United Nations E-Government Survey...
140
United Nations E-Government Survey 2010 Leveraging e-government at a time of financial and economic crisis
Transcript of United Nations E-Government Survey...

United Nations
E-GovernmentSurvey 2010
Leveraging e-governmentat a time of financial and economic crisis
Disclaimers
The designations employed and the presentation of the material
in this publication do not imply the expression of any opinion
whatsoever on the part of the Secretariat of the United Nations
concerning the legal status of any country, territory, city or area
or of its authorities, or concerning the delimitation of its frontiers
or boundaries. The term ‘country’ as used in the text of this
publication also refers, as appropriate, to territories and areas.
Since there is no established convention for the designation of
‘developed’ and ‘developing’ countries or areas in the United
Nations system, this distinction is made for the purposes of
statistical and analytical purposes only and does not necessar-
ily express a judgment about the stage reached by a particular
country or region in the development process. Mention of the
name of any company, organization, product or website does not
imply endorsement on the part of the United Nations.
The United Nations Department of Economic and Social Affairs is a vital interface between global policies in the economic, social and environmental spheres and national action. The Department works in three main interlinked areas: (1) it compiles, generates and analyses a wide range of economic, social and environmental data and information on which Member States of the United Nations draw to review common problems and to take stock of policy options; (2) it facilitates the negotiations of Member States in many intergovernmental bodies on joint courses of action to address ongoing or emerging global challenges; and (3) it advises interested governments on the ways and means of translating policy frameworks developed in United Nations conferences and summits into programmes at the country level and, through technical assistance, helps build national capacities.
United Nations Department of Economic and Social Affairs
Copyright © United Nations, 2010
All rights reserved. No part of this publication may be reproduced, stored in a retrieval system or trans-mitted, in any form or by any means, electronic, mechanical, photocopying, recording or other-wise, without prior permission.
ST/ESA/PAD/SER.E/131ISBN: 978-92-1-123183-0Sales No.: E.10.II.H.2
Printed by the UN Publishing Section, New York

i
United NationsNew York, 2010
United Nations
E-GovernmentSurvey 2010 Leveraging e-governmentat a time of financialand economic crisis
ST/ESA/PAD/SER.E/131
Department of Economic and Social Affairs

ii

Foreword
iii
United Nations E-Government Survey 2010
Foreword
The high demand for e-government knowledge and skills on the part of Member States has increased considerably in recent years. This upward trend in e-government development has accelerated despite, or maybe in part also due to, the current financial crisis and the pressing need for governments to be compe-tent, transparent, accessible and efficient. The crisis makes a compelling case for e-government. The de-mand for social support has increased dramatically while revenues have declined precipitously. Public sector commitments to stimulus packages and fi-nancial sector support have yielded debt levels that may take a very long time to reduce.
Member States have had to coordinate, make hard choices and weigh spending options very carefully. But we must also consider in this moment that there is a reason why e-government matters beyond the need to maximize efficiency, or even beyond engag-ing citizens in urgent questions of public policy. The compelling factor and the bitter lesson learned from the crisis is that trust matters and lack of confidence in government, as in markets, can lead to calamity. The capacity to respond under difficult conditions and deliver expected results are cornerstones of effec-tive government and a foundation of public trust.
The 2010 edition of the United Nations E-Government Survey, the fifth in a series begun in 2003, makes the case that e-government should play an ever-greater role in development. Many countries have made tremendous strides in the last two years, due in part to recent, exciting advances in the diffusion of technology. With its respon-sive, citizen-centric qualities, I firmly believe that e-government can make a decisive contribution to the achievement of the MDGs, particularly in de-veloping regions.
This publication can become a useful reference to guide development efforts at international, re-gional and local levels. n
Sha Zukang Under-Secretary-General for Economic and Social Affairs
E-government – once a bold experiment and now an important tool for public sector transformation – has progressed to the point where it is now a force for effective gover-nance and citizen participation, both at national and local levels. This is important. Until governments have the capacity to lead development efforts and deliver services that fully respond to the needs of citizens, the achievement of the internationally agreed devel-opment goals will continue to elude us. With the Millennium Development Goal time horizon of 2015 quickly approaching, it is no longer a question of whether we can afford information and communications technology in health, education, environmental pro-tection and a multitude of other areas, but where to deploy them first and how rapidly gains can be realized.

iv

Acknowledgements
v
United Nations E-Government Survey 2010
Acknowledgements
Preparation of the publication was undertaken by a group of senior e-government researchers and advisers at the United Nations, led directly by Haiyan Qian, Director of the Division for Public Administration and Development Management, Department of Economic and Social Affairs. The core research team comprised Richard Kerby, S. Ran Kim, Michael Mimicopoulos, Jonas Rabinovitch, Patrick Spearing and Keping Yao.
Part One on leveraging e-government at a time of financial and economic crisis was prepared by S. Ran Kim and Patrick Spearing with lead authors Tiago Peixoto (Chapter 1), Nick von Tunzelmann (Chapter 2) and S. Ran Kim (Chapter 3). Jeffrey Roy contributed an additional background paper for the study. Interns Aynur Sagin, Shuyi Wang, Jin Xin Liyuan Zhang and Huang Zhao provided research assistance.
Part Two on the state of e-government around the world was prepared by Richard Kerby, Deniz Susar, Carla Valle and Keping Yao with supple-mentary inputs from Michael Mimicopoulos, Jonas Rabinovitch and Patrick Spearing. The evaluation team for the methodology comprised Seema Hafeez, Richard Kerby, S. Ran Kim, Wai Min Kwok, Michael Mimicopoulos, Elida Reci, Silvia Schwarz and Deniz Susar.
The survey benefited from advice and guid-ance on e-government measurement provided by a group of experts who met in New York in December 2008. The group consisted of Kim Andreasson (United States), Frank Bannister (Ireland), Sue Brelade (United Kingdom), Gregory Curtin (United States), Andrea Di Maio (Italy), Morten Goodwin Olsen (Norway), Chris Harman (United Kingdom), Erik Hup (United States),Marijn Janssen (Netherlands), Jeremy Millard (Denmark), David Osimo (Belgium), Chris Parker (United Kingdom), Rajkumar
Prasad (India), Jeffrey Roy (Canada) and Mikael Snaprud (Norway).
Collection of data on online services was over-seen by Gregory Curtin of Civic Resource Group. The CRG research team was led by Charity Tran and Victoria Imsirovic, and included Albane Ariza, Sarah Millar Babovic, Itti Charoenthongtrakul, Sam Imsirovic, Fumi Iwasaki, Jayoon Koo, Leila Lomashvili, Thuy Luong, Suedine Bohn Nakano, Sonia Ghattas Rafidi, Dagfinn Romen, Lyuba Smith, Jessica Tang, Melike Tanrikulu, and a number of other spot researchers and translators around the globe.
Second stage data verification was provided by United Nations staff members Carla Valle, Keping Yao, Deniz Susar, Richard Kerby, Alexei Tikhomirov, Elida Reci, Vyatcheslav Cherkasov, S.K. Belal Hassan, Brian Gutterman, Bruno Bastet, Angela Capati-Caruso, Laura Tedesco, Maria Carreno, Anni L Haataja, Marian Haji-Mohamed, Yoshinobu Yonekawa, Enrica Murmura, Osamah Khawam, Wai Min Kwok and by interns Ashish Kumar, Samir Sayad, Mariam Zaari Jabiri and Pia De Mauleon.
Telecommunication infrastructure and edu-cation data were generously provided by the International Telecommunication Union and the United Nations Educational, Scientific and Cultural Organization respectively.
Technical assistance with data management was provided by Deniz Susar, S.K. Belal Hassan, Zhiliang Yu, and Candace Hosang, United Nations interns Ashish Kumar and Morten Olsen, and CRG interns Artin Mirzaian, Simone Sessler and Anthony Yeung.
Editorial services were provided by Susan Guthridge-Gould and Patrick Spearing. Editorial and administrative assistance were provided by Nathan Henninger, Silvia Schwarz, Candace
The 2010 edition of the United Nations e-Government Survey is the result of the efforts, contributions and support of many people from a number of organizations and thanks are extended to all who were involved directly or indirectly. In particular, the following people are acknowledged for their specific roles in its production.

vi
Hosang, Elizabeth Danseco, Dolores Tanpinco, Madeleine Losch and Milagros Verendia and by interns Marleen Geerlof, David Lung’ano, Julie
Mabine, Jing Tao and Di Zhao.Creative design was directed and executed by
Eliot Sela. n

Acronyms
vii
United Nations E-Government Survey 2010
AcronymsARRA American Recovery and Reinvestment Act
C2C Citizen-to-citizen
C2G Citizen-to-government
CEO Chief executive officer
CEPA Committee of Experts on Public Administration
CPSS Committee on Payments and Settlements Systems
CSC Common services centre
ESRI Environmental Systems Research Institute
EU European Union
FAQ Frequently asked question
FATF Financial Action Task Force
FSA Financial Services Authority
FSAP Financial Sector Assessment Program
G2B Government-to-business
GCC Gulf Cooperation Council
GDP Gross domestic product
GIS Geographic information system
HIV/AIDS Human immunodeficiency virus/acquired immune deficiency syndrome
ICT Information and communications technology
ILO International Labour Organization
IMF International Monetary Fund
IOSCO International Organization of Securities Commissions
ITU International Telecommunication Union
MDG Millennium Development Goal
NEPAD New Partnership for Africa’s Development
NGO Non-governmental organization
OECD Organization for Economic Cooperation and Development
OTC Over-the-counter
REDD Reducing emissions from deforestation and forest degradation
ROSC Report on the observance of standards and codes
SMART Skills matching and referral technology
SME Small- and medium-sized enterprise
SMS Short message service
UNDESA United Nations Department of Economic and Social Affairs
UNDP United Nations Development Programme

viii
Foreword iii
Acknowledgements v
Acronyms vii
Introduction 1
Part 1: Leveraging e-government at a time of financial and economic crisis 7
Chapter1: Stimulusfunds,transparencyandpublictrust 9
1.1 Crisisresponsewebsites 10
1.2 Fromtransparencytoparticipation 14
1.3 Dataaccessandcivilsociety 16
1.4 Conclusions 19
Chapter2: Rolesfore-governmentinfinancialregulationandmonitoring 25
2.1 E-governmentrisksandbenefits 26
2.2 Restoringtrustaftertimesofvolatility 28
2.3 Confidence,capabilitiesandcompetencies 33
2.4 Internationalcooperationande-government 36
2.5 Conclusions 40
Chapter3: E-servicedeliveryandtheMDGs 43
3.1 Whye-services? 44
3.2 Deliveringe-serviceswithaviewtowardsachievingtheMDGs 45
3.3 Conclusions 55
Part 2: The state of e-government around the world 57
Chapter4: Worlde-governmentrankings 59
4.1 Globale-governmentdevelopment 60
4.2 Regionalcomparisons 61
4.3 Economicgroupings 75
4.4 Progressinonlineserviceprovision 75
Chapter5:Citizenempowermentandinclusion 83
5.1 Progressine-participation 84
5.3 Questionsofaccessanddiversity 88
Chapter6: Measuringe-government 93
6.1 Towardsconsensusonindicators 94
6.2 Assessingonlineservicesande-participation 95
6.3 Accountingforcapacityconstraints 96
6.4 Conclusions 97
Notes 99
References 101
Statisticalannex 107
Surveymethodology 109
Datatables 114
Regionalgroupings 125
ix
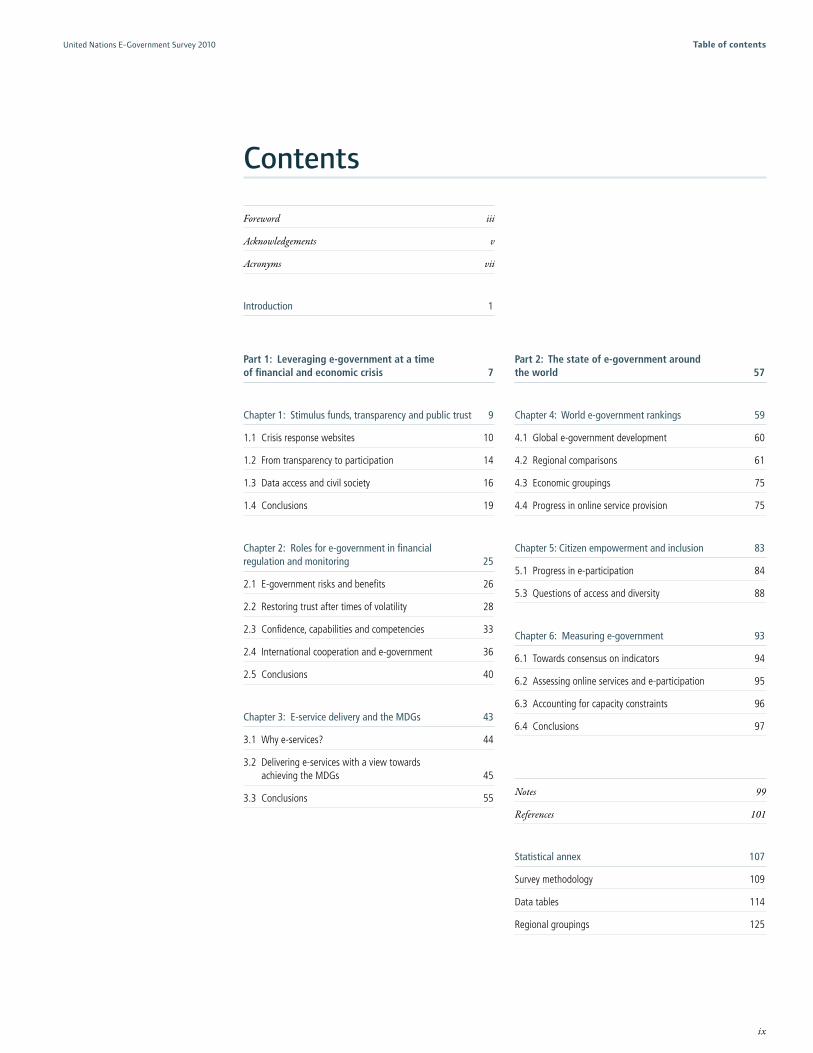
United Nations E-Government Survey 2010 Table of contents
Contents

x
United Nations E-Government Survey 2010Table of contents
Boxes
Box 2.1 ReportsontheObservanceofStandardsandCodesagreedbytheIMFandWorldBank,November2002 38
Box 3.1 OnlinealertsaboutschoolsandH1N1flu 48
Box 3.2 ‘Shrinking’Australiawithe-educationservices 48
Box 3.3 Promotingfreeandopensourcesoftwareinschoolsinacrisis-affectedcountry 49
Box 3.4 Mobilephonessupportlife-savingHIV/AIDSelectronicrecordssysteminRwanda 53
Box 3.5 Spatiallyenablede-governmenttoolsforforestmanagement 54
Box 4.1 UnitedStatesSocialSecurityAdministrationleadsincustomersatisfaction 60
Box 4.2 BahrainembracesWeb2.0 60
Box 4.3 AfriAfya,Kenya 63
Box 4.4 CyberEthiopia 63
Box 4.5 AlgeriaalertscitizenstotheirnewnationalhotlineforH1N1 64
Box 4.6 Panama’sPrimeraDama 67
Box 4.7 Guatemalae-procurement 67
Box 4.8 Kazakhstan–puttingcitizensfirst 69
Box 4.9 Japaneseportalprovidesaccesstostatisticalinformation 70
Box 4.10 RepublicofKorea’snationalportal 70
Box 4.11 Singaporespearheadsdevelopmentofmobileservices 70
Box 4.12 Malaysia–utilizingmobiletechnology 70
Box 4.13 Belgium’selectronicidentificationcard 73
Box 4.14 Austria–supportforgenderequality 73
Box 4.15 Germany–applyinge-governmenttoolstoeducatechildren 73
Box 4.16 Regionale-governmentstrategies 77
Box 4.17 Leadersintransactionalandconnectede-government 78
Box 5.1 Citizenengagementineconomiccrisisresponse 88
Box 5.2 Singapore’sREACH 89
Box 5.3 E-participationinChina 89
Box 5.4 WomeninruralIndiagainInternetaccess 90
Box 6.1 Thefourstagesofonlineservicedevelopment 95
Figures
Figure 1.1 NettrustintheEuropeanCentralBank(euroarea12),1999-2009 9
Figure 1.2 AustraliaEconomicStimulusPlanwebsitewithgeo-referencingtools 11
Figure 1.3 Crisis-responsewebsiteobjectives,October2009 12
Figure 1.4 Transparencyande-governmentdevelopmentintheUnitedStates,2009 13
Figure 1.5 UseofWeb2.0toolsbydifferentactors,October2009 15
Figure 1.6 UnitedKingdomcrisis-responsewebsitewithcitizenfeedbacktools 16
Figure 1.7 UnitedStatesfederalopendatainitiative 17
Figure 3.1 Gender-disaggregatedemployment-to-populationratios 50
Figure 3.2 Mobilecellphonesubscriptionsper100people 52
Figure 3.3 ICTtrendsinsub-SaharanAfrica(2000-2008) 53
Figure 4.1 E-governmentdevelopmentindexregionalaverages 61
Figure 4.2 E-governmentdevelopmentinAfrica 62
Figure 4.3 E-governmentdevelopmentintheAmericas 65
Figure 4.4 E-governmentdevelopmentinAsia 68
Figure 4.5 E-governmentdevelopmentinEurope 72
Figure 4.6 Nearlyallgovernmentshavewebsites 77
Figure 4.7 Numberofministrieslinkedtoanationalportal 78
Figure 4.8 Featuresofministrywebsites 79
Figure 4.9 Availabilityofstaticonlineforms 79
Figure 4.10 Selectedcountrieswithhightransactionalpresencescores 79
Figure 4.11 Numberofministrywebsiteswithonlineformsandtransactionalservices 80
Figure 5.1 Geographicdistributionofbestperformingcountriesine-participation 85
Figure 5.2 Governmentinteractionswithcitizens 86
Figure 5.3 Countrieswithhighpointsforconnectedservices 86
Figure 5.4 E-participationutilizationlevels 86
Figure 5.5 Ministrywebsiteswithe-consultationfeatures 88
Figure 5.6 Genderempowermentande-governmentdevelopment 90

xi
United Nations E-Government Survey 2010 Table of contents
Tables
Table 1.1 Number of websites studied by type of owner 10
Table 1.2 Features of selected crisis-response websites 21-23
Table 3.1 Real GDP growth (percent) before and after the economic crisis of 2008-2009 45
Table 4.1 Top 20 countries in e-government development 60
Table 4.2 Regional comparisons 61
Table 4.3 Top ranked countries in Africa 62
Table 4.4 E-government development in Eastern Africa 62
Table 4.5 E-government development in Middle Africa 63
Table 4.6 E-government development in Northern Africa 63
Table 4.7 E-government development in Southern Africa 64
Table 4.8 E-government development in Western Africa 64
Table 4.9 Top ranked countries in the Americas 65
Table 4.10 E-government development in the Caribbean 65
Table 4.11 E-government development in Central America 66
Table 4.12 E-government development in Northern America 66
Table 4.13 E-government development in South America 67
Table 4.14 Top ranked countries in Asia 68
Table 4.15 E-government development in Central Asia 68
Table 4.16 E-government development in Eastern Asia 69
Table 4.17 E-government development in Southern Asia 69
Table 4.18 E-government development in South-Eastern Asia 70
Table 4.19 E-government development in Western Asia 71
Table 4.20 Top ranked countries in Europe 71
Table 4.21 E-government development in Eastern Europe 72
Table 4.22 E-government development in Northern Europe 72
Table 4.23 E-government development in Southern Europe 73
Table 4.24 E-government development in Western Europe 74
Table 4.25 E-government development in Oceania 75
Table 4.26 Top ranked developing countries 75
Table 4.27 E-government development in least developed countries1 76
Table 4.28 Top 20 countries in online service development 77
Table 4.29 Characteristics of an emerging online presence 78
Table 4.30 Site maps and linkages from national portals 78
Table 4.31 Website design features: RSS, audio, video, language 79
Table 4.32 Support of mobile access 79
Table 4.33 Online payment 80
Table 4.34 Online submissions 80
Table 4.35 Connected presence 80
Table 4.36 Connecting to citizens 80
Table 4.37 Breakdown of online service scores for top ranked countries 81
Table 4.38 Online service levels in selected developing countries 81
Table 4.39 Online service levels in least developed countries1 82
Table 5.1 Top 20 countries in e-participation 85
Table 5.2 Quality of e-participation websites of selected countries 87
Table 5.3 Information about e-inclusivness and e-participation 87
Table 5.4 Interaction with citizens 87
Table 5.5 Interactive tools used by governments 87
Table 5.6 Web 2.0 tools used in e-decision-making 88
Table 6.1 Task Group on E-Government of the Partnership on Measuring ICT for Development – draft list of core e-government indicators 94
Maps
Map 4.1 Sub-regions of Africa 62
Map 4.2 Sub-regions of the Americas 65
Map 4.3 Sub-regions of Asia 68
Map 4.4 Sub-regions of Europe 72
Map 4.5 Sub-regions of Oceania 74
Map A.1 Regional groupings 125
Data tables
E-government development index 114-115
Online service index and its components 116-117
Telecommunication infrastructure index and its components 118-121
Human capital index and its components 122-123
E-participation index 124

xii

1
Introduction iUnited Nations E-Government Survey 2010
IntroductionE-government is a powerful tool for human development and essential to the achievement of the internationally agreed development goals including the Millennium Development Goals. Many countries are experiencing its transformative power in revitalizing public administration, overhauling public management, fostering inclusive leadership and mov-ing civil service towards higher efficiency, transparency and accountability. They recognize e-government as a way of real-izing the vision of a global information society. In contrast, countries slow to embrace e-government tend to remain mired in the typical institutional pathologies of supply-driven ser-vices and procedures, remoteness between government and citizen, and opaque decision-making processes.
Taking as its theme the most pressing challenge of recent times, the United Nations E-Government Survey 2010 fo-cuses on the global financial and economic crisis. Part One of this report is dedicated to a discussion of the ways in which e-government can be leveraged to mitigate the effects of the financial and economic crisis on development. Its three chap-ters examine e-government in light of three stated priorities of United Nations Member States. Part Two is a report on the results of a global survey.

2
Introductioni United Nations E-Government Survey 2010
E-government at a time of financial and economic crisisE-government is a means of enhancing the capac-ity of the public sector, together with citizens, to address particular development issues. It is never an end in itself. Can e-government help policy makers to respond to the global financial and eco-nomic crisis? Certainly, the effect of the crisis on the public sector has been profound. Although financial markets stabilized in 2009 due to mas-sive and internationally coordinated government intervention, the real economy is still in a state of shock with high rates of unemployment and a tremendous squeeze on government revenues in many countries.
“Make the stimulus work for all”In June 2009, government leaders and senior min-isters converged at the United Nations to discuss the crisis and its impact on development. Member States called for action and encouraged govern-ments to “make the stimulus work for all”. By October 2009, more than 50 countries had com-mitted $2.6 trillion to fiscal stimulus and pledged another $18 trillion in public funds to underwrit-ing the financial sector and other industries. Next came the challenge of assessing whether or not the stimulus was indeed working for all, as Member States had hoped, and of assuaging public unease about the distribution of these huge sums.
In response to the crisis, governments have been exploiting online tools to enhance trans-parency and track stimulus spending – and they stand to gain much more if they tap the potential of open data. Chapter One describes the ways in which e-government tools are being used to moni-tor the crisis response funds, based on a study of 115 websites built on official government infor-mation. While there is a relatively high degree of transparency in stimulus initiatives, the real poten-tial of e-government lies in the free sharing of gov-ernment information based on common standards. otherwise known as open data services. Most gov-ernments are not yet taking advantage of the sim-ple practice of sharing information in this way, yet it would enable independent actors to deepen their own analyses of government policy and action at very low cost to the public.
“Improved regulation and monitoring”Deficiencies in financial supervision revealed by the crisis spurred Member States to express an interest in “improved regulation and monitor-ing”. The experiences of the Great Depression and the Asian financial crisis show how alike the current crisis is in terms of financial causes as well as the behaviours that unfold as financial markets unravel. In each case, the systemic risks resulting from the neglect of analysts and regu-lators might have been mitigated if governments had promoted information and communication technology designed to reduce the opacity of the financial sector.
What is the role of e-government in financial regulation and monitoring? Chapter Two looks at these important historical analogies from the 1930s and 1990s, and then defines the potential of e-government to address structural problems in the financial system. Regulatory reform aims to pro-mote transparency, integrity and efficiency in the financial sector. This is exactly what e-government is highly capable of doing. It can also add agility and provide real-time responsiveness to regula-tory needs. While the capacity of e-government to handle speed and complexity is in the end no substitute for good policy, it may at least give citi-zens the power to question regulators and bring systemic issues forward.
“Contain the effects of the crisis and improve future global resilience”Finally, Member States have signaled the need to “contain the effects of the crisis and improve future global resilience” by ensuring that governments take internationally-agreed development goals into account when they respond to it. Stronger social safety nets and measures to protect social expendi-tures are required if goals for poverty eradication, employment, environmental protection, gender equality, food security, health and education ob-jectives are to be met alongside sustained economic growth. Stimulus funds can only go so far. To avert deep cuts in public spending (or even to avoid de-valuing currencies and defaulting on public debt), governments may have no choice but to enhance efficiency and effectiveness if provision of public services is to be assured.

3
Introduction iUnited Nations E-Government Survey 2010
Just as ICT can introduce speed, agility and insight into regulatory functions, so too can e-services help governments to respond to an ex-panded set of demands even as revenues fall short. In Chapter Three, to help governments build on the practical experiences of others, recent e-govern-ment actions are described with possible solutions suggested for addressing employment, education, gender equality, health and environmental pro-tection goals – five priorities of the Millennium Development Goals.
Global trends in e-government development The United Nations E-Government Survey is recognized for providing a comprehensive assess-ment of national online services, telecommunica-tion infrastructure and human capital. In Chapter Four, the results of the biennial global survey are presented together with insights into the “whats” and “whys” of e-government development in par-ticular situations.
The watchword of e-government is ‘citizen-cen-tric practice’. For a country to be assessed favour-ably in relation to other countries, there needs to be solid evidence of an approach to e-government development that places citizens at the centre. The survey will show, for example, the availability of electronic and mobile services designed with citi-zens in mind. The explosive growth of broadband access in developed regions and mobile cellular subscriptions in developing countries are trends that governments are reflecting in their use of ICT, to varying degrees. Chapter Five provides an assess-ment of the use of e-government tools to promote citizen empowerment and inclusion, including women’s equality. The focus is on the availability of e-services and the use of e-government techniques to enhance participation in decision-making.
Another word to watch is ‘development’, which in this edition replaces ‘readiness’. The term ‘e-gov-ernment development’ describes how far govern-ments have actually advanced in this field instead of how ready or able they might be to do so, which was how ‘e-government readiness’ described na-tional capacity. More countries than ever before are adopting national e-government strategies and
multi-year action plans. From the most to the least developed, countries can be seen responding to expectations that governments both participate in and enable the information society by com-municating and interacting more effectively with increasingly technology-savvy citizens. They are ready, and it is their level of development in this regard that must be assessed.
Key findings from the 2010 SurveyOn-demand access to information, services and
social networks on the Internet through a personal computer is no longer considered cutting-edge in developed regions but a norm that many people take for granted. The same may soon be true of the more advanced middle income countries. Cellular telephones and personal digital assistants have the potential to play the same role for developing coun-tries if governments are able to come to terms with the changing face of technology and innovate with a citizen-centric mindset.
For example, alerts sent through short message services (‘text messages’) are being used to notify citi-zens that a request for assistance has been processed, that a permit needs to be renewed or that an emer-gency advisory notice has been issued. Cellular tele-phones are also being used in a more dynamic fashion to browse public services, authorize payments and engage in micro-volunteerism. Cell phones are used, for example, to provide government agencies with images or descriptions of local environmental condi-tions and to respond to social surveys.
The mobile revolution and growth of high-speed broadband and wireless access is beginning to have a measurable economic impact, reinforced by expan-sion of e-government capacity in the public sector, even in least developed countries with limited econ-omies of scale. Mobile cellular subscriptions have grown exponentially in developing regions in the last 10 years but most governments are not exploiting this technology fully in public service delivery.
Returning to the question of online services, middle-income countries in particular have made significant advances,to the point where a number of them have usurped positions held in the past by high-income countries in the e-government development index. This has occurred despite the relative advantage enjoyed by developed regions

4
Introductioni United Nations E-Government Survey 2010
in telecommunications infrastructure, which ac-counts for a third of a country’s index value. This may be explained by a combination of government leaders who understand the potential of ICT, a willingness to invest and comprehensive e-govern-ment policies designed with all segments of society in mind. Many of these countries have revamped their national and ministry websites as tightly in-tegrated portals providing citizens with a single point of entry to all e-government services.
By contrast, e-government development re-mains a distant hope for many of the least devel-oped countries due to the cost of technology, lack of infrastructure, limited human capital and a weak private sector. A paucity of public sector re-sources clearly imposes a drag on government inno-vation. Small ad-hoc and stand-alone projects are the norm in least developed countries, which often lack a well-thought e-strategy within their national development plans. Once initial funding for these projects ends, they are usually at high risk of simply shutting down. However, there are a few notable exceptions, such as e-education in Bangladesh and Ethiopia, and m-health in Rwanda. The experi-ences of these three countries demonstrate that significant gains can be realized in the least de-veloped countries where there are enabling legal and regulatory frameworks in place, including specifically an e-government strategy with clearly identified sectoral priorities aligned with national development goals.
Consider Ethiopia – a landlocked country with limited access to international telecommu-nications lines, low adult literacy levels and a re-source-poor public sector. On the surface it seems ill-equipped to profit from the information revolu-tion, yet in 2005 the Government of Ethiopia ad-opted a national information and communications technology (ICT) policy and in 2006 launched a five-year ICT action plan to help diversify the country’s economy, promote public sector reform and improve opportunities in education, health, small business development and agricultural mod-ernization. The country has now connected nearly 600 local administrations to regional and federal offices, linked 450 secondary schools to a national education network, and provided some 16,000 vil-lages with access to broadband services.
Problems of resources are in no way limited to developing countries. The 2010 assessment of gov-ernment websites has revealed that many national governments continue to focus on online and mo-bile dissemination of information rather than ex-pansion of interactive services often because of the expense and complexity of rethinking systems, pro-cedures and staffing behind the scenes. An antidote might be found in incremental expansion of e-ser-vices guided by sound institutional principles with a core objective of integration. Even simple solutions to discrete problems can result in substantial local efficiency gains and increased public satisfaction.
The survey found that some progress has been made in addressing the disconnection between e-government supply and demand although there is still a lot of room for improvement globally. In places where citizens may not be aware of the exis-tence of e-government services, or prefer not to use them, governments would do well to ask them why. One reason may be ineffective marketing. Another may be that the majority of ICT initiatives are de-signed as efficiency measures (e.g. to automate com-plex functions such as income tax collection, school registration and processing of social benefits) with little input from the intended beneficiaries. Most surveys have shown that users prefer localized and personalized services, attributes that usually call for interdepartmental cooperation, back-office re-organization and reallocation of both human and financial resources. These requirements are not often taken into account.
E-participation remains in a nascent state in many countries, a finding that is related to the disconnection between government and citizens described above. Many governments include polls and feedback forms on their websites, but few spon-sor discussion forums or blogs or post information to social networking sites. This is especially true for developing countries. Governments may need to be more creative about the ways in which they inter-act with the public, perhaps by creating integrated ‘one-stop shop’ portals or actively soliciting views that can be used to design public services or to shape public policy. Here, the Governments of Australia, Bahrain, Canada, Kazakhstan, the Republic of Korea, Singapore, the United Kingdom and the United States have been leading the charge.

5
Introduction iUnited Nations E-Government Survey 2010
Despite technological progress, the lack of ICT professionals (i.e. human capital) remains a major shortcoming in both middle- and low-income countries. Few civil services are able to compete with private sector salaries, with the inevitable result that top information technol-ogy personnel in developing countries tend to gravitate towards commercial firms. Even in cases where governments are able to recruit highly skilled information technology workers, these young men and women tend to stay only long enough in their government jobs to acquire enough experience to make them marketable in the more lucrative private sector. Similar capacity gaps exist at the management level. Developing country governments often find themselves in the position of having to hire expatriate man-agement consultants and other information technology professionals to develop domestic e-government services.
Future prospectsThe value of e-government will increasingly be defined by its contribution to development for all. Citizen-centricity, inclusiveness, con-nected government, universal access and use of new technologies such as mobile devices are the benchmarks against which electronic and other innovative forms of public service delivery will be assessed. A conceptual framework is pre-sented in Chapter Six that grounds the future survey and sets the stage for further study by answering the question: What is e-government and how is it measured?
In the constantly evolving world of the Internet, research methods need to be updated regularly if the findings they underpin are to remain valid and relevant. More importantly, an international standard is needed in order to model, analyse and monitor the state of e-government across economic sectors and jurisdictions. Intergovernmental and expert bodies of the United Nations system could usefully examine the relationship between indica-tors of e-government and internationally agreed development goals. Such an exercise could deepen understanding of the impact of ICT in the public sector on development.
Indicators of e-government are the focus of ef-forts at the working level led by an international partnership of organizations. The group includes the United Nations Department of Economic and Social Affairs, the International Telecommunication Union, World Bank, Organisation for Economic Co-operation and Development, United Nations Conference on Trade and Development United Nations Educational, Scientific and Cultural Organization and others. While some progress has been made, a common set of e-government indi-cators would greatly facilitate international com-parability and avoid unnecessary duplication in assessment of e-government development.
It is important to bear in mind the resistance that reformers might face when confronted with an entrenched public sector. Beyond changes of a technological nature, deeper transformations may be necessary behind the scenes. This is particu-larly so in contexts where esprit de corps is deeply rooted, where information-sharing is the exception rather than the rule, and where government ICT capacity is limited. In order for a country to excel at e-government, policy makers will usually need to join forces with public administrators to change mindsets and behaviours while offering civil ser-vants the opportunity to acquire the skills needed in the modern organization.
Looking ahead, international coopera-tion in e-government may be driven by eco-nomic integration policies, as experienced recently in the Caribbean, Europe and Western Asia. The Caribbean Centre for Development Administration, an agency of the Caribbean Community, prepared a draft regional e-govern-ment strategy for 2010 to 2014 to outline a com-mon e-government vision, set of goals, strategic initiatives, immediate outcomes and implemen-tation plan for English-speaking countries of the Caribbean. In the European Union, ministers responsible for e-government policy issued the “Ministerial Declaration on eGovernment” to articulate a common vision, objectives and pri-orities for 2011 to 2015. The Gulf Cooperation Council developed e-government standards and structures that are common among Arab States of the Persian Gulf, and holds a regional e-govern-ment conference with national awards.
6
Introductioni United Nations E-Government Survey 2010
Elsewhere, the African Union convened a high-level summit in February 2010 on challenges and prospects for information and communication technologies in Africa, while the International Telecommunication Union has plans to organize a series of summits over the course of 2010 to pro-mote regional ICT strategies and products as part of its “Connect the World by 2015” initiative.
Such efforts at harmonizing e-government at the regional level would be strengthened by global
cooperation, in the spirit of the World Summit on the Information Society. Fundamentally, e-government is not about “e”, but about pro-motion of citizen-centric and participatory gov-ernance – helping people to improve their lives and have a voice in decisions affecting their fu-ture. Global collaboration is needed to succeed. With the leadership of United Nations Member States, e-government can become a global prior-ity, creating opportunities for all. n

7
1
Part 1
Leveraging e-government at a time of financial
and economic crisis
8
Part 1Leveraging e-government at a time of financial and economic crisis
Chapter 1Stimulus funds, transparency and public trust 9
Chapter 2Roles for e-government in financial regulation and monitoring 25
Chapter 3E-service delivery and the MDGs 43

9
Chapter OneStimulus funds, transparency and public trust 1United Nations E-Government Survey 2010
Chapter 1
Stimulus funds, transparency and public trust
In the face of the rapidly unfolding global economic crisis, governments have acted swiftly to stabilize markets, restore economic growth and promote job creation. By October 2009, more than $20 trillion in public funds had been com-mitted to addressing the crisis by some 50 countries – equiva-lent to more than one-third of world gross product. About 90 percent of this support went to underwriting the financial sector, with the remaining 10 percent allocated to the sort of government spending and tax breaks that constitute fiscal stimulus packages.1
Many observers agree that central banks, acting with the concurrence of national governments, can claim partial credit for the stabilization that has been achieved and the prospect of a recovery. But the general public seems to hold a completely different opinion. In the United Kingdom, United States and European Union, trust in central banks dramatically de-creased in the six months following September 2008, just as they were rolling out substantial crisis-response initiatives.2
1.1 Crisis response websites 10
1.1.1 Tracking public funds 10
1.1.2 The value of low-cost solutions 12
1.1.3 Coordination across agencies 13
1.2 From transparency to participation 14
1.3 Data access and civil society 16
1.3.1 Government as a platform 16
1.3.2 The economics of open data 17
1.3.3 Who guards the e-guardians? 19
1.4 Conclusions 19
Figure 1.1 Net trust in the European Central Bank (euro area 12), 1999-2009
30
25
20
15
10
5
0
-5Spring
EB511999
Autumn1999EB52
Spring
EB532000
Autumn2000EB54
Spring
EB552001
Autumn2001EB56
Spring
EB572002
Autumn2002EB58
Spring
EB592003
Autumn2003EB60
Spring
EB612004
Autumn2004EB62
Spring
EB632005
Autumn2005EB64
Spring
EB652006
Autumn2006EB66
Spring
EB672007
Autumn2007EB68
Spring
EB692008
Autumn2008EB70
Jan-Feb
EB7112009
Source:GrosandRoth(2009).NettrustisdefinedhereasthepercentageofrespondentssurveyedindicatingthattheytrusttheEuropeanCentralBankminusthepercentagewhoindicatetheydonottrustit,basedontwice-annualEurobarometersurveys.

10
Chapter OneStimulus packages and financial bailouts1 United Nations E-Government Survey 2010
Part of the public’s unease may be attributed to the vast sums involved and the shock of finan-cial calamity. General anxiety over tax increases and future obligations has combined with uncer-tainty about the implications of the crisis to sour the public mood.
Another cause of unease may be the highly spe-cialized nature of the field. The technicalities of governmental responses to the crisis are not easily understood by the general public. The intricacies of public finance provoke anxiety with discussion of such things as direct capital injections, purchase of assets and lending by treasuries, liquidity provi-sion to financial institutions, market guarantees and preferential taxes – all on top of the ‘simple’ task of monitoring government spending. When citizens of the United Kingdom, United States and European Union were asked whether central banks had responded appropriately to the chal-lenges of the economic downturn, 40 percent said they were not sure.3
E-government has much to contribute in ad-dressing such a situation. Information services, knowledge-sharing, and tools for participation and collaboration may all serve to reduce uncer-tainty and assuage public unease. An increasing number of studies suggest a positive relationship between e-government and improvement in citi-zens’ attitudes towards government.4 Research in Canada and the United States, for example, suggests that using the Internet to transact with government has a positive impact on trust as well as public perceptions of government responsive-ness.5 Also, satisfaction levels may increase when government uses the Internet to solicit ideas from citizens and engage them in decision-mak-ing. Citizen participation, in turn, can make it easier to implement policy and is likely to lead to better outcomes as a result of increased public awareness and buy-in.
1.1 Crisis response websitesGovernments around the world have created web-sites that enable citizens to track stimulus packages and other public funds committed to addressing the financial and economic crisis. A total of 115 such sites were analysed to determine the extent to which ICT was being used to increase the overall effectiveness of government responses. Three issues were explored in depth:
• The degree of transparency in crisis-response programmes;
• Whether citizens are engaged in decisions about the types of response, how much money and to whom funds should be made available;
• Current policies on information disclosure and the extent to which civil society is able to use government information to raise awareness of particular issues.The selection criteria for these cases were de-
signed to maximize geographical coverage, include national and sub-national levels, and consider the work of both governmental and non-governmen-tal actors. Finally, preference was given to cases that offered readily transferable policy lessons or that simply provided a greater amount of informa-tion for the study. It should be stressed, however, that the final ensemble of cases was the result of a stocktaking exercise and is neither a fully rep-resentative nor exhaustive listing of relevant e-government initiatives.
1.1.1 Tracking public fundsCitizens can recognize transparency – and the lack thereof – when they see it, and providing the public with more and better information on deci-sions taken and the reasons for them is a major need to be addressed by governments.6 At least for the moment, many appear to be responding. Some 83 percent of crisis-response websites studied have as a common denominator the use of ICT to in-crease transparency.
Indeed, governments can easily provide gen-eral information on stimulus spending policies and amounts committed to various interventions. This is the case for Switzerland’s State Secretariat of Economic Affairs website, which includes a sec-tion containing general information about the stabilization measures taken by the Government,
Table 1.1 Number of websites studied by type of owner
Group Number of cases
NationalgovernmentsandEuropeanUnion 31
Sub-nationalgovernments 63
Internationalorganizations 2
Non-governmentalorganizations 19
Total 115

11
Chapter OneStimulus funds, transparency and public trust 1United Nations E-Government Survey 2010
describing the three phases of the country’s stabi-lization plan and domains of intervention such as infrastructure and employment.
Similarly, a section on the website of the Swedish Government provides general informa-tion on measures taken in different sectors, such as warranty programmes for financial institutions and support for Swedish municipalities. This is also the case for a section of the Korean Ministry of Strategy and Finance website, which outlines policies related to fiscal stimulus measures, em-ployment and support to various industries. The website for the Philippines’ Resiliency Action Plan provides useful information on the country’s stim-ulus plan and fiscal measures as well as updated information on the latest measures taken by the Government and other news related to the crisis.
In contrast to the fairly simple initiatives described above, other governments have taken advantage of interactive tools to assist in the pro-vision of information. German citizens are invited to ask questions concerning their government’s recovery measures on the website of the German Ministry of Finance, which added this feature in an attempt to make its section on the economic crisis more attractive to its users by allowing for a more interactive experience. Prominently dis-played in the main section dedicated to the crisis is a tool that allows citizens to enter an e-mail ad-dress and to ask questions that are later answered by the Ministry’s staff, which posts the answers online. This simple application bears the poten-tial of creating a direct link between concerned citizens who would like to have further informa-tion on the actions taken by the Government, and the Government itself. In addition, by publicizing the questions that are asked, the civil servants in charge of replying can avoid answering duplicate inquiries on an individual basis (i.e. recurrent questions), consequently reducing the workload when it comes to responding to the public.
Funds committed to addressing the crisis often can be linked to a geographic area, and citi-zens might well be interested in finding out how much money is directed to nearby places, and for what purposes. Governments are using geographic information systems to provide information in a more contextualized and attractive manner, while
facilitating users’ comprehension of the data con-veyed. Forty percent of the websites identified pres-ent geo-referenced information.
Kazakhstan’s crisis response website, for ex-ample, offers an interactive map and with just a few clicks the user is able to localize the areas where investments are made, along with detailed descriptions of projects (e.g. amount of resources allocated, name of contractor, how to contact the person in charge of the project, time for the real-ization of the project, number of jobs created by the project). All of this information is conveyed through an interactive map that enables the user to identify the regions where funds are being al-located as well as the agencies responsible for the projects. Similarly, on France’s stimulus website the user can click on a map and find informa-tion on the allocation of recovery funds in the area selected and the total costs of individual projects taking place in the region. In a Brazilian example, the national government’s Programme to Accelerate Growth is explained using an inter-active map that provides information on invest-ments by regions of the country and the public works taking place.
Other online tools also provide geographical information. The United States Recovery Act and Australian Economic Stimulus Plan websites both allow users to track funds by entering their postal codes. The State of Arkansas in the United States allows users to track recovery funds by county using their mobile phones
In addition to the generalist websites described above, some e-government initiatives serve very spe-cific purposes. Innovative e-government solutions address specific needs raised by the crisis. A United
Figure 1.2 Australia Economic Stimulus Plan website with geo-referencing tools
Australia:Economicstimulusplan
http://www.economicstimulusplan.gov.au/pages/default.aspx
Breakdown of stimulus plan and tracking stimulus projects at local
level. Enables interactivity (ask a question). It could also be asking
questionsfromcitizensthemselves.Linkstosub-nationalwebsitesof
similarscope.Makeslinktonationaljobswebsite,apre-existinginitia-
tivethathelpsmitigatetheeffectofthecrisis.Subscriptiontoupdates.

12
Chapter OneStimulus packages and financial bailouts1 United Nations E-Government Survey 2010
States federal Government website assists recipi-ents of recovery funds to meet quarterly reporting requirements by providing them with the means to submit project updates online. The system allows the recipients to view and comment on reports, as well as update and correct them whenever neces-sary. It illustrates the role that e-government tools might play in providing faster, more standardized and more effective transactions between the recipi-ents of crisis funds and governments.
1.1.2 The value of low-cost solutionsThe websites studied represent varying levels of sophistication, as illustrated above, yet there ap-pears to be no correlation between the resources invested in technology (e.g. in website costs) and the quality and quantity of transparency that is achieved. Moreover, there is widespread evidence that expressive results can be achieved at very low costs,7 which in a context of constrained budgets is important for policy makers to know as they debate to what extent governments should priori-tize e-government applications (e.g. websites) as a means to increase transparency.
Governments should not lose sight of the fact that the benefits obtained through improved monitoring and oversight of public spending are most likely to outweigh the initial costs of setting up sites for communicating with citizens online. This is supported by extensive evidence that trans-parency policies lead to non-negligible and desir-able outcomes such as fiscal discipline and reduced misspending.8 In California, for example, it cost $21,000 to implement the State’s spending trans-parency website and its annual operational costs are estimated to be below $40,000. Visitors to the website report unnecessary spending to the
government and, after only a few months of op-eration, the website had already saved the state over $20 million.9 In a similar manner, the trans-parency website in Texas, just a few months after launching, had already helped achieve savings of over $5 million.10
The technological capability of a given govern-ment is another relatively insignificant factor af-fecting the actual level of transparency achieved. Consider the variance in transparency across the different countries, and their level of e-government development as measured, for example, by the qual-ity and scope of their Web presence. There is no evi-dence that governments that perform better in terms of e-government development are necessarily those delivering the most efficient services for monitoring crisis-response funds. That is, evidence suggests that there is no correlation between the level of techno-logical development of governments – as measured by its level of e-government development – and the factual provision of transparency with regards to cri-sis-response funds that are allocated by governments around the world.
When comparing cases at the international level, however, one is bound by serious limitations, given the disparity in aspects such as institutional frameworks (e.g. federal versus unitary) and crisis-response measures. An example from the state level will help to render this question of e-government and transparency more evident and less anec-dotal. At this level, analysis can be carried out in a controlled environment where institutional traits are equal among all the sub-units (i.e. states) of the federation. In other words, cases are more comparable than at the international level. In the United States, where all of the states currently run stimulus websites, the use of public funds from the American Recovery and Reinvestment Act is sub-ject to calls for transparency.
The scatterplot below illustrates the relation-ship between the transparency that is conveyed by those websites with regard to the allocation of recovery funds, in contrast to the e-government development of each State’s government.
Clearly, in this instance, no correlation at all can be found between the two factors.11 That is, a State’s level of e-government development does not predict its efficient use of ICT to track public
The benefits obtained through improved monitoring of public spending tend to outweigh the initial costs of setting up sites for communicating with citizens online.
Figure 1.3 Crisis-response website objectives, October 2009
0 10 20 30 40 50 60 70 80 90Prevalence (percent)
Feedback27
Social protection information34
Government to business communication41
Management of funds38
Public scrutiny of funds84

13
Chapter OneStimulus funds, transparency and public trust 1United Nations E-Government Survey 2010
stimulus funds. The extreme cases make the point. Delaware scores the highest on e-government de-velopment, yet its transparency website has one of the lowest scores. Conversely, Maryland’s website is considered by far the best website for monitor-ing stimulus funds, yet the state ranks 48 out of 50 at the bottom of the index for State e-govern-ment development in the United States.
Evidence gathered at the international level, added to this analysis at the sub-national level, suggests a rather limited relationship between e-government development and the provision of transparency – as counter-intuitive as it might seem. Likewise, as mentioned above, little relation can be found between the cost of crisis-response websites designed to enhance transparency and their quality.
This bodes well for reformers at a moment when budgets for investing in technology are limited, particularly in countries in which e-government structures are less developed. Transparency policies, in the context of the global economic crisis, might produce better results when implemented incremen-tally and when taking advantage of existing ICT so-lutions that can be deployed without constituting an additional burden to governments’ budgets.
In sum, rather than focusing on the expensive implementation of unnecessarily sophisticated tech-nology, governments might provide better value for money by creatively utilizing pre-existing and low-cost ICT infrastructures to provide comprehensive and detailed information in a single point of access, and in an accessible and timely manner.12
1.1.3 Coordination across agenciesThe global nature of the financial crisis, with the depression being highly connected as between re-gions and nations, requires more of government ICT initiatives. It requires that not just a few but all governments endeavour to build up networks to provide transparent information for the public, and to do so in a coordinated fashion.
It is naturally the case that the progress achieved towards building e-government systems will be different in different localities. Generally, accord-ing to a study of Spanish regional governments,13 regions with higher performance usually play an outstanding role, disclosing higher amounts of financial information on the Internet. To address
this point, countries may need to foster regional e-government systems via programmes supported by the central government. In particular, central government can provide regional governments and agencies with basic website frameworks. These frameworks can be developed by special projects, or outsourced from coordinated developers to ensure their interconnection. From such support by cen-tral government, the construction of e-government systems in comparatively backward regions and de-partments can be promoted, and the overall cost can be reduced by copyright-trading or economies of scale in software development.
Following on from the above point, common software standards are needed to realize inter-con-nectivity, integration of data and convenience for users. Open standards are often good candidates be-cause open software is fundamentally interoperable.
Web 2.0 is a popular term with advocates of e-government. Web 2.0 applications provide decen-tralized patterns for data submission and analysis, and provide a platform for the provider-user in-teraction, in contrast to non-interactive websites where users can only passively view information. Since the financial sector is a broad-wide con-nected industry, users in a variety of locations may find value in data and analysis of different locations and different investors. Therefore, the demands on data usage (e.g. downloading and
There appears to be no correlation between the resources invested in an established website and the quality and quantity of transparency that is achieved.
Figure 1.4 Transparency and e-government development in the United States, 2009
20 30 40 50 60 70 80E-government readiness in 2008
AR
RA
tra
nspa
renc
y in
dex
80
70
60
50
40
30
20
10
CA
CO
AR
DEFL
GA
CT
WY
MOMT
NJ
NH
NC
WI
WV
MI
IL
AZIA
KS
LA
ID HI
NV
OK
VTSD TX
MS
MD
IN
ME
PA
AL
MASC
RI
AK TNMN
UT
ND
NE OR
OH
NY
DC
NM
KY
Sources:TransparencyindexoftheARRA,AmericanRecoveryandReinvestmentAct(http://projects.propublica.org/recovery/),Mattera,McIlvaine,Laicy,LeeandCafcas(2009),West(2008).

14
Chapter OneStimulus packages and financial bailouts1 United Nations E-Government Survey 2010
applying) and interaction is correspondingly broad-wide. However, data integration and in-teraction can be achieved only by smooth data interconnection. In other words, there will be no true Web 2.0, no integration and application, if there is no broad interconnection across the rel-evant scope.
In fact, this lack of interconnection is at the heart of the current weakness of e-government sys-tems being built. Taking the e-government projects that present economic recovery plans in the United States as an example, it becomes evident that most geographic information systems applied by state and local governments are not the same, frequently incompatible, and based on proprietary standards. Regarding this point, the International Monetary Fund issued a set of recommended standards and codes after the Asian financial crisis of the late 1990s.14 Such principles ought to be taken up and advanced further as a partial solution to the ongo-ing financial crisis.
In many countries, information and services provided are not often presented in a centralized and coordinated manner, which requires business actors to navigate any number of different websites in order to gather the information they need. To address this problem, the Lithuanian economic stimulus plan website provides businesses with ex-tensive information on crisis-response measures, policies and opportunities for different categories of businesses. In a similar vein, the French website for business development and employment pro-vides useful information for small- and medium-sized enterprises in a format structured around thematic clusters (e.g. financing and investment support), functioning then as a single entry point to all information relevant to businesses in the con-text of the crisis.
Better delivery of services depends on the ex-tent to which services offered take user-centricity as a guiding principle, and it does not refer to the size or level of sophistication of e-government structures. In many cases, the creation of a simple website that centralizes and organizes useful infor-mation that had been previously scattered across different government agency portals constitutes by itself a major step towards offering better support for citizens and businesses.
Information is a resource that individuals might not be willing to spontaneously share unless specific settings and motivations to do so are gener-ated. It is important to bear in mind the resistance that reformers might face when confronted with the logics of the public sector. This is particularly so in contexts where esprit de corps is deep-rooted and where information-sharing is the exception, rather than the standard procedure. Beyond changes of a technological nature, deeper structural and or-ganizational changes are necessary to bring about change in the way governments use and provide data and ICT services. Policies aimed at transpar-ency can achieve their goals when governments create suitable institutional and organizational frameworks, incentives, and means such as e-gov-ernment technologies that promote information-sharing at the collective and individual.
1.2 From transparency to participationMost government websites with aims of transpar-ency tend to be one-directional in their provision of information, enabling citizens to track and monitor government spending but not to take a more active role. More advanced websites, how-ever, offer features and facilities enabling citizen participation and engagement. These websites are geared towards active interactions. In this regard, citizens are no longer passive consumers of govern-ment-provided information but active participants in the related content and information generation.
A range of opportunities for citizen partici-pation are offered by Web 2.0, a term that refers to web applications that facilitate interactive in-formation sharing, interoperability, user-centred design and collaboration. In the particular con-text of crisis-response funds and their usage, it is generally observed that governments lag behind non-governmental actors. The findings here seem to confirm this relationship when it comes to ICT in relation to crisis-response funds and policies aimed at mitigating the effects of the economic downturn. As shown by the figure below, only 23 percent of government crisis-response websites make any usage of Web 2.0 tools, compared to 57 percent of websites sponsored by non-govern-mental actors.

15
Chapter OneStimulus funds, transparency and public trust 1United Nations E-Government Survey 2010
Few governments are taking advantage of the prospects offered by interactive technologies to foster participation with relation to economic crisis issues, although they could be reaping the benefits of inclusive policy-making while doing so at lowered implementation costs. No more than 27 percent of cases had explored the prospects of ICT for promoting some kind of citizen feedback or participation, as modest as these attempts might be, through traditional means such as e-mail or through the usage of Web 2.0 tools.
In other words, only a minority of cases ex-plore the prospects of ICT tools for supporting a modality of engagement with external audiences. The budget consultation website of the Canadian province of British Columbia, for example, in-vites citizens to submit videos with their views on alternative ways of addressing the economic crisis and their indications of budgetary priori-ties. Another interesting deployment of ICT tools occurred in June 2009, when a message on the Twitter account of the Governor of California invited citizens to provide feedback on policies to address the State budget deficit. In August of the same year, a website was designed specifically to aggregate all the responses received from citizens via Twitter, with a user-based system also allow-ing users to rate each others’ ideas in an attempt to identify the best submissions.
A misleading assumption frequently made with regard to public participation, be it ICT-enabled or not, is that the simple creation of channels for citizens to interact with govern-ments necessarily engenders citizen participa-tion. Evidence shows that most e-participation experiences have repeatedly shown disappoint-ingly low levels of participation, despite the multiple and varied initiatives implemented by governments in recent years to engage citizens online, and apart from a few highly publicized examples.15 Likewise, discussion groups, blogs and other forums on the topic of crisis-response funds report that, in most of the cases, participa-tion has been extremely low.
By contrast, participatory budgeting has been reasonably successful. The practice, which can be broadly defined as the participation of
citizens in decisions about budget allocation and in the monitoring of public spending, has been identified with a number of positive outcomes. These include increased transparency, innovative delivery of public services and reduction of tax delinquency. In Belo Horizonte, Brazil, and La Plata, Argentina, 10 percent of the population has voted on budget proposals online or via mo-bile telephones. Citizens in the municipality of Pune, India, have made suggestions for budget allocations online through the municipality’s e-budgeting application. In Freiburg, Germany, the city has combined the use of an electronic budget planner with an online moderated delib-eration and aggregation of results in wikis edited by the participants.16
More specifically related to the management of crisis-response funds is an example from the district of Heathcote, Australia, where citizens were invited to decide through the Internet on the allocation of stimulus funds from the State Government. Through a website, users priori-tized the eligible proposals formulated by local community organizations, indicating which projects were the most deserving of existing funds. Citizens cast more than 20,000 votes in a short period of time, with groups actively engaged in canvassing campaigns both online and off line, some setting up stands and others launching online campaigns through social net-works. The meaningful involvement of citizens in budgeting processes is one of the most effi-cient ways to generate an awareness of the exist-ing tradeoffs when allocating limited resources. This opens up space for dialogue and coopera-tion, while allowing policy makers to identify citizens’ preferences and demands. Participatory budgeting initiatives illustrate how meaningful e-participation can be achieved.
Interactive technologies offer governments a way to reap the benefits of inclusive policy-making on economic crisis issues at relatively low cost.
Figure 1.5 Use of Web 2.0 tools by different actors, October 2009
0 10 20 30 40 50 60Prevalence (percent)
Non-governmental websites57.1
Governmental websites23.4
16
Chapter OneStimulus packages and financial bailouts1 United Nations E-Government Survey 2010
1.3 Data access and civil societyMuch of the innovation in the use of ICT to enhance management of crisis-response funds comes from the use of open data by non-govern-mental actors providing services of high public value without governments having to bear the costs. The aim of the open data movement is to make information freely available to everyone, without restrictions from copyright or patents and in standard machine-readable formats that can be exploited without the use of any given piece of software.
Open data enhances public sector efficiency by transferring some of the analytical demands of gov-ernment to third parties such as non-governmental organizations, research institutes and the media, which have been found to combine data from various sources in original and inventive ways. The potential for actors outside of government to pro-vide such services17 when government data is made freely available18 is suggested by Subsidyscope, an initiative of a non-profit foundation based in the United States. Its website draws on publicly avail-able records to deliver high-quality information on the disposition of financial bailout funds by the government.
Through the global economic crisis, it has also become clear that an ability to perceive and under-stand the concept of risk is important for citizens to master and, indeed, is a competency of citizens that is important for the long-term health of the financial system. Such building of competencies (e.g. through formal education) and capabilities (e.g. through learning by doing and by using) among the citizens would require the use of data.
1.3.1 Government as a platform The idea of ‘government 2.0’ is generally associated with the use of social media by the public sector. Recently, the notion has assumed greater definition through its association with government as a ‘plat-form’ or provider of data and services for others to exploit as they see fit.19 Advocates for the concept of government as a platform privilege the role that gov-ernments should play as providers of web services, allowing third parties to innovate by building upon government data and applications. They believe that if governments provide data in a non-proprietary and predictable format, third parties are more likely to maximize the value of this information, hence providing services that better respond to users’ ex-pectations and needs.20 Consequently, it is claimed that governments should use the Internet to provide free data in formats that are open, structured21 and machine-readable, while the Web presence of govern-ments is incrementally reduced as third parties start to provide information to the general public.22
The creation of the data.gov website by the United States Government is one of the most sub-stantial steps taken so far to provide such a platform for third parties.23 Launched in 2009, the website functions as a clearinghouse for datasets gener-ated by the government in an accessible developer-friendly format. The United Kingdom and the State of Sao Paulo in Brazil are following a similar path towards the creation of websites that will serve as a single point of access to public data. With the inten-tion of providing added value, both Governments have invited application developers to provide feed-back on the conception of the sites.24 Similar feed-back was sought for the second version of United States Recovery Act website by the United States Recovery Accountability and Transparency Board, which asked the community of developers for their views on the most convenient format for disclosing data on crisis-response funds.25
For the moment, the provision of open govern-ment data via online and mobile channels is limited primarily to developed countries. Nevertheless, the prospect of third parties delivering services of high public value, which would otherwise have to be provided using taxpayer funds, is a path that should not be underestimated for both developed and developing countries.
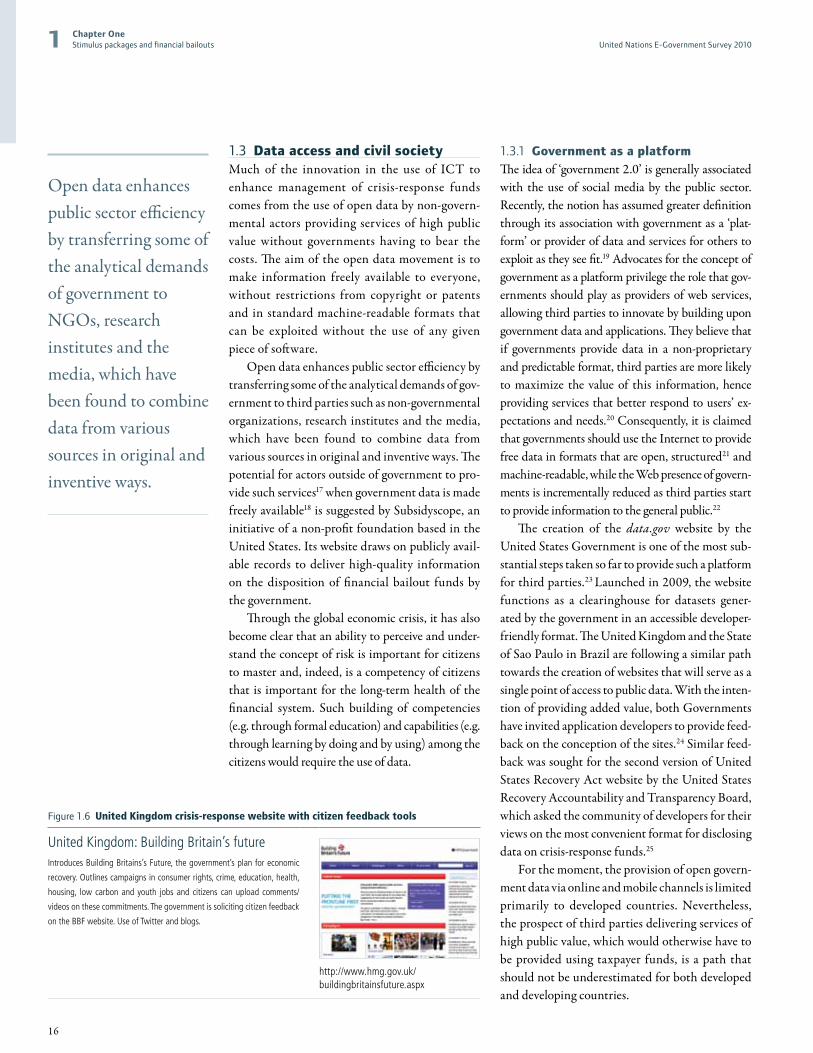
Open data enhances public sector efficiency by transferring some of the analytical demands of government to NGOs, research institutes and the media, which have been found to combine data from various sources in original and inventive ways.
Figure 1.6 United Kingdom crisis-response website with citizen feedback tools
UnitedKingdom:BuildingBritain’sfuture
http://www.hmg.gov.uk/buildingbritainsfuture.aspx
IntroducesBuildingBritains’sFuture,thegovernment’splanforeconomic
recovery.Outlinescampaignsinconsumerrights,crime,education,health,
housing, lowcarbonandyouth jobsandcitizens canuploadcomments/
videosonthesecommitments.Thegovernmentissolicitingcitizenfeedback
ontheBBFwebsite.UseofTwitterandblogs.

17
Chapter OneStimulus funds, transparency and public trust 1United Nations E-Government Survey 2010
1.3.2 The economics of open dataIn recent years, third parties have shown not only that they are able to deliver online services of great public value but also, in many cases, that they are able to provide such services even more efficiently than governments. To increase this kind of inno-vative work, the first step is to create a structure to ensure that governments provide data and web services in an appropriate manner. This will pro-mote the co-production of public goods that foster transparency and deliver better services.
Most governments possess an extensive amount of data that could be reused and combined in groundbreaking ways by third party actors, but this data is dispersed across agencies of different levels and diverse branches of government. To put it bluntly, most governments may not be fully aware of how much and what data they create and dispose of, or from where it can be sourced. The majority of these highly dispersed datasets are un-likely to be available in structured and machine-readable formats.
In organizational terms, addressing the problem of data dispersion and the lack of common standards would require governments to implement and en-force policies for shared standards of data gathering and reporting across public agencies at different levels and branches. Finally, acquiring the structure neces-sary for the delivery of data to third parties entails the provision of a single point of access, conveying and updating all the data gathered in a developer-friendly manner. The steps involved in the appropriate provi-sion of data, as briefly described above, produce bet-ter results when they occur simultaneously and in a gradual manner. For instance, governments might achieve their goals more efficiently if they release their data as it becomes available, rather than wait-ing to reach a hypothetical threshold or target before starting to release their data.
The deployment of human and financial re-sources to create the structure required for open data is a particularly sensitive matter for govern-ments in the context of an economic downturn and tightening budgets, and it is a major issue at any given time for developing countries. Thus, the incentives to bear these costs rely on the ex-pectation of concrete medium- and long-term results. The delivery of value-for-money when
building a structure for the provision of open data is highly dependent on whether third par-ties will actually come into play or not. That is, for an existing offer of data there must be a corre-sponding demand, and vice-versa. The economics of open data is about releasing governments from the costly delivery of services online26 while de-creasing marginal costs for the provision of gov-ernment-held data. The prospect of completing this virtuous cycle, which offsets governments’ initial investments, is the compelling argument for governments to deploy efforts to incremen-tally reinforce their role as providers of data and Web services.
The economics of open data, with governments as data providers and third parties delivering the information to the public in more innovative and creative ways, has an inevitable resemblance to economic models that privilege market efficiency with the least governmental intervention. It is particularly interesting that such views are put forward precisely at a moment of increased gov-ernment interventionism and scepticism towards unregulated markets. Will third parties increas-ingly co-produce online services if governments are to continuously withdraw from their previous roles as information providers? To what extent will non-governmental parties be able to address public demands and needs once governments start providing the necessary infrastructure in the form of datasets and Web services? If governments free the data, will third parties come?
Third parties have proven their ability to inno-vate and deliver, yet their range of action has been generally restricted to certain sectors of government activity and mainly concentrated in developed coun-tries. It is still too early to paint a clear picture of the
Figure 1.7 United States federal open data initiative
UnitedStates:Data.gov
http://www.data.gov
Federaldatasetsopenlyavailableforpublicuse.Visitorsareinvitedto
suggestideasforadditionaldataandothersiteenhancements.
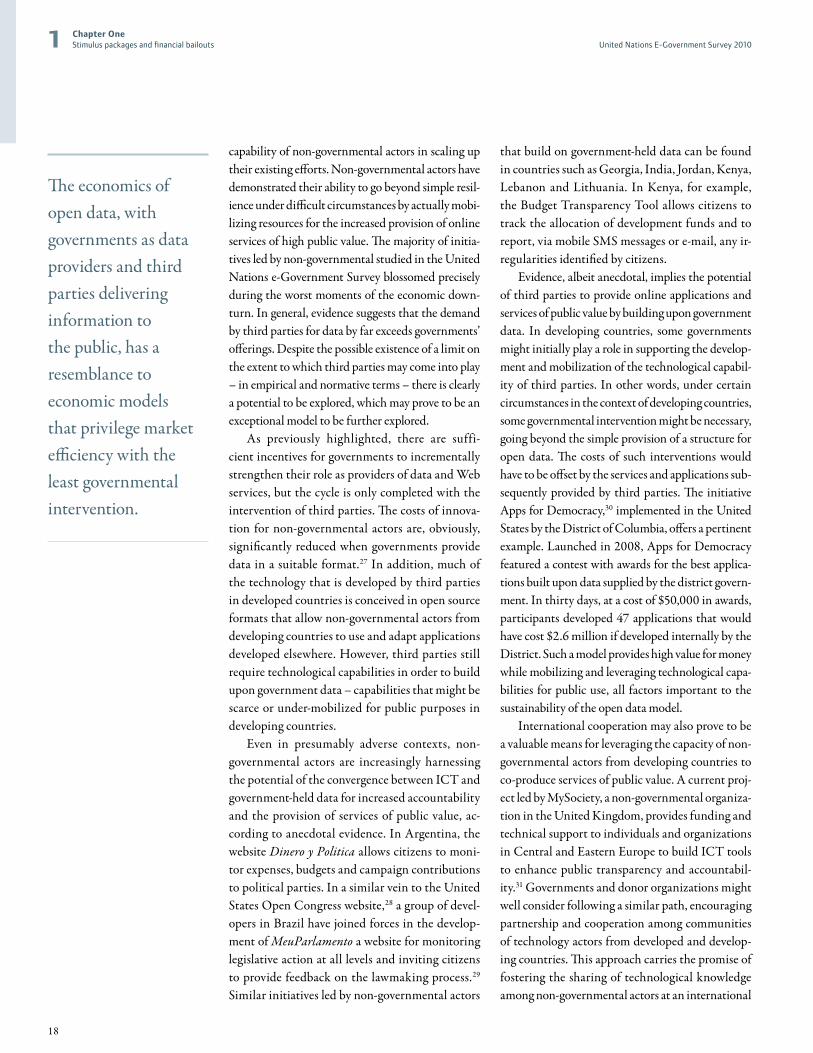
18
Chapter OneStimulus packages and financial bailouts1 United Nations E-Government Survey 2010
capability of non-governmental actors in scaling up their existing efforts. Non-governmental actors have demonstrated their ability to go beyond simple resil-ience under difficult circumstances by actually mobi-lizing resources for the increased provision of online services of high public value. The majority of initia-tives led by non-governmental studied in the United Nations e-Government Survey blossomed precisely during the worst moments of the economic down-turn. In general, evidence suggests that the demand by third parties for data by far exceeds governments’ offerings. Despite the possible existence of a limit on the extent to which third parties may come into play – in empirical and normative terms – there is clearly a potential to be explored, which may prove to be an exceptional model to be further explored.
As previously highlighted, there are suffi-cient incentives for governments to incrementally strengthen their role as providers of data and Web services, but the cycle is only completed with the intervention of third parties. The costs of innova-tion for non-governmental actors are, obviously, significantly reduced when governments provide data in a suitable format.27 In addition, much of the technology that is developed by third parties in developed countries is conceived in open source formats that allow non-governmental actors from developing countries to use and adapt applications developed elsewhere. However, third parties still require technological capabilities in order to build upon government data – capabilities that might be scarce or under-mobilized for public purposes in developing countries.
Even in presumably adverse contexts, non-governmental actors are increasingly harnessing the potential of the convergence between ICT and government-held data for increased accountability and the provision of services of public value, ac-cording to anecdotal evidence. In Argentina, the website Dinero y Politica allows citizens to moni-tor expenses, budgets and campaign contributions to political parties. In a similar vein to the United States Open Congress website,28 a group of devel-opers in Brazil have joined forces in the develop-ment of MeuParlamento a website for monitoring legislative action at all levels and inviting citizens to provide feedback on the lawmaking process.29 Similar initiatives led by non-governmental actors
that build on government-held data can be found in countries such as Georgia, India, Jordan, Kenya, Lebanon and Lithuania. In Kenya, for example, the Budget Transparency Tool allows citizens to track the allocation of development funds and to report, via mobile SMS messages or e-mail, any ir-regularities identified by citizens.
Evidence, albeit anecdotal, implies the potential of third parties to provide online applications and services of public value by building upon government data. In developing countries, some governments might initially play a role in supporting the develop-ment and mobilization of the technological capabil-ity of third parties. In other words, under certain circumstances in the context of developing countries, some governmental intervention might be necessary, going beyond the simple provision of a structure for open data. The costs of such interventions would have to be offset by the services and applications sub-sequently provided by third parties. The initiative Apps for Democracy,30 implemented in the United States by the District of Columbia, offers a pertinent example. Launched in 2008, Apps for Democracy featured a contest with awards for the best applica-tions built upon data supplied by the district govern-ment. In thirty days, at a cost of $50,000 in awards, participants developed 47 applications that would have cost $2.6 million if developed internally by the District. Such a model provides high value for money while mobilizing and leveraging technological capa-bilities for public use, all factors important to the sustainability of the open data model.
International cooperation may also prove to be a valuable means for leveraging the capacity of non-governmental actors from developing countries to co-produce services of public value. A current proj-ect led by MySociety, a non-governmental organiza-tion in the United Kingdom, provides funding and technical support to individuals and organizations in Central and Eastern Europe to build ICT tools to enhance public transparency and accountabil-ity.31 Governments and donor organizations might well consider following a similar path, encouraging partnership and cooperation among communities of technology actors from developed and develop-ing countries. This approach carries the promise of fostering the sharing of technological knowledge among non-governmental actors at an international
The economics of open data, with governments as data providers and third parties delivering information to the public, has a resemblance to economic models that privilege market efficiency with the least governmental intervention.

19
Chapter OneStimulus funds, transparency and public trust 1United Nations E-Government Survey 2010
level, ultimately strengthening the capabilities of third parties from both developed and developing countries in the co-production of services.
1.3.3 Who guards the e-guardians? A paramount value of public service is the extent to which it is amenable to public accountability.32 While third parties increasingly use ICT as a means to enhance transparency and empower citi-zens to hold governments accountable, the absence of mechanisms to hold third parties themselves ac-countable remains an issue to be addressed. This is even more pertinent if governments are to increas-ingly redefine their role as ‘platforms’, with third parties becoming gradually more significant in their emerging role as techno-political intermedi-aries between governments and the public.
If governments are to act mainly as providers of data and Web services, third parties come into play as the central actors in the definition of how data is presented and contextualized. The positive aspect of this is that third parties have shown a greater ability to represent data in innovative and accessible ways. This is useful if the consequent representation can reduce cognitive overload from access to so much information, improve its under-standing and highlight patterns and associations that might otherwise go unnoticed. Yet, the man-ner in which data is represented, as well as the pat-terns and correlations highlighted, are the fruit of human judgement.33 It remains to be seen how skilled third parties will be in helping the public to see the validity behind the information.
The techno-mediation deployed by third parties has proven valuable and their legitimacy has not been seriously challenged to date. However, if their role is expected to develop further, labels such as ‘non-parti-san’ and ‘non-profit’ might not be sufficient to ensure public trust and accountability in the long term. Last but not least, the competition for audiences online should not be regarded as a mechanism capable by it-self of rewarding the third parties that are committed to the values of transparency and public good. The emerging role of third parties in providing informa-tion to the public calls for creative and considered reflection on ways to ensure that public trust, both in governments and third parties, is not being taken for granted or undermined.
1.4 ConclusionsE-government tools have been used in an un-precedented manner as a means to support policies to alleviate and cope with the effects of the recent global economic crisis. They have played a major role in providing transparency of crisis-response measures, conveying relevant information and support to citizens and busi-nesses, and encouraging feedback from citizens on alternatives for addressing the effects of the economic downturn.
The capacity to convey transparency is within the reach of, if not all, most national governments around the world. Moreover, there is growing evi-dence that the provision of transparency – and the use of e-government tools to support it – consti-tutes an approach wherein the initial investments required are quickly offset by the outcomes gen-erated, such as increased savings and enhanced public trust.
Third parties can play an important role in the co-provision of services of high public value by de-ploying technologies in a manner that is creative and innovative. By enacting open data principles, governments lay down the foundations that reduce the entry barriers for non-governmental parties, thus allowing for the co-production of public ser-vices at minimal costs for governments and, conse-quently, for taxpayers.
The extent to which user-centricity is a compo-nent of each of the initiatives is a factor in its suc-cess. There exists a nearly systematic discrepancy between the offer of e-government facilities and the actual take-up of the services offered. This in-dicates that, less than a technological issue, users’ take-up depends ultimately on the extent to which services are able to effectively address their needs and preferences.
Participatory practices, when appropriately de-signed and implemented, can address users’ needs. Interactive ICT tools have proven to be an effec-tive means for policy makers to identify the needs, demands and preferences of citizens. However, it is not sufficient to simply create of ICT-mediated channels of communication between governments and citizens. It is essential to identify users’ needs, be it for the design of new e-government services or for the allocation of resources. This implies not

20
Chapter OneStimulus packages and financial bailouts1 United Nations E-Government Survey 2010
only creating channels to give a voice to citizens, but also creating the means to listen to the citizens and to provide them with meaningful responses.
The capacity of governments to address the is-sues that emerge as the economic crisis continues to unfold constitutes the core element through which trust can be renewed and reinforced, while trans-parency is also enhanced. As governments find themselves with constrained budgets and mount-ing demands, the need for providing better value for money has never been so pressing in the recent history of the public sector.
Although governments cannot easily afford to make mistakes, risk-aversion should not have the upper hand over innovation. The more prudent ac-tion is to move away from the comfort zone of stan-dard procedures and logics anterior to the crisis, as paradoxical as this may seem. The current envi-ronment should be regarded as an opportunity for change in the way governments operate and inter-act with society. As experience with crisis-response websites shows, the Internet offers governments an opportunity to reinvent themselves even as they ad-dress a host of financial and economic challenges. n

21
Chapter OneStimulus funds, transparency and public trust 1United Nations E-Government Survey 2010
Mgmt. ManagementoffundsG2B GovernmenttobusinesscommunicationSocial protect. Socialprotectioninformation
Table 1.2 Features of selected crisis-response websites
Objectives ToolsDraws on pre-existing
site
Public scrutiny of funds Mgmt. G2B
Social protect.
Feed- back
Geo-refencing
Social media
Australia. Economic Stimulus Planhttp://www.economicstimulusplan.gov.au/
BBreakdownofstimulusplanandtrackingstimulusprojectsatlocallevel.Enablesinteractivity(askaquestion).Linkstosub-nationalwebsitesofsimilarscope.Makeslinktonationaljobswebsite,apre-existinginitiativethathelpsmitigatetheeffectofthecrisis.Subscriptiontoupdates.
ü ü ü ü ü ü
Belgium. Restructuration d’entreprisehttp://www.herstructureringen.be/restructuration/fr/homepage/index.html
Intergovernmentalsiteexplainingrecoverymeasuresforbusiness.
ü ü
Belgium. Au travail – Mesures pour l’emploihttp://www.autravail.be/
AimstoprovidesimpleandcentralizedplacetofindinformationthatisavailableontheInternet,regardingfederalandregionalmeasuresthatpromoteemploymentbothforbusinessandfortheunemployed.Byfillinginaprofilethebusinessorthejobseekercanfindwhichmeasuresandopportunitiesareapplicable.
ü ü
Brazil. Programa de Aceleraçaõ do Crescimentohttp://www.brasil.gov.br/pac/
Government’sprogrammeforacceleratedgrowth.Informationontheallocationoffundsbyregionandsector.Linkalsotothepre-existinggovernmentbudgetconsultation.
ü ü ü
Canada. Department of Financehttp://www.fin.gc.ca/n08/data/08-103_1-eng.asp
Fiscalstimulusbudgetconsultation.
ü
Canada. Canada’s Economic Action Planhttp://www.actionplan.gc.ca/
OutlinesCanada’sEconomicActionPlan.LinkstoFacebook,Flickr,Twitter,YoutubeandMyspace.
ü ü ü ü ü
China. National Development and Reform Commissionhttp://www.ndrc.gov.cn/
NationalDevelopmentandReformCommissionwebsitewithinformationontheChinesestimulusplan.
ü ü
France. Les 1000 projets de la relancehttp://ww.relance.gouv.fr/
Details projects being carried out under stimulus package. Link to relanceTV. Specific section for incentives forcompanieswillingtohire,giventhatoneoftheobjectivesoftheinitiativeisprotectionofemployment.
ü ü ü ü
France. Agir pour no entreprises, c’est agir pour l’emploihttp://www.nosentreprisesnosemplois.gouv.fr/
G2B2G(governmenttobusinesstogovernmentinteraction)portalcentralizinginformationrelevanttobusinesses,e.g.informationonwheresmallandmediumenterprises(SME)canfindrelevantinformationonhowtoaccessfundsdeployedbythegovernmenttoaddressthecrisis.
ü ü
Germany. Bundesministerium der Finanzenhttp://www.fuer-alle-da.de/
MinistryofFinance.Detailsoffinancialcrisisandbankbailouts.Pageallowscitizenstoaskquestionsonlineandtheanswersarealsodisplayedonline.FunctionsasaFAQ(frequentlyaskedquestions)thatreliesonuser-generatedcontent.
ü ü ü
Iceland. The Icelandic Government Information Centre http://www.iceland.org/info/iceland-crisis/
TheIcelandgovernmentweb-portalprominentlyfeaturesalinkontheeconomiccrisisoneachpage.Seriouslyaffectedbythecrisis,IcelandprovidesasimplewebsitewithprovisionofgeneralinformationinEnglishconcerningpoliciestoaddressthecrisis,whichmightindicatesomeefforttoregainconfidencefromtheexternalpublicandmarkets.
ü
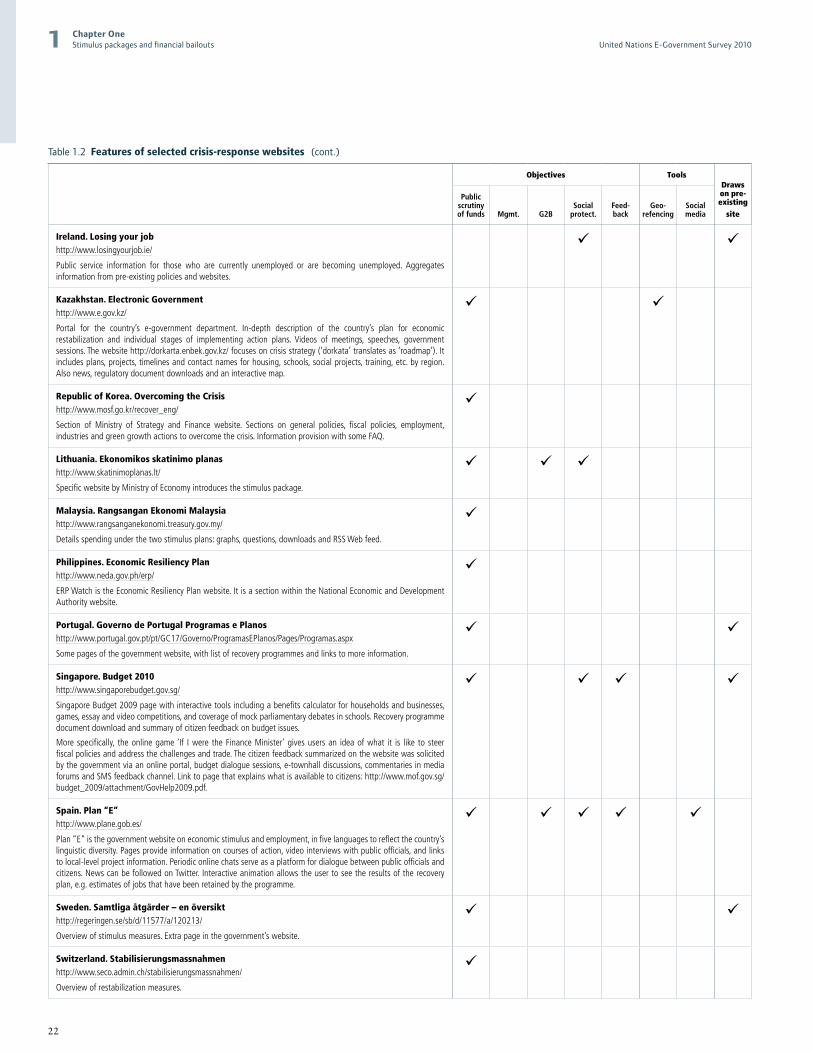
22
Chapter OneStimulus packages and financial bailouts1 United Nations E-Government Survey 2010
Table 1.2 Features of selected crisis-response websites
Objectives ToolsDraws on pre-existing
site
Public scrutiny of funds Mgmt. G2B
Social protect.
Feed- back
Geo-refencing
Social media
Ireland. Losing your jobhttp://www.losingyourjob.ie/
Public service information for those who are currently unemployed or are becoming unemployed. Aggregatesinformationfrompre-existingpoliciesandwebsites.
ü ü
Kazakhstan. Electronic Governmenthttp://www.e.gov.kz/
Portal for the country’s e-government department. In-depth description of the country’s plan for economicrestabilization and individual stages of implementing action plans. Videos of meetings, speeches, governmentsessions.Thewebsitehttp://dorkarta.enbek.gov.kz/focusesoncrisisstrategy(‘dorkata’translatesas‘roadmap’).Itincludesplans,projects,timelinesandcontactnamesforhousing,schools,socialprojects,training,etc.byregion.Alsonews,regulatorydocumentdownloadsandaninteractivemap.
ü ü
Republic of Korea. Overcoming the Crisis http://www.mosf.go.kr/recover_eng/
Section of Ministry of Strategy and Finance website. Sections on general policies, fiscal policies, employment,industriesandgreengrowthactionstoovercomethecrisis.InformationprovisionwithsomeFAQ.
ü
Lithuania. Ekonomikos skatinimo planashttp://www.skatinimoplanas.lt/
SpecificwebsitebyMinistryofEconomyintroducesthestimuluspackage.
ü ü ü
Malaysia. Rangsangan Ekonomi Malaysia http://www.rangsanganekonomi.treasury.gov.my/
Detailsspendingunderthetwostimulusplans:graphs,questions,downloadsandRSSWebfeed.
ü
Philippines. Economic Resiliency Planhttp://www.neda.gov.ph/erp/
ERPWatchistheEconomicResiliencyPlanwebsite.ItisasectionwithintheNationalEconomicandDevelopmentAuthoritywebsite.
ü
Portugal. Governo de Portugal Programas e Planos http://www.portugal.gov.pt/pt/GC17/Governo/ProgramasEPlanos/Pages/Programas.aspx
Somepagesofthegovernmentwebsite,withlistofrecoveryprogrammesandlinkstomoreinformation.
ü ü
Singapore. Budget 2010http://www.singaporebudget.gov.sg/
SingaporeBudget2009pagewithinteractivetoolsincludingabenefitscalculatorforhouseholdsandbusinesses,games,essayandvideocompetitions,andcoverageofmockparliamentarydebatesinschools.Recoveryprogrammedocumentdownloadandsummaryofcitizenfeedbackonbudgetissues.
Morespecifically, theonlinegame‘If Iwere theFinanceMinister’givesusersan ideaofwhat it is like tosteerfiscalpoliciesandaddressthechallengesandtrade.Thecitizenfeedbacksummarizedonthewebsitewassolicitedbythegovernmentviaanonlineportal,budgetdialoguesessions,e-townhalldiscussions,commentariesinmediaforumsandSMSfeedbackchannel.Linktopagethatexplainswhatisavailabletocitizens:http://www.mof.gov.sg/budget_2009/attachment/GovHelp2009.pdf.
ü ü ü ü
Spain. Plan “E”http://www.plane.gob.es/
Plan“E”isthegovernmentwebsiteoneconomicstimulusandemployment,infivelanguagestoreflectthecountry’slinguisticdiversity.Pagesprovideinformationoncoursesofaction,videointerviewswithpublicofficials,andlinkstolocal-levelprojectinformation.Periodiconlinechatsserveasaplatformfordialoguebetweenpublicofficialsandcitizens.NewscanbefollowedonTwitter.Interactiveanimationallowstheusertoseetheresultsoftherecoveryplan,e.g.estimatesofjobsthathavebeenretainedbytheprogramme.
ü ü ü ü ü
Sweden. Samtliga åtgärder – en översikt http://regeringen.se/sb/d/11577/a/120213/
Overviewofstimulusmeasures.Extrapageinthegovernment’swebsite.
ü ü
Switzerland. Stabilisierungsmassnahmen http://www.seco.admin.ch/stabilisierungsmassnahmen/
Overviewofrestabilizationmeasures.
ü
(cont.)

23
Chapter OneStimulus funds, transparency and public trust 1United Nations E-Government Survey 2010
Mgmt. ManagementoffundsG2B GovernmenttobusinesscommunicationSocial protect. Socialprotectioninformation
Table 1.2 Features of selected crisis-response websites
Objectives ToolsDraws on pre-existing
site
Public scrutiny of funds Mgmt. G2B
Social protect.
Feed- back
Geo-refencing
Social media
United Kingdom. Building Britain’s Futurehttp://www.hmg.gov.uk/buildingbritainsfuture.aspx
IntroducesBuildingBritain’sFuture,thegovernment’splanforeconomicrecovery.Outlinescampaignsinconsumerrights,crime,education,health,housing,lowcarbonandyouthjobsandcitizenscanuploadcomments/videosonthesecommitments.Thegovernmentissolicitingcitizenfeedbackontheplan.UseofTwitterandblogs.
ü ü ü
United Kingdom. Real help nowhttp://www.realhelpnow.gov.uk/
Adviceforcitizensonhowtocopewiththefinancialcrisis(e.g.homeowners,business,jobs).Possibletosearchforinitiativesatthelocallevelconcerningtherecoveryplanasawhole.
ü ü ü
United States. Reovery.govhttp://www.recovery.gov/
Thegovernment’sofficialwebsiteto‘trackthemoney’withdatarelatedtoUnitedStatesRecoveryActspending.Forcitizenstotrackthedevelopmentoftherecoveryforgreatertransparencyandaccountability.Linkstoexistingjobswebsites.UseofTwitter,Facebook,MySpaceandYouTube.
ü ü ü ü ü ü ü
United States. FinancialStability.govhttp://www.financialstability.gov/
Websiteonthefinancialstabilityplan.News,reportsandrelevantinformation,forexampleonthelocalimpactofthecapitalpurchaseprogramme.
ü ü ü
United States USAspending.govhttp://www.usaspending.gov/
Detailsfederalspendingincludingthatrelatedtostimulusfunds.Includes’ITDashboard’tofollowinvestmentsintheinformationtechnologysector.Thedashboardisconsideredtobeoneofthemostinnovativetoolstoenhancepublicscrutinyofgovernmentspending.
ü ü ü
United States. FederalReporting.govhttps://www.federalreporting.gov/
Businesstogovernment(B2G)websitethatservesasthecentraldatacollectionsystemforFederalAgenciesandRecipientsofFederalawardsundertheUnitedStatesRecoveryAct.Registereduserssubmitquarterlyreportsandreviewdata.Itprovidessupportonlinethroughalivechat.
ü ü
United States. The President’s SAVE Awardhttp://www.whitehouse.gov/omb/save/SaveAwardHomePage/
PartoftheWhitehousewebsite.IntroducesthePresident’sSAVEAwardtoenableFederalemployeestosubmittheirideasforhowgovernmentcansavemoneyandperformbetter,aspartofannualbudgetprocess.
ü ü
United States. A National Dialoguehttp://www.thenationaldialogue.org/
Onlinedialogueonsolutionstoimprovethedesignoftherecovery.govwebsite.HostedtheRecoveryAccountabilityandTransparencyBoardwiththeNationalAcademyofPublicAdministration.Nowclosed.
ü ü ü
(cont.)

24

25
Chapter TwoRoles for e-government in financial regulation and monitoring 2United Nations E-Government Survey 2010
Chapter 2
Roles for e-government in financial regulation
and monitoringGovernments are deploying new information and communi-cations technology in response to the global financial crisis. These electronic government technologies have the potential to deliver imaginative options for policy-making processes as well as for the debates that surround them. For governments, the current most critical issue is how to rebuild trust in a sys-tem of financial weaknesses and governmental responses that has proved so highly untrustworthy to date. At this time, how-ever, no one knows what these attempts at rebuilding trust might consist of, much less what they could possibly achieve in terms of refashioning the entire financial system – ideally, a system with more effective policies in place for financial regu-lation and monitoring.
In two historical analogies – the Great Depression and the Asian financial crisis – new technology embedded in capital formation alongside government efforts played some part in the subsequent stages of recovery. These historical compari-sons demonstrate how alike the ‘causes’ of past and present financial crises may be, as well as the patterns of circumstances and behaviours that emerge. Moreover, these comparisons inform the discussion about the role of new technology and especially governmentally underpinned technology (such as rural electrification in the 1930s) in recovery. In the recent Asian experience, government actually made use of ICT, which provides the technological backbone of e-government, to advance recovery.
2.1 E-government risks and benefits 26
2.2 Restoring trust after times of volatility 28
2.2.1 Starting from the right financial model 28
2.2.2 Roles for e-government in financial monitoring 31
2.3 Confidence, capabilities and competencies 33
2.3.1 Panics and restoring confidence 33
2.3.2 Shortcomings in skills and abilities 34
2.3.3 A platform to reconsider public expectations 36
2.4 International cooperation and e-government 36
2.4.1 Problems from a global perspective 36
2.4.2 Common standards for better regulation 38
2.4.3 The financial crisis and developing countries 39
2.5 Conclusions 40

26
Chapter TwoRoles for e-government in financial regulation and monitoring2 United Nations E-Government Survey 2010
2.1 E-government risks and benefitsE-government has a great deal to offer in the reform of the financial regulatory system. Such reform should aim to promote the transparency, integrity and efficiency of the financial sector and sectors that are linked to it. This is what e-government does best, so long as its practitioners are well-versed in carrying out such objectives. E-government car-ries the additional advantage of being able to effect such outcomes in ‘real time’.1
Most e-government is embedded in ICTs, which are connecting more and more people to a wider va-riety (‘breadth’) and profundity (‘depth’) of infor-mation. ICTs are connecting participants who had not previously been connected, which is enhancing the complexity in ‘breadth’ (the number of con-nections involved) of the market and the product.2 Consider the number of participants in the home mortgage, for example: homeowners, commercial banks, savings and loan associations, investment banks and other issuers of mortgage-backed secu-rities, purveyors of collateralized debt obligations and credit default swaps, mortgage lenders, brokers, servicers, trustees, credit-rating agencies, insurance companies, investors (including hedge funds, pen-sion funds, sovereign wealth funds and mutual funds), regulators, government-sponsored enter-prises, and politicians and their constituents. The number of financial institutions and investors enter-ing this sector increased as a result of the in-depth securitization following the 1980s and the repeal of Glass-Steagall Act in 1999. At the same time, the in-creasing complexity of the product design attracted increasing numbers of consumers who had not been able to access the traditional mortgage.
As the number of connections has grown, so too has the sophistication of the financial sector. This increasing ‘breadth’ can be seen in the design of more and more sophisticated financial prod-ucts, based on advanced mathematical models. The derivative products are designed as portfolios originating from different sources and including multi-layer securities. In this way, securitization has broken down the traditional relationship be-tween borrowers and lenders.
This leap forward in terms of complexity both in breadth and in depth in the financial sector cre-ated ideal conditions for the use of e-government
technology in problem-solving efforts. In the re-cent mortgage meltdown, however, as the regula-tors and major product providers worked to resolve the problems there proved to be a ‘downside’ asso-ciated with e-government. Regulators encountered problems linked to secrecy rather than transpar-ency, problems associated with the skills and competences of those individuals entrusted with coping with e-government, and problems with the opacity of the new derivative financial products themselves. In terms of e-government, all of these factors lowered the performance of regulators.
Another potential downside is that once e-government begins to develop and become more sophisticated, citizens will be compelled to inter-act electronically with the government on a larger scale, which could potentially lead to a lack of privacy for civilians as their government obtains more and more information on them. Increased contact between government and its citizens can be a positive or negative experience. Other pitfalls of particular relevance to financial monitoring in-clude the potential for high cost for little return on investment, lack of access for groups such as the poor, and a false impression of transparency given that governments control the information.
E-governanceE-government refers to a rather motley and eclec-tic variety of front-office and back-office opera-tions that happen to be carried out by government and that has in places become properly systemic. There is a broader term than e-government. The notion of ‘e-governance’ refers to the wider process of bringing about the corresponding transforma-tion in society.3 Pippa Norris, McGuire Lecturer in Comparative Politics at the John F. Kennedy School of Government at Harvard University, describes the difference in views held by optimists and pessimists about e-government:
“Cyber-optimists are hopeful that the devel-opment of interactive services, new channels of communication, and efficiency gains from digi-tal technologies will contribute towards the revi-talisation of the role of government executives in representative democracies, facilitating communi-cation between citizen and the state. In contrast, cyber-pessimists express doubts about the capacity
The leap forward in complexity both in breadth and in depth in the financial sector has created ideal conditions for the use of e-government in problem-solving efforts.

27
Chapter TwoRoles for e-government in financial regulation and monitoring 2United Nations E-Government Survey 2010
of governments to adapt to the new environment, stressing that it is naïve to expect technology to transform government departments as organisa-tions that are inherently conservative, hierarchical and bureaucratic.” 4
For practitioners of policy, neither of these ex-treme viewpoints might appear particularly useful, yet Norris offers the promise of effective ICT based on good governance:
“If practitioners bear in mind the factors of inclusiveness, equity, democratic accountability, transparency, civic engagement and other values embedded in the notion of ‘good governance’ to pro-vide a substantial ethical grounding for e-govern-ment, it is possible to devise and implement a series of interventions involving ICTs that help address … key challenges facing governments in developing nations today.” 5 Thus good e-government can be said to be
founded on good e-governance. However, the con-verse is also true: good e-government also contrib-utes to realizing good e-governance.
An interim assessmentE-government is becoming a meaningful solution to providing better communication between the government (as policy maker and implementer) and citizens, and between the government (as regula-tor) and the financial sector. In fact, e-government has been put into practice since the early 1990s in industrialized countries such as the United States. However, in most of these countries, e-government has been used on a task-by-task basis rather than in a systemic manner. Certainly, the construction and implementation of e-government is a dynamic and ongoing process.6 Many e-government web-sites, particularly those established and operated by governmental agencies, are still in their infancy stage and cannot as yet provide services that are satisfactory in either quantity or quality.7
To deal with the financial crisis in particular, the central issues promoted here are transparency, integrity and productivity (efficiency per unit of time), which are precisely the objectives that the introduction of e-government has the potential to improve. The most pertinent issue begins with how to implement e-government on a task-by-task basis, and the capabilities and competencies required,
since these can permit the extension of operations. Eventually, this could result in the emergence of a new system of government and a new paradigm for governance.8 The road from a task-by-task basis to a properly functioning system is, however, a long and rather tortuous one, involving cutting through or across many vested interests. Again there is much to gain from contemplating past historical evi-dence on how large systems came together, e.g. in electricity or railway networks.9
Regarding citizen participation, e-govern-ment issues remain somewhat controversial, and the impact seems to be evolving unevenly across populations. Some researchers argue that an in-crease in citizen participation in government de-cision-making could not be relied on to produce positive effects.10 Moreover, the transparency of information disclosure may actually worsen the digital divide.11 This may be the case if the policy makers are risk-averse, or if they are simply ad-dressing the interactive comments they receive from certain vocal citizen participants rather than fulfilling their mandate or responding to the public interest.12 A study of the central banks found that it was the independence of central banks that brought about their transparency, and not the reverse.13
In contrast to these pessimistic critics, propo-nents of citizens’ participation via the Internet or other ICT methods are making their case. Michael R. Ward suggests that the spread of Internet usage would reduce the cost of political activities, as well as the possibility of ‘circlet politics’, though he em-phasizes that the conclusion still needs to be tested through empirical studies.14 Steven L. Clift sug-gests democracy can be deepened and become more participatory with the effective implementation of ICTs.15 Many ICT industry observers, along with members of the current United States administra-tion under President Barack Obama, also advocate the democratization of data.16
In any event, citizen participation via the Internet is not in the foreground of our discussion about e-government and the financial crisis. It is generally agreed that ‘transparency of information’ is good for democracy, the quality of regulation, international coordination and the competency of the general pub-lic in dealing with corresponding matters.
The central issues promoted here are transparency, integrity and productivity, which are precisely the objectives that the introduction of e-government has the potential to improve.

28
Chapter TwoRoles for e-government in financial regulation and monitoring2 United Nations E-Government Survey 2010
Beyond this point, the discussion is organized into four main sections. In each section, the largely defensive, reactive tone in the earlier parts is re-placed later by scenarios in which a better society could be built by making more aggressive and pro-active use of e-government, and by shifting focus from surviving in the short run, to faring better in the medium- to long-term.
2.2 Restoring trust after times of volatility Beginning in mid-2007, a number of influential people issued warnings at various stages about the global financial situation. Most of the financial sec-tor and the general public ignored these warnings, thereby propelling themselves and their societies into recession and then depression. Questions re-main concerning the following:
• Would societies have listened to ‘better’ informa-tion and advice had it been offered, as the concept of ‘social capabilities’ suggests, or is this possibil-ity refuted by propositions like ‘irrational exuber-ance’, ‘herd instinct’ and ‘herd mentality’?17
• Did the e-technologies linking global financial centres actually make things worse than the ab-sence of such technologies in the past?
• Could better and wiser governance of finan-cial systems have averted recession, not to say depression, especially through more extensive adoption of e-government principles? And if so, did the basic shortcomings lie in the insti-tutions associated with those financial systems, or can they be attributed to the failings of indi-viduals and/or the particular organizations in which they were embedded? Stated in this fashion, these questions cannot
be adequately answered from the information currently available. The more enduring question to ask instead is: What are the opportunities for using e-government to ward off crises in the future? The pressing challenge then becomes one that has been skirted around several times already in this chapter, of how to go about restoring trust in what is widely regarded as a failed system. But to what extent can this be done without being in possession of a valid ‘model’ of the ways in which the present system may be malfunctioning?
The remainder of chapter two thus looks at fi-nancial regulation first in terms of models and then in terms of risk and other problems, before turning to what e-government might do better.
2.2.1 Starting from the right financial modelWith the views of economists and policy makers subject to change and sometimes caprice, who is correct? For any solution to financial problems, including the use of e-government technol-ogy, the key is to start from a valid viewpoint or model. This can be seen, for example, in ap-proaches to financial regulatory policy, whether we are discussing the Great Depression in the 1930s and its aftermath or the ongoing financial crisis of recent times.
By the 1980s the monetarist school of thought had eclipsed the rival Keynesian school and was putting forward as its base the theory of ‘ratio-nal expectations’, a modeling theory in which outcomes do not differ systematically from what people expect them to be. Rational expectations are based on probabilistic choices, as opposed to irrational expectations based on instinct. One of the direct implications of the rational expecta-tions theory was an overt preference for govern-ment policies to follow certain rules. The reasoning behind the preference for governments following expressed rules was twofold: i) it reduced the risks and uncertainties involved in decision-making by the private sector; and ii) it would reduce and maybe even eliminate arbitrary decision-making by the ‘untrustworthy’ public sector.
Monetarist economists therefore for a time pursued the enforcement of ‘rules’, in particular rules about what could and could not be done in terms of expanding the country’s money supply, in order to avoid inflation with all its costs. By way of a riposte to the asserted preference for rules, an opposing financial economist named Charles Goodhart formulated one rule (or ‘law’) that did always seem to work, namely that the imposition of any particular rule would ultimately subvert that rule. This would cause people to divert their efforts towards devising clever ways of circumventing the original ‘rule’, thereby negating the opportunity for the rule to work as it was designed to do.

29
Chapter TwoRoles for e-government in financial regulation and monitoring 2United Nations E-Government Survey 2010
When the limitations of the monetarist focus on rules became evident, this left the way clear in principle for exercising the obvious alternative of ‘discretion’ in policy-making, for instance in being more flexible about monetary expansion than the imposition of rules would allow. In an approach favouring discretion, e-government measures and techniques would seem to be ideal.
The most basic point to emphasize is that one cannot make any real progress through e-govern-ment or any other technological ‘fix’ if one begins from a specious set of assumptions about how the world really works, i.e. from the wrong model. The clear inference is that to implement a policy one must first make a serious effort to get the ‘initial conditions’ at least roughly correct or valid.
Systemic riskThe essence of the ongoing financial crisis is that the capability for control lags behind the pace of innovation in the financial sector. Therefore, the complexity of the activity has kept driving it on-wards. For many years, the situation has been one in which the regulatory controls have failed to catch up with, for example, the proliferating mar-kets for derivatives or the new methods for han-dling mortgages. The e-government solution could come into play through a call for greater transpar-ency or greater speed, to allow the government to establish a much firmer and more responsive basis for a decision to intervene (or not) in the opera-tions of a particular bank.
The transparency offered by e-government, how-ever, often runs counter to practices in a highly com-petitive activity such as modern finance. Participants are in practice usually more inclined to maintain their own business secrets, rather than having them out in the open. Several elements have been widely blamed as being inaccurate or too opaque, including the risk evaluations of rating agencies, the creation of structured investment vehicles, and the design of other derivative financial products offered by hedge funds and banks. To the financial product provid-ers, these non-transparent aspects contributed to their competitiveness, and were even encouraged by the government and regulators in the name of risk-sharing. The pursuit of high-profit investment opportunities was backed by massive foreign capital
inflows, and long-term interest rates remained low over the course of nearly a decade – in turn, these factors encouraged financial practitioners to head for profit-taking in spite of risks they did not prop-erly understand. So-called experts were not able to manage the risks effectively and often could not even define and measure the risks explicitly.18
The kinds of risks described above are rooted in financial systems; they are ‘systemic’ in that sense. ‘Systemic risk’ here refers to risks associated with enlarging operations at the level of macro ‘systems’, such as the financial system or the foreign trade system at the national level. ‘Cross-systemic risk’ refers to those linked to any conflict among those substantial components, such as barriers between the financial system and the technological or in-dustrial system.
As regards the source of systemic risk in the global financial sector of recent times, there are a va-riety of viewpoints. Some insider experts insist that the crisis was caused by discontinuities in the finan-cial market. These serious hiccups were based on “the innate human responses that result in swings between euphoria and fear” and were taken as “only a peripheral addendum to business-cycle and finan-cial modeling”.19 This is to claim that low-probabil-ity events caused by the ‘animal spirits’ of human beings, i.e. contexts not portrayed in previous risk-related econometric models of ‘rational expecta-tions’, destroyed these models in practical terms.20 In other words, much like Milton Friedman said of the Great Depression, the systemic collapse was triggered by a chain of accidents.
Other insider experts argue that such systemic risk was essential to the relevant risk-related econo-metric models. However, the developers of these models were unable to inform the public about the risk, or maybe did not take on the ethical responsi-bility to do so.21 Still others argue that the point is not whether the modeller ever informed the public about the systemic risks; rather, they say that the formal mathematical models essentially could not help to understand the complex relational struc-tures and mechanisms involved, because of the inherent analytical biases in those models.22 This position has much in common with the Keynesian views of Eichengreen and Temin regarding the 1930s, cited in section 2.1.1 above.

30
Chapter TwoRoles for e-government in financial regulation and monitoring2 United Nations E-Government Survey 2010
Yet another stance is taken by Peter Gowan,23 who suggests that both modelers and regulators did perceive the systemic risk beforehand, but thought they could control the risk. The required financial technical innovations had been developed and were in place before 2001, before the rise of the housing bubble that led to the ongoing crisis. Therefore, the bubble inflated under the intentional gaze, and in some cases the actual participation, of these mod-elers and regulators – just as had happened with bubbles before.
The rapid decline in the housing and real estate services sectors, the financial services sector, then primary materials and finally secondary industry suggests that the individual sectors are not isolated from each other, nor from even broader, macro-level interactions. This raises the possibility of the dynam-ics of deflation in the style depicted by Kindleberger for the late 1920s and beyond, operating at the cross-systemic level. What this phrase suggests is the asso-ciation – or sometimes collision – between already highly aggregated ‘systems’.
Cross-systemic riskHandling such a situation might sound like a clas-sic application of risk management and contain-ment, but success depends on first knowing how the policies for financial regulation are to be cho-sen. Rather than (insurable) ‘risk’, this would raise issues of genuine ‘uncertainty’ or worse: a lack of knowledge (or true ‘ignorance’) about what the present problems actually are.24 Without going into great detail about either the causes or the course of the ongoing financial crisis,25 it does not seem difficult to aver that the problems rap-idly became systemic, and indeed in our sense cross-systemic.
Thus, as in the United States or Europe in the 1930s or South-East Asia in the late 1990s, the dif-ficulties quickly began to pervade the real as well as monetary facets of globally oriented economies. The loss of faith in first one and then the other recalls Kindleberger’s notion of the (interacting) ‘dynam-ics of deflation’, and worked like a pair of pincers by greatly exacerbating systemic risk and uncertainty.
So what could e-government improvements have done about ‘systemic risk’? Or what might they do in any future re-run of this scenario? The
answer depends a lot on how much emphasis one places on social psychology, and on such beliefs in the vagaries of human nature as ‘herd mentality’. Using the Internet allows incorrect information as well as correct information to be circulated more rapidly; so how is any recipient in a position to ar-bitrate between seeing a particular item of infor-mation as correct or incorrect, especially when in reality the alternatives are likely to be much greater in number and much grayer in contrasting tones (i.e. offering less stark situations than choosing be-tween black and white)?
Raising awareness that there is a problem can be half the struggle, though unfortunately not many governments are brave enough to do this when it matters most, namely at the outset. Clearly much will depend on the citizens’ faith in the gov-ernmental office or officers concerned.
The ‘shadow banking system’The scale of the non-bank financial system (the ‘shadow banking system’) had been growing very rapidly before the crisis set in. According to Timothy F. Geithner,26 the aggregate size of shadow banking, including the structured invest-ment vehicles, auction-rate preferred securities, tender option bonds and variable-rate demand notes, along with assets financed overnight in tri-party repos (repurchasing agreements) and hedge funds, was approaching the asset levels of the tra-ditional deposit banking system by early 2007.27
The neglect of regulation of the shadow bank-ing system was a key factor underlying the finan-cial crisis, as noted by Geithner and Krugman. The shadow banking system had not been regulated nearly as strictly as the depository banking system, especially in terms of capital reserves and liquidity. This allowed the shadow system a remarkable de-gree of leverage on its capital, mainly via borrowing from the short-term, highly liquid money market, to speculate in long-term, less liquid markets.
From the mid-1980s on, few efforts were made to extend regulation to the growing shadow bank-ing system. On the contrary, moves were made in the opposite direction. Before the crisis, even regu-lators had no idea as to approximately how much capital had been engaged in such a system, and also had no clear mastery of the practical process

31
Chapter TwoRoles for e-government in financial regulation and monitoring 2United Nations E-Government Survey 2010
of transactions. In the words of the director of regulation at Spain’s central bank, structured in-vestment vehicles and conduits were “like banks but without capital or supervision”.28 Without ef-fective regulation, the increasingly complex struc-tures of derivatives as financial products promoted resource allocation (for speculation), while becom-ing, in Warren Buffett’s words, “financial weapons of mass destruction”.29
In the continuing absence of the kinds of fun-damental reforms that must be carried out, it can be predicted with a high degree of confidence that introducing or developing e-government practices will remain largely irrelevant. As it is, too large a proportion of financial speculation activity nowa-days still takes place below the radar of regulation. On the other hand, this lacuna offers great pros-pects for e-government once the gap in regulation is successfully overcome. At that stage, e-govern-ment can fully come into play, both to aid in the implementation of the regulatory code itself, and to monitor its consequences.
2.2.2 Roles for e-government in financial monitoring Effective communication should be regarded as the foundation of measures to allow the financial services sector to recover, especially in light of the complexity in breadth and depth of the issues in-volved. The transparency of the financial engineer-ing is important for regulators trying to build up a robust supervision system. Information disclosure is also critical to restore the confidence of the en-tire market, and to maintain long-term rationality in customer attitudes towards the market after the crisis has abated.
E-government can add agility and flexibil-ity in real-time responsiveness to events that will inevitably arise, and this is important in light of calls for more dynamic regulation. As the CEO of Goldman Sachs said in a recent speech:
“Capital, credit and underwriting standards should be subject to more ‘ dynamic regulation’. Regulators should consider the regulatory inputs and outputs needed to ensure a regime that is nimble and strong enough to identify and appro-priately constrain market excesses, particularly in a sustained period of economic growth.” 30
Financial activities will be reformed in a number of countries, as is currently being em-phasized by global leaders. The focus for reform is stricter regulation of shadow banking systems, and correspondingly the securitized derivative fi-nancial products. In July 2009, for example, the incoming Obama administration proposed leg-islation to require hedge-fund managers, as well as managers of private equity funds and venture capital funds, to register with the Securities and Exchange Commission.31 However, in an ever-changing and for the most part advancing world, it would seem unlikely that the regulation of the financial sector would be pulled back to the situ-ation that existed before the mid-1980s, which would imply sharp declines in, say, speculation via securitization and/or hedge funds. Rather, governments and regulators will try to promote the effectiveness and efficiency of monitoring. This means that the targets of reform should be at least twofold, involving promoting the safety of derivative financial activity, and minimizing the depressive effects brought about by the reform of financial innovations.
The critical point of reform is not to discour-age financial innovation, but to require informa-tion transparency, and enhanced supervisory capabilities on the part of regulators. Currently, a series of reforms is likely to be carried out, as has been observed by regulators around the world over the past few months. E-government can provide effective tools for these reforms as a platform to buttress communication among different actors from the government, industries and the public.
In addition, to promote regulation, some responsibilities attributed to particular regula-tory agents would be strengthened. Some gov-ernment entities, including the United States Department of the Treasury, propose that this kind of regulation could be carried out partly through representation by professional depart-ments and agencies. However, this has to be balanced against the likely augmentation of relevant regulatory bodies. In a context of ‘lean regulation’ or in Obama’s terminology ‘smart regulation’, accelerating the ICT foundation of regulation to promote information transparency
E-government can add agility and flexibility in real-time responsiveness to events that will inevitably arise, and this is important in light of calls for more dynamic regulation.

32
Chapter TwoRoles for e-government in financial regulation and monitoring2 United Nations E-Government Survey 2010
and process supervision would appear to be a good way forward. In constructing an e-gov-ernment system, it is also helpful to build up the capacity for systematic analysis by the unit responsible for supervision in the country con-cerned, so that it can respond to the ebbs and f lows and general processes of the crisis. A case in point is the Capital Markets Safety Board re-cently proposed by Andrew Lo,32 which would appear to be a more f lexible and comprehensive way of coping with the rapid and progressive dy-namic evolution of the financial sector.
To collect informationE-government can provide information tools for regulators to develop and then implement regu-lations related to the shadow banking system. Reform of the shadow banking system should aim to put the system back on the radar screen of regulators. Most requirements to the deposit banks would be transplanted to the shadow banking sys-tem, such as the requirement of adequate capital reserves, liquidity, and so on.
Regulators need to uncover more informa-tion compared with what has to be supplied under the existing regulations. The activities of banking are highly connected, and their trans-actions, as previously emphasized, do not hap-pen in traditional ways, i.e. in regulated venues and via transparent counterparties. Therefore, new categories of information should be ex-plored and collected to support the analysis of the regulators, as is broadly recognized by industrial practitioners and regulators. For ex-ample, Verena Ross of the United Kingdom’s Financial Services Authority, says that more re-sources should be devoted to the supervision of high-impact firms, and more focus ought to fall on the details of bank accounting.33 Generally speaking, data may need to be revealed to the regulators regarding the shadow banking sys-tem’s leverage, liquidity, correlation, concentra-tion, sensitivities and connectedness.
Mass information should be explored and ana-lyzed by regulators, as it is rapidly increasing in terms of both depth and breadth. E-government is a suitable method for regulators to carry out the data collection.
To undertake process supervisionConsidering the complexity of the financial sec-tor at present, static data at a particular point of time are not sufficient to master the dynamics of the transactions. To avoid another credit crisis, regulators should address the financial engineer-ing process of derivative product designs. In other words, the requirement of transparency should cover credit rating, product package modeling, pricing among counterparties, and so on. If regu-lators can obtain such data, this would enhance the competency levels of the regulators.
In fact, the proposed reforms aim to build a capillary network of information to cover the financial sector both in depth and in breadth. Only an ICT-based network can achieve such a target. It requires not only the construction of ICT infrastructure, but also the building of new institutional arrangements. New compulsory regulation procedures could be closely connected to an ICT network.
To improve the timeliness of regulationE-government is important if regulators are to ef-fect timely supervision. In comparison with tra-ditional bank activities, those needed to regulate derivative activities have special characteristics, especially those developed for over-the-counter markets (OTC derivatives). These transactions could occur without standard contracts, and with-out transparent and regulated venues and counter-parties.34 These features allow the current shadow banking system greater flexibility to adjust to the dynamics of targeted industries and price fluctua-tions. The transactions can be carried out flexibly with respect to both time and place (of course, before the crisis, many activities were even held offshore). This flexibility is an important source of the competitiveness of the shadow banking sys-tem led by United States and United Kingdom. For the regulators, however, it becomes very dif-ficult to master the complexity of the financial engineering process.
Timely monitoring is critical. Only a digital regulatory network can work compatibly with the automated data feeds of regulation. Through a Web 2.0 framework and the Internet accounts of these financial institutions, data on the transactions
33
Chapter TwoRoles for e-government in financial regulation and monitoring 2United Nations E-Government Survey 2010
could be collected automatically by the timely input of financial practitioners, for analysis and supervision by the regulators.
To prevent periodic bubblesThe ultimate solution is to prevent economic bubbles from forming in the first place – a conclusion drawn by reconsidering the economic bubbles and bursts in recent decades, when the leading countries were implementing aggressive monetarist policies. An eco-nomic wave is usually the outcome of an interaction between technological and industrial changes and fi-nancial investment.35 It reflects the natural reaction of human beings, with their capital and limited ratio-nality, to pursue potentially highly profitable oppor-tunities. However, according to events witnessed in the past few decades, some of the bubbles came about in the context of overheated ‘exuberance’, with the blind following the blind, and neglect on the part of analysts and regulators. Therefore, as a counterpart institutional arrangement, governmental interven-tion should have the capability to influence the for-mation of such bubbles more directly and effectively if need be. In fact, the existing e-government meth-ods do have the potential to influence the financial markets, as is demonstrated in a case study in Russia by Melvin et al.36
The intervention of government should be as-sociated with a coherent structure of regulation towards all components of the financial system, as well as an effective communication system with the public, namely the common investors. A potential system needs to be explored via e-government. The question is how to express the information sup-plied to and from the regulators clearly and directly in the market, and how to build a bridge for such information and the market feedback to reach the public, while also stressing minimum disturbance to the operation of the market.
Common standards are required to realize ef-fective information communication via e-govern-ment. Common standards of data collecting and processing are needed for the different agencies, namely those in different places and those in charge of different professional tasks. Only with such co-hesive cooperation can regulators build up an in-tegrated capability to cope with the systemic risks of the increasingly more complex financial sector.
2.3 Confidence, capabilities and competencies
2.3.1 Panics and restoring confidencePanics among common investors and even among financial managers and institutional investors are not difficult to understand as being a natural human response to the downturn of the bubble economy, as happened during 1930-1933, 1997-1998 and 2000-2001. Unlike in the past, however, the recent panics also arose from people’s inability to handle the complexity of financial products and markets. As already seen, the securitized derivative products of recent times had actually broken down any effective information channel between bor-rowers and lenders. People felt fearful in the face of downhill potentials they did not know well and evidently were not able to measure. Through these means, the panics were more likely to be the con-sequence than the cause of the industrial structure and the absence of effective regulation.
The crowded nature of the financial markets also contributed to the panics because when a downturn signal was identified, people knew that it was im-possible for everyone to get out at once.37 The panic among financial practitioners and investors resulted in a herd-like crowding into a flight-to-quality in asset holdings. For the highly connected financial sector, the fear quickly spread to other parts of the industry. Finally, the highly leveraged derivative products be-came a ‘death spiral’ confronting their investors, and the whole financial system collapsed. The supposedly super-safe, super-senior derivative products, such as collateralized debt obligations, rapidly tumbled to the level of becoming junk securities.
There are lessons here for the operation of mar-kets. Thus the head of Goldman Sachs has implic-itly argued for what are frequently referred to as ‘organized markets’:
“To increase overall transparency and help ensure that book value really means book value, regulators should require that all assets across fi-nancial institutions be similarly valued. Fair value accounting gives investors more clarity with respect to balance sheet risk. How can one justify that the same instruments or risks are priced differently be-cause they reside in different parts of the balance sheet within the same institution?
E-government offers financial transparency and the improvement of citizens’ capabilities in risk assessment and risk control – these are the twin keys to promoting market confidence and public trust.
34
Chapter TwoRoles for e-government in financial regulation and monitoring2 United Nations E-Government Survey 2010
“But, if we abandon, as opposed to regulate, market mechanisms created decades ago, like secu-ritization and credit default swaps, we may end up constraining access to capital and the efficient hedg-ing and distribution of risk, when we ultimately do come through this crisis.”38
This authority draws the conclusion that mar-kets cannot thrive without confidence:
“We have to safeguard the value of risk capi-tal … while enhancing investor confidence through meaning ful transparency, effective oversight and strong governance. But, there should be no doubt: markets simply cannot thrive without confidence.” 39 E-government offers information transparency
of the financial system and the improvement of cit-izens’ capabilities in risk assessment and risk con-trol – these are the twin keys to promoting market confidence and public trust, which are regarded as critical for restoring a robust financial sector.
2.3.2 Shortcomings in skills and abilitiesThe more irrational social desires cannot be elimi-nated by the effective communication or informa-tion transparency brought about by e-government, yet the goal of pursuing better lives is a worthy one. Indeed, this goal is the basic motivation for con-tinuing economic development. To what extent do social desires for improvement conflict with social capabilities40 to bring about a self-sustaining devel-opment process? To resolve this and similar issues in regard to implementing e-government, we need to dig deeper into the nature of ‘capabilities’ – a subject that existing studies normally take for granted.
To exchange knowledge and change in real timeNo amount of purely technical inputs into e-govern-ment will work in the absence of the skills (compe-tencies and capabilities) needed to supply, produce and use equipment and technological inputs. In contrast with much of the management literature, which tends to use these terms interchangeably, we are here sharply differentiating – at least in theory – the nature of ‘capabilities’ from that of ‘competences’ or ‘competencies’.41 If the problem is one of incom-petence, the individuals who might be blamed for the financial crisis fell short of the minimum actions required by the circumstances, notwithstanding
their apparent qualifications to do the job at hand, as reflected in résumés and other standard measures of ‘human capital’. If, on the other hand, the problem is one of incapability, then other factors, including many that would lie outside the individuals’ power to do much about, could be held to account for much of the current crisis.
Seminal studies by Wesley Cohen and Daniel Levinthal have explored the development of ‘ab-sorptive capacity’, i.e. the ability of a firm or other organization to master and utilize technologies taken from others. They argue that it rests to a con-siderable degree on trying to replicate the findings of earlier research and development efforts by those others,42 partly because of the gamut of difficulties that are likely to arise by simply copying ideas pre-viously developed elsewhere. In a later paper, these authors argued that “such a capability [‘absorptive capacity’] not only enables a firm to exploit new ex-tramural knowledge, but to predict more accurately the nature of future technological advances.”43
Two kinds of capabilities are of special concern to the development of e-government specifically and indeed to production practices in all walks of life. One type refers to ‘interactive capabilities’, and in-volves knowledge exchange with other entities. This knowledge exchange may take place along a supply chain (a company is likely to be involved in many of these44); with corporate or non-corporate organiza-tions in research, finance and marketing, etc.; and with transnational organizations and corporations in other countries (‘international technology transfer’ or interchange). A second type of capability concerns the now-popular phrase ‘dynamic capabilities’, implying the ability to change one’s capability base in ‘real time’, i.e. within a time period that is appropriate for dealing with pressing competition (explicit or implicit) that may be arising on a number of fronts at roughly the same time. Dealing successfully with such ‘dynamic competition’45 will normally involve having adapt-able, flexible and communicable resources in the sys-tem.46 It is worth bearing in mind that all that has just been said about the capabilities and competencies of firms applies equally to non-profit organizations such as state universities or governments.47
This is where e-government comes back to cen-ter stage. It is the mixture of flexibility and agility with transparency, integrity and efficiency that is

35
Chapter TwoRoles for e-government in financial regulation and monitoring 2United Nations E-Government Survey 2010
the key to ‘success’ in this arena, but all of these elements involve good people capable of working on good equipment. While in the financial indus-try certain actors are being blamed for the financial crisis, it is predicted that e-government and asso-ciated e-technologies might curtail such negative outcomes in the future.
Specific failings in the broader systemAs it stands, the specific problems can be summa-rized as follows:
1) The rating agents and their inaccurate credit ratings on mortgages created the bubble in the hous-ing market. This whole area of more or less collec-tive blunder has been blamed on many factors. Some question the agents’ underlying business model and argue that the implicit conflicts with practice inclined them to give unduly high ratings. Lo48 discloses the continual ‘brain-drain’ from the rat-ing agencies to their clients, namely the banks and shadow banks, which usually benefited the rating agencies in the short run but over the medium term deprived them of sufficient talent to deal with the complex situation that they were now confronting.
2) Regarding the oversights in relation to the shadow banking system (see section 2.2.1 above), one of the key questions relates to enhancing the competencies and capabilities of the regulators. In terms of their capabilities, regulators must have sufficient methods and means to identify and su-pervise the growing number and coverage of inno-vative financial activities, in terms of competencies, and display better understanding of the world they are facing, including the realm of shadow banking. Otherwise Goodhart’s Law will prevail, such that the imposition of any rule will ultimately under-mine the effectiveness of that rule.
3) The financial sector, given its scale and scope, lacks qualified human resources. For example, in 2007 the Massachusetts Institute of Technology produced only four PhD graduates in finance, com-pared with 337 in various fields of engineering. To make up for the shortages of expertise in advanced mathematics and modelling, many financial institu-tions recruited employees from technically sophis-ticated disciplines, such as physics, mathematics, computer sciences and astronomy to work as tech-nical supporting forces. However, these employees
were not essentially financially educated, and had only limited ability to respond to the sophisticated dynamic market evolution. This led to weaknesses in risk assessment, risk management and control.
4) Financial model developers did not inform the public about the systemic risks. Colander et al.49 argue that systemic risk did exist, and the financial model developers, namely the financial economists and financial engineers, did not inform the financial sector in general, much less the pub-lic at large. Lawson and recently Hodgson50 insist that the fundamental problem is not whether the modelers had ever been informed; it was that the pre-selected mathematical models could not inter-pret the complex, highly interconnected and dy-namically evolving economic practices. The former interpretation relates to cases involving ‘asymme-tries of information’ and thus competencies, while Lawson’s position has much more in common with what we refer to as ‘asymmetries of knowledge’, and therefore with (inadequate) capabilities.51
5) The integrity of managers in the financial sector was called into question, for example over their compensation and ‘bonuses’, which struck many of the more moderate public observers (in-cluding the Governor of the Bank of England52) as immodest in scale and positively harmful in terms of the incentives on offer. The incentives actually appeared to negate the clear need to enhance risk accounting, as well as the need to reform the regu-latory requirements on corporate governance to make sure that risk management was effectively deployed in the financial sector. Meanwhile, trans-parency of information is also needed for regula-tors to identify their transactions properly.
6) The securitized derivative financial products were so sophisticated that they disrupted effective information connections between borrowers and lenders. The derivatives products were in theory designed to disperse risk. Regulators such as the United States Department of the Treasury admit53 that the very process of securitization created con-flicts of interest; it did so by breaking down the traditional relationships between borrowers and lenders, which market discipline failed to correct. As previously mentioned, even many financial manag-ers did not fully understand the products they trans-acted, to say nothing of the common investors, who

36
Chapter TwoRoles for e-government in financial regulation and monitoring2 United Nations E-Government Survey 2010
were at the mercy of rating agencies that often failed to describe the risks of relevant products accurately. Originally, the motive behind bundling derivative financial products was to disperse risks. However, over the past 20 years these products gradually be-came extremely risky, especially after 1999, when they became more or less totally opaque to buyers. In fact, they became a major source of contagion.
2.3.3 A platform to reconsider public expectations E-government can aid in providing a platform for the public to reconsider their expectations. In the finan-cial system as it was, the ‘animal spirits’ of people at large were also included among the factors involved in the making of the bubble. This came to be asso-ciated in the public mind with the political desires and vanities of politicians, in spite of the increasingly huge trade deficit that underlay a comparatively slow or stagnant growth of productivity. The rapid expan-sion of the housing sector was achieved by the mas-sive participation of citizens, while the governmental solution to advocate and support such desires was also to create structured investment vehicles such as Fannie Mae and Freddie Mac (which provided “creative accounting”54 for the domestic housing in-dustry in the United States). The inappropriately fast and continuous expansion of desires finally contrib-uted to the primary determinant of this crisis, even though it is technically termed systemic risk.
The ongoing crisis provides its citizens and opinion leaders with a chance to re-think the es-sential problems of social, political and economic life. E-government, with the transparent data, analysis and interaction it can exhibit, can pro-vide a valid instrument for individuals to connect themselves with practical macro analysis, which might help to promote an understanding of the internal conflicts in society.
2.4 international cooperation and e-government
2.4.1 Problems from a global perspective With financial markets integrated worldwide, the crisis inevitably went global, as the United Kingdom’s Verena Ross asserts:
“The current crisis has been truly global in its nature and has highlighted significant shortcom-ings in the international regulatory framework. Growing risks were not properly identified and monitored, standard-setting bodies varied in their effectiveness and cross-border crisis management arrangements did not work well.”55
Global architecture A paper from the International Monetary Fund acknowledges that the present financial crisis “has revealed important flaws in the current global ar-chitecture” and specifically identifies four areas where the “existing architecture failed to respond adequately as growing vulnerabilities eventually produced a crisis.”56 Of these areas, two are related to systemic risk, namely across-the-board finan-cial regulation and the international coordination of macro-prudential responses to such risk. The other two areas noted by the IMF are the need for cross-border coordination and arrangements for financial regulation “to avoid a repetition of the ‘go-it-alone’ strategies seen in this crisis”, and the need for additional IMF-style funding.
In the ongoing crisis, a global perspective is crucial for understanding the transmission, over-all dimensions and causes of the crisis, which had deep roots in imbalances in international trade and capital flows and the disparity of regulation across countries. There is an element of chaos theory operating across international frontiers, in which something as small as the flutter of a butterfly’s wing in China might affect the weather in New York City. The part of the butterfly was played by an Austrian bank in 1931 (the Creditanstalt), by property-price inflation in Bangkok in 1997, and by Icelandic banks in 2007/8. The lessons learned so slowly and painfully in the mid-1930s about the necessity for international cooperation at the high-est levels (“hang together lest we hang separately”) were then forgotten until recently, when economic crises again became painfully evident.
The international level of the crisis can be seen in the flows of credits from one part of the world to another. This flood of credit was supported by low long-term interest rates, which were in turn supported by enormous growth in the amount of foreign capital flows. These massive foreign capital

37
Chapter TwoRoles for e-government in financial regulation and monitoring 2United Nations E-Government Survey 2010
inflows were linked to imbalances in international trade, significant global macroeconomic misalign-ments over the last decade, and in particular the build-up of large current account surpluses in Asian and oil exporting countries. Meanwhile, there were growing current account deficits in the United States as well as in the United Kingdom and other European countries. Thus foreign exchange surpluses were accumulated by China, other East Asian countries and countries exporting oil in large volumes.57 Much of this money went back to the major countries such as the United States and the United Kingdom through investing in a large capital pool, or buying up substantial portions of the national debts. This provided support for their levels of ‘over-consumption’ based on credit and for the prosperity of asset-backed trading and other se-curities, both directly as well as indirectly (via the domestic credit-fueled booms).
In principle, the international situation has e-government in its solution – yet e-government is usually national in nature. Most e-government schemes up to the present day, other than those launched by supranational or international bodies, start from a national and sometimes rather nation-alistic perspective, with corresponding sets of po-litical and policy assumptions. These assumptions may not square with the need for international tact and discretion, much less training programmes. Lloyd Blankfein of Goldman Sachs notes the need for supervision at the global level and what it would require to be effective:
“As recognized at the recent G20 Summit, the level of global supervisory coordination and com-munication should reflect the global interconnect-edness of markets. Regulators should implement more robust information sharing and harmonized disclosure, coupled with a more systemic, effective reporting regime for institutions and major mar-ket participants. Without these, regulators will lack essential tools to help them understand levels of systemic vulnerability in the banking sector and in financial markets more broadly.”58
Regulating offshore fundsRegulators are presented with a critical difficulty in the case of offshore transactions, and especially those linked with the shadow banking system.
Most activities of this kind do not have transpar-ent, regulated venues and counterparties for their transactions.
About half of all hedge funds in existence in 2008 were registered offshore, accord-ing to estimates. Tax havens were the most popular location for the offshore hedge funds. Offshore havens were located in places such as Bahrain, Bermuda, British Virgin Islands, Cayman Islands, Ireland, Luxembourg and the Netherlands Antilles. Onshore havens were lo-cated in the United Kingdom and United States. Registering in tax havens freed the hedge funds from paying tax on the increase in the value of their portfolios. More importantly, the host countries of the offshore hedge funds built up accommodating jurisdictions, which on the one hand attracted the relocation and residency of relevant pools of capital, and on the other hand freed the hedge funds from ‘annoying’ regula-tory interference. Policing such offshore opera-tions was not impossible, but was considerably more difficult. Moreover, for a long time the general consensus, at least in the United States, was that there was no need for such policing.59 This exacerbated disparities in regulation, and added to the difficulties of regulators trying to identify the prices, values and processes of the shadow banking system.
International coordination or greater national powers?Potential room for misalignment between national and global regulatory policy was paralleled by po-tential room for misalignment in e-government principles and practices. Take, for example, the Icelandic banks operating in the United Kingdom. As Ross points out in relation to the gap in regula-tory power:
“Landsbanki was free to operate in the UK as a branch over which the FSA [Financial Services Authority] only had limited powers, as responsibility for its prudential supervision rested with the Icelandic regulator. UK deposi-tors were also later dependent on the Icelandic deposit insurance scheme, with resources that proved inadequate and requiring the interven-tion of the UK authorities.”60
The complex international situation has e-government in its solution – yet e-government is usually national in nature with a corresponding potential for misalignment of e-government principles and practices.

38
Chapter TwoRoles for e-government in financial regulation and monitoring2 United Nations E-Government Survey 2010
The ‘options’ seemed to consist of strength-ening internal controls on the national front vs. greater external coordination on the suprana-tional (European) front. The Financial Services Authority could see the benefits of pursuing both at the same time, without dwelling too much on the costs side of that particular ledger. This is what political scientists tend to refer to as ‘multi-level governance’,61 in which spatial hierarchies domi-nate political decision-making, and from time to time find their ‘solutions’ in setting up top-heavy bureaucratic nightmares.
To manage such contexts satisfactorily, and to avoid their worst excesses, e-government be-comes essential. It is not merely an elegant ac-cessory but an indispensable tool when one is even considering such a complex system (or ‘sys-tem of systems’). Whether the ground-rules for
effective e-government can hold is open to debate. Desiderata such as transparency and integrity may prevail to greater or lesser extents. But any deroga-tion of decision-making duties to ICT networks must at the same time be sustained by the very di-versity of the e-government structures which they would already have helped to create.
It seems unlikely that powerful new inter-national agents will be set up to establish inter-national e-government that is transparent and satisfies international needs. Citizens and nations ought to enhance the potential for information-sharing and harmonized disclosure offered by e-government, based on existing international platforms such as The Group of Twenty Finance Ministers and Central Bank Governors, IMF, Organisation for Economic Co-operation and Development, and United Nations.
2.4.2 Common standards for better regulationRegulators have come to realize that common accounting principles and regulation standards should be implemented in countries where finan-cial activities, such as those based on securitized derivative products, have developed Internet-based connectivity far beyond the country’s bor-ders. There is, however, the additional need for these electronic networks to be inter-connectable, which is what makes information-sharing practi-cal. For this purpose, cross-national coordination is needed during the process of building or reform-ing e-government in such countries. Effective in-ternational cooperation depends on common standards for data collecting and processing, common or interoperable software platforms and high-speed communications. These elements are crucial. The most critical need is for mutual un-derstanding, which would permit the countries to share data and analysis in real time, and to achieve coordinated action. Perhaps this could be imple-mented firstly in international alliances, such as the European Union, OECD, North American Free Trade Agreement, and United Nations Conference on Trade and Development.
In fact, in the economic stimulus packages of different countries, large amounts have been invested in the infrastructure category, which
Box 2.1 Reports on the Observance of Standards and Codes agreed by the IMF and World Bank, November 2002
Transparency standards
Thestandards intheseareasweredevelopedandareassessedbytheInternationalMonetaryFundtocoverissuesofdataandpolicytransparency:
• Datatransparency:IMF’sSpecialDataDisseminationStandard/GeneralDataDisseminationSystem
• Fiscaltransparency:IMF’sCodeofGoodPracticesonFiscalTransparency
• Monetaryandfinancialpolicytransparency:IMF’sCodeofGoodPracticesonTransparencyinMon-etaryandFinancialPolicies,whichisusuallyassessedbytheFundandtheWorl
Financial sector standards
Thestandards intheseareasweredevelopedbyother institutionsandaregenerallyassessedundertheFSAP:
• Bankingsupervision:BaselCommittee’sCorePrinciplesforEffectiveBankingSupervision
• Securities:InternationalOrganizationofSecuritiesCommissions’(IOSCO)ObjectivesandPrinciplesforSecuritiesRegulation
• Insurance:InternationalAssociationofInsuranceSupervisors’InsuranceSupervisoryPrinciples
• Payments and securities settlement systems: Committee on Payments and Settlements Systems(CPSS) Core Principles for Systemically Important Payments Systems and CPSS-IOSCO JointTaskForce’sRecommendationsforSecuritiesSettlementSystems
• Anti-money laundering and combating the financing of terrorism: FinancialActionTask Force40+8Recommendations
Standards concerned with market integrity
StandardsintheseareashavebeendevelopedbyrelevantinstitutionsandtheWorldBankisintheleadinundertakingassessments.SomeoftheseareasmaybeassessedundertheFSAP.
• Corporategovernance:OECD’sPrinciplesofCorporateGovernance
• Accounting:InternationalAccountingStandardsBoard’sInternationalAccountingStandards
• Auditing:InternationalFederationofAccountants’InternationalStandardsonAuditing
• Insolvencyandcreditorrights

39
Chapter TwoRoles for e-government in financial regulation and monitoring 2United Nations E-Government Survey 2010
includes the investment in ICT infrastructure.62 This could provide an opportunity to appeal to member countries of these international entities to build up harmonized software platforms and coordinated institutions. But at more or less the same time as the East Asian economies – inspired by China in this respect – have begun to embrace the concept of harmony,63 western nations have re-jected harmonization, in the EU’s case in favour of ‘open methods of coordination’, i.e. the primacy of national over supranational systems.
Standards and codes After the Asian financial crisis of the 1990s, the IMF prepared a set of recommended Standards and Codes that remain relevant to e-government. Countries subject to reporting to the IMF and World Bank would be required to prepare Reports on the Observance of Standards and Codes, as ex-plained in a statement made when the recommen-dations were published:
“The IMF and World Bank have endorsed internationally recognized standards and codes in 12 areas as important for their work and for which Reports on the Observance of Standards and Codes (ROSCs) are prepared. Standards in the areas of data, fiscal transparency, and monetary and finan-cial policy transparency have been developed by the Fund while others have been developed by other standard setting bodies including the World Bank, the Basel Committee on Banking Supervision, and the Financial Action Task Force (FATF).
“ROSCs are prepared and published at the re-quest of the member country by the IMF and/or World Bank in each of the 12 areas. ROSCs covering financial sector standards are usually prepared in the context of the Financial Sector Assessment Program. In some cases, detailed assessments of countries’ obser-vance of standards are also published.”64
The IMF and World Bank published their list of ROSCs in November 2002. The areas addressed in this list could also serve as set of principles to guide countries as they seek to use e-government.
2.4.3 The financial crisis and developing countriesDeveloping countries face the challenge of ‘catch-ing-up’ to developed countries when it comes to
investing in e-government. On the one side are the cyber-optimists (to re-use Norris’s helpful phrase), who speak in terms of ‘leapfrogging’ and even overtaking the more advanced industrial coun-tries. Being unencumbered with the ‘penalty of an early start’,65 in the form here of large fixed landline communication systems and networks, developing nations are supposedly free to invest in cheaper and much more flexible mobile systems. On the other side again lie the cyber-pessimists, who envisage these high-tech activities as almost inevitably being dominated by the advanced industrial countries.
To be sure, a number of the larger developing countries, led by the so-called BRIC countries (Brazil, Russia, India and China), have public sec-tors that are large enough to keep some of the alleged depredations of multinational companies at bay, but most of them do not fall into this category. In the meantime, the countries best equipped in terms of e-skills (both competencies and capabilities as in section 2.3.2 above) are likely to wrest away most of the gains which, in their view, would belong to the knowledge-rich, earlier-industrializing countries. In the end, the predictions of the pessimists may turn out to fit reality better. But at the same time, e-government opportunities are within the grasp of each developing country itself – not simply in the hands of over-powerful foreigners.
One reason for this positive conclusion is that a fairly small country or region may have a com-parative advantage if it has relatively stable existing social networks lodged within a communicative social structure. This may explain the good overall position of e-government development of countries such as Estonia and New Zealand.66 The growing accentuation of a positive role for public procure-ment in policy-making is another point that can favour a small- to medium-sized developing coun-try, so long as it maintains a clear vision of what it stands for, as in the Republic of Korea’s approach to high-speed broadband.67
The concerns of developing countries in respect to e-government lie less in any natural barriers to the diffusion of e-government and more on the side of human resources and their disposition, i.e. their ‘capabilities’ in policy-making, technology and con-sumption, as per a study by Guida and Crow. Their main points are quoted in the following page:
40
Chapter TwoRoles for e-government in financial regulation and monitoring2 United Nations E-Government Survey 2010
• From a practitioner’s perspective, the most chal-lenging issues in the implementation of technol-ogy-dependent government services derive from the governance aspects of the initiatives;
• For governments in the developing world, the most important benefits of adopting a standards-based architecture lie in the area of procurement of applications and application-based services;
• Mobile phones, in providing affordable broad-band network access, can offer a valuable means of delivering e-government services;
• There is high risk associated with e-government investments, and though the rewards are poten-tially substantial they may be hard to quantify;
• Capacity-building and formal change manage-ment strategies are essential if e-government programmes are to be effective.68
The above factors range quite broadly over the terrain covered in this chapter, including references to governance, standards, risk and capabilities, as well as to technology. It is time to draw some con-clusions from our study.
2.5 ConclusionsE-government clearly has a potential role in allevi-ating the worst symptoms of the ongoing financial crisis. The benefits in comparison with the costs are likely to rise over time, as a consequence of two mutually reinforcing trends: the improvement in e-government systems themselves, including more widespread access, faster operating and transmis-sion speeds, and the increasing capabilities – and willingness – of the public to make use of the tech-nologies involved.
At the same time, it is all too easy to fall into the trap of advocating little more than a technological ‘fix’ for the problems that have arisen. Certainly, such ‘fixes’ by themselves will not work. Potential roadblocks include inadequate competencies (e.g. hemorrhaging of talent, poor models) and limited capabilities (e.g. lack of exercise of good judgment). Technology alone will not cure these deficiencies, even if it becomes more user-friendly, and fault-tolerant. It remains a challenge for e-government to attempt to make processes more transparent as well as more accurate. An example of this would be in formulating credit ratings.
The main point to emerge from recent history is much the same as for the Great Depression: no amount of good practice by e-government or other means can withstand the consequences of beginning with a false set of assumptions.69 Included among these faulty assumptions must be the notion that freedom from regulation is the solution. Another misleading assumption is that the solution lies in only allowing self-regulation, which has its limits:
“For policymakers and regulators, it should be clear that self-regulation has its limits. At the very least, fixing a system-wide problem, elevating stan-dards or driving the industry to a collective response requires effective central regulation and the conven-ing power of regulators.”70
That is, in the words of the CEO of Goldman Sachs, allowing the financial world to monitor and regulate itself would be a measure based on the er-roneous idea that the effects of systemic and espe-cially cross-systemic risks can be safely overlooked.
Coping with financial panics requires immedi-ately addressing the first signals of the crisis. This calls for what we can describe in this summary as ‘dynamic interactive capabilities’, so as to achieve a robust financial system and effective regulation. It may be recalled that ‘dynamic’ refers to real-time responses, which probably require a set of relevant and effective system-oriented competencies to be already present and at hand. The term ‘interac-tive’ refers to functioning two-way interchanges already in place in the financial system and around its edges. Both the dynamism and the interac-tivity could in theory be augmented by new ap-proaches based on high-speed technologies, such as e-government. These possibilities can be drawn on for solving some of the longer-term negative fallouts from the crisis, especially through using e-technologies.
All stakeholders admit that there were consid-erations beyond the previous economic models and regulatory systems that destroyed the stable pattern of development preceding the global financial cri-sis. In the past 20 years, human response in periods of fear ought to be included in these models and mind-sets, as they are at least equally important as those of the “euphoria” noted by Alan Greenspan, former Chairman of the United States Federal Reserve. But this view is not widely welcomed by
If e-government technology is correctly deployed and suitable governance systems are in place, one may end up with the happy situation of both more government capacity to intervene when needed and more freedom for markets to function as they ought to in due course.

41
Chapter TwoRoles for e-government in financial regulation and monitoring 2United Nations E-Government Survey 2010
the public which, on the contrary, is more inclined towards the comment from Krugman71 that sys-temic risks come from neglect on the part of regu-lators. Therefore, it would seem reasonable that critics and the general public question the ethical responsibilities of the model developers, and pos-sibly the regulators as well.
E-government provides the public with an op-portunity to have their views expressed. Whether governments take notice may be another matter, but they will have their ‘wriggle-room’ drasti-cally reduced, as a result of the associated in-crease in transparency and democratization. If the technology is correctly deployed and suitable governance systems are in place, it still may be possible end up with the happy situation of both more government intervention for a while but more freedom for markets – admittedly ‘orga-nized markets’ – to function as they ought to in due course. Thus paradoxically, in this scenario, more government discretion in the short run may lead to less arbitrary forms of government dis-cretionary power over the longer haul. There are any number of precedents for such an optimistic outcome to be realized, yet innate pessimists will match this story of an upward-pointing virtuous circle or spiral by citing possibilities of downward vicious circles.
What then of the balance between cyber-op-timism and cyber-pessimism? For the last words on this, consider the conclusion of the Economist Intelligence Unit, which had this to say in 2009 on the subject of e-government development:
In rich and poor countries alike, however, thorny policy issues arising from the very success of digital de-velopment remain largely unresolved… The delicate
social contract between digital consumers and the op-erators of digital channels will be tested in the coming years, as intensified revenue pressure increases service providers’ need to utilise the Internet for intrusions that are both annoying (for example, inbound ad-vertising) and potentially privacy-infringing (‘ deep-packet’ inspection systems).
The environmental impact of ICT usage is also likely to remain a concern for governments as long as climate change and carbon reduction re-main high on the global agenda… The expansion of one of the global economy’s most essential re-sources – information – is having an unintended knock-on effect on other precious resources… [E]-readiness is not fostered in a digital vacuum, but rather in a complex web of social, cultural, eco-nomic and political factors, ultimately driven by the usage imperative.72 In other words, the cross-systemic risk factor is
evident at the national and global levels, and not just within the ICT sector itself.
Can e-government then be recommended on balance for financial regulation? Yes, but if gov-ernment policies enable financial players to escape scrutiny, then e-government will not improve regulation although it can still enhance efficiency. Overall, e-government is built for speed and for managing complexity, qualities that make it well-suited to financial monitoring and regulation. At the same time, it should not be regarded as a tech-nological ‘fix’. E-government especially, of all the e-buzzwords, can only be as good as the ‘dynamic interactive capabilities’ of the policy makers who apply their principles and models to its design, to-gether with those of the people who construct and operate its systems. n

42

43
Chapter ThreeE-service delivery and the MDGs 3United Nations E-Government Survey 2010
Chapter 3
E-service delivery and the MDGs
The world economic crisis has savaged government finances. Policy makers are facing the harsh reality of substantially di-minished revenues at a time when social protection services and business support schemes are in great demand. Given mounting public debt as well as budget deficits ranging from 6 to 12 percent of Gross Domestic Product (GDP) in devel-oped regions and 5 to 6 percent of GDP in many developing countries, 2010 looks to be a difficult year for politicians and administrators trying to assure the delivery of essential public services.1 Even governments currently using stimulus spend-ing to compensate for financial shortfalls are discussing so-called exit strategies, in the knowledge that such large-scale borrowing cannot continue indefinitely.
The effects of the deterioration in public finances are likely to extend to official development assistance bud-gets on which many low-income countries rely, depending on the funds to supplement their volatile commodity and trade-related revenues.2 Sub-national governments are in an even tighter bind, with limited authority to raise revenues on their own and no possibility of tailoring monetary policy to local economic conditions.
3.1 Why e-services? 44
3.2 Delivering e-services with a view towards achieving the MDGs 45
3.2.1 Employment services for poverty eradication 45
3.2.2 Weathering difficult times in education 47
3.2.3 Gender-inclusive approaches to public service delivery 49
3.2.4 Health care and the advent of m-health 51
3.2.5 Keeping up environmental management 53
3.3 Conclusions 55

44
Chapter ThreeE-service delivery and the MDGs3 United Nations E-Government Survey 2010
3.1 Why e-services?Short of devaluing currencies or defaulting on public debt, governments are finding themselves with few options as they try to balance diminished revenues and increased expenditures. The most immediate response would be to reduce public services. Indeed, policy makers in both high- and middle-income countries are considering austerity measures of the sort once reserved for low-income recipients of multilateral financial aid. In so doing, social protection, health and education budgets will inevitably come under pressure. Another approach, less reactive and more strategic, is to mitigate the effects of the crisis on public finances by enhancing public sector capacity – providing services more efficiently as well as more effectively and aligning them with the results people expect. But how?
Here e-government can play a very important role. Just as technology has always been an impor-tant determinant of productivity in the broader economy, so too is the application of information technology in the rate and quality of public service delivery. In a time of economic stress, improved communications and faster response times can make a critical difference to those most at risk.
The overall trend of e-government develop-ment is conducive to such efforts. The number of initiatives related to e-government has continued to grow. In Australia, the Internet has replaced contact in person and by telephone as the most common way citizens make contact with their government.3 Since the United Nations E-Government Survey was launched in 2003,4 there has been steady prog-ress in the implementation of the electronic delivery of government services (e-service delivery) in both developed and developing countries, and by now the benefits are well known.
Chief among the benefits of e-service delivery are efficiency gains. Efficiency is especially important given the current financial crisis, which has drasti-cally increased demand for public services, including unemployment benefits, food vouchers, health ser-vices and the provision of information on debt relief. The British Financial Services Authority is a case in point. Overwhelmed by the demand for face-to-face debt advice, the Authority launched a new website to facilitate the provision of debt-related information.
In addition to new initiatives, some countries may also benefit from existing e-government in-frastructure. Singapore has provided rapid cash transfers to those most in need, including older persons and members of other vulnerable groups, by linking the databases of different government departments with the direct deposit systems of the nation’s banks. These e-government efforts can make a difference to citizens, especially in a country such as Singapore, which has allocated some 52 percent of its stimulus funds to social protection measures, and which has a high level of e-government development and a correspond-ing agility in the delivery of public services under a variety of conditions.5
In other countries, reports about the slow distribution of stimulus funds to citizens and businesses are ref lections of the limited admin-istrative capacity of government agencies. This situation has prompted some countries to initi-ate accelerated service delivery through online channels. The United States has created a web-site for processing stimulus grants that guides prospective recipients to benefits for which they may be eligible. The United Kingdom’s website Real Help Now provides detailed in-formation on stimulus opportunities for hom-eowners, pensioners and employers, as well as those looking for a job or needing assistance with personal finances. Initiatives are broken down by region and accessed through an inter-active map. What these and other initiatives have in common is a relatively high degree of e-government development as a result of prior, related investments.
Public feedback and collaboration will not guarantee better service delivery but, at very lit-tle cost to the taxpayer, participatory methods can help policy makers set priorities, encourage more citizens to ‘buy in’ to programmes, increase satisfaction levels and thus augment the chances of successful policy outcomes. For example, so-cial networking sites such as Facebook, YouTube and Twitter, as well as blogging software and mobile technology, allow governments to tap into the collective knowledge of society quickly and directly. In this way, citizens move from being passive consumers of government services
E-government can inject much needed flexibility and quickly expand the reach of public services at a time of economic and financial stress.

45
Chapter ThreeE-service delivery and the MDGs 3United Nations E-Government Survey 2010
to advisers and innovators contributing ideas that are in better accord with their individual and group needs.6
Despite speed, efficiency, citizen participation and other benefits of e-service delivery, the usual caveats apply. E-services cannot substitute for traditional methods if citizens do not have ready access to the requisite infrastructure (including a reliable supply of electricity), or if they lack basic education or the means to pay for access to the Internet. Measured in purchasing power parity dollars, broadband Internet subscriptions are 10 times more expensive in developing countries than in developed regions.7 Policy makers should also bear in mind problems related to time lags and the delayed impact of new e-government applications; the high failure rate of information technology projects; and the inevitability of rapid technologi-cal change, with the corresponding obsolescence of e-government systems.8 Moreover, the proportion of the Internet population providing original con-tent to social networking sites is still very small, even in developed regions, which limits the scope of participatory public service delivery.9
These are and other constraints are also dis-cussed in some detail in chapter two of this report.
3.2 Delivering e-services with a view towards achieving the MDGsFewer resources and greater demand – at heart this is a public sector delivery and capacity issue. The situ-ation calls for greater agility, efficiency and reach of public services, especially in the sectors of health, education, gender, environment and employment, which are important in their own right and central to achievement of the MDGs. E-government can be of great use in this regard. The purpose of this section is to present the reader with some potential e-government solutions, based on the experiences of others, which may help public authorities to continue on the path towards internationally agreed develop-ment goals, despite the current economic situation. For each of five priority areas drawn from the United Nations Millennium Declaration, specific develop-ment problems and issues arising from the current crisis are briefly recalled, followed by possible e-gov-ernment solutions and an account of recent actions.
3.2.1 Employment services for poverty eradication
The issuePoverty eradication is one of the most urgent and compelling development goals. There is serious concern that the ‘near poor’ are becoming the new poor. The World Bank estimates that an ad-ditional 53 million people in developing countries will fall into poverty on top of the 130 million to 155 million who became poor due to the impact of the food and oil crisis in 2008. This crisis caused a drop in GDP rates in many developing countries, including in African countries, which registered a 2.9 percent fall, as seen in table 3.1.
Productive employment is the key element for poverty reduction. The current financial and eco-nomic crisis exacerbates large-scale structural un-employment, under-employment and poverty for many developing countries, especially those consid-ered least-developed. The global economy has been relying on demand fuelled by credit rather than earnings from productive activity, greatly contrib-uting to the ‘jobless growth’. Therefore, enhancing employment opportunities is an important and ur-gent issue for the international community.
Faced with the prospect of a prolonged global increase in unemployment, poverty and inequal-ity, and the continuing collapse of enterprises, the International Labour Organization adopted a Global Jobs Pact on 19 June 2009. It is designed to guide national and international policies aimed at stimulating economic recovery, gener-ating jobs and providing protection to working people and their families. Although the Pact was designed with all regions in mind, it may be dif-ficult for developing countries with limited fiscal and policy space to promote job creation in the absence of innovative and cost-effective means of implementing the Pact. Against this background, e-government tools are increasingly considered as a potential solution.
Table 3.1 Real GDP growth (percent) before and after the economic crisis of 2008-2009
Real GDP growth GDP change
Before crisis After crisis After crisis
2008 estimate 2009 projection 2008 estimate 2009 projection 2008-2009
Africa 5.9 5.9 5.7 2.8 -2.9
Source:AfricanDevelopmentBank(2009)

46
Chapter ThreeE-service delivery and the MDGs3 United Nations E-Government Survey 2010
Possible solutionsMost of the policy options enumerated in the Global Jobs Pact appear to lend themselves to a variety of e-government responses. E-service delivery can con-tribute to efforts to address poverty, employment and the impacts of the financial and economic crisis.
In many countries, crisis-response measures aim to attenuate the effects of the economic crisis on employment, and e-government tools can play a significant role in ensuring that pro-employment policies reach their targets. Governments can pro-vide online public information services to job seek-ers and online vocational and technical training and entrepreneurial skills development for those who have lost or are at risk of losing their job as well as to vulnerable groups.10 In addition, they can provide ICT-based assessment, tracking and moni-toring of the activities of the unemployed through the various parts of the employment services sys-tem, which is useful in the current situation.
These potential solutions need to be innovative and geared towards pro-poor services for poverty eradication and employment, especially in rural areas, where the majority of populations in develop-ing countries live. Such e-government orientation is deemed particularly essential in rural areas, as most national e-government programmes have tended to focus on internal efficiency rather than public service delivery, and are mostly focused on urban areas.11
Recent actionsAn innovative e-government response to rural pov-erty and unemployment is India’s e-payment system for the National Rural Employment Guarantee Scheme, which makes use of biometric smart cards. The card uniquely identifies every citizen, with a fin-ger print scanner to the benefit of illiterate citizens. This card initiative was motivated by the need to en-sure that the poor and marginalized receive wages and social welfare benefits intended for them.12 It enhances transparency and accountability. Pension and wages underwritten by the scheme are paid through these smart cards in many Indian villages.
Another example of an e-government initiative in employment is the multimedia project ‘Oman Royal Court Affairs – Mobile Recruitment’, which won the World Summit Award in 2009 with an electronic evaluation system that receives
job applications via short messaging system (SMS).13 It was one of eight winners in a contest following on the United Nations’ World Summit on the Information Society, and is not identified as a direct response to the crisis. Every job applica-tion is processed in a few seconds and the recruit-ment process is completed in about two weeks. The system simplifies filtering of candidates by in-tegrating the National Manpower Register with a mobile-based job application, screening and short-listing of jobseekers. Results of automated screening process are forwarded via SMS. The automated mobile recruitment system saves time, cost and effort.14
The current financial and economic crisis has led governments in different parts of the world have taken explicit steps to reduce unemployment includ-ing the creation of websites as part of their response.
• Employment is among the discussion topics in My Better Estonia, a civil initiative that invites citizens to brainstorm for a better Estonia and to propose solutions for vari-ous problems, including those related to the country’s financial crisis. Public opinions are then published on a website and good ideas yielded by online brainstorming events nationwide are used in making policy deci-sions. As regards employment, the Ministry of Social Affairs is currently implementing a project that will create new jobs, based on citizen feedback collected online.15
• Ireland’s website Losing Your Job, provides public service information to the newly unemployed and potential job-seekers with a user-tailored design that make it easy to access relevant information.16
• In Belgium, the website Au Travail (Off to work)17 contains an application that allows job-seekers to find the specific employment mea-sures and opportunities that concern them. Users can complete an online form describing their work history before being directed to stim-ulus measures about work and employment that are relevant to their profile. This presentation of measures allows citizens to assess whether they are eligible for some form of assistance under the country’s stimulus plan. If so, they are told how to apply; if not, they are advised on alterna-tive measures.

47
Chapter ThreeE-service delivery and the MDGs 3United Nations E-Government Survey 2010
The most recent initiative, in direct response to the crisis, comes from the United States. The newly developed SMART 2010 (short for Skills Matching and Referral Technology) is an e-govern-ment tool connecting unemployed New Yorkers with available jobs. A completed résumé in elec-tronic format is fed into the State Department of Labor’s SMART 2010 system at a career centre. The computer program analyses résumés for skills and work experience and then electronically con-tacts unemployed New Yorkers via e-mail, recom-mending job openings in their areas based on their experience and skills. Within 24 hours of submit-ting a résumé, the individual will receive an e-mail message containing job matches from a database of employment opportunities.18
3.2.2 Weathering difficult times in education
The issueThere has been real progress towards universal primary education in many developing countries since 2000. But the current financial and eco-nomic crisis threatens the significant gains that these countries have made in improving education outcomes. Governments in developing countries have thus far managed to protect their education budgets from the crisis, yet it remains to be seen how long they can continue to do so. There are concerns over ability of governments to sustain educational expansion and maintain the quality of educational service.19 The crisis is reducing the abil-ity of both households and governments to invest in education.
At the same time, there are new, beneficial de-velopments such as allocation of stimulus funding to education. Not only developed countries (e.g. Finland, the Netherlands) but also some developing countries (e.g. Kenya, Mexico, Namibia, Thailand) have been using their stimulus packages for invest-ment in education. The focus differs, however. Developed countries such as the Netherlands and Switzerland have focused on supporting profes-sional schools for the unemployed. In contrast, de-veloping countries (including China) tend to focus on primary education and access to education. The Thai stimulus package to respond to the current
financial and economic crisis includes a 15-year free education policy that aims to reduce the finan-cial burdens on parents and enable Thai children to have equal access to high-quality education.20
The overall impact is too early to assess, yet there is a sense of real danger that some developing countries, which have made progress towards the Millennium Development Goal of universal primary educa-tion, will suffer setbacks as result of the financial and economic crisis. Countries such as Bangladesh, Ethiopia, Mali, Rwanda and Senegal are at particu-lar risk.21 Aid to education had already begun to fall prior to the crisis and may further drop by $1.1 bil-lion in 2010, according to the 2009 Education for All Global Monitoring Report. Nearly 75 million children are out of school, the report says.22 Case studies of countries such as Mongolia show that the financial and economic crisis has had a major impact on school attendance and school quality, increasing school dropout rates at every level of schooling.23 This finding is in contrast to the past Asian financial crisis of the 1990s, when school enrolment rates did not decline as much as feared, partly due to house-hold and school-level adjustment.24
Possible solutionsE-government delivery of educational service can help countries to weather difficult times in education. It is a powerful medium for educa-tion, with 24-hour Internet accessibility over distance. The reach of schools can dramatically be expanded. The ever-increasing possibility for remote education is particularly exciting and important for developing countries. Generally speaking, potential e-government solutions in-clude provision of information on topics such as finding a school, identifying the right colleges for students, finding teaching opportunities for teachers, and receiving test results. Solutions may also be found in the use of ICTs to enhance stu-dent education and teacher training.
If these potentials are to materialize, e-gov-ernment services for education need to be un-derpinned by affordable and reliable Internet connectivity and other vital infrastructure such as school computers and universal access facilities where ICT can be effectively used in educational and training tools.

48
Chapter ThreeE-service delivery and the MDGs3 United Nations E-Government Survey 2010
The use of ICT in education is too often con-strained by a lack of computer stations and other infrastructure. Ensuring the basic infrastructural backbone has been and continues to be a major concern for developing countries.
Recent actionsIn developed countries, stimulus packages are prompting substantial new initiatives in the educa-tional sector. The United States’ stimulus package set aside $650 million to invest in school technol-ogy and broadband, cover expenses for schools to install or improve Internet connections to broad-band, and to help teachers learn how technology can be used to improve their lessons. In the same country, several states initiated recent actions to monitor and analyze the effectiveness of their pro-grammes, such as the use of Economic Recovery Fund Tracking technology by the Arkansas Department of Education. Through funding from the American Recovery and Reinvestment Act, states are now being encouraged to create statewide longitudinal data systems to help track student achievement. Also, on a different topic, it is interesting to observe how e-technology has been applied to deal with the outbreak of H1N1 flu (see box 3.1).
The current situation of financial hardship has motivated countries to place financial information online, including information about scholarships
and financial aid. The Irish Government’s website called Student Finance25 is particularly useful in this regard.
In many developing countries, the focus has been primarily on ensuring that students and teachers have ICT skills (‘Education for ICT’) rather than using ICTs for better learning and teaching process (‘ICT for Education’).26 An example is the e-Schools Initiative of the New Partnership for Africa’s Development (NEPAD). Despite the current financial and economic cri-sis, the initiative has achieved some progress.27 Initiated in 2003, it aims to impart ICT skills to African schoolchildren, equip them with ICT ap-paratus, and provide teachers with ICT skills. It is a good example of integrated approaches with its teacher development framework for teacher train-ing and professional development.
ICT applications are becoming more im-portant for remote education and virtual classrooms. Long before the current economic crisis, several developing countries had initi-ated steps to provide education to students in remote areas. These include Mauritius’ Cyber Caravan Project, Egypt’s video-conference distance learning linking 27 sites across the country to provide learning facilities in remote areas, Guinea’s adult literacy programmes con-ducted via the Internet, and Burkina Faso’s Classe Rurale En Langue Nationales project, a distance-learning programme in local languages targeting rural people, including those who are illiterate. E-education services in Australia are successfully applied to overcome geographical distance and enable educators to reach remote communities (see box 3.2).
Mobile technology is becoming an important aspect of educational services, and it is a noticeable trend in the field of student education and teacher training. In the Philippines, the mobile phone and SMS are being used as the primary means for in-teractive learning and for providing information to students. In the United Republic of Tanzania, the BridgeIT project used mobile phones to pro-vide support for teacher training.28 Mobile tech-nology has rapidly gained in importance across the educational sector. Some even say that the current state of mobile education technology, or
Box 3.2 ‘Shrinking’ Australia with e-education services
WhenitcomestoAustralia,withitsvastareaandsparsepopulation,goingthedistanceandprovidingteachersandstudentswithICTeducationaltoolsisextremelyimportant.E-educationserviceshelp‘shrink’Australia.Mo-tivatedtoinvestinICTbyitsgeographicalcharacteristics,Australiaenjoysthebenefitsofremoteeducationandisnowhometomanyremotee-educationcompanies.
Source:SmartTechnology(2007)
Box 3.1 Online alerts about schools and H1N1 flu
Schoolsalreadyfacethechallengesoffinancialandeconomiccrisis.AddtothisthethreatofH1N1flu,whichis leading to increasingeffortson thepartofUnitedStatesgovernmentand schooldistricts toput informa-tiononline.ThroughsuchlearningmeasurespeoplecanbealertedtopossibleclosuresorteacherandstudentabsencesbecauseofaH1N1fluoutbreak.Inparticular,theUnitedStatesDepartmentofEducationhasaskedCurriki–anopen-sourceonlinerepositoryoffreecurricularmaterialsfromcommercialvendors,governmentandprofessionalorganizationsandeducators–toestablisha‘continuityoflearningplan’aspartofanationwidereadinessinitiative.
Source:Ash(2009)

49
Chapter ThreeE-service delivery and the MDGs 3United Nations E-Government Survey 2010
m-education, may be at the stage where mobile health, or m-health, was just a few years ago. In Bangladesh, more than 50 percent of the popula-tion gained access to mobile phones in the past decade. Mobile applications for English-language teachers in Bangladesh enable them to access training materials including audio and video at all times.29 Soon the mobile applications will be linked to the Government’s school curriculum, textbooks and assessment procedures.30
Mobile devices (e.g. cell phones, handheld devices and handheld computers) are among the most ubiquitous technologies in children’s lives today in countries like the United States. Mobile applications are likely to become an important part of a more effective approach to learning in the near future, which has an important implica-tion for governmental educational services as they prepare to facilitate and encourage ‘anywhere, anytime’ learning.
In addition to the emergence of m-education applications, there is an increasing trend towards learning as a more participative and collaborative process, which should be encouraged by govern-ments. Learning is becoming a more participa-tive and collaborative process in which Web 2.0 tools facilitate activities of teachers and students as co-producers of knowledge and educational content. An illustrative example is the School of Tomorrow project at the Aruba Pedagogical Institute, which has engaged in group-blog col-laborations with Dutch students and others, in-corporating ICTs into many aspects of teaching and learning in its technology-rich model class-room.31 It is also interesting to note that Iceland, one of the most crisis-affected countries in the world, has started promoting free and open source software in the country’s schools, which will open up new opportunities for more collab-orative learning processes (see box 3.3).
3.2.3 Gender-inclusive approaches to public service delivery
The issueSeventy percent of the world’s poor are women, and the financial and economic crisis has gender-spe-cific impacts. Women tend to face greater income
insecurity, and cuts in social spending also tend to disproportionately affect access to education and health services for women and girls. The United Nations Conference on the World Financial and Economic Crisis and Its Impact on Development recognized that crisis responses need to have a strong gender perspective. 32
Including women in economic development is an issue high on the current agenda of the inter-national community. There is consensus that the adverse impacts of the crisis on women’s economic empowerment, including women’s employment, present a major challenge to governments world-wide. Economic empowerment is mainly about securing economic opportunities. It includes mo-bilizing women to eliminate gender gaps in access to resources and services that are a major obstacle to women’s development. Microenterprise devel-opment, job creation and security, and above all, availability of microfinance loans are important.33
Access to the labour market has much to do with economic empowerment for women. Women are often in vulnerable employment and overrepre-sented in insecure, part-time and short-term jobs, including particularly, in the agricultural sector. As regards women’s unemployment, the Millennium Development Goals Report 2009 highlights its critical importance and notes that the crisis may hold back progress towards gender equality by cre-ating new hurdles to women’s employment. 34 The United Nations Committee on the Elimination of Discrimination against Women also warns that the current crisis is likely to have a serious impact on the realization of gender equality, especially in relation to employment.35
Female employment and microfinance are key issues arising from the financial and economic crisis. According to the World Bank, loss of
Box 3.3 Promoting free and open source software in schools in a crisis-affected country
TheMinistryofEducationinIcelandrecentlyannounceditsplantopromotetheuseoffreeandopensourcesoft-wareinschoolsacrossthecountry.Thisisbasedonthegovernment’spolicyonfreeandopensourcesoftwareforallinstitutionsthatareoperatedbypublicfunds,withtheobjectiveofaugmentingstudents’skillsinICTs,whichpresentcost-effectiveeducationalmethodforschools.Thekeyadvantageofopensourcesoftwareforeducationisitsopennessenablinganyorganizationorindividualtousefreeofcharge,changeandimprovethesoftwareforone’sownuseandtherebyexploreanewideaaboutlearning.Whencombinedwithopensoftwarestandards,opensourcebecomesevenmorepowerful,emergingasnewkindsofsoftwaretosupportcollaborativelearning.
Source:ePractice.eu(2009)

50
Chapter ThreeE-service delivery and the MDGs3 United Nations E-Government Survey 2010
employment constitutes the first round impact of the crisis on women and families, mainly as a re-sult of the drop in aggregate demand and exports. Another important first round impact is the fall in lending resources from microfinancing institu-tions, as a result of tightened credit markets.36
It is in view of these problems, the United Nations Millennium Campaign has called for the establishment of a ‘vulnerability fund’ in which each developed country would devote 0.7 percent of its stimulus package to aid poor countries to set up safety net programmes, including microfinance institutions. Governments are also urged to design and implement the packages, with explicit con-sideration of the labour market disadvantage that women face, and set explicit employment growth targets for women.37 It is important to ask if the
current stimulus packages contain gender-specific provisions for empowerment and employment op-portunities (see box 3.4).
The gender impact of the economic crisis in terms of unemployment rates is expected to be more detrimental for females than for males in most re-gions, and especially so in Latin America and the Caribbean. Figure 3.1 shows gender-disaggregated employment-to-population ratios prior to the crisis.
Possible solutionsE-government can be effectively leveraged for women’s economic empowerment and employment in the crisis. Employment-related e-government solutions include online provision of information on job opportunities for women, in particular for women who can use skills for the global digital economy beyond the limits of their local economy; online skills training for female jobseekers; and online distance learning.
E-government can also enhance informa-tion service delivery for much-needed women’s economic empowerment. It can help women to weather the crisis by disseminating information on income-generating opportunities, and by alert-ing women to other relevant information services. Women need information about microenterprise loans and other forms of capital for female entre-preneurship, as well as local, regional and global market information and market pricing infor-mation. Indeed, uninterrupted flows of microfi-nance are key to the economic empowerment of women, especially in a time of decreased lending. E-government can provide information about financial and other forms of assistance provided by governments, international donors and non-governmental organizations. In addition to these information services, women need to know about online business training and support for women-headed microenterprises, online marketing assis-tance and online financial services.
A number of conditions would facilitate the de-livery of information to women, including: (a) pub-lic access (e.g. mobile Internet kiosks, especially in rural areas); (b) free access to training on the use of the technology; (c) technological solutions that promote targeted access to women, such as voice recognition for people with little or no formal
Figure 3.1 Gender-disaggregated employment-to-population ratios
0 10 20 30 40 50 60 70 80 90 100Prevalence (percent)
Adult employment- to-population ratios, by sex and region, 1998 and 2008* (%)
Male 2008Male 1998Female 2008
Sub-Saharan Africa
85.486.2
62.960.8
North Africa
81.781.0
27.022.6
Middle East
81.782.2
25.020.5
Latin America and the Caribbean
81.982.0
52.644.2
South Asia
86.289.1
37.636.7
South-East Asia and the Pacific
87.688.6
58.759.9
East Asia
82.584.4
69.370.0
Central and South Eastern Europe (non-EU) & CIS
70.568.7
51.049.0
Developed Economics and European Union
67.569.8
50.448.3 Female 1998
* 2008arepreliminaryestimates Source:ILO(2009a)

51
Chapter ThreeE-service delivery and the MDGs 3United Nations E-Government Survey 2010
education, graphic interfaces and touch screens; and (d) the provision of information that rural women in developing countries need in an acces-sible language and format.
Recent actionsSome countries have taken steps in fiscal stimulus packages to protect and increase funding to micro-finance lending institutions, which are important to women’s empowerment. It is also important that public expenditure monitoring systems are in place to ensure that stimulus funding and other budget-ary allocations actually reach the intended groups, including women.38 In this regard, the latest ICT applications for tracking and monitoring of stim-ulus funding are likely to be useful, especially in countries like Uganda, which is one of the first developing countries to successfully implement a public expenditure tracking system and which has already built relevant capacity.
In direct response to the financial and eco-nomic crisis, China focused on women in the area of information service and assistance for fe-male jobseekers and entrepreneurs. The Women’s Federation of the City of LianYunGang made a significant effort to improve the female employ-ment rate in the city during the current crisis. The Federation reported that more than 60 per cent of the female population was unemployed. Events were organized to strengthen employment place-ment services for women, and the Federation es-tablished a database for unemployed women. The qualifications of female jobseekers were analysed and the Federation then recommended women to various organizations for employment according to their qualifications. The database is updated once every quarter, which aids in monitoring the employment situation. The Federation also created a special website column, where women could post their experiences with successful start-up microenterprises and published handbooks for female entrepreneurs.39
A good example of a microfinance initia-tive comes from India, where commercial banking entities including State Bank of India have linked with the respective Service Centre Agencies in the states under the framework of the National e-Governance Plan to provide
Banking Correspondent status to the Common Service Centres equipped with ICT infrastruc-ture, and have provided microfinance services through them. For the cost of sending an SMS message, the microfinance client uses an applica-tion stored on her mobile phone to initiate an ac-count transfer to her bank account. Applications for microfinance may be led by the private sector, with government and non-governmental organi-zations in support. In this case, the government has also routed various developmental schemes through microfinance.40
A trend observed is the growing importance of mobile usage, especially for women entrepreneurs, who need access to credit and capital. This devel-opment seems similar to the growing importance of mobile applications in other priority areas of the MDGs, such as m-education and m-health. There are some indications that it is one of the more acces-sible technologies for women. In fact, women’s mo-bile phone access in Africa is equal to that of men.41
3.2.4 Health care and the advent of m-health
The issueThe financial and economic crisis may have a serious impact on the health-related MDGs. In the crisis, governments around the world are under increasing pressure to maintain the level and quality of health services with limited and decreasing resources. Even more demands will be placed on public health services as income decreases and governments cut their budgets. The crisis is expected to negatively impact HIV/AIDS treatment programmes in one third of countries surveyed in 2009, with its adverse effects worsening over the year. The crisis will inevi-tably impact and exacerbate many of the problems facing healthcare. Previous crises in Asia and Latin America show the negative impact that crises can have on access to health outcomes. Women and children are especially vulnerable.
Possible solutionsICT applications in the health sector can bring
efficiency gains, much as they can for education, employment and other priorities of the MDGs. ICT applications could, for example, improve the
The advent of m-health is a harbinger of more mobile public services to come.

52
Chapter ThreeE-service delivery and the MDGs3 United Nations E-Government Survey 2010
monitoring of demand for and supply of HIV/AIDS drugs, which would be highly relevant given the current lack of funding for these drugs. The current crisis is intensifying the challenge of main-taining access to HIV treatment and prevention, especially in high-prevalence countries in Eastern and Southern Africa.42
ICT applications can engage citizens in par-ticipatory decision-making about health care, con-siderably expanding the scope of e-participation, These technologies offer the potential to empower citizens with medical information and knowledge that can facilitate improved decision-making and care. They can enable for stakeholders such as pa-tient groups and providers to agree on priorities and then streamline services to make them more efficient, which can reduce costs and help to miti-gate the impact of the crisis.43
Recent actionsE-health, a process of administering health care through ICT tools, is rapidly growing in impor-tance in all parts of the world. Telemedicine, for example, is a process of accessing health care from a distance through ICT tools. Telemedicine has been successfully implemented in several developing countries, including Bhutan, Ghana, Indonesia, Niger, Nigeria, Pakistan, Peru and South Africa.
Electronic health records are another example of ICT use in this sector. The stimulus package in the United States contains $19 billion for health care technology spending and the adoption of elec-tronic health records.44 The use of computerized
medical records has slowly been adopted in many developed countries such as Singapore and several European countries. In Qatar, electronic health records are a key component of the national e-health programme for all, which aims to increase the efficiency and effectiveness of the healthcare system. The Supreme Council of Information and Communication Technology, ictQATAR, will first promote the standardization of health records and the creation of the Electronic Patient Record, and will then focus on providing online healthcare information and services through portals and ap-plications with a view to developing an integrated health network.45
In the United Kingdom, recent initiatives are taking advantage of technology in innovative ways and building on Web 2.0 technologies. One exam-ple is the Wii platform development, which extends telehealth and telecare systems to include a range of new devices around the home. The technology cre-ates a virtual community of connected carers and cared-for, and it enhances community-based care and health information. The aim is to help prolong independent living for elderly and chronically ill pa-tients.46 Another e-health project is PatientOpinion, which allows patients of the British National Health Service to share their experiences at local hospitals, hospices and mental health services and to rate them based on criteria such as standard of medical care, being treated with respect and dignity, clear infor-mation and cleanliness.
More than half of all patients between the ages of 25 and 34 in the United States are influenced by social media when it comes to health care de-cisions, recent studies have found. Social media is a group of Internet-based applications that allow users to generate and exchange content, including blogs, wikis, podcasts, instant messaging and other social networking and communications software applications. The concentration of such activity in the most developed countries may result in an accentuation of the digital divide in health care, urgently necessitating a concerted effort for more inclusive e-health care on a global scale.
Using mobile phones, m-health stands out among the many emerging uses of ICT in health-care. It delivers health services and information (over distance) to patients and has become a critical
Figure 3.2 Mobile cell phone subscriptions per 100 people
60
50
40
30
20
10
0YR2000 2001 2002 2003 2004 2005 2006 2007 2008
Year
Region
World
Sub-Saharan Africa
Least developed countries: UN classification
Low and middle income countries
Source:WorldBank(2009c)
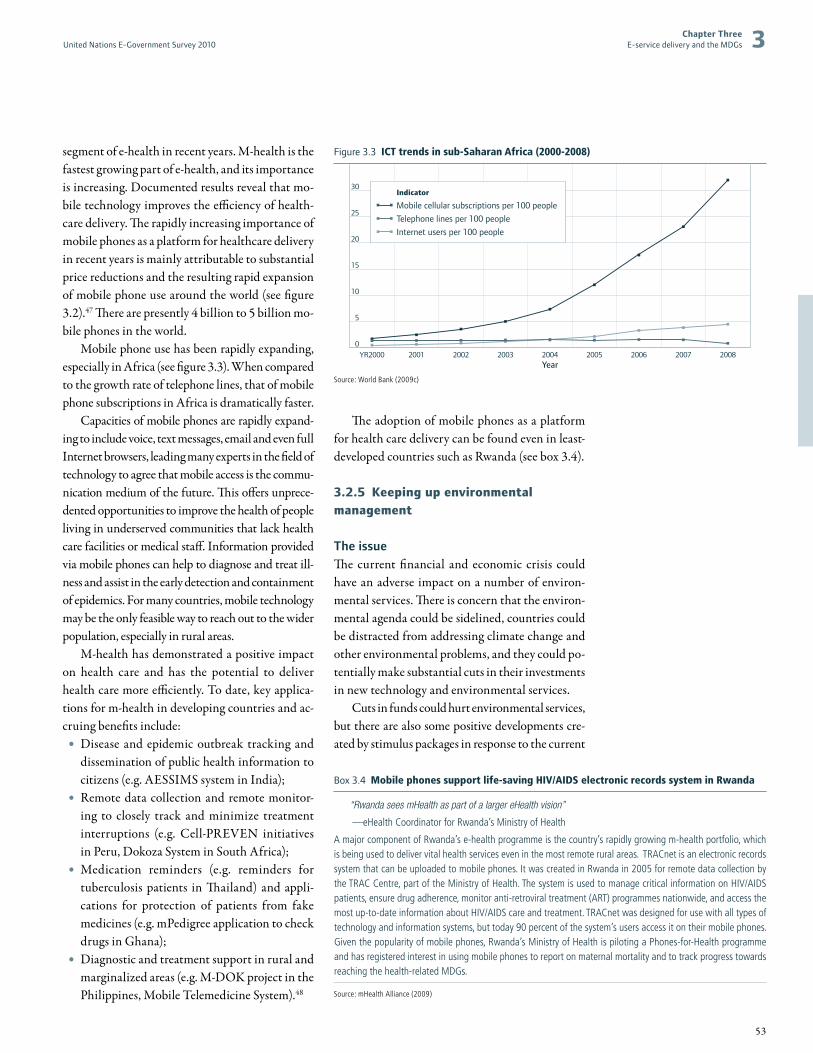
53
Chapter ThreeE-service delivery and the MDGs 3United Nations E-Government Survey 2010
segment of e-health in recent years. M-health is the fastest growing part of e-health, and its importance is increasing. Documented results reveal that mo-bile technology improves the efficiency of health-care delivery. The rapidly increasing importance of mobile phones as a platform for healthcare delivery in recent years is mainly attributable to substantial price reductions and the resulting rapid expansion of mobile phone use around the world (see figure 3.2).47 There are presently 4 billion to 5 billion mo-bile phones in the world.
Mobile phone use has been rapidly expanding, especially in Africa (see figure 3.3). When compared to the growth rate of telephone lines, that of mobile phone subscriptions in Africa is dramatically faster.
Capacities of mobile phones are rapidly expand-ing to include voice, text messages, email and even full Internet browsers, leading many experts in the field of technology to agree that mobile access is the commu-nication medium of the future. This offers unprece-dented opportunities to improve the health of people living in underserved communities that lack health care facilities or medical staff. Information provided via mobile phones can help to diagnose and treat ill-ness and assist in the early detection and containment of epidemics. For many countries, mobile technology may be the only feasible way to reach out to the wider population, especially in rural areas.
M-health has demonstrated a positive impact on health care and has the potential to deliver health care more efficiently. To date, key applica-tions for m-health in developing countries and ac-cruing benefits include:
• Disease and epidemic outbreak tracking and dissemination of public health information to citizens (e.g. AESSIMS system in India);
• Remote data collection and remote monitor-ing to closely track and minimize treatment interruptions (e.g. Cell-PREVEN initiatives in Peru, Dokoza System in South Africa);
• Medication reminders (e.g. reminders for tuberculosis patients in Thailand) and appli-cations for protection of patients from fake medicines (e.g. mPedigree application to check drugs in Ghana);
• Diagnostic and treatment support in rural and marginalized areas (e.g. M-DOK project in the Philippines, Mobile Telemedicine System).48
The adoption of mobile phones as a platform for health care delivery can be found even in least-developed countries such as Rwanda (see box 3.4).
3.2.5 Keeping up environmental management
The issueThe current financial and economic crisis could have an adverse impact on a number of environ-mental services. There is concern that the environ-mental agenda could be sidelined, countries could be distracted from addressing climate change and other environmental problems, and they could po-tentially make substantial cuts in their investments in new technology and environmental services.
Cuts in funds could hurt environmental services, but there are also some positive developments cre-ated by stimulus packages in response to the current
Figure 3.3 ICT trends in sub-Saharan Africa (2000-2008)
YR2000 2001 2002 2003 2004 2005 2006 2007 2008
30
25
20
15
10
5
0
Year
Indicator
Mobile cellular subscriptions per 100 people
Telephone lines per 100 people
Internet users per 100 people
Source:WorldBank(2009c)
Box 3.4 Mobile phones support life-saving HIV/AIDS electronic records system in Rwanda
“Rwanda sees mHealth as part of a larger eHealth vision”
—eHealthCoordinatorforRwanda’sMinistryofHealth
AmajorcomponentofRwanda’se-healthprogrammeisthecountry’srapidlygrowingm-healthportfolio,whichisbeingusedtodelivervitalhealthserviceseveninthemostremoteruralareas.TRACnetisanelectronicrecordssystemthatcanbeuploadedtomobilephones.ItwascreatedinRwandain2005forremotedatacollectionbytheTRACCentre,partoftheMinistryofHealth.ThesystemisusedtomanagecriticalinformationonHIV/AIDSpatients,ensuredrugadherence,monitoranti-retroviraltreatment(ART)programmesnationwide,andaccessthemostup-to-dateinformationaboutHIV/AIDScareandtreatment.TRACnetwasdesignedforusewithalltypesoftechnologyandinformationsystems,buttoday90percentofthesystem’susersaccessitontheirmobilephones.Giventhepopularityofmobilephones,Rwanda’sMinistryofHealthispilotingaPhones-for-Healthprogrammeandhasregisteredinterestinusingmobilephonestoreportonmaternalmortalityandtotrackprogresstowardsreachingthehealth-relatedMDGs.
Source:mHealthAlliance(2009)

54
Chapter ThreeE-service delivery and the MDGs3 United Nations E-Government Survey 2010
crisis. ‘Green growth’ makes up an important por-tion of stimulus packages after infrastructure investments, education and research and develop-ment, including specific ‘green measures’ in the proposed or announced fiscal stimulus packages in China, Germany, Japan, the Republic of Korea and the United States. Substantial amounts of money are directed at green technology research areas.49 Some tropical countries have announced stimulus packages with programmes such as Indonesia’s tree-planting and forest rehabilitation programmes.50
In most developing countries, the mobilization of funds and the proportion earmarked for green in-vestment will be limited. Missing the opportunity to stimulate green investments in developing countries now, and to unlock low-carbon opportunities, even as their economies are in a downturn, could mean storing up problems for the future that are far larger than the current financial and economic crisis.
Possible solutionsEnvironmental protection needs to be an integral part of countries’ recovery from the crisis, and ICT can help countries to achieve their goals in more cost-effective ways. It is estimated that ICT-enabled improvements in non-ICT sectors could save about 15 percent of total carbon emissions by 2020. Significant ICT-enabled energy efficiency gains are expected to be achievable in the short term in buildings and construction, in transport, logistics and energy end-use. It is estimated that the wider use of applications such as online public services and applications, and advanced collabora-tion technologies could save at least 1 to 2 percent of total energy use by 2020 worldwide. For some,
broadband is green technology. In fact, it is an en-abler of efficiencies that could drive major reduc-tions in carbon emissions. 51
E-government applications are already in po-sition to bring substantial gains for environmen-tal transactional services including, for example, cash-back incentives for green products, subsi-dies, tax rebates and environmental permit ap-plications. These efficiency gains are particularly significant at a time of financial and economic crisis, when many stimulus packages include di-rect public spending and tax incentives to sup-port green investments.
ICT-enabled environmental services also include provision of public environmental information and data, and enhance opportunities for monitoring and public awareness. In an example from the water sector, the Seoul Metropolitan Government in the Republic of Korea recently initiated an online real-time water quality assessment service to assess and monitor the quality of tap water. With the system, citizens can check online and in real-time the qual-ity of water supplied to their houses from water pu-rification plants.52 In an example from the forestry sector, geographic information systems (GIS) are considered powerful tools for tracking and moni-toring deforestation (see box 3.5).
Recent actionsOnly recently have countries recognized the po-tential of ICT-based innovations to contribute to environmental issues. Yet they are already being rec-ognized for their contributions, as in the case of an e-catalog for procurement by government agencies in the United States, which has improved the tracking and monitoring of green purchases.53 The country’s General Services Administration has been using so-cial media tools to ask citizens how to do better at procuring environmental goods and services.
E-government has a uniquely low-carbon de-livery process for its services, and this is being rec-ognized for its positive impact to environment. In the United Kingdom, a study of the Sunderland City Council demonstrated how e-government service delivery can serve the environmental ob-jectives of government. The study examined the carbon footprint of five services provided by the local government, and found that a shift towards
Box 3.5 Spatially enabled e-government tools for forest management
TheAsianfinancialcrisisprovidesampleevidencethatillegalforestactivitiesatbothindustrialandsubsistencelevelsincreaseintermsofeconomicstrife.DeforestationisanimportantclimatechangeissueandasignificantcontributorofCO2.
E-government toolscansupport theenvironmentalservicesofferedby the initiativeReducingEmissionsfromDegradationandDeforestation(REDD)andrelatedinitiatives.REDDisacrucialstrategyfordealingwithclimatechangethatrequiresslowingthegrowthofagriculture,forestryandcattleranchingtoprotectforestsinplacessuchasBrazilandIndonesia.
GIScanplayanimportantroleinassistinggovernmentagenciesintrackingandmonitoring.Thissystemenablesaneffectiveuseofgeographicinformation,designedforthecollection,storageandanalysisofobjects,wheregeographiclocationiscriticaltotheanalysis.Itaidsusersinorganizingthedataaboutproblems,under-standingtheirspatialrelationshipassociations,andanalyzingandsynthesizinginformationaboutthem.
Source:ESRI(2009)

55
Chapter ThreeE-service delivery and the MDGs 3United Nations E-Government Survey 2010
greater provision of these services via e-mail and the Internet would lead to a reduction in the Council’s carbon footprint.54
Governments were already grappling with many environmental issues prior to the crisis. After the onset of the crisis, some existing e-government tools were being scaled up or new tools were cre-ated. The spatially enabled e-government tools such as GIS, mentioned earlier, are increasingly being used to track and monitor environmental changes. A case in point comes from the United Kingdom’s National Weather Service, which fea-tures an interactive map on the Met Office website that demonstrates the impact of global warming in decades to come.
Another trend in e-government is the use of ap-plications that enhance public participation to im-prove environmental service delivery. Social media tools enable active social networking and consensus-building among environmental activists, who are one of the most vocal groups. Some governments actively encourage citizen participation in combat-ing climate change, using innovative e-government tools. Examples include the Climate Atlas of the German Federal Environment Ministry on the new online portal, Es ist Dein Klima (It’s your cli-mate).55 The Atlas shows who is committed to tack-ling climate change in individual municipalities. The objective is to motivate citizens and encourage participation in combating climate change.
3.3 ConclusionsFaced with pressure to do more with less, govern-ments find themselves in the position of having to be more efficient and agile in delivering pub-lic services in order to meet national develop-ment objectives. The ‘e’ of e-government services brings several important advantages in the cur-rent financial and economic crisis, most notably improved efficiency. These benefits, however, need to be assessed against existing constraints and limitations. Potential and actual e-government applications vary across countries and groups. Issues of public service delivery arising from the current financial and economic crisis also vary across countries and group. This high degree of variation is reflected in the many different
e-government approaches taken in employment, education, women’s empowerment, health care and the environment – five selected priority areas of the MDGs. For example, ICT tools have helped female jobseekers and entrepreneurs find opportunities for jobs and loans; m-health has de-livered vital health services even in remote rural areas of developing countries, including services for HIV/AIDS; and ICT tools have enhanced environmental monitoring and raised awareness through effective provision of public environmen-tal information.
Across these varied sectors there are common features and trends, due in part perhaps to the shared experience of the financial and economic crisis.
• A major part of the current e-government activity entails the provision and delivery of information service, a finding common to the five selected areas of the MDGs. ICT-enabled transactional services have been used to meet the drastically increasing demand for social welfare and other benefits, and they have gained in importance and usage.
• E-transaction services present an important issue in connection with stimulus funding, not only to enhance transparency (see chapter 1 of the United Nations E-Government Survey) but from the per-spective of public service delivery. E-government tools can expand and enhance public service de-livery capacity through, for example, efficient pro-cessing and distribution of stimulus grants.
• Another important trend involves e-participa-tion, closely linked to public service delivery. Many countries, especially developed countries, show increasing use of new Web 2.0 and other social media tools to create a more interactive environment between governments and citi-zens. Several countries have invested substantial resources and effort into experimenting with these tools, finding innovative ways to use them for more effective delivery of public services.
• One of the most noteworthy developments is the rapid and ubiquitous emergence of mobile technol-ogy as a powerful tool for public service provision and delivery, especially in developing countries. Mobile service delivery is becoming pervasive in employment, education, women’s empowerment and the environment but nowhere it is advancing more quickly than in the health sector. It is at an
56
Chapter ThreeE-service delivery and the MDGs3 United Nations E-Government Survey 2010
early and dynamic stage, and the scope of its appli-cation is rapidly expanding. The mobile platform is widely seen as the direction of the future and will continue to play an increasingly important role in public service delivery. Despite the current crisis, the mobile technology industry shows resilience.Governments responded to the financial and eco-
nomic crisis by developing new e-government tools, scaling up existing initiatives and by refocusing or stepping up their overall e-government efforts. Some governments benefit from pre-existing e-government systems and initiatives. E-government work, which has already carried out has proven invaluable in the current crisis, allowing some governments to accelerate their e-government programmes, with a view to realizing benefits such as enhanced efficiency, effectiveness and financial savings on the delivery of public services.56
Looking ahead, constant progress in ICTs is driving rapid change, presenting both new chal-lenges and new opportunities for public service de-livery. Technological developments will continue to provide new possibilities for e-government to ad-dress both immediate problems such as those arising from the current financial and economic crisis and long-term challenges for public service delivery. At the present time, due to pressures on ICT budgets, many countries have cancelled or postponed their ICT projects. Ultimately, however, the crisis may act as a powerful catalyst for improvement in the deliv-ery of public services by governments, which could prove advantageous in the long run.
Progress in ICT infrastructure will help ad-vance e-government and service delivery in all areas including, in particular, those advancing the MDGs. It follows, for example, that the provision of interactive public services is high in countries with large broadband penetration.57 There are en-couraging developments in this regard, especially in Africa, and despite the global financial and eco-nomic crisis. Rwanda, for example, continues to invest in ICT applications and e-government. In South Africa, the government has said that ICT sector would be used to deal with the current crisis. Plans to develop Internet connections in develop-ing countries are making steady progress despite the global financial and economic crisis. The Eastern Africa Submarine Cable System has been successfully launched, which could drastically re-duce the cost of Internet access in East Africa and landlocked central regions in the near future. The future progress of e-government depends on this kind of infrastructural progress.
E-government is practical today as well as being an investment in the future, yet an exam-ple from the past helps make the point. In the Asian financial crisis of the 1990s, the Republic of Korea continued and even enhanced its invest-ment in ICT development and use of ICTs for public service delivery, experiencing particular success with its e-procurement system. This con-tinuing investment contributed to the country’s economic recovery.58 n
A country’s capacity to achieve the MDGs can be greatly enhanced with the right e-government applications.

57
The state of e-government around the world
2
Part 2

58
Part 2The state of e-government around the world
Chapter 4World e-government rankings 59
Chapter 5Citizen empowerment and inclusion 83
Chapter 6Measuring e-government 93

59
Chapter FourWorld e-government rankings 4United Nations E-Government Survey 2010
Chapter 4
World e-government rankings
The United Nations E-Government Survey 2010 finds that citizens are benefiting from more advanced e-service deliv-ery, better access to information, more efficient government management and improved interactions with governments, primarily as a result of increasing use by the public sector of information and communications technology. Most coun-tries have published a tremendous amount of information online, many going beyond basic websites to provide national portals that serve as a major starting point for users to con-nect to government services in different ministries. At the same time, many developing countries need to devote ad-ditional energy to transactional services as well as the elec-tronic means of engaging citizens in public consultation and decision-making.
To better reflect the higher expectations of e-govern-ment development around the world, the United Nations Department of Economic and Social Affairs introduced sig-nificant changes to the survey instrument in this round, fo-cusing more on how governments are using websites and Web portals to deliver public services and expand opportunities for citizens to participate in decision-making. The number of questions increased from 86 in 2008 to 95 in 2010. More spe-cifically, twenty-five questions were added and 16 questions removed from the questionnaire in the 2010 survey round, while 29 questions were modified.
4.1 Global e-government development 60
4.2 Regional comparisons 61
4.2.1 E-government in Africa 61
4.2.2 E-government in the Americas 65
4.2.3 E-government in Asia 68
4.2.4 E-government in Europe 71
4.2.5 E-government in Oceania 74
4.3 Economic groupings 75
4.4 Progress in online service provision 75
4.4.1 How governments rank in online services 76
4.4.2 About the services governments provide online 77
4.4.3 The data behind the rankings 81

60
Chapter FourWorld e-government rankings4 United Nations E-Government Survey 2010
As a result of these changes, the world aver-age of the e-government development index regis-tered a slight decline compared to previous years. Nevertheless, the decline should not be interpreted as the degeneration of e-government on a global scale since the index measures e-government devel-opment of countries relative to one another within a given year. More importantly, a drop in a coun-try’s ranking may serve as a reminder of the need to devote greater resources to improving online services and expanding access to telecommunica-tion infrastructure.
4.1 Global e-government developmentHigh-income countries enjoy the top rankings in the e-government development index in 2010 as in previous years. Among the top five countries in the 2010 United Nations E-Government Survey, the Republic of Korea received the highest score (0.8785), followed by the United States (0.8510), Canada (0.8448), the United Kingdom (0.8147) and the Netherlands (0.8097).
Figure 4.1 shows that Europe (0.6227) and the Americas (0.4790) score above the world av-erage (0.4406). Asia (0.4424) is almost the same as the world average. Africa (0.2733) and Oceania (0.4193) score below the world average.
The majority of positions in the top 20 rank-ings belong to high-income countries, which is not surprising since they have the financial resources to develop and rollout advanced e-government initiatives, as well as to create a favorable environ-ment for citizen engagement and empowerment. Developed countries have a distinct advantage in achieving higher rankings in the survey, as nearly two-thirds of the weight of e-government develop-ment index is allocated to the telecommunication infrastructure and human capital components, which both require long-term investment. For emerging and developing countries, the chal-lenge is to invest in all three dimensions – online services, telecommunication infrastructure and education – to narrow the current digital gap. In other words, having a great website does little in e-service provision if the majority of people in the country cannot read or write, nor if they have no access to the Internet.
Rank CountryE-government
development index value
1 RepublicofKorea 0.8785
2 UnitedStates 0.8510
3 Canada 0.8448
4 UnitedKingdom 0.8147
5 Netherlands 0.8097
6 Norway 0.8020
7 Denmark 0.7872
8 Australia 0.7863
9 Spain 0.7516
10 France 0.7510
Rank CountryE-government
development index value
11 Singapore 0.7476
12 Sweden 0.7474
13 Bahrain 0.7363
14 NewZealand 0.7311
15 Germany 0.7309
16 Belgium 0.7225
17 Japan 0.7152
18 Switzerland 0.7136
19 Finland 0.6967
20 Estonia 0.6965
Table 4.1 Top 20 countries in e-government development
.
Box 4.2 Bahrain embraces Web 2.0
Bahrain:Web2.0
http://www.bahrain.bh/
Bahrain’se-governmentprogrammehasbeeninnovativewhenitcomes
tocustomer’scentricity.Citizeninvolvementhasbeenensuredrightfrom
thestrategy formulationandcontinuous feedbackhasbeenobtained
duringimplementation.Incontinuationtothisphilosophy,theBahrain
e-governmentprogramhasembracedtheWeb2.0toreachitscustom-
ers.Ministersandseniorgovernmentofficialshaveestablishedanopen-
doorpolicytointeractwithcitizens.Thee-governmentprogramhasits
presenceonsocialnetworkingsitessuchasFacebookandYouTube.In
addition,thenationalportalandministrywebsitesprovidefeaturessuch
asopenforums,blogs,livechats,onlinepolls,e-newslettersandother
interactiveservicesthatinvolvecitizensingovernmentdecisionmaking.
For instance, twoof theministersand theCEOof thee-Government
Authorityhaveinteractedwithcitizensthroughsuchblogs.
Citizens’ participation and constructive feedback was recog-
nizedandimplementedbychangingthenationalportalandrepriori-
tizingitsobjectives,therebyachieving85%ofcustomersatisfaction
onthee-governmentprogrammeaspertheMay2009Survey.
Box 4.1 United States Social Security Administration leads in customer satisfaction
UnitedStates:SocialSecurityAdministration
http://www.ssa.gov
According to theAmerican Customer Satisfaction Index for the 3rd
quarterof2009, theSocial SecurityAdministration (SSA) is the top
governmentportalintermsofcitizensatisfaction.Citizenshaverated
theSSA’sRetirementEstimatorandtheIClaimasthetwohigheste-
governmentserviceswithascoreof91and90respectively.
TheCustomerSatisfactionIndexlooksatfunctionality,naviga-
tion, look and feel, site performance and content to determine the
levelofcustomersatisfaction.TheSSAportalreceivesahighnumber
of repeat customers and has become one of the primary resources
forinformationonsocialservicesintheUnitedStates.TheSSAportal
hascontinuedtomakeimprovementstorespondtocustomers’needs,
whichhasledtoanincreaseinloyaltyandcostsavings.

61
Chapter FourWorld e-government rankings 4United Nations E-Government Survey 2010
What is noteworthy is that some developing countries have begun to catch up with higher-income countries despite these challenges. Bahrain (0.7363), for example, has made significant strides in the two years since the previous survey, moving up in the rankings to 13th place in 2010 from 42nd place in 2008. Bahrain’s recent emphasis on citizen engage-ment and the electronic provision of government services has propelled the country into the top 15 in e-government development, somewhat closer to Singapore (0.7476) which is among the global leaders in provision of electronic and mobile public services.
Mobile technology will become an affordable tool to fill in the digital gap between developed and developing countries, given the rapid price decline of mobile products. Emerging and least developed countries have already demonstrated that they are capable of narrowing the digital gap by investing in websites and Web portals and by applying tools such as telecentres, kiosks, community centres and other similar outlets to increase access to the Internet. They are adopting the use of mobile technology at a fast rate, which will trigger the need to develop more mobile e-government services. The private sector in these countries has an opportunity to work with government to create and distribute mobile services. The 2010 survey recorded an increase in the use of mobile technology for communication from gov-ernments to citizens, whether it is simple SMS, alert notification or a full-fledged mobile service.
In general, Member States are channelling more human and financial resources to fulfill the ever-increasing digital needs.
The 2010 survey found that some countries are increasingly active in seeking customer satisfac-tion through online polls, blogs, surveys and other means. This indicates that a growing number of countries have recognized the importance of citi-zen feedback via Internet and are taking advantage of social networking tools to create better websites and Web portals.
Though emerging and developing countries have yet to fill the digital gap, table 4.1 shows that those developing countries that have channeled more investment to telecommunications infra-structure, education and online services could compete with developed countries and, in some cases, even score higher.
4.2 Regional comparisonsOn a regional basis, Europe receives the highest score, followed by the Americas. These are the only two regions above the world average. Africa continues to lag far below the world average, given that most of the world’s least developed countries are in this region and they generally lack the financial and human resources to fully implement e-government. The Asian region is slightly above the world average, but the Republic of Korea is the exception, as it stands at the top of 2010 rankings in the e-government develop-ment index.
4.2.1 E-government in AfricaFigure 4.2 indicates that all sub-regions in Africa fall below the world average. However, there has been some improvement in the region, especially in Middle, Northern and Western Africa since the 2008 survey. Northern Africa leads the re-gion and is closely followed by the Southern Africa. Western Africa lags far behind the other sub-regions and is the lowest scoring sub-region in the 2010 Survey.
Table 4.3 shows that Tunisia leads Africa in e-government development, followed by Mauritius and Egypt. It also shows that the majority of coun-tries in the ‘top ten’ rankings are developing coun-tries from Northern and Southern Africa.
Eastern AfricaMauritius (0.4645) and the Seychelles (0.4179) continue to lead the region, though both coun-tries register lower rankings in the 2010 Survey. Mauritius dropped by 14 positions and the
Figure 4.1 E-government development index regional averages
0 0.1000 0.2000 0.3000 0.4000 0.5000 0.6000 0.7000
World average0.4406
Oceania0.4193
Europe0.6227
Asia0.4424
Americas0.4790
Africa0.2733
Table 4.2 Regional comparisons
Region
E-governmentdevelopment index value
2010 2008
Africa 0.2733 0.2739
EasternAfrica 0.2782 0.2879
MiddleAfrica 0.2603 0.2530
NorthernAfrica 0.3692 0.3403
SouthernAfrica 0.3505 0.3893
WesternAfrica 0.2156 0.2110
Americas 0.4790 0.4936
Caribbean 0.4454 0.4480
CentralAmerica 0.4295 0.4604
NorthernAmerica 0.8479 0.8408
SouthAmerica 0.4869 0.5072
Asia 0.4424 0.4470
CentralAsia 0.4239 0.3881
EasternAsia 0.6470 0.6443
SouthernAsia 0.3248 0.3395
South-EasternAsia 0.4250 0.4290
WesternAsia 0.4732 0.4857
Europe 0.6227 0.6490
EasternEurope 0.5449 0.5689
NorthernEurope 0.7113 0.7721
SouthernEurope 0.5566 0.5648
WesternEurope 0.7165 0.7329
Oceania 0.4193 0.4338
Worldaverage 0.4406 0.4514

62
Chapter FourWorld e-government rankings4 United Nations E-Government Survey 2010
Seychelles dropped by 35 positions. Seychelles has the best infrastructure and education indices, which explains its high ranking in the region.
Zambia (0.2810) and Zimbabwe (0.3230) both improved in e-government development. Zambia jumped 15 positions to stand at 143rd in the 2010 Survey ranking and Zimbabwe jumped 12 posi-tions to rank the 129th.
Table 4.4 E-government development in Eastern Africa
Country
E-governmentdevelopment index value
World e-government development ranking
2010 2008 2010 2008
Mauritius 0.4645 0.5086 77 63
Seychelles 0.4179 0.4942 104 69
Kenya 0.3338 0.3474 124 122
Zimbabwe 0.3230 0.3000 129 137
UnitedRepublicofTanzania 0.2926 0.2929 137 143
Madagascar 0.2890 0.3065 139 135
Uganda 0.2812 0.3133 142 133
Zambia 0.2810 0.2266 143 158
Rwanda 0.2749 0.2941 148 141
Malawi 0.2357 0.2878 159 146
Comoros 0.2327 0.1896 160 170
Mozambique 0.2288 0.2559 161 152
Djibouti 0.2059 0.2279 170 157
Ethiopia 0.2033 0.1857 172 172
Burundi 0.2014 0.1788 174 174
Eritrea 0.1859 0.1965 175 169
Somalia … … … …
Sub-regionalaverage 0.2782 0.2879
Worldaverage 0.4406 0.4514
Notwithstanding the overall low scores of the e-government development index in the region, some countries have managed to improve their Web presence either in national portals or minis-try websites.
Kenya’s national portal received the highest score in the region, followed by Mauritius and Madagascar. Ethiopia registered the third high-est online service score in the region, whilst its infrastructure and education indices hindered it from scoring higher in the e-government develop-ment index.
The websites of most ministries in the region provide basic information, but e-services are gen-erally not available. The Ministry of Education of Mauritius scored the highest among ministries in the region.
Figure 4.2 E-government development in Africa
0 0.1000 0.2000 0.3000 0.4000 0.5000
World average0.4406
Regional average0.2733
Western Africa0.2156
Southern Africa0.3505
Northern Africa0.3692
Eastern Africa0.2782
Middle Africa0.2603
Map 4.1 Sub-regions of Africa
Eastern AfricaBurundiComorosDjiboutiEritreaEthiopiaKenyaMadagascarMalawiMauritiusMayotteMozambiqueRéunionRwandaSeychellesSomaliaUgandaUnited Republic of TanzaniaZambiaZimbabwe
Middle AfricaAngolaCameroonCentral African RepublicChadCongoDemocratic Republic of the CongoEquatorial GuineaGabonSão Tomé and Príncipe
Northern AfricaAlgeriaEgyptLibyan Arab JamahiriyaMoroccoSudanTunisiaWestern Sahara
Southern AfricaBotswanaLesothoNamibiaSouth AfricaSwaziland
Western AfricaBeninBurkina FasoCape VerdeCôte d’IvoireGambiaGhanaGuineaGuinea-BissauLiberiaMaliMauritaniaNigerNigeriaSaint HelenaSenegalSierra LeoneTogo
Table 4.3 Top ranked countries in Africa
Rank Country
E-governmentdevelopment index value
World e-government development ranking
2010 2008 2010 2008
1 Tunisia 0.4826 0.3458 66 124
2 Mauritius 0.4645 0.5086 77 63
3 Egypt 0.4518 0.4767 86 79
4 SouthAfrica 0.4306 0.5115 97 61
5 Seychelles 0.4179 0.4942 104 69
6 CapeVerde 0.4054 0.4158 108 104
7 Libya 0.3799 0.3546 114 120
8 Botswana 0.3637 0.3647 117 118
9 Lesotho 0.3512 0.3805 121 114
10 Gabon 0.3420 0.3228 123 129
Worldaverage 0.4406 0.4514

63
Chapter FourWorld e-government rankings 4United Nations E-Government Survey 2010
Middle AfricaThe majority of countries in Middle Africa gener-ally scored higher in the 2010 Survey and improved their respective rankings.
Gabon (0.3420) leads the sub-region in the 2010 Survey and has moved up six positions com-pared to the 2008 Survey. This should be attributed to Gabon’s edge in infrastructure and education indices. São Tomé and Príncipe (0.3258) stands at the second position in the ranking, followed by Angola (0.3110) and Congo (0.3019).
Table 4.5 E-government development in Middle Africa
Country
E-governmentdevelopment index value
World e-government development ranking
2010 2008 2010 2008
Gabon 0.3420 0.3228 123 129
SãoToméandPríncipe 0.3258 0.3215 128 130
Angola 0.3110 0.3328 132 127
Congo 0.3019 0.2737 135 148
EquatorialGuinea 0.2902 0.2890 138 145
Cameroon 0.2722 0.2734 149 149
DemocraticRepublicoftheCongo 0.2357 0.2177 158 162
CentralAfricanRepublic 0.1399 0.1412 181 179
Chad 0.1235 0.1047 182 182
Sub-regionalaverage 0.2603 0.2530
Worldaverage 0.4406 0.4514
In the area of ‘online service assessment’, Cameroon’s ministries of health and education enjoyed the highest scores among all ministries in the region. These ministries were the only ones in the region to benefit from some degree of citi-zen involvement.
Northern AfricaThe region as a whole performed better in the 2010 Survey. Tunisia (0.4826) received the high-est score in the region, followed by Egypt (0.4518), Libya (0.3799) and Morocco (0.3287). Tunisia’s Ministry of Finance provides a number of e-services and a wealth of information and scored the highest among all ministries in the region. In addition, each ministry’s websites in Tunisia (health, education, labour and social services) all receive the highest scores in the region in its respective category.
Egypt stands the second in the regional rank-ing, but its national portal enjoys the highest rank-ing in the region. Egypt and Algeria both regressed
in the 2010 Survey, falling to the 86th and 131st positions respectively. Morocco has jumped 14 po-sitions to a global rank of 126th. Libya and Sudan have improved their rankings as well since the 2008 Survey.
Libya continues to lead in the human capacity index, followed by Tunisia and Algeria. The tele-communication infrastructure in the region re-mains low compared to other regions, with Tunisia having the highest infrastructure index. Morocco leads the region with the highest ratio of Internet users per 100 inhabitants.
Table 4.6 E-government development in Northern Africa
Country
E-governmentdevelopment index value
World e-government development ranking
2010 2008 2010 2008
Tunisia 0.4826 0.3458 66 124
Egypt 0.4518 0.4767 86 79
Libya 0.3799 0.3546 114 120
Morocco 0.3287 0.2944 126 140
Algeria 0.3181 0.3515 131 121
Sudan 0.2542 0.2186 154 161
Sub-regionalaverage 0.3692 0.3403
Worldaverage 0.4406 0.4514
Box 4.3 AfriAfya, Kenya
Kenya:AfriAfya
http://www.afriafya.org/
AfriAfya,theAfricanNetworkforHealthKnowledgeManagementand
CommunicationiscomprisedofsevenofthelargesthealthNGOsin
KenyawiththegoalofharnessingICTstoimprovecommunityhealth
in rural and other marginalized Kenyan communities. The network
provides communities with relevant up-to-date health information
throughatwo-waycommunicationwithhealth-careproviders.
Box 4.4 Cyber Ethiopia
Ethiopia:CyberEthiopia
http://www.cyberethiopia.com
TheAmhariclanguagehasAfrica’soldestscript,whichhasbeenused
forwrittencommunicationsince100B.C.TheCyberEthiopiainitiative
hasconvertedtheAmharicscriptsothatitisWeb-friendly,responding
to the challenge of digital multilingualism and the development of
the local script fordigitaluse.Theuseof theAmharic scripton the
InternetfacilitatesEthiopia’sdigitalinclusionandfullparticipationin
theinformationsociety.

64
Chapter FourWorld e-government rankings4 United Nations E-Government Survey 2010
Southern AfricaAll the countries in Southern Africa scored lower in the 2010 Survey than they did two years ago. South Africa (0.4306) continues to lead the re-gion, but it also witnessed the most dramatic drop in rank, to 97th in the 2010 Survey. Botswana, Lesotho and Namibia have maintained the similar e-government rankings in 2010 Survey as com-pared to the 2008 Survey. Swaziland did not re-ceive any scores in the online service index because none of its websites could be opened during the review period.
The Western Africa region is the lowest rank-ing region in the 2010 Survey, showing virtually no improvement since the 2008 Survey. This should be mainly attributed to poor telecommunications infrastructure and low human capacity in the re-gion. Broadband access is practically non-existent in the region, and the best case is Cape Verde with only 1.48 subscribers per 100 inhabitants.
Table 4.7 E-government development in Southern Africa
Country
E-governmentdevelopment index value
World e-government development ranking
2010 2008 2010 2008
SouthAfrica 0.4306 0.5115 97 61
Botswana 0.3637 0.3647 117 118
Lesotho 0.3512 0.3805 121 114
Namibia 0.3314 0.3445 125 126
Swaziland 0.2757 0.3454 145 125
Sub-regionalaverage 0.3505 0.3893
Worldaverage 0.4406 0.4514
Cape Verde (0.4054) leads the regions thanks to its higher telecommunication infrastructure and human capacity components, followed by Côte d’Ivoire (0.2805) and Ghana (0.2754).
Côte d’Ivoire enjoys the highest online service score followed by Cape Verde, Mali, Senegal and Burkina Faso. Côte d’Ivoire also experienced the most significant change in rankings as compared to the 2008 Survey, gaining 29 positions to rank 144th globally. Côte d’Ivoire barely had a Web presence in 2008 but the current survey finds that the na-tional and ministry websites are much more robust and offer a wealth of information. Mauritania also improved its ranking by 9 positions from the 2008 Survey to rank 157th globally. Other countries re-mained essentially unchanged in global rankings.
Western AfricaTable 4.8 E-government development in Western Africa
Country
E-governmentdevelopment index value
World e-government development ranking
2010 2008 2010 2008
CapeVerde 0.4054 0.4158 108 104
Côted'Ivoire 0.2805 0.1853 144 173
Ghana 0.2754 0.2997 147 138
Nigeria 0.2687 0.3063 150 136
Mauritania 0.2359 0.2028 157 168
Senegal 0.2241 0.2531 163 153
Togo 0.2150 0.2191 165 160
Liberia 0.2133 0.2170 166 163
Gambia 0.2117 0.2253 167 159
Benin 0.2017 0.1860 173 171
Mali 0.1815 0.1591 176 175
SierraLeone 0.1697 0.1463 177 178
BurkinaFaso 0.1587 0.1542 178 176
Guinea-Bissau 0.1561 0.1521 179 177
Guinea 0.1426 0.1402 180 180
Niger 0.1098 0.1142 183 181
Sub-regionalaverage 0.2156 0.2110
Worldaverage 0.4406 0.4514
Any substantive progress in e-government de-velopment in the region is likely to be a long way off, given its poor telecommunication infrastructure, low human resources capacity and the amount of in-vestment required – which far exceeds the financial capacity of the region. Despite limited resources, a few countries managed to improve their e-govern-ment. The national website of Benin features pod-casting and online forums with a dozen thematic areas for its citizen’s participation. Ghana’s national website utilizes a ‘social media’ box featuring tools such as YouTube and containing direct links to the Facebook accounts of government officials in the Ministry of Information.
Box 4.5 Algeria alerts citizens to their new national hotline for H1N1
Algeria:H1N1NationalHotline
http://www.ands.dz/
OnthenationalportalofAlgeriahttp://www.ands.dz/thereisalink
titled“AlerteGrippePorcine”,fortheH1N1flu.Thefeaturetakesthe
user toaportalpagewithaspecificsection forhealthcareprofes-
sionalsalongwithresourcesforcitizenswithlinkstoinformationand
medicalresources,anewtelephonehotlinenumber,audiosfromradio
spotssharinginformationonsymptomstowatchforandhygienepro-
tocol,andweeklyhealthnewslettershavebeenarchived.

65
Chapter FourWorld e-government rankings 4United Nations E-Government Survey 2010
4.2.2 E-government in the AmericasFigure 4.3 illustrates that the status of e-government development in Northern America, which is far ahead of other regions. The region’s two countries, the United States and Canada, enjoy the second and third global ranking respectively in the 2010 Survey. Central America is the only region in the Americas that registered a regional average below that of the world average, though many developing countries in this region scored above the world average.
Among the top 10 countries in the Americas, five countries are from South America, three are from the Caribbean, and one is from Central America.
CaribbeanIn the 2010 Survey, the Caribbean region wit-nessed some improvement and consequently el-evated its score above the world average. In the 2008 Survey, its e-government development index was slightly below the world average.
Table 4.10 E-government development in the Caribbean
Country
E-governmentdevelopment index value
World e-government development ranking
2010 2008 2010 2008
Barbados 0.5714 0.5667 40 46
AntiguaandBarbuda 0.5154 0.4485 55 96
Bahamas 0.4871 0.4911 65 71
TrinidadandTobago 0.4806 0.5307 67 54
SaintKittsandNevis 0.4691 0.4814 75 78
DominicanRepublic 0.4557 0.4943 84 68
SaintLucia 0.4471 0.4746 88 80
Jamaica 0.4467 0.4679 89 85
SaintVincentandtheGrenadines 0.4355 0.4306 94 98
Cuba 0.4321 0.3990 96 111
Grenada 0.4277 0.4545 99 92
Dominica 0.4149 0.3746 105 116
Haiti 0.2074 0.2097 169 165
Sub-regionalaverage 0.4454 0.4480
Worldaverage 0.4406 0.4514
Barbados (0.5714) continues to lead the region thanks to its better telecommunication infrastruc-ture and higher adult literacy and gross enrolment, followed by Antigua and Barbuda (0.5154) and the Bahamas (0.4871). Barbados leads the Caribbean in both Internet users and broadband subscribers per 100 inhabitants. This advantage allowed Barbados to maintain its e-government edge despite the fact that other countries scored more highly in online services.
Table 4.9 Top ranked countries in the Americas
Rank Country
E-governmentdevelopment index value
World e-government development ranking
2010 2008 2010 2008
1 UnitedStates 0.8510 0.8644 2 4
2 Canada 0.8448 0.8172 3 7
3 Colombia 0.6125 0.5317 31 52
4 Chile 0.6014 0.5819 34 40
5 Uruguay 0.5848 0.5645 36 48
6 Barbados 0.5714 0.5667 40 46
7 Argentina 0.5467 0.5844 48 39
8 AntiguaandBarbuda 0.5154 0.4485 55 96
9 Mexico 0.5150 0.5893 56 37
10 Brazil 0.5006 0.5679 61 45
Worldaverage 0.4406 0.4514
Figure 4.3 E-government development in the Americas
0 0.1000 0.2000 0.3000 0.4000 0.5000 0.6000 0.7000 0.8000 0.9000
World average0.4406
Regional average0.4790
Northern America0.8479
Central America0.4295
South America0.4869
Caribbean0.4454
Map 4.2 Sub-regions of the Americas
CaribbeanAnguillaAntigua and BarbudaArubaBahamasBarbadosBritish Virgin IslandsCayman IslandsCubaDominicaDominican RepublicGrenadaGuadeloupeHaitiJamaicaMartiniqueMontserratNetherlands AntillesPuerto RicoSaint-BarthélemySaint Kitts and NevisSaint LuciaSaint Martin (French part)Saint Vincent and the GrenadinesTrinidad and TobagoTurks and Caicos IslandsUnited States Virgin Islands
Northern AmericaBermudaCanadaGreenlandSaint Pierre and MiquelonUnited States of America
Central AmericaBelizeCosta RicaEl SalvadorGuatemalaHondurasMexicoNicaraguaPanama
South AmericaArgentinaBoliviaBrazilChileColombiaEcuadorFalkland Islands (Malvinas)French GuianaGuyanaParaguayPeruSurinameUruguayVenezuela

66
Chapter FourWorld e-government rankings4 United Nations E-Government Survey 2010
Barbados is the first country in the region to have an integrated single-sign-on service for its na-tional portal. Single-sign-on services allow citizens greater ease and flexibility in performing necessary online tasks with the government.
Antigua and Barbuda saw the biggest increase in the global ranking by 41 positions to rank 55th globally. Cuba and Dominica also had their rank-ings increase significantly over the 2008 Survey by 15 and 11 positions respectively. Cuba is now ranked 96th and Dominica 105th globally.
The Dominican Republic, Trinidad and Tobago and Cuba led the region in the area of online ser-vices. Top scores in ministry sites were received by Education and Labour in the Dominican Republic along with the Ministry of Health in Cuba.
The Dominican Republic’s Ministry of Labour offers key user services to citizens, including Empleateya.net, an employment seeking portal with polls and online form submissions and a re-lated website, FlujoMigratorio, for tracking emi-gration and employment in Spain.
The national portal for Grenada integrates great design with social media elements that enable its citizens, especially youth, to share information on social networking platforms with the government.
The Ministry of Finance of Trinidad and Tobago has implemented a Web-based procurement tool, Finance.gov.tt, that allows suppliers to bid online for contracts to supply of goods or services.
Central America The region of Central America has regressed in relative terms since the 2008 Survey, when it scored higher above the world average. In the 2010 Survey, its e-government scoring falls below the world av-erage. The vast majority of countries in the region received lower scores in the 2010 Survey as com-pared to the 2008 Survey. Mexico (0.5150) leads the region followed by Costa Rica (0.4749) and El Salvador (0.4700).
Mexico experienced the most significant drop in global rankings. It fell by 19 positions from the 2008 Survey to the 2010 Survey and is currently ranked 56th globally. The degeneration of Mexico’s e-government is mainly attributed to the much lower score for online services, which dropped from 0.7057 to 0.4413. The following countries
also saw significant drops, with Costa Rica down by 12 positions, Guatemala by 13 positions and Belize by 13 positions.
Table 4.11 E-government development in Central America
Country
E-governmentdevelopment index value
World e-government development ranking
2010 2008 2010 2008
Mexico 0.5150 0.5893 56 37
CostaRica 0.4749 0.5144 71 59
ElSalvador 0.4700 0.4974 73 67
Panama 0.4619 0.4718 79 83
Honduras 0.4065 0.4048 107 110
Guatemala 0.3937 0.4283 112 99
Nicaragua 0.3630 0.3668 118 117
Belize 0.3513 0.4102 120 107
Sub-regionalaverage 0.4295 0.4604
Worldaverage 0.4406 0.4514
Northern AmericaThe United States and Canada continue to score high in the 2010 Survey. The United States (0.8510) was ranked the second and Canada (0.8448) was ranked the third globally. The United States and Canada were also ranked the second and the third respectively in the online service index. Both countries have well-developed portals with a wide spectrum of e-services for their citizens. They have both created a favorable environment to encourage citizens to participate in decision-making around political issues and to provide feedback.
Table 4.12 E-government development in Northern America
Country
E-governmentdevelopment index value
World e-government development ranking
2010 2008 2010 2008
UnitedStates 0.8510 0.8644 2 4
Canada 0.8448 0.8172 3 7
Sub-regionalaverage 0.8479 0.8408
Worldaverage 0.4406 0.4514
Canada has a strong online presence with a na-tional portal that offers quick access to government programmes and information on popular services. It links to Service Canada, a robust e-services portal for citizens, Canada Business for entrepre-neurs and Canada International for Canadians living abroad. The national portal also has a ‘My Government Account’ feature that provides a

67
Chapter FourWorld e-government rankings 4United Nations E-Government Survey 2010
single point of access for a citizen to manage a personalized set of links to the information and services offered by the Government of Canada. A mobile wireless portal is being developed to pro-vide news, directories and other information.
The national portal of the United States is a leader in e-government. The USA.gov homepage links to more than 100 online government services and transactions. A navigational tool bar organizes information in categories for citizens, business and non-profit organizations, government employees, and visitors to the country. It then breaks these cat-egories down even further so users can quickly lo-cate the information and services. In addition, the national portal also offers its general information in 88 languages with extensive online services for for-eigners wishing to conduct business, work, study and travel in the United States. It also includes live per-sonal assistance via ‘Live Help/Web Chat’. The site also makes it very easy to connect and communicate with the government via social media tools such as YouTube, Twitter, Facebook and the ‘Gov Gab Blog’, where bloggers share tips and information from the Federal government and where citizens can com-ment and share their own experiences.
In response to the global economic crisis, the national portal also provides a link to Recovery.gov, which offers information and data on the cur-rent economic crisis, tracking of the recovery fund-ing, and how citizens can benefit from it.
South AmericaColombia (0.6125) enjoys the highest global rank-ing in the region in the 2010 Survey, climbing by 21 positions from the 2008 Survey. It ranked higher than Chile, Argentina, Brazil and Uruguay. Chile (0.6014) and Uruguay (0.5848) stand second and third in the region.
The national portal of Colombia features a vari-ety of online services, especially with the procedures and services section, which allows citizens to search by department or region. The site also provides a link to Programa Gobierno en Linea, a comprehensive and user-friendly information resource about e-gov-ernment activities that is easy to navigate. Colombia’s national website also features e-Cuidadano, an ini-tiative on digital literacy through which citizens can take courses and become certified.
The website of the Ministry of Labour of Peru was the only ministry site in the region to offer a page, Revalora Perú, dedicated to unemployment in light of the global economic crisis. It explains the government’s reponse and features a special programme on labour restructuring and govern-ment stimulus activities.
Table 4.13 E-government development in South America
Country
E-governmentdevelopment index value
World e-government development ranking
2010 2008 2010 2008
Colombia 0.6125 0.5317 31 52
Chile 0.6014 0.5819 34 40
Uruguay 0.5848 0.5645 36 48
Argentina 0.5467 0.5844 48 39
Brazil 0.5006 0.5679 61 45
Peru 0.4923 0.5252 63 55
Venezuela 0.4774 0.5095 70 62
Ecuador 0.4322 0.4840 95 75
Bolivia 0.4280 0.4867 98 72
Paraguay 0.4243 0.4654 101 88
Guyana 0.4140 0.4375 106 97
Suriname 0.3283 0.3472 127 123
Sub-regionalaverage 0.4869 0.5072
Worldaverage 0.4406 0.4514
Box 4.6 Panama’s Primera Dama
Panama:TheFirstLady’swebsitePrimeraDama
http://www.presidencia.gob.pa
TheFirstLady’swebsitePrimeraDamaismakingaconsiderableeffort
tosupportthepoorandwomen.Hersitecanbebrowsedbyadirect
linkfromthenationalwebsiteandhasanationalcampaignof‘NoVio-
lenceAgainstWomen’.InconjunctionwiththeMinistryofAgricultural
Development, a micro-credit initiative was implemented to support
ruralandindigenouswomen.Theinitiative,whichispromotedonthe
FirstLady’swebsite, isgearedto improvingtheeconomicactivity in
thecommunitythatisdedicatedtodomesticactivitiesandproduction
forfoodconsumption.
Box 4.7 Guatemala e-procurement
Guatemala:E-procurementWebsite
http://www.guatecompras.gt/
Guatemala has well-organized e-procurement website linked di-
rectlyfromthenationalwebsiteaswellasfrommostoftheministry
websites. Itprovides informationaboutthecontractsandprocure-
ment system of the state, with comprehensive e-government fea-
tures and services including registration with authentication and
viewingofcontractsawarded.Itlistsallopportunitiesforsuppliers
andproductsforbuyers.

68
Chapter FourWorld e-government rankings4 United Nations E-Government Survey 2010
Uruguay offers customized online services through Mi Portal, a prominent link on the home page of the national website. Mi Portal offers strong online features organized by thematic areas for citizens, business and government.
Argentina’s Ministry of Health provides an offi-cial page on the H1N1 flu virus with downloadable videos, informational pamphlets and links to virtual libraries. Argentina’s Ministry of Labour dedicates sections of its homepage to special topics such as child labour, women in the workplace and war veterans.
Bolivia’s Ministry of Health and Sports (Social Welfare) offers a one-stop portal at Promocion de la Salud that covers special topics ranging from gen-der violence to environmental health to disability.
4.2.3 E-government in AsiaThe Asian region presents a mixed picture with Eastern Asia far exceeding the world average for e-government development while Southern Asia lags far behind, as illustrated in figure 4.4. This dichot-omy also mirrors the income disparities between the two regions. Central and South-Eastern Asia are slightly lower than the world average, while Western Asia is above the world average.
Table 4.14 shows that the Republic of Korea, Singapore and Bahrain enjoy the top three rank-ings in the region. Five countries from Western Asia made the top 10 in the region. Eastern Asia and South-East Asia, each had two countries in the top 10, while Central Asia had one country in the top 10.
Central AsiaTable 4.15 E-government development in Central Asia
Country
E-governmentdevelopment index value
World e-government development ranking
2010 2008 2010 2008
Kazakhstan 0.5578 0.4743 46 81
Uzbekistan 0.4498 0.4057 87 109
Kyrgyzstan 0.4417 0.4195 91 102
Tajikistan 0.3477 0.3150 122 132
Turkmenistan 0.3226 0.3262 130 128
Sub-regionalaverage 0.4239 0.3881
Worldaverage 0.4406 0.4514
Central Asia has made the most significant improvement as a region from the 2008 Survey, with Kazakhstan (0.5578) making one of the most dramatic leaps in the 2010 Survey to continue
Figure 4.4 E-government development in Asia
0 0.1000 0.2000 0.3000 0.4000 0.5000 0.6000 0.7000
World average0.4406
Regional average0.4424
Western Asia0.4732
South-Eastern Asia0.4250
Central Asia0.4239
Eastern Asia0.6470
Southern Asia0.3248
Map 4.3 Sub-regions of Asia
Eastern AsiaChinaHong Kong Special Administrative Region of ChinaMacao Special Administrative Region of ChinaDemocratic People’s Republic of KoreaJapanMongoliaRepublic of Korea
South-Eastern AsiaBrunei DarussalamCambodiaIndonesiaLao People’s Democratic RepublicMalaysiaMyanmarPhilippinesSingaporeThailandTimor-LesteViet Nam
Central AsiaKazakhstanKyrgyzstanTajikistanTurkmenistanUzbekistan
Southern AsiaAfghanistanBangladeshBhutanIndiaIran (Islamic Republic of)MaldivesNepalPakistanSri Lanka
Western AsiaArmeniaAzerbaijanBahrainCyprusGeorgiaIraqIsraelJordanKuwaitLebanonOmanQatarSaudi ArabiaSyrian Arab RepublicTurkeyUnited Arab EmiratesYemen
Table 4.14 Top ranked countries in Asia
Rank Country
E-governmentdevelopment index value
World e-government development ranking
2010 2008 2010 2008
1 RepublicofKorea 0.8785 0.8317 1 6
2 Singapore 0.7476 0.7009 11 23
3 Bahrain 0.7363 0.5723 13 42
4 Japan 0.7152 0.7703 17 11
5 Israel 0.6552 0.7393 26 17
6 Malaysia 0.6101 0.6063 32 34
7 Cyprus 0.5705 0.6019 42 35
8 Kazakhstan 0.5578 0.4743 46 81
9 UnitedArabEmirates 0.5349 0.6301 49 32
10 Kuwait 0.5290 0.5202 50 57
Worldaverage 0.4406 0.4514

69
Chapter FourWorld e-government rankings 4United Nations E-Government Survey 2010
to lead the region. Uzbekistan, Kyrgyzstan and Tajikistan have all improved their national and ministry websites.
Among national portals, Kyrgyzstan received the highest ranking in the region. The national portal includes transactional aspects and was is strong on citizen engagement.
Eastern AsiaThe Republic of Korea (0.8785) was the highest ranking country in the 2010 Survey and its na-tional portal also received the highest ranking. It scored particularly high in providing e-services and tools for citizen engagement. The ministries of health, education and social welfare scored the highest among ministries.
Table 4.16 E-government development in Eastern Asia
Country
E-governmentdevelopment index value
World e-government development ranking
2010 2008 2010 2008
RepublicofKorea 0.8785 0.8317 1 6
Japan 0.7152 0.7703 17 11
Mongolia 0.5243 0.4735 53 82
China 0.4700 0.5017 72 65
DemocraticPeople'sRepublicofKorea … … … …
Sub-regionalaverage 0.6470 0.6443
Worldaverage 0.4406 0.4514
Japan (0.7152) ranked second in the region in the 2010 Survey, dropping down one place from the previous survey. Mongolia (0.5243) gained 29 positions to be ranked 53rd globally, a dramatic rise due primarily by efforts to en-hance its national portal and ministry websites to offer more e-services available and more on-line content.
China fell slightly in the 2010 Survey and the Democratic People’s Republic of Korea has a very limited Web presence as in the 2008 Survey.
The national portal of Japan was ranked the second highest in Asia. The portal is rich in e-infor-mation and content and provides extensive links to ministries and key government resources.
The Ministry of Finance of Mongolia scored the highest in the region for its category. Its portal provides comprehensive e-services and opportuni-ties for citizens to provide feedback.
The Ministry of Finance of Mongolia provides a portal for e-procurement where users can regis-ter for online bids, sort through different types of tenders, see upcoming tenders, and find out results of previous tenders. E-Procurement is available in the Mongolian and English languages. There is a newsletter and additional information regarding legislation, bidding and guidelines.
Southern AsiaTable 4.17 E-government development in Southern Asia
Country
E-governmentdevelopment index value
World e-government development ranking
2010 2008 2010 2008
Maldives 0.4392 0.4491 92 95
Iran(IslamicRep.of) 0.4234 0.4067 102 108
SriLanka 0.3995 0.4244 111 101
India 0.3567 0.3814 119 113
Bangladesh 0.3028 0.2936 134 142
Pakistan 0.2755 0.3160 146 131
Bhutan 0.2598 0.3074 152 134
Nepal 0.2568 0.2725 153 150
Afghanistan 0.2098 0.2048 168 167
Sub-regionalaverage 0.3248 0.3395
Worldaverage 0.4406 0.4514
In this region, most portals and websites have remained stagnant since the 2008 Survey in terms of developing new features. As a result, the region as a whole has regressed in the 2010 Survey and remains far below the world average. Maldives (0.4392) continues to lead the region because it gained the highest scores for infrastructure and education indices. Nevertheless, its online services received very low scores and made very limited progress in overall e-government development. Iran (0.4234) and Bangladesh (0.3028) are the two
Box 4.8 Kazakhstan – putting citizens first
Kazakhstan:User-friendlysite
E-Gov.kz
ThenationalwebsiteofKazakhstanisauser-friendlyone-stop-shopthat
allowsaoneclickaccesstoE-Gov.kz,thecountry’se-governmentportal,
whichoffersacomprehensiveselectionofe-servicesforcitizens.Thepor-
talalsoprovidesinformationonthenationale-governmentdevelopment
programme with 17 different projects aimed at improving services to
thecitizeninaconvenient(online)andcost-effectivemanner.E-services
includee-payments,e-documents,e-registrations,e-signatures,e-forms,
etc.Theportalalsocontainsvideosandeducationalprogrammesforchil-
dren,onlinediscussionsandconsultations,andothercitizenengagement
tools.Thisdistinctiveapproachisintendedtoenhancetheroleofthegov-
ernmentandfacilitatebuildingcitizens’trustingovernmentauthoritiest.
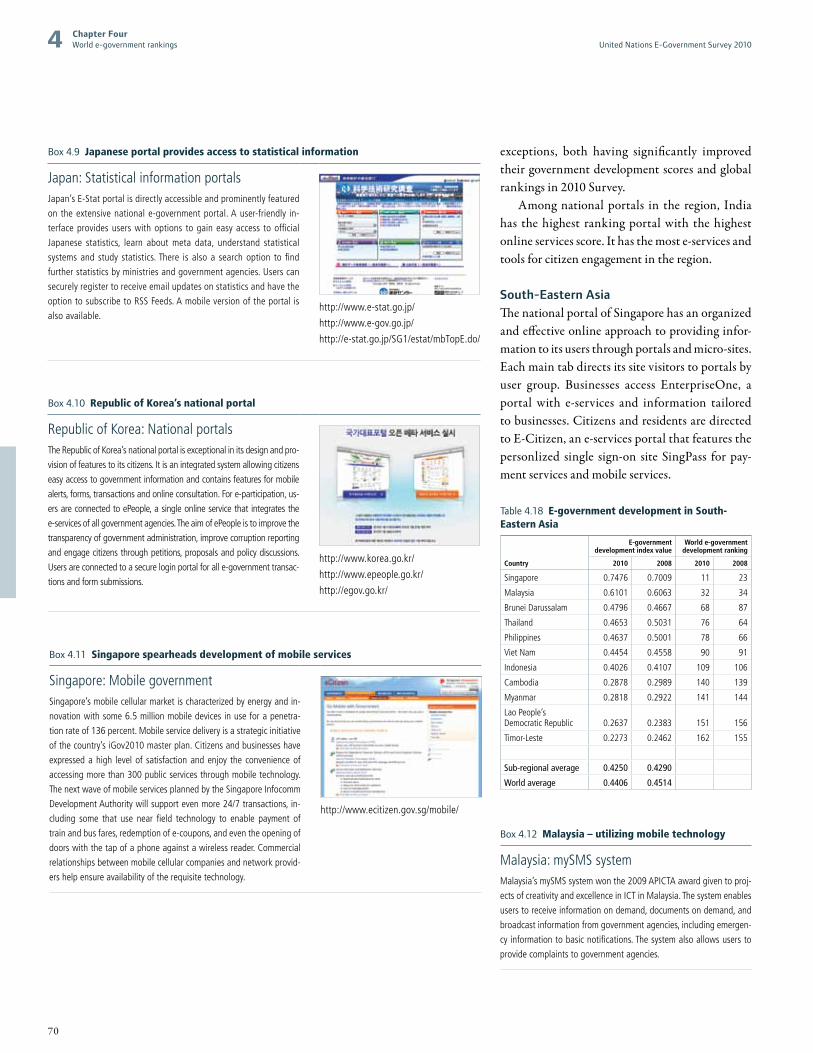
70
Chapter FourWorld e-government rankings4 United Nations E-Government Survey 2010
exceptions, both having significantly improved their government development scores and global rankings in 2010 Survey.
Among national portals in the region, India has the highest ranking portal with the highest online services score. It has the most e-services and tools for citizen engagement in the region.
South-Eastern AsiaThe national portal of Singapore has an organized and effective online approach to providing infor-mation to its users through portals and micro-sites. Each main tab directs its site visitors to portals by user group. Businesses access EnterpriseOne, a portal with e-services and information tailored to businesses. Citizens and residents are directed to E-Citizen, an e-services portal that features the personlized single sign-on site SingPass for pay-ment services and mobile services.
Table 4.18 E-government development in South-Eastern Asia
Country
E-governmentdevelopment index value
World e-government development ranking
2010 2008 2010 2008
Singapore 0.7476 0.7009 11 23
Malaysia 0.6101 0.6063 32 34
BruneiDarussalam 0.4796 0.4667 68 87
Thailand 0.4653 0.5031 76 64
Philippines 0.4637 0.5001 78 66
VietNam 0.4454 0.4558 90 91
Indonesia 0.4026 0.4107 109 106
Cambodia 0.2878 0.2989 140 139
Myanmar 0.2818 0.2922 141 144
LaoPeople’sDemocraticRepublic 0.2637 0.2383 151 156
Timor-Leste 0.2273 0.2462 162 155
Sub-regionalaverage 0.4250 0.4290
Worldaverage 0.4406 0.4514
Box 4.12 Malaysia – utilizing mobile technology
Malaysia:mySMSsystemMalaysia’smySMSsystemwonthe2009APICTAawardgiventoproj-
ectsofcreativityandexcellenceinICTinMalaysia.Thesystemenables
userstoreceiveinformationondemand,documentsondemand,and
broadcastinformationfromgovernmentagencies,includingemergen-
cyinformationtobasicnotifications.Thesystemalsoallowsusersto
providecomplaintstogovernmentagencies.
Box 4.9 Japanese portal provides access to statistical information
Japan:Statisticalinformationportals
http://www.e-stat.go.jp/
http://www.e-gov.go.jp/
http://e-stat.go.jp/SG1/estat/mbTopE.do/
Japan’sE-Statportalisdirectlyaccessibleandprominentlyfeatured
ontheextensivenationale-governmentportal.Auser-friendly in-
terfaceprovidesuserswithoptions togaineasyaccess toofficial
Japanese statistics, learn about meta data, understand statistical
systemsand study statistics.There isalsoa searchoption tofind
furtherstatisticsbyministriesandgovernmentagencies.Userscan
securelyregistertoreceiveemailupdatesonstatisticsandhavethe
optiontosubscribetoRSSFeeds.Amobileversionoftheportalis
alsoavailable.
Box 4.10 Republic of Korea’s national portal
RepublicofKorea:Nationalportals
http://www.korea.go.kr/
http://www.epeople.go.kr/
http://egov.go.kr/
TheRepublicofKorea’snationalportalisexceptionalinitsdesignandpro-
visionoffeaturestoitscitizens.Itisanintegratedsystemallowingcitizens
easyaccesstogovernmentinformationandcontainsfeaturesformobile
alerts,forms,transactionsandonlineconsultation.Fore-participation,us-
ersareconnectedtoePeople,asingleonlineservicethatintegratesthe
e-servicesofallgovernmentagencies.TheaimofePeopleistoimprovethe
transparencyofgovernmentadministration,improvecorruptionreporting
andengagecitizensthroughpetitions,proposalsandpolicydiscussions.
Usersareconnectedtoasecureloginportalforalle-governmenttransac-
tionsandformsubmissions.
Box 4.11 Singapore spearheads development of mobile services
Singapore:Mobilegovernment
http://www.ecitizen.gov.sg/mobile/
Singapore’smobilecellularmarketischaracterizedbyenergyandin-
novationwithsome6.5millionmobiledevicesinuseforapenetra-
tionrateof136percent.Mobileservicedeliveryisastrategicinitiative
ofthecountry’siGov2010masterplan.Citizensandbusinesseshave
expressedahigh levelof satisfactionandenjoy the convenienceof
accessingmorethan300publicservicesthroughmobiletechnology.
ThenextwaveofmobileservicesplannedbytheSingaporeInfocomm
DevelopmentAuthoritywillsupportevenmore24/7transactions,in-
cluding some that use near field technology to enable payment of
trainandbusfares,redemptionofe-coupons,andeventheopeningof
doorswiththetapofaphoneagainstawirelessreader.Commercial
relationshipsbetweenmobilecellularcompaniesandnetworkprovid-
ershelpensureavailabilityoftherequisitetechnology.

71
Chapter FourWorld e-government rankings 4United Nations E-Government Survey 2010
Western AsiaThe majority of countries in this region have wit-nessed noticeable changes in their respective rank-ings. Bahrain (0.7363) has emerged as the new leader in the region.
Launched in early 2009, Bahrain’s e-govern-ment portal system provides its citizens with a wealth of information, e-services and links to national and ministry sites. ‘E-Government for a Better Life’ is the motto for the government’s initiative. E-participation and citizen engagement features are accessible throughout the portal sites. The government publishes a Customer Charter available in the page footer.
Table 4.19 E-government development in Western Asia
Country
E-governmentdevelopment index value
World e-government development ranking
2010 2008 2010 2008
Bahrain 0.7363 0.5723 13 42
Israel 0.6552 0.7393 26 17
Cyprus 0.5705 0.6019 42 35
UnitedArabEmirates 0.5349 0.6301 49 32
Kuwait 0.5290 0.5202 50 57
Jordan 0.5278 0.5480 51 50
SaudiArabia 0.5142 0.4935 58 70
Qatar 0.4928 0.5314 62 53
Turkey 0.4780 0.4834 69 76
Oman 0.4576 0.4691 82 84
Azerbaijan 0.4571 0.4609 83 89
Lebanon 0.4388 0.4840 93 74
Georgia 0.4248 0.4598 100 90
Armenia 0.4025 0.4182 110 103
SyrianArabRepublic 0.3103 0.3614 133 119
Iraq 0.2996 0.2690 136 151
Yemen 0.2154 0.2142 164 164
Sub-regionalaverage 0.4732 0.4857
Worldaverage 0.4406 0.4514
Israel (0.6552), Cyprus (0.5705) and United Arab Emirates (0.5349), were ranked as the second, the third and the fourth in the region. Although Israel scored lower in the 2010 Survey, its Ministries of Finance and Labour scored the highest in the region. The national portal of Cyprus scored high within the region; it provided e-tools to empower citizens to dialogue with the government.
Iraq, Oman, Saudi Arabia and Turkey im-proved their rankings in the 2010 Survey, while Azerbaijan, Jordan, Kuwait, Lebanon and Syria dropped to lower positions.
Oman’s Ministry of Education promotes e-learning by having its own e-learning system that features virtual classrooms and a self-learning sys-tem. Communication can occur via audio, video and text. The Ministry also employs an SMS feature for parents. Through Oman Mobile, the Ministry has set up a system that allows parents to follow their children’s school performance on mo-bile phones. Parents can track student attendance, receive calls to visit the school, learn about tem-porary suspensions, pull student ID, and receive grade reports.
Saudi Arabia’s national portal features links to 215 e-services. While not a single-sign-on system, the electronic portal easily connects its citizens to the online services of various government agen-cies for such purposes as obtaining personal docu-ments, filing complaints, utilizing business services and paying utilities. In conjunction with this direc-tory of e-services is SADAD, an e-payment system through which the Kingdom of Saudi Arabia fa-cilitates and streamlines bill payment transactions.
4.2.4 E-government in EuropeAll European sub-regions excel in the e-government development index and achieve high scores far above world average. Drawing on the advantages of the well-developed telecommunication infrastructure and high human resources capacity, Western and Northern Europe perform especially well in e-gov-ernment development, followed by Southern and Eastern Europe. Many countries in Europe are high-income developed countries, and this advantage is reflected in the ranking shown in figure 4.5.
Table 4.20 Top ranked countries in Europe
Rank Country
E-governmentdevelopment index value
World e-government development ranking
2010 2008 2010 2008
1 UnitedKingdom 0.8147 0.7872 4 10
2 Netherlands 0.8097 0.8631 5 5
3 Norway 0.8020 0.8921 6 3
4 Denmark 0.7872 0.9134 7 2
5 Spain 0.7516 0.7228 9 20
6 France 0.7510 0.8038 10 9
7 Sweden 0.7474 0.9157 12 1
8 Germany 0.7309 0.7136 15 22
9 Belgium 0.7225 0.6779 16 24
10 Switzerland 0.7136 0.7626 18 12
Worldaverage 0.4406 0.4514

72
Chapter FourWorld e-government rankings4 United Nations E-Government Survey 2010
Table 4.20 shows that the United Kingdom emerged as the new leader in Europe in the 2010 Survey, followed by the Netherlands. In the top 10 list, Western Europe had five countries, Northern Europe had four countries, Southern Europe had one country and there were no countries from Eastern Europe.
Eastern EuropeThe region as a whole has not changed much since the 2008 Survey. In the 2010 Survey, Hungary (0.6315) has moved ahead of the Czech Republic (0.6060) to lead the region. The national portal of Hungary was ranked the highest in the region. Poland and Ukraine moved down in the rankings. The Republic of Moldova (0.4611) moved up 13 positions to be ranked 80th globally.
Table 4.21 E-government development in Eastern Europe
Country
E-governmentdevelopment index value
World e-government development ranking
2010 2008 2010 2008
Hungary 0.6315 0.6494 27 30
CzechRepublic 0.6060 0.6696 33 25
Slovakia 0.5639 0.5889 43 38
Bulgaria 0.5590 0.5719 44 43
Poland 0.5582 0.6134 45 33
Romania 0.5479 0.5383 47 51
Ukraine 0.5181 0.5728 54 41
RussianFederation 0.5136 0.5120 59 60
Belarus 0.4900 0.5213 64 56
RepublicofMoldova 0.4611 0.4510 80 93
Sub-regionalaverage 0.5449 0.5689
Worldaverage 0.4406 0.4514
The website of the Ministry of Finance of Ukraine scored the highest among ministries based on its con-tent and citizen engagement, although e-services were limited. The Ministry of Finance of Romania also scored high for the region due to the availability of a number of e-services as well as extensive content.
Northern EuropeTable 4.22 E-government development in Northern Europe
Country
E-governmentdevelopment index value
World e-government development ranking
2010 2008 2010 2008
UnitedKingdom 0.8147 0.7872 4 10
Norway 0.8020 0.8921 6 3
Denmark 0.7872 0.9134 7 2
Sweden 0.7474 0.9157 12 1
Finland 0.6967 0.7488 19 15
Estonia 0.6965 0.7600 20 13
Ireland 0.6866 0.7296 21 19
Iceland 0.6697 0.7176 22 21
Lithuania 0.6295 0.6617 28 28
Latvia 0.5826 0.5944 37 36
Sub-regionalaverage 0.7113 0.7721
Worldaverage 0.4406 0.4514
The United Kingdom (0.8147) enjoys the highest ranking in Europe. The national portal of the United Kingdom was ranked the third in the 2010 Survey. The Scandinavian countries as a whole scored lower. Sweden dropped from first position in the 2008 Survey to the 12th in global ranking in the 2010 Survey, which is mainly at-tributed to the regression of its online services.
Figure 4.5 E-government development in Europe
0 0.1000 0.2000 0.3000 0.4000 0.5000 0.6000 0.7000 0.8000
World average0.4406
Regional average0.6227
Western Europe0.7165
Southern Europe0.5566
Northern Europe0.7113
Eastern Europe0.5449
Map 4.4 Sub-regions of Europe
Eastern EuropeBelarusBulgariaCzech RepublicHungaryPolandRepublic of MoldovaRomaniaRussian FederationSlovakiaUkraine
Northern EuropeÅland IslandsChannel IslandsDenmarkEstoniaFaeroe IslandsFinlandGuernseyIcelandIrelandIsle of ManJerseyLatviaLithuaniaNorwaySvalbard and Jan Mayen IslandsSwedenUnited Kingdom of Great Britain and Northern Ireland
Southern EuropeAlbaniaAndorraBosnia and HerzegovinaCroatiaGibraltarGreeceHoly SeeItalyMaltaMontenegroPortugalSan MarinoSerbiaSloveniaSpainThe former Yugoslav Republic of Macedonia
Western EuropeAustriaBelgiumFranceGermanyLiechtensteinLuxembourgMonacoNetherlandsSwitzerland
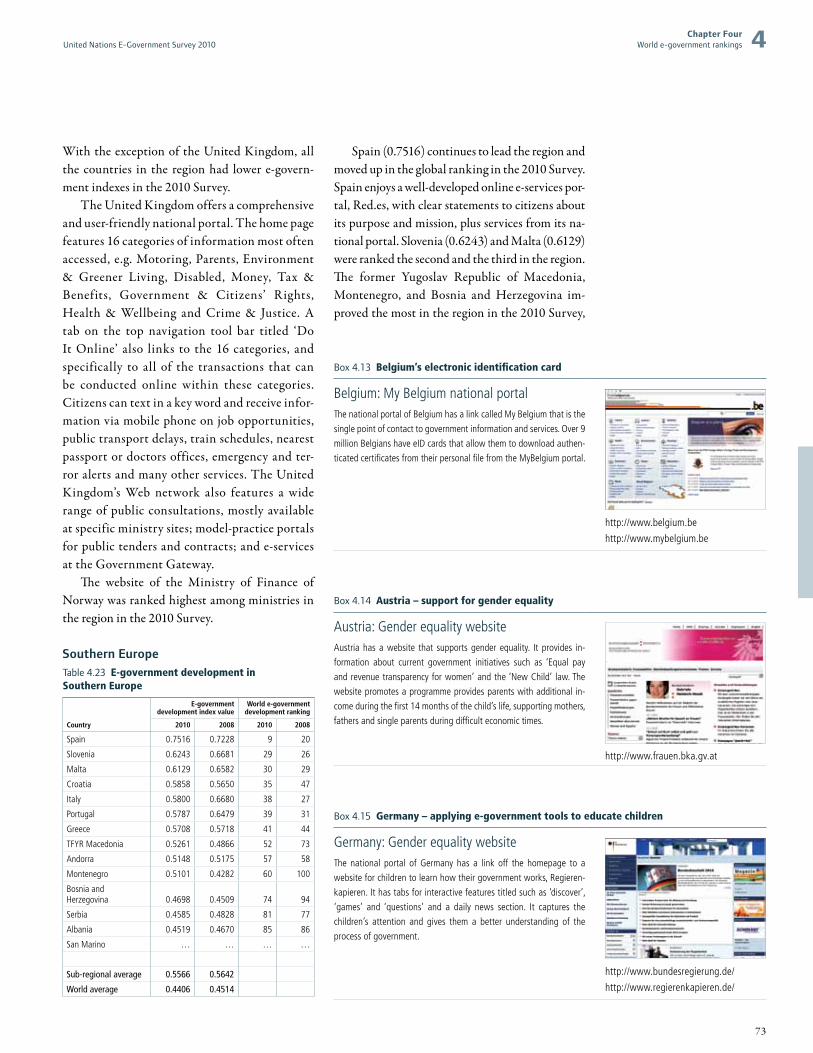
73
Chapter FourWorld e-government rankings 4United Nations E-Government Survey 2010
With the exception of the United Kingdom, all the countries in the region had lower e-govern-ment indexes in the 2010 Survey.
The United Kingdom offers a comprehensive and user-friendly national portal. The home page features 16 categories of information most often accessed, e.g. Motoring, Parents, Environment & Greener Living, Disabled, Money, Tax & Benefits, Government & Citizens’ Rights, Health & Wellbeing and Crime & Justice. A tab on the top navigation tool bar titled ‘Do It Online’ also links to the 16 categories, and specifically to all of the transactions that can be conducted online within these categories. Citizens can text in a key word and receive infor-mation via mobile phone on job opportunities, public transport delays, train schedules, nearest passport or doctors offices, emergency and ter-ror alerts and many other services. The United Kingdom’s Web network also features a wide range of public consultations, mostly available at specific ministry sites; model-practice portals for public tenders and contracts; and e-services at the Government Gateway.
The website of the Ministry of Finance of Norway was ranked highest among ministries in the region in the 2010 Survey.
Southern EuropeTable 4.23 E-government development in Southern Europe
Country
E-governmentdevelopment index value
World e-government development ranking
2010 2008 2010 2008
Spain 0.7516 0.7228 9 20
Slovenia 0.6243 0.6681 29 26
Malta 0.6129 0.6582 30 29
Croatia 0.5858 0.5650 35 47
Italy 0.5800 0.6680 38 27
Portugal 0.5787 0.6479 39 31
Greece 0.5708 0.5718 41 44
TFYRMacedonia 0.5261 0.4866 52 73
Andorra 0.5148 0.5175 57 58
Montenegro 0.5101 0.4282 60 100
BosniaandHerzegovina 0.4698 0.4509 74 94
Serbia 0.4585 0.4828 81 77
Albania 0.4519 0.4670 85 86
SanMarino … … … …
Sub-regionalaverage 0.5566 0.5642
Worldaverage 0.4406 0.4514
Spain (0.7516) continues to lead the region and moved up in the global ranking in the 2010 Survey. Spain enjoys a well-developed online e-services por-tal, Red.es, with clear statements to citizens about its purpose and mission, plus services from its na-tional portal. Slovenia (0.6243) and Malta (0.6129) were ranked the second and the third in the region. The former Yugoslav Republic of Macedonia, Montenegro, and Bosnia and Herzegovina im-proved the most in the region in the 2010 Survey,
Box 4.14 Austria – support for gender equality
Austria:Genderequalitywebsite
http://www.frauen.bka.gv.at
Austriahasawebsite that supportsgender equality. It provides in-
formation about current government initiatives such as ‘Equal pay
andrevenuetransparencyforwomen’andthe‘NewChild’ law.The
websitepromotesaprogrammeprovidesparentswithadditionalin-
comeduringthefirst14monthsofthechild’slife,supportingmothers,
fathersandsingleparentsduringdifficulteconomictimes.
Box 4.13 Belgium’s electronic identification card
Belgium:MyBelgiumnationalportal
http://www.belgium.be
http://www.mybelgium.be
ThenationalportalofBelgiumhasalinkcalledMyBelgiumthatisthe
singlepointofcontacttogovernmentinformationandservices.Over9
millionBelgianshaveeIDcardsthatallowthemtodownloadauthen-
ticatedcertificatesfromtheirpersonalfilefromtheMyBelgiumportal.
Box 4.15 Germany – applying e-government tools to educate children
Germany:Genderequalitywebsite
http://www.bundesregierung.de/
http://www.regierenkapieren.de/
The national portal of Germany has a link off the homepage to a
websiteforchildrentolearnhowtheirgovernmentworks,Regieren-
kapieren.Ithastabsforinteractivefeaturestitledsuchas’discover’,
‘games’ and ‘questions’ and a daily news section. It captures the
children’s attention and gives them a better understanding of the
processofgovernment.

74
Chapter FourWorld e-government rankings4 United Nations E-Government Survey 2010
with the former Yugoslav Republic of Macedonia gaining 21 positions to be ranked 52nd globally, Montenegro gaining 40 positions to be in 60th position and Bosnia and Herzegovina gaining 20 positions to be 74th. These changes were attribut-able to the improvement in telecommunication infrastructure and online services.
Western EuropeThe Netherlands (0.8097) continues to lead the re-gion in the global rankings of the 2010 Survey, with France (0.7510) and Germany (0.7309) ranked sec-ond and the third respectively. Liechtenstein saw the most significant progress and was ranked 23rd globally in the 2010 Survey, which could be attrib-uted to its efforts to improve online services.
Table 4.24 E-government development in Western Europe
Country
E-governmentdevelopment index value
World e-government development ranking
2010 2008 2010 2008
Netherlands 0.8097 0.8631 5 5
France 0.7510 0.8038 10 9
Germany 0.7309 0.7136 15 22
Belgium 0.7225 0.6779 16 24
Switzerland 0.7136 0.7626 18 12
Liechtenstein 0.6694 0.5486 23 49
Austria 0.6679 0.7428 24 16
Luxembourg 0.6672 0.7512 25 14
Monaco … … … …
Sub-regionalaverage 0.7165 0.7329
Worldaverage 0.4406 0.4514
The national portal of Portugal is informational and integrated and provides a clear gateway to ser-vices for citizens, including e-services. The site pro-vides link to all ministries, including links to various services for citizens, such as Emprego 2009 for ac-cess to educational and professional resources.
Montenegro combined effective graphic design with efficient navigation for a visually related se-ries of portals and websites, including those of the national government and all of its ministries. It worked well as a result of investment in back office integration. The various sites polling users about what they would like to see changed or improved on their government’s websites.
The Education Ministry of Serbia had one of the best online resources for students including information on student loans and scholarships, foreign government and foundations scholarships, international competitions, and Republic of Serbia Foundation Scholarships. Students can buy their books online and access their school records.
The website of the Ministry of Health of Belgium received the second highest ranking among that of the health ministries in the 2010 Survey based on the excellent provision of e-ser-vices to citizens. The country’s Ministry of Labour has a website with a notable usability/user experi-ence. For example, when a user searches on its site, any results that are associated with an e-govern-ment feature or service will be marked with the letter ‘e’ in the form of a red icon next to the search results, cuing the user to click.
The national portal of the Netherlands offers a gateway to the municipalities of the Netherlands. It also harbors a substantive resource for elderly and disabled individuals wishing to locate online government services.
4.2.5 E-government in OceaniaAustralia (0.7863) continues to lead the Oceania region with New Zealand (0.7311) in second posi-tion. Among the island states in the Pacific, Palau (0.4189) and Fiji (0.3925) are the leading countries in e-government development.
The extensive national portal for Australia helps citizens to navigate to key features, government ini-tiatives, services and information. The website promi-nently features the Social Inclusion website with the
Map 4.5 Sub-regions of Oceania
Australia and New ZealandAustraliaNew ZealandNorfolk Island
MicronesiaGuamKiribatiMarshall IslandsMicronesia (Federated States of)NauruNorthern Mariana IslandsPalau
MelanesiaFijiNew CaledoniaPapua New GuineaSolomon IslandsVanuatu
PolynesiaAmerican SamoaCook IslandsFrench PolynesiaNiuePitcairnSamoaTokelauTongaTuvaluWallis and Futuna Islands

75
Chapter FourWorld e-government rankings 4United Nations E-Government Survey 2010
vision of society in which all Australians feel valued and are equipped with the opportunity to participate fully in society. New features on the site include State, Territory and Local Government Search within the national site, smart forms for enrolling to vote and making complaints, and new e-consultation features for public consultation, blogs and a feature called Bright Ideas where citizens can provide new ideas and perspectives on a specific or any subject.
Table 4.25 E-government development in Oceania
Country
E-governmentdevelopment index value
World e-government development ranking
2010 2008 2010 2008
Australia 0.7863 0.8108 8 8
NewZealand 0.7311 0.7392 14 18
Palau 0.4189 0.0000 103 …
Fiji 0.3925 0.4156 113 105
Samoa 0.3742 0.3761 115 115
Tonga 0.3697 0.3950 116 112
Vanuatu 0.2521 0.2510 155 154
SolomonIslands 0.2445 0.2748 156 147
PapuaNewGuinea 0.2043 0.2078 171 166
Kiribati … … … …
MarshallIslands … … … …
Micronesia(FederatedStatesof) … … … …
Nauru … … … …
Tuvalu … … … …
Sub-regionalaverage 0.4193 0.4338
Worldaverage 0.4406 0.4514
4.3 Economic groupingsTable 4.26 illustrates the top 25 developing coun-tries in the 2010 Survey. Many developing countries have been investing in streamlining the national and ministry portals and websites to better offer more e-services and more actively engage citizens in dia-logues with government. The digital divide between the developed countries and developing countries is gradually closing in the e-government arena.
Table 4.27 provides a list of the least developed countries, which face severe constraints to e-gov-ernment development.
Finally, some countries do not appear in the ranking of the 2010 United Nations E-Government Survey. The Survey lacked data in significant areas for these countries, which made it impossible to either construct an index on infrastructure or human resources capacity, or both. Tables in the
Annex provide the raw scores for the telecommuni-cation infrastructure, human capacity and online service indexes of these countries.
A number of countries are engaged in the de-velopment of regional e-government strategies, as illustrated by the examples in box 4.16.
4.4 Progress in online service provisionThe number of e-services available on government websites continues to grow by leaps and bounds. Every year it is evident that more and more e-services are put into operation in government websites. A country’s strength in online service provision is measured against four benchmarks.
• Does the national government provide basic information services online?
• Does the national government use multimedia technology and promote two-way exchanges with citizens?
Table 4.26 Top ranked developing countries
Rank Country
E-governmentdevelopment index value
World e-government development ranking
2010 2008 2010 2008
1 RepublicofKorea 0.8785 0.8317 1 6
2 Singapore 0.7476 0.7009 11 23
3 Bahrain 0.7363 0.5723 13 42
4 Israel 0.6552 0.7393 26 17
5 Colombia 0.6125 0.5317 31 52
6 Malaysia 0.6101 0.6063 32 34
7 Chile 0.6014 0.5819 34 40
8 Uruguay 0.5848 0.5645 36 48
9 Barbados 0.5714 0.5667 40 46
10 Cyprus 0.5705 0.6019 42 35
11 Kazakhstan 0.5578 0.4743 46 81
12 Argentina 0.5467 0.5844 48 39
13 UnitedArabEmirates 0.5349 0.6301 49 32
14 Kuwait 0.5290 0.5202 50 57
15 Jordan 0.5278 0.5480 51 50
16 Mongolia 0.5243 0.4735 53 82
17 Ukraine 0.5181 0.5728 54 41
18 AntiguaandBarbuda 0.5154 0.4485 55 96
19 Mexico 0.5150 0.5893 56 37
20 SaudiArabia 0.5142 0.4935 58 70
21 RussianFederation 0.5136 0.5120 59 60
22 Brazil 0.5006 0.5679 61 45
23 Qatar 0.4928 0.5314 62 53
24 Peru 0.4923 0.5252 63 55
25 Belarus 0.4900 0.5213 64 56
Worldaverage 0.4406 0.4514

76
Chapter FourWorld e-government rankings4 United Nations E-Government Survey 2010
• Does the national government use the Internet to deliver public services and solicit occasional input on matters of public interest?
• Does the national government connect public service functions and routinely consult with citizens on matters of public policy?If there is clear evidence that a country does all
four of these things well, and therefore has estab-lished a digital foundation for citizen empower-ment and inclusion, then it will be highly placed in the online service index.
Overall, the bar for online service has shifted up and the global index average is down in the 2010 Survey as compared to 2008. The present Survey gives more weight to more advanced stages of online development, e.g. availability of trans-actional services and promotion of the connected approach to e-government. Half of the total avail-able points for online services are assigned to these stages. Specifically, the survey instrument allocates 68 points to characteristics of an emerg-ing online presence (16.9 percent), 116 points to an enhanced online presence (28.8 percent), 169 points to a transactional presence (41.9 percent) and 50 points to a connected presence (12.4 per-cent) for a maximum possible score of 403.
4.4.1 How governments rank in online services First position in online services is held by the Republic of Korea (1.0000), followed by the United States (0.9365) and Canada (0.8825). Several of the top-ranked countries in 2010, as seen in table 4.28, are newcomers or have otherwise made significant gains in the last two years. Notable climbers in-clude Bahrain, Chile, Colombia, Singapore and the United Kingdom, which have joined the world’s top performers in online service development.
Growth of online services is especially strong in the case of middle-income countries. In 2010, mid-dle-income countries accounted for four positions among the top 10 in the online service development index, and 14 positions among the top 35 countries.
A country’s strength in online service provision correlates positively with its use of new technology such the emerging tools for social networking. The 2010 Survey put greater emphasis on online service provision and networking with citizens,
Table 4.27 E-government development in least developed countries1
Rank Country
E-governmentdevelopment index value
World e-government development ranking
2010 2008 2010 2008
1 Maldives 0.4392 0.4491 92 95
2 Samoa 0.3742 0.3761 115 115
3 Lesotho 0.3512 0.3805 121 114
4 SãoToméandPríncipe 0.3258 0.3215 128 130
5 Angola 0.3110 0.3328 132 127
6 Bangladesh 0.3028 0.2936 134 142
7 UnitedRepublicofTanzania 0.2926 0.2929 137 143
8 EquatorialGuinea 0.2902 0.2890 138 145
9 Madagascar 0.2890 0.3065 139 135
10 Cambodia 0.2878 0.2989 140 139
11 Myanmar 0.2818 0.2922 141 144
12 Uganda 0.2812 0.3133 142 133
13 Zambia 0.2810 0.2266 143 158
14 Rwanda 0.2749 0.2941 148 141
15 LaoPeople’sDemocraticRepublic 0.2637 0.2383 151 156
16 Bhutan 0.2598 0.3074 152 134
17 Nepal 0.2568 0.2725 153 150
18 Sudan 0.2542 0.2186 154 161
19 Vanuatu 0.2521 0.2510 155 154
20 SolomonIslands 0.2445 0.2748 156 147
21 Mauritania 0.2359 0.2028 157 168
22 DemocraticRepublicoftheCongo 0.2357 0.2177 158 162
23 Malawi 0.2357 0.2878 159 146
24 Comoros 0.2327 0.1896 160 170
25 Mozambique 0.2288 0.2559 161 152
26 Timor-Leste 0.2273 0.2462 162 155
27 Senegal 0.2241 0.2531 163 153
28 Yemen 0.2154 0.2142 164 164
29 Togo 0.2150 0.2191 165 160
30 Liberia 0.2133 0.2170 166 163
31 Gambia 0.2117 0.2253 167 159
32 Afghanistan 0.2098 0.2048 168 167
33 Haiti 0.2074 0.2097 169 165
34 Djibouti 0.2059 0.2279 170 157
35 Ethiopia 0.2033 0.1857 172 172
36 Benin 0.2017 0.1860 173 171
37 Burundi 0.2014 0.1780 174 174
38 Eritrea 0.1859 0.1965 175 169
39 Mali 0.1815 0.1591 176 175
40 SierraLeone 0.1697 0.1463 177 178
41 BurkinaFaso 0.1587 0.1542 178 176
42 Guinea-Bissau 0.1561 0.1521 179 177
43 Guinea 0.1426 0.1402 180 180
44 CentralAfricanRepublic 0.1399 0.1412 181 179
45 Chad 0.1235 0.1047 182 182
46 Niger 0.1098 0.1142 183 181
47 Kiribati … … … …
48 Somalia … … … …
49 Tuvalu … … … …
Worldaverage 0.4406 0.4514

77
Chapter FourWorld e-government rankings 4United Nations E-Government Survey 2010
engaging and empowering them to be part of the governance process. Social networking tools enable governments to consult with citizens and expand opportunities for participation in decision-making processes. They can be used to garner feedback and opinions and to elicit support for public policy. To engage citizens, more countries have developed sites in the social networking arena and more are in the process of doing so.
Figure 4.6 Nearly all governments have websites
Governmentswithout websites
2%
Governmentswith websites98%
Some low-income countries are lagging far behind the world trend towards more and bet-ter e-government development. Some countries have no national portal or ministry websites for education, finance, health, labour and social ser-vices. Consequently, these countries receive a score of zero for the online service index. Countries with no online presence include Central African Republic, Somalia and Swaziland. These countries could not be ranked for online services develop-ment because they had no government websites. However, Central African Republic and Swaziland received an e-government development score be-cause the country had sufficient data to calculate the indexes for telecommunications infrastructure and human capacity.
Sometimes e-government development can change quickly. The 2008 Survey reported that Zambia had no online presence and yet by the 2010 Survey the country’s national sites were read-ily available and easily assessed.
4.4.2 About the services governments provide online An increasing number of governments are en-deavouring to meet the needs of the citizens by providing more online content and e-services and by creating a level of online dialogue that was not in place even a few years ago, according to the 2010 Survey. Portals are becoming more integrated and streamlined. It is easier than ever for citizens to find information and ser-vices online. This is especially true in developed and middle-income countries. Least developed countries are starting to incorporate many of the online tools that developed and middle-income countries now use, including videos and social networking tools. Only a few countries are able to offer many secure transactions online, how-ever, although the trend is toward more e-forms and e-payments.
Table 4.28 Top 20 countries in online service development
.Rank Country Online service index value
1 RepublicofKorea 1.0000
2 UnitedStates 0.9365
3 Canada 0.8825
4 UnitedKingdom 0.7746
5 Australia 0.7651
6 Spain 0.7651
7 Norway 0.7365
8 Bahrain 0.7302
9 Colombia 0.7111
10 Singapore 0.6857
Rank Country Online service index value
11 France 0.6825
12 Netherlands 0.6794
13 Denmark 0.6730
14 Japan 0.6730
15 NewZealand 0.6381
16 Malaysia 0.6317
17 Belgium 0.6254
18 Chile 0.6095
19 Israel 0.5841
20 Mongolia 0.5556
Box 4.16 Regional e-government strategies
Ministersresponsiblefore-governmentpolicyintheEuropeanUnionissueda“MinisterialDeclarationone-Govern-ment”inNovember2009thatsharedacommonvision,objectivesandimplementationapproachfor2011-2015.
The Persian Gulf region has developed e-government standards and structures that are implementedthroughout the region.Thecountries in theGulfCooperativeCouncilareworking togetherandsharing theire-governmentexperiencestoadvancetheregionasawhole.AllGCCcountrieswererepresentedataregionale-government conference in December 2009 in Oman.Awards were presented for innovative e-governmentprogrammes,servicesandsolutionsintheregion.
AfricanMinistersconfirmedtheirwillingnesstopromoteinter-governmentalcooperationinhavingcommonframeworks fore-Government regionaldevelopmentatameeting inMexico inSeptember2009. InFebruary2010,ICTwillbethefocusoftheSummitoftheAfricanUnion,withthetheme‘InformationandCommunicationTechnologiesinAfrica:ChallengesandProspectsforDevelopment.’
AdraftregionalCaribbeane-Governmentstrategy2010-2014waspreparedin2009withtheactiveparticipationofseniore-governmentrepresentativesofCaribbeanStatesandUNDESAsupport.ItproducedbyCaribbeanCentreforDevelopmentAdministration(CARICAD),anagencyofCARICOM.Thisstrategycontainsaconsensusone-governmentvision,goals,strategicinitiatives,immediateoutcomesandimplementationplanforCaribbeancountries.
TheInternationalTelecommunicationUnion(ITU)isplanningtoorganizeaseriesofregionalsummits,strategiesandproducts,includingtheArabStatesandtheAmericas.Theeffortispartofits‘ConnecttheWorldby2015initiative’.

78
Chapter FourWorld e-government rankings4 United Nations E-Government Survey 2010
Ninety-eight percent of countries have some presence on the Web, either by having a national portal or ministry website, as illustrated in figure 4.6. This number has not changed since 2008.
Certain features are common across many web-sites. Table 4.29 reveals that most government web-sites have a section for archived information and a section called ‘What’s New’. These features enable users to find information on past activities that are no longer highlighted on the website and encourage users to browse updated information. In contrast, only 44 percent of governments have a section that provides ready answers to frequently asked questions (FAQ). The use of FAQs can reduce the amount of time and human resources devoted to public inquiry functions, and improve public perception that the goverment is responsive to citizens’ concerns.
Table 4.29 Characteristics of an emerging online presence
FeatureNumber of
countries Percent
What’snew? 156 81
Frequentlyaskedquestions 85 44
Archivedinformation 166 86
Most national portals have direct links to their respective ministries. The 2010 Survey finds that 61 percent of national portals contain links to more than 10 ministry websites, as illustrated in figure 4.7. These links allow citizens visiting a national portal to link quickly and directly to the information and services offered by a particular ministry, avoiding separate searches. They can simply go to the national homepage and access the ministry websites.
Figure 4.7 also shows that one quarter of national portals do not have links to any ministries, which means that they are either completely segregated from the websites of ministries, or the ministries in these
countries do not have websites at all. Citizens visiting national portals with links to only five or less minis-tries in their homepages must search outside for infor-mation that should be readily accessible. Ideally, the homepage of a country’s national portal should have links to all ministry and government agency websites.
Figure 4.7 Number of ministries linked to a national portal
0 ministries49 countries26%
1-5 ministries15 countries8%
More than 10 Ministries118 countries61%
6-10 ministries10 countries
5%
Site maps can be found on slightly over 50 per-cent of national portals, as per table 4.30. This very useful feature helps citizens to find pages on the website without having to guess where informa-tion might be found. Links to other public sector services are provided on 67 percent of national por-tals, which makes them a one-stop shop for infor-mation and services.
Table 4.30 Site maps and linkages from national portals
FeatureNumber of
countries Percent
Sitemapisavailable 102 53
Linksbetweennationalhomepagesandministries/departments 143 74
Linksbetweennationalhomepageandpublicsectorservices 129 67
More than 50 percent of ministry websites have site maps, help or FAQs available or are integrated with the national portal, as shown in figure 4.8. Ministries of finance are more likely than other ministries to be integrated with the national portal and to include a site map.
Even static forms are not widely available on national portals. Figure 4.9 indicates that 63
Box 4.17 Leaders in transactional and connected e-government
Whoaretheworldleadersintransactionalandconnectede-government?Thefollowingcountriesareinthethirdorfourthstageofonlineservicesdevelopment:Australia,Austria,Belgium,Canada,Denmark,Estonia,Finland,France,Germany,Japan,Malaysia,Netherlands,NewZealand,Norway,RepublicofKorea,Singapore,Spain,Swe-den,UnitedKingdomandUnitedStates.
Thesecountrieshavebeenintegratingback-officeoperationsandprovidinge-servicestocitizensinaseam-lessmanner.Informationisefficientlytransferredbetweenagenciesanddepartments.Inaddition,thesecountrieshaveaproventrack-recordofusingWeb2.0 tools tocommunicatewithcitizensandregularly receive inputsfromthem.Theseinputsareusedtoshapepublicpolicyandlaw.Thelevelofpublictrustingovernmentishigheramongadvancede-governmentcountriesthaninmanyotherplaces.

79
Chapter FourWorld e-government rankings 4United Nations E-Government Survey 2010
percent of countries have not provided citizens with the capability of downloading static forms, let alone forms that can be filled-out and submit-ted online. In many least developed countries citizens can download forms, complete them by hand and manually submit them to the relevant ministry or department.
Figure 4.9 Availability of static online forms
0 forms123 countries63%
1-5 forms11 countries6%
More than 10 forms53 countries28%
6-10 forms5 countries
3%
Some 49 percent of national portals or websites are in more than one language. Where a site has more than one language, English is usually the second language, demonstrating the continued im-portance of that language on the Internet. In a few cases, ministry websites are in English only, while English is not the first language of that country.
Table 4.31 Website design features: RSS, audio, video, language
FeatureNumber of
countries Percent
Sitemeetsprovidesatleastminimallevelofwebcontentaccessibility 24 13
Sitesupportaudioand/orvideocontent 95 49
Siteprovidesrealsimplesyndication(RSS) 68 35
Siteofferscontentinmorethanonelanguage 95 49
The use of real simple syndication (RSS) feeds jumped from 10 percent of national portals in the 2008 Survey to 35 percent in the 2010 Survey. This means that more national portals are automatically releasing information and content to individual subscribers. Citizens are informed whenever any updates are made.
Multimedia is gaining importance in the config-uration of most national and ministry websites, with 49 percent of national portals supporting audio and/or video content, up from only 38 percent in 2008.
Table 4.32 Support of mobile access
FeatureNumber of
countries Percent
SitesupportsWAP/GPRSaccess 24 13
Siteoffersservicetosendalertmessagestomobilephones 25 13
Usercanapplyforregistrationorapplicationbymobilephone 14 7
Userscanpayregistrationfees,fines,etc.bymobilephone 17 4
Figure 4.8 Features of ministry websites
0 10 20 30 40 50 60 70 80 90 100
Social service ministries
6952
83
Labour ministries
6260
83
Health ministries
7051
90
Education ministries
6862
83
Finance ministries
8161
92
Site map available
Integrated with the national partal
Help or FAQ available
Figure 4.10 Selected countries with high transactional presence scores
0 10 20 30 40 50 60 70 80 90 100 110 120
Australia64
United Kingdom66
Israel66
France72
Bahrain72
Chile74
Colombia89
Canada99
Republic of Korea107
United States110

80
Chapter FourWorld e-government rankings4 United Nations E-Government Survey 2010
Wireless devices such as mobile phones are being used by some governments to provide services in the form of alert messages, applications or fee payment. Table 4.33 indicates a slight increase in the number of national portals using wireless application pro-tocol (WAP) for wireless communication. In 2008, 19 national portals had WAP implemented.
Wireless devices such as mobile phones are al-most equally popular in developing countries as they are in developed countries. In 2008, 14 na-tional sites offered mobile alerts, while in 2010, that number increased to 25. Such an increase is minor compared to the major opportunity that wireless devices offer to governments interested in providing electronic content and services to their citizens. Meanwhile, only in seven countries can users pay registration fees, fines, etc. via mobile ac-cess provided through their national portals. These countries are Bahrain, Croatia, Estonia, Israel, Mongolia, New Zealand and Sudan.
Table 4.33 Online payment
Payment typeNumber of
countries Percent
Taxes 34 18
Registrations 36 19
Permits,certificates,identificationcards 33 17
Fines 22 11
Utilities 18 9
Compared to mobile payment options, more are offered through online portals. How many countries allow online payment of taxes, fines, registrations, utilities, and certificates from their
national portals? The majority of countries in table 4.33 were middle income countries. Since 2008, there has been a slight increase of governmental online payment facilities.
Transactional servicesOnly a few countries are able to offer many transac-tional services online at this time. However, coun-tries with the highest scores in figure 4.10 offer a wide range of integrated transactional e-services that cater to many segments of society. They have comprehensive back office integration systems and secure networks on which these e-services oper-ate, giving citizens security and confidence. The United States, the Republic of Korea and Canada are the top three countries in terms of transac-tional opportunities. The developing countries are well-represented in the top 10 with four countries: Bahrain, Chile, Colombia and Israel.
Table 4.34 Online submissions
FeatureNumber of
countries Percent
Onlineforms 53 28
Onlinetransactions 60 32
Applicationforgovernmentbenefits 32 17
Acknowledgementofreceipt 19 10
Table 4.35 Connected presence
FeatureNumber of
countries Percent
Singlesign-on 31 16
Electronicidentitymanagementandauthentication 33 17
One-stopshop 130 68
Informationinmachinereadableformat 74 39
InteractionwithHeadofState 61 32
Table 4.36 Connecting to citizens
FeatureNumber of
countries Percent
Citizenscanrequestpersonalinformationaboutthemselves 21 11
Userscantag,assessandrankcontent 7 4
Userscaninitiateproposals 16 8
Userscanpersonalizethewebsite 12 6
Governmenthascommittedtoincorporatinge-participationoutcomeindecisionmaking 22 11
Fewer than one-third of governments provide citizens with the possibility of online transactions and the online submission of e-forms, as shown in table 4.34 on online submissions. In addition, less
Figure 4.11 Number of ministry websites with online forms and transactional services
20100 30 40 50 60 70 80
Social service ministries
2524
62
Labour ministries
2636
66
Health ministries
2727
52
Transactional servicesOnline formsDownloadable forms
Education ministries
1823
63
Finance ministries
2931
69

81
Chapter FourWorld e-government rankings 4United Nations E-Government Survey 2010
than 20 percent of governments allow citizens to apply for government benefits online. The main reason for this low number is the complex integra-tion that is required among different systems to ensure compatibility and a seamless interaction. All administrative or financial transactions need to be performed over a secure network. The threat of identify theft or financial fraud is too great on an unsecured network.
The websites of ministries of finance have the most downloadable forms and online transaction services available for citizens, while the ministries of labour have the most e-forms, as seen in figure 4.11.
Governments are having some success in cre-ating a ‘connected presence’ with their national portals. Table 4.37 shows that they are creating websites that support citizens by making it easier for them to find information, by integrating sites into a one-stop shop, and by creating single-sign-on for access to all government services. The level of sophistication of the single-sign-on varies greatly among countries. Very few single-sign-on systems have reached the level of Singapore’s Sing-pass.
Governments are inviting citizens to become more actively involved in determining the design and content of portals and websites. Table 4.36 lists a variety of ways this is being done. Some countries allow users to personalize their own ‘Mysite’ from the information found on government portals. Six countries allow citizens to tag and rank content, which allows them to have more control of the in-formation provided in the portals.
4.4.3 The data behind the rankingsWhat kind of data goes into measuring a coun-try’s performance in online services? Table 4.37 shows categories on online service data including emerging information services, enhanced informa-tion services, transactional services and connected services. The scores include the total scores for the national portal and five ministries. The maximum points that a country could attain is 403.
Table 4.38 shows online service data for se-lected developing countries. Most developing countries are still limited in the transactional as-pect of e-government. None of the countries listed were able to obtain over 50 percent of the points available in the transaction stage.
Table 4.37 Breakdown of online service scores for top ranked countries
Rank Country
Emerging infor-mation services
(stage 1)
Enhanced infor-mation services
(stage 2)Transactional ser-
vices (stage 3)Connected ser-vices (stage 4) Total
PointsScore
(%) PointsScore
(%) PointsScore
(%) PointsScore
(%) PointsScore
(%)
1 RepublicofKorea 66 97 106 91 112 66 31 62 315 78
2 UnitedStates 62 91 97 84 115 68 21 42 295 73
3 Canada 59 87 83 72 104 62 32 64 278 69
4 UnitedKingdom 61 90 87 75 71 42 25 50 244 61
5 Australia 58 85 76 66 69 41 38 76 241 60
5 Spain 60 88 88 76 68 40 25 50 241 60
7 Norway 61 90 85 73 69 41 17 34 232 58
8 Bahrain 63 93 72 62 72 43 23 46 230 57
9 Colombia 57 84 51 44 89 53 27 54 224 56
10 Singapore 54 79 82 71 64 38 16 32 216 54
11 France 54 79 71 61 77 46 13 26 215 53
12 Netherlands 60 88 80 69 55 33 19 38 214 53
13 Denmark 54 79 88 76 52 31 18 36 212 53
13 Japan 59 87 78 67 56 33 19 38 212 53
15 NewZealand 59 87 76 66 46 27 20 40 201 50
16 Malaysia 51 75 73 63 55 33 20 40 199 49
17 Belgium 57 84 66 57 54 32 20 40 197 49
18 Chile 57 84 44 38 74 44 17 34 192 48
19 Israel 49 72 45 39 66 39 24 48 184 46
20 Mongolia 47 69 49 42 54 32 25 50 175 43
21 Germany 54 79 76 66 23 14 20 40 173 43
22 Jordan 50 74 44 38 57 34 17 34 168 42
23 Egypt 55 81 51 44 49 29 12 24 167 41
24 Kazakhstan 66 97 53 46 24 14 23 46 166 41
24 Sweden 54 79 67 58 26 15 19 38 166 41
Table 4.38 Online service levels in selected developing countries
Rank Country
Emerging information
services (stage 1)
Enhanced information
services (stage 2)Transactional
services (stage 3)Connected
services (stage 4) Total
PointsScore
(%) PointsScore
(%) PointsScore
(%) PointsScore
(%) PointsScore
(%)
30 Tunisia 52 76 40 34 50 30 10 20 152 38
32 Uruguay 51 75 43 37 36 21 21 42 151 37
36 Kuwait 41 60 39 34 58 34 7 14 145 36
39 Mexico 45 66 52 45 26 15 16 32 139 34
40 ElSalvador 48 71 30 26 46 27 10 20 134 33
44 Argentina 53 78 42 36 22 13 13 26 130 32
45 Peru 53 78 37 32 26 15 13 26 129 32
49 Philippines 48 71 25 22 35 21 16 32 124 31
53 Uzbekistan 52 76 39 34 18 11 10 20 119 30
54 Cyprus 44 65 39 34 19 11 15 30 117 29
55 Brazil 53 78 34 29 10 6 19 38 116 29
55 China 54 79 40 34 4 2 18 36 116 29
55 India 45 66 41 35 22 13 8 16 116 29
55 Oman 47 69 33 28 26 15 10 20 116 29
59 DominicanRepublic 46 68 30 26 24 14 15 30 115 29
62 Turkey 57 84 29 25 9 5 14 28 109 27
62 Ukraine 55 81 31 27 7 4 16 32 109 27
65 TrinidadandTobago 50 74 39 34 12 7 6 12 107 27
67 Thailand 50 74 31 27 15 9 9 18 105 26
68 RussianFederation 49 72 28 24 15 9 12 24 104 26

82
Chapter FourWorld e-government rankings4 United Nations E-Government Survey 2010
Least developed countries have no real e-ser-vices, nor are they providing citizens with trans-actional opportunities, as presented in table 4.39. The vast majority of the sites surveyed primarily contain e-information and the beginning stages of citizen engagement with polls and feedback forms. The top two positions among least developed countries in the online service assessment went to Bangladesh and Angola. n
Table 4.39 Online service levels in least developed countries1
Rank Country
Emerging information
services (stage 1)
Enhanced information
services (stage 2)Transactional
services (stage 3)Connected
services (stage 4) Total
PointsScore
(%) PointsScore
(%) PointsScore
(%) PointsScore
(%) PointsScore
(%)
60 Bangladesh 48 71 44 38 5 3 15 30 112 28
65 Angola 52 76 38 33 9 5 8 16 107 27
95 Lesotho 52 76 29 25 1 1 1 2 85 21
106 Afghanistan 41 60 25 22 5 3 2 4 83 21
111 Ethiopia 32 47 23 20 3 2 5 10 73 18
114 Bhutan 30 44 21 18 6 4 2 4 63 16
116 Mali 29 43 12 10 9 5 8 16 59 15
120 Senegal 32 47 14 12 3 2 7 14 58 14
121 Rwanda 34 50 14 12 2 1 5 10 56 14
121UnitedRepublicofTanzania 34 50 21 18 … … … … 55 14
124 Mozambique 32 47 13 11 3 2 6 12 55 14
125 Nepal 30 44 22 19 … … 1 2 54 13
126 Madagascar 28 41 13 11 4 2 7 14 53 13
127 Maldives 27 40 24 21 … … … … 52 13
129 BurkinaFaso 26 38 13 11 … … 10 20 51 13
129 Sudan 23 34 16 14 2 1 8 16 49 12
134 Samoa 24 35 21 18 … … … … 49 12
135 Cambodia 25 37 13 11 2 1 3 6 45 11
138 Timor-Leste 23 34 16 14 … … 3 6 43 11
143 Benin 20 29 10 9 4 2 3 6 42 10
145 Zambia 21 31 8 7 … … 4 8 37
146 Uganda 18 26 11 9 … … 3 6 33
150DemocraticRepublicoftheCongo 17 25 7 6 … … 4 8 32
150 Mauritania 11 16 13 11 1 1 3 6 28
150 SãoToméandPríncipe 21 31 7 6 … … … … 28
154 Gambia 16 24 9 8 … … 1 2 28
154 Myanmar 19 28 7 6 … … … … 26
156LaoPeople’sDemocraticRepublic 12 18 9 8 2 1 2 4 26
160 Togo 6 9 8 7 3 2 5 10 25
163 Liberia 11 16 7 6 … … 2 4 22
167 Djibouti 9 13 3 3 … … 3 6 20
167 Yemen 9 13 4 3 … … 2 4 15
169 SolomonIslands 7 10 6 5 … … 1 2 15
170 Burundi 8 12 2 2 … … 3 6 14
172 Niger 4 6 2 2 3 2 3 6 13
173 Guinea 5 7 2 2 3 2 1 2 12
174 EquatorialGuinea 2 3 5 4 … … 3 6 11
175 Comoros 5 7 3 3 … … 1 2 10
175 Kiribati 4 6 5 4 … … … … 9
179 Eritrea 3 4 4 3 … … … … 9
181 Chad 3 4 2 2 1 1 … … 7
181 Haiti 3 4 2 2 … … 1 2 6
184 Guinea-Bissau … … 3 3 1 1 1 2 6
184 Malawi 3 4 2 2 … … … … 5
186 Tuvalu 1 1 3 3 … … … … 5
186 Vanuatu 1 1 2 2 … … 1 2 4
189 SierraLeone … … … … … … 1 2 4
…CentralAfricanRepublic … … … … … … … … 1
… Somalia … … … … … … … … …

83
Chapter FiveCitizen empowerment and inclusion 5United Nations E-Government Survey 2010
Chapter 5
Citizen empowerment and inclusion
E-government can be used by governments to empower and include citizens. Individuals and their democratic governance systems as a whole stand to benefit from better access to in-formation and services, and from more opportunities for their voices to be heard by decision makers. The United Nations E-Government Survey assesses citizen empowerment and inclusion by reviewing channels for online participation in public affairs. The area of online services that opens up chan-nels for online participation in public affairs is termed ‘e-par-ticipation’. Given special attention by Survey, it is measured using an index that isolates Internet-based consultative and decision-making mechanisms. A country’s strength in e-par-ticipation is measured against three benchmarks:
• Does the national government publish information on items under consideration?
• Are there ways for the public to engage in consulta-tions with policy makers, government officials and one another?
• Can citizens directly influence decisions, for example by voting online or using a mobile telephone?
Countries that have been actively developing participatory features fare better in e-participation rankings.
5.1 Progress in e-participation 84
5.1.1 About e-participation 84
5.1.2 How governments rank in e-participation 85
5.2 Questions of access and diversity 88
5.2.1 The digital divide and inclusive e-government 88
5.2.2 Unequal benefits for women and men 90
84
Chapter FiveCitizen empowerment and inclusion5 United Nations E-Government Survey 2010
5.1 Progress in e-participationThe provision of online services, as described above, provides a transformative platform for the public sphere. It intersects with the process of so-cial communication where opinions are expressed, synthesized and coalesced. There are many types of public spheres operating across many different platforms, including the traditional mass media of television, radio and newspapers. The Internet is transformative because it allows anyone to be a publisher. This changes the power relationships in the public sphere in profound ways. It affords polit-ical leaders new routes to power. It affords citizens new ways to have their say. Even the voices of the marginalized can now be heard making the public sphere increasingly rich and diverse.1
5.1.1 About e-participationMany governments are engaging citizens for feed-back via their websites. The majority of sites have polls or surveys or feedback buttons, but this is just the tip of the iceberg. Web 2.0 (and Web 3.0 in the near future) will provide citizens with an av-enue for direct impact on how government oper-ates. E-participation goes well beyond e-voting; it changes the dynamics between government and citizens. Web 2.0 and social networking tools have created an environment that politicians and deci-sion-makers must adjust to and incorporate in their daily work. In the United States, for example, more than 2 million followers subscribe to the Twitter feed of President Barack Obama. Politicians have been inclined to embrace and encourage the use of these e-participation and e-tools. They are provid-ing information directly to citizens, which may help citizens to have a better understanding of their politicians. E-participation is one of the key assessments of the current e-government survey. It reflects on how well governments are keeping citi-zens at the centre of e-services.
Many governments have enhanced their na-tional and ministerial websites to incorporate interactive tools to strengthen citizen e-partici-pation. As citizens are empowered, they create a different relationship with their respective govern-ments, characterized by enhanced effectiveness, as government are able to respond to the needs of citi-zens in a more direct manner. The e-participation
index is indicative on how governments create an environment in which citizens can be more active and supportive of their governments.
Citizens express their views in environments they feel are acceptable. The 2010 Survey assesses how governments are interacting with citizens using popular Web 2.0 tools such as blogs, chat rooms and SMS as well as communication tech-nologies such as Facebook, Twitter and other social networking tools.
Web 2.0 and social networking tools have empowered citizens to become more active in ex-pressing their views on many issues, especially on issues concerning environment, health, education and other areas of government policy. Citizens use Web 2.0 and social networking tools to galvanize other like-minded citizens to share ideas and to develop collaborative approaches in tackling the issues that are important to them. Politicians and other decision-makers need to tap into this wealth of information and knowledge in order to be more responsive to their constituents.
As more and more people create their own blogs and issue-based social networking groups, they are becoming power-brokers in influencing governmental policies. Today, many citizens are in-terested in the views of bloggers and those of other members of their social networking groups. This new-found power and influence is contributing to higher standards of transparency in government.
The United Nations E-Government Survey recognizes the importance of e-participation in all its aspects ranging from e-information, e-consul-tation to e-decision-making. Politicians and politi-cal decision makers represent the voice of citizens within government. Now these politicians and decision makers are soliciting information and knowledge from the constituents online and in real-time, seeking to respond more efficiently to their constituents.
There is a growing global trend towards listen-ing to citizen’s voices and engaging their participa-tion. This trend is likely to continue and expand in the next few years and beyond. Citizens are em-ploying more e-participation tools. Politicians and decision-makers seem to be inclined to listen to the citizens. Although this movement is primarily tak-ing hold in high-income countries, middle-income

85
Chapter FiveCitizen empowerment and inclusion 5United Nations E-Government Survey 2010
countries are not far behind. Governments are now creating portals on social networking sites in order to reach out to citizens and promote their programmes, messages and policies. Citizens using e-participation tools have influenced several major presidential elections in recent years.
E-participation goes well beyond presidential and parliamentary elections; it is the empower-ment of citizens to have an open dialogue with gov-ernment. In densely populated countries, one sees e-participation working at the local levels, where district and village leaders are able to communicate with their constituency by using different e-tools. In smaller countries, e-participation can take place at the national level, where decision-makers can have direct access to citizens.
5.1.2 How governments rank in e-participationThe e-participation index shows how govern-ments performed in 2010 compared to 2008. The 2010 Survey included a comprehensive review of how governments are including citizens in their decision-making process, how governments are providing information and knowledge, and how governments are consulting citizens to obtain feed-back and opinions.
The best performing e-participation countries as expressed in the e-participation index are listed in table 5.1. The e-participation index combines the cumulative scores from the national portals plus the scores for the citizen-empowerment.
The Republic of Korea leads the e-participa-tion index, followed by Australia, Spain and New Zealand. More than one third of the countries in the top 35 list are new and, notably, the majority are middle-income countries. Since 2008, a num-ber of middle-income countries have revamped their websites to obtain more feedback and start the dialogue process with citizens.
‘Best practices’ were noted in Chile, Croatia, Cyprus and Mongolia. The countries placed more emphasis on obtaining feedback and inputs from citizens and also included more e-participation tools such as blogs, discussion forum, social net-working sites, polls and citizen feedback.
Kazakhstan and Kyrgyzstan stand out for embracing the concept of e-participation. Their
national portals allow citizens to initiate their own proposals, which the government reviews in the decision-making process. Citizens receive an acknowledgement that their inputs on e-delibera-tions or e-opinions have been received. The national portals allow discussion via social networking tools and they also post past forum debates. Their senior officials respond directly to the opinions from the online forums.
Figure 5.1 Geographic distribution of best performing countries in e-participation
Oceania6%
Europe51%
Asia29%
Americas14%
Table 5.1 Top 20 countries in e-participation
Rank Country2010 e-participation
index value 2010 rank 2008 rank Change +/(-)
1 RepublicofKorea 1.0000 1 2 1
2 Australia 0.9143 2 5 3
3 Spain 0.8286 3 34 31
4 NewZealand 0.7714 4 6 2
4 UnitedKingdom 0.7714 4 25 21
6 Japan 0.7571 6 11 5
6 UnitedStates 0.7571 6 1 (5)
8 Canada 0.7286 8 11 3
9 Estonia 0.6857 9 8 (1)
9 Singapore 0.6857 9 10 1
11 Bahrain 0.6714 11 36 25
12 Malaysia 0.6571 12 41 29
13 Denmark 0.6429 13 3 (10)
14 Germany 0.6143 14 74 60
15 France 0.6000 15 3 (12)
16 Netherlands 0.6000 15 16 1
17 Belgium 0.5857 17 28 11
18 Kazakhstan 0.5571 18 98 80
19 Lithuania 0.5286 19 20 1
20 Slovenia 0.5143 20 55 35

86
Chapter FiveCitizen empowerment and inclusion5 United Nations E-Government Survey 2010
Figure 5.1 is a graphical presentation of table 5.1. The European continues to dominate the top list with almost 50 percent of the countries from the region appearing in the list. The Asian region is next with a little over 30 percent followed by the Americas and Oceania. There were no African countries in the top 35.
What is the level of interaction between gov-ernment and citizens? How does government track citizen usage of its websites? Figure 5.2 is about government interactions with citizens. It also shows the number of countries that have created a secure network for citizens to participate. As figure 5.2 indicates, a very limited number of countries carry out surveys and report the results online.
Figure 5.3 shows the best-performing countries with the largest number of aggregate points for connected services. Australia had the highest con-nected score in 2010, followed by Canada and the Republic of Korea. The top 10 countries are evenly distributed with 50 percent coming from develop-ing and developed regions.
The quality of e-participation in government websites is shown in table 5.2. The e-participation section of the survey was strengthened for the 2010 Survey by adding more questions to the survey in-strument. As a result, countries generally scored lower. Also, more countries have some aspects of e-participation on their websites, with seven ad-ditional countries receiving scores above zero for participation. More specifically, 20 countries re-ceived scores of zero for e-participation in 2008, while this figure has been reduced to 13 countries in 2010. In addition, as the threshold for the e-participation section was elevated due to changes in the survey instrument introduced in 2010, fewer countries could receive scores above the 60 percent of the maximum points.
Figure 5.4 shows the breakdown of countries and their respective e-participation range. There was a slight increase from the 30 percent to 60 percent range and a slight decrease in the over 60 percent range in the 2010 Survey.
E-informationThe assessement of e-information determines
if governments are providing the kind of infor-mation that encourages and empowers citizen participation. This includes online publishing of e-participation policies, a calendar of online dis-cussion forums, and electronic notification tools to alert citizens who want to participate.
Australia scored the highest on the e-information assessment in the 2010 Survey. Japan, Mexico and the Republic of Korea tied for second place. Of all
Figure 5.4 E-participation utilization levels
0 20 40 60 80 100 120 140 160Number of countries
0%13
30% to 60%33
60% to 100%4
1% to 30%142
Figure 5.3 Countries with high points for connected services
0 5 10 15 20 25 30 35 40Total points
Hungary23
Bahrain23
Israel24
United Kingdom25
Spain25
Mongolia25
Colombia27
Republic of Korea31
Canada32
Australia38
Figure 5.2 Government interactions with citizens
0 10 20 30 40 50Number of countries
Australia42
Web usage statistics posted onlinet18
Survey results posted online13
Online surveys21

87
Chapter FiveCitizen empowerment and inclusion 5United Nations E-Government Survey 2010
countries surveyed, 88 percent have some informa-tion about e-participation on their national portals.
How many countries have information about inclusiveness and e-participation on their national websites? Table 5.3 suggests that governments are encouraging citizens by providing information that invites them to be active and to participate. These governments also provide the necessary e-tools to do so.
Table 5.3 Information about e-inclusivness and e-participation
FeatureNumber of
countries Percent
Siteprovidesinformationaboutinclusivenessine-government 49 26
Siteprovidesinformationaboute-participation 39 20
The following countries provide citizens with an updated calendar of events on e-participation that allows people to plan ahead of time if they want to participate: Australia, Belize, Cyprus, Egypt, Japan, Kazakhstan, Kuwait, Libya, Mauritania, Mexico, Pakistan, Peru, Spain and Uruguay. Only 7 percent of the countries surveyed have this option. This represents a slight increase from the 2008 Survey where only 5 percent of the countries surveyed had this option.
Citizen charters or service-level statements are be-coming more popular as governments begin to treat citizens as customers. Very few countries had this option in the 2008 Survey. Table 5.4 suggests that governments are now letting the citizens know what is required of the government when citizens are mak-ing requests online. Citizens can now hold govern-ments accountable for failing to meet the benchmarks within these charters or service level statements.
Table 5.4 Interaction with citizens
FeatureNumber of
countries Percent
Citizencharterorservicelevelstatement 41 21
Facilityforcitizenfeedback 76 40
Informationaboutemploymentopportunities 66 34
E-consultationGovernments are starting, albeit slowly, to use interactive tools to conduct dialogue and receive feedback and inputs from citizens with online survey beginning to gain importance. More
governments are embedding surveys within their portals and websites in order to capture the citi-zen’s view. The United States is leading the field in this category with most government websites being mandated to have a customer satisfaction survey to gauge the sentiments of citizens. Table 5.5 identi-fies a number of interactive tools now in use.
Table 5.5 Interactive tools used by governments
Payment typeNumber of
countries Percent
Onlinepolls 30 16
Onlinesurveysorfeedbackforms 55 29
Chatroomsorinstantmessaging 11 6
Weblogs 20 10
Listservicesornewsgroups 16 8
Otherinteractivetools 33 17
The assessment of e-consultation considers the means used to solicit citizen opinion, feedback and input through online polls, chat rooms, instant
Table 5.2 Quality of e-participation websites of selected countries
Range Country
Score (%)
E-information E-consultation E-decision making Total
Over60%
RepublicofKorea 87.50 78.79 75.00 78.95
Australia 100.00 60.61 68.75 68.42
Kazakhstan 87.50 66.67 62.50 68.42
Bahrain 75.00 66.67 56.25 64.91
30-60%
Spain 75.00 63.64 37.50 57.89
Kyrgyzstan 50.00 63.64 31.25 52.63
Mongolia 62.50 54.55 43.75 52.63
Israel 50.00 51.52 50.00 50.88
NewZealand 50.00 54.55 43.75 50.88
UnitedKingdomofGreatBritain 50.00 60.61 31.25 50.88
Japan 87.50 39.39 50.00 49.12
UnitedStatesofAmerica 50.00 54.55 37.50 49.12
Canada 75.00 36.36 50.00 45.61
China 37.50 39.39 62.50 45.61
Colombia 75.00 39.39 43.75 45.61
Mexico 87.50 51.52 12.50 45.61
Slovenia 50.00 45.45 43.75 45.61
Chile 75.00 39.39 31.25 42.11
Cyprus 50.00 30.30 62.50 42.11
Estonia 50.00 42.42 31.25 40.35
Singapore 50.00 48.48 18.75 40.35
Under30%
Belarus 37.50 33.33 18.75 29.82
France 37.50 36.36 12.50 29.82
Netherlands 75.00 18.18 31.25 29.82
Belgium 62.50 12.12 43.75 28.07
Kenya 37.50 33.33 12.50 28.07
Kuwait 75.00 21.21 18.75 28.07
Turkey 37.50 18.18 37.50 26.32

88
Chapter FiveCitizen empowerment and inclusion5 United Nations E-Government Survey 2010
messaging, blogs, etc. The Republic of Korea scored the highest in the e-consultation section, with Bahrain and Kazakhstan tied for second. Seventy-nine percent of the countries surveyed in 2010 have some aspect of e-consultation.
The use of Web 2.0 tools on government por-tals and websites is still at its infancy stage, with a small number of countries providing this service to its citizens. The number of government sites with online discussion forums rose slightly in 2010.
Feedback forms or online surveys are more commonly used online polls in ministry websites. The ministries of labour tend to use online poll-ing more than other ministries, while the websites of ministries of social services have more feedback mechanisms. Figure 5.5 illustrates the use of e-con-sultation tools to gather public opinion.
E-decision makingThe e-decision making component of the Survey assesses the extent to which countries are com-mitted to empowering citizens to be involved and
are committed to taking into account the citizen’s view when making policy decisions. The Republic of Korea leads in the e-decision making assessment, followed by Australia and Kazakhstan.
Only 9 percent of countries surveyed allow for e-petitions to be submitted to government for consideration from their national and ministry websites. The United Kingdom is one of the lead-ers, with features that allow citizens to sign their petitions and send them directly to the Prime Minister’s Office. E-petition was reviewed as a separate item in the 2010 Survey, whereas in 2008 it was grouped with other electronic tools.
Table 5.6 Web 2.0 tools used in e-decision-making
FeatureNumber of
countries Percent
Onlinediscussionforums 32 17
Archiveofpastdiscussionforums 27 14
Governmentofficialsrespondtocitizeninput 16 8
Governmentofficialsmoderatee-consultations 8 4
Onlinepetitions 17 9
Onlinevoting 17 9
The percentage of countries with government officials responding to citizen feedback is slightly higher in 2010 than it was in 2008. For the most part, government officials at the local levels have a higher level of response to citizen feedback. As in the past, the 2010 Survey only captures data at the national level. It does not include any data on e-government at the local level. Table 5.6 looks at the range of Web 2.0 tools used in e-decision-making.
5.2 Questions of access and diversity
5.2.1 The digital divide and inclusive e-governmentThere is some debate about how fast the digital gap is expanding, but there is no question that it is expanding. As the population continues to grow in developing countries, outpacing that of developed countries, more and more people will be joining the group of digital ‘have-nots’ unless governments work together to dramatically ex-pand access to information and knowledge. One of the most critical e-government challenges fac-ing many governments today is how to bridge the digital divide.
Figure 5.5 Ministry websites with e-consultation features
0 5 10 15 20 25 30 35 40 45Number of countries
4022
Ministry of Social
3528
Ministry of Labor
3127
Ministry of Health
2816
Ministry of Education
3324
Ministry of Finance
Public opinion through online pollsPublic opinionthrough online surveys or feedback forms
Box 5.1 Citizen engagement in economic crisis response
Atthistimeofeconomiccrisis,citizenshavealsobeenveryactive in followingwhatgovernmentsaredoingwith taxpayer dollars. Of the 54 countries that hadcommittedpublicfundstoaddressingthefinancialandeconomiccrisisasofOctober2009,249ofthemhavecreatedwebsitesgeared toproviding informationonfiscalstimulusmeasuresandotherformsofsupporttotheeconomy.However,citizenengagementseemstofollowthesameoldpatterns.Onlyninegovernmentsgivecitizensasay inhowtaxpayerdollarsarespentusingonlinetools.
ObservationNumber of
countriesPercent of total
Commitmentofpublicfundstoaddressingthefinancialandeconomiccrisis
54 100
Governmentwebsiteprovidesinformationonfinancialandbudgetarymeasureslinkedtothecrisis
49 91
Governmentwebsitegivecitizensasayonhowfundsarespentusingonlinetools
9 17

89
Chapter FiveCitizen empowerment and inclusion 5United Nations E-Government Survey 2010
Even in developed countries, many elderly people, low-income individuals and families, and minorities are outside the realm of the digital so-ciety. In order for e-government to be inclusive, it must reach out to all segments of the popula-tion with e-services that meet the needs of the digitally disadvantaged.
In developing countries, expanding access to in-formation and knowledge includes these basic steps:
• Increasing the number of Internet users and personal computer usage;
• Increasing the broadband capacity to allow for greater use of mobile devices for e-government;
• Developing content that citizens find impor-tant and useful;
• Improving education levels, so that citizens are able to use the information and knowledge pro-vided; and
• Encouraging citizen participation.
Governments should take into account lan-guage, culture, content, accessibility and alternate delivery methods in e-services to all segments of the population.
Inclusive planning with citizens prior to the implementation and delivery of services is criti-cal to the success of most e-services. Top-down approaches do not always work. Segments of so-ciety that are consulted are more likely to use the e-services when they are operational. Outreach early on allows governments to take time to com-municate with the beneficiaries of the service prior to its development.
Another aspect of inclusive e-government is service personalization. Personalized and user-driven services should meet and reinforce shared expectations and principles of social justice as well as personal and public value, so they must also be genuinely universal and available to all.3
Inclusive e-government means using a vari-ety of interfaces such as voice, touch-screen and other modalities in the future. The use of multi-channel systems is also important, not only per-sonal computers and the Internet, but also mobile devices, telephone, digital TV, kiosks, etc. Thus, the technology should also result in simplicity, flexibility and choice, with any complex systems hidden to users.4
Digital inclusion is not necessarily social inclu-sion. Social inclusion through the use of ICTs may occur when social actors use it to promote the qual-ity of life in communities; to express local values and cultures; to enhance the political dynamics within communities, countries and regions; to advocate rights and social campaigns; to denounce injustices and to promote gender equality. The possibilities are endless, yet social inclusion requires consis-tent policy support from public administration
Box 5.2 Singapore’s REACH
Singapore:Governmentpoliciesandissues
http://app.reach.gov.sg/reach/
TheGovernmentofSingaporeassignedtheREACHportalasthemain
online platform for e-engagement on public policies and issues.To
encourageonlineengagementwithcitizens,ministriesandagencies
useREACH forannouncementsand feedbackexercises suchas the
annualbudgetandralliesforMayDayandNationalDay.Adedicated
micro-siteprovidesdetailsoftheconsultationexerciseaswellasin-
formationonbudget-relatedissues.Citizensposttheirfeedbackand
suggestions on the micro-site’s discussion threads and, in addition,
citizens not online are involved in the feedback exercise through a
seriesofface-to-facedialogues.
Discussionforumsareseparatedintotwosegments.Postsiniti-
atedbyREACHappearin‘REACH’sDiscussionCorner’andpostsiniti-
atedbycitizensappearin‘YourDiscussionCorner’.Twothirdsofall
discussionsareinitiatedbycitizens.Theonlinediscussionforumsare
consideredveryeffectiveinenablingthegovernmenttogaugesenti-
mentsontheground.
Manycitizensusethemulti-lingualfeaturetoposttranslations
andtoinitiatetranslations.
Box 5.3 E-participation in China
China:NetizensinteractwithGovernmentofficials
http://ask1.news.cn/
WithincreasedInternetpenetrationinChinaandincreasingcitizenship
awarenessoftheopportunitiespresentedbye-participationinpublic
affairs,theGovernmenthasbeenactiveinsolicitingcommentsthrough
onlinechannelsforconsiderationindecision-making.Drawingonideas
expressedinonlinediscussionforums,seniorgovernmentofficialshave
revised,orinsomecaseseliminated,anumberofadministrativerules.
Theemergingtrendofe-participationinChinahasbeengivenaboost
bytopleaders,amongthemPremierWenJiabaowhohasheldonline
chatsessionswiththeaimofsolicitingideasthatcouldinformGovern-
mentpolicyinadvanceoftheannualmeetingoftheNationalPeople’s
Congress.E-participationhasalsobeentakenupattheworkinglevel
bytheStateBureauofAnti-Corruption.Theagencyhasstartedtouse
Government discussion forums to interact with citizens and gather
cluesthatmightberelevanttocorruptioninvestigations.
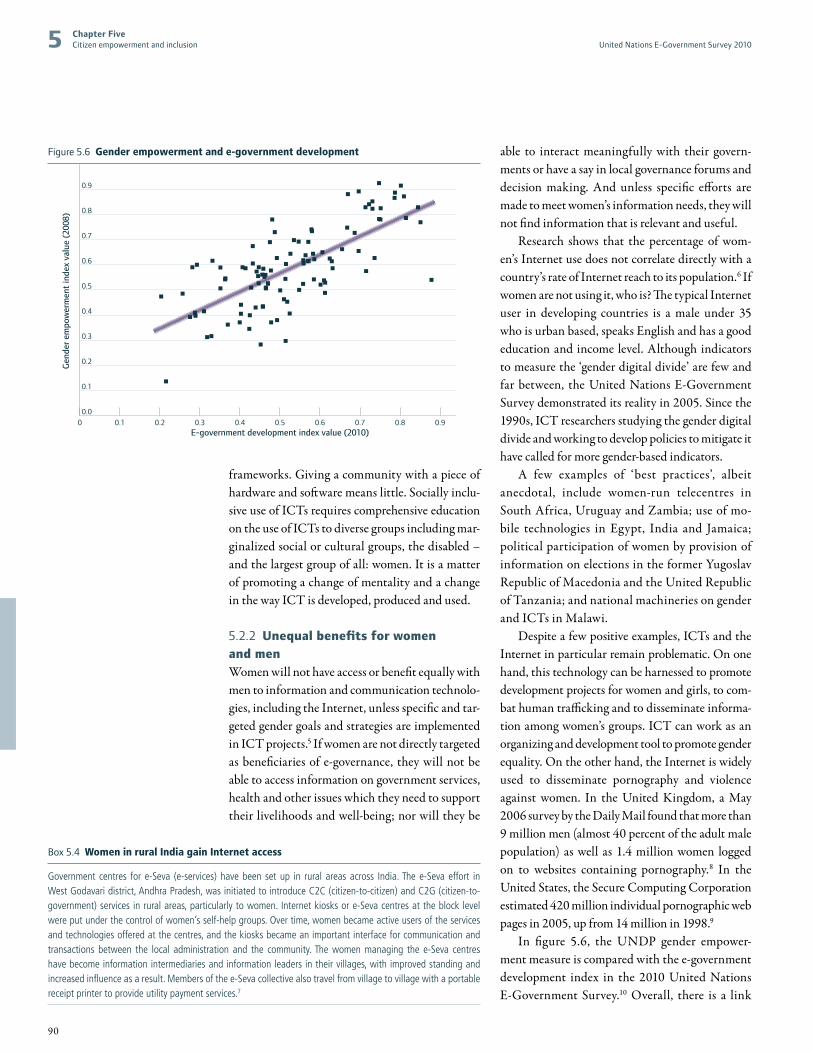
90
Chapter FiveCitizen empowerment and inclusion5 United Nations E-Government Survey 2010
frameworks. Giving a community with a piece of hardware and software means little. Socially inclu-sive use of ICTs requires comprehensive education on the use of ICTs to diverse groups including mar-ginalized social or cultural groups, the disabled – and the largest group of all: women. It is a matter of promoting a change of mentality and a change in the way ICT is developed, produced and used.
5.2.2 Unequal benefits for women and menWomen will not have access or benefit equally with men to information and communication technolo-gies, including the Internet, unless specific and tar-geted gender goals and strategies are implemented in ICT projects.5 If women are not directly targeted as beneficiaries of e-governance, they will not be able to access information on government services, health and other issues which they need to support their livelihoods and well-being; nor will they be
able to interact meaningfully with their govern-ments or have a say in local governance forums and decision making. And unless specific efforts are made to meet women’s information needs, they will not find information that is relevant and useful.
Research shows that the percentage of wom-en’s Internet use does not correlate directly with a country’s rate of Internet reach to its population.6 If women are not using it, who is? The typical Internet user in developing countries is a male under 35 who is urban based, speaks English and has a good education and income level. Although indicators to measure the ‘gender digital divide’ are few and far between, the United Nations E-Government Survey demonstrated its reality in 2005. Since the 1990s, ICT researchers studying the gender digital divide and working to develop policies to mitigate it have called for more gender-based indicators.
A few examples of ‘best practices’, albeit anecdotal, include women-run telecentres in South Africa, Uruguay and Zambia; use of mo-bile technologies in Egypt, India and Jamaica; political participation of women by provision of information on elections in the former Yugoslav Republic of Macedonia and the United Republic of Tanzania; and national machineries on gender and ICTs in Malawi.
Despite a few positive examples, ICTs and the Internet in particular remain problematic. On one hand, this technology can be harnessed to promote development projects for women and girls, to com-bat human trafficking and to disseminate informa-tion among women’s groups. ICT can work as an organizing and development tool to promote gender equality. On the other hand, the Internet is widely used to disseminate pornography and violence against women. In the United Kingdom, a May 2006 survey by the Daily Mail found that more than 9 million men (almost 40 percent of the adult male population) as well as 1.4 million women logged on to websites containing pornography.8 In the United States, the Secure Computing Corporation estimated 420 million individual pornographic web pages in 2005, up from 14 million in 1998.9
In figure 5.6, the UNDP gender empower-ment measure is compared with the e-government development index in the 2010 United Nations E-Government Survey.10 Overall, there is a link
Box 5.4 Women in rural India gain Internet access
Government centres fore-Seva (e-services)havebeen setup in rural areasacross India.Thee-Sevaeffort inWestGodavaridistrict,AndhraPradesh,wasinitiatedtointroduceC2C(citizen-to-citizen)andC2G(citizen-to-government)servicesinruralareas,particularlytowomen.Internetkiosksore-Sevacentresattheblocklevelwereputunderthecontrolofwomen’sself-helpgroups.Overtime,womenbecameactiveusersoftheservicesandtechnologiesofferedatthecentres,andthekiosksbecameanimportantinterfaceforcommunicationandtransactions between the local administration and the community.The women managing the e-Seva centreshavebecomeinformationintermediariesandinformationleadersintheirvillages,withimprovedstandingandincreasedinfluenceasaresult.Membersofthee-Sevacollectivealsotravelfromvillagetovillagewithaportablereceiptprintertoprovideutilitypaymentservices.7
Figure 5.6 Gender empowerment and e-government development
0 0.1 0.2 0.3 0.4 0.5 0.6 0.7 0.8 0.9 1.0E-government development index value (2010)
Gen
der
empo
wer
men
t in
dex
valu
e (2
008)
0.9
0.8
0.7
0.6
0.5
0.4
0.3
0.2
0.1
0.0

91
Chapter FiveCitizen empowerment and inclusion 5United Nations E-Government Survey 2010
between e-government development and gender empowerment although it would be wrong to con-clude from this that gender-sensitive e-government policies are responsible. When telecommunication infrastructure and human capital are removed from the equation, the connection between e-gov-ernment development and gender empowerment is found to be weak. This suggests that economic and social progress in general leads both to higher levels of e-government development and gender empow-erment but that online public services as currently designed may not be contributing much to reduc-tion of inequality between women and men.
Countries that wish to advance on gender equal-ity goals may wish to explore the opportunities offered by e-government in general, and e-participa-tion in particular, to reduce the gender gap.
For ICTs including the Internet, among the first steps are governmental policies addressing:
• Gender-conscious ICT policy development;• Enactment of legal frameworks to promote
ICTs for gender equality;• Improved cross-jurisdictional coordination to
promote gender equality across the actions of public administration institutions;
• Funding for gender equality initiatives using ICTs;
• Closer cooperation between electoral bodies and gender groups.Information and communication technology,
including the Internet, is a powerful enabler of development. It is realizing important efficiency and productivity gains when applied in the private sector, public sector management, health, and education programmes. ICTs are also connect-ing rural and remote populations to the global knowledge economy and supply chain.11 Yet har-nessing the power of the Internet for the good of all citizens is a goal that requires gender-specific action, in the same way that targeted action for gender equality is called for in the Millennium Development Goals.
The trend towards an increasing gender digital divide is alarming, as is and the tremendous dif-ference between the volume of Internet content that denies women’s rights in contrast to content that promotes them. These trends are particularly alarming when considering the array of interna-tionally agreed development goals promoting gen-der equality. n

92

93
Chapter SixMeasuring e-government 6United Nations E-Government Survey 2010
Chapter 6
Measuring e-governmentReliable and relevant e-government measurement can offer crucial signposts to point policy makers and practitioners in the right direction. Yet, how does one go about measur-ing e-government given the diversity of approaches? Some important common threads include a country’s economic strength, technological development and aggregate level of education. All three of these factors pertain to capacity, and two of them – technology and education – are combined with a direct assessment of the state of national online ser-vices to produce the United Nations e-government develop-ment index.
Although methodological work on the United Nations e-government survey has helped elucidate some of the issues in e-government measurement, there is no formal agreement on a common international framework. There is also no single view of how such indicators should be designed so that they remain relevant and practical over time.
6.1 Towards consensus on indicators 94
6.2 Assessing online services and e-participation 95
6.3 Accounting for capacity constraints 96
6.4 Conclusions 97
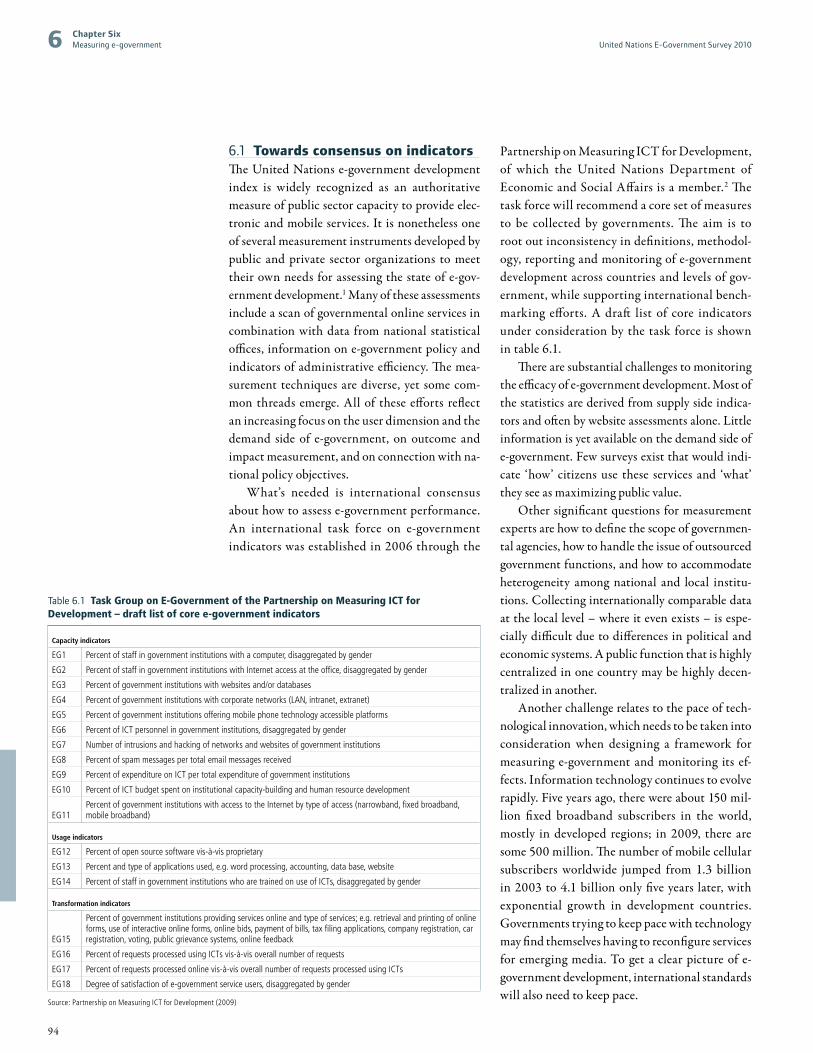
94
Chapter SixMeasuring e-government6 United Nations E-Government Survey 2010
6.1 Towards consensus on indicatorsThe United Nations e-government development index is widely recognized as an authoritative measure of public sector capacity to provide elec-tronic and mobile services. It is nonetheless one of several measurement instruments developed by public and private sector organizations to meet their own needs for assessing the state of e-gov-ernment development.1 Many of these assessments include a scan of governmental online services in combination with data from national statistical offices, information on e-government policy and indicators of administrative efficiency. The mea-surement techniques are diverse, yet some com-mon threads emerge. All of these efforts reflect an increasing focus on the user dimension and the demand side of e-government, on outcome and impact measurement, and on connection with na-tional policy objectives.
What’s needed is international consensus about how to assess e-government performance. An international task force on e-government indicators was established in 2006 through the
Partnership on Measuring ICT for Development, of which the United Nations Department of Economic and Social Affairs is a member.2 The task force will recommend a core set of measures to be collected by governments. The aim is to root out inconsistency in definitions, methodol-ogy, reporting and monitoring of e-government development across countries and levels of gov-ernment, while supporting international bench-marking efforts. A draft list of core indicators under consideration by the task force is shown in table 6.1.
There are substantial challenges to monitoring the efficacy of e-government development. Most of the statistics are derived from supply side indica-tors and often by website assessments alone. Little information is yet available on the demand side of e-government. Few surveys exist that would indi-cate ‘how’ citizens use these services and ‘what’ they see as maximizing public value.
Other significant questions for measurement experts are how to define the scope of governmen-tal agencies, how to handle the issue of outsourced government functions, and how to accommodate heterogeneity among national and local institu-tions. Collecting internationally comparable data at the local level – where it even exists – is espe-cially difficult due to differences in political and economic systems. A public function that is highly centralized in one country may be highly decen-tralized in another.
Another challenge relates to the pace of tech-nological innovation, which needs to be taken into consideration when designing a framework for measuring e-government and monitoring its ef-fects. Information technology continues to evolve rapidly. Five years ago, there were about 150 mil-lion fixed broadband subscribers in the world, mostly in developed regions; in 2009, there are some 500 million. The number of mobile cellular subscribers worldwide jumped from 1.3 billion in 2003 to 4.1 billion only five years later, with exponential growth in development countries. Governments trying to keep pace with technology may find themselves having to reconfigure services for emerging media. To get a clear picture of e-government development, international standards will also need to keep pace.
Table 6.1 Task Group on E-Government of the Partnership on Measuring ICT for Development – draft list of core e-government indicators
Capacity indicators
EG1 Percentofstaffingovernmentinstitutionswithacomputer,disaggregatedbygender
EG2 PercentofstaffingovernmentinstitutionswithInternetaccessattheoffice,disaggregatedbygender
EG3 Percentofgovernmentinstitutionswithwebsitesand/ordatabases
EG4 Percentofgovernmentinstitutionswithcorporatenetworks(LAN,intranet,extranet)
EG5 Percentofgovernmentinstitutionsofferingmobilephonetechnologyaccessibleplatforms
EG6 PercentofICTpersonnelingovernmentinstitutions,disaggregatedbygender
EG7 Numberofintrusionsandhackingofnetworksandwebsitesofgovernmentinstitutions
EG8 Percentofspammessagespertotalemailmessagesreceived
EG9 PercentofexpenditureonICTpertotalexpenditureofgovernmentinstitutions
EG10 PercentofICTbudgetspentoninstitutionalcapacity-buildingandhumanresourcedevelopment
EG11PercentofgovernmentinstitutionswithaccesstotheInternetbytypeofaccess(narrowband,fixedbroadband,mobilebroadband)
Usage indicators
EG12 Percentofopensourcesoftwarevis-à-visproprietary
EG13 Percentandtypeofapplicationsused,e.g.wordprocessing,accounting,database,website
EG14 PercentofstaffingovernmentinstitutionswhoaretrainedonuseofICTs,disaggregatedbygender Transformation indicators
EG15
Percentofgovernmentinstitutionsprovidingservicesonlineandtypeofservices;e.g.retrievalandprintingofonlineforms,useofinteractiveonlineforms,onlinebids,paymentofbills,taxfilingapplications,companyregistration,carregistration,voting,publicgrievancesystems,onlinefeedback
EG16 PercentofrequestsprocessedusingICTsvis-à-visoverallnumberofrequests
EG17 Percentofrequestsprocessedonlinevis-à-visoverallnumberofrequestsprocessedusingICTs
EG18 Degreeofsatisfactionofe-governmentserviceusers,disaggregatedbygender
Source:PartnershiponMeasuringICTforDevelopment(2009)
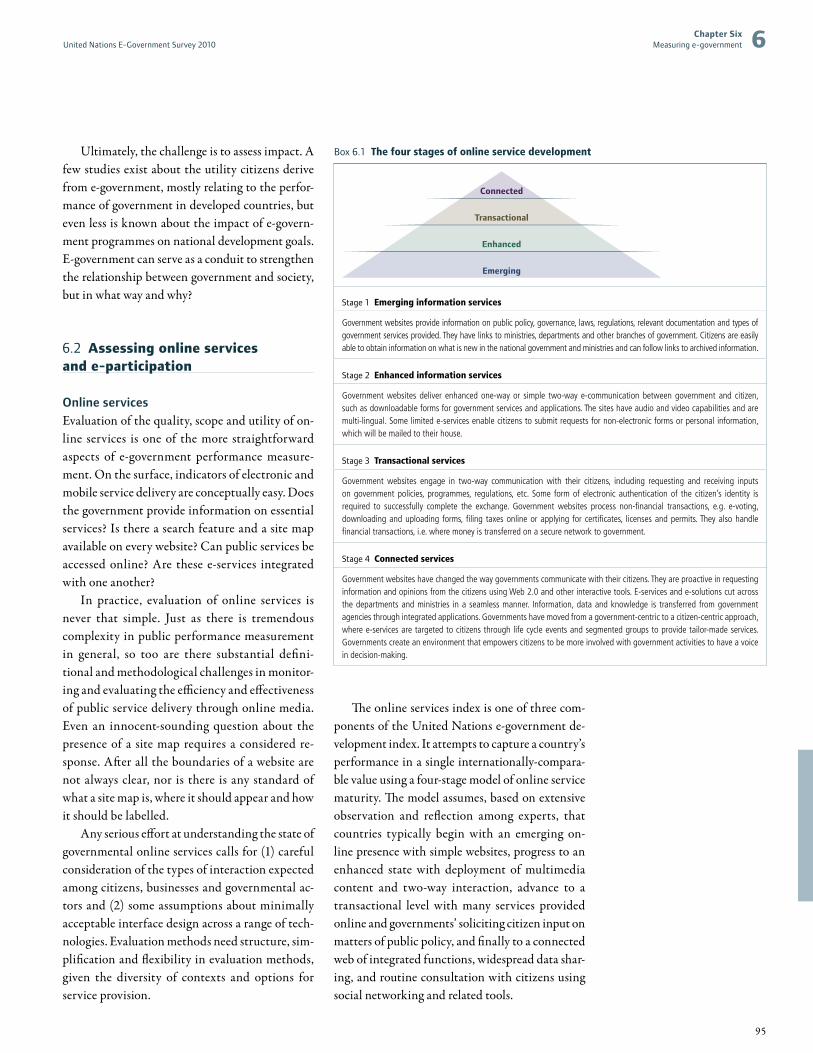
95
Chapter SixMeasuring e-government 6United Nations E-Government Survey 2010
Ultimately, the challenge is to assess impact. A few studies exist about the utility citizens derive from e-government, mostly relating to the perfor-mance of government in developed countries, but even less is known about the impact of e-govern-ment programmes on national development goals. E-government can serve as a conduit to strengthen the relationship between government and society, but in what way and why?
6.2 Assessing online services and e-participation
Online servicesEvaluation of the quality, scope and utility of on-line services is one of the more straightforward aspects of e-government performance measure-ment. On the surface, indicators of electronic and mobile service delivery are conceptually easy. Does the government provide information on essential services? Is there a search feature and a site map available on every website? Can public services be accessed online? Are these e-services integrated with one another?
In practice, evaluation of online services is never that simple. Just as there is tremendous complexity in public performance measurement in general, so too are there substantial defini-tional and methodological challenges in monitor-ing and evaluating the efficiency and effectiveness of public service delivery through online media. Even an innocent-sounding question about the presence of a site map requires a considered re-sponse. After all the boundaries of a website are not always clear, nor is there is any standard of what a site map is, where it should appear and how it should be labelled.
Any serious effort at understanding the state of governmental online services calls for (1) careful consideration of the types of interaction expected among citizens, businesses and governmental ac-tors and (2) some assumptions about minimally acceptable interface design across a range of tech-nologies. Evaluation methods need structure, sim-plification and flexibility in evaluation methods, given the diversity of contexts and options for service provision.
The online services index is one of three com-ponents of the United Nations e-government de-velopment index. It attempts to capture a country’s performance in a single internationally-compara-ble value using a four-stage model of online service maturity. The model assumes, based on extensive observation and reflection among experts, that countries typically begin with an emerging on-line presence with simple websites, progress to an enhanced state with deployment of multimedia content and two-way interaction, advance to a transactional level with many services provided online and governments’ soliciting citizen input on matters of public policy, and finally to a connected web of integrated functions, widespread data shar-ing, and routine consultation with citizens using social networking and related tools.
Box 6.1 The four stages of online service development
Connected
Transactional
Enhanced
Emerging
Stage 1 Emerging information services
Governmentwebsitesprovideinformationonpublicpolicy,governance,laws,regulations,relevantdocumentationandtypesofgovernmentservicesprovided.Theyhavelinkstoministries,departmentsandotherbranchesofgovernment.Citizensareeasilyabletoobtaininformationonwhatisnewinthenationalgovernmentandministriesandcanfollowlinkstoarchivedinformation.
Stage 2 Enhanced information services
Governmentwebsitesdeliver enhancedone-wayor simple two-way e-communicationbetweengovernment and citizen,suchasdownloadableformsforgovernmentservicesandapplications.Thesiteshaveaudioandvideocapabilitiesandaremulti-lingual.Somelimitede-servicesenablecitizenstosubmitrequestsfornon-electronicformsorpersonalinformation,whichwillbemailedtotheirhouse.
Stage 3 Transactional services
Government websites engage in two-way communication with their citizens, including requesting and receiving inputsongovernmentpolicies, programmes, regulations, etc. Some formof electronic authenticationof the citizen’s identity isrequired to successfully complete the exchange. Government websites process non-financial transactions, e.g. e-voting,downloadinganduploading forms,filing taxesonlineorapplying for certificates, licensesandpermits.Theyalsohandlefinancialtransactions,i.e.wheremoneyistransferredonasecurenetworktogovernment.
Stage 4 Connected services
Governmentwebsiteshavechangedthewaygovernmentscommunicatewiththeircitizens.TheyareproactiveinrequestinginformationandopinionsfromthecitizensusingWeb2.0andotherinteractivetools.E-servicesande-solutionscutacrossthedepartmentsandministries inaseamlessmanner. Information,dataandknowledge is transferred fromgovernmentagenciesthroughintegratedapplications.Governmentshavemovedfromagovernment-centrictoacitizen-centricapproach,wheree-servicesaretargetedtocitizensthroughlifecycleeventsandsegmentedgroupstoprovidetailor-madeservices.Governmentscreateanenvironmentthatempowerscitizenstobemoreinvolvedwithgovernmentactivitiestohaveavoiceindecision-making.

96
Chapter SixMeasuring e-government6 United Nations E-Government Survey 2010
E-participationAssessment of e-participation is an area that re-quires particular attention. It is less well-defined than the quality, scope and utility of online service delivery but no less important to the realization of citizen-centric governance. This is particularly relevant at the local level where individuals are most likely to come into contact with public agen-cies. To what degree are governments providing supporting information, actively consulting with citizens through online channels, and involving them in decision-making as a matter of course? Each of these aspects of citizen-centric gover-nance must be defined in concrete, measurable terms, and corresponding data collected, in order to monitor the relationship between online ser-vices and citizen empowerment.
The e-government development index is complemented by an e-participation index. This index attempts to bring some order to measure-ment of e-governance by positing the relevance of three factors in citizen engagement: elec-tronic information dissemination, electronic consultation and electronic participation in decision-making.
Electronic information dissemination entails communication among government, citizens and businesses that supports policy-making. For citi-zens to become engaged in public policy, laws and regulations must be readily accessible, strategies and policies explained, and options under consid-eration clearly presented. This must be done with regard for inclusion of all segments of society, in-cluding rural or isolated areas. This information could be distributed via online newsletters, fo-rums, blogs, community networks, text messaging, email, open data or other services.
Electronic consultation entails communica-tion between government, citizens and businesses at the initiative of the government itself. For con-sultation to be effective, and for citizens to trust the outcome, feedback from citizens needs to be acknowledged with an appropriate response. For example, policy makers may report on the outcome of dialogue with citizens by summarizing the po-sitions of various stakeholders and announcing a way forward. Relevant e-government tools include polls, surveys, chat rooms, blogs, social networks,
newsgroups and other interactive services that fa-cilitate engagement. Online consultation might also be initiated by citizen groups as in the case of electronic petitions.
Electronic participation in decision-making entails communication between citizens and gov-ernment that results in direct citizen input into public policy. Governments elicit feedback from citizens and businesses on government proposals. Alternatively, citizen’s groups might introduce their own proposals for creating or amending pub-lic policies or programmes to be taken up by politi-cal representatives and government officials.
6.3 Accounting for capacity constraintsE-government development is often impeded by constraints in public sector capacity. Such limita-tions often originate in the fragmented informa-tion systems that often accompany organizational complexity and, to a lesser degree, in deficiencies in ICT skills in the public sector work force. These problems are by no means the exclusive domain of developing countries. Indeed, early adopters of information technology in regions with ex-pansive public institutions and programmes may find themselves called upon to integrate back of-fice systems for improved e-government perfor-mance in the face of entrenched organizational structures designed with precisely the opposite purpose in mind, to delegate and decentralize administrative authority. Another common con-straint in the public sector is the need to change mindset and behaviour, a process that can be enabled by appropriate skills development and institutional incentives to address some of the risk associated with implementing individual e-government initiatives.
Recognizing the importance of a support-ive institutional framework, the United Nations E-Government Survey includes an indicator in its development index to capture the existence of a government-wide chief information officer or equivalent post for coordinating national e-govern-ment policy. This is a start. Future work on measur-ing e-government capacity within the public sector might usefully expand beyond ICT infrastructure

97
Chapter SixMeasuring e-government 6United Nations E-Government Survey 2010
and human resource issues to cover, where feasible, adherence to recommended practice in design of institutional machinery, laws, regulations, policies and standards.
Constraints in public sector capacity extend to work processes and the need to measure the connectedness of public agencies behind the scenes. This would be a way of gauging a govern-ment’s capacity to respond to citizen preferences for simplified access to online services. Despite the association between efficient administration and public satisfaction levels, work on measure-ment of ICT within the public sector has so far been quite limited. A newly developed set of in-dicators should assess the internal processes, sys-tems and organizational arrangements required to support efficient e-government functions and better service delivery.
Capacity constraints are very much present on the demand side of the e-government equa-tion as well. Here questions of national ICT de-velopment, human capital and service delivery preferences come into play. A general picture of a population’s ability to access and take advantage of online services is provided by telecommunica-tion infrastructure indicators that cover Internet usage, diffusion of personal computers, main tele-phone lines, and number of mobile cellular and fixed broadband subscribers – along with literacy and education levels.
Two factors are missing from the analysis in the Survey and its indexes. First, the national capacity indicators do not provide breakdowns by population segment. This makes it difficult to assess whether certain groups are at a particular disadvantage when it comes to accessing public services over the Internet. Telecommunication infrastructure data disaggregated by sex is unavailable in most countries, for example, and is not part of the official statistics collected by the International Telecommunication Union. The same is true for different age, language, cultural and income groups, though some of this information might be derived from geo-referencing data at the sub-national level.
Second, usage of e-government services by citi-zens is absent from most e-government measure-ment frameworks. The importance of accounting for demand is well-understood by e-government experts, especially when discussing global or re-gional aggregates. Ways to capture demand for e-government have been suggested by the task force of the Partnership on Measuring ICT for Development. This could be accomplished by mea-suring the percent of requests processed using ICT as a function of the overall number of requests, the percent of requests processed online as a func-tion of the overall number of requests processing using ICT, and the degree of satisfaction of e-gov-ernment service users. None of this data would be easy to collect without a concerted effort on the part of governments.
6.4 ConclusionsA global agreement on a consistent framework for measuring e-government development is called for. Such a platform will likely avoid inconsistent meanings and interpretation by national and local governments, allow for the more effective adoption of best practice solutions from around the world and advance the international comparison of e-government usage and development.
Stakeholders, particularly at the global level, need to continue to support e-government capac-ity-building at the national and local levels. At the same time, model surveys should continue to be followed since they form an important source of international comparability in e-government de-velopment. Surveys such as this one by the United Nations Department of Economic and Social Affairs provide a comparative global picture of ICT in the public sector. Ongoing cooperation in performance measurement could take many forms, from articulation of e-government princi-ples, adoption of open standards and elaboration of indicators, to information sharing, develop-ment of interoperable systems, and multilateral technical assistance. n

98

99
Notes NUnited Nations E-Government Survey 2010
Chapter 1 1 UnitedNations(2009i).
2 GrosandRoth(2009).
3 GrosandRoth(2009).
4 SeeWelch,HinnantandMoon(2005),Tolbert
andMossberger(2006),Freed(2009),Shim
andEom(2009),andLazer,Neblo,Esterling
andGoldschmidt(2009).
5 Parent,VandebeekandGemino(2005).
6 Weil(2008).
7 BritoandOkolski(2009).
8 Hameed(2005).
9 Kaplan,Morillas,RuschandBaxandall(2009).
10 BritoandOkolski(2009).
11 Pearson’sr=0.008,sig.n.s.,n=50.
12 See,forinstance,BaxandallandMagnuson
(2008).
13 PerezandHernandez(2007).
14 IMF(2009c).
15 Pratchett,Durose,Lowndes,Smith,Stokerand
Wales(2009).
16 ForabriefdescriptionofLaPlata’sexperience
seeVerclas(2009).
17 Intheframeworkofthisstudy,theconceptof
online“provisionofservice”isbroaderthanthe
simpleautomationofprocessesanddeliveryof
traditionalgovernmentservicesbymeansofICT.
Amongothers,werefertoinitiativesthatfoster
collaboration,participationandtransparency.
18 AninitiativeofthePewCharitableTrustsin
conjunctionwiththeSunlightFoundation,see
http://subsidyscope.com/projects/bailout/.
19 See,forinstance,TechCrunch(2009).
20 See,forinstance,Eups20(2009).
21 Hereunderstoodas“informationthathasbeen
organisedtoallowidentificationandseparation
ofthecontextoftheinformationfromits
content”.SeeTheNewZealandGovernment
StateServicesCommission(2002).
22 Robinsonetal.2009.
23 LaunchedMay2009,seehttp://www.data.gov/.
24 James(2009).
25 Montanez(2009).
26 Forinstance,thecontractforthesecondversion
oftheUnitedStatesrecovery.govwebsitehas
beenvaluedat$18million,seeGSA(2009).
27Robinson,Yu,ZellerandFelten(2009).
28OpenCongressisalegislativemonitoring
websiteconceivedbytheSunlightFoundation,
anon-governmentalactor,
seehttp://www.opencongress.org/.
29 SeeMeuParlamentowebsite,http://
meuparlamento.com.br/.
30 SeeAppsforDemocracywebsite,
http://www.appsfordemocracy.org/.
31 SeeMySocietywebsite,http://cee.mysociety.org/.
32 Haque(2001).
33 Brito(2008),Perez(2008).
Chapter 2 1 Withinatimeperiodthatisappropriatefor
dealingwithpressingcompetition(explicitor
implicit)thatmaybearisingonanumberof
frontsatroughlythesametime.
2 Oncomplexityinbreadthvs.indepth,see
WangandvonTunzelmann(2000).Complexity
inbreadthissometimestermed‘relational
complexity’,whilecomplexityindepthcanbe
called‘cognitivecomplexity’.
3 GuidaandCrow(2008).
4 Norris(2001).
5 Norris(2001).
6 Aldrich,BertotandMcClure(2002).
7 Robinson,Yu,ZellerandFelten(2009).
8 PärnaandvonTunzelmann(2007).
9 Ontheurbanelectricitysystems,seeHughes
(1983);forthenational‘grid’system,see
Hannah(1979);forrailways,seetherecent
studybyMarkCasson(Casson,2009).
10 Coglianese(2005).
11 Dugdale,Daly,PapandreaandMaley(2005).
12 Coglianese(2005).
13 CroweandMeade(2008).
14 Ward(1996).
15 Clift(2004).
16 TheChiefInformationOfficeroftheObama
administrationisalsothefirstCIOinUnited
Stateshistorytobeastrongsupporterofthe
democratizationofdata.Refertothewebsite
http://www.data.gov/fortheirrecenteffortsto
opengovernmentaldatatocitizens.
17 ThesetermsareassociatedwithAlanGreenspan,
ChairmanoftheUnitedStatesFederalReserve
(1987-2006),whocoined‘irrationalexuberance’
inaspeechin1996,thoughthetermwas
popularizedbytheeconomistRobertShillerin
hisbookwiththattitle(Shiller,2000).‘Social
capabilities’wasaphraseutilizedinamore
positivesettingbythelateMosesAbramovitzin
hispaper,‘Catchingup,forgingaheadandfalling
behind’(Abramovitz,1986).
18 Lo(2008).
19 Greenspan(2008).
20 Compare:AkerlofandShiller(2009).
21 Forinstance,Colander,Follmer,Haas,Goldberg,
Juselius,Kirman,LuxandSloth(2009).
22 Lawson(2009).
23 Gowan(2009).
24 Thereferenceimpliedhereistotheseminal
studybyFrankH.Knight(Knight,1921).Andrew
C.Stirling(Stirling,2007)hassuggesteda2x2
matrixof‘incertitude’,pittingknowledgeabout
outcomesagainstknowledgeaboutlikelihoods.
Knight’scategoryof‘risk’doeswellonboth
counts–theoutcomesarewidelyrecognized,
anditispossibletoassignaprobabilityto
eachoutcome.Knight’scaseof‘uncertainty’
isfarhardertoagreeonaprobabilitybut
theoutcomesarestillwellunderstood.With
‘ignorance’,thislatterisalsolacking.
25 Thesewereexplicitlystatedtolieoutsideour
remit.Althoughthebeginningofthecrisisis
conventionallylinkedtotheSeptember2008
collapseofinvestmentbankersLehmanBrothers,
infactitbeganearlier.Thedismemberingofthe
subprimemortgagemarket,forinstance,began
atLehman’smorethanayearbefore.
26 Geithner(2008).
27 SeealsoKrugman(2008).
28 Gowan(2009).
29 MontgomeryInvestmentTechnology(2002).
30 Blankfein(2009).
31 Refertothe‘PrivateFundInvestment
AdvisersRegistrationActof2009’
(July,2009),seeUnitedStatesDepartment
ofTreasury(2009b).
32 Lo(2009).
33 Ross(2009).
34 Someofthesefeatureswouldbe
changedbytheincomingreformofthe
regulatoryregime.
35 Perez(2002).
36 Melvin,MenkhoffandSchmeling(2009).
37 Lo(2008).
38 Blankfein(2009).
39 Blankfein(2009).
40 Abramovitz(1986).
41 vonTunzelmann(2009).
42 Theearlierofthetwoprincipalstudiesby
WesleyM.CohenandDanielA.Levinthal
(CohenandLevinthal),especially,stresses
thispoint.Seealsotheyetmorewidelycited
subsequentpaper,‘Absorptivecapacity’
(CohenandLevinthal,1990).
43 CohenandLevinthal(1994).
44 Onecantalkofa‘valuenetwork’when
translatingthevarioussupplychainsinto
functions,butnotofaspecific‘valuechain’.
Theterminologyisasourceofgreatconfusion
intheliterature,aconfusionthatdatesbackto
someoftheoriginalcontributionsbyPorter.
SeePorter(1985).
45 Thephrase‘dynamiccompetition’was
popularizedbySchumpeterearlyinthe20th
century;seeSchumpeter(1934).
46 Penrose(2009).
47 Inthecaseofgovernments,‘absorptive
capacity’moreorlessequatestoevidence-
basedpolicylearning.
48 Lo(2009).
49 Colander,Follmer,Haas,Goldberg,Juselius,
Kirman,LuxandSloth(2009).
50 Lawson(2009).Hodgson(2009).
51 VonTunzelmann(2009).
52 MervynA.King,speechtoScottish
businessorganizations,20October2009:
“Toparaphraseagreatwartimeleader,
neverinthefieldoffinancialendeavourhas
somuchmoneybeenowedbysofewtoso
many.And,onemightadd,sofarwithlittle
realreform.”
53 UnitedStatesDepartmentofTreasury(2009a).
54 Creativeaccountingreferstoaccounting
practicesthatmayfollowtheletteroftherules
ofstandardaccountingpractices,butcertainly
deviatefromthespiritofthoserules.See
Griffiths(1986).
55 Ross(2009).
56 IMF(2009a).
57 Blankfein(2009).
58 Blankfein(2009).
59 Krugman(2008).
60 Ross(2009).
61 Forexample,HoogheandMarks(2003).
Notes

100
NotesN United Nations E-Government Survey 2010
62 AccordingtotheOECD(2009),intheir
economicstimuluspackages,countries’
investmentininfrastructureintermsofshares
inGDPare0.82percentforAustralia,1.27
percentforCanada,0.50percentforChile,0.48
percentforFinland,0.24percentforFrance,0.5
percentforGermany,0.16percentforNorway,
0.27percentforSweden,0.072percentfor
Poland,0.03percentforPortugaland0.70
percentforUSA.Interestingly,onlyJapan
(amongasimilarthoughnotidenticalgroupof
countries)specificallymentions“promotionof
e-government”amongitsICTtargets.
63 Tao,Cheung,PainterandLi(Eds.)(2009).
64 IMF(2009b).
65 Thephrasewaspopularizedasapossible
explanationofwhyGreatBritainfellbehind
duringtheso-calledSecondIndustrial
Revolutionafter1870,ratherthanleadingit,as
ithadledthepreviouswave.
66 IntheEconomistIntelligenceUnit’swidely
supportede-readinessindexfor2009,out
ofatotalof70countriesreported,New
Zealandranked11thoverallandEstonia24th,
bothwellaheadoftheirreaGDPpercapita
rankings.NewZealandscoredmorehighlythan
countriessuchastheUnitedKingdom,France,
SwitzerlandorGermany,whileEstoniaranked
aboveSpain,Italy,etc.TheUnitedStateswas
theonlylargecountryinthetop8,ranking5th
in2009.
67 Fransman(ed.)(2006).
68 GuidaandCrow(2008).
69 Suchaviewissharplyatoddswiththatof
MiltonFriedmanontheroleof‘positive
economics’.SeeFriedman(1953).
70 Blankfein(2009).
71 Krugman(2008).
72 EIU(2009).
Chapter 3 1 UnitedNations(2009i).
2 UnitedNations(2009e).
3 AustralianGovernment’slatestreportonthe
country’se-governmentservicesentitled,
“InteractingwithGovernment”,showsthatthe
Internethasreplacedcontactinpersonand
bytelephoneasthemostcommonwaypeople
hasmadetheirlastcontactwithgovernment
in2008,mainlyforconveniencereasons,see
AGMIO(2008).
4 UnitedNations(2003).
5 Goh(2009).
6 OECD(2009a).
7 ITU(2009).
8 InformationSocietyCommission(2003).
9 Osimo,CentenoandBurgelman(2007).
10 ILO(2009).
11 UNDP(2009a).
12 Devanathan(2008).
13 SeeRoyalCourtAffairswebsite,http://www.
rca.gov.om/.
14 WorldSummitAward(2009).
15 Hinsberg(2009).
16 SeeLosingYourJobwebsite,http://www.
losingyourjob.ie/.
17 SeeAutravailwebsite,http://www.autravail.be/.
18 NewYorkStateDepartmentofLabor(2009).
19 UNESCO(2009).
20 Sabhavasu(2009).
21 GlobalResearch(2009).
22 UNESCO(2008).
23 AsianDevelopmentBank(2009b).
24 AblettandSlengesol(2000).
25 SeeStudentFinancewebsite,http://www.
studentfinance.ie/.
26 Unwin(2004).
27 UnitedNations(2009g).
28 Trucano(2009).
29 PouezevaraandKhan(2007).
30 TheGuardianWekly(2009).
31 Gaible(2008).
32 UnitedNations(2009d).
33 UnitedNations(2009j).
34 UnitedNations(2009f).
35 UnitedNations(2009b).
36 WorldBank(2009a).
37 UnitedNations(2009a).
38 Sirimanne(2009).
39 LianyungangCityWomen’sFederation(2009).
40 Kashyapb(2009).
41 Hordosch(2009).
42 WorldBank(2009b).
43 Cole(2009).
44 Howell(2009).
45 Seethee-HealthpageonICTQatar,
http://www.ict.gov.qa/output/Page6.asp.
46 LookingLocal(2009).
47 WorldBank(2009c).
48 JoseandAccra(2009).
49 EnvironmentalSystemsResearchInstitute(2009).
50 AsianDevelopmentBank(2009a).
51 TheAustralian(2009).
52 UnitedNations(2009c).
53 EnvironmentalProtectionAgency(2004).
54 UKDepartmentforCommunitiesandLocal
Government(2008).
55 GermanFederalMinistryfortheEnvironment,
NatureConservationandNuclearSafety(2009).
56 OECD(2009b).
57 OECD(2009c).
58 Kim(2009).
Chapter 4 1 TheUnitedNationsdesignationofleast
developedcountriesisgivenbasedonareview
andrecommendationoftheCommitteefor
DevelopmentPolicy,asubsidiarybodyofthe
EconomicandSocialCouncil.Thecurrentlistof
leastdevelopedcountriesincludes49countries,
33inAfrica,15inAsiaandthePacific,and1in
theCaribbean.
Chapter 5 1 W3CConsortium(2009).
2 SeeWorldEconomicSituationandProspects
2010andWorldEconomicSituationand
ProspectsMonthlyBriefing,April2009.
3 UnitedNations(2009k).
4 Ibid.
5 HafkinandHambley(2002).
6 Huyer,Hafkinetal.(2005).
7 Nath(2006).
8 DailyMail(2006).
9 ThirdWay(2005).
10 UNDP(2009b).
11 WorldBank(2009d).
Chapter 6 1 UnitedNations(2009k).
2 ThePartnershiponMeasuringICT
forDevelopmentiscomposedof11
internationalorganizations:theInternational
TelecommunicationsUnion,UNDepartment
ofEconomicandSocialAffairs,UN
ConferenceonTradeandDevelopment,
UNESCOInstituteforStatistics,WorldBank,
UNEconomicCommissionforAfrica,UN
EconomicCommissionforLatinAmerica
andtheCaribbean,UNEconomicand
SocialCommissionforAsiaandthePacific,
UNEconomicandSocialCommissionfor
WesternAsia,the,OrganizationforEconomic
CooperationandDevelopmentandthe
StatisticalOfficeoftheEuropeanCommunities.

101
References RUnited Nations E-Government Survey 2010
Ablett, J. and I.-A. Slengesol. 2000. Education in Crisis:
The Impact and Lessons of the East Asian Financial Shock
1997-99. Thematic Studies for World Education Forum
Dakar, Senegal, 26 - 28 April 2000. Paris: UNESCO.
Abramovitz, M. 1986. “Catching Up, Forging Ahead and Falling
Behind”. The Journal of Economic History 46 (2): 385-406.
African Development Bank. 2009. “Impact of the Crisis on Afri-
can Economies – Sustaining Growth and Poverty Reduction,
African Perspectives and Recommendations to the G20”.
A report from the Committee of African Finance Ministers
and Central Bank Governors established to monitor the
crisis, March 2009.
Akerlof, G. A. and R. J. Shiller. 2009. Animal Spirits: How Human
Psychology Drives the Economy, and Why It Matters for
Global Capitalism. Princeton: Princeton University Press.
Aldrich, D., J. C. Bertot and C. R. McClure. 2002. “E-Govern-
ment: Initiatives, Developments, and Issues”. Government
Information Quarterly 19 (4): 349-355.
Ash, K. 2009. “National Flu Readiness Initiative Taps Curriki for
E-Learning”. Education Weeks, Digital Education.
Asian Development Bank. 2009a. The Economics of Climate
Change in Southeast Asia: A Regional Review. Mandaluyong
City: Asian Development Bank.
. 2009b. “Proposed Asian Development Fund Grant Mon-
golia: Education for the Poor – Financial Crisis Response
Project”. Project no. 43127, August. Manila: Asian Develop-
ment Bank.
Australian Government Information Management Office. 2008.
Interacting with Government: Australians’ Use and Satisfac-
tion with e-Government Services. Canberra: AGMIO.
Baxandall, P. and B. Magnuson. 2008. Transparency.gov 2.0:
Using the Internet for Budget Transparency to Increase
Accountability, Efficiency and Taxpayer Confidence. Boston:
Masspirg Education Fund.
Beyerstein, L. 2009. “Women’s Groups See Success in Stimulus
- Feminist Organizations Say Pressure Campaign Paid Off”.
The Washington Independent, 29 January.
Blankfein, L. C. 2009. “Lessons from the Financial Crisis”.
A transcript of remarks by L. C. Blankfein to the Council
of Institutional Investors, Spring Meeting, April 2009. The
Harvard Law School Forum on Corporate Governance and
Financial Regulation.
Brito, J. 2008. “Hack, Mash & Peer: Crowdsourcing Government
Transparency”. Columbia Science and Technology Review
9: 119-157.
Brito, J. and G. Okolski. 2009. The Cost of State Online
Spending-Transparency Initiatives. Arlington, VA: George
Mason University, Mercatus Center.
Casson, M. 2009. The World’s First Railway System: Enterprise,
Competition, and Regulation on the Railway Network in
Victorian Britain. Oxford: Oxford University Press.
Clift, S. L. 2004. “E-Government and Democracy: Represen-
tation and Citizen Engagement in the Information Age”.
Publicus.Net.
Coglianese, C. 2005. “The Internet and Citizen Participation
in Rulemaking”. I/S: A Journal of Law and Policy for the
Information Society 1: 33-57.
Cohen, W. M. and D. A. Levinthal. 1989. “The Two Faces of
R&D”. Economic Journal 99: 569-596.
. 1990. “Absorptive Capacity”. Administrative Science
Quarterly 35: 128-156.
1994. “Fortune Favors the Prepared Firm”. Management
Science 40: 227-251.
Colander, D., H. Follmer, A. Haas, M. Goldberg, K. Juselius,
A. Kirman, T. Lux and B. Sloth. 2009. “The Financial Crisis
and the Systemic Failure of Academic Economics”. Kiel
Working Paper No. 1489. Kiel, Germany: Kiel Institute for the
World Economy.
Cole, A. 2009. “Hard times: Public services and the Financial Crisis
- Stronger, Leaner, Fitter…” Guardian Newspaper, 10 June.
Crowe, C. and E. E. Meade. 2008. “Central Bank Independence
and Transparency: Evolution and Effectiveness”. European
Journal of Political Economy 24: 763-777.
Devanathan, G. K. 2008. “Biometric Smart Card”. Information
Technology for Developing Countries – A Newsletter of the
IFIP Working Group 9.4 and Center for Electronic Gover-
nance, Indian Institute of Management, Ahmedabad : 18 (3):
20-23. Ahmedabad: Centre for Electronic Governance and
Indian Institute of Management.
Dugdale, A., A. Daly, F. Papandrea and M. Maley. 2005.
“Accessing e-Government: Challenges for Citizens and
Organizations”. International Review of Administrative
Sciences 71 (1): 109-118.
Economist Intelligence Unit. 2009. E-Readiness Rankings 2009:
the Usage Imperative. EIU and IBM Institute for Business Value.
Environmental Systems Research Institute. 2009. “Algonquin
Forestry Authority in Central Ontario, Canada, Moves Toward
Paperless Reporting and Analysis: Using GIS Across the
Forest”. ESRI ArcNews Online, Winter 2008/2009.
ePractice.eu. 2009. “IS: Ministry of Education Enhances Use of
Free and Open Source Software in Schools”. http://www.
epractice.eu/en/news/293747/. Accessed October 2009.
Eups20. 2009. “Phase 2 Results”. http://eups20.wordpress.
com/phase-two-results/. Accessed September 2009.
Fransman, M. (Ed.). 2006. Global Broadband Battles: Why
the U.S. and Europe Lag While Asia Leads. Palo Alto, CA:
Stanford University Press.
Freed, L. 2009. “Online Transparency, Satisfaction and Trust:
A Study of the Relationship Between Key Concepts and
Goals of the Obama Administration”. Foresee Results.
Friedman, M. 1953. Positive Economics. Chicago: University
of Chicago Press.
References

102
ReferencesR United Nations E-Government Survey 2010
Gaible, E. 2008. Survey of ICT and Education in the Caribbean:
A Summary Report, Based on 16 Country Surveys.
Washington, D.C.: World Bank, Information and Develop-
ment Program.
Geithner, T. F. 2008. “Reducing Systemic Risk in a Dynamic Fi-
nancial System”. Speech at the Economic Club of New York,
New York City. Federal Reserve Bank of New York, 9 June.
Germany, Federal Ministry for the Environment, Nature Conservation
and Nuclear Safety. 2009. “Your community in the Climate
Atlas”. http://www.ufz.de/data/flyer_dein_klima8966.pdf.
Global Research. 2009. “UNESCO Study Warns of Extreme Finan-
cial Crisis Impact on Africa”. http://www.globalresearch.ca/
index.php?context=va&aid=12542. Accessed March 2009.
Goh, C. T. 2009. “Good Governance for Effective e-Government”.
Speech by Mr. Goh Chok Tong, Senior Minister, at the
IGOV Global Exchange Opening, June 2009, at the Suntec
International Convention Center, Singapore.
Gowan, P. 2009. “Crisis in the Heartland: Consequences of
the New Wall Street System”. New Left Review 55 (Jan-
Feb): 5-29.
Greenspan, A. 2008. “We Will Never Have a Perfect Model of
Risk”. Financial Times, 17 October.
Griffiths, I. 1986. Creative Accounting: How to Make Your
Profits What You Want Them to Be? London: Sidgwick and
Jackson Ltd.
Gros, D. and F. Roth. 2009. The Crisis and Citizens’ Trust in Cen-
tral Banks. Brussels: Centre for European Policy Studies.
Guida, J. and M. Crow. 2008. “E-Government and e-
Governance”. In T. Unwin (Ed.), ICT4D – Information and
Communication Technologies for Development. Cambridge:
Cambridge University Press.
Hafkin, N. and H. Hambley. 2002. “Gender, ICTs and Agricul-
ture: A Situation Analysis for the 5th Consultative Expert
Meeting of CTA’s ICT Observatory meeting on Gender and
Agriculture in the Information Society”. http://www.agricta.
org/observatory2002/background_paper.pdf. Accessed
December 2009.
Hameed, F. 2005. “Fiscal Transparency and Economic Out-
comes”. Working Paper No. 05/225. Washington, D.C.:
International Monetary Fund.
Haque, M. S. 2001. “The Diminishing Publicness of Public
Service Under the Current Mode of Governance”. Public
Administration Review 61 (1): 65-78.
Hannah, L. 1979. Electricity before Nationalisation. Hampshire:
Palgrave Macmillan.
Hinsberg, H. 2009. “My better Estonia”. Increasing Citizen En-
gagement in Government., The Intergovernmental Solutions
Newsletter, Fall 2009: 20-21. Washington, D.C.: Center for
Intergovernmental Solutions, U.S. General Services Adminis-
tration Office of Citizens Services and Communications.
Hodgson, G. M. 2009. “The Financial Crisis: How Econo-
mists Went Astray”. http://emmarogan.wordpress.
com/2009/10/23/the-financial-crisis-how-economists-
went-astray/. Accessed October 2009.
Hooghe, L. and G. Marks. 2003. “Unraveling the Central
State, But How?: Types of Multi-Level Governance”.
Political Science Series No. 87. Vienna: Institute for Ad-
vanced Studies.
Hordosch, S. (2009). “ICT and Gender Equality: New Opportuni-
ties and Challenges for Public Administration to Implement
the MDGs”. Paper prepared for the 2010 Committee of
Experts for Public Administration meeting, 19-23 April 2010,
New York.
Howell, C. 2009. “Stimulus Package Contains $19 Billion for
Health Care Technology Spending and Adoption of Electronic
Health Records”. Guest Column on Wisconsin Technology
Network, 15 February.
Hughes, T. P. 1983. Networks of Power: Electrification in
Western Society, 1800-1930. Baltimore: Johns Hopkins
University Press.
Huyer, S., N. Hafkin et al. 2005, Gurumurthy 2006 and Huyer,
2009. “We are no longer ignorant: e-Governance strategies
to overcome the gender divide.” Unpublished paper.
India, Ministry of Communications and Information Technology.
2009. “Core & Support Infrastructure, Common Services
Centre”. http://www.mit.gov.in/default.aspx?id=825. Ac-
cessed December 2009.
Information Society Commission. 2003. E-Government: More
Than an Automation of Government Services. Dublin: Infor-
mation Society Commission.
International Labour Organization. 2009a. Global Employment
Trends. Geneva: ILO.
. 2009b. Recovering From the Crisis: A Global Jobs Pact.
Geneva: ILO.
International Monetary Fund. 2009a. Initial Lessons of the Crisis
for the Global Architecture and the IMF. Washington, D. C.:
IMF, Strategy, Policy, and Review Department.
. 2009b. “Standards and Codes”. http://www.imf.org/
external/standards/index.htm. Accessed July 2009.
. 2009c. “General Data Dissemination System”. http://dsbb.
imf.org/Applications/web/getpage/?pagename=gddshome.
Accessed December 2009.
International Telecommunication Union. 2009. Measuring the In-
formation Society: The ICT Development Index. Geneva: ITU.
James, T. 2009. “Calling Open Data Developers: We Need Your
Help”. Cabinet Office, Digital Engagement Blog, 30 September.
Jose, S. and G. Accra. 2009. “Ghana Leads the World in ICT
for Health”. http://africanliberty.org/node/776. Accessed
September 2009.
Kaplan, S., P. Morillas, E. Rusch and P. Baxandall. 2009.
California Budget Transparency 2.0: Online Tools for Better
Government. Sacramento: Calpirg Education Fund.
Kashyapb, S. 2009. “Microfinance: Leveraging ICTs”. ICTs and
Microfinance 7 (6): 6-8.
Kim, D-C. 2009. “Korean Experience of Overcoming Economic
Crisis through ICT Development”. ESCAP technical paper
no. IDD/TP-09-01. Bangkok: United Nations, Economic and
Social Commission for Asia and the Pacific.

103
References RUnited Nations E-Government Survey 2010
Knight, F. H. 1921. Risk, Uncertainty, and Profit. Boston:
Houghton-Mifflin.
Krugman, P. R. 2008. The Return of Depression Economics and
the Crisis of 2008. New York: W.W. Norton.
Lawson, T. 2009. “The Current Economic Crisis: Its Nature and
the Course of Academic Economics”. Cambridge Journal of
Economics 33: 759-777.
Lazer, D., M. Neblo, K. Esterling and K. Goldschmidt. 2009. Online
Town Hall Meetings: Exploring Democracy in the 21st Century.
Washington, D.C.: Congressional Management Foundation.
Lianyungang City Women’s Federation. 2009. “Lianyungang
City Women’s Federation on the Financial Crisis the Situa-
tion of Women’s Employment, Entrepreneurship Research”.
http://www.women.org.cn/allnews/02/2524.html. Ac-
cessed June 2009.
Lo, A. W. 2008. “Hedge Funds, Systemic Risk, and the Financial
Crisis of 2007-2008: Written Testimony for the House
Oversight Committee Hearing on Hedge Funds”. Working
Paper. Cambridge, MA: MIT Sloan School of Management
and National Bureau of Economic Research.
. 2009. “Regulatory Reform in the Wake of the Financial
Crisis of 2007-2008”. Working Paper. Cambridge, MA:
MIT Sloan School of Management and National Bureau of
Economic Research.
Looking Local. 2009. “Looking Local Launches on Nintendo Wii”.
http://www.digitv.gov.uk/site/news/2009-02-12-wii.html.
Accessed February 2009.
Mattera, P., L. McIlvaine, C. Laicy, M. Lee and T. Cafcas. 2009.
Show Us the Stimulus: an Evaluation of State Government
Recovery Act Websites. Washington, D.C.: Good Jobs First.
Melvin, M., L. Menkhoff and M. Schmeling. 2009. “Exchange
Rate Management in Emerging Markets: Intervention via
An Electronic Limit Order Book”. Journal of International
Economics 79: 54-63.
mHealth Alliance. 2009. “mHealth Spotlight: Rwanda’s Forward-
Looking mHealth Activities”. mPulse: eNewsletter of the
mHealth Alliance 1 (5).
Montanez, L. 2009. “Your Input Wanted on Recovery.gov Data”.
Sunlight Labs, 24 September.
Montgomery Investment Technology. 2002. “Warren Buffet on De-
rivatives”. Camden, NJ: Montgomery Investment Technology.
Nath, 2006, “Empowerment of Women through ICT-empowered
Networks” in Cinderella or Cyberella: Empowering Women
in the Knowledge Society. Hafkin and Huyer. Bloomfield:
Kumarian Press.
New York State Department of Labor. 2009. “Governor
Paterson Announces State-of-the-Art, Web-Based System
in Albany that Electronically Connects the Unemployed with
Potential Job Openings”. http://www.labor.state.ny.us/
pressreleases/2009/October16_2009.htm. Accessed
October 2009.
New Zealand State Services Commission. 2002. A New Zealand
E-Government Interoperability Framework (e-GIF). Canberra:
New Zealand State Services Commission, E-Government Unit.
Norris, P. 2001. Digital Divide: Civic Engagement, Informa-
tion Poverty and the Internet. Cambridge: Cambridge
University Press.
Obama, B. 2008. “Connecting and Empowering All Americans
through Technology and Innovation”. http:// www.baracko-
bama.com/.
Organization for Economic Co-operation and Development.
2009a. Focus on Citizens: Public Engagement for Better
Policy and Services. Paris: OECD.
. 2009b. “The Financial and Economic Crisis: Impact on
e-Government in OECD Countries”. Prepared for the 5th
Ministerial eGovernment Conference, 19-20 November
2009, Malmo, Sweden.
. 2009c. Rethinking e-Government Services: User-centred
approaches. Paris: OECD.
Osimo, D., C. Centeno and J.-C. Burgelman. 2007. “Web 2.0
for eGovernment: Why and How?”. Presentation at the 4th
Ministerial eGovernment Conference, 19-21 September
2007, Lisbon, Portugal.
Pakistan. 2008. “Inaugurating NADRA e-Sahulat Project”.
News release from the Government of Pakistan web-
site. http://202.83.164.26/wps/portal/Moi/. Accessed
November 2008.
Parent, M., C. A. Vandebeek, and A. C. Gemino. 2005. “Building
Citizen Trust through e-Government”. Government Informa-
tion Quarterly 22 (4): 720-736.
Pärna, O. and N. von Tunzelmann. 2007. “Innovation in the Public
Sector: Key Features Influencing the Development and
Implementation of Technologically Innovative Public Services
in the UK, Denmark, Finland and Estonia”. Information Polity
12 (3): 109-126.
Partnership on Measuring ICT for Development. 2009. “Draft list
of e-government indicators”. http://www.itu.int/ITU-D/ict/
conferences/rio09/. Accessed January 2010.
Penrose, E. M. 2009. The Theory of the Growth of the Firm,
[1959]. 3rd edition. New York: Oxford University Press.
Perez, C. 2002. Technological Revolutions and Financial Capital.
Northampton, MA: Edward Elgar.
Perez, C. C. and A. M. L. Hernandez. 2007. “E-government and
Public Financial Reporting: the Case of Spanish Regional
Governments”. American Review of Public Administration 37
(2): 142-177.
Porter, M. E. 1985. Competitive Advantage: Creating and Sustain-
ing Superior Performance. New York: Free Press.
Pouezevara, S. Lucas and R. Khan. 2007. “Innovative Information
and Communication Technology in Education and Its Po-
tential for Reducing Poverty in the Asia and Pacific Region:
Summary of Findings ‘Learning Communities Enabled by
Mobile Technology: A Case Study of School-based, In-
service Secondary Teacher Training in Rural Bangladesh’”.
Prepared by RTI International for Developed for the October
2007 International Conference on ICT for Education, under
Asian Development Bank, TA No. 6278-REG. Manila: Asian
Development Bank.

104
ReferencesR United Nations E-Government Survey 2010
Pratchett, L., C. Durose, V. Lowndes, G. Smith, G. Stoker
and C. Wales. 2009. Empowering Communities to Influ-
ence Local Decision Making: A Systematic Review of the
Evidence. London: Department for Communities and
Local Government.
Robinson, D., H. Yu, W., P. Zeller and E. W. Felten. 2009. “Gov-
ernment Data and the Invisible Hand”. Yale Journal of Law
and Technology 11: 160-175.
Ross, V. 2009. “Lessons from the Financial Crisis”. Speech at the
Chatham House Conference on Global Financial Regulation,
24 March 2009, Bloomberg, London.
Sabhavasu, K. 2009. “Thailand’s Policy Orientation under Global
Turbulence: Making the Most of the ASEAN Economic Inte-
gration”. Speech at the 15th Nikkei International Conference
on “The Future of Asia” on Friday 22nd May 2009, Tokyo.
Schumpeter, J. A. 1934. The Theory of Economic Development.
1st English Edition. Boston: Harvard University Press.
Shiller, R. 2000. Irrational Exuberance. Princeton: Princeton
University Press.
Shim, D. C. and T. H. Eom. 2008. “E-Government and Anti-
Corruption: Empirical Analysis of International Data.” Interna-
tional Journal of Public Administration 31 (3): 298-316.
Sirimanne, S. 2009. “Emerging issue: The Gender Perspectives
of the Financial Crisis”. Written statement at the Interactive
Expert Panel, Commission on the Status of Women, Fifty-
third session, New York, 2-13 March 2009.
Smart Technology. 2007. “Shrinking Australia with ICT”. Interac-
tive Classroom 2 (2): 1-2.
Stirling, A. C. 2007. “Risk, Precaution and Science: Towards a More
Constructive Policy Debate”. Science and Society 8: 309-315.
Tao, J., A. B. L. Cheung, M. Painter and C. Li (Eds.). 2009. Gover-
nance for Harmony in Asia and Beyond. Florence: Routledge.
TechCrunch. 2009. “Gov 2.0: It’s All About The Platform”. http://
www.techcrunch.com/2009/09/04/gov-20-its-all-about-
the-platform/. Accessed July 2009.
Telecentre Magazine. 2008. “Transforming Rural India: 600,000
Villages: Over 100,000 Telecentres”. Interview summery
with R. Chandrashekhar, Additional Secretary e-Governance,
Government of India, Telecentre Magazine, 6 June, India.
The Australian. 2009. “NBN to cut power bills: Conroy”. http://
www.theaustralian.com.au/news/nbn-to-cut-power-bills-con-
roy/story-e6frgal6-1225704763430. Accessed April 2009.
The Daily Mail. 30 May 2006. “Downloads of Net porn hit record
high”. http://www.dailymail.co.uk/news/article-388134/.
Accessed December 2009.
The Guardian Weekly. 2009. “Bangladesh Gets Mobile Lessons”.
http://www.guardianweekly.co.uk/?page=editorial&id=134
2&catID=18. Accessed November 2009.
Third Way. 2005. ”The Porn Standard: Children and Pornography
on the Internet”. http://www.thirdway.org/publications/14/.
Accessed December 2009.
Tolbert, C. J. and K. Mossberger. 2006. “The Effects of E-
Government on Trust and Confidence in Government”. Public
Administration Review 66 (3): 354-70.
Trucano, M. 2009. “Checking in with BridgeIT in Tanzania: Using
Mobile Phones to Support Teachers”. http://blogs.world-
bank.org/edutech/checking-in-with-bridgeit-in-tanzania/.
Accessed September 2009.
United Kingdom Department of Communities and Local Govern-
ment. 2008. An e-Government Truth Potential CO2 Efficien-
cies from Online Provision of Local Government Services.
London: Department of Communities and Local Government.
United Nations. 2003. UN Global E-Government Survey 2003.
New York: United Nations.
. 2009a. “Economic Crisis Set to Drive 53 Million More
People into Poverty in 2009 – World Bank”. http://www.
un.org/apps/news/story.asp?NewsID=29897. Accessed
February 2009.
. 2009b. “Government Must Focus on Women as Economic
Agents During Global Financial Crisis”. Document no.
WOM/1721. New York: United Nations, Department of
Public Information.
. 2009c. Good Practices and Innovations in Public Gover-
nance, UN Public Service Awards Winners and Finalists,
2003-2009. New York: United Nations, Department of
Economics and Social Affairs.
. 2009d. “Outcome of the Conference on the World Financial
and Economic Crisis”. Resolution adopted by the General
Assembly, 9 July 2009. Document no. A/RES/63/303. New
York: United Nations.
. 2009e. “The World Financial and Economic Crisis and Its
Impact on Development”.
Report of the Secretary-General, Conference on the World
Financial and Economic Crisis and Its Impact on
Development. Document no. A/CONF.214/4. New York:
United Nations.
. 2009f. Millennium Development Goals Report 2009.
New York: United Nations, Department of Economics and
Social Affairs.
. 2009g. “New Partnership for Africa’s Development:
Seventh Consolidated Progress Report on Implementation
and International Support”. Report of the Secretary-General.
Document no. A/64/204. New York: United Nations.
. 2009h. MDG Gap Task Force Report 2009: Strengthening
the Global Partnership for Development in a Time of Crisis.
New York: United Nations.
. 2009i. “LINK Global Economic Outlook”. Prepared for
Expert Group Meeting on the World Economy (Project LINK),
26-28 October 2009, Bangkok, Thailand. New York: United
Nations, Department of Economics and Social Affairs.
. 2009j. World Survey on the Role of Woman in Develop-
ment. New York: United Nations, Department of Economics
and Social Affairs.
. 2009k. “Report of the Expert Group Meeting on the
E-Government Survey: Getting to the Next Level”. New York:
United Nations, Department of Economics and Social Affairs.
United Nations Development Programme. 2009a. “E-gov CoP
Report”. New York: UNDP.

105
References RUnited Nations E-Government Survey 2010
. 2009b. “Gender empowerment measure and its compo-
nents”, pp. 186-190, in Human Development Report 2009.
New York: UNDP.
United Nations Educational, Scientific and Cultural Organization.
2008. EFA Global Monitoring Report 2009 - Overcoming
Inequality: Why Governance Matters. Paris and Oxford:
UNESCO and Oxford University Press.
. 2009. “Financial Crisis: Education Budgets Weather the
Storm – So Far”. http://www.unesco.org/en/education/
dynamic-content-single-view/news/financial_crisis_educa-
tion_budgets_weather_the_storm_so_far/back/9195/.
Accessed October 2009.
United States Department of Treasury. 2009a. Financial Regula-
tory Reform – A New Foundation: Rebuilding Financial
Supervision and Regulation. Washington, D.C.: United States
Department of Treasury.
. 2009b. “Title IV – Registration of Advisers to Private
Funds”. Press Release Report. Washington, D.C.: United
States Department of Treasury.
United States Environmental Protection Agency. 2004. “Buying
Green Online Greening Government E-Procurement of Office
Supplies”. Document no. EPA 742-R-04-001. Washington,
D.C.: Environmental Protection Agency.
United States General Services Administration. 2009. “Recovery.
gov Version 2.0 $18 Million Contract Awarded”. GSA News
Releases No. 10607, 8 July. Washington, D.C.: GSA.
Unwin, T. 2004. “Towards a Framework for the Use of ICT in
Teacher Training in Africa”. Revised Version for special issue
of Open Learning: The Journal of Open and Distance Educa-
tion on Open Learning in Less Developed Countries.
Verclas, K. 2009. “Participation Made Easy With SMS:
Participatory Budging and Mobile Tech”. Mobile Active.org,
1 October.
Von Tunzelmann, N. 2009. “Competencies versus Capabilities: A
Reassessment”. Economia Politica. Forthcoming.
Wang, Q. and N. von Tunzelmann. 2000. “Complexity and the
Functions of the Firm: Breadth and Depth”. Research Policy
29: 805-818.
Ward, M. R. 1996. “The Effect of the Internet on Political Institu-
tions”. Industrial and Corporate Change 5 (4): 1127-1141.
Weil, D. 2008. “The Fix We’re In: David Weil on transparency and
the economic crisis”. CV Unbound, 19 October. http://www.
cwunbound.org/2008/10/the-fix-were--3.html. Accessed
January 2010.
Welch, E. W., C. C. Hinnant and M. J. Moon. 2005. “Linking
Citizen Satisfaction with E-Government and Trust in Govern-
ment”. Journal of Public Administration Research and Theory
Advance 15 (3): 371-391.
West, D. M. 2008. State and Federal Electronic Government in the
United States, 2008. Washington, D.C.: Governance Studies
at Brookings.
World Bank. 2009a. “Impact of Financial Crisis on Women and
Families”. Washington, D.C.: World Bank, PREM Gender
and Development.
. 2009b. Averting a Human Crisis During the Global Crisis:
Policy Options from the World Bank’s Human Development
Network. Washington, D.C.: World Bank.
. 2009c. World Development Indicators. Washington, D.C.:
World Bank.
. 2009d. “ICTs for Women’s Empowerment”. http://
go.worldbank.org/G8HGH1UBR0. Accessed December 2009.
World Summit Award. 2009. “Oman Multimedia Product is Best
in the World”. News brief at the World Summit Award, 19
July 2009, Salzburg/Maskat.
W3C Consortium. 2009. “Improving Access to Government
though Better Use of the Web”. W3C Interest Group Note
12. W3C Consortium, E-Government Interest Group.
http://www.w3.org/TR/egov-improving/. Accessed
December 2009.

106

107
Statistical annex
A
108
Statistical annex Survey methodology 109 Data tables 114 Regional groupings 125
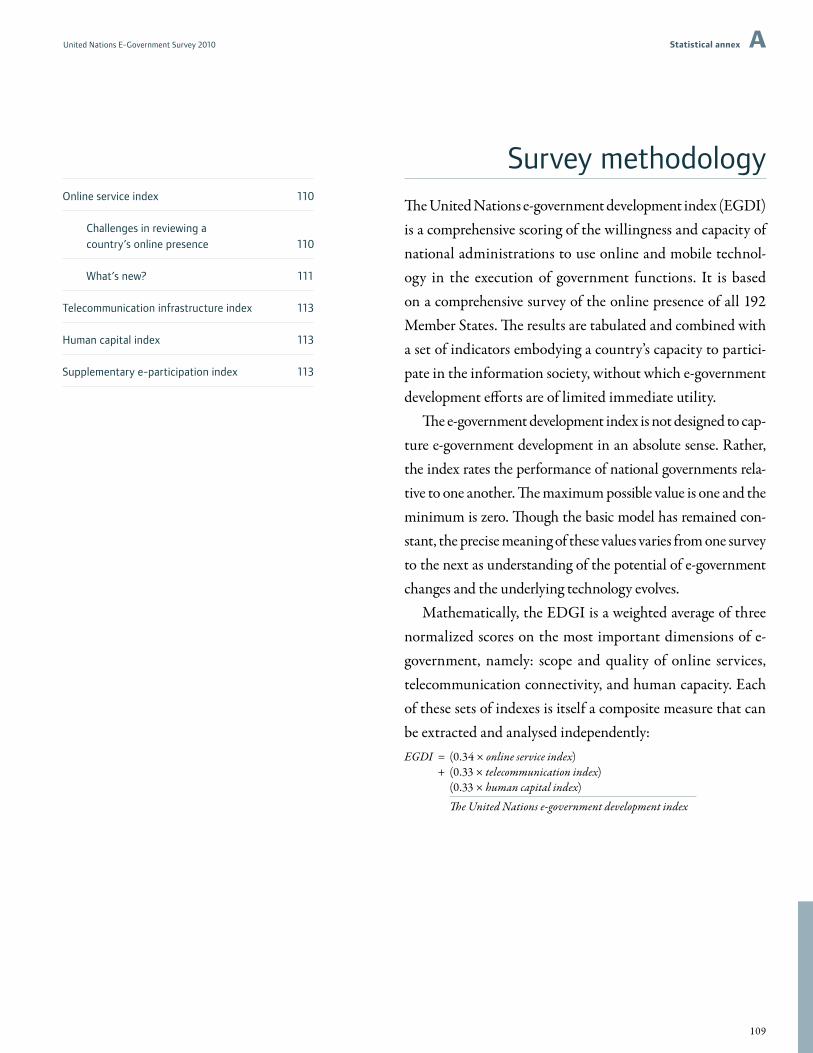
109
Statistical annex AUnited Nations E-Government Survey 2010
Survey methodologyThe United Nations e-government development index (EGDI) is a comprehensive scoring of the willingness and capacity of national administrations to use online and mobile technol-ogy in the execution of government functions. It is based on a comprehensive survey of the online presence of all 192 Member States. The results are tabulated and combined with a set of indicators embodying a country’s capacity to partici-pate in the information society, without which e-government development efforts are of limited immediate utility.
The e-government development index is not designed to cap-ture e-government development in an absolute sense. Rather, the index rates the performance of national governments rela-tive to one another. The maximum possible value is one and the minimum is zero. Though the basic model has remained con-stant, the precise meaning of these values varies from one survey to the next as understanding of the potential of e-government changes and the underlying technology evolves.
Mathematically, the EDGI is a weighted average of three normalized scores on the most important dimensions of e-government, namely: scope and quality of online services, telecommunication connectivity, and human capacity. Each of these sets of indexes is itself a composite measure that can be extracted and analysed independently:EGDI = (0.34 × online service index) + (0.33 × telecommunication index) (0.33 × human capital index)
The United Nations e-government development index
Online service index 110
Challenges in reviewing a country’s online presence 110
What’s new? 111
Telecommunication infrastructure index 113
Human capital index 113
Supplementary e-participation index 113

110
Statistical annexA United Nations E-Government Survey 2010
Online service indexTo arrive at a set of online service index values, the re-search team assessed each country’s national website as well as the websites of the ministries of education, labour, social services, health and finance. Associated portals and subsidiary websites were considered part and parcel of the parent sites and taken into consid-eration when assigning values to survey responses. Among other things, the national sites were tested for a minimal level of Web content accessibility as de-scribed in the Web Content Accessibility Guidelines of the World Wide Web Consortium.
The survey itself has four sections correspond-ing to the four stages of e-government develop-ment. The first of these includes questions relating to attributes that would be considered typical of an emerging online presence, the second to an enhanced presence, the third to a transactional presence and the fourth to a connected presence. Almost all questions in the survey call for a binary response of yes or no, with “yes” given one point and “no” zero. Exceptions include a small num-ber of questions designed to capture data on the number of forms and e-services available. These are worth up to ten points each.
The value for a given country is equal to the total number of points scored by that country less the lowest score for any country divided by the range of values for all countries in the survey. For example, if country “x” were to score 233, with the lowest score of any country equal to 20 and the highest equal to 403, then the online services value for country “x” would be:Online service index (country “x”) = (233-20) = 0.5561 (403-20)
The research team followed a citizen-centric ap-proach to assessment of online services, among other things by putting themselves in the place of the av-erage user. Thus, responses were generally based on whether the relevant feature(s) could be found and accessed easily, not whether they in fact exist. As the number of national websites grows, this becomes in-creasingly important. While it is possible, although implausible, to spend hours browsing a government website meticulously for all content and features, this approach misses the key point that for informa-tion and services to be “usable” they must be readily discoverable by the intended beneficiaries.
The actual time spent by the survey team on any given country assessment diverged widely depend-ing on how varied the online presence was, the de-gree of user-friendliness and the amount of content offered. A researcher would typically review one or two countries per day. Once completed, the assess-ment would be validated by a senior researcher who would further confer with the team leader in cases of doubt. A number of countries were selected at random for a full reassessment, as were anomalous results that appeared to be inconsistent with prior year trends. Each site was reviewed by at least two researchers, one or more of whom had multiple years’ experience in assessing online services of the public sector.
Challenges in reviewing a country’s online presenceIdentification of the national websiteAll Member States were invited to supply the ad-dresses of their own top-level national and min-isterial websites to be used as a starting point by the survey team. Responses could be submitted by postal mail, email, fax or online. Approximately thirty per cent of Member States responded. In cases where no response was received, the survey team used a variety of search engines to locate the most relevant sites.
Where more than one entry point for a national or ministerial site was identified, the research team would evaluate features on all relevant sites provided links were clearly indicated. If no sites were found that could reasonably be classified as the national site, for example emanating from the Head of Government, zero points were accorded for related questions. This has become less and less common since the survey was introduced in 2003.
Some countries do not offer certain public ser-vices at the federal level, but rather at the regional level. It should be clearly indicated that no country is penalized for offering a service at the regional as opposed to the federal level per se. In fact, when the issue arises researchers tend to be inclusive in as-sessing the matter as long as the information and/or service can be found from the national level.
A more difficult problem arises when not only a specific service is located at the local level but when the entire ministerial functions are altogether

111
Statistical annex AUnited Nations E-Government Survey 2010
missing at the national level. If researchers are un-able to locate a ministry as per the above described method, then the final step was to find out whether the country in question actually has such a minis-try at the national level or whether the functions might be locally administered.
Identification of ministerial websitesAnother dilemma, albeit a minor one, arises in those countries where one or more ministries are combined into a single entity. Most notably, a fair number of countries have a ministry of health and social welfare or similar institutional arrangement. In these cases, the ministry is assessed as usual and its score simply duplicated for each of the covered ministries. Similarly, a very small number of coun-tries have combined three ministries, namely, la-bour, social and health ministries into one. Here the score would be multiplied by three.
Finding and selecting the appropriate site(s) at the ministerial level has been in the past a typically easier task because most national sites provide links to the ministries, often under a clearly defined header or subsection. However, as the use of the Internet has expanded, so too has the growth of government websites in general and programme sites in particular. This year, re-searchers have noted a significant increase in the number of programme and subject specific sites. If these separate sites were tightly integrated and easily linked to an official ministry site, they were scored for specific features. However, if they were not tightly integrated, then those separate sites were not scored.
Language limitationsThe research team was fully equipped to handle the six official languages of the United Nations, namely Arabic, Chinese, English, French, Russian and Spanish. However, as in previous survey cycles, the team went well beyond this mandate and made every effort to review each country in the official language of the country or, where that was not pos-sible, in another of the languages available on the site. Translators provided assistance as necessary. It is acknowledged that lack of linguistic parity on multilingual sites may have introduced errors in scoring on occasion.
What’s new?The methodological framework for the United Nations e-government development index has re-mained consistent across survey periods. At the same time, survey questions have been adjusted to reflect evolving knowledge of best practices in e-government, changes in technology and other factors, and data collection practices have been pe-riodically refined.
In the current round, 25 questions were added to the survey instrument, 29 questions were modified and 16 questions were removed. Greater emphasis was given to online services and e-partic-ipation than in previous years with more granular questions about the type of services provided. This included availability of mobile applications, Web 2.0 tools, use of online services by citizens, and the extent to which governments are integrating back-office operations. The result was a significantly enhanced survey instrument with a wider range of point distributions that better reflects the relative differences in levels of e-government development among countries.
Extension of the survey windowThe survey window in 2003 and 2005 was sixty days. In 2008, this was shortened to thirty days to order to come closer to capturing a snapshot in time. This policy proved to be difficult for two reasons. First, there was little gained in the way of understanding either about the situation in individual countries or about regional and global trends by constricting the study in this way. Indeed, researchers were instructed to try connect-ing to the relevant government websites on two dif-ferent dates, but not more than that, in order to get a fuller picture of availability while maintaining the citizen-centric perspective. Second, shorten-ing of the window proved to be very difficult for the team to accommodate the amount of planning, research and validation work required. Therefore, both for quality assurance purposes and as a prac-tical matter, the survey window was extended to a full seventy-five days.
Enhanced citizen-centric approachThe research team was instructed to enforce the citizen-centric approach even more rigorously than

112
Statistical annexA United Nations E-Government Survey 2010
in previous surveys. If features could not be found easily, quickly and intuitively, then a site would score poorly. Researchers were asked not to make extraordinary efforts to seek out information and services wherever they might be. As noted above, the question behind the questions was always, “Can the user find it easily?” as opposed to, “Does it exist somewhere on the site?”
Identification of sites for reviewThe identification of national and ministry websites for evaluation has always been one of the most difficult issues facing research teams. Over the course of the survey, researchers typi-cally evaluate more than 1,000 top-level web sites as well as their constituent sub-sites. In past years, the team would spend a significant amount of time locating and verifying top-level Web addresses before initiating a country review. This time, the United Nations Department of Economic and Social Affairs invited Member States to supply the addresses of the national and ministry websites that should be included in the survey. Although the response from Member States was incomplete, and additional searching was required, the practice was found to be help-ful both to Member States and to the Secretariat, and will be continued in future.
Greater scrutiny of sitesResearchers were instructed and trained to take advantage of the extended survey window to scrutinize sites even more closely than in past years with the caveat that the citizen-centric approach should prevail. There has been a geo-metric increase in the number of websites to be assessed since the last round as well as in the amount of information and number of services available and degree of sophistication. This un-doubtedly ref lects both the value of e-govern-ment in public administration reform and the rapid evolution of information and communica-tion technology. At the same time, the team had to maintain a careful balance between in-depth research and consideration of usability to ensure the most reliable scores possible, especially for countries with a poorly designed but expanding web presence.
Emphasis on interactive, transactional and integrated servicesGreater weight was given to development of partici-patory and integrated transactional services than in the past as a reflection of the need to promote inclu-sion and narrow the digital divide. Countries with an Internet penetration rate greater than or equal to 50 percent could receive up to 25 additional points for the use of blogs, discussion forums, online chat features, bulletin boards and social networking tools, online voting and petitioning, and calen-dars of e-participation events, while countries with an Internet penetration rate below 50 percent but above 30 percent were eligible to receive up to 10 ad-ditional points. A further 5 points were awarded to countries having an Internet penetration rate of at least 30 percent if integrated transactional services were provided through the national portal.
International research teamA web-based information management system was used by an international team of researchers for managing the survey effort and tracking results. Team leaders conducted training online, held virtual help sessions, and worked in tandem with country researchers and language specialists as needed to produce high quality results. During recruitment, a premium was also placed on proficiency in multiple languages to promote consistency in scoring. The smaller team and online management enabled senior researchers to follow the process closely and reinforce adherence to common data collection standards. A second quality assurance team within the United Nations Department of Economic and Social Affairs validated the findings through a series of spot checks and verification of values outside the expected range.
Improved quality assuranceData received from the primary research team were validated by a second-level quality assurance group to ensure that sites were rated with maximum ob-jectivity and accuracy. The quality assurance proce-dure resulted in adjustment of scores for a number of countries. The United Nations Department of Economic and Social Affairs is committed to en-suring impartiality and rigour in its survey meth-ods and will continue to enhance quality assurance procedures in future.

113
Statistical annex AUnited Nations E-Government Survey 2010
Telecommunication infrastructure indexThe telecommunication infrastructure index is a composite of five indicators: number of personal computers per 100 persons, number of Internet users per 100 persons, number of telephone lines per 100 persons, number of mobile cellular subscrip-tions per 100 persons and number of fixed broad-band subscribers per 100 persons. The International Telecommunication Union was the primary source of data in each case.
Each of these indicators was normalized by taking its value for a given country subtracting the lowest value for any country in the survey and dividing by the range of values for all coun-tries. For example, if country “x” were to have 36.69 Internet users per 100 inhabitants, with the lowest value of any country equal to 0 and the highest equal to 88.87, then the normalized value of this indicator for country “x” would be given by:Internet penetration index (country “x”) = (36.69-0) = 0.4129 (88.87-0)
The telecommunication infrastructure index for country “x” is then the simple arithmetic mean of each of the five normalized indicators derived in this way:Telecommunication infrastructure index =
Average (personal computer index + Internet user index + telephone line index + mobile subscription index + fixed broadband index)
Human capital indexThe human capital index is a composite of two indicators: adult literacy rate and the combined primary, secondary, and tertiary gross enrollment ratio. The United Nations Educational, Scientific and Cultural Organization was the main source of data in both cases. Gaps were completed to the extent possible using data from the 2009 UNDP Human Development Report.
The two indicators were normalized by tak-ing their values for a given country subtracting the lowest value for any country in the sur-vey and dividing by the range of values for all
countries. For example, if country “x” were to have an adult literacy rate of 66.8 per 100 inhab-itants, with the lowest value of any country equal to 28.7 and the highest equal to 99.5, then the normalized value of this indicator for country “x” would be given by:Adult literacy index (country “x”) = (66.8-28.7) = 0.5381 (99.5-28.7)
The human capital index for country “x” is then the weighted arithmetic mean of the two normal-ized indicators derived in this way with adult literacy assigned a weight of 0.6667 and gross en-rollment 0.3333:Human capital index = ⅔ × adult literacy index + ⅓ × gross enrollment index
Supplementary e-participation indexThe e-participation questions expand the survey by emphasizing quality in the connected presence stage of e-government. These questions focus on the use of the Internet to facilitate provision of information by governments to citizens (“e-infor-mation sharing”), interaction with stakeholders (“e-consultation”) and engagement in decision-making processes (“e-decision making”). A coun-try’s e-participation index value reflects how useful these features are and the extent to which they have been deployed by the government compared to all other countries. The purpose of this measure is not to prescribe any particular practice, but rather to offer insight into how different countries are using online tools to promote interaction between citizen and government, as well as among citizens, for the benefit of all.
The e-participation index calculated in this way is then normalized by taking their values for a given country subtracting the lowest value for any country in the survey and dividing by the range of values for all countries. For example, if country “x” were to have an e-participation s core of 30, with the lowest value of any country equal to 0 and the highest equal to 45, then the normalized index value for country “x” would be given by:E-participating index (country “x”) = (30-0) = 0.6667 (45-0)

114
Statistical annexA United Nations E-Government Survey 2010
Data tables
Rank Country Index value
Of which
Online service component
Telecom-munication
infrastructure component
Human capital component
1 RepublicofKorea 0.8785 0.3400 0.2109 0.3277
2 UnitedStates 0.8510 0.3184 0.2128 0.3198
3 Canada 0.8448 0.3001 0.2244 0.3204
4 UnitedKingdom 0.8147 0.2634 0.2364 0.3149
5 Netherlands 0.8097 0.2310 0.2530 0.3257
6 Norway 0.8020 0.2504 0.2254 0.3262
7 Denmark 0.7872 0.2288 0.2306 0.3278
8 Australia 0.7863 0.2601 0.1983 0.3278
9 Spain 0.7516 0.2601 0.1683 0.3231
10 France 0.7510 0.2321 0.1965 0.3225
11 Singapore 0.7476 0.2331 0.2107 0.3037
12 Sweden 0.7474 0.1792 0.2482 0.3200
13 Bahrain 0.7363 0.2483 0.1932 0.2948
14 NewZealand 0.7311 0.2170 0.1864 0.3278
15 Germany 0.7309 0.1867 0.2295 0.3146
16 Belgium 0.7225 0.2126 0.1880 0.3218
17 Japan 0.7152 0.2288 0.1730 0.3134
18 Switzerland 0.7136 0.1511 0.2537 0.3088
19 Finland 0.6967 0.1630 0.2059 0.3278
20 Estonia 0.6965 0.1705 0.2070 0.3190
21 Ireland 0.6866 0.1695 0.1894 0.3277
22 Iceland 0.6697 0.1349 0.2110 0.3238
23 Liechtenstein 0.6694 0.1781 0.1786 0.3127
24 Austria 0.6679 0.1619 0.1893 0.3167
25 Luxembourg 0.6672 0.1295 0.2355 0.3021
26 Israel 0.6552 0.1986 0.1430 0.3136
27 Hungary 0.6315 0.1716 0.1432 0.3167
28 Lithuania 0.6295 0.1641 0.1456 0.3198
29 Slovenia 0.6243 0.1360 0.1659 0.3224
30 Malta 0.6129 0.1597 0.1605 0.2927
31 Colombia 0.6125 0.2418 0.0799 0.2908
32 Malaysia 0.6101 0.2148 0.1134 0.2819
33 CzechRepublic 0.6060 0.1543 0.1405 0.3112
34 Chile 0.6014 0.2072 0.0895 0.3047
35 Croatia 0.5858 0.1436 0.1393 0.3030
36 Uruguay 0.5848 0.1630 0.1050 0.3168
37 Latvia 0.5826 0.1414 0.1241 0.3171
38 Italy 0.5800 0.0982 0.1622 0.3196
39 Portugal 0.5787 0.1317 0.1382 0.3088
40 Barbados 0.5714 0.0680 0.1819 0.3215
41 Greece 0.5708 0.1209 0.1263 0.3235
42 Cyprus 0.5705 0.1263 0.1428 0.3015
43 Slovakia 0.5639 0.1177 0.1390 0.3072
44 Bulgaria 0.5590 0.1392 0.1112 0.3086
45 Poland 0.5582 0.1317 0.1113 0.3152
46 Kazakhstan 0.5578 0.1792 0.0593 0.3194
47 Romania 0.5479 0.1414 0.1021 0.3045
48 Argentina 0.5467 0.1403 0.0928 0.3136
49 UnitedArabEmirates 0.5349 0.0853 0.1793 0.2703
50 Kuwait 0.5290 0.1565 0.0833 0.2892
51 Jordan 0.5278 0.1813 0.0596 0.2869
52 TFYRMacedonia 0.5261 0.1090 0.1255 0.2916
53 Mongolia 0.5243 0.1889 0.0342 0.3012
54 Ukraine 0.5181 0.1177 0.0821 0.3184
Rank Country Index value
Of which
Online service component
Telecom-munication
infrastructure component
Human capital component
55 AntiguaandBarbuda 0.5154 0.0410 0.1730 0.3014
56 Mexico 0.5150 0.1500 0.0713 0.2936
57 Andorra 0.5148 0.0788 0.1457 0.2903
58 SaudiArabia 0.5142 0.1058 0.1330 0.2754
59 RussianFederation 0.5136 0.1123 0.0913 0.3101
60 Montenegro 0.5101 0.1069 0.1093 0.2940
61 Brazil 0.5006 0.1252 0.0838 0.2916
62 Qatar 0.4928 0.0950 0.1046 0.2932
63 Peru 0.4923 0.1392 0.0590 0.2941
64 Belarus 0.4900 0.1025 0.0687 0.3188
65 Bahamas 0.4871 0.0788 0.1156 0.2927
66 Tunisia 0.4826 0.1641 0.0641 0.2544
67 TrinidadandTobago 0.4806 0.1155 0.0760 0.2891
68 BruneiDarussalam 0.4796 0.0961 0.0892 0.2943
69 Turkey 0.4780 0.1177 0.0852 0.2752
70 Venezuela 0.4774 0.1036 0.0766 0.2971
71 CostaRica 0.4749 0.1036 0.0800 0.2913
72 China 0.4700 0.1252 0.0631 0.2817
73 ElSalvador 0.4700 0.1446 0.0635 0.2619
74 BosniaandHerzegovina 0.4698 0.0939 0.0827 0.2932
75 SaintKittsandNevis 0.4691 0.0345 0.1417 0.2929
76 Thailand 0.4653 0.1133 0.0576 0.2943
77 Mauritius 0.4645 0.1004 0.0874 0.2768
78 Philippines 0.4637 0.1338 0.0368 0.2931
79 Panama 0.4619 0.0961 0.0727 0.2932
80 RepublicofMoldova 0.4611 0.1004 0.0638 0.2970
81 Serbia 0.4585 0.0756 0.0889 0.2940
82 Oman 0.4576 0.1252 0.0690 0.2633
83 Azerbaijan 0.4571 0.1101 0.0439 0.3031
84 DominicanRepublic 0.4557 0.1241 0.0547 0.2769
85 Albania 0.4519 0.1058 0.0538 0.2924
86 Egypt 0.4518 0.1803 0.0414 0.2301
87 Uzbekistan 0.4498 0.1284 0.0282 0.2931
88 SaintLucia 0.4471 0.0378 0.1158 0.2934
89 Jamaica 0.4467 0.0777 0.0930 0.2759
90 VietNam 0.4454 0.1036 0.0746 0.2672
91 Kyrgyzstan 0.4417 0.1079 0.0303 0.3035
92 Maldives 0.4392 0.0550 0.0952 0.2889
93 Lebanon 0.4388 0.0907 0.0648 0.2833
94SaintVincentandtheGrenadines 0.4355 0.0443 0.1216 0.2697
95 Ecuador 0.4322 0.1079 0.0526 0.2716
96 Cuba 0.4321 0.0820 0.0206 0.3296
97 SouthAfrica 0.4306 0.1047 0.0476 0.2783
98 Bolivia 0.4280 0.1036 0.0302 0.2942
99 Grenada 0.4277 0.0637 0.0795 0.2845
100 Georgia 0.4248 0.0842 0.0384 0.3022
101 Paraguay 0.4243 0.0896 0.0473 0.2875
102 Iran(IslamicRepublicof) 0.4234 0.0907 0.0712 0.2616
103 Palau 0.4189 0.0183 0.0840 0.3165
104 Seychelles 0.4179 0.0194 0.1002 0.2983
105 Dominica 0.4149 0.0173 0.1177 0.2800
106 Guyana 0.4140 0.0615 0.0424 0.3101
107 Honduras 0.4065 0.1004 0.0419 0.2642
E-government development index

115
Statistical annex AUnited Nations E-Government Survey 2010
Rank Country Index value
Of which
Online service component
Telecom-munication
infrastructure component
Human capital component
108 CapeVerde 0.4054 0.0917 0.0543 0.2593
109 Indonesia 0.4026 0.0831 0.0377 0.2818
110 Armenia 0.4025 0.0594 0.0422 0.3009
111 SriLanka 0.3995 0.0885 0.0357 0.2753
112 Guatemala 0.3937 0.1047 0.0504 0.2386
113 Fiji 0.3925 0.0626 0.0461 0.2839
114 Libya 0.3799 0.0464 0.0371 0.2963
115 Samoa 0.3742 0.0486 0.0270 0.2986
116 Tonga 0.3697 0.0237 0.0419 0.3040
117 Botswana 0.3637 0.0680 0.0357 0.2601
118 Nicaragua 0.3630 0.0863 0.0250 0.2516
119 India 0.3567 0.1252 0.0192 0.2123
120 Belize 0.3513 0.0540 0.0462 0.2511
121 Lesotho 0.3512 0.0896 0.0132 0.2484
122 Tajikistan 0.3477 0.0302 0.0203 0.2972
123 Gabon 0.3420 0.0270 0.0366 0.2784
124 Kenya 0.3338 0.0810 0.0210 0.2319
125 Namibia 0.3314 0.0227 0.0402 0.2685
126 Morocco 0.3287 0.0810 0.0584 0.1894
127 Suriname 0.3283 0.0076 0.0400 0.2807
128 SãoToméandPríncipe 0.3258 0.0302 0.0273 0.2683
129 Zimbabwe 0.3230 0.0432 0.0193 0.2605
130 Turkmenistan 0.3226 0.0097 0.0137 0.2992
131 Algeria 0.3181 0.0335 0.0412 0.2435
132 Angola 0.3110 0.1155 0.0149 0.1806
133 SyrianArabRepublic 0.3103 0.0140 0.0399 0.2564
134 Bangladesh 0.3028 0.1209 0.0109 0.1710
135 Congo 0.3019 0.0270 0.0195 0.2555
136 Iraq 0.2996 0.0518 0.0182 0.2295
137 UnitedRepublicofTanzania 0.2926 0.0594 0.0111 0.2221
138 EquatorialGuinea 0.2902 0.0108 0.0198 0.2596
139 Madagascar 0.2890 0.0561 0.0099 0.2230
140 Cambodia 0.2878 0.0464 0.0098 0.2316
141 Myanmar 0.2818 0.0281 0.0015 0.2522
142 Uganda 0.2812 0.0345 0.0158 0.2309
143 Zambia 0.2810 0.0356 0.0141 0.2313
144 Côted’Ivoire 0.2805 0.1101 0.0205 0.1498
145 Swaziland 0.2757 …… 0.0202 0.2555
146 Pakistan 0.2755 0.0842 0.0254 0.1658
147 Ghana 0.2754 0.0507 0.0195 0.2051
148 Rwanda 0.2749 0.0594 0.0067 0.2089
149 Cameroon 0.2722 0.0518 0.0136 0.2069
150 Nigeria 0.2687 0.0324 0.0196 0.2167
151LaoPeople’sDemocraticRepublic 0.2637 0.0270 0.0109 0.2259
152 Bhutan 0.2598 0.0637 0.0204 0.1757
153 Nepal 0.2568 0.0572 0.0075 0.1921
154 Sudan 0.2542 0.0529 0.0235 0.1778
155 Vanuatu 0.2521 0.0043 0.0124 0.2354
156 SolomonIslands 0.2445 0.0151 0.0063 0.2232
157 Mauritania 0.2359 0.0302 0.0263 0.1793
158DemocraticRepublicoftheCongo 0.2357 0.0302 0.0046 0.2009
159 Malawi 0.2357 0.0054 0.0060 0.2243
160 Comoros 0.2327 0.0097 0.0067 0.2162
Rank Country Index value
Of which
Online service component
Telecom-munication
infrastructure component
Human capital component
161 Mozambique 0.2288 0.0583 0.0083 0.1623
162 Timor-Leste 0.2273 0.0453 0.0022 0.1797
163 Senegal 0.2241 0.0604 0.0235 0.1403
164 Yemen 0.2154 0.0162 0.0098 0.1894
165 Togo 0.2150 0.0237 0.0150 0.1763
166 Liberia 0.2133 0.0216 0.0062 0.1855
167 Gambia 0.2117 0.0281 0.0315 0.1521
168 Afghanistan 0.2098 0.0788 0.0108 0.1202
169 Haiti 0.2074 0.0065 0.0221 0.1789
170 Djibouti 0.2059 0.0162 0.0049 0.1848
171 PapuaNewGuinea 0.2043 0.0248 0.0075 0.1719
172 Ethiopia 0.2033 0.0680 0.0024 0.1329
173 Benin 0.2017 0.0399 0.0150 0.1468
174 Burundi 0.2014 0.0140 0.0030 0.1844
175 Eritrea 0.1859 0.0076 0.0037 0.1746
176 Mali 0.1815 0.0626 0.0096 0.1093
177 SierraLeone 0.1697 0.0011 0.0059 0.1627
178 BurkinaFaso 0.1587 0.0529 0.0066 0.0992
179 Guinea-Bissau 0.1561 0.0054 0.0118 0.1388
180 Guinea 0.1426 0.0119 0.0094 0.1213
181 CentralAfricanRepublic 0.1399 0.0000 0.0015 0.1384
182 Chad 0.1235 0.0065 0.0060 0.1110
183 Niger 0.1098 0.0130 0.0038 0.0930
Other UN Member States
184DemocraticPeople’sRepublicofKorea …… 0.0065 …… ……
184 Kiribati …… 0.0097 0.0049 ……
184 MarshallIslands …… 0.0086 0.0138 ……
184Micronesia(FederatedStatesof) …… 0.0432 0.0268 ……
184 Monaco …… 0.0464 0.2297 ……
184 Nauru …… 0.0043 …… ……
184 SanMarino …… 0.0626 0.1759 ……
184 Somalia …… 0.0000 0.0040 ……
184 Tuvalu …… 0.0043 0.0567 ……
Regional and economic groupings
Africa 0.2733 0.0489 0.0221 0.2039
Americas 0.4790 0.1069 0.0857 0.2864
Asia 0.4424 0.1085 0.0657 0.2659
Europe 0.6227 0.1480 0.1598 0.3123
Oceania 0.4193 0.0532 0.0548 0.2766
Developedcountries 0.6542 0.1369 0.1719 0.3136
DevelopingcountriesotherthanLDCs 0.4443 0.0960 0.0675 0.2774
Leastdevelopedcountries 0.2424 0.0381 0.0147 0.1895
SmallislanddevelopingStates 0.3924 0.0479 0.0657 0.2685
E-government development index (cont.)

116
Statistical annexA United Nations E-Government Survey 2010
Rank Country Index value
Points for emerging
information services
Points for enhanced
inromation services
Points for transaction
services
Points for connected approach
1 RepublicofKorea 1.0000 66 106 112 31
2 UnitedStates 0.9365 62 97 115 21
3 Canada 0.8825 59 83 104 32
4 UnitedKingdom 0.7746 61 87 71 25
5 Spain 0.7651 60 88 68 25
5 Australia 0.7651 58 76 69 38
7 Norway 0.7365 61 85 69 17
8 Bahrain 0.7302 63 72 72 23
9 Colombia 0.7111 57 51 89 27
10 Singapore 0.6857 54 82 64 16
11 France 0.6825 54 71 77 13
12 Netherlands 0.6794 60 80 55 19
13 Japan 0.6730 59 78 56 19
13 Denmark 0.6730 54 88 52 18
15 NewZealand 0.6381 59 76 46 20
16 Malaysia 0.6317 51 73 55 20
17 Belgium 0.6254 57 66 54 20
18 Chile 0.6095 57 44 74 17
19 Israel 0.5841 49 45 66 24
20 Mongolia 0.5556 47 49 54 25
21 Germany 0.5492 54 76 23 20
22 Jordan 0.5333 50 44 57 17
23 Egypt 0.5302 55 51 49 12
24 Kazakhstan 0.5270 66 53 24 23
24 Sweden 0.5270 54 67 26 19
26 Liechtenstein 0.5238 49 43 52 21
27 Hungary 0.5048 53 43 40 23
28 Estonia 0.5016 45 54 38 21
29 Ireland 0.4984 48 63 37 9
30 Tunisia 0.4825 52 40 50 10
30 Lithuania 0.4825 54 61 22 15
32 Uruguay 0.4794 51 43 36 21
32 Finland 0.4794 44 55 36 16
34 Austria 0.4762 46 64 28 12
35 Malta 0.4698 53 51 32 12
36 Kuwait 0.4603 41 39 58 7
37 CzechRepublic 0.4540 50 42 34 17
38 Switzerland 0.4444 51 44 28 17
39 Mexico 0.4413 45 52 26 16
40 ElSalvador 0.4254 48 30 46 10
41 Croatia 0.4222 46 44 29 14
42 Latvia 0.4159 52 37 19 23
42 Romania 0.4159 55 38 25 13
44 Argentina 0.4127 53 42 22 13
45 Peru 0.4095 53 37 26 13
45 Bulgaria 0.4095 47 41 28 13
47 Slovenia 0.4000 55 46 6 19
48 Iceland 0.3968 53 37 23 12
49 Philippines 0.3937 48 25 35 16
50 Poland 0.3873 54 45 10 13
50 Portugal 0.3873 54 37 21 10
52 Luxembourg 0.3810 46 32 30 12
53 Uzbekistan 0.3778 52 39 18 10
54 Cyprus 0.3714 44 39 19 15
Online service index and its components
Rank Country Index value
Points for emerging
information services
Points for enhanced
inromation services
Points for transaction
services
Points for connected approach
55 Brazil 0.3683 53 34 10 19
55 China 0.3683 54 40 4 18
55 India 0.3683 45 41 22 8
55 Oman 0.3683 47 33 26 10
59 DominicanRepublic 0.3651 46 30 24 15
60 Bangladesh 0.3556 48 44 5 15
60 Greece 0.3556 46 37 15 14
62 Turkey 0.3460 57 29 9 14
62 Slovakia 0.3460 50 32 14 13
62 Ukraine 0.3460 55 31 7 16
65 Angola 0.3397 52 38 9 8
65 TrinidadandTobago 0.3397 50 39 12 6
67 Thailand 0.3333 50 31 15 9
68 RussianFederation 0.3302 49 28 15 12
69 Côted’Ivoire 0.3238 42 31 22 7
69 Azerbaijan 0.3238 47 36 10 9
71 TFYRMacedonia 0.3206 38 41 10 12
72 Ecuador 0.3175 53 27 9 11
72 Kyrgyzstan 0.3175 28 26 33 13
74 Montenegro 0.3143 45 40 6 8
75 SaudiArabia 0.3111 46 25 22 5
75 Albania 0.3111 44 33 10 11
77 SouthAfrica 0.3079 34 34 27 2
77 Guatemala 0.3079 48 26 12 11
79 Bolivia 0.3048 35 37 12 12
79 CostaRica 0.3048 45 28 10 13
79 Venezuela 0.3048 43 30 9 14
79 VietNam 0.3048 51 26 5 14
83 Belarus 0.3016 43 25 15 12
84 Mauritius 0.2952 46 23 18 6
84 Honduras 0.2952 45 21 12 15
84 RepublicofMoldova 0.2952 51 26 6 10
87 Italy 0.2889 43 28 12 8
88 Panama 0.2825 49 18 9 13
88 BruneiDarussalam 0.2825 40 35 3 11
90 Qatar 0.2794 27 21 37 3
91 BosniaandHerzegovina 0.2762 48 27 1 11
92 CapeVerde 0.2698 40 33 5 7
93 Iran(IslamicRepublicof) 0.2667 50 21 4 9
93 Lebanon 0.2667 32 29 16 7
95 Lesotho 0.2635 52 29 1 1
95 Paraguay 0.2635 39 18 16 10
97 SriLanka 0.2603 33 30 6 13
98 Nicaragua 0.2540 34 25 16 5
99 UnitedArabEmirates 0.2508 46 26 2 5
100 Georgia 0.2476 45 17 5 11
100 Pakistan 0.2476 33 36 5 4
102 Indonesia 0.2444 41 25 4 7
103 Cuba 0.2413 36 27 7 6
104 Kenya 0.2381 34 29 8 4
104 Morocco 0.2381 40 22 9 4
106 Bahamas 0.2317 47 18 6 2
106 Afghanistan 0.2317 41 25 5 2
106 Andorra 0.2317 27 26 10 10

117
Statistical annex AUnited Nations E-Government Survey 2010
Rank Country Index value
Points for emerging
information services
Points for enhanced
inromation services
Points for transaction
services
Points for connected approach
109 Jamaica 0.2286 38 17 8 9
110 Serbia 0.2222 38 26 0 6
111 Botswana 0.2000 31 21 6 5
111 Ethiopia 0.2000 32 23 3 5
111 Barbados 0.2000 25 19 13 6
114 Grenada 0.1873 30 22 2 5
114 Bhutan 0.1873 30 21 6 2
116 Mali 0.1841 29 12 9 8
116 SanMarino 0.1841 32 12 8 6
116 Fiji 0.1841 36 21 0 1
119 Guyana 0.1810 34 17 0 6
120 Senegal 0.1778 32 14 3 7
121 Rwanda 0.1746 34 14 2 5
121UnitedRepublicofTanzania 0.1746 34 21 0 0
121 Armenia 0.1746 38 10 0 7
124 Mozambique 0.1714 32 13 3 6
125 Nepal 0.1683 30 22 0 1
126 Madagascar 0.1651 28 13 4 7
127 Maldives 0.1619 27 24 0 0
128 Belize 0.1587 24 17 3 6
129 BurkinaFaso 0.1556 26 13 0 10
129 Sudan 0.1556 23 16 2 8
131 Cameroon 0.1524 16 16 12 4
131 Iraq 0.1524 24 13 5 6
133 Ghana 0.1492 26 18 1 2
134 Samoa 0.1429 24 21 0 0
135 Libya 0.1365 21 19 0 3
135 Cambodia 0.1365 25 13 2 3
135 Monaco 0.1365 14 17 5 7
138 Timor-Leste 0.1333 23 16 0 3
139SaintVincentandtheGrenadines 0.1302 29 11 0 1
140 Zimbabwe 0.1270 23 11 0 6
140Micronesia(FederatedStatesof) 0.1270 19 17 2 2
142 AntiguaandBarbuda 0.1206 14 19 1 4
143 Benin 0.1175 20 10 4 3
144 SaintLucia 0.1111 14 16 0 5
145 Zambia 0.1048 21 8 0 4
146 Uganda 0.1016 18 11 0 3
146 SaintKittsandNevis 0.1016 15 9 2 6
148 Algeria 0.0984 19 9 1 2
149 Nigeria 0.0952 20 8 0 2
150DemocraticRepublicoftheCongo 0.0889 17 7 0 4
150 Mauritania 0.0889 11 13 1 3
150 SãoToméandPríncipe 0.0889 21 7 0 0
150 Tajikistan 0.0889 15 7 4 2
154 Gambia 0.0825 16 9 0 1
154 Myanmar 0.0825 19 7 0 0
156 Congo 0.0794 7 8 7 3
156 Gabon 0.0794 13 9 1 2
156LaoPeople’sDemocraticRepublic 0.0794 12 9 2 2
Rank Country Index value
Points for emerging
information services
Points for enhanced
inromation services
Points for transaction
services
Points for connected approach
159 PapuaNewGuinea 0.0730 13 7 0 3
160 Togo 0.0698 6 8 3 5
160 Tonga 0.0698 13 9 0 0
162 Namibia 0.0667 14 5 0 2
163 Liberia 0.0635 11 7 0 2
164 Seychelles 0.0571 11 7 0 0
165 Palau 0.0540 8 7 0 2
166 Dominica 0.0508 7 6 1 2
167 Djibouti 0.0476 9 3 0 3
167 Yemen 0.0476 9 4 0 2
169 SolomonIslands 0.0444 7 6 0 1
170 Burundi 0.0413 8 2 0 3
170 SyrianArabRepublic 0.0413 7 5 0 1
172 Niger 0.0381 4 2 3 3
173 Guinea 0.0349 5 2 3 1
174 EquatorialGuinea 0.0317 2 5 0 3
175 Comoros 0.0286 5 3 0 1
175 Turkmenistan 0.0286 4 5 0 0
175 Kiribati 0.0286 4 5 0 0
178 MarshallIslands 0.0254 4 3 0 1
179 Eritrea 0.0222 3 4 0 0
179 Suriname 0.0222 3 2 0 2
181 Chad 0.0190 3 2 1 0
181 Haiti 0.0190 3 2 0 1
181DemocraticPeople’sRepublicofKorea 0.0190 3 2 1 0
184 Guinea-Bissau 0.0159 0 3 1 1
184 Malawi 0.0159 3 2 0 0
186 Nauru 0.0127 2 2 0 0
186 Tuvalu 0.0127 1 3 0 0
186 Vanuatu 0.0127 1 2 0 1
189 SierraLeone 0.0032 0 0 0 1 Countries without online services
CentralAfricanRepublic
Somalia
Swaziland Regional and economic groupings
Africa 0.1439
Americas 0.3143
Asia 0.3191
Europe 0.4354
Oceania 0.1565
Developedcountries 0.5082
DevelopingcountriesotherthanLDCs 0.2823
Leastdevelopedcountries 0.1121
SmallislanddevelopingStates 0.1409
Online service index and its components (cont.)

118
Statistical annexA United Nations E-Government Survey 2010
Rank Country Index valueEstimated Internet users
per 100 inhabitants Main fixed telephone
lines per 100 inhabitants Mobile subscribers per
100 inhabitants Personal computers per
100 inhabitants Total fixed broadband
per 100 inhabitants
1 Switzerland 0.7687 76.10 63.91 116.43 92.24 32.89
2 Netherlands 0.7666 86.36 44.31 120.57 90.91 34.83
3 Sweden 0.7522 79.65 57.83 119.38 87.79 31.56
4 UnitedKingdom 0.7164 79.62 54.24 123.41 80.23 28.21
5 Luxembourg 0.7138 76.61 54.22 147.11 67.73 29.80
6 Denmark 0.6988 84.82 45.56 120.02 55.09 36.75
7 Monaco 0.6961 61.48 106.38 62.54 49.18 37.71
8 Germany 0.6955 75.97 62.60 130.37 65.54 27.47
9 Norway 0.6830 84.60 42.16 109.98 62.68 33.73
10 Canada 0.6799 72.85 55.37 64.51 94.40 28.96
11 UnitedStates 0.6449 74.00 51.33 86.79 78.67 25.35
12 Iceland 0.6395 65.64 60.58 106.33 53.09 31.66
13 RepublicofKorea 0.6390 77.83 44.29 94.71 58.14 32.14
14 Singapore 0.6386 69.24 40.24 138.15 76.04 21.74
15 Estonia 0.6273 63.64 37.14 188.20 52.13 23.70
16 Finland 0.6240 78.91 31.11 128.76 50.05 30.48
17 Australia 0.6011 71.98 44.46 104.96 60.29 24.39
18 France 0.5954 51.16 56.42 93.45 65.17 28.52
19 Bahrain 0.5855 51.95 28.37 180.51 74.58 16.12
20 Ireland 0.5739 63.79 49.63 113.77 58.07 20.09
21 Austria 0.5736 59.37 40.08 129.73 60.69 21.49
22 Belgium 0.5698 66.53 42.08 111.63 42.02 27.97
23 NewZealand 0.5648 69.76 41.37 109.22 52.97 21.63
24 Barbados 0.5513 73.86 58.93 132.00 15.79 21.77
25 UnitedArabEmirates 0.5434 65.15 33.63 208.65 33.08 11.79
26 Liechtenstein 0.5412 65.08 55.40 90.58 …… 39.61
27 SanMarino 0.5330 51.37 68.30 56.76 79.00 12.83
28 Japan 0.5242 69.16 40.21 86.73 40.87 23.65
29 AntiguaandBarbuda 0.5241 75.03 43.86 157.67 20.68 14.52
30 Spain 0.5100 56.70 45.41 111.68 40.04 20.22
31 Slovenia 0.5026 49.24 50.11 101.97 42.68 21.17
32 Italy 0.4914 48.85 33.61 148.61 36.64 18.93
33 Malta 0.4863 49.14 59.18 94.64 22.99 24.25
34 Andorra 0.4415 70.04 44.28 76.06 …… 24.49
35 Lithuania 0.4413 53.50 23.64 151.24 18.29 17.77
36 Hungary 0.4338 54.93 30.90 122.09 25.63 15.40
37 Israel 0.4334 28.85 41.13 127.38 25.10 22.69
38 Cyprus 0.4327 38.04 47.93 117.89 38.34 12.06
39 SaintKittsandNevis 0.4295 29.75 40.56 146.78 22.68 19.04
40 CzechRepublic 0.4258 48.61 22.08 133.54 27.47 17.05
41 Croatia 0.4220 50.75 41.85 133.95 17.95 11.86
42 Slovakia 0.4212 51.32 20.33 102.23 51.46 11.46
43 Portugal 0.4189 41.69 38.60 139.64 17.19 15.85
44 SaudiArabia 0.4031 30.55 16.27 142.85 68.25 4.16
45 Greece 0.3829 32.60 53.65 123.90 9.43 13.53
46 TFYRMacedonia 0.3804 42.90 22.39 122.56 36.76 8.77
47 Latvia 0.3762 55.20 28.39 97.72 32.81 6.44
48 SaintVincentandtheGrenadines 0.3685 60.49 20.87 119.23 15.18 8.58
49 Dominica 0.3566 39.40 26.03 132.76 19.23 9.70
50 SaintLucia 0.3510 58.68 24.02 99.53 15.89 8.22
51 Bahamas 0.3502 42.05 39.82 106.04 12.29 10.08
52 Malaysia 0.3438 62.57 15.89 100.41 23.15 4.8253 Poland 0.3374 43.94 27.11 108.54 16.92 8.99
54 Bulgaria 0.3370 30.99 29.74 140.05 8.91 11.24
55 Montenegro 0.3311 45.09 56.85 103.58 …… 4.16
Telecommunication infrastructure index and its components

119
Statistical annex AUnited Nations E-Government Survey 2010
Rank Country Index valueEstimated Internet users
per 100 inhabitants Main fixed telephone
lines per 100 inhabitants Mobile subscribers per
100 inhabitants Personal computers per
100 inhabitants Total fixed broadband
per 100 inhabitants
56 Uruguay 0.3183 40.01 28.64 104.73 13.53 8.59
57 Qatar 0.3168 34.04 20.56 131.39 15.69 8.07
58 Romania 0.3093 23.99 23.58 114.54 19.32 11.75
59 Seychelles 0.3037 38.17 27.70 101.78 21.59 4.08
60 Maldives 0.2886 23.52 15.38 142.82 20.24 5.15
61 Jamaica 0.2820 56.88 11.69 100.58 6.71 3.61
62 Argentina 0.2812 28.11 24.15 116.61 9.04 7.99
63 RussianFederation 0.2765 21.14 31.14 132.61 13.33 2.82
64 Chile 0.2711 32.47 20.99 88.05 14.11 8.49
65 BruneiDarussalam 0.2703 48.82 19.91 90.66 8.92 2.91
66 Serbia 0.2695 23.99 31.35 97.76 18.31 4.59
67 Mauritius 0.2647 29.69 28.48 80.74 17.43 5.71
68 Turkey 0.2581 33.12 23.68 89.05 6.10 7.78
69 Palau 0.2546 26.97 36.71 52.65 33.58 0.48
70 Brazil 0.2538 33.83 21.43 78.47 16.12 5.26
71 Kuwait 0.2524 31.57 18.61 97.28 22.22 0.93
72 BosniaandHerzegovina 0.2505 34.66 27.33 84.26 6.40 4.99
73 Ukraine 0.2487 22.51 28.65 121.09 4.55 3.48
74 CostaRica 0.2424 32.31 31.81 41.75 23.10 3.90
75 Colombia 0.2421 38.03 15.15 91.90 7.92 4.23
76 Grenada 0.2408 22.29 27.60 57.97 15.66 9.79
77 Venezuela 0.2321 25.49 22.42 96.31 9.26 3.90
78 TrinidadandTobago 0.2304 16.02 23.14 113.67 13.21 2.67
79 VietNam 0.2261 23.92 33.13 80.37 9.54 2.35
80 Panama 0.2202 22.91 14.59 111.94 4.56 4.63
81 Mexico 0.2161 21.43 18.92 69.37 14.10 7.01
82 Iran(IslamicRepublicof) 0.2157 31.37 33.83 58.65 10.37 0.41
83 Oman 0.2092 16.84 9.84 115.58 16.88 1.15
84 Belarus 0.2081 28.89 37.76 71.57 0.80 0.12
85 Lebanon 0.1965 37.72 16.76 34.10 10.18 4.80
86 Tunisia 0.1942 27.53 12.18 84.27 7.62 2.24
87 RepublicofMoldova 0.1933 19.09 29.44 66.60 11.43 1.29
88 ElSalvador 0.1923 12.49 17.56 113.32 5.78 2.01
89 China 0.1913 22.28 27.51 47.41 5.61 6.23
90 Jordan 0.1806 24.46 8.46 86.60 7.20 2.09
91 Kazakhstan 0.1797 12.34 21.97 96.06 …… 3.64
92 Peru 0.1789 24.72 9.98 72.66 10.06 2.52
93 Morocco 0.1769 32.59 9.46 72.19 3.52 1.53
94 Thailand 0.1746 20.03 10.49 92.01 6.68 1.36
95 Tuvalu 0.1717 40.63 13.20 18.28 8.60 3.56
96 DominicanRepublic 0.1658 25.75 9.90 72.45 3.49 2.27
97 CapeVerde 0.1646 20.61 14.44 55.68 14.03 1.48
98 Albania 0.1629 15.10 10.07 99.93 3.84 1.15
99 Ecuador 0.1595 9.71 14.17 86.01 12.95 0.26
100 Guatemala 0.1528 10.13 10.59 109.22 2.06 0.21
101 SouthAfrica 0.1443 8.43 9.22 90.60 8.25 0.77
102 Paraguay 0.1433 8.66 5.82 92.83 7.79 1.50
103 Belize 0.1400 10.86 10.35 53.23 15.28 2.56
104 Fiji 0.1396 10.90 14.53 71.09 6.04 1.37
105 Azerbaijan 0.1329 10.74 15.10 75.00 2.39 0.69
106 Guyana 0.1285 24.87 14.42 36.84 3.80 0.26
107 Armenia 0.1280 5.63 19.39 61.07 9.69 0.06
108 Tonga 0.1270 8.11 24.66 48.73 5.89 0.70
109 Honduras 0.1268 9.00 11.28 84.86 1.98 0.00
110 Egypt 0.1256 15.42 14.73 50.62 4.60 0.94
Telecommunication infrastructure index and its components (cont.)

120
Statistical annexA United Nations E-Government Survey 2010
Rank Country Index valueEstimated Internet users
per 100 inhabitants Main fixed telephone
lines per 100 inhabitants Mobile subscribers per
100 inhabitants Personal computers per
100 inhabitants Total fixed broadband
per 100 inhabitants
111 Algeria 0.1248 10.34 9.06 81.41 1.07 0.85
112 Namibia 0.1219 5.33 6.61 49.39 23.94 0.01
113 Suriname 0.1213 8.62 16.13 63.33 4.00 0.53
114 SyrianArabRepublic 0.1209 16.79 17.12 33.24 8.78 0.05
115 Georgia 0.1164 8.26 12.76 59.66 5.46 1.07
116 Indonesia 0.1143 11.13 13.36 61.83 2.03 0.13
117 Libya 0.1126 4.72 14.39 72.95 2.19 0.16
118 Philippines 0.1115 5.97 4.32 75.38 7.23 0.56
119 Gabon 0.1110 6.21 1.86 89.77 3.37 0.14
120 SriLanka 0.1081 5.72 17.18 55.24 3.76 0.50
121 Botswana 0.1081 4.16 7.41 77.34 4.83 0.19
122 Mongolia 0.1036 12.25 6.19 35.08 13.95 0.28
123 Gambia 0.0955 6.88 2.94 70.24 3.53 0.02
124 Kyrgyzstan 0.0918 14.03 9.02 40.56 1.92 0.05
125 Bolivia 0.0915 10.50 7.12 49.82 2.40 0.36
126 Uzbekistan 0.0854 8.89 7.06 46.52 3.12 0.24
127 SãoToméandPríncipe 0.0827 15.48 4.86 30.59 3.93 0.20
128 Samoa 0.0819 4.75 10.90 48.06 2.35 0.04
129 Micronesia(FederatedStatesof) 0.0811 13.62 7.90 24.91 5.48 0.04
130 Mauritania 0.0798 1.43 2.37 65.07 4.54 0.18
131 Pakistan 0.0771 10.45 2.50 49.74 0.44 0.09
132 Nicaragua 0.0757 2.81 4.49 53.62 4.03 0.34
133 Sudan 0.0711 9.19 0.86 27.05 10.71 0.11
134 Senegal 0.0711 8.35 1.95 44.13 2.22 0.39
135 Haiti 0.0669 10.29 1.11 32.40 5.14 0.00
136 Kenya 0.0637 8.67 0.65 41.88 1.37 0.05
137 Cuba 0.0623 12.94 9.85 2.96 5.62 0.02
138 Côted’Ivoire 0.0622 3.21 1.73 50.74 1.68 0.05
139 Bhutan 0.0619 5.82 4.00 36.55 2.51 0.30
140 Tajikistan 0.0615 7.20 5.05 34.93 1.29 0.00
141 Swaziland 0.0612 4.13 3.87 39.13 3.69 0.00
142 EquatorialGuinea 0.0600 1.82 1.64 52.49 1.48 0.03
143 Nigeria 0.0594 7.27 0.86 41.66 0.85 0.02
144 Ghana 0.0592 4.27 0.62 49.55 0.58 0.07
145 Congo 0.0590 4.29 0.47 49.98 0.56 0.00
146 Zimbabwe 0.0586 11.40 2.77 13.28 6.94 0.12
147 India 0.0583 6.95 3.21 29.36 3.18 0.45
148 Iraq 0.0552 0.93 3.60 47.55 0.77 0.00
149 Uganda 0.0479 7.90 0.53 27.02 1.69 0.02
150 Benin 0.0455 1.85 1.32 39.66 0.71 0.02
151 Togo 0.0453 5.42 2.18 23.95 3.09 0.03
152 Angola 0.0451 3.05 0.63 37.59 0.65 0.07
153 Zambia 0.0427 5.55 0.72 28.04 1.12 0.04
154 MarshallIslands 0.0417 3.71 7.42 1.27 9.00 0.00
155 Turkmenistan 0.0414 1.41 9.20 6.98 7.19 0.00
156 Cameroon 0.0411 2.93 1.04 32.28 1.12 0.00
157 Lesotho 0.0400 3.58 2.64 28.35 0.25 0.00
158 Vanuatu 0.0376 7.46 3.87 11.40 1.39 0.03
159 Guinea-Bissau 0.0359 2.35 0.29 31.75 0.20 0.00
160 UnitedRepublicofTanzania 0.0337 1.22 0.29 30.62 0.91 0.00
161 Bangladesh 0.0330 0.32 0.84 27.90 2.25 0.03
162 LaoPeople’sDemocraticRepublic 0.0329 1.64 1.56 24.27 1.70 0.06
163 Afghanistan 0.0328 1.90 0.37 29.03 0.39 0.00
164 Madagascar 0.0301 1.65 0.86 25.30 0.58 0.03
165 Yemen 0.0298 1.44 4.48 13.76 2.77 0.00
Telecommunication infrastructure index and its components
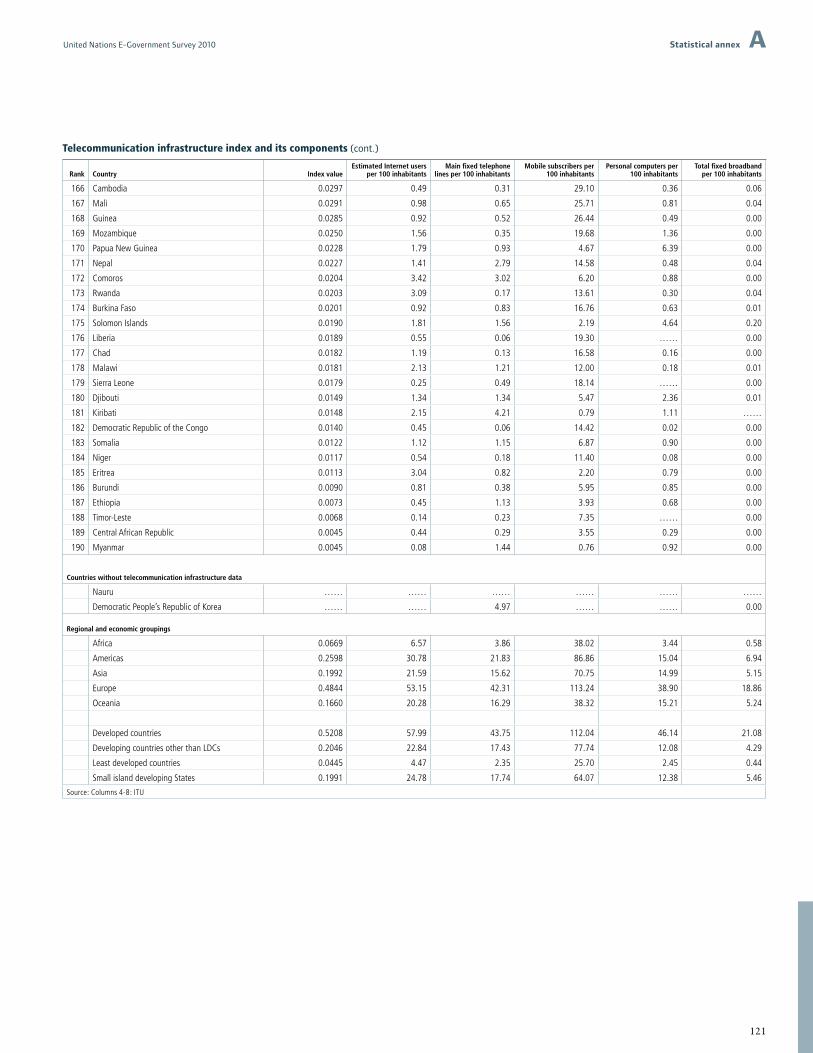
121
Statistical annex AUnited Nations E-Government Survey 2010
Rank Country Index valueEstimated Internet users
per 100 inhabitants Main fixed telephone
lines per 100 inhabitants Mobile subscribers per
100 inhabitants Personal computers per
100 inhabitants Total fixed broadband
per 100 inhabitants
166 Cambodia 0.0297 0.49 0.31 29.10 0.36 0.06
167 Mali 0.0291 0.98 0.65 25.71 0.81 0.04
168 Guinea 0.0285 0.92 0.52 26.44 0.49 0.00
169 Mozambique 0.0250 1.56 0.35 19.68 1.36 0.00
170 PapuaNewGuinea 0.0228 1.79 0.93 4.67 6.39 0.00
171 Nepal 0.0227 1.41 2.79 14.58 0.48 0.04
172 Comoros 0.0204 3.42 3.02 6.20 0.88 0.00
173 Rwanda 0.0203 3.09 0.17 13.61 0.30 0.04
174 BurkinaFaso 0.0201 0.92 0.83 16.76 0.63 0.01
175 SolomonIslands 0.0190 1.81 1.56 2.19 4.64 0.20
176 Liberia 0.0189 0.55 0.06 19.30 …… 0.00
177 Chad 0.0182 1.19 0.13 16.58 0.16 0.00
178 Malawi 0.0181 2.13 1.21 12.00 0.18 0.01
179 SierraLeone 0.0179 0.25 0.49 18.14 …… 0.00
180 Djibouti 0.0149 1.34 1.34 5.47 2.36 0.01
181 Kiribati 0.0148 2.15 4.21 0.79 1.11 ……
182 DemocraticRepublicoftheCongo 0.0140 0.45 0.06 14.42 0.02 0.00
183 Somalia 0.0122 1.12 1.15 6.87 0.90 0.00
184 Niger 0.0117 0.54 0.18 11.40 0.08 0.00
185 Eritrea 0.0113 3.04 0.82 2.20 0.79 0.00
186 Burundi 0.0090 0.81 0.38 5.95 0.85 0.00
187 Ethiopia 0.0073 0.45 1.13 3.93 0.68 0.00
188 Timor-Leste 0.0068 0.14 0.23 7.35 …… 0.00
189 CentralAfricanRepublic 0.0045 0.44 0.29 3.55 0.29 0.00
190 Myanmar 0.0045 0.08 1.44 0.76 0.92 0.00 Countries without telecommunication infrastructure data
Nauru …… …… …… …… …… ……
DemocraticPeople’sRepublicofKorea …… …… 4.97 …… …… 0.00 Regional and economic groupings
Africa 0.0669 6.57 3.86 38.02 3.44 0.58
Americas 0.2598 30.78 21.83 86.86 15.04 6.94
Asia 0.1992 21.59 15.62 70.75 14.99 5.15
Europe 0.4844 53.15 42.31 113.24 38.90 18.86
Oceania 0.1660 20.28 16.29 38.32 15.21 5.24
Developedcountries 0.5208 57.99 43.75 112.04 46.14 21.08
DevelopingcountriesotherthanLDCs 0.2046 22.84 17.43 77.74 12.08 4.29
Leastdevelopedcountries 0.0445 4.47 2.35 25.70 2.45 0.44
SmallislanddevelopingStates 0.1991 24.78 17.74 64.07 12.38 5.46
Source:Columns4-8:ITU
Telecommunication infrastructure index and its components (cont.)

122
Statistical annexA United Nations E-Government Survey 2010
Rank Country Index valueAdult literacy
rate (%)
Combined gross enrol-
ment ratio for primary,
secondary and tertiary schools (%)
1 Cuba 0.9987 99.80 100.00
2 Australia 0.9933 99.00 100.00
2 Denmark 0.9933 99.00 100.00
2 Finland 0.9933 99.00 100.00
2 NewZealand 0.9933 99.00 100.00
6 Ireland 0.9931 99.00 99.93
7 RepublicofKorea 0.9929 99.00 99.88
8 Norway 0.9884 99.00 98.53
9 Netherlands 0.9870 99.00 98.11
10 Iceland 0.9811 99.00 96.33
11 Greece 0.9804 97.10 99.91
12 Spain 0.9792 97.90 97.96
13 France 0.9772 99.00 95.17
14 Slovenia 0.9770 99.70 93.70
15 Belgium 0.9751 99.00 94.54
16 Barbados 0.9743 99.70 92.89
17 Canada 0.9708 99.00 93.24
18 Sweden 0.9698 99.00 92.94
19 Lithuania 0.9692 99.70 91.35
20 UnitedStates 0.9691 99.00 92.73
21 Italy 0.9684 98.90 92.71
22 Kazakhstan 0.9677 99.60 91.12
23 Estonia 0.9666 99.80 90.39
24 Belarus 0.9659 99.70 90.38
25 Ukraine 0.9647 99.70 90.02
26 Latvia 0.9608 99.80 88.64
27 Uruguay 0.9599 97.90 92.16
28 Austria 0.9598 99.00 89.94
29 Hungary 0.9597 98.90 90.11
30 Palau 0.9591 95.40 96.92
31 Poland 0.9552 99.30 87.95
32 UnitedKingdom 0.9542 99.00 88.27
33 Germany 0.9533 99.00 88.00
34 Argentina 0.9503 97.60 89.88
35 Israel 0.9502 97.10 90.85
36 Japan 0.9496 99.00 86.88
37 Liechtenstein 0.9476 99.00 86.29
38 CzechRepublic 0.9429 99.00 84.87
39 RussianFederation 0.9397 99.50 82.90
40 Guyana 0.9396 99.00 83.87
41 Switzerland 0.9358 99.00 82.74
42 Portugal 0.9357 94.90 90.90
43 Bulgaria 0.9350 98.30 83.91
44 Slovakia 0.9310 99.00 81.30
45 Chile 0.9233 96.50 83.98
46 Romania 0.9226 97.60 81.58
47 Tonga 0.9212 99.20 77.97
48 Singapore 0.9203 94.40 87.30
49 Kyrgyzstan 0.9196 99.30 77.28
50 Azerbaijan 0.9185 99.50 76.55
51 Croatia 0.9181 98.70 78.04
52 Georgia 0.9156 99.00 76.69
Rank Country Index valueAdult literacy
rate (%)
Combined gross enrol-
ment ratio for primary,
secondary and tertiary schools (%)
53 Luxembourg 0.9156 99.00 76.68
54 Cyprus 0.9135 97.70 78.66
55 AntiguaandBarbuda 0.9133 99.00 76.00
56 Mongolia 0.9127 97.30 79.21
57 Armenia 0.9117 99.50 74.52
58 Turkmenistan 0.9067 99.50 73.00
59 Samoa 0.9049 98.70 74.07
60 Seychelles 0.9039 91.80 87.56
61 Tajikistan 0.9005 99.60 70.95
62 Venezuela 0.9004 95.20 79.73
63 RepublicofMoldova 0.8999 99.20 71.57
64 Libya 0.8979 86.80 95.76
65 Bahrain 0.8933 88.80 90.38
66 Thailand 0.8919 94.10 79.38
67 BruneiDarussalam 0.8918 94.90 77.73
68 Bolivia 0.8914 90.70 86.02
69 Peru 0.8911 89.60 88.13
70 Montenegro 0.8910 96.40 74.50
70 Serbia 0.8910 96.40 74.50
72 Mexico 0.8898 92.80 81.35
73 SaintLucia 0.8892 94.80 77.17
74 Qatar 0.8886 93.10 80.38
75 BosniaandHerzegovina 0.8886 96.70 73.17
76 Panama 0.8884 93.40 79.73
77 Uzbekistan 0.8883 96.90 72.69
78 Philippines 0.8881 93.40 79.64
79 SaintKittsandNevis 0.8875 97.80 70.64
80 Malta 0.8870 92.40 81.31
81 Bahamas 0.8870 95.80 74.49
82 Albania 0.8860 99.00 67.80
83 Brazil 0.8837 90.00 85.11
84 TFYRMacedonia 0.8835 97.00 71.05
85 CostaRica 0.8826 95.90 72.98
86 Colombia 0.8813 92.70 78.99
87 Andorra 0.8797 99.00 65.92
88 Kuwait 0.8764 94.50 73.92
89 TrinidadandTobago 0.8761 98.70 65.42
90 Maldives 0.8754 97.00 68.63
91 Paraguay 0.8711 94.60 72.13
92 Jordan 0.8694 91.10 78.62
93 Grenada 0.8622 96.00 66.66
94 Fiji 0.8602 94.40 69.25
95 Lebanon 0.8583 89.60 78.30
96 Malaysia 0.8543 91.90 72.48
97 Indonesia 0.8540 92.00 72.20
98 China 0.8535 93.30 69.46
99 Suriname 0.8505 90.40 74.36
100 Dominica 0.8484 88.00 78.52
101 Gabon 0.8437 86.20 80.70
102 SouthAfrica 0.8432 88.00 76.96
103 DominicanRepublic 0.8391 89.10 73.53
104 Mauritius 0.8388 87.40 76.85
Human capital index and its components

123
Statistical annex AUnited Nations E-Government Survey 2010
Rank Country Index valueAdult literacy
rate (%)
Combined gross enrol-
ment ratio for primary,
secondary and tertiary schools (%)
105 Jamaica 0.8361 86.00 78.82
106 SaudiArabia 0.8346 85.00 80.39
107 SriLanka 0.8343 90.80 68.68
108 Turkey 0.8339 88.70 72.76
109 Ecuador 0.8231 84.20 78.52
110 UnitedArabEmirates 0.8192 90.00 65.76
111 SaintVincentandtheGrenadines 0.8172 88.10 68.95
112 Namibia 0.8135 88.00 68.05
113 SãoToméandPríncipe 0.8131 87.90 68.12
114 VietNam 0.8098 90.30 62.33
115 Honduras 0.8007 83.60 73.01
116 Oman 0.7980 86.70 66.00
117 ElSalvador 0.7935 82.00 74.05
118 Iran(IslamicRepublicof) 0.7927 82.30 73.20
119 Zimbabwe 0.7895 91.20 54.44
120 Botswana 0.7881 82.90 70.62
121 EquatorialGuinea 0.7868 87.00 62.04
122 CapeVerde 0.7858 83.80 68.14
123 SyrianArabRepublic 0.7769 83.10 66.86
124 Swaziland 0.7742 83.80 64.67
125 Congo 0.7742 84.70 62.86
126 Tunisia 0.7710 77.70 75.91
127 Myanmar 0.7643 89.90 49.50
128 Nicaragua 0.7626 78.00 72.77
129 Belize 0.7609 75.10 78.07
130 Lesotho 0.7529 82.20 61.46
131 Algeria 0.7377 75.40 70.52
132 Guatemala 0.7229 73.20 70.47
133 Vanuatu 0.7134 78.10 57.81
134 Kenya 0.7027 73.60 63.60
135 Cambodia 0.7019 76.30 57.97
136 Zambia 0.7008 70.60 69.05
137 Uganda 0.6997 73.60 62.70
138 Egypt 0.6973 66.40 76.40
139 Iraq 0.6956 74.10 60.47
140 LaoPeople’sDemocraticRepublic 0.6845 72.70 59.94
141 Malawi 0.6797 71.80 60.32
142 SolomonIslands 0.6763 76.60 49.68
143 Madagascar 0.6757 70.70 61.32
144 UnitedRepublicofTanzania 0.6731 72.30 57.32
145 Nigeria 0.6567 72.00 53.01
146 Comoros 0.6553 75.10 46.39
147 India 0.6433 66.00 60.98
148 Rwanda 0.6329 64.90 60.08
149 Cameroon 0.6269 67.90 52.26
150 Ghana 0.6215 65.00 56.45
151 DemocraticRepublicoftheCongo 0.6087 67.20 48.20
152 Nepal 0.5821 56.50 61.62
153 Morocco 0.5739 55.60 60.98
153 Yemen 0.5739 58.90 54.38
155 Liberia 0.5621 55.50 57.64
156 Djibouti 0.5599 70.30 27.37
Rank Country Index valueAdult literacy
rate (%)
Combined gross enrol-
ment ratio for primary,
secondary and tertiary schools (%)
157 Burundi 0.5587 59.30 49.01
158 Angola 0.5473 67.40 29.40
159 Timor-Leste 0.5445 50.10 63.16
160 Mauritania 0.5435 55.80 51.44
161 Haiti 0.5420 54.80 53.00
162 Sudan 0.5389 60.90 39.86
163 Togo 0.5342 53.20 53.85
164 Bhutan 0.5325 52.80 54.14
165 Eritrea 0.5291 64.20 30.32
166 PapuaNewGuinea 0.5210 57.80 40.70
167 Bangladesh 0.5182 53.50 48.46
168 Pakistan 0.5026 54.20 42.37
169 SierraLeone 0.4932 38.10 71.75
170 Mozambique 0.4918 44.40 58.75
171 Gambia 0.4609 42.50 53.27
172 Côted’Ivoire 0.4540 48.70 38.80
173 Benin 0.4448 40.50 52.43
174 Senegal 0.4250 41.90 43.70
175 Guinea-Bissau 0.4207 44.80 36.60
176 CentralAfricanRepublic 0.4194 48.60 28.62
177 Ethiopia 0.4027 35.90 49.02
178 Guinea 0.3677 29.50 51.30
179 Afghanistan 0.3641 28.00 53.23
180 Chad 0.3363 31.80 37.29
181 Mali 0.3311 26.20 46.94
182 BurkinaFaso 0.3006 28.70 32.77
183 Niger 0.2819 28.70 27.16 Countries without education data
DemocraticPeople’sRep.ofKorea …… …… ……
Kiribati …… …… 75.79
MarshallIslands …… …… 62.33
Micronesia(FederatedStatesof) …… …… 83.56
Monaco …… 99.00 ……
Nauru …… …… 48.49
SanMarino …… 99.00 ……
Somalia …… …… ……
Tuvalu …… …… 69.23 Regional and economic groupings
Africa 0.6177 64.39 56.54
Americas 0.8679 90.80 78.78
Asia 0.8059 85.24 71.28
Europe 0.9464 98.53 86.92
Oceania 0.8381 88.69 71.84
Developedcountries 0.9502 98.49 88.14
DevelopingcountriesotherthanLDCs 0.8406 88.61 74.64
Leastdevelopedcountries 0.5743 59.98 53.15
SmallislanddevelopingStates 0.8136 86.39 70.84
Source:Columns4and5:UNESCO
Human capital index and its components (cont.)

124
Statistical annexA United Nations E-Government Survey 2010
Rank Country Index value
1 RepublicofKorea 1.0000
2 Australia 0.9143
3 Spain 0.8286
4 NewZealand 0.7714
4 UnitedKingdom 0.7714
6 Japan 0.7571
6 UnitedStates 0.7571
8 Canada 0.7286
9 Estonia 0.6857
9 Singapore 0.6857
11 Bahrain 0.6714
12 Malaysia 0.6571
13 Denmark 0.6429
14 Germany 0.6143
15 France 0.6000
15 Netherlands 0.6000
17 Belgium 0.5857
18 Kazakhstan 0.5571
19 Lithuania 0.5286
20 Slovenia 0.5143
21 Austria 0.5000
21 Norway 0.5000
23 Cyprus 0.4857
23 Sweden 0.4857
25 Croatia 0.4571
26 Colombia 0.4429
26 Ireland 0.4429
28 Kyrgyzstan 0.4286
28 Mongolia 0.4286
30 Finland 0.4143
30 Israel 0.4143
32 China 0.3714
32 Mexico 0.3714
34 Chile 0.3429
34 Malta 0.3429
36 Guatemala 0.3143
36 Hungary 0.3143
36 Uzbekistan 0.3143
39 Bulgaria 0.3000
39 Nicaragua 0.3000
39 Tunisia 0.3000
42 Brazil 0.2857
42 Egypt 0.2857
42 Jordan 0.2857
45 Latvia 0.2714
45 Lebanon 0.2714
45 Portugal 0.2714
48 Greece 0.2571
48 Ukraine 0.2571
48 Uruguay 0.2571
51 Belarus 0.2429
51 Poland 0.2429
53 Kenya 0.2286
53 Kuwait 0.2286
55 Italy 0.2143
Rank Country Index value
55 TFYRMacedonia 0.2143
55 Turkey 0.2143
58 Argentina 0.2000
58 Bolivia 0.2000
58 CostaRica 0.2000
58 India 0.2000
58 RepublicofMoldova 0.2000
58 Switzerland 0.2000
64 DominicanRepublic 0.1857
64 Philippines 0.1857
64 Romania 0.1857
64 SouthAfrica 0.1857
68 Azerbaijan 0.1714
68 BruneiDarussalam 0.1714
68 CapeVerde 0.1714
68 Côted’Ivoire 0.1714
68 Libya 0.1714
68 Luxembourg 0.1714
68 Pakistan 0.1714
68 Peru 0.1714
76 AntiguaandBarbuda 0.1571
76 Cameroon 0.1571
76 Congo 0.1571
76 Ecuador 0.1571
76 Montenegro 0.1571
76 Oman 0.1571
82 Andorra 0.1429
82 Grenada 0.1429
82 SriLanka 0.1429
82 Venezuela 0.1429
86 Albania 0.1286
86 CzechRepublic 0.1286
86 Honduras 0.1286
86 Indonesia 0.1286
86LaoPeople’sDemocraticRepublic 0.1286
86 Liechtenstein 0.1286
86 Morocco 0.1286
86 Qatar 0.1286
86 RussianFederation 0.1286
86 TrinidadandTobago 0.1286
86 UnitedArabEmirates 0.1286
97 Cambodia 0.1143
97 Cuba 0.1143
97 Mali 0.1143
97 Mauritania 0.1143
97 Mozambique 0.1143
102 Bangladesh 0.1000
102 Barbados 0.1000
102 Belize 0.1000
102 Botswana 0.1000
102 Niger 0.1000
102 SaudiArabia 0.1000
102 Sudan 0.1000
102 Togo 0.1000
Rank Country Index value
110 EquatorialGuinea 0.0857
110 Ghana 0.0857
110 Guyana 0.0857
110 Jamaica 0.0857
110 Lesotho 0.0857
110 Thailand 0.0857
110 VietNam 0.0857
117 Angola 0.0714
117 Bahamas 0.0714
117 Benin 0.0714
117 Bhutan 0.0714
117 ElSalvador 0.0714
117 Guinea-Bissau 0.0714
117Iran(IslamicRepublicof) 0.0714
117 Maldives 0.0714
117 Slovakia 0.0714
117 Uganda 0.0714
127 Afghanistan 0.0571
127 BurkinaFaso 0.0571
127 Chad 0.0571
127 Comoros 0.0571
127 Georgia 0.0571
127 Madagascar 0.0571
127 Mauritius 0.0571
127 Nepal 0.0571
135 Armenia 0.0429
135BosniaandHerzegovina 0.0429
135 Ethiopia 0.0429
135 Iceland 0.0429
135 Iraq 0.0429
135 Serbia 0.0429
135 Seychelles 0.0429
135UnitedRepublicofTanzania 0.0429
135 Yemen 0.0429
144 Djibouti 0.0286
144 Dominica 0.0286
144 Eritrea 0.0286
144 Fiji 0.0286
144 Gabon 0.0286
144 Guinea 0.0286
144 Liberia 0.0286
144 MarshallIslands 0.0286
144 Monaco 0.0286
144 Rwanda 0.0286
144 SaintLucia 0.0286
144 Tajikistan 0.0286
144 Zimbabwe 0.0286
157 Algeria 0.0143
157 Burundi 0.0143
157DemocraticRepublicoftheCongo 0.0143
157 Gambia 0.0143
157 Kiribati 0.0143
Rank Country Index value
157Micronesia(FederatedStatesof) 0.0143
157 Namibia 0.0143
157 Nauru 0.0143
157 Nigeria 0.0143
157 Palau 0.0143
157 PapuaNewGuinea 0.0143
157 Paraguay 0.0143
157 SaintKittsandNevis 0.0143
157SaintVincentandtheGrenadines 0.0143
157 Samoa 0.0143
157 SanMarino 0.0143
157SãoToméandPríncipe 0.0143
157 Senegal 0.0143
157 SolomonIslands 0.0143
157 SyrianArabRepublic 0.0143
157 Timor-Leste 0.0143
157 Tonga 0.0143
157 Vanuatu 0.0143 Countries without e-participation data
CentralAfricanRepublic
DemocraticPeople’sRepublicofKorea
Haiti
Malawi
Myanmar
Panama
SierraLeone
Somalia
Suriname
Swaziland
Turkmenistan
Tuvalu
Zambia Regional and economic groupings
Africa 0.0845
Americas 0.1982
Asia 0.2396
Europe 0.3236
Oceania 0.1440
Developedcountries 0.3867
DevelopingcountriesotherthanLDCs 0.1840
Leastdevelopedcountries 0.0599
SmallislanddevelopingStates 0.0773
E-participation index
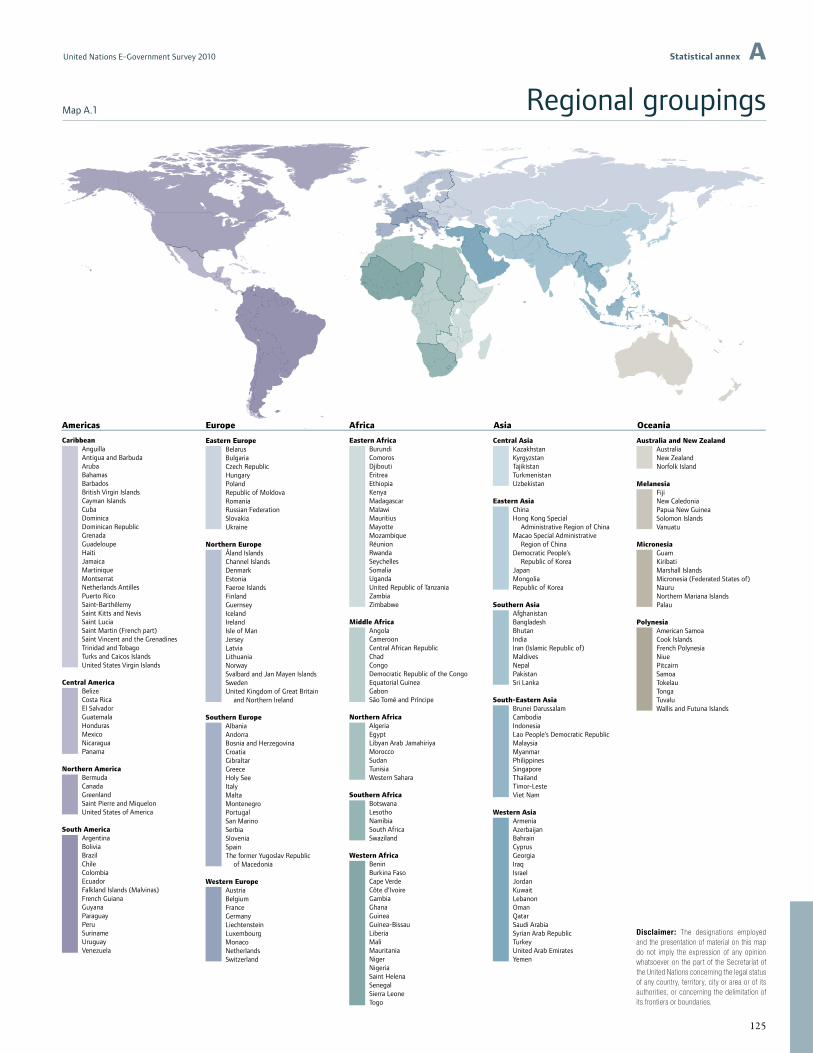
CaribbeanAnguillaAntigua and BarbudaArubaBahamasBarbadosBritish Virgin IslandsCayman IslandsCubaDominicaDominican RepublicGrenadaGuadeloupeHaitiJamaicaMartiniqueMontserratNetherlands AntillesPuerto RicoSaint-BarthélemySaint Kitts and NevisSaint LuciaSaint Martin (French part)Saint Vincent and the GrenadinesTrinidad and TobagoTurks and Caicos IslandsUnited States Virgin Islands
Central AmericaBelizeCosta RicaEl SalvadorGuatemalaHondurasMexicoNicaraguaPanama
Northern AmericaBermudaCanadaGreenlandSaint Pierre and MiquelonUnited States of America
South AmericaArgentinaBoliviaBrazilChileColombiaEcuadorFalkland Islands (Malvinas)French GuianaGuyanaParaguayPeruSurinameUruguayVenezuela
Eastern AfricaBurundiComorosDjiboutiEritreaEthiopiaKenyaMadagascarMalawiMauritiusMayotteMozambiqueRéunionRwandaSeychellesSomaliaUgandaUnited Republic of TanzaniaZambiaZimbabwe
Middle AfricaAngolaCameroonCentral African RepublicChadCongoDemocratic Republic of the CongoEquatorial GuineaGabonSão Tomé and Príncipe
Northern AfricaAlgeriaEgyptLibyan Arab JamahiriyaMoroccoSudanTunisiaWestern Sahara
Southern AfricaBotswanaLesothoNamibiaSouth AfricaSwaziland
Western AfricaBeninBurkina FasoCape VerdeCôte d’IvoireGambiaGhanaGuineaGuinea-BissauLiberiaMaliMauritaniaNigerNigeriaSaint HelenaSenegalSierra LeoneTogo
Central AsiaKazakhstanKyrgyzstanTajikistanTurkmenistanUzbekistan
Eastern AsiaChinaHong Kong Special Administrative Region of ChinaMacao Special Administrative Region of ChinaDemocratic People’s Republic of KoreaJapanMongoliaRepublic of Korea
Southern AsiaAfghanistanBangladeshBhutanIndiaIran (Islamic Republic of)MaldivesNepalPakistanSri Lanka
South-Eastern AsiaBrunei DarussalamCambodiaIndonesiaLao People’s Democratic RepublicMalaysiaMyanmarPhilippinesSingaporeThailandTimor-LesteViet Nam
Western AsiaArmeniaAzerbaijanBahrainCyprusGeorgiaIraqIsraelJordanKuwaitLebanonOmanQatarSaudi ArabiaSyrian Arab RepublicTurkeyUnited Arab EmiratesYemen
Australia and New ZealandAustraliaNew ZealandNorfolk Island
MelanesiaFijiNew CaledoniaPapua New GuineaSolomon IslandsVanuatu
MicronesiaGuamKiribatiMarshall IslandsMicronesia (Federated States of)NauruNorthern Mariana IslandsPalau
PolynesiaAmerican SamoaCook IslandsFrench PolynesiaNiuePitcairnSamoaTokelauTongaTuvaluWallis and Futuna Islands
Eastern EuropeBelarusBulgariaCzech RepublicHungaryPolandRepublic of MoldovaRomaniaRussian FederationSlovakiaUkraine
Northern EuropeÅland IslandsChannel IslandsDenmarkEstoniaFaeroe IslandsFinlandGuernseyIcelandIrelandIsle of ManJerseyLatviaLithuaniaNorwaySvalbard and Jan Mayen IslandsSwedenUnited Kingdom of Great Britain and Northern Ireland
Southern EuropeAlbaniaAndorraBosnia and HerzegovinaCroatiaGibraltarGreeceHoly SeeItalyMaltaMontenegroPortugalSan MarinoSerbiaSloveniaSpainThe former Yugoslav Republic of Macedonia
Western EuropeAustriaBelgiumFranceGermanyLiechtensteinLuxembourgMonacoNetherlandsSwitzerland
AfricaAmericas Asia OceaniaEurope
125
Statistical annex AUnited Nations E-Government Survey 2010
Disclaimer: The designations employed and the presentation of material on this map do not imply the expression of any opinion whatsoever on the part of the Secretariat of the United Nations concerning the legal status of any country, territory, city or area or of its authorities, or concerning the delimitation of its frontiers or boundaries.
Regional groupingsMap A.1

USD 60
ISBN: 978-92-1-123183-0
Printed at the United Nations, New York
April 2010
United Nations E-Government Survey 2010Leveraging e-government at a time of financial and economic crisis
The United Nations global survey of e-government presents a systematic assessment of the use and potential of
information and communication technology to transform the public sector by enhancing transparency, efficiency,
access to public services and citizen participation in all countries and at all levels of development. By studying broad
patterns of e-government around the world, the report identifies leading countries in e-government development.
It also suggests a way forward for those that have yet to take advantage of its tremendous power.
The 2010 edition of the survey was prepared against a backdrop of financial and economic crisis that is putting
tremendous pressure on governments to do more with less. The report examines transparency of stimulus funding
and finds that open data – the free sharing of government information based on common standards – could do a
great deal to assuage unease and regain the public trust. The authors also argue that e-government technology,
while no substitute for good policy, may provide regulators with a much-needed means of grappling with the speed
and complexity of financial markets. Similarly, e-government can add agility to public service delivery and help
governments respond to an expanded set of demands even as revenues fall short and deficits soar. This report, the
fifth in the United Nations e-government series, tells us how.
The United Nations E-Government Survey is a product of the United Nations Department of Economic and
Social Affairs. The department, through its Division for Public Administration and Development Management, has
published this world report on e-government since 2003 and is regularly called upon to advise national administra-
tions on ways to expand public sector use of ICT to advance on internationally-agreed development goals, including
the Millennium Development Goals.
For more information
Visit the UN Department of Economic and Social Affairs at:
http://www.un.org/en/development/desa/
Visit the UN Division for Public Administration and Development Management at:
http://www.unpan.org/dpag/
Visit the UN E-Government Knowledge Base at:
http://www2.unpan.org/egovkb/