United Nations Development Programme Research for · PDF fileUnited Nations Development...
29
United Nations Development Programme Regional Bureau for Latin America and the Caribbean Evidence and Policy Lessons on the Link between Disaster Risk and Poverty in Latin America: Summary of Regional Studies Luis F. López-Calva* Eduardo Ortiz Juárez* December, 2008 Document prepared for the ISDR/RBLAC Research Project on Disaster Risk and Poverty. This document is part of the Latin American contribution to the Global Assessment Report on Disaster Risk Reduction, and the Regional Report on Disaster Risk and Poverty in Latin America. The terms natural disaster and climate-related events will be used interchangeably, understanding that socioeconomic conditions play a role to explain the intensity and consequences of such phenomena. Thus, no event is strictly or exclusively natural. Regional Bureau for Latin America and the Caribbean, UNDP. The opinions expressed here are of the authors and not represent those of the RBLAC-UNDP. Please cite this document as: López-Calva, L. F. and E. Ortiz. 2008. “Evidence and Policy Lessons on the Link between Disaster Risk and Poverty in Latin America: Summary of Regional Studies”, RPP LAC – MDGs and Poverty – 10/2008, RBLAC-UNDP, New York. Research for Public Policy RPP LAC – MDGs and Poverty – 10/2008
Transcript of United Nations Development Programme Research for · PDF fileUnited Nations Development...

United Nations Development Programme
Regional Bureau for Latin America and the Caribbean
Evidence and Policy Lessons on the Link between Disaster Risk and
Poverty in Latin America:
Summary of Regional Studies
Luis F. López-Calva*
Eduardo Ortiz Juárez*
December, 2008
Document prepared for the ISDR/RBLAC Research Project on Disaster Risk and Poverty. This
document is part of the Latin American contribution to the Global Assessment Report on
Disaster Risk Reduction, and the Regional Report on Disaster Risk and Poverty in Latin
America. The terms natural disaster and climate-related events will be used interchangeably,
understanding that socioeconomic conditions play a role to explain the intensity and
consequences of such phenomena. Thus, no event is strictly or exclusively natural. Regional Bureau for Latin America and the Caribbean, UNDP.
The opinions expressed here are of the authors and not represent those of the RBLAC-UNDP.
Please cite this document as: López-Calva, L. F. and E. Ortiz. 2008. “Evidence and Policy
Lessons on the Link between Disaster Risk and Poverty in Latin America: Summary of Regional
Studies”, RPP LAC – MDGs and Poverty – 10/2008, RBLAC-UNDP, New York.
Research for Public Policy
RPP LAC – MDGs and Poverty – 10/2008

Evidence and Policy Lessons on the Link between Disaster Risk and
Poverty in Latin America:
Summary of Regional Studies 1
Draft 2.0
Luis F. López-Calva
Eduardo Ortiz Juárez
Regional Bureau for Latin America and the Caribbean
UNDP
1. The Issues
The links between natural disasters and living standards are complex to capture
empirically. Among other reasons, there is a two-way relationship between the
vulnerability to natural disasters and poverty, and disentangling the direction of the
causal impacts is rather challenging, especially in terms of the intensity of the effects of
the events and not only their incidence.
Extreme climate-related events imply negative shocks that have a direct impact on the
welfare of regions and households. The frequency and magnitude of those shocks
appear to be closely linked to increasing vulnerability of households and communities
in developing countries. The impact of such events could result in an immediate
increase in poverty and deprivation, with permanent effects over time (Carter et al,
2007). Vulnerability of households to natural shocks is determined by the economic
structure, the stage of local development, social and economic conditions, coping
mechanisms available, exposure to risk and frequency and intensity of disasters,
1 Empirical research for the country cases was conducted by Fernando Ramírez (Bolivia, Colombia,
Ecuador, Peru); Elisabeth Mansilla (Mexico, El Salvador); Ernesto Pérez de Rada and Daniel Paz
Fernandez (Bolivia); Carla Calero, Rosario Maldonado and Andrea Molina (Ecuador); Javier Baez and
Indhira Santos (El Salvador); Alejandro De la Fuente, Rodolfo de la Torre y Eduardo Rodriguez-Oreggia
(Mexico); and Manuel Glave, Ricardo Fort and Cristina Rosemberg (Peru). The authors acknowledge
Andrew Maskrey and Alejandro De la Fuente for their support and helpful comments. The document
benefitted from discussions with all the authors involved in the project, and from conversations with the
ISDR-GAR team during the meetings held in Geneva, Bangkok, Bogota and Mexico City.

among other factors. The impact on the poor households and regions is
multidimensional.
Significant social and economic consequences of major recent natural hazards in
different parts of the world have reinforced the need to place hazard concerns at the
top on the global poverty and development agenda. Lindell and Prater (2003), for
example, persuasively outline the policy relevance of the issue. First, policy makers
must understand the impacts of natural shocks on poor households in order for the
assistance to be more effective. Moreover, specific population groups should be
identified as more vulnerable to natural hazards, as a useful way for planning ex-ante
responses to avoid long term consequences on welfare.
The geographical conditions of Latin America make it prone to the occurrence of high-
intensity climate-related events. But the large economic and human cost associated
with these natural events is mainly the result of extreme vulnerability (Charveriat,
2000).
The project on Disaster Risk and Poverty in Latin America and the Caribbean was
based on two main objectives. First, the empirical analysis estimated the relation
between natural events and social indicators at the local level, establishing a causal link
whenever possible. Second, analysis was carried out at the household level in order to
determine the potential role played by coping mechanisms to influence long-term
impacts on welfare.
As described below, the assets approach to poverty can be used as a reference
framework to understand the nature and potential impact of shocks. Events can
influence the stock of assets held by household members, the intensity in which such
assets are used, and the prices paid for their use. Transfers can compensate short term
impacts and may, in principle, be used to avoid long term consequences of shocks.
Specific examples will be provided.
In terms of the policy implications, emphasis will be made on two “biases” that are
present in disaster-related policies. First, physical infrastructure tends to be prioritized
and, in many cases, assumed to be the only realm of public action and damage
accounting. That is incorrect given the important economic losses implied by the
destruction of “intangibles” with long run effects: school attendance of children, health
related impacts, systematic reduction of employment opportunities, and lower returns
to assets. The second bias relates to the importance given to ex-post interventions,
while ex-ante mechanisms could be put in place to shield households from losses,
especially in human capital. Conditional cash transfers programs (CCT), for example,
could incorporate shock-related responses. De Janvry, et al. (2006) shows that pre-
existing conditional cash transfer schemes do function as a safety net for those exposed
to natural events, and that such role could be strengthened.
2. The Evidence
As we noted above, the links between natural events and living standards are complex
to capture empirically. As discussed in De la Fuente, et al. (2008), one important
challenge in the analysis of disaster risk and poverty is the existence of a double
causality. Thus, we can state the hypothesis of the interaction in two directions:
i) Poverty –or socioeconomic conditions—do affect the incidence (in specific kinds
of phenomena) and the intensity (in almost all cases) of hazards. We shall
call this hypothesis 1.
ii) The occurrence of natural hazards affects poverty. This will be called
hypothesis 2 (Figure 1).
The analysis summarized in this section focuses on both hypothesis above. A summary
of variables analyzed, data used and empirical strategies is shown in Annex 1.
Following the empirical methodology outlined in De la Fuente, et al. (2008) and in
López-Calva and Rodríguez-Oreggia (2008), the purpose of the analysis is to determine

the impact of natural events on poverty at the local –geographic-- and household
levels, with causal implications whenever possible.
Figure 1
Hazards PovertyHypothesis I Hypothesis II
2.1. Mexico
According to National Center for Disaster Prevention (CENAPRED) between 1980 and
2006 there have been 75 major natural events that have produced more than 10
thousand deaths and a damage of about 9,600 million dollars. In contrast, in the same
period there were 17,172 natural events of medium and small scale with important
effects (see table 1). These events also had particular impact on agriculture: during
1980-2006 more than 52.6 millions of crops hectares were lost, representing a loss of
nearly 32 billion dollars.
Table 1
Summary of damages of the natural events of medium and small scale
Total 17,172
Deaths 32,288
Missing people 9,076
Injured and sick 45,099,806
Victims 12,328,326
Houses affected 1,992,372
Houses destroyed 347,931 Source: Desinventar.
More than half (54.5%) of the events are associated to climatic phenomena, while the
anthropic and technological events represent less than a quarter of total. Regarding the
first ones, floods are the event with higher recurrence, representing 22.1% of the total
events.

According to their territorial distribution, over 40% of the events are located in five
states: Distrito Federal (12.6%), Veracruz (9.9%), Estado de Mexico (8.1%), Chihuahua
(5%) and Chiapas (4.7%). At municipal level, 22 of the 2,445 municipalities (0.9%)
capture a total of 3,401 events (19.8% of total). Cuauhtemoc, in the Distrito Federal, has
the highest incidence (357 events), followed by Juarez, Chihuahua (248) and Iztapalapa
(228) also in the Distrito Federal (see map 1).
Map 1
Risk geography at the municipal level in Mexico, 1980-2006
Source: Desinventar.
These 22 municipalities are characterized by having a high economic development
degree. However, most of the metropolitan areas they belong to, have high
marginalization levels in its urban population. Except Monterrey, Chihuahua,
Guadalajara and the Distrito Federal, the rest have high and very high marginalization
degrees in more than 25% of its population. In cities like Acapulco, Coatzacoalcos and
Tapachula these marginalization degrees reach more than 50% of the whole
population. In general, high risk levels are associated with the growth of human
settlements and some urbanization forms in cities with these characteristics.
The analysis of the impacts of natural events on social indicators follows the next
empirical questions: Is there an effect of the incidence of natural events on long term
indicators such as those included in the Human Development Index? Are those events

affecting the levels of poverty in such areas? Do public responses for localities affected
reduce the impact of such events?
Using information from DesInventar database and other publicly available data, the
analysis for Mexico tackles those questions. Specifically, the analysis focuses on how
natural events may affect local social indexes at the municipal level, such as the
Human Development Index (HDI), and poverty levels, between years 2000 and 2005.
Results show that there is a reduction of .006 on average in the HDI as result of the
incidence of any type of natural events at the municipal level for the period 2000-2005,
which represents on average 0.8% of the HDI. Also, there is an increase of about 3.6
percentage points in the incidence of food poverty, three percentage points in
capacities poverty, and 1.5 percentage points in assets poverty.2 Disaggregating by type
of event, we find that droughts reduces the HDI on 0.009, representing about 1.2 per
cent of the HDI on average, while heavy rains is significant for some of the
specifications, representing a decrease of about 0.8 per cent of the HDI.
Disaggregating by type of event, floods have an incidence on the increase of food
poverty of 3.5 percentage points, while droughts increase it by 4.1 percentage points.
Also, floods and droughts increase capacities poverty in 2.9 and 3.7 percentage points
respectively. Finally, floods and droughts also increase assets poverty by 1.9 and 2.5
percentage points.
2.2. El Salvador
El Salvador is a country that has been subjected to a large variety of natural hazards in
the past: the San Salvador earthquake in 1986; “El Niño” phenomenon 1997-98; the
hurricane Mitch (1998); the 2001 earthquakes and the drought in the same year; the
pneumonia epidemic of 2003 which caused 304 deaths; and the tropical storm Stan in
2005. The impact of these events has resulted in considerable losses. In particular, the
effects of two major earthquakes and a number of smaller follow-ups on rural
2 In Mexico, poverty lines

household income and poverty in early 2001. According to ECLAC, these earthquakes
and related landslides produced a death toll of more than 1,200 people, affected nearly
300,000 dwellings (about 32% of the existing housing stock) and caused US$1.6 billion
in direct and indirect damages (12% of GDP in 2000).3
Between 1970 and 2007, 3,386 events occurred in the country. These events caused
more than 2,000 deaths and more than 12,000 houses have been damaged or destroyed
(see table 2). Floods and slides are the major events: 23% and 19% of total events,
respectively.
Table 2
Summary of damages, 1970-2007
Total 3,386
Deaths 2,120
Missing people 605,143
Victims 120,115
Houses affected 10,130
Houses destroyed 2,026 Source: Desinventar.
Regarding the geographical distribution of these events, at departmental level San
Salvador has the largest number of events in the period (31.2% of total). Similarly, at
regional and municipal levels, the largest number of events occurred in the
Metropolitan Area of San Salvador, with 1,094 events (32.3% of total). In general, there
is a large risk concentration in a small part of the territory: 48.6% of the total events
occurred only in 20 of the 262 municipalities (see map 2).
Map 2
Territorial distribution of the natural events, 1970-2007
3 CEPAL (2001a)

Source: Desinventar.
Only by comparing maps 2 and 3 it seems that there is not a direct relationship
between risk and poverty: the total of municipalities with middle and high incidence
remains with low levels of extreme and moderate poverty.
Map 3
National extreme poverty map in El Salvador
Source: FISDL.
However, the empirical analysis exploits microeconomic evidence at the household
level together with variation in the intensity of the geological shocks in a quasi-
experimental way (Baez and Santos, 2008). Using longitudinal data collected in rural
areas before and after the shock (approximately 700 households), the analysis
specifically tests whether the 2001 earthquakes have an effect on household income, as
well as on other indicators that can identify coping responses to the shock. These
earthquakes are associated with a reduction of $1,760 colones in household income per
capita (a reduction of 15%) or one third of the pre-shock average, in turn affecting
poverty levels as well. Yet, other indicators that measure the incidence of poverty such

as the poverty gap show a relative worsening in highly affected areas. Some basic
indicators indicate that alternative sources of income and consumption only played a
limited role in coping with the effects of the shocks.
These findings highlight that while natural events can have a pervasive impact on
poverty in the short term, the most dangerous effects are those that reveal themselves
only in the medium to long term through reductions in human and physical capital.
Results show that children in households highly exposed to the 2001 earthquakes in
rural El Salvador became differentially less likely to attend school as the probability of
enrollment decreased by 6 percentage points (fall of 7%). “High-intensity” treated
households also exhibit relatively higher losses of assets such as housing, land,
livestock, farm machinery and other physical capital. Overall, these impacts are
expected to reduce the future earning capacity of the most affected households.
2.3. Peru
Peru is globally considered among the countries where “El Niño Southern Oscillation”
(ENSO) strikes harder. The Peruvian ocean is the scenario of the encounter of warm
waters from the Equator with the colder front coming from the extreme Southern
Pacific. At the peak years along the ENSO cycles, popularly known as “El Niño years”,
the classic pattern of events is a combination of floods in the northern coast with
extreme droughts in the southern Andean highlands. The most recent “El Niño years”
have been 1972, 1983, and 1997-98 although the ENSO cycle is a dynamic climatological
process and in the recent years the media tend to grade every year having a more or
less strong ENSO effect.
The following analysis provides an overview of natural hazards in Peru since 1970. The
events are classified using two criteria: extensive–intensive events depending of the
number of deaths and houses destroyed (risk typology), and the division between
geological and hydro-meteorological events (event typology).
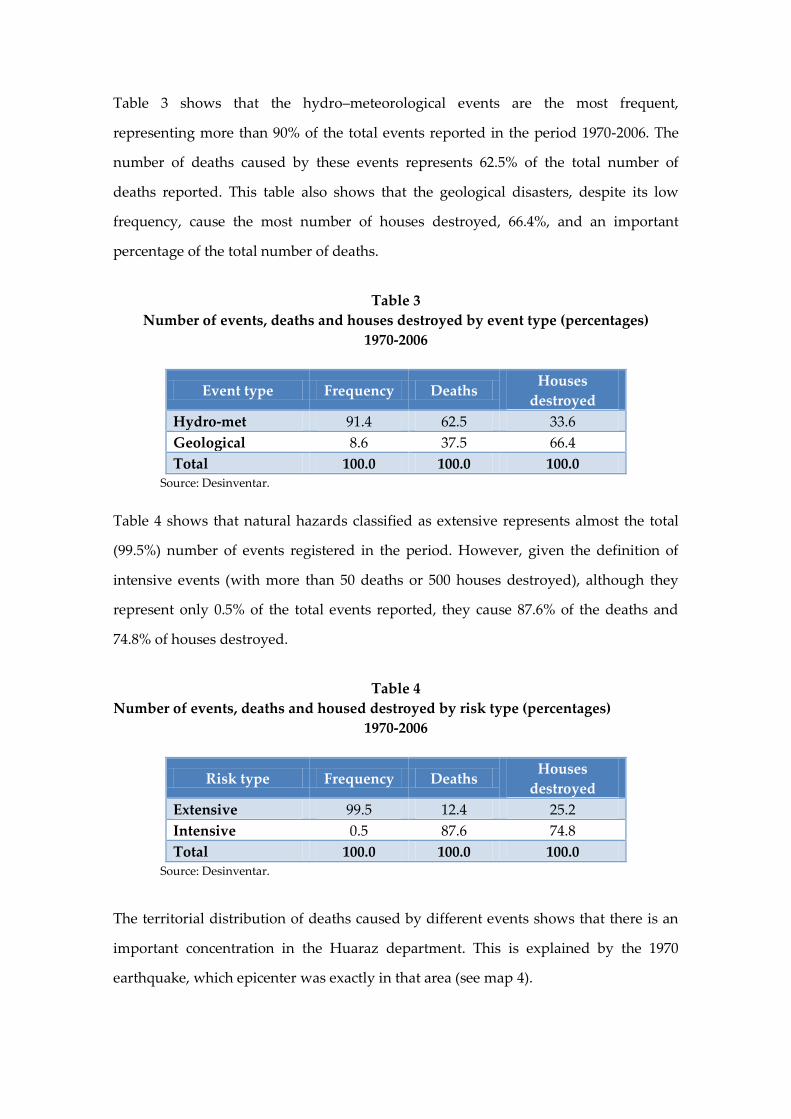
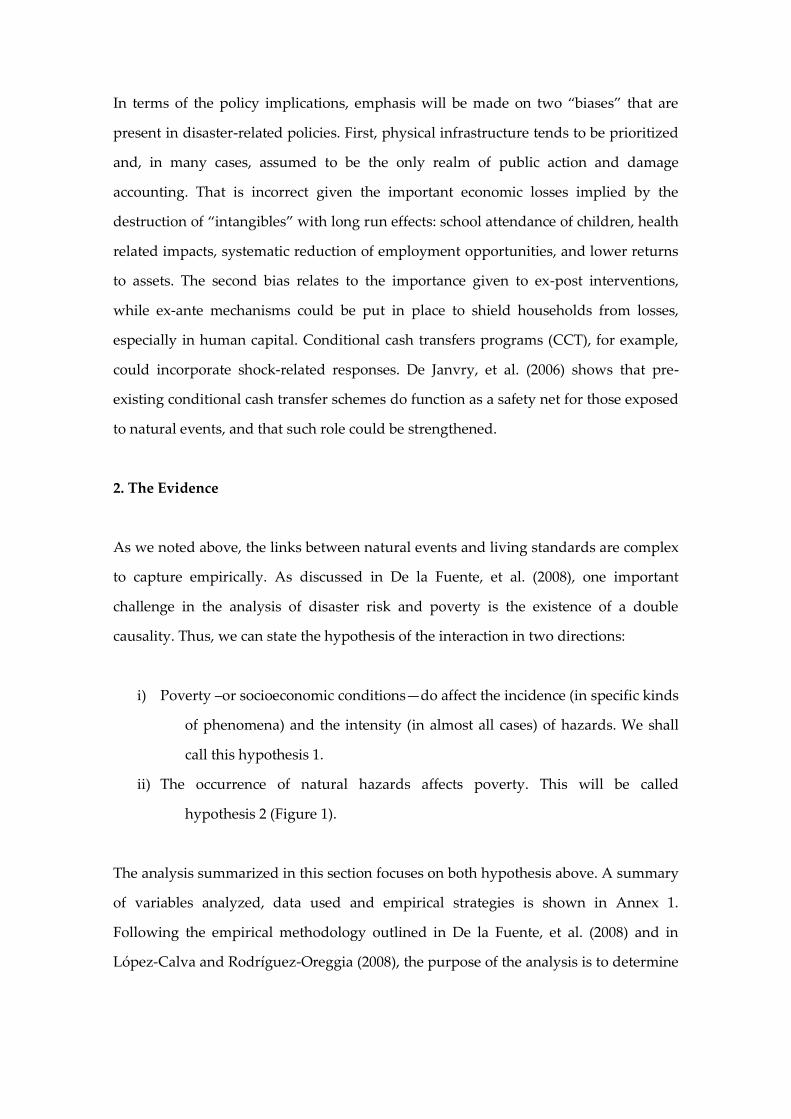
Table 3 shows that the hydro–meteorological events are the most frequent,
representing more than 90% of the total events reported in the period 1970-2006. The
number of deaths caused by these events represents 62.5% of the total number of
deaths reported. This table also shows that the geological disasters, despite its low
frequency, cause the most number of houses destroyed, 66.4%, and an important
percentage of the total number of deaths.
Table 3
Number of events, deaths and houses destroyed by event type (percentages)
1970-2006
Event type Frequency Deaths Houses
destroyed
Hydro-met 91.4 62.5 33.6
Geological 8.6 37.5 66.4
Total 100.0 100.0 100.0 Source: Desinventar.
Table 4 shows that natural hazards classified as extensive represents almost the total
(99.5%) number of events registered in the period. However, given the definition of
intensive events (with more than 50 deaths or 500 houses destroyed), although they
represent only 0.5% of the total events reported, they cause 87.6% of the deaths and
74.8% of houses destroyed.
Table 4
Number of events, deaths and housed destroyed by risk type (percentages)
1970-2006
Risk type Frequency Deaths Houses
destroyed
Extensive 99.5 12.4 25.2
Intensive 0.5 87.6 74.8
Total 100.0 100.0 100.0 Source: Desinventar.
The territorial distribution of deaths caused by different events shows that there is an
important concentration in the Huaraz department. This is explained by the 1970
earthquake, which epicenter was exactly in that area (see map 4).
Map 4
Territorial distribution of deaths
Source: Desinventar.
In terms of the number of houses destroyed, the 1970 earthquake is, again, the most
significant event. However, there was an important amount of houses destroyed in
1983 and 2001. This is explained by the effects of El Niño in 1983 and by the earthquake
in 2001 in the south of the country. Huaraz is the most affected department, followed
by the north zone, where El Niño typically causes great losses.
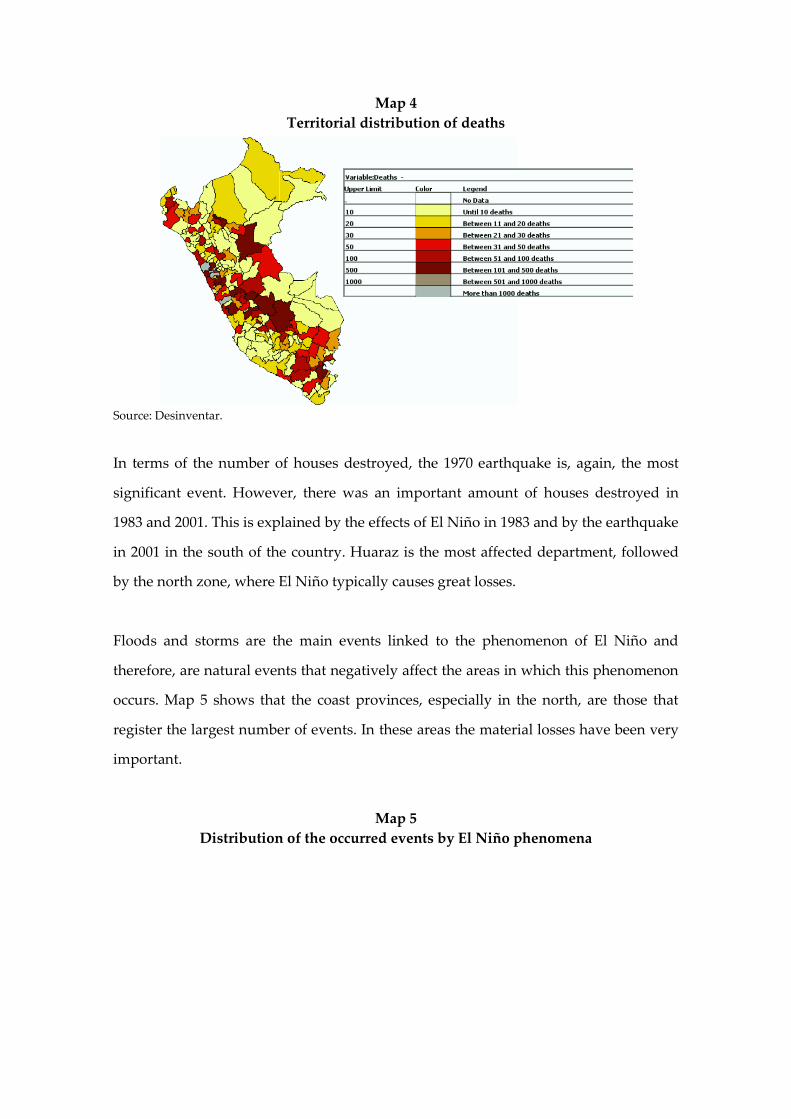
Floods and storms are the main events linked to the phenomenon of El Niño and
therefore, are natural events that negatively affect the areas in which this phenomenon
occurs. Map 5 shows that the coast provinces, especially in the north, are those that
register the largest number of events. In these areas the material losses have been very
important.
Map 5
Distribution of the occurred events by El Niño phenomena

Source: Desinventar.
In the case of Peru, as well as in other countries, there seems to be a strong bias in the
information on natural hazards in the DesInventar database. First, more isolated
districts do not count with any report on natural hazards in the past 36 years. Second,
districts of higher rank or importance in terms of geo-political classification
systematically present a higher number of reported events than the rest, even when
compared to their neighbor districts. Given that the main scope of the analysis for Peru
is to assess the relationship between natural hazards and welfare indicators, the fact
that districts with better socio-economic conditions (like provincial capitals) tend to
have a higher number of reported events in the DesInventar database due to its method
for data collection, will seriously limit the possibility of using this information in the
empirical analysis.
The bias in the DesInventar database deters the option of doing a clear analysis of the
relationship at the District level. Thus, the analysis for Peru is based on the national
household survey ENAHO, conducted by the National Institute of Statistics (INEI). It
has been possible to ensemble a five-wave unbalanced panel database for the period
2002-2006 with information for 2,091 households at rural level. However, the balanced
panel database just includes 831 households. ENAHO is used to calculate and monitor
poverty in the country. Consequently it allows the calculation of household’s
consumption levels as well as income. Furthermore, it includes valuable information
regarding durable and productive assets and access to public services. The survey also
includes a question about the experience of a negative shock in the last 12 months
(death of an income’s provider, unemployment, natural hazard), and asks also about
the consequences of that shock and the strategies undertaken (depletion of assets,
borrow money, etc.)
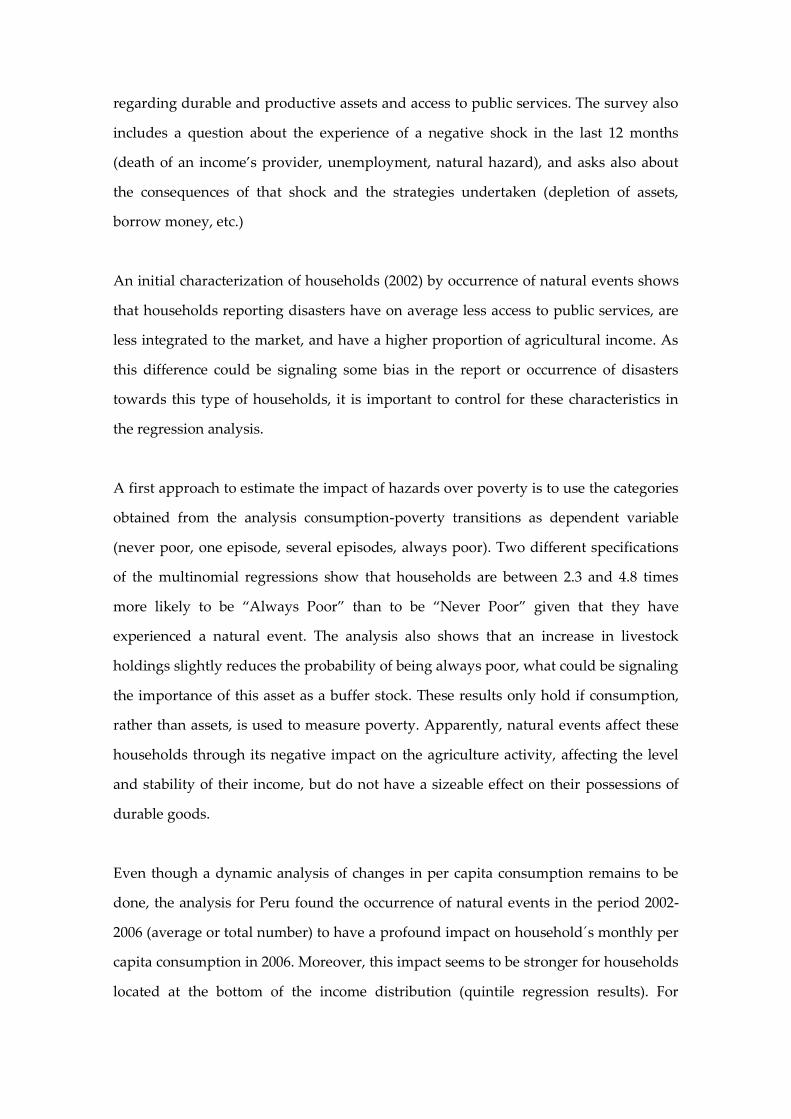
An initial characterization of households (2002) by occurrence of natural events shows
that households reporting disasters have on average less access to public services, are
less integrated to the market, and have a higher proportion of agricultural income. As
this difference could be signaling some bias in the report or occurrence of disasters
towards this type of households, it is important to control for these characteristics in
the regression analysis.
A first approach to estimate the impact of hazards over poverty is to use the categories
obtained from the analysis consumption-poverty transitions as dependent variable
(never poor, one episode, several episodes, always poor). Two different specifications
of the multinomial regressions show that households are between 2.3 and 4.8 times
more likely to be “Always Poor” than to be “Never Poor” given that they have
experienced a natural event. The analysis also shows that an increase in livestock
holdings slightly reduces the probability of being always poor, what could be signaling
the importance of this asset as a buffer stock. These results only hold if consumption,
rather than assets, is used to measure poverty. Apparently, natural events affect these
households through its negative impact on the agriculture activity, affecting the level
and stability of their income, but do not have a sizeable effect on their possessions of
durable goods.
Even though a dynamic analysis of changes in per capita consumption remains to be
done, the analysis for Peru found the occurrence of natural events in the period 2002-
2006 (average or total number) to have a profound impact on household´s monthly per
capita consumption in 2006. Moreover, this impact seems to be stronger for households
located at the bottom of the income distribution (quintile regression results). For

instance, increasing the average occurrence of shocks in one unit reduces monthly per
capita consumption by 2% for households in the lower quartile of the distribution,
while it only reduces consumption by 1.2% for households in the richer quartile.
2.4. Bolivia
Between 1970 and 2007 a total of 1,406 events have been reported in Bolivia at level of
Provinces. Only five of these events are risk-intensive: earthquake in 1998, slide in
1992, two flash floods in 1983 and 2002, and a flood in 2003 (see table 5). These events
were reported in La Paz (2), Cochabamba (2) and Santa Cruz (1).
Table 5
Intensive and extensive events, by associated losses, 1970-2007
Intensive % Extensive % Total
Events reported 5 0.3 1,401 99.7 1,406
Deaths 354 43.0 467 57.0 821
Houses destroyed 1,800 43.0 2,378 57.0 4,178
Houses affected 0 0 2,090 100.0 2,090 Source: Desinventar.
The extensive risk represents almost 60% of deaths and destroyed houses and the total
of affected ones. In these manifestations, the climatic events represent 87% of the total
of reports and deaths, and more than 90% of houses destroyed or damaged (see table
6).
Table 6
Extensive events and associated losses, 1970-2007
Extensive events Events
reported %
Deaths
(%)
Houses
Destroyed
(%)
Affected (%)
Climatic 1,228 87.7 87.0 92.1 95.0
Geological 16 1.1 0.0 0.3 0.0
Tecnological 118 8.4 12.8 7.3 5.0
Total 1,401 100.0 100.0 100.0 100.0 Note: 39 events are associated to fire.
Source: Desinventar.

The highest climatic events incidence (2006 and 2007) is associated to the two major
rain waves that affected the east departments of the country, especially Beni, Pando
and Santa Cruz. In terms of deaths, however, the greatest number was reported in 2004
when there was a drought in the providence of Cordillera, in Santa Cruz department.
Regarding the territorial distribution, a total of 94 provinces reported effects by any
extensive risk manifestation. There is a middle or high occurrence in 13 of these
provinces, and they concentrate 65% of the total reports, 47% of deaths, 56% of
destroyed houses and 81% of affected ones. These provinces are: 4 in the Cochabamba
department (Cercado, Chapare, Quillacollo and Carrasco), 2 in La Paz department
(Murillo and Larecaja) and one in each of the other 7 departments of the country.
Map 6 shows how the affectation of provinces has changed during last decades. We
can observe a territorial expansion of the extensive risk manifestations, highlighting
the case of La Paz, which appears in all the decades; Cochabamba, especially affected
in the eighties; and the case of Santa Cruz, with an important reports concentration in
the last two decades. In the current century we observe a larger number of affected
provinces, expanding significantly the extensive risk territory.
Map 6
Extensive risk by decades, 1970-2007
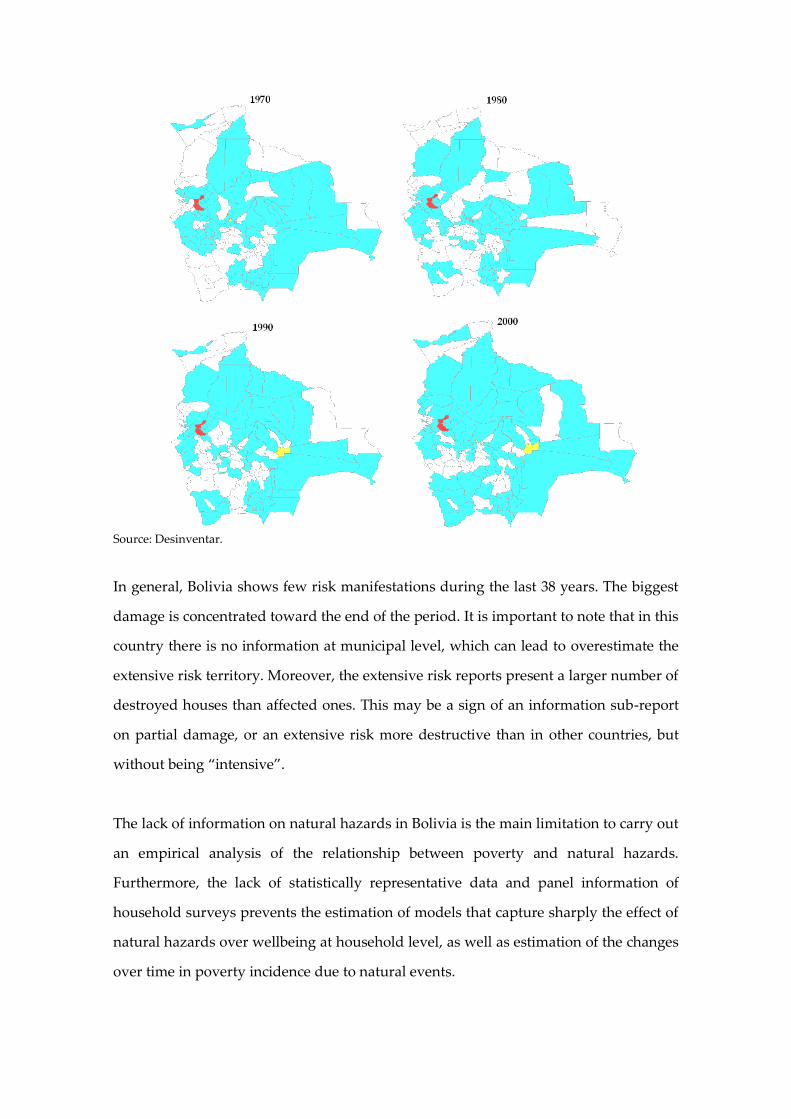
Source: Desinventar.
In general, Bolivia shows few risk manifestations during the last 38 years. The biggest
damage is concentrated toward the end of the period. It is important to note that in this
country there is no information at municipal level, which can lead to overestimate the
extensive risk territory. Moreover, the extensive risk reports present a larger number of
destroyed houses than affected ones. This may be a sign of an information sub-report
on partial damage, or an extensive risk more destructive than in other countries, but
without being “intensive”.
The lack of information on natural hazards in Bolivia is the main limitation to carry out
an empirical analysis of the relationship between poverty and natural hazards.
Furthermore, the lack of statistically representative data and panel information of
household surveys prevents the estimation of models that capture sharply the effect of
natural hazards over wellbeing at household level, as well as estimation of the changes
over time in poverty incidence due to natural events.

Considering the above limitations, the methodology applied for the Bolivian case
analysis can be described as follows:
(i) Estimation of model of change in poverty incidence between census (1992-2001)
at a municipal level as a function of risk index among other determinants.
The risk index was constructed only with information of climate and
geological events weighted by exposed population, since information of
damages is not available;
(ii) Estimation of changes in poverty and inequality indexes as well as repeated
cross section estimations of income functions in Trinidad – the city which
was largely affected by floods in 2006-2007 by the phenomenon of “El
Niño” – taking into account the effect of district of residence as a proxy of
exposure to the natural event.
Among the results at municipal level the analysis for poverty incidence shows, first,
that the average schooling level in the municipality has an increasing contribution over
the reduction of poverty incidence. Moreover, an initial greater incidence of poverty in
the municipality (1992 incidence) has a positive effect on its change. However, this
result can be interpreted as the effect of being in a disadvantageous initial situation
more than as a symptom of convergence. Second, the negative change in the Rate of
Child Mortality (interpreted as an improvement in living conditions) as well as
positive rates of migration (immigration) impact positively over the change of poverty
incidence. Despite that the sign in both variables changes in the simultaneous model
and two stages least squares, the significance also falls. In the case of the change in
Unmet Basic Needs (UBN, interpreted as non monetary poverty) results show a
positive effect over monetary poverty.
Regarding the variable risk, it shows the results predicted by theory: as the risk is
larger at the municipality level, smaller is the improvement in monetary poverty. The
coefficient displays negative and statistically significant values in five estimations,
although in the case of two stages least squares and simultaneous equations methods,

the magnitude of the effect is lower in about 50% compared with the rest of the
estimators obtained (4% and 3% respectively).
The interpretation of the variable risk must be taken with caution since this index may
capture not only the vulnerability of municipalities in terms of natural events, but also
other effects like productive capacity, agro-industrial potential or other kind of shock
occurred in the municipality in nine years of intercensus period. Even when the
variable is instrumented by exogenous variables (such altitude, temperature or slope)
the coefficient may capture problems associated to agricultural efficiency, lack of roads
and communication or other limitations derived from geography that are not always
manifested as a natural event. The results are qualitatively consistent in different
estimations, emphasizing the fact that the index of risks has a negative incidence in the
improvement of wellbeing in municipalities in all cases. Finally, statistical significance
of education and risk variables are inalterable in all estimations.
The analysis for Trinidad City shows that the levels of poverty incidence in 2007
increased of almost twelve points compared with information of 2006. This increment
occurred after the flood, is more than five times the increment observed at a national
level. A similar situation is observed in the case of the poverty gap, whose interannual
increase was more than six points. Finally, the severity of poverty, expressed by the
FGT (2) index had also a substantial increase between the analyzed years.
Not only levels of poverty had a dramatic increase, but also inequality. In fact, Gini
coefficient rose from 0.37 to 0.43 between 2006 and 2007. These results reveal the
enormous impact in wellbeing conditions in the city of Trinidad, derived from the
effects of the natural event. In this context, one of the major concerns is to isolate the
effect of the flood on wellbeing conditions (measured by household income) through
econometric estimations.
The results of the income regressions indicate that, first, every year of education is
associated with an increase in income of 8.7% and 6.6% in 2006 and 2007 respectively.

Note that the return of education is significantly smaller in 2007. Such situation could
be due to the fact that the disaster shock might affect economic context of the city,
which in turn, is translated into a lower return of education on income. A similar
situation is observed in the case of the variable sex. For both years men have received a
premium on income compared to women.
Additionally, this premium has increased between the 2006 and the 2007, which
implies that the changes in socioeconomic context in Trinidad in this period (including
the event of the flood) had more evident negative effects on the female population.
Second, in the case of labor experience, the variable has a positive return over income,
but with a decreasing rate. The changes between both years are not statistically
different. Finally living in a protected zone from flood risks (smaller exposure to risk)
implies a return on income. Although nothing can be concluded about the mechanisms
that produce such extraordinary return, we can observe that this return increased
between 2006 and 2007 from 5% to 7%.
A vast literature about returns of residence over income concludes that such
approximation has endogeneity problems since residence is not a random decision in
the household. If this is correct, we must expect that our proxy variable for exposition
to natural hazard is upward biased. In any case, we can establish that at least one part
of this effect can be attributable to the natural event occurred in Trinidad.
A final exercise accomplished for the case of Trinidad, was the decomposition of
inequality Gini index. Among other results we can observe that schooling (education)
has the largest contribution in explaining inequality of income in Trinidad. This
variable explains between 75% and 77% of the inequality. This value is 9 times greater
than the other factors, including the residence district. Nevertheless, it is interesting to
note changes registered in other factors between the 2006 and the 2007. In first place,
we can observe that in 2006 the second factor in importance to explain the inequality is
the labor experience, since its contribution to inequality is 7.9%. The district of

residence and sex respectively are the third and fourth place in importance that year
with a contribution to the inequality of 7.4% and 7.3%.
The magnitudes of the factors for 2007 registered an important change. Although the
education is still the most important explanatory factor of the inequality, the factor
district of residence is the second factor in importance now with a contribution of 9.6%
over inequality. Variable sex also increased its contribution to inequality in 2007, but its
magnitude is smaller than district of residence. These results allow inferring that at
least one part of the increase in the contribution of inequality by residence district is
due to the impact of the natural event in the city of Trinidad. Additionally, the increase
in the contribution of variable sex reveals that conditions for women not only are
worse than those for men in absolute terms (smaller return). It also shows (at least in
part) that women were more affected by natural events taking into account the changes
in contribution of sex to inequality after the flood disaster in Trinidad.
2.5. Ecuador
Between 1970 and 2007, 3,596 natural events have been reported, of which only 6 are
risk-intensive: two earthquakes (1987 and 1996), two slides (1983 and 1993), one flood
(1987) and one flash flood (1993), while the rest are extensive (see table 7). The low
incidence of the first ones contrasts with the potential risk of the volcanic and seismic
activity in the country. At least four active volcanoes have had eruptive episodes since
1999 (Reventador, Pichincha, Cotopaxi and Tungurahua), threatening large population
areas including the capital.
Table 7
Intensive and extensive events, by associated losses, 1970-2007
Intensive % Extensive % Total
Events reported 6 0.2 3,590 99.8 3,596
Deaths 877 29.0 2,138 71.0 3,015
Houses destroyed 2,253 19.6 9,240 80.4 11,493
Houses affected 178 0.4 40,596 99.6 40,774 Source: Desinventar.
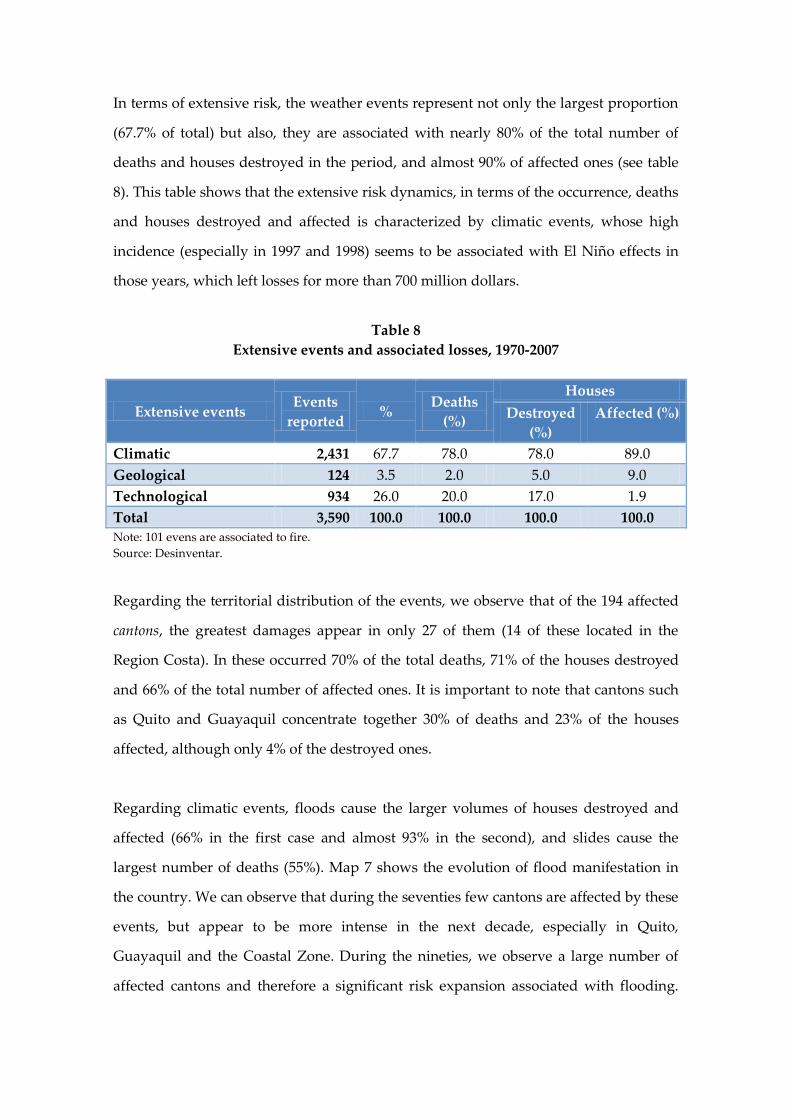
In terms of extensive risk, the weather events represent not only the largest proportion
(67.7% of total) but also, they are associated with nearly 80% of the total number of
deaths and houses destroyed in the period, and almost 90% of affected ones (see table
8). This table shows that the extensive risk dynamics, in terms of the occurrence, deaths
and houses destroyed and affected is characterized by climatic events, whose high
incidence (especially in 1997 and 1998) seems to be associated with El Niño effects in
those years, which left losses for more than 700 million dollars.
Table 8
Extensive events and associated losses, 1970-2007
Extensive events Events
reported %
Deaths
(%)
Houses
Destroyed
(%)
Affected (%)
Climatic 2,431 67.7 78.0 78.0 89.0
Geological 124 3.5 2.0 5.0 9.0
Technological 934 26.0 20.0 17.0 1.9
Total 3,590 100.0 100.0 100.0 100.0
Note: 101 evens are associated to fire.
Source: Desinventar.
Regarding the territorial distribution of the events, we observe that of the 194 affected
cantons, the greatest damages appear in only 27 of them (14 of these located in the
Region Costa). In these occurred 70% of the total deaths, 71% of the houses destroyed
and 66% of the total number of affected ones. It is important to note that cantons such
as Quito and Guayaquil concentrate together 30% of deaths and 23% of the houses
affected, although only 4% of the destroyed ones.
Regarding climatic events, floods cause the larger volumes of houses destroyed and
affected (66% in the first case and almost 93% in the second), and slides cause the
largest number of deaths (55%). Map 7 shows the evolution of flood manifestation in
the country. We can observe that during the seventies few cantons are affected by these
events, but appear to be more intense in the next decade, especially in Quito,
Guayaquil and the Coastal Zone. During the nineties, we observe a large number of
affected cantons and therefore a significant risk expansion associated with flooding.

Finally, in the current decade the risk increased in the Amazon region and decreased in
the Sierra region. Quito and Guayaquil are still very affected.
Map 7
Extensive risk associated to floods, 1970-2007
Source: Desinventar.
In general, in Ecuador there is an association between the occurrence of El Niño and
extensive events, given that between 1997 and 1998 there were the largest number of
affected cantons.
In order to examine the relationship between natural hazards and poverty the analysis
for Ecuador employs several specifications, corresponding to varying set of controls.
For each specification the analysis take into account distinct natural hazards such as
seismic events, earthquakes, landslides, droughts, and floods.
Interestingly, only seismic events and droughts seem to have an effect on the changes
in canton poverty incidence. Exposure to seismic events increases the changes in

poverty incidence along all specifications. Further, instead of using the change in
poverty incidence the change in poverty gap and severity is used; however, seismic
events do not seem to have any effect on these measures. Similar patterns are observed
for droughts, albeit with slightly higher marginal effects. Droughts are associated with
increased changes in poverty incidence. For instance, in the complete specification
exposure to droughts increases the changes in poverty incidence by 2 percentage point
on average.
Although the findings are suggestive and lies on correlation analysis, understanding
the link between poverty and natural hazards constitute a key element to design
poverty alleviation strategies. Taking into account that natural hazards have important
consequences on the welfare of households and particularly of vulnerable and poor
ones, it is important to move from policies that respond to emergencies and disasters to
policies that incorporates actively reducing natural hazard. Protecting vulnerable
population and improving coping mechanisms (i.e. insurance, access to financial
markets, among others) are critical for fighting against short and long term poverty.
3. Policy Lessons
The evidence indicates that sufficiently large or persistent natural events are likely to
have both a short term and a potential long term and inter-generational impact on
poverty, unless public policy plays both a prevention and mitigation role. How should
policy address the issue?
First, in the short run, interventions aimed at protecting households from large and
aggregate shocks have to address the most immediate humanitarian needs and
damages in infrastructure, as well as instantaneous loss of income. Second, disaster-aid
policies have to be combined with programs that emphasize the prevention of losses of
productive human and physical capital. The design of preventive and ex-post safety
nets targeting children and ensuring that they stay in school and healthy is a case in
point to reduce the impacts on next generations.

Furthermore, the immediate response and transfers made could be designed on an ex
ante basis to be triggered in a way to introduce the incentives for changes in behavior
needed to achieve more efficient ex-ante risk management and ex-post coping
strategies in the short-term. Optimal income diversification, improvements in the use
of savings and less reliance on adverse coping strategies (e.g. reductions in
consumption, child labor, sell of physical assets) are in principle more effective means
to make rural income and human welfare more resilient to natural hazards such as
earthquakes and other extreme events, even before they strike. CCT programs could be
an instrument of this type (De Janvry, et al., 2008).
Finally, since policies can’t be implemented in isolation, it is crucial that policy makers
have a clear understanding of the interactions between poverty and institutional/social
structures and how they matter for managing natural events in the local context. Policy
implications of the study include public investments for the strengthening of
information data sets on natural hazards by territorial units, for example. This implies
capacity building activities at different levels of government (national, regional, local).
Regarding the policy debates on coping mechanisms, the study seems to suggest that
livestock holdings could be functioning as a buffer stock in the presence of natural
hazards in rural areas, suggesting potential ex-ante public policies to also improve the
management of strategic assets of the rural poor.

References
Baez, J. and I. Santos. 2008. “On Shaky Ground: The Effects of Earthquakes on
Household Income and Poverty” Document Prepared for ISDR/RBLAC Research
Project on Disaster Risk and Poverty.
Carter, M., P. Little and T. Mogues. 2007. “Poverty Traps and Natural Disasters in
Ethiopia and Honduras.” World Development, 35(5), 835-856.
Charvériat, C. 2000. “Natural Disasters in Latin America and the Caribbean: An
Overview of Risk.” Working Paper No. 434, Research Department, Inter-American
Development Bank, Washington.
De Janvry, A., E. Sadoulet, P. Salomón, and R. Vakis. 2006. “Uninsured Risk and Asset
Protection: Can Conditional Cash Transfer Programs Serve as Safety Nets?” SP
Discussion Paper No. 0604, World Bank, Washington.
De la Fuente, A., Luis F. López-Calva and A. Revi. 2008. “Assessing the Relationship
between Natural Hazards and Poverty: A Conceptual and Methodological Proposal.”
Document Prepared for ISDR/RBLAC Research Project on Disaster Risk and Poverty.
Elliot, J. R. and J. Pais. 2006. “Race, Class, and Hurricane Katrina: Social Differences in
Human Response to Disasters.” Social Science Research, 35, 295-321.
Glave, M., R. Fort and C. Rosemberg. 2008. “Disaster Risk and Poverty in Latin
America: The Peruvian Case Study.” Document Prepared for ISDR/RBLAC Research
Project on Disaster Risk and Poverty.
Lindell, M. K. and Prater, C. S. 2003. “Assessing Community Impacts of Natural
Disasters.” Natural Hazards Review, 4(4), 176-185.
López-Calva, Luis F. and E. Rodríguez-Oreggia. 2008. “Methodological Note for the
Analysis of the Links between Natural Disasters and Poverty.” Document Prepared for
ISDR/RBLAC Research Project on Disaster Risk and Poverty.
Calero, C., R. Maldonado and A. Molina. 2008. “Relación entre eventos climáticos y
geológicos externos y pobreza.” Document Prepared for ISDR/RBLAC Research Project
on Disaster Risk and Poverty.
Mansilla, E. 2008. “Marco general de riesgo en El Salvador y México”. Document
Prepared for ISDR/RBLAC Research Project on Disaster Risk and Poverty.
Rodríguez-Oreggia, E. A. De la Fuente and R. De la Torre. 2009. “The Impact of
Natural Disasters on Human Development and Poverty at the Municipal Level in
Mexico”. Document Prepared for ISDR/RBLAC Research Project on Disaster Risk and
Poverty.

Peacock, W. G. and C. Girard. 1997. “Ethnic and Racial Inequalities in Hurricane
Damage and Insurance Settlements.” In Peacock, W.G., B.H. Morrow and H. Gladwin
(eds). Hurricane Andrew: Ethnicity, Gender, and the Sociology of Disasters. Routledge,
London.
Perez-De-Rada, E. and D. Paz. 2008. “Análisis de la relación entre amenazas naturales y
condiciones de vida: El Caso de Bolivia.” Document Prepared for ISDR/RBLAC
Research Project on Disaster Risk and Poverty.
Ramirez, F. 2008. “Patrones de manifestaciones de riesgo extensivo en la región
Andina: Los casos de Colombia, Bolivia y Ecuador.” Document Prepared for
ISDR/RBLAC Research Project on Disaster Risk and Poverty.
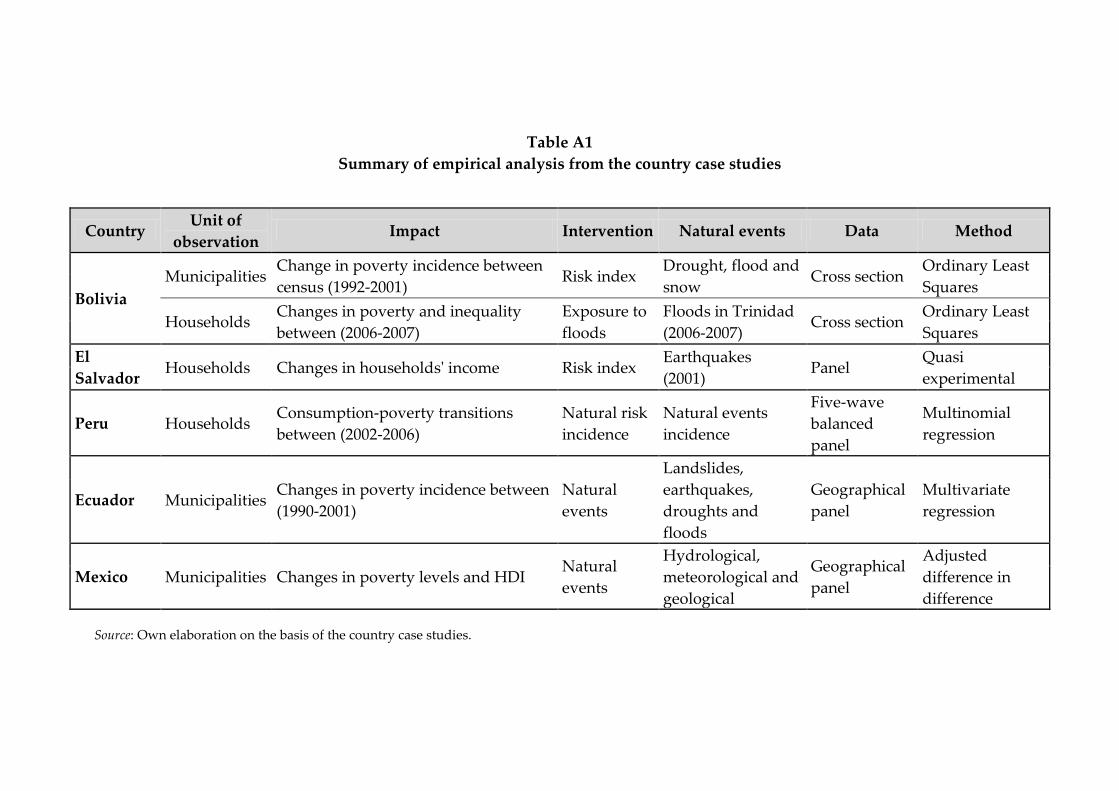
Table A1
Summary of empirical analysis from the country case studies
Country Unit of
observation Impact Intervention Natural events Data Method
Bolivia
Municipalities Change in poverty incidence between
census (1992-2001) Risk index
Drought, flood and
snow Cross section
Ordinary Least
Squares
Households Changes in poverty and inequality
between (2006-2007)
Exposure to
floods
Floods in Trinidad
(2006-2007) Cross section
Ordinary Least
Squares
El
Salvador Households Changes in households' income Risk index
Earthquakes
(2001) Panel
Quasi
experimental
Peru Households Consumption-poverty transitions
between (2002-2006)
Natural risk
incidence
Natural events
incidence
Five-wave
balanced
panel
Multinomial
regression
Ecuador Municipalities Changes in poverty incidence between
(1990-2001)
Natural
events
Landslides,
earthquakes,
droughts and
floods
Geographical
panel
Multivariate
regression
Mexico Municipalities Changes in poverty levels and HDI Natural
events
Hydrological,
meteorological and
geological
Geographical
panel
Adjusted
difference in
difference
Source: Own elaboration on the basis of the country case studies.

Table A2
Main findings of the empirical analysis from the country case studies
Country Unit of
observation Results
Bolivia
Municipalities
Schooling contributes on the reduction of poverty incidence.
Immigration impact positively on the change of poverty incidence.
As the risk is larger, smaller is the improvement in poverty.
Households
After the flood, poverty in 2007 increased 12 pp compared with 2006
Gini coefficient rose from 0.37 to 0.43 between 2006 and 2007.
Isolating the effect of the flood on wellbeing:
-Schooling is associated with an increase in income of 8.7% (2006) and 6.6%
(2007).
-Smaller exposure to risk implies a return on income: 5% in 2006 and 7% in 2007.
-By the decomposition of Gini index schooling explains inequality on around 77%
-District of residence has a contribution on inequality of 9.6% in 2007 (7.4% in
2006).
El
Salvador Households
Before and after the shock there are no differential effects on poverty incidence.
However, the earthquakes are associated with a reduction of $1,760 colones.
Most dangerous effects are related to reductions in human and physical capital.
In households exposed the probability of school enrollment decreased by 6 pp.
“High-intensity” treated households exhibit relatively higher losses of assets.
Peru Households
Given that households have experienced a natural event:
-Households are 2.3-4.8 times more likely to be always poor than to be never poor.
-Increase in livestock holdings reduces the probability of being always poor.
-Results only hold if consumption, rather than assets, is used to measure poverty.
Occurrence of shocks (increase in one unit the average) reduces consumption:
-For households in the lower quartile of the distribution (2%).
-For households in the richer quartile (1.2%).
Ecuador Municipalities
Seism and droughts seem to have an effect on the changes poverty incidence.
Exposure to droughts increases the change in poverty by 2 pp on average.
There is no effect on the change in poverty gap and severity.
Mexico Municipalities
Reduction of .006 on average in the HDI.
Increase in the level of poverty: food (3.6 pp), capacities (3 pp) and assets (1.5 pp).
Disaggregating by type of event:
-Droughts reduce the HDI on 0.009 and rains about 0.8 per cent of the HDI.
-Floods and droughts increase food poverty in 3.5 and 4.1 pp respectively.
-Floods and droughts increase capacities poverty in 2.9 and 3.7 pp respectively.
-Floods and droughts increase assets poverty by 1.9 and 2.5 pp respectively.
pp: Percentage points.
Source: Own elaboration on the basis of the country case studies.