United Kingdom - WHO/ · PDF fileQuantitative data on health services are based on a number...
125
European Observator y on Health Care Systems United Kingdom
Transcript of United Kingdom - WHO/ · PDF fileQuantitative data on health services are based on a number...

European Observator yon Health Care System s
United Kingdom

I
United Kingdom
Health Care Systems in Transition
United Kingdom
Health Care Systemsin Transition
The European Observatory on Health Care Systems is a partnership between the World HealthOrganization Regional Office for Europe, the Government of Norway, the Government of Spain,the European Investment Bank, the World Bank, the London School of Economics and PoliticalScience, and the London School of Hygiene & Tropical Medicine
PLVS VLTR
INTERNATIONAL BANK
FOR
RE
CO
NST
RUCTION AND DEVELOP
ME
NT
WORLD BANK
1999
II
United Kingdom
European Observatory on Health Care Systems
AMS 5001890CARE 04 01 01
Target 191999
Keywords
DELIVERY OF HEALTH CAREEVALUATION STUDIESFINANCING, HEALTHHEALTH CARE REFORMHEALTH SYSTEM PLANS – organization and administrationUNITED KINGDOM
©European Observatory on Health Care Systems 1999
This document may be freely reviewed or abstracted, but not for commercial purposes. For rights ofreproduction, in part or in whole, application should be made to the Secretariat of the European Observatoryon Health Care Systems, WHO Regional Office for Europe, Scherfigsvej 8, DK-2100 Copenhagen Ø,Denmark. The European Observatory on Health Care Systems welcomes such applications.
The designations employed and the presentation of the material in this document do not imply theexpression of any opinion whatsoever on the part of the European Observatory on Health Care Systems orits participating organizations concerning the legal status of any country, territory, city or area or of itsauthorities, or concerning the delimitation of its frontiers or boundaries. The names of countries or areasused in this document are those which were obtained at the time the original language edition of thedocument was prepared.
The views expressed in this document are those of the contributors and do not necessarily represent thedecisions or the stated policy of the European Observatory on Health Care Systems or its participatingorganizations.
European Observatory on Health Care SystemsWHO Regional Office for Europe
Government of NorwayGovernment of Spain
European Investment BankWorld Bank
London School of Economics and Political ScienceLondon School of Hygiene & Tropical Medicine
Target 19 – RESEARCH AND KNOWLEDGE FOR HEALTHBy the year 2005, all Member States should have health research, information and communication systems thatbetter support the acquisition, effective utilization, and dissemination of knowledge to support health for all.By the year 2005, all Member States should have health research, information and communication systems thatbetter support the acquisition, effective utilization, and dissemination of knowledge to support health for all.

III
United Kingdom
Health Care Systems in Transition
Foreword .............................................................................................v
Acknowledgements..........................................................................vii
Introduction and historical background .......................................... 1Introductory overview .................................................................... 1Historical background .................................................................... 5
Organizational structure and management................................... 13Organizational structure of the health care system ....................... 13Planning, regulation and management .......................................... 24
Health care finance and expenditure............................................. 33Main system of finance and coverage .......................................... 33Health care benefits and rationing ................................................ 35Complementary sources of finance .............................................. 40Health care expenditure ................................................................ 45
Health care delivery system............................................................ 53Primary health care and public health services ............................ 53Secondary and tertiary care .......................................................... 60Social care .................................................................................... 71Human resources and training ...................................................... 74Pharmaceuticals and health care technology assessment ............. 82
Financial resource allocation.......................................................... 85Third-party budget setting and resource allocation ...................... 85Payment of hospitals .................................................................... 87Payment of health care professionals ........................................... 90
Health care reforms ......................................................................... 97Aims and objectives ..................................................................... 97Reforms and legislation .............................................................. 100Reform implementation .............................................................. 102
Conclusions..................................................................................... 107
References....................................................................................... 111
Appendix 1 ...................................................................................... 113
Abbreviations ................................................................................. 117
Contents

IV
United Kingdom
European Observatory on Health Care Systems
V
United Kingdom
Health Care Systems in Transition
Foreword
The Health Care Systems in Transition (HiT) profiles are country-basedreports that provide an analytical description of each health care systemand of reform initiatives in progress or under development. The HiTs
are a key element that underpins the work of the European Observatory onHealth Care Systems.
The Observatory is a unique undertaking that brings together WHO RegionalOffice for Europe, the Governments of Norway and Spain, the EuropeanInvestment Bank, the World Bank, the London School of Economics andPolitical Science, and the London School of Hygiene & Tropical Medicine.This partnership supports and promotes evidence-based health policy-makingthrough comprehensive and rigorous analysis of the dynamics of health caresystems in Europe.
The aim of the HiT initiative is to provide relevant comparative informa-tion to support policy-makers and analysts in the development of health caresystems and reforms in the countries of Europe and beyond. The HiT profilesare building blocks that can be used to:
• learn in detail about different approaches to the financing, organization anddelivery of health care services;
• describe accurately the process and content of health care reformprogrammes and their implementation;
• highlight common challenges and areas that require more in-depth analysis;• provide a tool for the dissemination of information on health systems and
the exchange of experiences of reform strategies between policy-makersand analysts in the different countries of the European Region.
The HiT profiles are produced by country experts in collaboration with theresearch directors and staff of the European Observatory on Health CareSystems. In order to maximize comparability between countries, a standardtemplate and questionnaire have been used. These provide detailed guidelines

VI
United Kingdom
European Observatory on Health Care Systems
and specific questions, definitions and examples to assist in the process ofdeveloping a HiT. Quantitative data on health services are based on a numberof different sources in particular the WHO Regional Office for Europe healthfor all database, Organisation for Economic Coordination and Development(OECD) health data and the World Bank.
Compiling the HiT profiles poses a number of methodological problems. Inmany countries, there is relatively little information available on the healthcare system and the impact of reforms. Most of the information in the HiTs isbased on material submitted by individual experts in the respective countries,which is externally reviewed by experts in the field. Nonetheless, somestatements and judgements may be coloured by personal interpretation. Inaddition, the absence of a single agreed terminology to cover the wide diversityof systems in the European Region means that variations in understanding andinterpretation may occur. A set of common definitions has been developed inan attempt to overcome this, but some discrepancies may persist. These problemsare inherent in any attempt to study health care systems on a comparative basis.
The HiT profiles provide a source of descriptive, up-to-date and comparativeinformation on health care systems, which it is hoped will enable policy-makersto learn from key experiences relevant to their own national situation. Theyalso constitute a comprehensive information source on which to base more in-depth comparative analysis of reforms. This series is an ongoing initiative. It isbeing extended to cover all the countries of Europe and material will be updatedat regular intervals, allowing reforms to be monitored in the longer term. HiTsare also available on the Observatory’s website at http://www.observatory.dk.

VII
United Kingdom
Health Care Systems in Transition
Acknowledgements
The HiT on the United Kingdom was written by Professor Ray Robinson(LSE Health) in collaboration with Anna Dixon (European Observatoryon Health Care Systems). The Research Director for the United Kingdom
HiT was Elias Mossialos.
The European Observatory on Health Care Systems is grateful to ProfessorChris Ham (Birmingham University) and Professor Julian Le Grand (LondonSchool of Economics and Political Sciences) for reviewing the report. Also toGiovanni Fattore (Luigi Bocconi University, Milan) for earlier work on thereport and to Sean Boyle (Department of Operational Research) and ProfessorWalter Holland (Visiting Professor LSE Health) for their advice on particularsections of the report.
The current series of the Health Care Systems in Transition profiles hasbeen prepared by the research directors and staff of the European Observatoryon Health Care Systems. The European Observatory on Health Care Systemsis a partnership between the WHO Regional Office for Europe, the Governmentof Norway, the Government of Spain, the European Investment Bank, the WorldBank, the London School of Economics and Political Science, and the LondonSchool of Hygiene & Tropical Medicine.
The Observatory team working on the HiT profiles is led by Josep Figueras,Head of the Secretariat and the research directors Martin McKee, EliasMossialos and Richard Saltman. Technical coordination is by Suszy Lessof.Administrative support, design and production of the HiTs has been under-taken by a team led by Phyllis Dahl and comprising Myriam Andersen, SueGammerman and Anna Maresso. Special thanks are extended to the WHORegional Office for Europe health for all database from which data on healthservices were extracted; to the OECD for the data on health services in westernEurope, and to the World Bank for the data on health expenditure in centraland eastern European (CEE) countries. Thanks are also due to national statisticaloffices which have provided national data.
1
United Kingdom
Health Care Systems in Transition
Introduction andhistorical background
Introductory overview
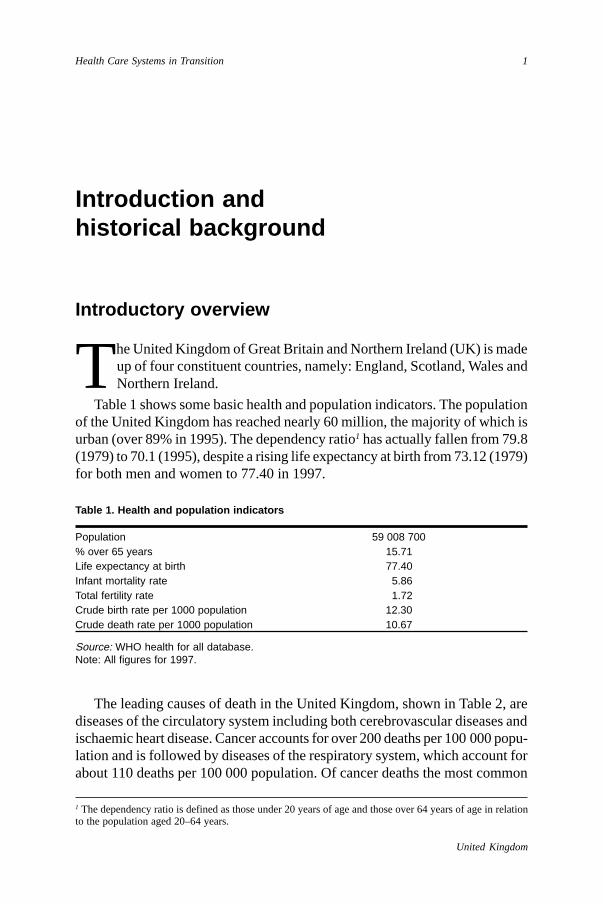
The United Kingdom of Great Britain and Northern Ireland (UK) is madeup of four constituent countries, namely: England, Scotland, Wales andNorthern Ireland.
Table 1 shows some basic health and population indicators. The populationof the United Kingdom has reached nearly 60 million, the majority of which isurban (over 89% in 1995). The dependency ratio1 has actually fallen from 79.8(1979) to 70.1 (1995), despite a rising life expectancy at birth from 73.12 (1979)for both men and women to 77.40 in 1997.
Table 1. Health and population indicators
Population 59 008 700% over 65 years 15.71Life expectancy at birth 77.40Infant mortality rate 5.86Total fertility rate 1.72Crude birth rate per 1000 population 12.30Crude death rate per 1000 population 10.67
Source: WHO health for all database.Note: All figures for 1997.
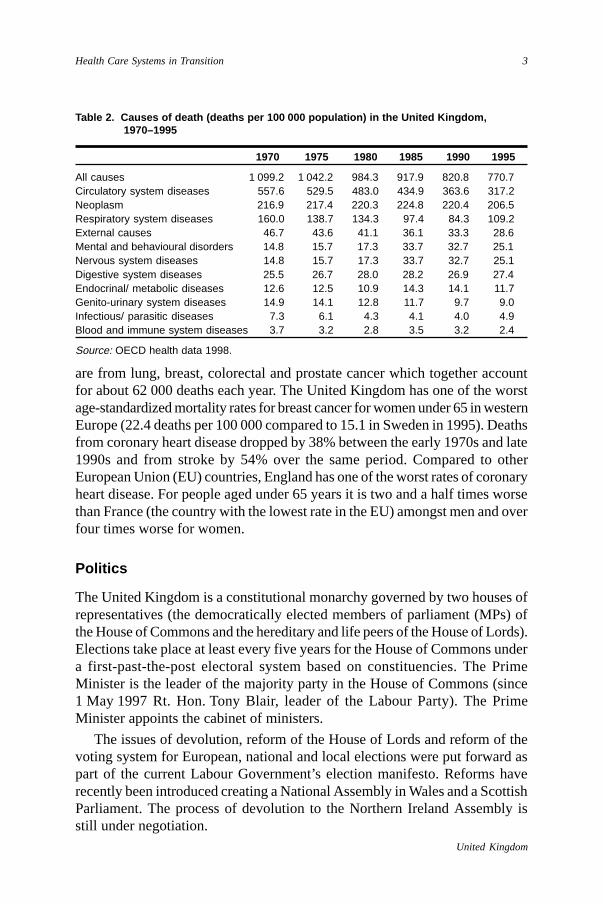
The leading causes of death in the United Kingdom, shown in Table 2, arediseases of the circulatory system including both cerebrovascular diseases andischaemic heart disease. Cancer accounts for over 200 deaths per 100 000 popu-lation and is followed by diseases of the respiratory system, which account forabout 110 deaths per 100 000 population. Of cancer deaths the most common
1 The dependency ratio is defined as those under 20 years of age and those over 64 years of age in relationto the population aged 20–64 years.

2
United Kingdom
European Observatory on Health Care Systems
NorthAtlanticOcean
IrishSea
CelticSea
English Channel
NorthSea
The islandof Rockallnot shown
ShetlandIslands
Voe
OrkneyIslands
0 75 1 50 km0 75 1 50 m i
Hebrides
G lasgow
G range-m ou th
E dinbu rg h
N e w cas tleupon Tyne
M idd lesb rough
K ingstonupon H u ll
M ancheste r
England
Isleof
Man(UK)
Liverpoo l
Londonderry
B elfastNorthernIreland
Wales
C a rd iffB ris to l
B irm ingham
D o ver
LO N D O N
IRELAND
FRANCE
Guernsey (UK)
Jersey (UK)
Scotland
2 The maps presented in this document do not imply the expression of any opinion whatsoever on the partof the Secretariat of the European Observatory on Health Care Systems or its partners concerning the legalstatus of any country, territory, city or area or of its authorities or concerning the delimitations of its frontiersor boundaries.
Fig. 1. Map of the United Kingdom 2
3
United Kingdom
Health Care Systems in Transition
are from lung, breast, colorectal and prostate cancer which together accountfor about 62 000 deaths each year. The United Kingdom has one of the worstage-standardized mortality rates for breast cancer for women under 65 in westernEurope (22.4 deaths per 100 000 compared to 15.1 in Sweden in 1995). Deathsfrom coronary heart disease dropped by 38% between the early 1970s and late1990s and from stroke by 54% over the same period. Compared to otherEuropean Union (EU) countries, England has one of the worst rates of coronaryheart disease. For people aged under 65 years it is two and a half times worsethan France (the country with the lowest rate in the EU) amongst men and overfour times worse for women.
Politics
The United Kingdom is a constitutional monarchy governed by two houses ofrepresentatives (the democratically elected members of parliament (MPs) ofthe House of Commons and the hereditary and life peers of the House of Lords).Elections take place at least every five years for the House of Commons undera first-past-the-post electoral system based on constituencies. The PrimeMinister is the leader of the majority party in the House of Commons (since1 May 1997 Rt. Hon. Tony Blair, leader of the Labour Party). The PrimeMinister appoints the cabinet of ministers.
The issues of devolution, reform of the House of Lords and reform of thevoting system for European, national and local elections were put forward aspart of the current Labour Government’s election manifesto. Reforms haverecently been introduced creating a National Assembly in Wales and a ScottishParliament. The process of devolution to the Northern Ireland Assembly isstill under negotiation.
Table 2. Causes of death (deaths per 100 000 population) in the United Kingdom, 1970–1995
1970 1975 1980 1985 1990 1995
All causes 1 099.2 1 042.2 984.3 917.9 820.8 770.7Circulatory system diseases 557.6 529.5 483.0 434.9 363.6 317.2Neoplasm 216.9 217.4 220.3 224.8 220.4 206.5Respiratory system diseases 160.0 138.7 134.3 97.4 84.3 109.2External causes 46.7 43.6 41.1 36.1 33.3 28.6Mental and behavioural disorders 14.8 15.7 17.3 33.7 32.7 25.1Nervous system diseases 14.8 15.7 17.3 33.7 32.7 25.1Digestive system diseases 25.5 26.7 28.0 28.2 26.9 27.4Endocrinal/ metabolic diseases 12.6 12.5 10.9 14.3 14.1 11.7Genito-urinary system diseases 14.9 14.1 12.8 11.7 9.7 9.0Infectious/ parasitic diseases 7.3 6.1 4.3 4.1 4.0 4.9Blood and immune system diseases 3.7 3.2 2.8 3.5 3.2 2.4
Source: OECD health data 1998.
4
United Kingdom
European Observatory on Health Care Systems
Until May 1999 Scotland and Wales were governed centrally throughWestminster. All their ‘national’ affairs were overseen by the Secretary of Statefor Scotland and the Scottish Office in Scotland and London, and similarly theSecretary of State for Wales and the Welsh Office in Wales and London. Withthe establishment of the Scottish Parliament and Welsh Assembly the respon-sibility for health, education, agriculture and industry will be devolved.Currently the National Health Service (NHS) in Scotland is administered bythe Department of Health in the Scottish Office, the NHS in Wales through theWelsh Office and in Northern Ireland there is a joint Department of Health andSocial Services which runs the Health and Personal Social Services (HPSS).See Appendix I for details of the main differences in the structure of healthcare administration in each of the constituent parts of the United Kingdom.The United Kingdom has been a member of the European Union since 1972.Members of the European Parliament (MEPs) were elected on the basis of aproportional system with party lists for the first time in 1999.
In England the system of local government is made up of directly electedrepresentatives of county and city councils (39 and 7 respectively). NorthernIreland is made up of 26 districts. Scotland is made up of 9 regions and threeisland areas: Orkney, Shetland and the Western Isles. Wales is made up ofeight counties. There remain a number of dependent territories: including Ber-muda, the Falkland Islands, Gibraltar, Guernsey, Jersey, Isle of Man, Montserrat,and South Georgia. Hong Kong returned to Chinese rule on 1 July 1997.
Economy
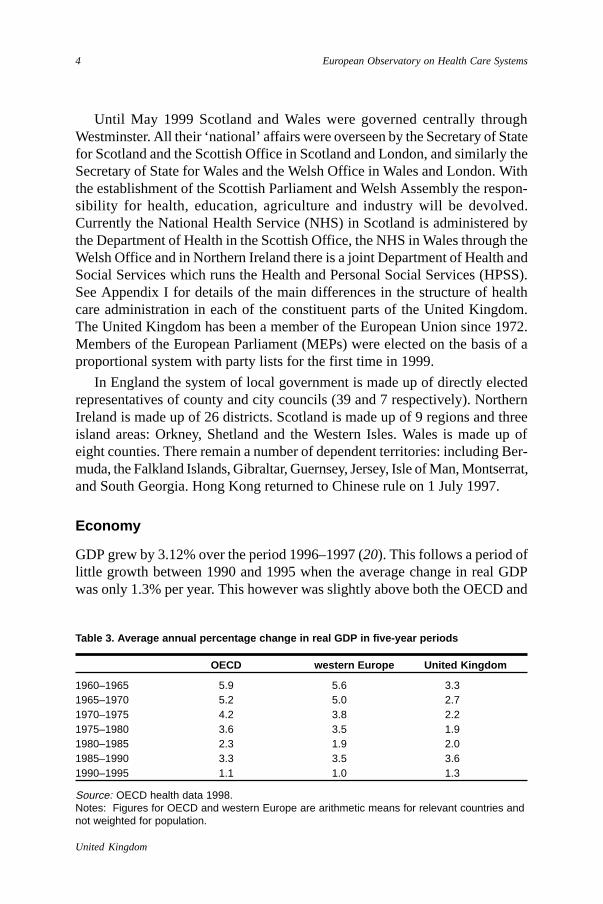
GDP grew by 3.12% over the period 1996–1997 (20). This follows a period oflittle growth between 1990 and 1995 when the average change in real GDPwas only 1.3% per year. This however was slightly above both the OECD and
Table 3. Average annual percentage change in real GDP in five-year periods
OECD western Europe United Kingdom
1960–1965 5.9 5.6 3.31965–1970 5.2 5.0 2.71970–1975 4.2 3.8 2.21975–1980 3.6 3.5 1.91980–1985 2.3 1.9 2.01985–1990 3.3 3.5 3.61990–1995 1.1 1.0 1.3
Source: OECD health data 1998.Notes: Figures for OECD and western Europe are arithmetic means for relevant countries andnot weighted for population.

5
United Kingdom
Health Care Systems in Transition
western European average (see Table 3). The United Kingdom had a grosspublic debt of 60.5% GDP in 1997. There is currently debate about whetherand when the United Kingdom should participate in European Monetary Union,which began on 1 January 1999.
The total labour force is 49.3% of the population, of which 62.8% work inthe service industries, 25% in manufacturing and construction, 9.1% ingovernment employment (includes all NHS employees), 1.9% in energy andonly 1.2% in agriculture. Agriculture is intensive and highly mechanized andproduces about 60% of food needs. Primary energy production accounts forabout 12% of GDP. Services, especially financial services, account for thelargest proportion of GDP.
Historical background
Health services
The discussion in this section traces some of the main developments in the UKNational Health Service (NHS) over the last fifty years with particular emphasison those features that remain relevant for understanding the nature of the servicetoday.3
The National Health Service (NHS) came into operation in 1948 followingthe provisions of the NHS Act of 1946. This Act was of crucial importance inestablishing the post-Second World War pattern of health service finance andprovision in the United Kingdom. It introduced the principle of collectiveresponsibility by the state for a comprehensive health service, which was to beavailable to the entire population free at the point of use. Freedom from usercharges was a key feature of this approach which placed heavy emphasis onequality of access.
The political consensus for establishing the NHS was built during the warand was in tune with other welfare state initiatives in areas such as socialsecurity, education and housing, which were being developed at this time.However not every group subscribed fully to this consensus. Most notably, themedical profession was initially opposed to some of the proposed features ofthe newly established NHS. The Royal Colleges – the professional bodies thatrepresent different medical specialties led by consultants (senior specialists) –
3 Most of the discussion in this report refers to health services in England. The organization and manage-ment of the health services in Scotland, Wales and Northern Ireland is similar to the English system, butsome important differences apply. Appendix I outlines some of the major differences.

6
United Kingdom
European Observatory on Health Care Systems
and general practitioners (GPs) were strongly opposed to any loss of professionalautonomy. They wanted independence from bureaucratic interference and wereespecially concerned about proposals that would have placed the health serv-ice under local government control. In the event, skilful negotiation by theMinister of Health, Aneurin Bevan, obtained the support of the medical pro-fession for the establishment of a central government-run NHS with a numberof concessions to demands for professional autonomy. Thus GPs were allowedto operate as independent contractors within the NHS while hospital specialists,although salaried employees of the NHS, were allowed to retain a large degreeof control over their conditions of employment. They were also permitted toretain the right to private practice alongside their NHS work. These conditionsof service remain largely unchanged today.
One of the assumptions behind the establishment of the NHS was that therewas a “backlog” or “stock” of ill health that would be made good by the newservice, after such time demand would level off or fall. In the event, of course,this did not happen and demand in the 1950s outstripped the funding that wasmade available. One consequence of limited funding was extreme pressure onan under-resourced hospital service. Recognition of this problem led to the1962 Hospital Plan which proposed major new capital funding over the nextten years and introduced the concept of the district general hospital (DGH).The DGH represented a planned approach to hospital provision whereby a unitof between 600 and 800 beds would cater for all the general medical needs ofa population of between 100 000 and 150 000. This pattern of hospital provisionhas persisted until the present day and is one reason why a number of commen-tators said that the NHS internal market – introduced by the reforms of 1991 –would be characterized by a series of local monopolies.
Organizational structure
Some of the main elements of the present day organizational structure of theNHS can be traced back to the major changes that were introduced through theNHS Act of 1973.
This Act introduced a new hierarchical command and control system. Atthe apex there was the Ministry of Health headed by the Minister of Health.Below the Ministry there were regional health authorities (RHAs) with broadplanning responsibilities. Beneath the RHAs there were 90 area healthauthorities that were, in turn, divided into districts administered by a districtmanagement team. These were all introduced in 1974 under the provisions ofthe 1973 Act. It was the district that generally had responsibility for the operationof the district general hospital.

7
United Kingdom
Health Care Systems in Transition
This new system had barely been introduced, however, when major problemsstarted to emerge. Some of the most important of these were beyond the controlof the health service. For example, the sustained expansion of welfare stateexpenditures in most advanced industrial countries was interrupted in the mid-1970s as sharp increases in oil prices and worldwide economic recession led tocalls to cut back public expenditures. This led to increased pressures on NHSbudgets. At the same time, however, it was becoming clear that the new systemwas cumbersome with its multiple tiers of administration, slow in makingdecisions and costly to administer. As a result, the Merrison Royal Commissionwas set up in 1976 to consider the best use and management of resources in theNHS. The Commission reported in 1979 and recommended that, inter alia, asingle tier of health authorities should be established to take over the func-tions of areas and districts. Following these recommendations, 192 districthealth authorities (DHAs) were created in 1982. Despite variations in theirnumber, size and functions, DHAs (now simply referred to as ‘health authori-ties’) remain important units in the administration of the NHS today.
Another important development during the 1970s dealt with the equity ofresource allocation between different regions of the country. Until the 1970sannual resource allocations were based largely on past allocations with someminor adjustments for particular circumstances. This resulted in some majorinequities between different regions. To address this problem a Resource Allo-cation Working Party (RAWP) was set up in 1975 with the task of developinga formula for allocating resources on a more equitable basis. The WorkingParty reported in 1976 and recommended a formula for allocating fundingbetween different regions based upon their respective health ‘needs’. Theseneeds were measured in terms of the region’s population size, age and sexcomposition, and its levels of morbidity. The RAWP formula was adopted and,although subject to several subsequent modifications, the principle of weightedcapitation payments based upon population health needs has remained an im-portant basis for resource allocation within the NHS.
Yet another important development in the history of the NHS occurred in1979 when the government of Margaret Thatcher was elected with itscommitment to a programme of radical economic and social reform. Thisgovernment saw public expenditure and state involvement as the source ofBritain’s economic difficulties and embarked upon a major programme ofprivatization.
Although early policy on privatization in relation to the NHS was restrictedmainly to contracting-out of ancillary services (i.e. laundry, catering and clean-ing), the government’s belief in the superior efficiency of private sector practiceled to major changes in management arrangements. An inquiry into the

8
United Kingdom
European Observatory on Health Care Systems
management of the NHS was set up in 1983 under the chairmanship of Sir RoyGriffiths, a managing director of a chain of supermarkets. Adopting privatesector business principles, the Griffiths Inquiry reporting in 1993 recommendeda move away from the old-style ‘consensus’ management towards a system of‘general’ management with general managers at the unit, district and regionallevels. New boards, responsible for policy and strategic planning on the onehand and operational management on the other, were also established at thecentre. This system, based upon local management decision-making and a clearline of accountability from the top to the bottom of the NHS, was designed toreplace the previous system, which was based largely on administration withina bureaucratic hierarchy. General management was an important precursor ofmore dramatic market-based reforms which were to follow.
Despite the Griffiths’ reforms and the government’s strong belief in thesuperior efficiency of the private sector, the NHS was not fundamentally affectedby major organizational change for most of the 1980s. It is possible that thegovernment was wary about extending its radical programme to a sector whichsuccessive opinion polls continued to show enjoyed deep and widespreadsupport. However, following intense debate about inadequate spending on theNHS – which took place towards the end of 1987 – Mrs Thatcher announcedan internal review of the NHS under her own chairmanship. This review andits recommendations led to the reforms embodied in the NHS and CommunityCare Act 1990 which were implemented on 1 April 1991. These reforms intro-duced an ‘internal’ or ‘quasi’ market to the NHS and represented the greatestchange to its organization and management in its entire history.
The internal market separated the responsibility for purchasing (or com-missioning) services from the responsibility for providing them. The mainpurchaser function was assigned to the health authorities (supplementedincreasingly by general practice fundholders) while the provision of serviceswas made the responsibility of NHS trusts. Trusts were expected to competewith each other for service contracts from purchasers.
The internal market, albeit with numerous modifications and restrictions,was used as the primary mechanism for the allocation of health care resourcesthroughout much of the 1990s.
With the election of a Labour Government in 1997, however, prioritieschanged. Their plans for the NHS were set out in the White Paper, The newNHS: modern, dependable, published in December 1997. The approach pre-sented in this White Paper and several subsequent documents, including thecurrent NHS Bill, is designed to replace emphasis on market-based processeswith far more emphasis on planning, collaboration and partnership-working.

9
United Kingdom
Health Care Systems in Transition
The main features of the 1991 reforms, and the ways in which current proposalsindicate that they will be modified, will be analysed extensively in subsequentsections of this report.
Primary care services
Before moving on to consider these recent developments, however, it is worthhighlighting another trend which has taken place since the 1980s, namely, theincreased emphasis placed upon primary care. Although the United Kingdomhas a well-developed system of primary care compared with most othercountries, this sector received little attention from policy-makers in comparisonwith the acute sector until the mid-1980s. The independent contractor status ofgeneral practitioners (GPs), established back in 1948, meant that services haddeveloped piecemeal and coordination with hospital-based community healthservices was poor. Following an extended period of discussion and consulta-tion in the second half of the 1980s, major changes were implemented throughthe introduction of a new GP contract in 1990. Through this contract, GPsbecame more accountable to family health service authorities (FHSAs), theprimary care counterparts of district health authorities. DHAs and FHSAs wereactually merged in 1996. Among other things, GPs were required to produceannual reports, contain pharmaceutical prescriptions within indicative budg-ets, and meet targets for various health screening and preventative services. Atthe same time, payments systems were changed to offer incentives for im-proved performance and to make them more responsive to patients’ needs.
Following closely on the heels of this change, GP fundholding was intro-duced through the NHS and Community Care Act 1990. From an early experi-mental status, primary care-based purchasing became a central element of theNHS during the 1990s. Not only did fundholding expand dramatically in termsof the number of GPs involved but also several variants of the scheme wereintroduced. Probably the most ambitious of these variants was the totalpurchasing pilot scheme introduced in 1995. Through this scheme, selectedgroups of practices were allocated budgets with which they could purchasepotentially all of the secondary and community health services received bytheir patients. While the new Labour Government has abolished GP fund-holding – on the grounds of inequity and unacceptably high transaction costs –it has retained an emphasis on the ‘primary care-led NHS’. Since April 1999all GPs have been required to join a primary care group: these are larger area-based groupings of GPs that have responsibilities for commissioning as wellas primary care provision. (Primary care groups are discussed further in thesections on Organizational structure and management and Health care reforms.)
10
United Kingdom
European Observatory on Health Care Systems
Public health services
Public health medicine has a long history in the United Kingdom. Its originscan be traced back to the middle of the nineteenth century when the main Actsof Parliament concerning public health issues were passed. A total of 17 piecesof legislation were passed between 1848 and 1890, of which six affected thedelivery of public health services through administrative and structural changes.It was, however, the Public Health Act of 1875 which represented landmarklegislation. This consolidated previous legislation, giving a clear account ofthe powers and responsibilities of local sanitary authorities. It laid the founda-tions for modern public health (no changes were made for more than 60 years).
Many successes were achieved by the turn of the century including im-provements to water supply and sewerage, street cleaning, working and livingenvironments and personal hygiene. The strong legislative framework com-bined with the growing power and effectiveness of local Medical Officers ofHealth made a crucial contribution to these improvements.
Having played a significant role in the organization of health services duringthe Second World War, Medical Officers of Health assumed that the develop-ment of a National Health Service would be part of local government with anexpansion of services provided by local authorities. However, the strength ofpolitical opposition by the British Medical Association, the Royal Collegesand the voluntary hospitals to local government control meant that the role ofpublic health and Medical Officers in the NHS was minimal.
During the reorganization of public health into community medicine andwith the establishment of regional, area and district health authorities in 1974,the position of Medical Officer of Health was abolished. It was not until the1980s that there was renewed discussion about the role of public health doc-tors. Possibly the most significant document to influence the future directionof public health services was the Acheson Report.
In 1986 the then Secretary of State set up an inquiry team under the chair-manship of the Chief Medical Officer, Sir Donald Acheson, to consider thefuture of the public health function. Published in 1988, the report identifiedfive main problems: lack of information about the health of the population;lack of emphasis on health promotion and disease prevention; confusion aboutthe roles and responsibilities of public health doctors; confusion about theresponsibility for communicable disease control; and lack of information aboutoutcomes on which to make informed choices.
Following the enactment of the NHS and Community Care Act 1990 a newopportunity for public health arose. The Health of the Nation report publishedin July 1992 aimed to shift the focus from the delivery of clinical services to

11
United Kingdom
Health Care Systems in Transition
health. It encouraged health authorities to take on a more strategic role, namelythat of maintaining and improving the health of the local population.
The most recent initiative in the public health area has been the publicationof the present government White Paper Saving Lives: Our Healthier Nation inJuly 1999. The White Paper builds on the earlier Green Paper Our HealthierNation and sets out the government’s future strategy for public health policy.
The present organization and development of public health services aredescribed in the section on Primary health care and public health services.

12
United Kingdom
European Observatory on Health Care Systems

13
United Kingdom
Health Care Systems in Transition
Organizational structure andmanagement
Organizational structure of the health system
The structure of the UK health system is currently undergoing majororganizational change following the election of a Labour Governmentin May 1997. Their plans for the NHS were set out originally in a White
Paper, The new NHS: modern, dependable, published in December 1997. TheHealth Act 1999, which gives a legislative basis to many of the changes set outin the White Paper, received royal assent on 30 June 1999. In addition numerousexecutive letters and guidance notes setting out the details of the government’splans have been issued. These plans are intended to build on some of thesuccesses of the previous Conservative Government’s reform programme butto replace certain important elements of it. In the following account the exist-ing system is described together with the main changes either implementedalready, in the process of implementation or planned for the future.4
The Department of Health
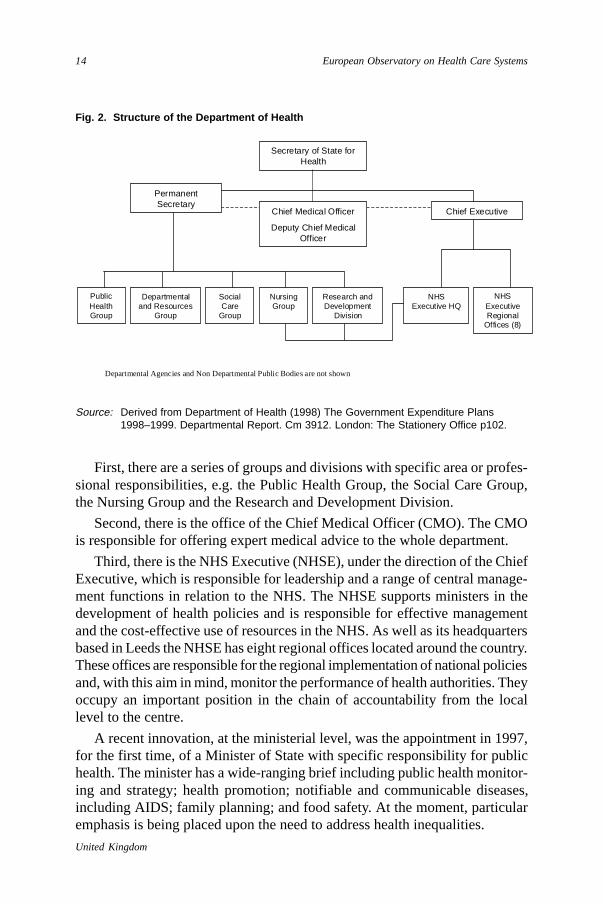
The Department of Health (DoH) under the direction of the Secretary of Statefor Health, together with his team of five ministerial colleagues, is responsiblefor health and personal social services in England. Separate responsibilitiesare held by the Secretaries of State for Scotland, Wales and Northern Ireland.In England the Department sets overall health policy, including policies onpublic health and those relating to the health consequences of environmentaland food matters. It is also has overall responsibility for the NHS. Fig. 2 indicatesthe structure of the Department. As the figure shows, it has three main branches.
4 Most of the discussion in this report refers to health services in England. These account for about 80% oftotal United Kingdom public expenditure on health and personal social services. The remainder is spent inScotland (11%), Wales (6%) and Northern Ireland (3%). The organization and management of the healthservice in these countries is similar to the English system, but some important differences apply. AppendixI outlines some of the major differences.
14
United Kingdom
European Observatory on Health Care Systems
Fig. 2. Structure of the Department of Health
Source: Derived from Department of Health (1998) The Government Expenditure Plans1998–1999. Departmental Report. Cm 3912. London: The Stationery Office p102.
First, there are a series of groups and divisions with specific area or profes-sional responsibilities, e.g. the Public Health Group, the Social Care Group,the Nursing Group and the Research and Development Division.
Second, there is the office of the Chief Medical Officer (CMO). The CMOis responsible for offering expert medical advice to the whole department.
Third, there is the NHS Executive (NHSE), under the direction of the ChiefExecutive, which is responsible for leadership and a range of central manage-ment functions in relation to the NHS. The NHSE supports ministers in thedevelopment of health policies and is responsible for effective managementand the cost-effective use of resources in the NHS. As well as its headquartersbased in Leeds the NHSE has eight regional offices located around the country.These offices are responsible for the regional implementation of national policiesand, with this aim in mind, monitor the performance of health authorities. Theyoccupy an important position in the chain of accountability from the locallevel to the centre.
A recent innovation, at the ministerial level, was the appointment in 1997,for the first time, of a Minister of State with specific responsibility for publichealth. The minister has a wide-ranging brief including public health monitor-ing and strategy; health promotion; notifiable and communicable diseases,including AIDS; family planning; and food safety. At the moment, particularemphasis is being placed upon the need to address health inequalities.
Secretary of State forHealth
NHSExecutiveRegional
Offices (8)
NHSExecutive HQ
SocialCare
Group
Departmentaland Resources
Group
PublicHealthGroup
PermanentSecretary
Chief Medical Officer
Deputy Chief MedicalOfficer
NursingGroup
Research andDevelopment
Division
Chief Executive
Departmental Agencies and Non Departmental Public Bodies are not shown
15
United Kingdom
Health Care Systems in Transition
Another innovation of some importance was the establishment of a divisionwithin the Department of Health with specific responsibility for leading aprogramme of research and development geared to policy questions of directrelevance to the NHS. The first director of this division was appointed in 1991and a strategy designed to make NHS decision-making research-based waslaunched. Since then, a national research and development programme, togetherwith a series of regional programmes, has played a major role in commissioningand funding research related to the needs of the NHS.
Other ministries
The present Labour Government places considerable emphasis on the co-ordination of policy across ministries (the term ‘joined-up government’ hasbeen coined). This approach highlights the role of other ministries withresponsibilities for health and health-related matters. These include:
• The Department of Social Security which has responsibility for socialwelfare payments (e.g. income support, invalidity and disability benefits);
• The Department of the Environment, Transport and the Regions whichhas responsibility for personal social services administered through localgovernment authorities;
• The Ministry of Agriculture, Food and Fisheries which currently hasresponsibility for food standards (this may change if the Food StandardsBill introduced in parliament in June 1999 is passed into law); and
• The Department for Education and Employment which funds the trainingof medical students and other health professionals.
The National Health Service
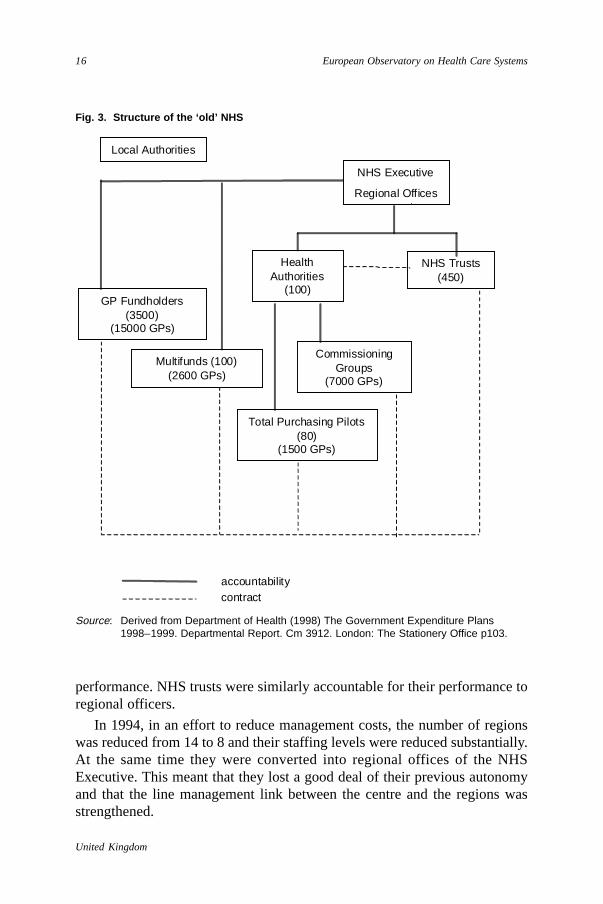
The organizational structure of the NHS as it existed following the 1991 reformsand prior to the current reform plans is shown in Fig. 3. Within this structure,there are four main organizations; namely, regional health authorities, districthealth authorities, general practice fundholders (GPFHs) and NHS trusts.
Regional health authorities (RHAs)
At the time of the 1991 reforms, and in the period immediately following them,there were 14 RHAs in England. These regions carried out a range of monitoringand performance management roles on behalf of the NHS Executive. As partof this function, each district health authority (see below) had a contract withthe regional office specifying the tasks it was expected to carry out over thenext year and it was held to account to the regional office for its actual
16
United Kingdom
European Observatory on Health Care Systems
Fig. 3. Structure of the ‘old’ NHS
NHS Executive
Regional Offices
HealthAuthorities
(100)
NHS Trusts(450)
Local Authorities
GP Fundholders(3500)
(15000 GPs)
Total Purchasing Pilots(80)
(1500 GPs)
Multifunds (100)(2600 GPs)
CommissioningGroups
(7000 GPs)
accountabilitycontract
Source: Derived from Department of Health (1998) The Government Expenditure Plans1998–1999. Departmental Report. Cm 3912. London: The Stationery Office p103.
performance. NHS trusts were similarly accountable for their performance toregional officers.
In 1994, in an effort to reduce management costs, the number of regionswas reduced from 14 to 8 and their staffing levels were reduced substantially.At the same time they were converted into regional offices of the NHSExecutive. This meant that they lost a good deal of their previous autonomyand that the line management link between the centre and the regions wasstrengthened.
17
United Kingdom
Health Care Systems in Transition
District health authorities (DHAs)
As was pointed out in the previous section, under the terms of the NHS andCommunity Care Act 1990, responsibility for purchasing or commissioninghealth services in the NHS was separated from the responsibility for providingthem in 1991. This arrangement was dubbed an ‘internal’ or ‘quasi’ market.Within this system, the main purchasing function was allocated to district healthauthorities (DHAs).
DHAs were corporate bodies operating under the general direction of achairperson, appointed by the Secretary of State, and a board comprisingexecutive and nonexecutive directors. In 1991 there were just under 200 DHAscatering for resident populations of, on average, 250 000 people, although theactual size range extended from 100 000 to 800 000. Each DHA was requiredto assess the health care needs of its population and, from its weighted capitation-based budget, commission a range of services from providers to meet theseneeds. Each DHA had a department of public health responsible for carryingout needs assessment. A contract system was introduced to formalize the linkbetween purchasers and providers.
Over time, a series of mergers took place between DHAs with the aim ofrealizing economies of scale. By 1998 the number of DHAs had fallen to 100,the figure shown in Fig. 3. With the conversion of RHAs to regional offices ofthe NHS Executive, there is now only one tier of health authority and so DHAsare referred to simply as ‘health authorities‘.
Family health service authorities (FHSAs)
Within the NHS, there has been a long-standing distinction between primarycare (delivered by general practitioners and associated staff) and hospitalservices. From 1991, DHAs were responsible for hospital services while primarycare was the responsibility of family health service authorities (FHSAs).However, as part of the effort to coordinate primary and secondary careeffectively, DHAs and FHSAs were merged into single authorities from 1996.
General practice fundholders and other primary care-basedpurchasers
At the same time as DHAs were allocated a purchasing function in 1991, 294 GPfundholding schemes (GPFHs) were introduced. These were selected GPpractices which were allocated budgets with which they could purchase directlya range of diagnostic and elective procedures on behalf of the patients registeredwith them. (The bulk of services for these patients were still, however, purchased

18
United Kingdom
European Observatory on Health Care Systems
by the DHA). At the beginning, GP fundholding was very much an experimentalscheme, but the number of practices covered by the scheme grew rapidly eachyear. As Fig. 3 shows, by 1998 there were 3500 GPFHs.
As fundholding grew in scale, and the commitment of the ConservativeGovernment grew towards primary care-based commissioning, several variantsof fundholding emerged. Some fundholders sought to economize on manage-ment costs by combining into multi-practice consortia: Fig. 3 shows that therewere 100 of these ‘multi-funds’ in 1998.
Even more radically, in 1995, the government approved the establishmentof 53 total purchasing pilot sites (TPPs). These were single or multi-practiceGP sites, covering populations of between 12 000 and 80 000 people, that weregiven the opportunity to purchase potentially all of the hospital and communityhealth services for the patients registered with them. With the introduction of asecond wave of TPPs in the following year, there were 80 TPP sites nation-wide by 1998 (see (18) for an account of models of purchasing developed inthe United Kingdom over the 1990s).
GP commissioning groups
Despite the formidable growth of GPFHs, multi-funds and TPPs, many GPsremained unhappy with the fundholding experiment. For some there wereideological objections; for others, the practicalities were unattractive. As a re-sult of these reservations, a number of GPs chose to form ‘Commissioning Groups’.These were non-fundholding collectives of GPs who worked with their local DHAsin an effort to jointly determine purchasing priorities and strategies. As Fig. 3shows, approximately 7000 GPs belonged to such groups in 1998 comparedwith just over 19 000 GPs associated with fundholding models of purchasing.
NHS trusts
Turning to the supply-side of the internal market, providers of services weregiven greater freedom and autonomy through the creation of NHS trusts. Thesetrusts were within the NHS and run by a board of directors comprising executiveand nonexecutive members. Trusts were expected to compete for contractsfrom DHAs and GPs for the provision of clinical services. By 1998, all acutehospitals, community health service providers and ambulance services hadacquired trust status.
Decentralization and regulation in the internal market
The 1991 reforms and subsequent measures were designed to increaseefficiency, quality and choice through the creation of decentralized, market-
19
United Kingdom
Health Care Systems in Transition
type mechanisms. They represented a move away from hierarchical, or verticallyintegrated, forms of organization towards models based on purchaser-providerseparation and contractual relationships. The forms of contractual relation-ships between purchasers and providers are indicated by the dotted lines inFig. 3. The degree of autonomy offered by these arrangements was, however,strictly limited. As pointed out above, both purchasers and providers wereaccountable to the regional offices of the NHS Executive, and these officesoperated a strong performance management system. In addition, the NHSExecutive exerted strong control over DHAs and trusts in terms of planningand service priorities. These issues are discussed more fully in the discussionof regulation below.
The new Labour Government and the new NHS
While in opposition, the Labour Party had been sharply critical of the internalmarket, arguing that it had led to fragmentation, inequality, increased bureau-cracy and lack of accountability. On gaining office its first major policydocument on the NHS, the White Paper The new NHS: modern, dependable,set out Labour’s plans for the future of the service. The stated intention is toreplace competition within the internal market with a system based upon col-laboration and partnership between the different agencies responsible for healthand social care. The main organizational features of this approach are depictedin Fig. 4.
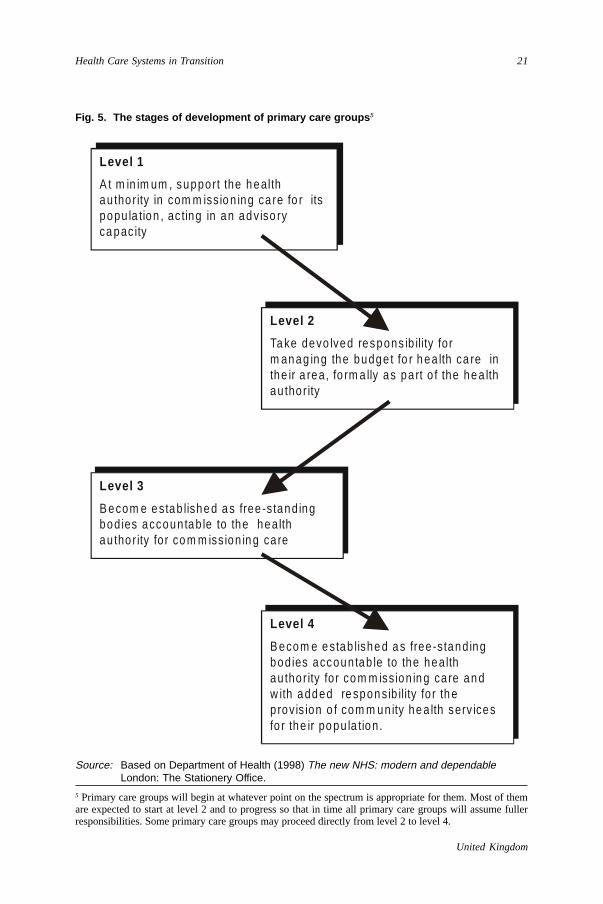
A major change is occurring through the abolition of GP fundholding andits variants, and its replacement with primary care groups (PCGs). PCGs aregroupings around GP practices in a geographical area to which all GPs – bothformer fundholders and non-fundholders – belong. These groups have beenlive since 1 April 1999. They will be far larger than previous primary care-based models, covering populations ranging from 50 000 to 250 000 people. Itis envisaged that PCGs will progress through four developmental stages overtime, culminating in the formation of primary care trusts (see Fig. 5). Thegovernment’s plans also envisage a far greater degree of interagencycollaboration with PCGs working closely with local government social servicesdepartments.
NHS trusts are continuing to be responsible for the provision of services,but their short-term contractual relationships with purchasers are being replacedwith longer-term service agreements. More emphasis is being placed oncollaborative working between commissioners and providers instead of market-type competition.
With the former regional health authorities becoming regional offices ofthe NHS Executive, district health authorities are now simply referred to as

20
United Kingdom
European Observatory on Health Care Systems
Health Authorities
NHSTrusts
LocalAuthorities
Primary CareGroups
Statutory accountability
Service accountability
Health Improvement Programme (HImP)
NHS Executive
Regional Offices
Fig. 4. Structure of the ‘new’ NHS
Source: Derived from Department of Health (1998) The Government Expenditure Plans1998–1999. Departmental Report. Cm 3912. London: The Stationery Office p103.
‘health authorities’. The functions of health authorities are increasingly shiftingtowards strategic planning as PCGs assume greater responsibility forcommissioning services. The HAs are responsible for drawing up plans for‘health improvement programmes’ in their areas in collaboration with PCGs,trusts and local government authorities.
As before, there are lines of accountability from HAs and trusts to the NHSExecutive and to its regional offices. In fact, these lines of accountability to thecentre appear likely to be rather stronger than they were under the previousgovernment. These considerations are discussed further below.
21
United Kingdom
Health Care Systems in Transition
Fig. 5. The stages of development of primary care groups 5
Source: Based on Department of Health (1998) The new NHS: modern and dependableLondon: The Stationery Office.
5 Primary care groups will begin at whatever point on the spectrum is appropriate for them. Most of themare expected to start at level 2 and to progress so that in time all primary care groups will assume fullerresponsibilities. Some primary care groups may proceed directly from level 2 to level 4.
Level 1
A t m in im um , support the H ea lthA u tho rity in co m m iss ion ing ca re fo r itspopu la tion , ac ting in an ad v iso ryca pac ity
Level 1
A t m in im um , support the h ealthau tho r ity in com m iss io n ing ca re fo r itspopu la tion , ac ting in an ad v iso ryca pac ity
Level 2
Ta ke devo lved respons ib ility fo rm anag ing the budge t fo r h ea lthca re inthe ir a rea, fo rm a lly as pa rt o f the H ea lthA u tho rity
Level 2
Ta ke devo lved respons ib ility fo rm anag ing the budge t fo r h ea lth ca re inthe ir a rea, fo rm a lly as pa rt o f the he a lthau tho r ity
Level 3
B ecom e e stab lishe d a s free -s tand ingbod ies accoun tab le to the H ea lthA u tho rity fo r com m iss ion ing ca re
Level 3
B ecom e e stab lishe d a s free -s tand ingbod ies accoun tab le to the hea lthau tho r ity fo r co m m iss ion in g ca re
Level 4
B ecom e e stab lishe d a s free -s tand ingbod ies accoun tab le to the H ea lthA u tho rity fo r com m iss ion ing ca re andw ith added re spon s ib ility fo r th ep rov is ion o f com m un ity he a lth serv icesfo r the ir po pu la tion .
Level 4
B ecom e e stab lishe d a s free -s tand ingbod ies accoun tab le to the hea lthau tho r ity fo r co m m iss ion in g ca re an dw ith added re spon s ib ility fo r th ep rov is ion o f com m un ity he a lth serv icesfo r the ir po pu la tion .

22
United Kingdom
European Observatory on Health Care Systems
Voluntary and consumer groups
There is a plethora of advocacy groups working on behalf of patients in theUnited Kingdom. Many are disease-based advocacy groups, such as those whichpromote the interests of people suffering from AIDS, osteoporosis, diabetes,leukaemia, cancer, etc. Others work on behalf of people with mental illness(MIND) and particular patient groups such as the elderly (Age Concern). Aswell as providing support and information for patients and their families, thesegroups work to improve the care and services provided by the NHS. In addition,the independent Patients Association works to further the interests of patientsin general. Other more formalized mechanisms for public input into the healthcare system are through community health councils, described in more detailbelow, and representatives on primary care group boards.
Community health councilsCommunity health councils (CHCs) were established in 1974. They provide alink between the NHS and the community, separating the management of serviceprovision from the representation of patient and community interests.
There are currently 207 CHCs in England and Wales (16 health councils inScotland and 4 health and social services councils in Northern Ireland thatperform similar functions to CHCs). Each CHC has around 16–30 members;half are local authority nominees; a third are elected by the local voluntarysector; and a sixth appointed by the Secretary of State for Health (or Secretaryof State for Wales for Welsh CHCs). CHCs are funded from a national budgetheld by the NHS Executive, but are independent of the NHS managementstructure, each other and the Association of CHC for England and Wales(ACHCEW).
Health authorities are required to consult formally with CHCs on substantialvariations in service provision, provide information required by the CHC incarrying out its public duties and arrange an annual meeting between theauthority and CHC members.
In the light of the current reforms the future of the CHCs is currently underdiscussion.
Professional bodies
The British Medical Association is both the doctors’ professional organizationand also an independent trade union protecting the professional and personalinterests of its members. Its membership is made up of more than 80% ofBritish doctors. Professional registration and regulation of the medicalprofession is the responsibility of the General Medical Council. Similar

23
United Kingdom
Health Care Systems in Transition
organizations exist for other professions such as the British Dental Association.There are also several trade unions that represent health care workers. Themain unions are UNISON, which represents the interests of people working inthe public services and essential industries, and MSF which represents over60 000 professional, craft, technical, scientific, medical and nursing staff withinthe NHS.
In addition, each of the medical specialties is governed by a Royal College,which is responsible for the assessment and awarding of qualifications in thespecialty and in most cases continuing medical education, the issuing of clinicalguidelines and medical auditing.
Private sector
In 1996 there were 25 private medical insurers offering coverage in the UnitedKingdom. Seven of these were non-profit, provident associations (e.g. BUPA,PPP Healthcare, WPA); the remaining 18 may be described as “commercialinsurers”, although some of them are mutual societies owned by their members(e.g. Norwich Union).
Although the commercial insurers include five relatively long-establishedcompanies who entered the market before 1988, the majority of them enteredduring the late 1980s and early 1990s. With the increased competition fromthese new entrants, the provident associations have experienced a reduction intheir market share in recent years (see Table 4).
On the supply-side, there are approximately 230 independent medical/surgical hospitals in the United Kingdom. Five main groups (General HealthcareGroup Ltd, Nuffield Trust Ltd, BUPA Hospitals Ltd, Community HospitalsGroup and PPP Columbia Healthcare Ltd) dominate the market. These fivegroups account for just over 60% of hospitals and a combined share ofapproximately 65% of total private beds.
Table 4. Market shares (%) of private insurance companies by subscription income
Company Year1985 1990 1995 1996
BUPA 59 50 44 42PPP 25 29 27 27WPA 7 7 5 5Other providents 2 3 4 4Commercials 7 11 20 22Total subscription income (£m) 521 1 105 1 757 1 923
Source: Laing and Buisson (1997) Laing’s Healthcare Market Review 1997–1998,Laing and Buisson, London.

24
United Kingdom
European Observatory on Health Care Systems
Planning, regulation and management
Planning
The NHS can be characterized as a publicly owned and financed health systemwithin which there are strong lines of vertical accountability. Over the 1990ssome of the central command and control features have been loosened asresponsibility for decision-making has been partly devolved to local organi-zations and agencies. Within this context, planning takes a number of differentforms and is undertaken by several different agencies.
Expenditure planningTotal expenditure on the NHS is still tightly controlled from the centre.Expenditure planning, for both capital and recurrent expenditure, takes placeas part of the government’s general public expenditure planning process, throughwhich the level of funding to be made available to the NHS for the followingyear is determined. The Department of Health determines the allocation of thisfunding to regions, and regions determine district allocations (see the sectionson Health care finance and expenditure and Financial resource allocation forfurther discussion of NHS finance, expenditure and resource allocation).
Service planningAlthough there is no detailed national plan for service planning purposes, eachyear the Department of Health issues an executive letter setting out the prioritiesand planning guidance for the NHS. The guidance for 1998–1999, for example,set out the government’s general aims for the coming year, identified specificpressures which it expected the NHS to manage, and identified areas for develop-ment.
The aims covered improving the public’s health, a commitment to fairnessin the health service, developing the quality of services and promoting partner-ship and collaboration. Pressures to be managed included the provision ofprompt and effective emergency care, the maintenance of guarantees andstandards for maximum waiting times, and ensuring financial stability. Specificareas identified for development were: the provision of comprehensive mentalhealth services, the development of a leading role for primary care, improvingclinical and cost effectiveness, giving greater voice and influence to users,meeting the needs for continuing health care and developing NHS organizationsas good employers.
The new Labour Government and planning guidanceIn a departure from previous practice, the new government produced nationalguidance on the priorities for a three-year period – 1999/2000–2001/2002 – in
25
United Kingdom
Health Care Systems in Transition
September 1998 under the heading Modernising Health and Social Services.This document is wider in scope than previous guidance. It sets out a newdirection for the health service based upon tackling the root causes of ill health,breaking down barriers between service providers and placing greater emphasison the quality of services.
The guidance identifies priority areas where the NHS is expected to take alead responsibility and other areas where it is expected to share lead responsi-bility with local government social services departments.
In the case of NHS lead responsibility, the service is expected:
• to reduce waiting lists and waiting times in line with quantitative targets;
• to undertake specific measures to develop primary and community servicesin order to address inequality, improve quality and convenience for patients,and increase efficiency;
• to meet targets for reducing deaths from heart disease by providing highquality, cost-effective and responsive services for the prevention and treat-ment of coronary heart disease;
• to improve the quality, effectiveness and speed of access to cancer servicesin the areas of prevention, screening and palliative care.
Areas where the NHS and local government social service departments areexpected to take lead responsibility and work together are:
• reducing health inequalities by improving the health of the worst-off insociety at a faster rate than the rest of the population (this will includestrategies to reduce unwanted teenage pregnancies, ensure fair access toservices for black and ethnic minority groups, reducing smoking, increasingchildhood immunization rates and reducing drug dependency);
• improving the mental health of the population, and improving the treatmentand care of those with mental health problems, through the provision of acomprehensive set of high quality, effective and responsive services;
• ensuring the provision of services which help adults achieve and sustainmaximum independence in their lives through, inter alia, reducing avoidableadmissions to hospitals, developing preventative services and respite care,and providing additional support to informal carers.
Alongside these plans, the government is developing a national frameworkfor assessing performance in the NHS. This will cover six dimensions ofperformance, namely: health improvement, fair access, effective delivery ofappropriate health care, efficiency, patient/user experience, and health outcomes.It is intended that this framework will underpin accountability agreementsbetween regional offices and health authorities, and between health authoritiesand primary care groups.
26
United Kingdom
European Observatory on Health Care Systems
Planning and public healthSetting priorities for the achievement of specific health improvement targetsin relation to particular diseases and disabilities has its origins in a major publichealth planning exercise undertaken by the previous Conservative Government.The Health of the Nation strategy, launched in 1992, identified five priorityareas for reducing mortality and morbidity – namely, heart disease and stroke;cancers; mental illness; sexual health; and accidents – and set 25 quantifiedtargets for achieving reductions in rates of mortality and morbidity over giventimescales. This was the first time that such a strategic planning approach hadbeen adopted in the United Kingdom.
The present government published its own plans for public health in a GreenPaper, Our Healthier Nation, in February 1998 which was followed by a WhitePaper, Saving Lives: Our Healthier Nation, in July 1999. This expresses acommitment to setting goals for improving population health with moreemphasis placed upon the social and environmental determinants of health andin particular the need to reduce health inequalities. Among other things thiswill involve taking into account the effects of poverty, unemployment, poorhousing and environmental pollution. This strategy is intended to replace theHealth of the Nation strategy and includes revised targets for the four keyareas of cancer, coronary heart disease and stroke, accidents and mental health.
Planning by health authoritiesThe national priorities and planning guidance issued by the NHS Executivesets the context within which health authorities are expected to develop theirown plans. Until recently, these were presented in the form of health strategyand purchasing plans, often extending over planning periods of up to five yearsahead. Under the government’s new approach they are now formulated in termsof service and financial frameworks. These plans are normally prepared by theplanning, finance and public health departments of each HA and need to beapproved by the HA board comprising chair, chief executive and other execu-tive and nonexecutive members. Although these plans usually pay a good dealof attention to local needs, strong accountability to the NHS Executive meansthat strong emphasis tends to be placed upon the achievement of nationalpriorities. These priorities figure prominently in the assessments carried out byregional offices as part of their performance management function.
New responsibilities placed upon health authorities, as part of the newLabour Government’s plans, involve drawing up health improvementprogrammes (HImPs) for their areas. These programmes are expected to bringtogether a range of health and social care agencies, together with other organi-zations, e.g. voluntary organizations and private sector firms, in the productionof plans for improving the health of local people. HImPs are seen as a vehicle

27
United Kingdom
Health Care Systems in Transition
for formulating a local response to national priorities and targets, and of deter-mining local priorities for action. In addition, some areas of extreme deprivationhave been designated health action zones (HAZs). These will receive specialassistance for the development of plans aimed at raising health standards amongdeprived groups.
Planning and NHS trustsDuring the 1990s, NHS trusts have been required to produce business plans.These set out their expectations in terms of income and expenditure and havebeen an important component of the capital planning process. Under the internalmarket arrangements, trusts wishing to undertake major capital investmentshave been required to obtain support – in the form of statements of purchasingintentions – from those HAs who intend to purchase services from them. GPfundholders and other primary care-based purchasers have also been requiredto produce annual purchasing plans.
Regulation
In common with most health care systems, the UK system has long been subjectto a variety of regulatory policies. In this section, some of the long-establishedforms of regulation are discussed briefly. However, most of the discussionconcentrates on new approaches to regulation developed in the 1990s as a partof managing the evolving internal market, and to the systems of regulationbeing developed by the present government as part of its new approach to theNHS.
Regulation of professional standardsOne of the most important areas of regulation applies to the standards expectedof clinical professionals. By and large, this function has traditionally beenperformed through a system of professional self-regulation. Thus the GeneralMedical Council regulates the education, training and professional standardsof doctors while the UK Central Council of Nursing and Midwifery performsa similar function for its members. At the present time, however, a number ofwell-publicized instances of the failure of professional self-regulation to pre-vent serious professional malpractice have led to official proposals and plansfor greater external regulation.
Medical workforce planningThe Medical Workforce Standing Advisory Committee advises the Secretaryof State on developments relating to the overall supply of and demand fordoctors in the United Kingdom. Following the recommendations contained inits 1995 report, the system of workforce planning has been recently overhauled.
28
United Kingdom
European Observatory on Health Care Systems
An advisory group on medical (and dental) education, training and staffing hasbeen created – chaired by the Chief Medical Officer – which is responsible fordeveloping a national strategic policy.
Local medical advisory groups have been set up to advise regional officerson medical staffing aspects of NHS trusts. These groups are designed to ensurethat individual trust policies are consistent with national standards and objec-tives. Trusts are required to include information on medical staffing strategiesin their business plans and, although medical staff are now employed directlyby trusts, the trusts are nonetheless expected to act in accordance with nationalobjectives.
Regulation of hospital standardsNHS hospitals are not subject to formal regulation through systems of accredi-tation, as in some countries, although nongovernmental organizations such asthe King’s Fund in London have offered an accreditation service which a numberof NHS and private hospitals have taken up. However, official regulation doesapply in the cases of mental health institutions, which are subject to officialinspections, and residential care and nursing homes, in which nursing and safetystandards are regulated.
Regulation of the pharmaceutical industryAnother area where there has been long-standing regulation – both on clinicaland financial grounds – is in relation to the pharmaceutical industry. All newproducts are subject to rigorous testing on safety grounds before they can belicensed for use. Moreover, the profits that pharmaceutical firms make throughtheir sales to the NHS are regulated through the Pharmaceutical Price RegulationScheme (PPRS). This is a nonstatutory scheme negotiated between the Depart-ment of Health and the Association of the British Pharmaceutical Industry,which has been in operation since 1957. The scheme operates at the level of acompany’s total business with the NHS rather than in relation to individual products.
A company’s return on capital is calculated by assessing profits minusallowable costs. A 1996 report to parliament argued that the PPRS has a numberof strengths. It claimed the PPRS promotes reasonable prices; contributes to astrong industry capable of successful investment in research and development;provides continuity and stability; encourages innovation; and is administra-tively simple. Nonetheless the report also claimed that PPRS has a number ofdisadvantages such as a lack of transparency, a tendency to encourage ineffi-ciency and to undermine cost containment policies, and to act as a barrier toprice competition.
The most recent five-year PPRS agreement expired in 1998 and the govern-ment is currently seeking to replace it with a statutory system.

29
United Kingdom
Health Care Systems in Transition
Regulation of the internal marketNotwithstanding these long-established regulatory mechanisms, it is the newpressures posed by the introduction of the internal market in 1991 and by thesubsequent plans for the replacement of the internal market, which have attractedmost attention in relation to regulatory policy.
The 1991 reforms placed heavy emphasis on the need to introduce competi-tion into the NHS as a spur for improved performance. The government’sexpectations of competition were stated unequivocally:
... a funding system in which successful hospitals can flourish ... will encouragelocal initiative and greater competition. All of this in turn will ensure a betterdeal for the public, improving the choice and quality of services offered and theefficiency with which these services are delivered. (3)
Thus competition between providers for contracts from purchasers wasexpected to widen choice, improve quality and increase efficiency. From theoutset, however, there were a number of experts who questioned the theoreticaland empirical case for expecting competition to have these effects in the healthcare market. In particular, fears were expressed about an overemphasis onefficiency to the detriment of quality and equity. The government’s response tothese concerns was to develop a system of what became known as ‘managedcompetition’. In essence, this involved using competition, or contestability, asan incentive for increased efficiency, but regulating the market so that excessivecompetition did not jeopardize other objectives.
Early examples of market regulation appeared in the guise of ‘core’ servicesthat each health authority was expected to purchase from its local provider toensure that access to key services was maintained for their local population.Beyond this, the whole raft of purchasing and planning priorities, described inthe preceding section, was used to regulate the purchasing activities of healthauthorities, albeit in the form of ‘guidance’ (backed up by managementsanctions) rather than through prescribed rules of behaviour.
But probably the most explicit use of regulation occurred in relation torestrictions on provider behaviour. From the beginning, it was made clear thatNHS trusts would have limited freedom over their financial affairs. Thus trustscould not behave as profit-seeking firms; rather, they were required to make a6% return on their capital assets and to break even. Pricing policy was alsoregulated. They were expected to price their services on the basis of averagecosts and could not, except in exceptional circumstances, engage in marginalcost pricing or cross-subsidization.
The most vivid statement of regulatory policy towards providers wascontained in the guidance document published by the NHSE in 1994, The

30
United Kingdom
European Observatory on Health Care Systems
operation of the internal market: local freedoms, national responsibilities. Thisset out criteria for the NHS Executive to use when carrying out activities suchas: approving mergers and joint ventures between providers; managing providerrestructuring and closures; and in preventing collusion (with the possible adverseconsequences of higher prices, lower quality and barriers to entry) whileencouraging collaboration which is in the interests of patients.
The significance of The operation of the internal market: local freedoms,national responsibilities is that it makes explicit the need to manage or regulatethe market, while claiming that the internal market was never intended to meetall of the aims of the NHS on its own. This signalled a move away fromdependence on competition and a greater reliance on planning and regulation.This is a trend that has continued with added emphasis by the new LabourGovernment.
The new NHS and its regulatory frameworkA prominent feature of the present government’s approach to regulation in theNHS is a strong emphasis on measuring and improving quality standards. Toachieve this aim a number of new agencies are being set up. These include aNational Institute of Clinical Excellence (NICE) and a Commission for HealthImprovement (ChIMP).
The NICE will be responsible for assessing evidence on the clinical andcost-effectiveness of existing and new treatments and for producing clearguidance for clinicians. At the outset it is expected that the Institute will carryout 30–50 appraisals per year which will be used as the basis for clinical guide-lines. This approach will be bolstered by the specification of national serviceframeworks that will spell out how services should be best organized to caterfor patients in different service areas. To ensure that good quality services areactually delivered, the government intends to establish a Commission for HealthImprovement. This is designed to provide independent scrutiny of local servicesand will intervene when local action fails to address deficiencies. (A full state-ment of the government’s plans in these areas is contained in A First ClassService: Quality in the new NHS published by the Department of Health in1998).
One of the first outputs from the government’s new approach to regulationthrough performance assessment was the publication of clinical indicators andhigh-level performance indicators in June 1999. Through its new performanceassessment framework, the quality and efficiency of services are measured interms of six main areas; namely, improvements in people’s health, fair accessto services, the delivery of effective care, efficiency, the experiences of patientsand their carers and health outcomes. The June 1999 publication reports on the
31
United Kingdom
Health Care Systems in Transition
performance of each NHS trust in terms of six main clinical indicators and alsoon health authority performance. The clinical indicators include such measuresas deaths in hospital within 30 days of surgery, deaths in hospital within 30 daysof emergency admission with hip fracture for patients aged 65 and over andrates of emergency re-admission to hospital within 28 days of discharge. Theindicators used to measure health authorities include size of inpatient waitinglist per 1000 head of population and five-year survival rates for breast andcervical cancer.
Other aspects of planning and regulation to be carried out as part of thegovernment’s plans for the new NHS – such as health improvement pro-grammes – have been outlined in earlier sections and are reviewed again at theend of this report.

32
United Kingdom
European Observatory on Health Care Systems

33
United Kingdom
Health Care Systems in Transition
Health care finance and expenditure
Main system of finance and coverage
The main system of health finance and coverage in the United Kingdomis less complex than in most other countries. The NHS is financed mainlythrough central government general taxation together with an element
of national insurance (NI) contributions. As shown in Table 5, in 1996/199793.7% of gross spending on the NHS in England was met from these twosources: 81.5% from the Consolidated Fund, that is, general taxation, and 12.2%from national insurance contributions. (Despite the separation of tax and NIpayments for national income accounting purposes, NI contributions arenowadays tantamount to an income tax and eligibility for NHS services is notdependent on their payment). The remainder of NHS finance (6.3%) was raisedthrough user charges (2.1%) – mainly charges for pharmaceutical prescriptionsand dental charges; from repayments of NHS trust interest bearing debt (3.0%);and from other miscellaneous sources (1.2%) such as health authority capitalrepayments.
Raising finance through general taxation means that there is a broad fundingbase, covering all forms of income, capital and expenditure taxation. Becausethe NHS finance component is not separately identified at the collection stage,it is not possible to specify the degree of progressivity in the payments system.However, to the extent that the overall tax system is broadly progressive, sothe NHS finance system may be described as broadly progressive. Collectionthrough general taxation also means that the costs of collection are kept lowbecause funding destined for the NHS is collected as part of the general inlandrevenue, tax collection process.
The general tax-based system of finance does, however, mean that the degreeof transparency (i.e. the relationship between individual tax payments and thebenefits received from the NHS) is low. Until recently (1998), an annual PublicExpenditure Survey (PES) was undertaken to determine the levels of fundingfor public expenditure programmes, including the NHS. Through this process,
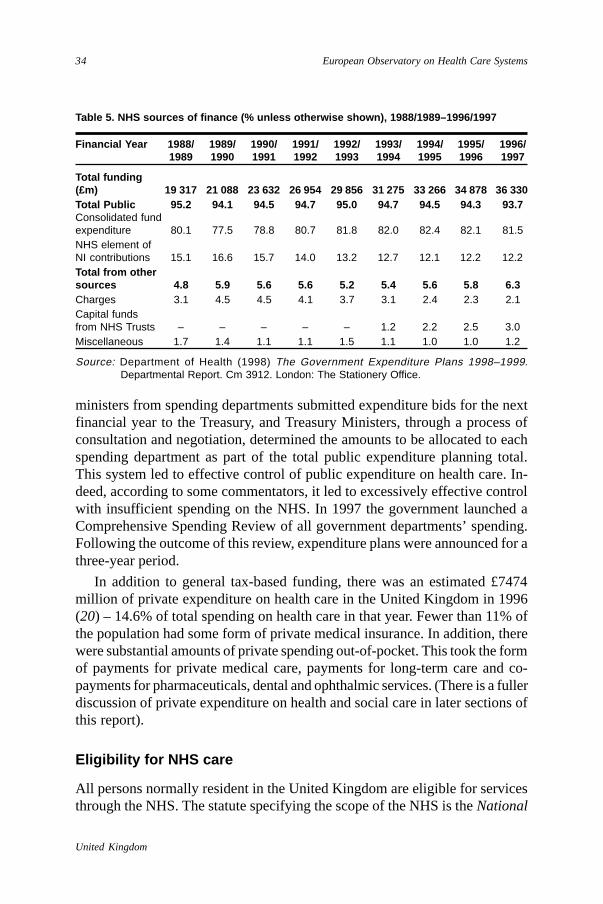
34
United Kingdom
European Observatory on Health Care Systems
ministers from spending departments submitted expenditure bids for the nextfinancial year to the Treasury, and Treasury Ministers, through a process ofconsultation and negotiation, determined the amounts to be allocated to eachspending department as part of the total public expenditure planning total.This system led to effective control of public expenditure on health care. In-deed, according to some commentators, it led to excessively effective controlwith insufficient spending on the NHS. In 1997 the government launched aComprehensive Spending Review of all government departments’ spending.Following the outcome of this review, expenditure plans were announced for athree-year period.
In addition to general tax-based funding, there was an estimated £7474million of private expenditure on health care in the United Kingdom in 1996(20) – 14.6% of total spending on health care in that year. Fewer than 11% ofthe population had some form of private medical insurance. In addition, therewere substantial amounts of private spending out-of-pocket. This took the formof payments for private medical care, payments for long-term care and co-payments for pharmaceuticals, dental and ophthalmic services. (There is a fullerdiscussion of private expenditure on health and social care in later sections ofthis report).
Eligibility for NHS care
All persons normally resident in the United Kingdom are eligible for servicesthrough the NHS. The statute specifying the scope of the NHS is the National
Table 5. NHS sources of finance (% unless otherwise shown), 1988/1989–1996/1997
Financial Year 1988/ 1989/ 1990/ 1991/ 1992/ 1993/ 1994/ 1995/ 1996/1989 1990 1991 1992 1993 1994 1995 1996 1997
Total funding(£m) 19 317 21 088 23 632 26 954 29 856 31 275 33 266 34 878 36 330Total Public 95.2 94.1 94.5 94.7 95.0 94.7 94.5 94.3 93.7Consolidated fundexpenditure 80.1 77.5 78.8 80.7 81.8 82.0 82.4 82.1 81.5NHS element ofNI contributions 15.1 16.6 15.7 14.0 13.2 12.7 12.1 12.2 12.2Total from othersources 4.8 5.9 5.6 5.6 5.2 5.4 5.6 5.8 6.3Charges 3.1 4.5 4.5 4.1 3.7 3.1 2.4 2.3 2.1Capital fundsfrom NHS Trusts – – – – – 1.2 2.2 2.5 3.0Miscellaneous 1.7 1.4 1.1 1.1 1.5 1.1 1.0 1.0 1.2
Source: Department of Health (1998) The Government Expenditure Plans 1998–1999.Departmental Report. Cm 3912. London: The Stationery Office.
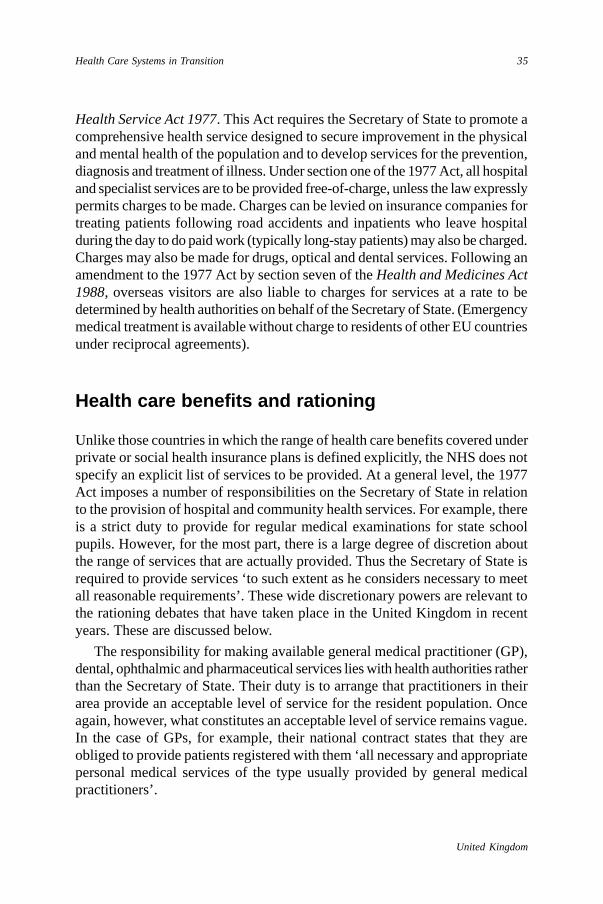
35
United Kingdom
Health Care Systems in Transition
Health Service Act 1977. This Act requires the Secretary of State to promote acomprehensive health service designed to secure improvement in the physicaland mental health of the population and to develop services for the prevention,diagnosis and treatment of illness. Under section one of the 1977 Act, all hospitaland specialist services are to be provided free-of-charge, unless the law expresslypermits charges to be made. Charges can be levied on insurance companies fortreating patients following road accidents and inpatients who leave hospitalduring the day to do paid work (typically long-stay patients) may also be charged.Charges may also be made for drugs, optical and dental services. Following anamendment to the 1977 Act by section seven of the Health and Medicines Act1988, overseas visitors are also liable to charges for services at a rate to bedetermined by health authorities on behalf of the Secretary of State. (Emergencymedical treatment is available without charge to residents of other EU countriesunder reciprocal agreements).
Health care benefits and rationing
Unlike those countries in which the range of health care benefits covered underprivate or social health insurance plans is defined explicitly, the NHS does notspecify an explicit list of services to be provided. At a general level, the 1977Act imposes a number of responsibilities on the Secretary of State in relationto the provision of hospital and community health services. For example, thereis a strict duty to provide for regular medical examinations for state schoolpupils. However, for the most part, there is a large degree of discretion aboutthe range of services that are actually provided. Thus the Secretary of State isrequired to provide services ‘to such extent as he considers necessary to meetall reasonable requirements’. These wide discretionary powers are relevant tothe rationing debates that have taken place in the United Kingdom in recentyears. These are discussed below.
The responsibility for making available general medical practitioner (GP),dental, ophthalmic and pharmaceutical services lies with health authorities ratherthan the Secretary of State. Their duty is to arrange that practitioners in theirarea provide an acceptable level of service for the resident population. Onceagain, however, what constitutes an acceptable level of service remains vague.In the case of GPs, for example, their national contract states that they areobliged to provide patients registered with them ‘all necessary and appropriatepersonal medical services of the type usually provided by general medicalpractitioners’.
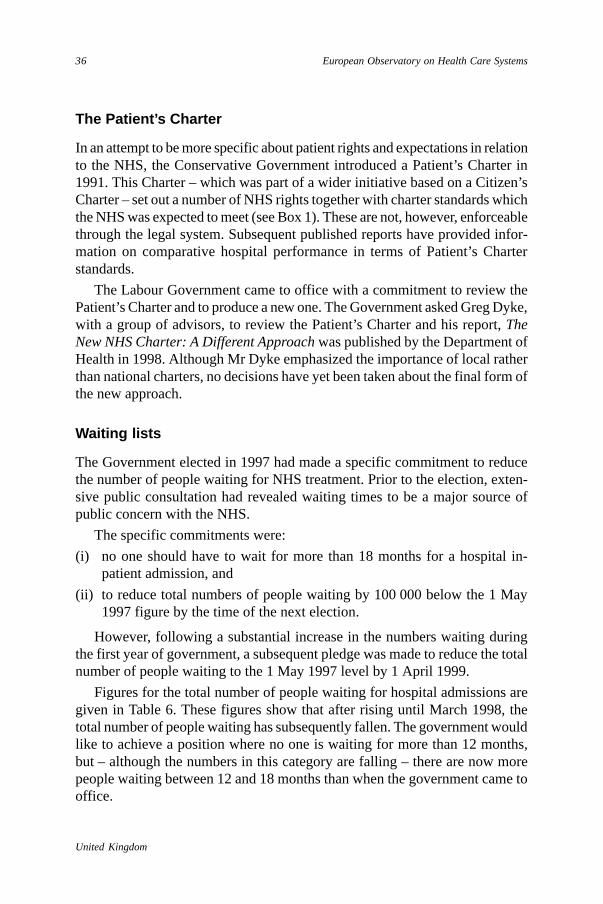
36
United Kingdom
European Observatory on Health Care Systems
The Patient’s Charter
In an attempt to be more specific about patient rights and expectations in relationto the NHS, the Conservative Government introduced a Patient’s Charter in1991. This Charter – which was part of a wider initiative based on a Citizen’sCharter – set out a number of NHS rights together with charter standards whichthe NHS was expected to meet (see Box 1). These are not, however, enforceablethrough the legal system. Subsequent published reports have provided infor-mation on comparative hospital performance in terms of Patient’s Charterstandards.
The Labour Government came to office with a commitment to review thePatient’s Charter and to produce a new one. The Government asked Greg Dyke,with a group of advisors, to review the Patient’s Charter and his report, TheNew NHS Charter: A Different Approach was published by the Department ofHealth in 1998. Although Mr Dyke emphasized the importance of local ratherthan national charters, no decisions have yet been taken about the final form ofthe new approach.
Waiting lists
The Government elected in 1997 had made a specific commitment to reducethe number of people waiting for NHS treatment. Prior to the election, exten-sive public consultation had revealed waiting times to be a major source ofpublic concern with the NHS.
The specific commitments were:
(i) no one should have to wait for more than 18 months for a hospital in-patient admission, and
(ii) to reduce total numbers of people waiting by 100 000 below the 1 May1997 figure by the time of the next election.
However, following a substantial increase in the numbers waiting duringthe first year of government, a subsequent pledge was made to reduce the totalnumber of people waiting to the 1 May 1997 level by 1 April 1999.
Figures for the total number of people waiting for hospital admissions aregiven in Table 6. These figures show that after rising until March 1998, thetotal number of people waiting has subsequently fallen. The government wouldlike to achieve a position where no one is waiting for more than 12 months,but – although the numbers in this category are falling – there are now morepeople waiting between 12 and 18 months than when the government came tooffice.

37
United Kingdom
Health Care Systems in Transition
Box 1 The Patient’s Charter: Rights and Standards
Rights• To receive health care on the basis of clinical need, regardless of ability to pay;
• To be registered with a GP;
• To receive emergency medical care at any time, through your GP or the emergencyambulance service and hospital accident and emergency departments;
• To be referred to a consultant, acceptable to you, when your GP thinks it necessaryand to be referred for a second opinion if you and your GP agree this is desirable;
• To be given a clear explanation of any treatment proposed, including any risks andany alternatives, before you decide whether you will agree to the treatment;
• To have access to your health records, and to know that those working for the NHSwill, by law, keep their contents confidential;
• To choose whether or not you wish to take part in medical research or medical studenttraining;
• To be given detailed information on local health services, including quality standardsand maximum waiting times. You will be able to get this information from your HealthAuthority, GP or Community Health Council;
• To be guaranteed admission for virtually all treatments by a specific date no later thantwo years from the day when your consultant places you on a waiting list. Most patientswill be admitted before this date. Currently, 90 per cent are admitted within a year;
• To have any complaint about NHS services – whoever provides them – investigated,and to receive a full and prompt written reply from the chief executive of your HealthAuthority or general manager of your hospital. If you are still unhappy, you will be ableto take up the case with the Health Services Commissioner.
Standards• Respect for privacy, dignity and religious and cultural beliefs;
• Arrangements to ensure everyone, including people with special needs, can use theservices;
• Information to relatives and friends about the progress of your treatment, subject, ofcourse, to your wishes;
• An emergency ambulance should arrive within 14 minutes in an urban area, or 19 min-utes in a rural area;
• When attending an accident and emergency department, you will be seen immedi-ately and your need for treatment assessed;
• When you go to an outpatient clinic, you will be given a specific appointment time andwill be seen within 30 minutes of it;
• Your operation should not be cancelled on the day you are due to arrive in hospital.If, exceptionally, your operation has to be postponed twice you will be admitted tohospital within one month of the second cancelled operation;
• A named qualified nurse, midwife or health visitor responsible for your nursing ormidwifery care;
• A decision should be made about any continuing health or social care needs youmay have, before you are discharged from hospital.
Source: Department of Health (1995) NHS: the patient’s charter: a charter for England HMSO,London.
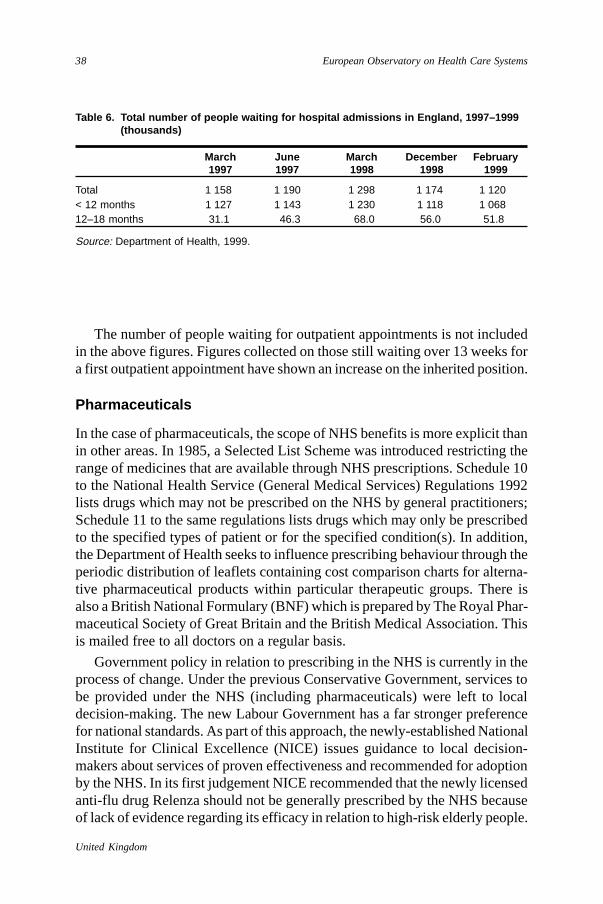
38
United Kingdom
European Observatory on Health Care Systems
The number of people waiting for outpatient appointments is not includedin the above figures. Figures collected on those still waiting over 13 weeks fora first outpatient appointment have shown an increase on the inherited position.
Pharmaceuticals
In the case of pharmaceuticals, the scope of NHS benefits is more explicit thanin other areas. In 1985, a Selected List Scheme was introduced restricting therange of medicines that are available through NHS prescriptions. Schedule 10to the National Health Service (General Medical Services) Regulations 1992lists drugs which may not be prescribed on the NHS by general practitioners;Schedule 11 to the same regulations lists drugs which may only be prescribedto the specified types of patient or for the specified condition(s). In addition,the Department of Health seeks to influence prescribing behaviour through theperiodic distribution of leaflets containing cost comparison charts for alterna-tive pharmaceutical products within particular therapeutic groups. There isalso a British National Formulary (BNF) which is prepared by The Royal Phar-maceutical Society of Great Britain and the British Medical Association. Thisis mailed free to all doctors on a regular basis.
Government policy in relation to prescribing in the NHS is currently in theprocess of change. Under the previous Conservative Government, services tobe provided under the NHS (including pharmaceuticals) were left to localdecision-making. The new Labour Government has a far stronger preferencefor national standards. As part of this approach, the newly-established NationalInstitute for Clinical Excellence (NICE) issues guidance to local decision-makers about services of proven effectiveness and recommended for adoptionby the NHS. In its first judgement NICE recommended that the newly licensedanti-flu drug Relenza should not be generally prescribed by the NHS becauseof lack of evidence regarding its efficacy in relation to high-risk elderly people.
Table 6. Total number of people waiting for hospital admissions in England, 1997–1999(thousands)
March June March December February1997 1997 1998 1998 1999
Total 1 158 1 190 1 298 1 174 1 120< 12 months 1 127 1 143 1 230 1 118 1 06812–18 months 31.1 46.3 68.0 56.0 51.8
Source: Department of Health, 1999.
39
United Kingdom
Health Care Systems in Transition
Priority setting by health authorities
Following the implementation of the NHS and Community Care Act inApril 1991, health authorities acquired major new responsibilities as purchasersor commissioners of health care. They assumed responsibility for assessingthe health care needs of their populations and commissioning a mix of serviceswhich best met these needs. As before, however, the NHS remained a cash-limited service and so this task needed to be carried out within the constraint offixed budgets. This meant that a series of choices needed to be made aboutwhich services were commissioned, in what quantities and for whom. Theassignment of explicit responsibility for these decisions to health authoritieswas one of the main reasons for the heightened awareness about rationing inthe NHS during the 1990s.
Over this period there have been a number of high profile debates centeringon the decisions of particular health authorities that have decided to restrict therange of services to be made available to their resident populations or decidednot to fund particular services for particular individuals. Probably the mostwidely-publicised case is that of the so-called ‘Child B’ (Jaymee Bowen) whichoccurred in March 1995. The father of the child took Cambridge and HuntingdonDistrict Health Authority to court for refusing to fund further chemotherapyand a second bone transplant for his daughter, who was suffering fromleukaemia, on the grounds that the clinical prognosis was extremely poor. Infact the court found in favour of the health authority. The child actually receivedthe treatment in the private sector, funded by a private donation, but sadly diedsubsequently.
Faced with the need to make difficult choices over decisions of this type, anumber of approaches to priority setting have been developed. For its part, thecentral government has encouraged health authorities to involve the generalpublic in decisions about rationing and priority setting. This stance was subse-quently supported by the all-party House of Commons Select Committee onHealth in its report on priority setting (1995). At the local level, numerousmethods for eliciting the public’s views have been used including populationsurveys, public meetings, focus groups and, latterly, citizens’ juries.
Other initiatives have involved health authorities in elaborate exercises whereexpert and public inputs have been drawn upon to assist managers in determiningpriorities in relation to future spending. Methods of economic evaluationdeveloped by health economists have also been drawn upon.
Despite all these initiatives, however, a major study of priority setting, ascarried out by health authorities, found that outright exclusion of services wasrare and, where it did occur, was confined to peripheral services such as tattooremovals, cosmetic surgery and homeopathy. For the most part, health authorities

40
United Kingdom
European Observatory on Health Care Systems
sought to avoid major controversies by providing at least some services, andrelying on traditional NHS approaches of waiting lists and rationing by clini-cians in the case of major service categories. In a recent review of rationingapproaches, Hunter (12) has dubbed this approach ‘muddling through elegantly’.
Complementary sources of finance
The NHS dominates health care provision in the United Kingdom and, as Table 7shows, it is financed overwhelmingly through general taxation. There are,however, some complementary sources of health finance. Table 7 shows thatthe NHS itself derives about 2% of its income from user charges. In addition,there are private, out-of-pocket payments for nonprescription medicines andalso payments for private health care which may be funded out of pocket orthrough private health insurance.
Table 7 indicates the relative shares of total health expenditure accountedfor by mainstream taxation and complementary sources of finance for selectedyears over the period 1975–1995. As the table shows the share of total healthexpenditure accounted for by private payments rose from 3.1% in 1975 to6.7% in 1990. Most of this growth was attributable to a rising share of paymentsfrom private insurance. During the 1990s, however, this share has remainedalmost constant and the overall share of private expenditure has fallen slightly.Trends in private insurance are considered in more detail in the next two sections.
Table 7. Main sources of finance (as % of total expenditure on health care), 1975–1995
Source of finance 1975 1980 1985 1990 1994 1995
PublicTaxes 89.0 89.0 86.0 79.0 82.0 84.0Other public 7.9 7.3 8.2 14.3 11.6 9.8
PrivateOut-of-pocket 2.2 2.5 3.3 3.4 2.9 2.7Private insurance 0.9 1.2 2.5 3.3 3.5 3.5
Source: Derived from OECD health data 1998 and Department of Health (1998) The GovernmentExpenditure Plans 1998–1999. Departmental Report. Cm 3912. London: The StationeryOffice.
Out-of-pocket payments
In the NHS hospital sector, small amounts of income come from charges for“amenity” beds which generally have more privacy than normal ward beds.But the main areas where charges are levied is the family health services inrelation to pharmaceutical, dental and ophthalmic services.
41
United Kingdom
Health Care Systems in Transition
PharmaceuticalsPrescription charges were first introduced back in 1952, as the demand forservices outstripped the expectations of the original architects of the NHS,and, apart from the period 1965–1968, have been in existence ever since. Thesecharges have risen steeply over time. For example, the real charge (i.e. priceadjusted for general inflation) rose by nearly 300% over the period 1971–1993.In 1998 the prescription charge amounted to £5.80 per item (about 57% of theaverage total prescription cost). There are, however, widespread exemptionsfrom charges for children under the age of 16, elderly people, those on lowincomes, for people with specific chronic conditions and for specified uses,e.g. contraceptive pills. By 1995/1996, 84% of prescriptions were dispensed topeople claiming exemptions.
Despite the existence of widespread exemptions, changes in prescriptioncharges can have a noticeable impact both on government revenues and on thenumber of prescriptions dispensed. For example, it has been estimated by agroup of leading academic researchers that the increase in prescription chargesfrom £3.75 to £4.25 per item in 1993 resulted in the generation of £17.3 millionin extra revenue for the government. It also resulted in a reduction of 2.3 mil-lion in the number of prescriptions dispensed compared with the number thatwould have been dispensed if charges had not risen.
From 1953 to 1969, pharmaceutical prescriptions were the largest sourceof NHS income from charges. Since 1969, however, they have been exceededby dental charges: for example in 1998/1999, income from prescription chargesfor England was £341 million whereas income from dental charges amountedto £420 million.
Dental servicesWithin the NHS, general dental services are provided by independent dentistsunder agreements made with local health authorities. There is currently aconsiderable amount of co-payment with individuals paying 80% of the costof their treatment up to a maximum charge set at £348 in 1999/2000. NHScharges are not levied on certain patient groups, mainly children, those on lowincomes and pregnant or nursing mothers. In 1998/1999 the average full costof a course of NHS dental treatment was approximately £34.
Many dentists offer services both to NHS patients and to private patients.In recent years disputes between dentists and the government over the feesoffered for NHS work have led to some dentists withdrawing entirely fromNHS work, and to others reducing the amount they undertake. Faced withdifficulties in obtaining treatment under the NHS, patients in many areas havebecome private patients. This involves bearing the full costs of dental treatment.As a result private dental insurance has expanded rapidly in recent years. For
42
United Kingdom
European Observatory on Health Care Systems
example, Denplan Ltd (which was acquired by the major medical insurer, PPP,in 1994) currently funds about £60 million of private dentistry per year for500 000 patients out of an estimated total private dental market of £500 millionper year.
Ophthalmic servicesDuring the 1980s there was general deregulation of ophthalmic services. FromApril 1989, free NHS eye tests have been restricted to certain priority groups;namely, children, students under 19 years of age and in full-time education,adults on low income and people who have, or are predisposed to, certain eyediseases. Entitlement to free NHS sight tests was reinstated to all aged 60 andover from April 1999. All other groups must seek private eye tests. Prices areusually in the range £16–£18. Most spectacles are now provided on a commercialbasis by opticians, although NHS vouchers are provided to help certain prioritygroups, mainly children and those on low incomes, meet the cost of spectacles.Just fewer than four million vouchers were issued in 1996/1997 in England.
Social careWithin British health and social care policy, there has been a long-standingdistinction between health care provided by the NHS, which is overwhelminglyfree at the point of use, and social care provided through local government,which is means-tested. For much of the post-war period, however, this distinctionwas masked as local authorities often failed to levy charges for domiciliarysocial care and a large amount of long-term nursing care was provided free-of-charge by the NHS.
A change in this situation started to occur in the 1980s as government policyencouraged the private provision of nursing and residential care at the expenseof NHS and local authority provided care. To begin with, the financial impli-cations of the withdrawal of free NHS care were obscured because the socialsecurity system funded the newly provided private care. However, followingthe implementation of the care in the community component of the NHS andCommunity Care Act in 1993, this situation changed.
Under the new arrangements, all individuals who require social care aresubject to a needs assessment carried out by a case manager from their localauthority social services department. On the basis of this assessment, anappropriate package of care – which may involve domiciliary or residentialcare – is identified. The individual is also assessed in terms of their income,and (in the case of residential care) in terms of the value of their assets, inorder to determine what level of payment they will be required to bear privately.
At the present time, anyone with assets in excess of £10 000 is required tomake a contribution towards the costs of nursing home or residential care.

43
United Kingdom
Health Care Systems in Transition
Anyone with assets in excess of £16 000 is required to meet the costs in full.For the purposes of this calculation, a person’s equity holding in their home isincluded as part of their assets and must be drawn upon to meet the costs ofsocial care.
This process has led to considerable complaint from those people, and theirfamilies and heirs, who have been expected to meet their long-term care costsin this way. Claims have been made that an implicit social contract betweenthe government and elderly people has been broken. As a result, there has beenmuch debate on the subject and numerous proposals have been made for reformof the system. In the light of these concerns, the Labour Government set up aRoyal Commission on Long Term Care in 1997. The Commission publishedits report, With Respect to Old Age: Long Term Care – Rights and Responsi-bilities, in March 1999. Its main recommendation was that the costs of careshould be split between living costs, housing costs and personal care. Personalcare should be available after an assessment, according to need and paid forfrom general taxation: the rest should be subject to a co-payment according tomeans. At the time of writing the government is considering its response to theCommittee’s recommendations.
Voluntary (private) health insurance *
Private medical insurance takes two main forms: employment-based, companyinsurance (which represents 59% of the total) and individual insurance (whichaccounts for 31%). The remaining 10% is made up of voluntary employee-paid groups whereby professional associations or trades unions act as umbrellaorganizations, but employees meet the costs of premiums themselves. It is alsoworth noting that in just under one third of company schemes employees meetall or part of the premium costs.
Table 8 shows how the size of the private insurance market – as measuredby the percentage of the population covered – has grown over the last 30 years.For most of the early period, coverage grew slowly so that by the end of the1970s it represented about 5% of the population. During the 1980s, however,the sector expanded dramatically, primarily as the result of the growth ofemployment-based schemes. Coverage peaked in 1990 when 11.5% of the popu-lation were covered. Since then, the sector has stagnated, probably as a resultof the combined effects of economic recession and a substantial increase in thereal price of insurance premiums. These grew at an average rate of nearly 5%per year between 1991 and 1996. By 1996, private insurers provided coveragefor 6.4 million people; this represented about 10.8% of the population.
* The material in this section draws extensively on Laing and Buisson (14).
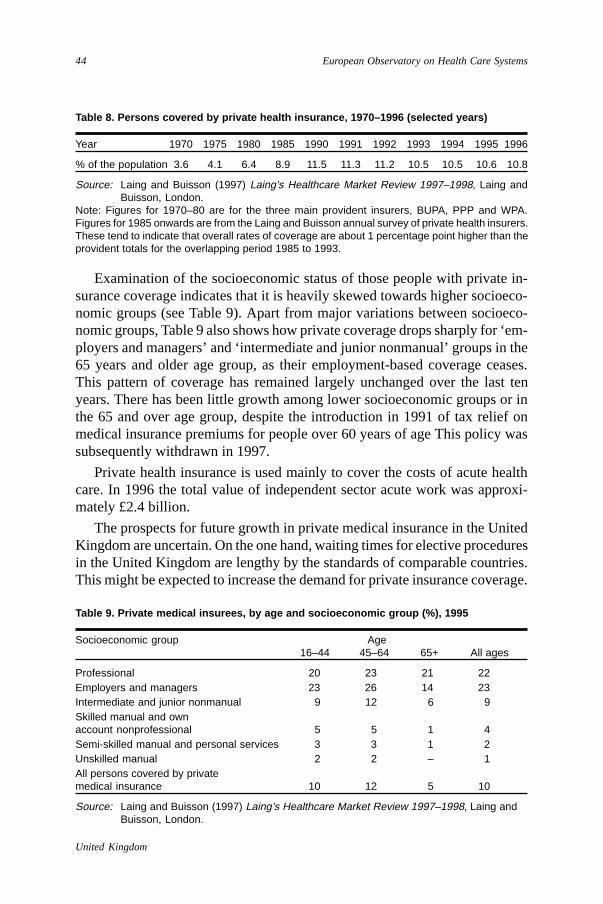
44
United Kingdom
European Observatory on Health Care Systems
Examination of the socioeconomic status of those people with private in-surance coverage indicates that it is heavily skewed towards higher socioeco-nomic groups (see Table 9). Apart from major variations between socioeco-nomic groups, Table 9 also shows how private coverage drops sharply for ‘em-ployers and managers’ and ‘intermediate and junior nonmanual’ groups in the65 years and older age group, as their employment-based coverage ceases.This pattern of coverage has remained largely unchanged over the last tenyears. There has been little growth among lower socioeconomic groups or inthe 65 and over age group, despite the introduction in 1991 of tax relief onmedical insurance premiums for people over 60 years of age This policy wassubsequently withdrawn in 1997.
Private health insurance is used mainly to cover the costs of acute healthcare. In 1996 the total value of independent sector acute work was approxi-mately £2.4 billion.
The prospects for future growth in private medical insurance in the UnitedKingdom are uncertain. On the one hand, waiting times for elective proceduresin the United Kingdom are lengthy by the standards of comparable countries.This might be expected to increase the demand for private insurance coverage.
Table 9. Private medical insurees, by age and socioeconomic group (%), 1995
Socioeconomic group Age16–44 45–64 65+ All ages
Professional 20 23 21 22Employers and managers 23 26 14 23Intermediate and junior nonmanual 9 12 6 9Skilled manual and ownaccount nonprofessional 5 5 1 4Semi-skilled manual and personal services 3 3 1 2Unskilled manual 2 2 – 1All persons covered by privatemedical insurance 10 12 5 10
Source: Laing and Buisson (1997) Laing’s Healthcare Market Review 1997–1998, Laing andBuisson, London.
Table 8. Persons covered by private health insurance, 1970–1996 (selected years)
Year 1970 1975 1980 1985 1990 1991 1992 1993 1994 1995 1996
% of the population 3.6 4.1 6.4 8.9 11.5 11.3 11.2 10.5 10.5 10.6 10.8
Source: Laing and Buisson (1997) Laing’s Healthcare Market Review 1997–1998, Laing andBuisson, London.
Note: Figures for 1970–80 are for the three main provident insurers, BUPA, PPP and WPA.Figures for 1985 onwards are from the Laing and Buisson annual survey of private health insurers.These tend to indicate that overall rates of coverage are about 1 percentage point higher than theprovident totals for the overlapping period 1985 to 1993.
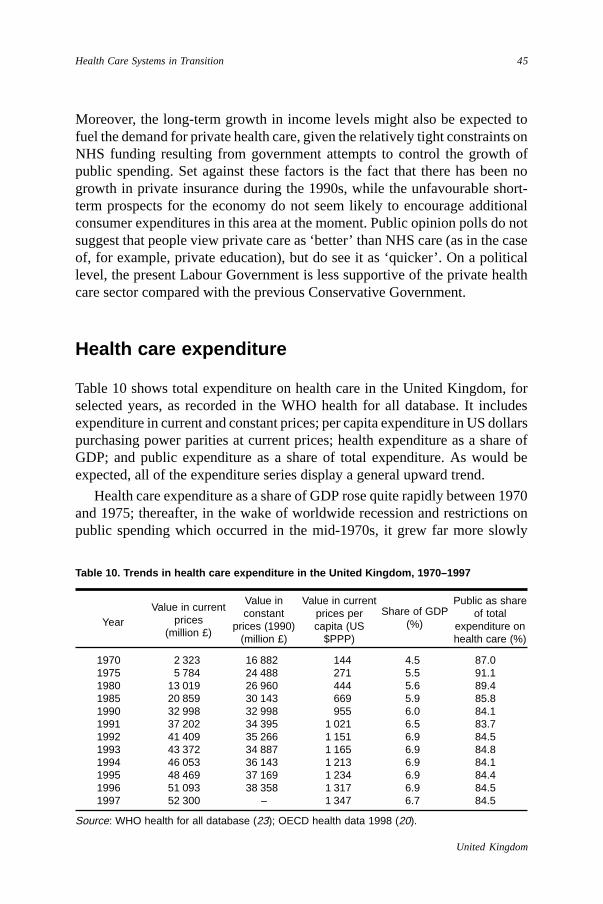
45
United Kingdom
Health Care Systems in Transition
Moreover, the long-term growth in income levels might also be expected tofuel the demand for private health care, given the relatively tight constraints onNHS funding resulting from government attempts to control the growth ofpublic spending. Set against these factors is the fact that there has been nogrowth in private insurance during the 1990s, while the unfavourable short-term prospects for the economy do not seem likely to encourage additionalconsumer expenditures in this area at the moment. Public opinion polls do notsuggest that people view private care as ‘better’ than NHS care (as in the caseof, for example, private education), but do see it as ‘quicker’. On a politicallevel, the present Labour Government is less supportive of the private healthcare sector compared with the previous Conservative Government.
Health care expenditure
Table 10 shows total expenditure on health care in the United Kingdom, forselected years, as recorded in the WHO health for all database. It includesexpenditure in current and constant prices; per capita expenditure in US dollarspurchasing power parities at current prices; health expenditure as a share ofGDP; and public expenditure as a share of total expenditure. As would beexpected, all of the expenditure series display a general upward trend.
Health care expenditure as a share of GDP rose quite rapidly between 1970and 1975; thereafter, in the wake of worldwide recession and restrictions onpublic spending which occurred in the mid-1970s, it grew far more slowly
Table 10. Trends in health care expenditure in the United Kingdom, 1970–1997
YearValue in current
prices(million £)
Value inconstant
prices (1990)(million £)
Value in currentprices percapita (US
$PPP)
Share of GDP(%)
Public as shareof total
expenditure onhealth care (%)
1970 2 323 16 882 144 4.5 87.01975 5 784 24 488 271 5.5 91.11980 13 019 26 960 444 5.6 89.41985 20 859 30 143 669 5.9 85.81990 32 998 32 998 955 6.0 84.11991 37 202 34 395 1 021 6.5 83.71992 41 409 35 266 1 151 6.9 84.51993 43 372 34 887 1 165 6.9 84.81994 46 053 36 143 1 213 6.9 84.11995 48 469 37 169 1 234 6.9 84.41996 51 093 38 358 1 317 6.9 84.51997 52 300 – 1 347 6.7 84.5
Source: WHO health for all database (23); OECD health data 1998 (20).
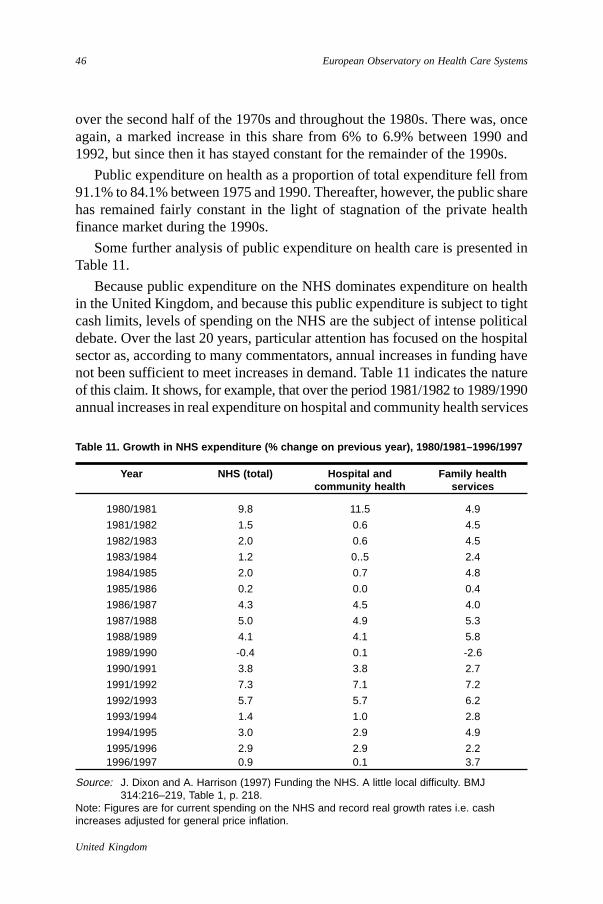
46
United Kingdom
European Observatory on Health Care Systems
over the second half of the 1970s and throughout the 1980s. There was, onceagain, a marked increase in this share from 6% to 6.9% between 1990 and1992, but since then it has stayed constant for the remainder of the 1990s.
Public expenditure on health as a proportion of total expenditure fell from91.1% to 84.1% between 1975 and 1990. Thereafter, however, the public sharehas remained fairly constant in the light of stagnation of the private healthfinance market during the 1990s.
Some further analysis of public expenditure on health care is presented inTable 11.
Because public expenditure on the NHS dominates expenditure on healthin the United Kingdom, and because this public expenditure is subject to tightcash limits, levels of spending on the NHS are the subject of intense politicaldebate. Over the last 20 years, particular attention has focused on the hospitalsector as, according to many commentators, annual increases in funding havenot been sufficient to meet increases in demand. Table 11 indicates the natureof this claim. It shows, for example, that over the period 1981/1982 to 1989/1990annual increases in real expenditure on hospital and community health services
Table 11. Growth in NHS expenditure (% change on previous year), 1980/1981–1996/1997
Year NHS (total) Hospital and Family healthcommunity health services
1980/1981 9.8 11.5 4.9
1981/1982 1.5 0.6 4.5
1982/1983 2.0 0.6 4.5
1983/1984 1.2 0..5 2.4
1984/1985 2.0 0.7 4.8
1985/1986 0.2 0.0 0.4
1986/1987 4.3 4.5 4.0
1987/1988 5.0 4.9 5.3
1988/1989 4.1 4.1 5.8
1989/1990 -0.4 0.1 -2.6
1990/1991 3.8 3.8 2.7
1991/1992 7.3 7.1 7.2
1992/1993 5.7 5.7 6.2
1993/1994 1.4 1.0 2.8
1994/1995 3.0 2.9 4.9
1995/1996 2.9 2.9 2.21996/1997 0.9 0.1 3.7
Source: J. Dixon and A. Harrison (1997) Funding the NHS. A little local difficulty. BMJ314:216–219, Table 1, p. 218.
Note: Figures are for current spending on the NHS and record real growth rates i.e. cashincreases adjusted for general price inflation.

47
United Kingdom
Health Care Systems in Transition
(i.e. cash increases adjusted for general inflation) amounted to an average rateof about 1.7%. In fact, if cash increases were adjusted by the rate of priceinflation in the NHS hospital sector, the average annual rate of increase inexpenditure was less than 1%. These figures contrast with unofficial estimateswhich suggest that the NHS requires annual increases in spending of around3% per year to keep abreast of rising demands resulting from an ageingpopulation, the introduction of new medical technologies and rising publicexpectations. According to many commentators, it was the build-up of fundingpressures during the 1980s (and the political debate surrounding these pressures)that prompted the Prime Minister at the time, Margaret Thatcher, to instigatethe inquiry which led to the 1991 reforms.
Annual funding settlements for the NHS in general, and the hospital servicein particular, were considerably more generous in the period immediatelypreceding and following the implementation of the 1991 reforms, but startedto tighten up again in 1993/1994. In July 1998, following a far-reaching,comprehensive spending review, the new Secretary of State for Health, FrankDobson, announced a three-year expenditure plan for the NHS with annualincreases in real growth over the period 1999/2000–2001/2002 planned toaverage 4.7% per year. Despite the generally favourable response accorded tothis announcement, the winter pressures on the hospital service in 1998/1999once again led to headlines announcing an ‘NHS in crisis’.
During debates about the adequacy of NHS expenditure, reference is oftenmade to the smaller proportion of GDP devoted to health expenditure in theUnited Kingdom compared with most other similar countries. As Fig. 6 shows,total expenditure on health as a proportion of GDP, at 6.7% in the UnitedKingdom, is indeed lower than the western European average of 8.5%. On thismeasure, the United Kingdom ranks 20 out of 21 countries.
Comparative data on public expenditure as a proportion of total expenditureon health for the WHO European countries is given in Fig. 7. This indicatesthat the UK proportion of 85% is among the highest in western Europe. Thishighlights the fact that it is the low level of private expenditure on health whichproduces the low overall ratio of health spending-to-GDP in the UnitedKingdom.
Fig. 8 shows the trends in health care expenditure as a percentage of GDPover the period 1970–1995 for selected countries. It shows that the UKpercentage has grown over time, but that it has remained below that of theother countries included in the figure.
Some idea of the actual spending levels on health in different countries isprovided in Fig. 9. This indicates health care expenditure per head in US dollars

48
United Kingdom
European Observatory on Health Care Systems
Fig. 6. Total expenditure on health care as % of GDP in the WHO European Region,1997 or latest available year
Source: WHO Regional Office for Europe health for all database (23).
% of GDP
TajikistanRepublic of Moldova
BelarusTurkmenistan
GeorgiaArmeniaUkraine
KyrgyzstanUzbekistan
NIS averageKazakhstan
Russian FederationAzerbaijan
CroatiaThe former Yugoslav Republic of Macedonia
SloveniaSlovakia
Czech RepublicHungaryEstoniaPoland
CCEE averageLithuaniaBulgaria
LatviaBosnia and Herzegovina
AlbaniaRomania
GermanySwitzerland
FranceSweden
NetherlandsEU average
IsraelPortugalIcelandAustria
DenmarkItaly
BelgiumSpain
NorwayFinland
LuxembourgGreeceIreland
United KingdomTurkey
1.2
2.2
2.7
3.0
3.0
3.2
3.5
4.2
4.5
5.0
5.1
6.4
8.0
2.6
2.8
3.5
4.5
4.7
5.1
5.3
5.3
6.0
6.5
7.0
7.1
7.7
8.8
9.0
3.8
6.7
7.0
7.1
7.1
7.3
7.4
7.4
7.6
7.6
7.7
7.9
8.0
8.2
8.4
8.5
8.5
8.6
9.9
10.2
10.4
0 2 4 6 8 10 12
123456789012345123456789012345

49
United Kingdom
Health Care Systems in Transition
Source: WHO Regional Office for Europe health for all database (23).
Fig. 7. Public (government) health care expenditure as % of total health careexpenditure in the WHO European Region, 1997 or latest available year
Percentage
60
65
69
70
70
71
72
72
74
75
75
77
77
78
79
82
83
84
85
85
87
88
88
90
92
92
92
93
94
97
97
98
100
100
100
100
100
100
0 20 40 60 80 100
Albania
Bosnia and Herzegovina
Bulgaria
Croatia
Romania
Slovakia
The former Yugoslav Republic of Macedonia
Kazakhstan
Kyrgyzstan
Belarus
Poland
Czech Republic
Ukraine
Luxembourg
Lithuania
Slovenia
Belgium
Estonia
Latvia
United Kingdom
Iceland
Sweden
Norway
Spain
France
Germany
Finland
Ireland
Greece
Israel
Austria
Netherlands
Turkey
Italy
Switzerland
Hungary
Denmark
Portugal
123456789012345678123456789012345678
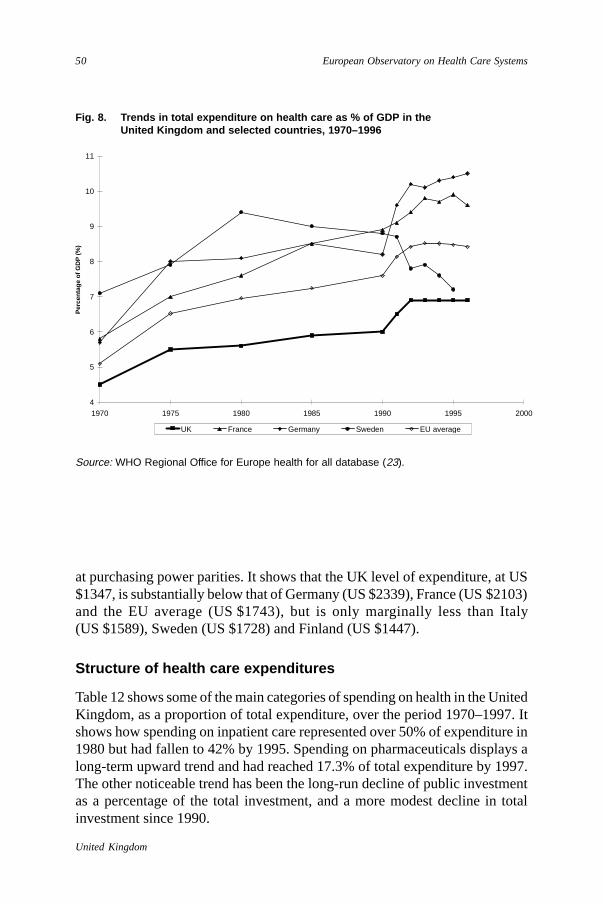
50
United Kingdom
European Observatory on Health Care Systems
Fig. 8. Trends in total expenditure on health care as % of GDP in theUnited Kingdom and selected countries, 1970–1996
Source: WHO Regional Office for Europe health for all database (23).
4
5
6
7
8
9
10
11
1970 1975 1980 1985 1990 1995 2000
Per
cent
age
of G
DP
(%
)
UK France Germany Sweden EU average
at purchasing power parities. It shows that the UK level of expenditure, at US$1347, is substantially below that of Germany (US $2339), France (US $2103)and the EU average (US $1743), but is only marginally less than Italy(US $1589), Sweden (US $1728) and Finland (US $1447).
Structure of health care expenditures
Table 12 shows some of the main categories of spending on health in the UnitedKingdom, as a proportion of total expenditure, over the period 1970–1997. Itshows how spending on inpatient care represented over 50% of expenditure in1980 but had fallen to 42% by 1995. Spending on pharmaceuticals displays along-term upward trend and had reached 17.3% of total expenditure by 1997.The other noticeable trend has been the long-run decline of public investmentas a percentage of the total investment, and a more modest decline in totalinvestment since 1990.

51
United Kingdom
Health Care Systems in Transition
Fig. 9. Total expenditure on health care in US $PPP per capita in the WHO EuropeanRegion, 1997 or latest available year
Source: WHO Regional Office for Europe health for all database (23).
10
16
47
232
371
602
743
904
974
1125
1168
1324
1347
1447
1589
1728
1743
1747
1793
1814
1825
1848
2005
2103
2339
2340
2547
0 500 1000 1500 2000 2500 3000
Ukraine
Turkmenistan
Russia
Turkey
Poland
Hungary
Slovenia
Czech Republic
Greece
Portugal
Spain
Ireland
United Kingdom
Finland
Italy
Sweden
EU average
Belgium
Austria
Norway
Netherlands
Denmark
Iceland
France
Germany
Luxembourg
Switzerland
US $PPPs
123456789012345671234567890123456712345678901234567

52
United Kingdom
European Observatory on Health Care Systems
Year Inpatient care Pharmaceuticals Total investment Public investment
1970 – 12.5 6.9 6.61975 – 11.2 6.8 6.31980 53.5 12.8 5.5 4.71985 – 14.1 6.1 4.81990 43.9 13.8 6.7 5.11991 44.6 14.0 6.1 4.41992 43.3 14.5 5.7 3.91993 42.8 15.3 4.9 2.31994 42.2 15.3 5.0 1.01995 42.2 15.9 – 0.71996 – 16.5 – –1997 – 17.3 – –
Table 12. Health care expenditure by categories in the United Kingdom (as % of total expenditure on health care), 1970–1997
Source: OECD health data 1998 (20).
53
United Kingdom
Health Care Systems in Transition
Health care delivery system
Primary health care and public health services
Primary health care services
The United Kingdom has a highly developed system of generalist, primarycare delivered by general medical practitioners (GPs) and associatedstaff (e.g. practice nurses and community nurses) as part of the NHS.
General practitioners (GPs)Over 99% of the population are registered with GPs who provide 24-hour accessand a range of preventative, diagnostic and curative primary care services (thosenot registered with GPs tend to be homeless people and those in temporaryaccommodation). Approximately 90% of patient contacts with the NHS arewith GPs. Patients may select a GP of their choice, although choice is restrictedwithin geographical areas. The incidence of patients changing their GP – otherthan for reasons of changed residential location – is low. Most people have along-standing relationship with their GP.
Patient referral to hospital specialists is made by GPs. This GP ‘gatekeeping’role is an important element of the NHS. Unlike many other countries, NHSpatients do not have direct access to specialists other than in special circum-stances, e.g. attendance at hospital accident and emergency departments. Recentreforms have aimed to offer patients more choice concerning referrals tohospital, but there is little evidence to suggest that this has resulted in, forexample, more active choice of specialists.
On 1 October 1998 there were 27 392 general practitioners practising in8994 practices in England. This produces an average practice size of aroundthree GPs. The average practice size has increased over time with over 63% ofpractices currently comprising four or more doctors. Less than 10% of practices
54
United Kingdom
European Observatory on Health Care Systems
are currently single-handed, compared with 50% in 1952. The average patientlist size per general practitioner on 1 October 1998 was 1866. The average listsize has fallen by 7% over the last ten years. The average GP carries out 10 000consultations per year. The number of consultations per GP has risen over thelast ten years at about the same rate as list sizes have fallen.
Since the establishment of the NHS in 1948, GPs have been self-employedprofessionals who provide services to the NHS under contract. This independentcontractor status gives GPs considerable autonomy. The terms and conditionsof the GPs’ contract with the NHS are negotiated nationally between the doctors’representatives and the government. The latest version of this contract (1990)introduced some major changes. It was designed to increase patient choice byrequiring practices to provide more information about their services; to maketheir terms of service more explicit; and to relate payments more closely toperformance. (These performance-related payments are discussed more fullyin the section Payment of health care professionals.)
A central Medical Practices Committee has the responsibility for reviewingand controlling the spread of GP practices around the country. Any new practicecan set up in an area that is designated ‘open’ by the Committee; in contrast,new practices can only be set up in exceptional circumstances in areas whichare considered to be over-doctored and therefore designated ‘restricted’.
Practice nurses, health visitors and community nursesVarious other health professionals are involved in the provision of primaryhealth care services: namely, practice nurses, district nurses, midwives andhealth visitors.
Practice nurses are generally registered general nurses who are employedby GPs to work within practices. They undertake a wide variety of tasksincluding chronic disease management, health promotion activities, immuni-zations and health assessments of elderly people. The number of practice nursesemployed by GPs has increased by almost fourfold over the last ten years sothat by October 1998 there were 10 358 full-time equivalents working in theNHS.
In addition, there are community-nursing staff who are formally employedby community hospital trusts, although they are often attached to, and workwith GPs and other primary care professionals. These include district nurses,midwives, health visitors, chiropodists and various therapists (e.g. physio-therapists, occupational therapists).
District nurses are registered general nurses who provide skilled nursing carefor patients in their own homes. There are about 10 000 district nurses in England.
55
United Kingdom
Health Care Systems in Transition
Midwives are registered general nurses who have undertaken further trainingfocused on women’s health during pregnancy and childbirth. Working in thecommunity, they provide services to pregnant women and have responsibilityfor mother and child for 28 days following delivery. There are around 5000midwives in England.
Health visitors are registered general nurses who have undertaken a courseof further training. They concentrate on visiting families with babies and veryyoung children in their own homes. They offer advice and are generallyconcerned with the prevention of ill health and health promotion. There areapproximately 12 600 health visitors in England.
In recent years, increasing emphasis has been placed upon the creation ofprimary care teams, comprising GPs and associated nursing staff. While thesehave worked effectively in some areas, problems of joint working and the splitmanagement responsibility between GPs and community trusts have inhibitedtheir performance in many places.
Private primary careThere is very little privately financed primary care in the United Kingdom.Successive user opinion polls have revealed a high level of satisfaction withNHS GP services and so there is little scope for private practice to addressperceived failings of the NHS, such as lengthy waiting times for elective surgeryin the hospital sector. A recent innovation has seen the appearance of privateprimary care centres located at certain London mainline railway stations,offering immediate consultations for a standard fee of £35. These are designedto address the needs of busy working people who experience difficulty makingnormal GP appointments but are, so far, on a very small scale.
Pharmaceutical servicesPharmaceutical services are provided mainly by community pharmacists, whosupply drugs and appliances prescribed by GPs. In 1997/1998 there were 10 503contracting pharmacies, a number that has remained fairly constant over thelast ten years. The number of prescriptions dispensed, on the other hand, hasgrown by 38% over the last ten years, amounting to 505.8 million prescriptionsin 1997/1998. Rising expenditure on pharmaceuticals is a major policy concernof the government. Expenditure is now within a cash-limited budget.
Current government plans are also designed to extend the role of communitypharmacists and to make better use of their skills. To this end, a series of pilotprojects have been launched, such as those involving extended advice frompharmacists for patients with medication-related problems. The NHS (PrimaryCare) Act 1997 also gives health authorities more flexibility in providing additional

56
United Kingdom
European Observatory on Health Care Systems
pharmaceutical services. The Department of Health will be publishing a strategyfor community pharmacy in the near future.
Dental servicesDental services are provided as part of the NHS by independent general dentalpractitioners who have service agreements with their local health authorities.The number of dentists on health authority lists grew by 14.4% in the ten years1988/1989–1998/1999, so that by 1998/1999 there were 17 245 dentists listed.However, the number of adult courses of NHS dental treatment rose by justunder 9% over the same period, resulting in a slight fall in the number ofcourses of treatment per dentist. Over this period, courses of private dentaltreatment, provided, for the most part, by the same independent practitioners,have expanded considerably. In some areas, patients find it difficult to obtainNHS-funded treatment and have switched to private treatment. The section onComplementary sources of finance reports how about £500 million per year iscurrently spent on private dental treatments.
The government’s own plans in relation to dental services have concentratedon reducing inequalities in dental health status and overcoming difficultieswith access to NHS treatment.
Reform of primary careOver the last ten years, an increasing amount of policy emphasis has beenplaced upon the primary care sector within the NHS. This process gained realmomentum following the publication of a White Paper, Promoting BetterHealth, in 1987. This White Paper contained a number of measures designedto make general practice more responsive to market forces. It was followed bythe new 1990 contract and the various organizational reforms, involving GPfundholding and its variants, which have been discussed already in the sectionon Organizational structure and management.
Another significant event in the development of primary care occurred withthe publication of the NHS executive letter, Developing NHS Purchasing andGP Fundholding, in October 1994. The subtitle of this document was Towardsa primary care-led NHS. Much of the change resulting from the strategy setout in the executive letter has concentrated on primary care-based purchasing,but there has also been considerable emphasis on extending and improvingprimary care provision. As a result, many new services have grown up in primarycare settings (e.g. a large expansion in primary care counselling services), whileother services have been transferred from secondary care to primary care settings(e.g. specialist outpatient clinics held on primary care premises). The NHS(Primary Care) Act 1997 also set up a number of pilot projects around the

57
United Kingdom
Health Care Systems in Transition
country with the aim of expanding further the form and scope of primary careprovision.
The new government’s current reforms discussed in the section on Organi-zational structure and management look set to continue this emphasis on aprimary care-led NHS. In April 1999, 481 primary care groups were establishedinvolving all general practices within an area. These are designed both toimprove the quality of primary care provision and to enable GPs and otherprimary care professionals to influence the nature of secondary care servicesprovided for their patients.
Fig. 10 provides some comparative data on the number of outpatient contactsper person per year in the WHO European Region. It suggests that at 5.9 consul-tations per person in 1996, the United Kingdom has an average consultationrate amongst the countries of western Europe. The average number of patientcontacts of those western European countries shown in Fig. 10 is 5.7.
Public health services
Responsibility for the promotion and maintenance of public health in the UnitedKingdom is shared by a number of different levels within the Department ofHealth and the NHS.
Central governmentThe current government was the first to appoint a minister with responsibilityfor public health. The Minister has a broad remit covering several governmentdepartments as well as specific responsibilities in relation to policies on, forexample, tobacco and food safety. At the present time, a major responsibilityfor the minister is to lead the development and implementation of the healthstrategy set out in Saving Lives: Our Healthier Nation.
Also at the central government level, the Chief Medical Officer – withinthe Department of Health – provides independent medical advice on publichealth matters across the whole department. The Annual Report of the ChiefMedical Officer reports on the state of public health in England and identifiesareas for improvement.
Health authoritiesHealth authorities have major responsibilities for pursuing population-based,public health strategies within a framework set out by the Department of Health.
Each HA has a department of public health under a medically-trained directorwho is an executive member of the board. The director of public health is
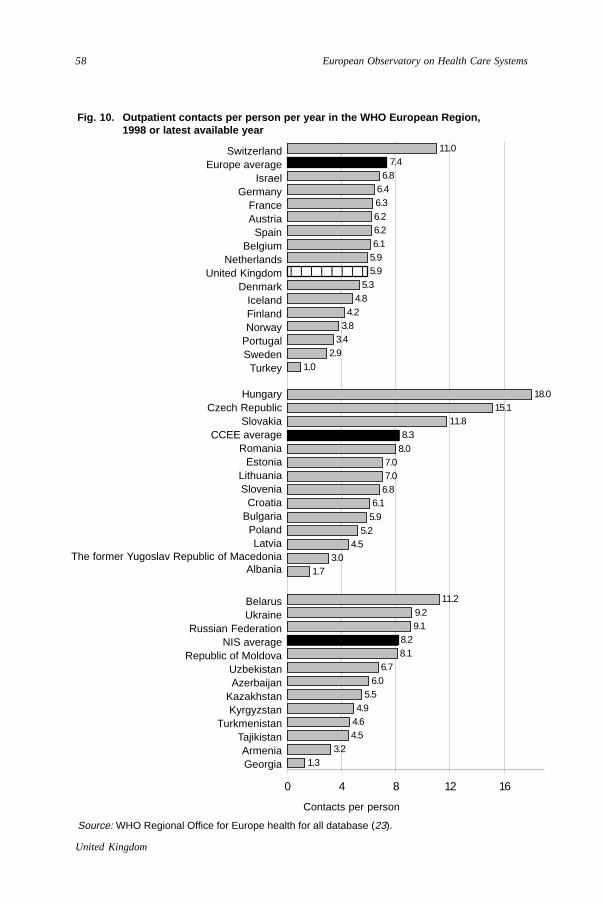
58
United Kingdom
European Observatory on Health Care Systems
Fig. 10. Outpatient contacts per person per year in the WHO European Region,1998 or latest available year
Source: WHO Regional Office for Europe health for all database (23).
Contacts per person
SwitzerlandEurope average
IsraelGermany
FranceAustria
SpainBelgium
NetherlandsUnited Kingdom
DenmarkIcelandFinlandNorway
PortugalSweden
Turkey
BelarusUkraine
Russian FederationNIS average
Republic of MoldovaUzbekistanAzerbaijan
KazakhstanKyrgyzstan
TurkmenistanTajikistanArmeniaGeorgia
HungaryCzech Republic
SlovakiaCCEE average
RomaniaEstonia
LithuaniaSlovenia
CroatiaBulgariaPolandLatvia
The former Yugoslav Republic of MacedoniaAlbania
1.33.2
4.54.64.9
5.56.0
6.78.18.2
9.19.2
11.2
1.73.0
4.55.2
5.96.1
6.87.07.0
8.08.3
11.815.1
18.0
1.02.9
3.43.8
4.24.8
5.35.95.96.16.26.26.36.46.8
7.411.0
0 4 8 12 16
1234567812345678

59
United Kingdom
Health Care Systems in Transition
required to produce an annual report which documents the state of the localpopulation’s health and strategies for improving it. Within the department aconsultant in public health medicine will have specific responsibility for thecontrol of communicable diseases. During the 1990s, departments of publichealth have played an increasingly important role in developing local healthstrategies and carrying out health needs assessments as a basis for the HAs’purchasing strategy. Most HAs have a health promotion department, often aspart of the department of public health.
General practitionersGPs have traditionally responded to individual patient demands and have notbeen prominent in population-based health programmes. However, the 1990contract sought to increase the role of GPs and other primary health careprofessionals in the area of public health by offering a range of financialincentives for achieving immunization and disease-screening targets. Systemsof performance-related payments were subsequently introduced for healthpromotion and chronic disease programmes. These programmes involveregistration, data collection and the provision of advice. They includemaintaining registers of patients with hypertension, coronary heart disease andstroke; maintaining registers of patients’ smoking habits; monitoring diet andphysical activity; carrying out annual health checks on people over 75 years ofage; and carrying out cervical and breast cancer screening.
Despite the expansion of public health activities in primary care settings,concerns persist about the ability of GPs to carry out effective public healthfunctions. This potential limitation is of particular importance given theincreasing power being devolved to GPs for the allocation resources as part ofthe move towards a primary care-led NHS.
New approaches to public healthThe 1992 White Paper, The Health of the Nation, provided a national publichealth strategy for England for the first time. It set priorities and quantifiedtargets for mortality reductions in five key areas: heart disease and strokes,cancers, mental illness, sexual health, and accidents. Although it represented aconsiderable step forward, the Health of the Nation approach was widelycriticized for placing too much emphasis on individual behaviours as anexplanation of poor health, and for disregarding important social determinantsof poor health, particularly inequality and poverty.
The Government’s approach to public health was set out in the Green PaperOur Healthier Nation, published in February 1998. Following wide publicconsultation, the new health strategy was published in the White Paper SavingLives: Our Healthier Nation in July 1999.
60
United Kingdom
European Observatory on Health Care Systems
The government’s declared aim is to find “a third way between the oldextremes of individual victim blaming, on the one hand, and nanny-state socialengineering, on the other”. An important feature of the new approach is anemphasis on improving the health of the worse-off in society and narrowinghealth gaps. Partnership working between central government, local healthauthorities, local government, voluntary organizations and the business sectoris also a key feature of the new approach. This approach will be taken forwardthrough the health improvement programmes (HimPs) to be developed by allhealth authorities in collaboration with their local partners. In addition, 26specially designated health action zones (HAZs) – located in areas of particularsocial and economic deprivation – have been targeted for particular action.These HAZs receive central funding and are designed to improve health bywide-ranging policies involving the participation of local partners in, inter alia,health, housing and employment.
Comparative country performance in terms of one specific public healthindicator – that is, the levels of immunization against measles – is shown inFig. 11. This suggests that the United Kingdom level of immunization – at91% – places it slightly above the mid-point in the distribution for westernEuropean countries in the WHO European Region. Since 1995, parentalconcerns about MMR (measles/mumps/rubella) vaccine have led to a fall inuptake and the latest Department of Health published figure (1998/1999) showsthat rates have fallen to 88.3% at the age of two years. Immunization ratesagainst other diseases such as diphtheria, tetanus, pertussis and poliomyelitisare similarly high in the United Kingdom at or around 93%. Immunizations arethe responsibility of GPs, who receive target payments for attaining certainlevels of immunization amongst patients on their list.
The responsibility for communicable disease control lies with the departmentof public health within each health authority. Most have a consultant responsiblefor the control of communicable disease who would take action in the event ofan outbreak, such as meningitis or E coli.
Secondary and tertiary care
The NHS hospital system is a hierarchical one comprising three tiers. Themiddle tier comprises district general hospitals.
District general hospitals
The district general hospital (DGH) is the bedrock of the system. They wereoriginally introduced in the 1960s in order to provide a comprehensive range
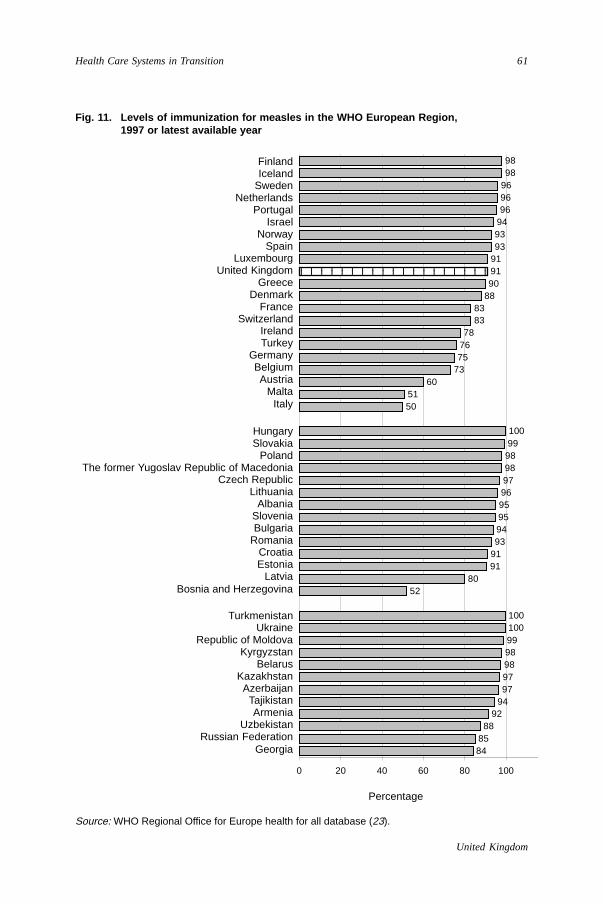
61
United Kingdom
Health Care Systems in Transition
Source: WHO Regional Office for Europe health for all database (23).
Percentage
Fig. 11. Levels of immunization for measles in the WHO European Region,1997 or latest available year
FinlandIceland
SwedenNetherlands
PortugalIsrael
NorwaySpain
LuxembourgUnited Kingdom
GreeceDenmark
FranceSwitzerland
IrelandTurkey
GermanyBelgiumAustria
MaltaItaly
TurkmenistanUkraine
Republic of MoldovaKyrgyzstan
BelarusKazakhstanAzerbaijan
TajikistanArmenia
UzbekistanRussian Federation
Georgia
HungarySlovakia
PolandThe former Yugoslav Republic of Macedonia
Czech RepublicLithuania
AlbaniaSloveniaBulgaria
RomaniaCroatiaEstonia
LatviaBosnia and Herzegovina
848588
92949797989899100100
5280
9191939495959697989899100
5051
6073757678
8383
889091919393949696969898
0 20 40 60 80 100
12345678901234567891234567890123456789
62
United Kingdom
European Observatory on Health Care Systems
of services to populations of between 150 000 and 200 000 people. Despite anumber of changes in organization, the model of the DGH remains the basis ofNHS hospital provision today.
DGHs are wide in terms of the scope of services they provide – in 1991/1992,for example, there were over 200 hospitals carrying out work in 300 or more ofthe 500 ‘health-related groups’ used to classify clinical activity. The centralidea underlying the DGH is that there are benefits in terms of both superiorquality and lower costs from providing a number of different services from thesame site. There were, however, considerable variations in their scale of activity:the largest carried out over 100 000 episodes of care per year, while the smallestperformed only about 10 000.
Because the DGH system was developed as a planned system, the distributionof hospitals is such that access to services is generally good throughout thecountry. This does not mean, however, that there are no variations in access.The pre-1948 distribution of hospitals left a highly unequal legacy betweendifferent regions in terms of the quality and quantity of provision. Parts of thislegacy persist today, such as the heavy concentration of teaching hospitals inLondon.
There is also a substantial backlog of maintenance and repair work necessaryin order to bring parts of the system up to acceptable standards. As part of theprogramme to improve the quality of the capital stock within the NHS, boththe previous government and the present one are committed to the PrivateFinance Initiative (PFI). This is a partnership programme designed to encourageprivate investment in the public sector. At the start of 1998, there were15 projects planned with a total capital value of £1.2 billion. Ten further schemeswere announced in April 1998 taking the total capital value to £2.3 billion.
Clinical activity within a typical DGH is organized in terms of specialtydepartments comprising teams of consultants (i.e. senior specialists) and theirteams of junior doctors (similar organizational arrangements exist in tertiaryhospitals). Specialists and their juniors are responsible for conducting out-patient clinics at the DGH, where they see patients referred to them by GPs,and for providing inpatient treatments. Doctors and nurses working in the NHShospitals are employed on a salaried basis. (Details of the payments systemsfor doctors and nurses are discussed in the section on Financial resourceallocation.)
Regional and supra-regional specialties
Above the DGH in the hierarchy, there are tertiary level hospitals offeringhighly specialized services in addition to secondary care. These services
63
United Kingdom
Health Care Systems in Transition
typically include neurosurgery, heart and liver transplants, renal services andcertain cancer treatments. They are often offered by teaching hospitals andmay operate at the regional level or the supra-regional level. Patients are nor-mally referred to these hospitals by their specialist colleagues at the districtlevel, when it becomes clear that highly specialized treatment is necessary.
Small-scale community hospitals
At the other end of the spectrum there are small-scale community hospitals.These may have up to 200 beds, but typically have up to 50 beds, some ofwhich are available for GPs to manage their patients directly. Facilities offeredvary from hospital to hospital but they will often have a range of diagnosticfacilities, operating theatres, minor injuries units and, sometimes, day-hospitalfacilities.
Community hospitals have had a rather chequered history in recent years.The general move towards concentrating services on larger sites, for reasonsof cost and quality, has led to a reduction in their number. Between 1980 and1990, the number of hospitals with less than 50 beds fell from around 600 tojust over 400. However, the emphasis placed upon treatment in primary andcommunity settings during the 1990s has led to renewed support for smaller,community-based hospitals. Some of those GPs with control over their budgets,such as the total purchasing pilot sites, have sought to develop their communityhospitals as an alternative to expensive and unnecessary, acute hospital care –particularly in the case of elderly people.
Hospital closures
Government policy over the years has led to the closure of many hospitals andto a reduction in the number of hospital beds. In 1993, for example, there wereless than 2000 hospitals of all types compared with around 3000 in 1960. Inthe period 1990–1994, there were 245 hospital closures in England. This hasled to a steady reduction in the number of hospital beds. In the last ten years, forexample, around just over 10 000 beds have been closed each year in England.
There are several reasons for this downsizing. Much of it has been associatedwith the closure of long-stay psychiatric hospitals as policy for people sufferingfrom mental illness has shifted towards care in the community. At the sametime, the movement towards day surgery rather than inpatient care has reducedthe number of beds needed for a given level of clinical activity. A similarreduction in demand for hospital beds has occurred because of the ability –with new drugs and other technologies – to treat people in their own homesinstead of as inpatients. New technologies also enable shorter lengths of stay

64
United Kingdom
European Observatory on Health Care Systems
and, therefore, greater productivity per bed. Thus between 1991 and 1997, thenumber of general and acute episodes of care rose from 7.5 million to 9.6 milliondespite the substantial reduction in the number of beds.
Despite these trends, however, the current government believes that thedownsizing process may have gone too far. Ministers are currently speaking ofan excessive run-down in hospital capacity and the resultant insufficient levelof spare capacity to deal with peaks in demand, such as those resulting fromwinter outbreaks of influenza. In this connection, the low level of bed provisionin the United Kingdom, by international standards, has been highlighted by anumber of experts (see below).
In recent years there has also been a trend towards hospital mergers in thebelief that combining units offers economies of scale and scope. For example,22 mergers (54 trusts into 27) took place on 1 April 1999. This trend continuesdespite some research evidence which queries whether larger hospitals reallydo yield economies of scale.
On the issue of bed numbers, the difficulties that many hospitals faced copingwith the rises in emergency admissions during the winter of 1998/1999 led thecurrent Secretary of State for Health, Frank Dobson, to announce the NationalBeds Inquiry. He expressed the belief that this trend had progressed too far andthat there was now insufficient spare capacity in the system to deal with emer-gency situations. The National Beds Inquiry has been set up within the Depart-ment of Health to review assumptions about growth in the volume of generaland acute health services and their implications for health services and hospitalbed numbers looking 10 to 20 years ahead.
Hospital management
There have been a number of developments in the organization and managementof DGHs over recent years. Under the 1991 reforms, hospitals became NHStrusts; that is, not-for-profit organizations within the NHS but outside the controlof the district health authority. Each trust was expected to generate incomethrough service contracts with purchasers and had to meet centrally specifiedfinancial objectives such as making a 6% return on its capital assets.
In many hospitals, this new financial regime led to new management systemscombining clinical and financial governance. As a result, clinical activity withina hospital is now typically organized in terms of ‘clinical directorates’. Eachdirectorate is headed by a clinical director, assisted by a nurse manager and abusiness manager, and is responsible for its own clinical and financial manage-ment. The hospital medical director who works alongside the chief executiveusually undertakes the overall management of clinical directorates.

65
United Kingdom
Health Care Systems in Transition
Despite its commitment to abolish the internal market, the present govern-ment has announced no plans radically to change trust status. Trusts appearlikely to remain independent organizations within the NHS. However, theemphasis on competition for service contracts has been replaced by arequirement to work collaboratively with health authorities and other trusts inthe design and implementation of health improvement programmes. The pre-vious emphasis on financial performance is being replaced. Instead a greateremphasis is being placed on the quality of care and health outcomes within anew system of clinical governance.
Private hospitals and clinics
There are about 230 independent medical/surgical hospitals in the UnitedKingdom (mid-1998) with operating theatres registered to take inpatientsaccording to Independent Healthcare Association (IHA) figures. The market isdominated by five main hospital chains: General Healthcare Group Ltd (ofwhich BMI Healthcare is a subsidiary), Nuffield Nursing Homes Trust Ltd(who operate Nuffield Hospitals), BUPA Hospitals Ltd, Community HospitalsGroup PLC. and PPP Columbia Healthcare Ltd. These alone own 61% of allindependent hospitals and have a combined share of 65% of the total numberof private beds in independent hospitals (see Table 13).
A number of independent hospitals opened in the early 1990s (see Table 14).Many of the more recent hospitals to have been built are on NHS sites. Sincethe decision by the Labour Government to proceed with a number of PFI projectsit is likely that most of the independent hospitals built in future will not befully equipped hospitals on independent sites but part of NHS hospital develop-ments.
It is noticeable that there has been some vertical integration between theinsurance function and hospital ownership in United Kingdom private healthcare market, with both PPP and BUPA heading up the league tables of privatehospital ownership and private health insurance (see Table 4).
One way for the major hospital groups to strengthen their market positionhas been through acquisitions and mergers. However the number of mergersand acquisitions has not accelerated in the 1990s due in part to the findings ofa report on private health care by the Monopolies and Mergers Commission,which stated that further mergers and integration would be against the publicinterest. Instead since 1996, two of the main insurers have established net-works of preferred providers.
The first network of this kind was launched by BUPA in May 1996 whichincluded 150 hospitals (the majority of which are operated by the main chains
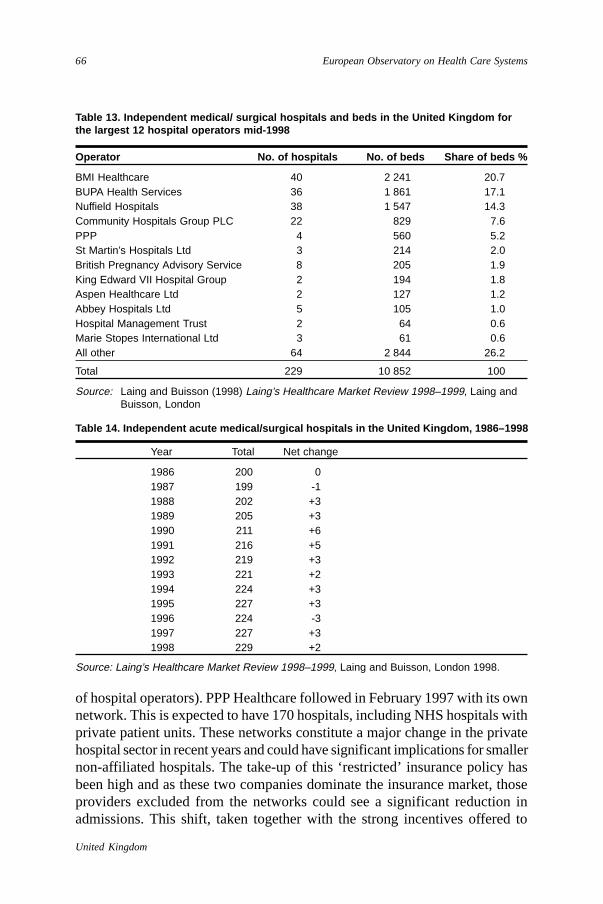
66
United Kingdom
European Observatory on Health Care Systems
of hospital operators). PPP Healthcare followed in February 1997 with its ownnetwork. This is expected to have 170 hospitals, including NHS hospitals withprivate patient units. These networks constitute a major change in the privatehospital sector in recent years and could have significant implications for smallernon-affiliated hospitals. The take-up of this ‘restricted’ insurance policy hasbeen high and as these two companies dominate the insurance market, thoseproviders excluded from the networks could see a significant reduction inadmissions. This shift, taken together with the strong incentives offered to
Year Total Net change
1986 200 01987 199 -11988 202 +31989 205 +31990 211 +61991 216 +51992 219 +31993 221 +21994 224 +31995 227 +31996 224 -31997 227 +31998 229 +2
Table 14. Independent acute medical/surgical hospitals in the United Kingdom, 1986–1998
Source: Laing’s Healthcare Market Review 1998–1999, Laing and Buisson, London 1998.
Table 13. Independent medical/ surgical hospitals and beds in the United Kingdom forthe largest 12 hospital operators mid-1998
Operator No. of hospitals No. of beds Share of beds %
BMI Healthcare 40 2 241 20.7BUPA Health Services 36 1 861 17.1Nuffield Hospitals 38 1 547 14.3Community Hospitals Group PLC 22 829 7.6PPP 4 560 5.2St Martin’s Hospitals Ltd 3 214 2.0British Pregnancy Advisory Service 8 205 1.9King Edward VII Hospital Group 2 194 1.8Aspen Healthcare Ltd 2 127 1.2Abbey Hospitals Ltd 5 105 1.0Hospital Management Trust 2 64 0.6Marie Stopes International Ltd 3 61 0.6All other 64 2 844 26.2
Total 229 10 852 100
Source: Laing and Buisson (1998) Laing’s Healthcare Market Review 1998–1999, Laing andBuisson, London

67
United Kingdom
Health Care Systems in Transition
private specialists and consultants to encourage them to refer their patients toa preferred provider, could result in independent hospital closures. By mid-1998,4000 of the 20 000 privately practising consultants had signed up to the BUPApartnership which may account for as much as 50% of all private work.
Table 15 indicates the estimated number of operations and procedures carriedout in independent hospitals in 1992/1993. It shows that abortions were thecommonest procedure (13.2%). Excluding abortions, most clinical activity wasfor elective surgery covering such procedures as cataract removals, hernia
Table 15. Estimated number of operations and procedures carried out in independenthospitals, inpatients and day cases
Main operation or procedure Residents of England and Wales Total no. %1981 1986 1992/1993 1992/1993 1992/1993
All known excludingabortion operations 206 920 381 605 557 451 572 104 84.3– All endoscopic examination 11 012 31 535 58 928 59 963 8.8– Other orthopaedic 16 537 35 353 57 134 58 227 8.6– Other ear nose and throat 12 811 24 789 31 784 31 880 4.7– Other gynaecological 6 629 11 071 31 069 31 492 4.6– Other skin subcutaneous 8 972 24 478 28 706 28 768 4.2– Dental extraction 7 344 14 504 21 587 21 655 3.2– Abdominal hernia repair 9 435 15 664 16 444 16 604 2.4– All hysterectomy 9 211 13 843 16 146 16 216 2.4– Lens operations 3 935 8 491 15 356 15 875 2.3– Ligation or stripping varicose veins 7 429 10 505 13 428 13 428 2.0– Arthroplasty 6 328 10 080 12 637 12 787 1.9– Tonsillectomy and adenoidectomy 9 229 12 115 13 092 13 031 1.9– Dilation and curettage 11 973 20 915 12 350 12 420 1.8– Plastic surgery 3 825 4 539 11 100 11 279 1.7– Major intra-abdominal 6 117 10 198 11 107 11 191 1.6– Other eye operations 3 086 6 125 8 896 9 902 1.5– Prostatectomy 2 803 4 585 9 756 9 802 1.4– Haemorrhoidectomy and other anal and peranal surgery 5 483 6 562 8 595 8 715 1.3– All other heart operations 234 2 902 6 379 7 604 1.1– Coronary artery bypass graft 374 929 3 809 6 463 1.0– Vasectomy 2 546 4 912 4 393 4 396 0.6– Circumcision 2 490 3 605 3 342 3 342 0.5– Appendicectomy 1 694 2 350 1 947 1 947 0.3– Division ligation occlusion of oviducts 4 035 2 819 1 827 1 925 0.3– All other operations and procedures 36 496 64 446 82 878 84 935 12.5– No operation or procedure 16 930 34 290 74 712 78 257 11.5Abortions 66 027 68 956 81 476 89 809 13.2Not known 2 805 11 106 16 423 16 789 2.5
Total 275 752 461 666 655 350 678 703 100
Source: T. Williams and J. Nicholl (1994) Patient Characteristics and clinical caseload of short- stay independent hospitals in England and Wales, 1992–1993, BMJ 308:1699–1701.
68
United Kingdom
European Observatory on Health Care Systems
repairs, hip replacements and stripping of varicose veins. Comparisons with1986 data do indicate, however, that there has been a substantial growth inrather more complex procedures, such as coronary artery bypass grafts andother heart operations, in recent years.
In addition to the large amount of acute health care, a small amount ofprivate health care was provided in NHS hospitals. For the most part, privateacute services are supplementary to NHS provision – offering shorter waitingtimes for procedures that are available through the NHS. In some cases, however,private provision has effectively replaced NHS provision because its scale isinsufficient to meet user needs, e.g. termination of pregnancies.
Numbers of hospital beds: some comparative data
As Fig. 12 shows, the United Kingdom had approximately 4.5 hospital bedsper 1000 population in the mid-1990s. This is one of the lowest levels in westernEurope and contrasts markedly with countries such as Norway (13.5), France(10.5) and Germany (10.2).
Fig. 13 provides some comparative data on hospital beds per 1000 populationfor selected countries over the period 1983–1995. It shows how all countrieshave been reducing their bed numbers over time, but that the rate of decline inthe United Kingdom has been greater than in both France and Germany.
Private beds
British for-profit companies dominate ownership of private hospital beds inthe private and independent sector (over 50% of the total). For-profit companiesown 65% of beds in the private sector. This figure is up from 41% in 1979.Charitable and religious groups own a significant proportion (34% of the totalnumber of beds).
The total numbers of beds in the independent sector has seen a declinesince 1995 when the total number peaked at 11 681. By 1998 there were 10 852beds, representing a reduction of 829 beds or 7.1%. This follows similar trendsin the NHS as a result of the shift towards day surgery and outpatient treatmentfor a number of complaints.
NHS amenity beds and private patient units
There are 3000 authorized amenity beds in the United Kingdom NHS, of whichthe majority (about 1600) are on ordinary NHS wards. Amenity beds refer tobeds that are available for the treatment of NHS patients for an extra chargeusually in a private room.

69
United Kingdom
Health Care Systems in Transition
Fig. 12. Hospital beds per 1000 population in western Europe, 1990 and latest availableyear
Source: WHO Regional Office for Europe health for all database (23).
2.4
3.9
4.6
4.6
5.7
5.7
5.8
5.7
12.4
5.8
6.7
6.2
8.5
8.1
8.9
10.2
11.5
11.4
12.2
11.7
11.7
14.4
2.5
3.7
4.1
4.3
4.5
4.7
5.1
5.5
5.6
5.8
6.1
6.1
7.3
7.3
8.7
9.2
9.3
10.2
10.5
10.8
11.0
13.5
0 2 4 6 8 10 12 14 16
Turkey
Ireland
Portugal
Spain
United Kingdom
Denmark
Netherlands
Greece
Sweden
Malta
Italy
Israel
EU average
Belgium
Switzerland
Austria
Finland
Germany
France
Iceland
Luxembourg
Norway
Latest year
1990
Hospital beds per 1000 population
1234567891234567891234567890123456712345678901234567

70
United Kingdom
European Observatory on Health Care Systems
NHS trusts can offer services and accomodation to private patients in whatare known as NHS pay beds. Consultants are authorized to use a certain numberof NHS bed days for private patients in a given year. Another NHS/privatepartnership is the use of dedicated private patient units, which are either entire
Fig. 13. Number of hospital beds per 1000 population in the United Kingdom andselected countries, 1983–1995
Source: WHO Regional Office for Europe health for all database (23)
YearHospitals beds
per 1000population
Admissions per100 population
Average length ofstay in days
1970 – 10.9 25.71975 – 11.6 22.91980 7.9 12.17 19.11985 7.1 13.45 15.81990 5.7 14.46 15.61991 5.4 14.81 14.11992 5.1 14.94 12.41993 4.8 15.20 10.01994 4.6 15.32 10.01995 4.5 15.86 9.91996 – 23.10 9.8
Source: WHO Regional Office for Europe health for all database (23).
Table 16. Inpatient facilities utilization and performance in the United Kingdom,1970–1996
4
6
8
10
12
14
16
1983 1985 1987 1989 1991 1993 1995 1997
France Germany Sweden United Kingdom EU average

71
United Kingdom
Health Care Systems in Transition
wards or wings in NHS hospitals that are dedicated to private patients. In mid-1998 there were 78 units of this sort with nearly 1400 beds.
Utilization and performance of hospitals
Table 16 presents some data on the utilization of inpatient facilities in theUnited Kingdom over the period 1970–1997. As well as the reduction in thenumber of beds per 1000 head of population, it shows how average lengths ofstay have fallen from over 25 days in 1970 to less than 10 days in 1996. (Itshould be borne in mind, however, that much of the large fall between 1970and 1985 resulted from the closure of long-stay institutions. Since then the fallhas continued but at a slower rate).
Table 17 provides the same utilization data as that presented in Table 16 forcountries in the WHO European Region for 1996 (or the latest year available).Comparing these kind of data across countries is hazardous because of thedifferent categories of inpatient care included in national definitions. However,the data do suggest that that admission rates and lengths of stay in the UnitedKingdom are towards the lower end of the distribution among western Europeancountries.
Social care
Social care in Britain is usually defined as long-term care in residential ornursing homes for people with mental illness, people with learning difficultiesand elderly people, together with a range of domiciliary services provided forpeople in their own homes. Responsibility for making sure that these servicesare provided is shared between local government, social services departmentsand the NHS. This joint responsibility has led to long-standing problems ofpoor coordination that current policy reforms are seeking to overcome (seebelow).
In common with many other countries, UK policy over the last 30 years hasfavoured ‘care in the community’ as an alternative to long-stay institutionalcare for people with mental illness or learning difficulties. As a result, nearly100 000 people have been discharged into the community between the 1960sand 1980s. Throughout this period, however, there have been concerns thatrates of discharge have exceeded the rate at which alternative services are be-ing provided in the community. In recent years, some highly publicized – butalso highly atypical – cases of violence involving discharged mental healthpatients have led to a reconsideration of some aspects of this policy.

72
United Kingdom
European Observatory on Health Care Systems
Table 17. Inpatient utilization and performance in the WHO European Region, 1997 orlatest available year
Country Hospital beds Admissions Average Occupancyper 1000 per 100 length of stay rate (%)
population population in days
Western EuropeAustria 9.2a 25.1a 10.5a 75.1a
Belgium 7.3a 20.0a 11.3a 81.4b
Denmark 4.7a 19.8b 7.3a 79.1b
Finland 9.3b 26.7 11.0 74.0France 10.5a 22.8b 11.2a 75.0Germany 10.2 – 14.3a 79.8a
Greece 5.5a 15.0b 8.2a –Iceland 10.8e 28.0c 16.8e 70.3h
Ireland 3.7a 15.1a 7.5a 82.3a
Israel 6.1 19.0 13.0 93.0Italy 6.1a 17.5a 9.4a 77.4a
Luxembourg 11.0c 19.4c 15.3a 74.3c
Malta 5.8a – – –Netherlands 5.1 9.8 13.8 64.4Norway 13.5c 15.3a 9.9a 81.1a
Portugal 4.1 11.8 9.3 70.1Spain 4.3a 10.0a 11.0a 73.9c
Sweden 5.6a 18.0a 7.5a 81.9a
Switzerland 8.7f 15.0c 24.5h 77.7c
Turkey 2.5 6.9 6.1 57.7United Kingdom 4.5b 23.1a 9.8a 76.2i
CCEEAlbania 3.0 7.7 7.9 –Bosnia and Herzegovina 4.5f 8.9f 13.3f 70.9f
Bulgaria 10.3 17.5a 12.9 64.1a
Croatia 6.0 14.9 12.9 89.3Czech Republic 8.8 20.2 12.3 71.8Estonia 7.4 18.3 10.9 71.4Hungary 8.3 23.7 11.0 74.4a
Latvia 9.7 21.7 12.9 –Lithuania 9.8 21.8 12.9 –Poland 6.2a 11.6b 10.4 –Romania 7.4 20.9 10.0 –Slovakia 8.3 19.9 12.1 78.5Slovenia 5.7 16.2 10.0 77.7The former Yugoslav Republic of Macedonia 5.2 10.0 13.4 63.9NISArmenia 6.8 6.7 13.9 36.1Azerbaijan 9.6 5.8 17.5 –Belarus 12.4 26.1 15.5 88.7c
Georgia 4.5 4.3 10.5 26.8c
Kazakhstan 8.4 15.1 16.5 80.8Kyrgyzstan 8.3 17.5 14.5 83.6Republic of Moldova 11.3 18.7 18.0 80.0Russian Federation 11.4 20.6 16.6 87.7Tajikistan 7.0 11.0 15.0 59.9Turkmenistan 7.1 13.0 13.4 72.1Ukraine 9.4 19.1 16.2 85.2Uzbekistan 6.4 15.8 13.8 –
Source: WHO Regional Office for Europe health for all database.Note: a 1996, b 1995, c 1994, d 1993, e 1992, f 1991, g 1990, h 1989, i 1986.

73
United Kingdom
Health Care Systems in Transition
Informal carers look after those who are sick, disabled, vulnerable or frail.Britain has an estimated 5.7 million carers and one in six households – 17% –contains a carer. Of the estimated 5.7 million carers, 1.7 devote at least 20 hoursa week to caring. Of those, 855 000 care for 50 hours or more. Most caring isbased on close personal relationships.
Another key feature of government policy in the 1980s and early 1990s wasthe encouragement of the private long-term care sector. This was part of thegeneral preference of the government of that time for private provision overpublic sector provision, wherever feasible. For example, in the case of long-term care places for elderly people, between 1980 and 1994 the number ofplaces in private residential homes rose from just under 36 000 to over 164 000.The number of places in local authority residential homes fell from approxi-mately 114 000 to under 69 000.
As was pointed out in the section on Complementary sources of finance,much of this growth in private sector residential care was fuelled by publicly-funded, social security payments. This was, of course, at variance with thethrust of ‘care in the community’ which favoured care at home rather thaninstitutional care. In 1986 Sir Roy Griffiths, a policy adviser of the PrimeMinister Margaret Thatcher, was invited to examine the issue. His report, pub-lished in 1988, formed the basis of the community component of the NHS andCommunity Care Act 1990 and its main elements were implemented in April1993. The Griffiths proposals continue to form the basis of community carepolicy in the United Kingdom today.
Under this policy, local government social service departments are respon-sible for identifying needs, setting priorities and developing plans. At theindividual level, case managers assess individuals and make sure that appropriatepackages of care are provided. These packages will typically involve both domi-ciliary care and residential care sometimes publicly, but increasingly privately,provided. Between 1992 and 1995, for example, the proportion of home-carecontact hours provided by independent contractors rose from 2% to 29%.
To overcome the perverse incentives for residential care presented throughthe social security system prior to 1993, central government transferred moniesfrom social security to local authorities to be spent on care packages. In somecases, this is used to fund residential care where the case manager deems itnecessary and the patient is eligible for public funding. However, particularlyin the case of elderly people, private funding is becoming increasingly necessary.At the present time, anyone with assets of £16 000 or more (including theirequity holding in their home) is not eligible for assistance through publicfunding. As was pointed out in the section on Complementary sources of finance,this requirement has led to widespread concern about elderly people having to
74
United Kingdom
European Observatory on Health Care Systems
sell their homes to fund long-term care and was the subject of a recentinvestigation by a Royal Commission which reported in early 1999.
Other current policy developments in relation to social care allow the NHSand all health-related aspects of local government – not just social services –to delegate commissioning and providing functions to one another and poolbudgets. These powers are designed to enable organizations to work togetherin the best interests of users and look more carefully at the mix of professionalsproviding services. Additionally, changes are being made to existing legislationgoverning transfers of money from the NHS to local government. The NHScan already transfer money to local authorities for a limited range of mainlysocial service functions. This power has been expanded and a new reciprocalpower introduced for local authorities to transfer funds to the NHS where sucha transfer will better meet the objectives of the local authority. All these newpowers will be available from April 2000.
Ensuring adequate quality standards in social care, especially in the case ofresidential care, has been a long-standing concern. With the provision of care(for often vulnerable people) distributed among thousands of different sites,this is clearly a complex task. Periodic media reports have highlighted someworrying cases of poor standards and sometimes patient abuse. Legislationduring the 1990s has sought to strengthen mechanisms for monitoring andensuring satisfactory service standards. At the national level, the Social ServicesInspectorate within the Department of Health plays an important role in thenational monitoring and in-depth study of particular aspects of communitycare. At the local level, health authorities have been responsible for the inspec-tion of nursing homes, and local authorities for residential homes. However,under the government’s current proposals (included in the White Paper Modern-ising Social Services: Promoting Independence, Improving Protection, RaisingStandards (4)), independent agencies with across-the-board responsibilities willundertake the inspection of nursing homes, residential homes and domiciliarycare providers.
Human resources and training
Training
DoctorsThe education and training of doctors in the United Kingdom covers threerelated stages:
75
United Kingdom
Health Care Systems in Transition
(i) undergraduate medical education
(ii) postgraduate medical education
(iii) continuing medical education.
In England, students receive a five-year (or in some cases six-year) under-graduate education and training in medicine at one of 19 medical schools.These are part of the university system and are funded by the Higher EducationFunding Council.
The number of students entering medical schools in the United Kingdomgrew steadily from 4311 in 1990 to 5091 in 1998. There are currently plans toexpand the number of places for medical students by about 1000 places perannum by 2005. In England there will be expansion at some of the existing19 medical schools and at least three new centres of medical education. Thereare currently four medical schools in Scotland, one in Wales and one in NorthernIreland.
On completion of their undergraduate training, students enter a pre-registration year during which they have provisional registration with theGeneral Medical Council (GMC) that allows them to practice in hospitals andprimary care as pre-registration house officers under supervision. The pre-registration year is the final part of basic medical training and is overseen bythe medical school.
After successfully completing one year’s training as a house officer, a doctoris eligible to apply for full registration with the GMC. Inclusion on the GMC’smedical register is necessary to work in the NHS as a doctor and enables doctorsto, for example, prescribe drugs and complete medical certificates.
The subsequent career progression of a hospital doctor would generallyfollow the path of:
• Senior house officer (minimum three to five years but often longer) under-going general professional and basic specialist training;
• Specialist registrar (four to five years) undergoing specialist training;
• Consultant specialist in the specialty of choice. This is the career grade anddoctors should expect to reach this point in their mid-thirties.
Doctors entering general practice follow a different path. After their pre-registration year as a house officer, (and possibly some experience as a seniorhouse officer), they must undertake three years of vocational training with atleast two years in hospital SHO posts and one year as a GP registrar. As a GPregistrar, they work and train in general practice with a recognized GP trainer.Upon successful completion of this period they will receive a certificate whichenables them to work in general practice, including as a GP principle.
76
United Kingdom
European Observatory on Health Care Systems
Doctors who have completed their formal medical training should continueto learn and develop through the concepts of continual professional develop-ment. This is central to ‘lifelong learning’ and underpins the key principle ofclinical governance. Under this system doctors take responsibility for the main-tenance and development of professional skills which will improve servicesavailable to NHS patients. This is designed to keep doctors up-to-date withdevelopments in their own area of practice.
NursesIn order to work as a qualified nurse in the United Kingdom, an individual hasto be registered with the United Kingdom Central Council for Nursing,Midwifery and Health Visiting (UKCC) and registration has to be renewedevery three years. In March 1998 there were 637 449 qualified nurses, midwivesand health visitors registered with the UKCC. This represents the pool fromwhich nursing staff are drawn, although not all nurses on the register arecurrently working in the United Kingdom.
The vast majority of nurses are employed by the NHS. In 1995, there were305 160 whole time equivalents (wte) employed by the service. This comparedwith 57 775 (wte) employed by independent hospitals and nursing homes. Inaddition, there were also 10 478 (wte) working as GP practice nurses. Whenexpressed in terms of the total number of individuals working as nurses, eitherfull- or part-time, these figures amount to over half a million. With 90% ofnurses being female, nursing represents the largest source of professionalemployment for women in the United Kingdom.
The number of nurses employed directly by the NHS has remained fairlystatic since the late 1980s, whereas the number working in the independentsector has grown threefold and the number working as GP practice nurses byfourfold.
Nursing retention and turnover was a major problem during the 1980s. Eachyear approximately one in ten nurses left the workforce and two thirds of thesenever returned. The reduction in alternative employment opportunities associ-ated with economic recession in the late 1980s and early 1990s relieved someof the pressure, but wastage and vacancy rates have once again risen in the late1990s. Currently, nursing shortages are seen as a major problem. The scale ofthis shortage is estimated at between 8000 and 12 000 nurses. In an attempt toaddress this problem, the Secretary of State for Health has recently announceda new salary structure for nurses with a significant increase in the startingsalary. A campaign has also been launched to persuade those who have leftnursing to return to the profession.
The system of nurse education and training in the United Kingdom wastransformed by the implementation of a new policy in 1988. This was based
77
United Kingdom
Health Care Systems in Transition
largely upon the UKCC’s recommendations for the reform of nursing education.The new approach represents a full-scale reorientation of nurse education, awayfrom on-the-job training to full-time study in colleges of further and highereducation. Under this system, students are counted as supernumerary to servicestaffing requirements while acquiring on-the-job experience and their appliedwork is designed to be closely linked to course-based learning.
In July 1999, the Secretary of State for Health launched a new strategy,Making a Difference for Nurses, Midwives and Health Visitors. The new strategyis designed to increase the supply of nurses, midwives and health visitors byimproving their career prospects. It will allow training to be spread over morethan three years by incorporating ‘take-a-break’ periods, introduce new path-ways into nursing via national vocational qualifications, and create new postsof nurse consultants who will take on senior roles while devoting at least halfof their time to direct patient care for example.
Professions Allied to Medicine (PAMs)The Council for Professions Supplementary to Medicine is responsible forregistering practitioners, approving training courses and carrying outdisciplinary functions for the following professions: art, music and dramatherapy, chiropody/podiatry, dietetics, medical laboratory scientific officers,occupational therapy, orthoptics, orthotics and prosthetics, physiotherapy,radiography, speech and language therapy, paramedics and clinical scientists.
At September 1998 there were 103 540 scientific, therapeutic and technicalstaff, 14% of the total NHS Hospital and Community Health Services staff.This group includes a wide range of areas of work, the main components ofwhich were 14 550 (14%) physiotherapy staff, 12 080 (12%) occupationaltherapy staff and 11 290 (11%) radiography staff.
A greater focus on rehabilitation is increasing demand for physiotherapyand occupational therapy services. Investment in PAMs training continues toincrease and the professions remain a popular choice with students. In the lastfive years, the number of training places of occupational therapists has grownby 41% and for physiotherapists by 45%. Ways of widening access into theseprofessions and encouraging applications from those employed in the NHSwho wish to pursue a professional career are being considered.
DentistsDentists are required to complete five years’ dental school training beforepractising as a dentist. However those wanting to go into general practice mustalso do a period of vocational training. There are a number of areas of dentalspecialty for which further training is required, e.g. oral surgery, orthodontics,restorative dentistry, dental public health, paediatric dentistry and others. The

78
United Kingdom
European Observatory on Health Care Systems
Fig.15. Number of nurses per 1000 population in the United Kingdom and selectedcountries, 1980–1995
Source: WHO Regional Office for Europe health for all database (23).
Fig.14. Number of doctors per 1000 population in the United Kingdom and selectedcountries, 1980–1996
Source: WHO Regional Office for Europe health for all database (23).
2
3
4
5
6
7
8
9
10
11
12
1980 1982 1984 1986 1988 1990 1992 1994 1996
Num
ber o
f nur
ses
per 1
000
popu
latio
n
United Kingdom* France Germany Sweden EU average
1
1.5
2
2.5
3
3.5
4
1980 1982 1984 1986 1988 1990 1992 1994 1996
United Kingdom France Germany Sweden EU average

79
United Kingdom
Health Care Systems in Transition
Source: WHO Regional Office for Europe health for all database (23).
Number per 1000 population
Fig. 16. Number of physicians and nurses per 1000 population in the WHO EuropeanRegion, 1998 or latest available year
UkraineBelarus
Russian FederationGeorgia
AzerbaijanRepublic of Moldova
KazakhstanArmenia
UzbekistanKyrgyzstan
TurkmenistanTajikistan
LithuaniaHungaryBulgaria
Czech RepublicEstonia
Slovakia (1996)Latvia
Poland (1997)Croatia
The former Yugoslav Republic of MacedoniaSloveniaRomania
Bosnia and Herzegovina (1992)Albania
ItalySpain (1997)
NorwayGreece (1996)
IsraelBelgium
Germany (1997)Switzerland (1996)
Sweden (1997)Portugal
FranceIceland (1995)
FinlandDenmark (1995)
AustriaNetherlands (1991)
Malta (1994)Luxembourg (1997)
Ireland (1997)United Kingdom (1994)
Turkey (1997)
1.9
3.0
3.1
3.1
3.2
3.3
3.5
3.8
4.0
4.2
4.4
1.3
1.6
1.8
2.2
2.2
2.3
2.4
2.9
3.0
3.1
3.1
3.4
3.5
4.0
1.1
1.6
2.1
2.3
2.5
2.5
2.9
2.9
3.0
3.0
3.0
3.1
3.1
3.2
3.4
3.9
3.9
3.9
4.1
4.2
5.5
5.2
5.9
7.9
10.1
5.0
6.7
9.0
8.4
4.5
8.3
11.5
11.0
3.7
4.7
4.1
6.7
5.3
4.6
5.3
5.6
7.1
6.3
8.9
5.7
3.7
9.0
1.0
5.0
15.8
7.3
11.0
9.0
5.2
7.2
21.5
13.6
5.0
3.7
9.7
7.8
9.0
10.8
6.7
2.6
17.9
4.5
3.0
4.5
0 5 10 15 20 25
PhysiciansNurses

80
United Kingdom
European Observatory on Health Care Systems
majority of whom work as consultants in hospitals (with the exception of pub-lic health dentists who work for health authorities). Those who wish to work ashospital dentists pursue a progression through hospital training grades (i.e.house officer, senior house officer, etc.) similar to that of doctors. There are anumber of auxiliary positions including, dental hygienist, dental therapist, dentaltechnician and oral health educator.
Human resources
The main employer of doctors in the United Kingdom is the NHS. Table 18shows that in 1996 there were 102 610 doctors employed by the NHS or, in thecase of GPs, holding contracts with it. This total comprised 19 940 UK-trainedhospital consultants (together with 3740 consultants from overseas) and 27 490UK-trained GP principals (together with 5700 trained overseas).
Fig. 15 presents some comparative WHO data on the number of nurses per1000 population for the United Kingdom and selected countries over the period1970–1995. These data suggest that the UK ratio of nurses-to-population grewover the period 1980–1990 but has, thereafter, remained fairly static. The ratiois currently below that found in Germany and Sweden, and the EU average,but above that found in France (in 1992). The UK figure also appears to be farmore stable over time than those for other countries.
Fig. 16 provides comparative data on the number of doctors and nurses per1000 population in the WHO European Region for 1998 (or the latest yearavailable). It shows that the doctor-to-population ratio is the second lowest inwestern Europe. According to the 1998 NHS Executive census of the hospitalworkforce there were 1.21 hospital doctors of all grades per 1000 populationin England. This figure does not include the number of GPs in the UnitedKingdom.
The low international ranking of the UK nurse-to-population ratio is notquite so evident, but the United Kingdom is still in the lowest one third inwestern Europe.
Table 19 presents some data on the number of health care personnel inrelation to the population, in the United Kingdom, over the period 1980–1996(or the latest year available). It shows how the numbers of active physiciansper 1000 population rose slightly over the period; how the number of activedentists and pharmacists per 1000 population remained constant; and how thenumber of certified nurses rose from 3.5 per 1000 to 5.2 per 1000 between1980 and 1990, remained constant and then fell slightly between 1990 and1995, but then fell to 4.5 per 1000 population in 1996.
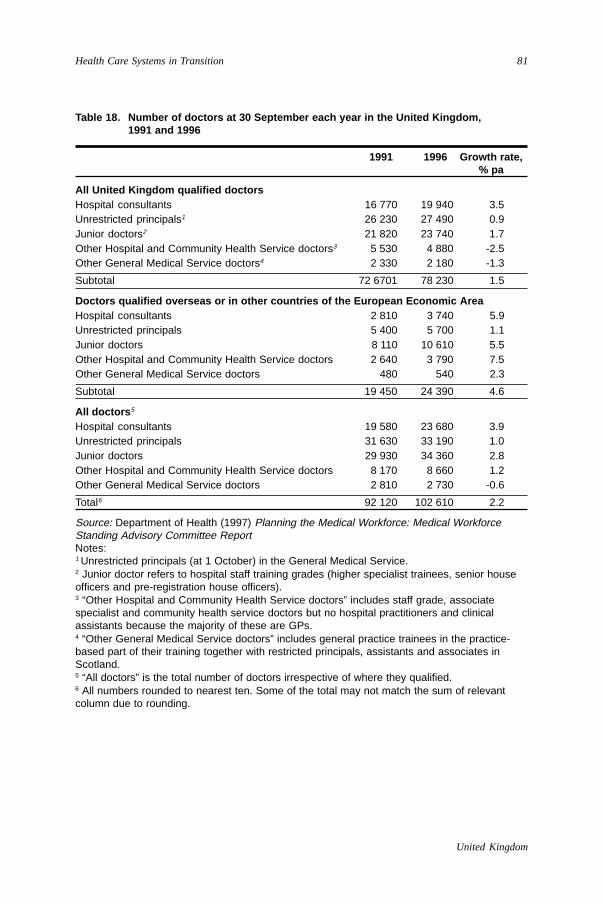
81
United Kingdom
Health Care Systems in Transition
Table 18. Number of doctors at 30 September each year in the United Kingdom,1991 and 1996
1991 1996 Growth rate,% pa
All United Kingdom qualified doctorsHospital consultants 16 770 19 940 3.5Unrestricted principals1 26 230 27 490 0.9Junior doctors2 21 820 23 740 1.7Other Hospital and Community Health Service doctors3 5 530 4 880 -2.5Other General Medical Service doctors4 2 330 2 180 -1.3
Subtotal 72 6701 78 230 1.5
Doctors qualified overseas or in other countries of the European Economic AreaHospital consultants 2 810 3 740 5.9Unrestricted principals 5 400 5 700 1.1Junior doctors 8 110 10 610 5.5Other Hospital and Community Health Service doctors 2 640 3 790 7.5Other General Medical Service doctors 480 540 2.3
Subtotal 19 450 24 390 4.6
All doctors 5
Hospital consultants 19 580 23 680 3.9Unrestricted principals 31 630 33 190 1.0Junior doctors 29 930 34 360 2.8Other Hospital and Community Health Service doctors 8 170 8 660 1.2Other General Medical Service doctors 2 810 2 730 -0.6
Total6 92 120 102 610 2.2
Source: Department of Health (1997) Planning the Medical Workforce: Medical WorkforceStanding Advisory Committee ReportNotes:1 Unrestricted principals (at 1 October) in the General Medical Service.2 Junior doctor refers to hospital staff training grades (higher specialist trainees, senior houseofficers and pre-registration house officers).3 “Other Hospital and Community Health Service doctors” includes staff grade, associatespecialist and community health service doctors but no hospital practitioners and clinicalassistants because the majority of these are GPs.4 “Other General Medical Service doctors” includes general practice trainees in the practice-based part of their training together with restricted principals, assistants and associates inScotland.5 “All doctors” is the total number of doctors irrespective of where they qualified.6 All numbers rounded to nearest ten. Some of the total may not match the sum of relevantcolumn due to rounding.
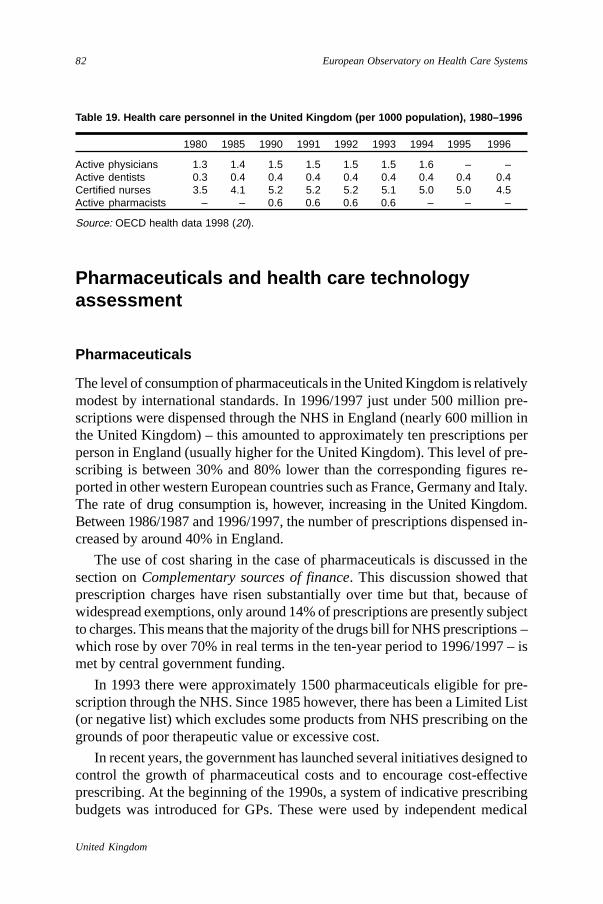
82
United Kingdom
European Observatory on Health Care Systems
Pharmaceuticals and health care technologyassessment
Pharmaceuticals
The level of consumption of pharmaceuticals in the United Kingdom is relativelymodest by international standards. In 1996/1997 just under 500 million pre-scriptions were dispensed through the NHS in England (nearly 600 million inthe United Kingdom) – this amounted to approximately ten prescriptions perperson in England (usually higher for the United Kingdom). This level of pre-scribing is between 30% and 80% lower than the corresponding figures re-ported in other western European countries such as France, Germany and Italy.The rate of drug consumption is, however, increasing in the United Kingdom.Between 1986/1987 and 1996/1997, the number of prescriptions dispensed in-creased by around 40% in England.
The use of cost sharing in the case of pharmaceuticals is discussed in thesection on Complementary sources of finance. This discussion showed thatprescription charges have risen substantially over time but that, because ofwidespread exemptions, only around 14% of prescriptions are presently subjectto charges. This means that the majority of the drugs bill for NHS prescriptions –which rose by over 70% in real terms in the ten-year period to 1996/1997 – ismet by central government funding.
In 1993 there were approximately 1500 pharmaceuticals eligible for pre-scription through the NHS. Since 1985 however, there has been a Limited List(or negative list) which excludes some products from NHS prescribing on thegrounds of poor therapeutic value or excessive cost.
In recent years, the government has launched several initiatives designed tocontrol the growth of pharmaceutical costs and to encourage cost-effectiveprescribing. At the beginning of the 1990s, a system of indicative prescribingbudgets was introduced for GPs. These were used by independent medical
Table 19. Health care personnel in the United Kingdom (per 1000 population), 1980–1996
1980 1985 1990 1991 1992 1993 1994 1995 1996
Active physicians 1.3 1.4 1.5 1.5 1.5 1.5 1.6 – –Active dentists 0.3 0.4 0.4 0.4 0.4 0.4 0.4 0.4 0.4Certified nurses 3.5 4.1 5.2 5.2 5.2 5.1 5.0 5.0 4.5Active pharmacists – – 0.6 0.6 0.6 0.6 – – –
Source: OECD health data 1998 (20).
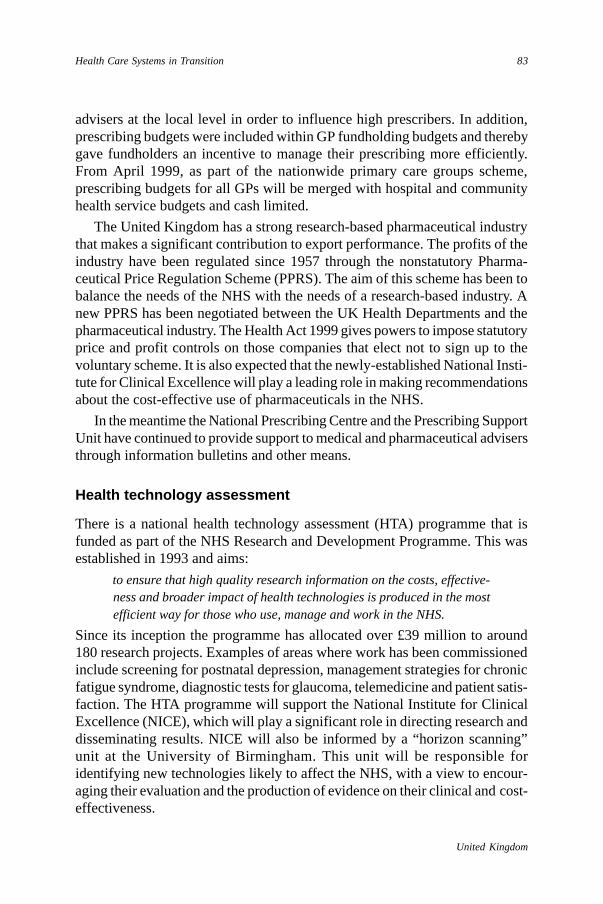
83
United Kingdom
Health Care Systems in Transition
advisers at the local level in order to influence high prescribers. In addition,prescribing budgets were included within GP fundholding budgets and therebygave fundholders an incentive to manage their prescribing more efficiently.From April 1999, as part of the nationwide primary care groups scheme,prescribing budgets for all GPs will be merged with hospital and communityhealth service budgets and cash limited.
The United Kingdom has a strong research-based pharmaceutical industrythat makes a significant contribution to export performance. The profits of theindustry have been regulated since 1957 through the nonstatutory Pharma-ceutical Price Regulation Scheme (PPRS). The aim of this scheme has been tobalance the needs of the NHS with the needs of a research-based industry. Anew PPRS has been negotiated between the UK Health Departments and thepharmaceutical industry. The Health Act 1999 gives powers to impose statutoryprice and profit controls on those companies that elect not to sign up to thevoluntary scheme. It is also expected that the newly-established National Insti-tute for Clinical Excellence will play a leading role in making recommendationsabout the cost-effective use of pharmaceuticals in the NHS.
In the meantime the National Prescribing Centre and the Prescribing SupportUnit have continued to provide support to medical and pharmaceutical advisersthrough information bulletins and other means.
Health technology assessment
There is a national health technology assessment (HTA) programme that isfunded as part of the NHS Research and Development Programme. This wasestablished in 1993 and aims:
to ensure that high quality research information on the costs, effective-ness and broader impact of health technologies is produced in the mostefficient way for those who use, manage and work in the NHS.
Since its inception the programme has allocated over £39 million to around180 research projects. Examples of areas where work has been commissionedinclude screening for postnatal depression, management strategies for chronicfatigue syndrome, diagnostic tests for glaucoma, telemedicine and patient satis-faction. The HTA programme will support the National Institute for ClinicalExcellence (NICE), which will play a significant role in directing research anddisseminating results. NICE will also be informed by a “horizon scanning”unit at the University of Birmingham. This unit will be responsible foridentifying new technologies likely to affect the NHS, with a view to encour-aging their evaluation and the production of evidence on their clinical and cost-effectiveness.

84
United Kingdom
European Observatory on Health Care Systems

85
United Kingdom
Health Care Systems in Transition
Financial resource allocation
Third-party budget setting and resource allocation
The NHS budget
The budget for the NHS is set annually as part of the overall publicexpenditure planning process. As was described in the section Mainsystem of finance and coverage, until recently ministers from spending
departments submitted expenditure bids for the next financial year to theTreasury. Following a process of consultation and negotiation, TreasuryMinisters determined the spending totals for each department. While this wasan extremely effective method of short-term expenditure control, the arrange-ment has been criticized because it inhibits longer-term expenditure planning.Last year, for the first time, spending totals for the following three years wereannounced. This decision followed the results of a wide-ranging, comprehen-sive spending review which looked at numerous aspects of public expenditureand its planning.
Once the overall budget has been announced, the Department of Healthdetermines the breakdown of the allocation between the two main health sectors:namely, ‘hospital and community health services’ and ‘family health services’.The former, as the name implies, covers acute and community hospital services,while the latter covers primary care. (Note: the Department of Health allocationsrelate to England; separate allocations take place in Scotland, Wales andNorthern Ireland. Also it is worth noting that several current policy initiativesare blurring the distinction between budgets for secondary and primary care,through the development of integrated budgets.)
Hospital and community health service budgetsFollowing the determination of the total budget for hospital and communityhealth services, the allocation to regional health authorities is made. The current

86
United Kingdom
European Observatory on Health Care Systems
weighted capitation approach to regional allocations dates from the 1976Resource Allocation Working Group (RAWP) report. This Group produced aformula for allocating budgets to regions based upon their population size,their composition in terms of age and gender, their levels of morbidity (usingstandard mortality ratios as a proxy) and unavoidable geographical differencesin the costs of providing services.
The original RAWP formula indicated substantial discrepancies betweenregions in terms of the distance of their actual allocations from their targetallocations (based upon the formula). In particular, the regions surroundingLondon were shown to be substantially “over-funded” while those in the Northwere “under-funded”. Over the period 1977–1985, the RAWP formula wasused to reduce variations around target levels of spending and to produce agreater degree of interregional equity.
By 1985 the government decided that discrepancies around regional targetshad been largely eradicated and the RAWP formula required some fine tuning.Accordingly, a review of the formula was commissioned. As a result of thisreview, adjustments were made that mainly had the effect of reducing theimportance attached to differences in the needs-based element, that is thestandardized mortality ratios.
In 1990, in anticipation of the introduction of the internal market, the RAWPformula was replaced by an alternative weighted capitation formula althoughthe principles of the RAWP formula were retained. Yet another review, carriedout by a team from the University of York, reported in 1994. Their work –based upon the most sophisticated econometric modelling undertaken to date –differed from earlier approaches by incorporating a wider range of health statusand social factors in the needs-based element. Thus health status measuresincluded the incidence of limiting long-standing illness and low birth-weightbabies, while social factors included unemployment rates and the numbers oflone elderly households. While not all of the recommendations of the Yorkgroup were accepted by the government, their work forms the main basis ofthe current system for allocating funds to regions.
Allocations from regional health authorities to district health authoritieshave been based on a variety of approaches. Most regions use a variant of thenational allocation formula but tend to adjust it in the light of historic allocationsand local circumstances. During the 1990s the task of subregional allocationshas been made more complicated by the emergence of a plurality of purchasers.This has required allocations to be made not only to district health authoritiesbut also to GP fundholders and total purchasing pilot sites. While there hasbeen general agreement about the desirability of basing all of these allocationson weighted capitation formulae, reliable formulae for application in the case
87
United Kingdom
Health Care Systems in Transition
of small populations are not generally available. As such most allocations haverelied heavily on historic patterns of costs and activity.
Family health service budgetsAlthough the principle of weighted capitation funding is well established inrelation to hospital and community health services, no such approach has beendeveloped in relation to allocations between the family health servicesresponsible for funding primary care in different parts of the country. As aresult there are substantial variations in expenditure per head between familyhealth service areas. Moreover these variations do not seem to reflect needs-based, hospital and community health service variations.
In the future, the formation of primary care groups can be expected to leadto greater consistency in the funding of primary care as formulae are developedfor budgetary allocations. In the short term, however, it is expected that mostPCGs will have funds allocated to them by health authorities on the basis ofpatterns of activity and cost.
Fig. 17 illustrates the flow of funds within the United Kingdom health systemas at 1 April 1999. However, as the new system of organization and funding isfurther implemented, this model will change. For example, it is anticipatedthat PCGs may develop into primary care trusts in future and directly employhealth personnel.
Payment of hospitals
The methods used for paying hospitals are currently under reform. In this sectionwe describe the major move to a contracting system which took place in the1990s – a move that is currently being revised.
Under the provisions of the 1991 reforms a contracting system was intro-duced through which funds were transferred from purchasers (i.e. district healthauthorities and GP fundholders) to hospitals and other providers. Contractsspecify what services are to be provided and the terms on which they are to besupplied. Initially, there were three types of contract: namely, block contracts,cost-and-volume contracts and cost-per-case contracts.
Block contracts specified access by DHA residents to a range of services inreturn for a defined sum of money. Such contracts often included some form ofindicative workload agreement. The lack of information for more detailedcontracting was seen as justifying block contracts which gave hospitals aguaranteed sum of money in return for a broad service agreement. They were seenprimarily as a mechanism for establishing a new system of hospital financing.
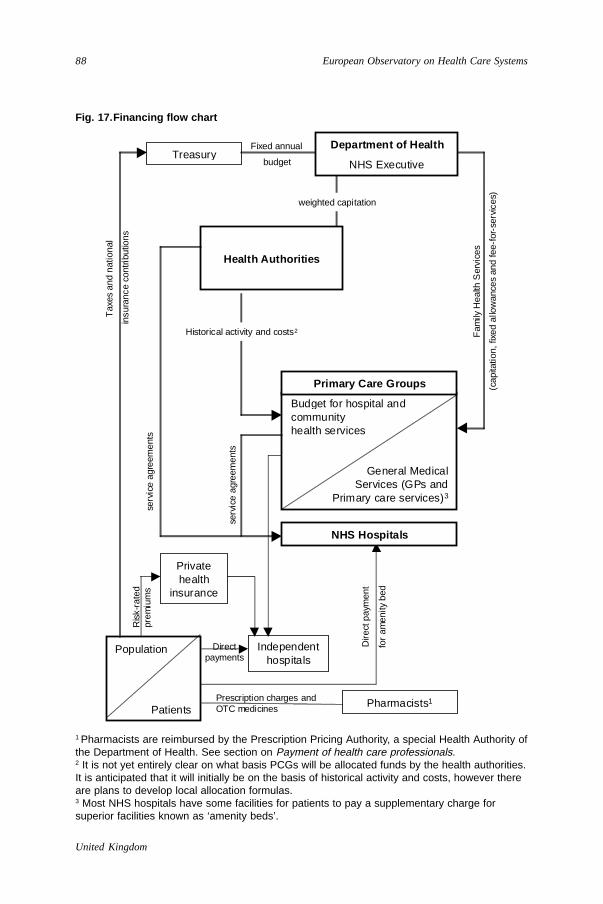
88
United Kingdom
European Observatory on Health Care Systems
Fig. 17.Financing flow chart
Ris
k-ra
ted
prem
ium
sTreasury
Pharmacists1
Independenthospitals
Budget for hospital andcommunityhealth services
General MedicalServices (GPs and
Primary care services)3
Population
Patients
Tax
es a
nd n
atio
nal
insu
ranc
e co
ntrib
utio
ns
Prescription charges andOTC medicines
Directpayments
Fixed annual
budget
serv
ice
agre
emen
ts
Fam
ily H
ealth
Ser
vice
s
(cap
itatio
n, fi
xed
allo
wan
ces
and
fee-
for-
serv
ices
)
Health Authorities
Primary Care Groups
NHS Hospitals
weighted capitation
Privatehealth
insurance
Dire
ct p
aym
ent
for
amen
ity b
ed
serv
ice
agre
emen
ts
Historical activity and costs2
Department of Health
NHS Executive
1 Pharmacists are reimbursed by the Prescription Pricing Authority, a special Health Authority ofthe Department of Health. See section on Payment of health care professionals.2 It is not yet entirely clear on what basis PCGs will be allocated funds by the health authorities.It is anticipated that it will initially be on the basis of historical activity and costs, however thereare plans to develop local allocation formulas.3 Most NHS hospitals have some facilities for patients to pay a supplementary charge forsuperior facilities known as ‘amenity beds’.
89
United Kingdom
Health Care Systems in Transition
Cost-and-volume contracts specified that a provider would supply a givennumber of treatments or cases at an agreed price. They allowed service specifi-cations to be made more specific than was generally the case with block con-tracts. Greater emphasis was placed upon services defined in terms of ‘outputs’(i.e. patients treated) rather than in terms of ‘inputs’ (i.e. facilities provided). Ifthe number of cases exceeded the cost-and-volume agreement, extra cases wereoften paid for on a cost-per-case basis.
Cost-per-case contracts were defined at the level of the individual patient.Thus activity and expenditure were linked explicitly. Because they involved aconsiderable level of transaction costs, health authorities have tended to usecost-per-case contracts as a residual category in order to fund treatments thatfall outside their block and cost-and-volume contracts. These have coveredreferrals of patients to hospitals with whom the health authority does not havea prospective contract, so-called ‘extra contractual referrals’. Many servicesbought by GP fundholders have also been based on cost-per-case contracts.
The initial expectation of this contracting system was that, as it becamemore refined, there would be a movement from block contracts to cost-and-volume and/or cost-per-case contracts. In practice however, a new form ofcontract emerged which has been described as a ‘sophisticated block’ contract.These typically involve a purchaser paying a hospital an agreed contract sumfor access to a defined range of services or facilities. However, indicative patientactivity targets or thresholds with ‘floors’ and ‘ceilings’ will also be includedin the contract together with agreed mechanisms for further action if actualactivity falls outside the specified range between the floor and the ceiling. Thisaction could include additional work on data validation or further negotiation.
A survey of district health authorities for the year 1994/1995 indicated that69% of their main contracts with acute hospitals were in the form of sophisti-cated block contracts, 25% were cost-and-volume and 5% cost-per-case.
The actual sums of money agreed in these contracts have been based on avariety of approaches. Historic evidence on the sums of money necessary tofund a defined level of activity played a large part in the specification of earlyblock contracts. Over time, considerable effort has been devoted to refininghospital costing practices so that contract prices can reflect the costs of particularepisodes of treatment more accurately. As part of this effort the NHS Case MixOffice has been developing a series of ‘health related groups’ – these are a UKequivalent of US diagnosis-related groups (DRGs). At the same time, thedevelopment of a market-based system meant that the negotiating skill andpower of particular purchasers and providers also played a part in determiningthe sums of money received by hospitals.

90
United Kingdom
European Observatory on Health Care Systems
In terms of the analytical categories used to classify hospital paymentssystems in international studies, the NHS contract system can be described asa mix involving global budgets with elements of cost-per-case payments. Insome of the more sophisticated arrangements there have also been paymentsrelated to length of stay.
The contracting system introduced in 1991 was part of a wider move on thepart of the government of that time to move from a system based on hierarchiesto one based on contractual relationships. It represented a major cultural shiftfor the NHS and meant that considerable amounts of management time havebeen devoted to the annual tasks of writing, executing and monitoring contracts.The present government believes that management costs associated with thecontracting process have not been justified and is in the process of replacing itwith a system based on longer-term service agreements. This approach willretain the distinction between commissioners (purchasers) and providers butwill aim to reduce transaction costs by using three-year agreements. It is alsoaimed at shifting the focus from an emphasis on cost and activity levels to onebased on the quality of care. The new performance assessment framework,discussed previously, is part of this shift in emphasis.
Payment of health care professionals
Doctors
Separate payments systems apply in the case of general practitioners and hospitaldoctors.
General practitioners (GPs)General practitioners contract with the NHS to provide general medical services.The terms of this contract are negotiated nationally between the General MedicalServices Committee – the GPs representation within the British Medical Associ-ation – and the Department of Health. The actual payment system set out in thenational contract is a mix of fixed allowances, capitation fees and fees for anumber of specific services.
GPs are independent self-employed contractors to the NHS who providegeneral medical services (GMS). The arrangement is a statutory one, and theterms of service (TOS) and the fees and allowances payable are determined bySecretary of State following consultations with the profession’s representatives –the General Practitioners Committee (GPC) – the GPs representation withinthe British Medical Association.
91
United Kingdom
Health Care Systems in Transition
The GP remuneration systemGPs are paid by the NHS as independent, self-employed professionals under a“cost plus” principle. The payments they receive cover both their expenses(the “cost”) in providing GMS and a net income for doing so (the “plus”). Thislevel of income is reviewed annually by the Doctors’ and Dentists’ Review Body(DDRB) who then make recommendations for decision by the Government.
GPs do not, therefore, receive a salary but are paid through a system ofpayments designed to deliver a certain level of gross income for the averageGP. The basic elements of the current payment system are:
Capitation fees – annual fees payable for each patient registered on their listamounting to just over half of gross income from fees and allowances. Theyprovide an incentive for GPs to provide high quality services, therebyattracting and retaining patients.
Allowances – are the next largest single element of gross income from fees andallowances for the average GP. They include basic practice allowance, paidin recognition of the basic or standing costs incurred in setting up andmaintaining a practice.
Health promotion payments – comprise payments for running health promotionand chronic disease management programmes, and for achieving target levelsof coverage for childhood immunizations and cytology screening.
Item of service payments – paid every time a GP provides certain services,contraception services being an example. These payments are, by definition,workload sensitive.
Therefore for individual GPs the amount of income they derive from feesand allowances will depend on the number of registered patients on their list,whether or not they qualify for specific fees and allowances, the number, andlevel of activities undertaken and the performance achieved.
The introduction of GP fundholding, and subsequent variants such as totalpurchasing, did not affect the ways in which GPs received their personalincomes. Fundholding budgets were for the purchase of hospital and communityservices and could not be used to supplement GP incomes. The financialincentives offered by this scheme were in the form of control over budgets tobe spent on patient care and not in the form of personal financial incentives.
Personal Medical Services (PMS) pilotsFrom 1 April 1998, under the provisions of the NHS (Primary Care) Act 1997,a series of pilot sites were established which gave health authorities the powerto contract directly with GPs on a local basis for the provision of services.They provide an alternative to the national GP contract, giving primary careprofessionals the opportunity to test different concepts for delivering GMS.

92
United Kingdom
European Observatory on Health Care Systems
These changes offer the opportunity for exploring potentially radical changesto the payments system for GPs. They not only permit local specification ofcontracts, including payments levels, but also allow for the pooling of budgetsfor purchasing hospital services and for GPs to be employed on a salariedbasis.
Primary Care Groups (PCGs) and Primary Care Trusts (PCTs)As pointed out earlier, all GPs were assigned to primary care groups in April1999 and some will join primary care trusts in April 2000. Membership ofPCGs and PCTs does not however affect the independent contractor status ofGPs who remain self-employed.
Hospital doctorsUnlike GPs hospital doctors are directly employed by the NHS on a salariedbasis. Their actual salary scales are determined by the government each yeartaking into account the recommendations of the Review Body on Doctors’ andDentists’ Remuneration. In addition to their NHS earnings, full-time NHSconsultants (i.e. senior specialists) are permitted to earn up to 10% of theirgross income from private practice. Those consultants who opt for maximumpart-time contracts are permitted to engage in private practice without restrictionon their earnings by giving up payment for one NHS session per week.
There has been extensive debate in the United Kingdom on the possibleperverse incentives offered to NHS consultants by the combination of privateand NHS earnings. In particular it has been claimed that private earnings mightreduce both the time available for and commitment to NHS work. However,despite the frequency of these claims, there is little hard evidence on the subject.
In addition to their basic payments, selected hospital consultants receivemerit awards, which are allocated by a peer review process. These merit awardsfall into different categories and can represent sizeable additions to basic NHSsalaries. The merit award system has come under some criticism recently forbeing too heavily based on research performance and for being too littleconcerned with medical performance. As a result the whole system is currentlyunder review.
Doctors are paid fee-for-service for private consultations and activity eitherdirectly by the patient who may then be reimbursed by a private insurancecompany if he/she is a policyholder, or by the private hospital/clinic at whichthe services are provided.
Private activity of doctorsIt has been estimated that there are 17 100 consultants providing privatespecialist services in the United Kingdom (1992). Full-time doctors in the NHS
93
United Kingdom
Health Care Systems in Transition
are allowed to practice privately. However, they are limited to earning 10% oftheir gross income from this source. Those NHS doctors on maximum part-time contracts are allowed to practice privately without restriction. In returnthey have to give up one eleventh of their NHS salary.
There is very little private activity in primary care. Only 3% of GPconsultations are estimated to be in the private sector according to self-reportingin the General Household Survey. There are about 200 exclusively private GPsin the United Kingdom mostly concentrated in London practices. The mainreasons for the lack of development in this area are that GPs are not allowedunder their contract to see patients on their NHS list privately or to issue NHSprescriptions and there are currently few insurance products to cover primarycare services. A growth in this area may occur depending on the success ofwalk-in clinics (see Private primary care in the section on Primary health careand public services). Other possibilities being experimented with are the sitingof general practices on private hospital sites and the provision of company-paid private GP services.
Dentists
On 31 March 1997, there were 19 209 dentists in the NHS General DentalService. These dentists undertake work for the NHS but may also undertakeprivate work. They are paid for their NHS work on the basis of a gross fee peritem of service. This fee is meant to cover their personal income and associatedcosts. Fee relativities between different services are designed to reflect thetime taken and the direct costs involved.
The Doctors’ and Dentists’ Pay Review Body is responsible for collectingevidence and for making recommendations to the government each year foradjustments to fee schedules. In recent years there have been moves to influencethe mix of services offered (e.g. more preventative work, more emphasis onservices for children) through adjustments to fee relativities.
Because of dissatisfaction with NHS fee levels many dentists are increasingthe amount of private work that they undertake. The British Dental Associationclaims that on average just over 14% of a dentist’s income came from privatework in 1994/1995 and that this share is increasing over time at the expense ofNHS work.
Community pharmacists
Community pharmacists submit NHS prescriptions to the Pharmaceutical PricingAuthority (PPA), a special health authority established by the Department of

94
United Kingdom
European Observatory on Health Care Systems
Health. They are paid by way of a flat fee, about 95 pence per item for mostprescriptions they dispense. In addition, pharmacies that dispense more than1600 items a month are eligible for a professional allowance worth around£17 000 a year. Pharmacies dispensing between 1100 and 1600 prescriptions amonth receive a proportionately lower professional allowance. Pharmacies thatdo not get the full (or any) professional allowance qualify for subsidies underthe Essential Small Pharmacies Scheme.
Pharmacies are reimbursed the average net acquisition cost of the drugsthey dispense.
Price lists are submitted by the manufacturers to the PPA each year andform the basis for reimbursement. Any revenue received directly by the phar-macist for prescription charges is deducted from the amount to be reimbursed.Any drugs that are covered by the drug tariff list, drawn up by the Departmentof Health, should be dispensed as generics as they will only be reimbursed tothe pharmacist at the level stated in the drug tariff list.
Nurses, midwives and professions allied to medicine
A separate review body makes recommendations to the government for annualincreases in the salaries of nurses, midwives and professions allied to medicine(including occupational therapists, radiographers, physiotherapists, etc.).
Prior to 1988, the career structure for nurses and health visitors had remainedbasically unaltered since the creation of the NHS. Whatever its original merits,the system had failed to adapt to the considerable changes within nursing thathad taken place over a 40-year period. A particular concern was that it failed tooffer a career structure that rewarded clinical skills and responsibilities. As aresult many nurses found that the only way for them to progress up the careerladder was to leave direct patient care completely.
To address this problem a new clinical grading structure was introduced in1988 that was designed to reward nursing skills and responsibilities. Thisstructure comprised nine scales and extended from scale A, covering nursingauxiliaries and support workers, to scale I covering managers of units with overallresponsibility for clinical care together with responsibilities for budgetary, staff-ing and planning matters.
It was hoped that this system would help overcome the perennial problemsassociated with nursing recruitment and retention. While the principle ofoffering a clear ladder for career progression has been generally welcomed,problems of recruitment and retention have persisted.

95
United Kingdom
Health Care Systems in Transition
New proposals for modernizing the NHS pay system as a whole are set outin the document Agenda for Change-Modernising NHS Pay published by theGovernment on 15 February 1999.
For nurses, midwives and health visitors a new career structure is proposedto replace the existing clinical grades. It is designed to provide better careerprogression and fairer rewards for developing new skills, taking on extendedroles and team-working. There will be three broad flexible ranges – registerednurses, a higher range of nurse experts and clinical managers and above thatnurse consultants and a fourth for nursing auxiliaries and other clinical supportworkers. There will be a clear minimum pay threshold for each of these setnationally. For PAMs the proposals are expected to support better career develop-ment and give a clear basis for valuing these skilled staff fairly. These changesare dependent on reaching agreement with the Trade Unions and professionalorganizations.
In February 1999 the Secretary of State for Health announced substantialincreases in the starting pay for newly-qualified nurses with the aim of attractingmore entrants to the professions.

96
United Kingdom
European Observatory on Health Care Systems
97
United Kingdom
Health Care Systems in Transition
Health care reforms
Aims and objectives
The period 1989–1999 has been one of unprecedented change for theNHS. First there were the radical market-based reforms introduced bythe Conservative Government through the NHS and Community Care
Act in 1991. These led to numerous changes in the period up to 1998. Then,following the election of a Labour Government in 1997, a new policy directionwas announced. At the present time these policy changes are in the process ofbeing implemented. In the following account, the determinants and objectivesthat led to the round of reforms introduced by the previous ConservativeGovernment are discussed. Then discussion moves on to the current reformsbeing introduced by the Labour Government.
The Conservative Government’s reform programme was set out in the WhitePaper, Working for Patients, which was published in January 1989. Thisproposed a radical reform programme that was subsequently embodied in theNHS and Community Care Act 1990. It was this act which led to the introductionof an internal or quasi-market in the NHS. A combination of factors appears tohave influenced the timing and direction of this change.
The immediate cause was the funding crisis of the winter of 1987 whichprompted the Prime Minister, Margaret Thatcher, to set up a high-profileministerial review of the NHS, which she herself chaired. The early deliberationsof the group were believed to have centred on alternative ways of NHS funding:ways that would avoid the constant funding crises to which the NHS was prone.However it soon became clear that the existing method of central tax-basedfunding was particularly effective at containing the growth in health expenditure.For this reason the United Kingdom, unlike many other countries was not subjectto serious cost escalation. Recognition of this fact made ministers reluctant tointerfere with funding mechanisms. As a result attention shifted to the wayservices were organized, managed and delivered.
98
United Kingdom
European Observatory on Health Care Systems
Within this new focus, a wider set of considerations became relevant.Throughout the 1980s a constant theme of government microeconomic policyhad been a belief in the superior efficiency of the private sector. A centralcomponent of this belief was that the competitive environment, within whichprivate sector firms operate, provides the necessary incentive structure forachieving greater efficiency. This had been the stated rationale for previousprivatization schemes. As such there was an established commitment to a systemof organization that could – with suitable modification – be applied to theNHS. The result was the introduction of an internal market into the NHS, withthe claim that competition between providers would increase efficiency, offerwider choice and improve the quality of services.
Thereafter a number of other factors came into play. It soon became clearthat the wider, social objectives of health care required the market to be quiteclosely regulated, so a system of managed or regulated competition developed.This trend was reinforced on the political level as the unpopularity of a stronglymarket-based approach among the general public and many health care profes-sionals led successive ministers to distance themselves from aggressively pro-market stances. At the same time, the unexpected rate of growth and expansionof GP fundholding led ministers to attach increasing importance to primarycare-based models of purchasing and to an eventual emphasis on a ‘primarycare-led NHS’.
Throughout the 1990s, while in opposition, the Labour Party was sharplycritical of the Conservative Government’s market-based approach. The allegedinequity of the system, particularly the unequal treatment received by patientsof fundholding and non-fundholding GPs and the heavy transaction costs ofrunning a market system, were particular sources of criticism. For these reasonsthe Labour Party was committed to the abolition of the internal market. Thesepledges have started to be put into practice since the election of a LabourGovernment in May 1997,
As mentioned above, the Labour Government’s main criticisms of theinternal market reforms are that they led to fragmented services, carried heavytransaction costs and were inequitable. There has also been criticism of theoveremphasis on costs in the contracting system, and a belief that the qualityof health care has been neglected. At the same time, however, there seems tohave been an acceptance of the merits of the primary care focus of the previousreform programme and a desire to retain this emphasis in a way that avoids theperceived unfairness and fragmentation caused by GP fundholding.
The Labour Government’s own plans for the reform of the NHS were setout in the White paper, The new NHS: modern, dependable, published in
99
United Kingdom
Health Care Systems in Transition
December 1997. This set out a ten-year agenda that aims to replace competitionand the internal market with a new-style system based on partnership workingand collaboration. Since then, there has been a steady stream of NHS executiveletters and guidance providing more details about implementation. At the timeof writing, the Health Act 1999 is going through parliament containing detailsof those changes that require legislative approval.
The main elements of the new approach are:
• Maintenance of the separation of responsibilities for commissioning andproviding but the replacement of annual contracts with three-year serviceagreements;
• The abolition of GP fundholding and the formation of area-based primarycare groups (PCGs) to which all GPs in an area will belong. 400 to 500 ofthese groups, formed since April 1999, will cater for average populationsof 100 000 patients (see the section on Organizational structure of the healthsystem);
• The maintenance of health authorities (HAs) but with the intention thattheir activities should become increasingly strategic as PCGs assume theresponsibility for commissioning services. A major responsibility for healthauthorities will be to take the lead on the development of health improve-ment plans (HimPs) in collaboration with other local agencies in their area;
• Maintenance of NHS trusts but with an obligation for them to workcollaboratively with DHAs, PCGs and other providers;
• Far greater emphasis on the quality of care and health outcomes with theestablishment of new methods of clinical governance. These include theestablishment of the National Institute for Clinical Excellence for deter-mining and disseminating information on best clinical practice; the develop-ment of national service frameworks setting out recommended patterns ofcare in specific disease, disability and client areas; and the formation of aCommission for Health Improvement to monitor and improve standards atthe local level;
• A far higher priority attached to reductions in inequality and deprivation.The commitment to this objective can be seen in the new approach to publichealth and the formation of 26 health action zones (HAZs). This latterinitiative is focused on areas of particular deprivation and is designed toencourage collaborative working between the NHS, local government, localindustry and voluntary organizations in order to improve the health ofdeprived populations.
100
United Kingdom
European Observatory on Health Care Systems
Reforms and legislation
This section provides a chronological account of the main policy measuresaffecting the NHS that have been introduced over the period 1989 to 1999.Each measure is described only briefly as they have all been discussed morefully elsewhere in the report.
1989 Publication of the White Paper, Working for Patients, which set out theConservative Government’s plans for radical reforms of the NHS throughthe development of an internal market.
1990 The introduction of a new national contract for GPs aimed at improvingperformance and making the profession more accountable. The contractwas introduced in the face of fierce opposition from the profession.
1991 The start of the implementation of the NHS internal market reformsfollowing the embodiment of the proposals contained in Working forPatients in the NHS and Community Care Act 1990.
The Health of the Nation Green Paper published setting out a publichealth strategy based on setting quantified targets and measuringperformance against these targets.
A research and development strategy for the NHS was launched withthe aim of contributing towards evidence-based practice and policy.
Publication of the Patient’s Charter setting out for the first time the rightsof patients and the standards of service they could expect from the NHS.
1992 A White paper on the Health of the Nation published confirming theapproach outlined in the previous year’s Green Paper.
An additional 1400 doctors joined the GP fundholding scheme, bringingthe total to over 3000 GPs caring for 6.7 million patients or 14% of thepopulation.
1993 The start of the delayed implementation of the community carecomponent of the NHS and Community Care Act 1990.
1994 An executive letter was distributed by the NHS Executive, entitled De-veloping NHS Purchasing and GP Fundholding, which set out anagenda for greater emphasis to be placed upon fundholding and extendedversions of it (such as total purchasing) as part of the development of a‘primary care-led NHS’.
Guidelines on regulation of the internal market were issued by the NHSExecutive entitled The operation of the internal market: local freedoms,national responsibilities.
101
United Kingdom
Health Care Systems in Transition
1995 The Health Authorities Act led to closer integration of primary andsecondary care through the creation of approximately 100 merged districthealth authorities and family health service authorities.
1996 Regional health authorities were replaced by regional offices of the NHSExecutive.
A report Primary care: the future, published by the NHS Executive,setting out the results of an extensive consultation exercise on the futureof primary care in the NHS. Following this publication, a White PaperChoice and opportunity: primary care, the future, was published settingout new models of primary care that the government intended to pilot,including practice-based contracts and salaried GPs.
1997 The NHS (Primary Care) Act was passed giving the go-ahead for theintroduction of pilot schemes covering GP personal medical services.
A new Labour Government was elected committed to the abolition ofthe internal market.
The Labour Government sets out its plans for a reformed NHS in a WhitePaper The new NHS: modern, dependable. This describes an approachin which markets and competition will be replaced by collaboration andjoint working.
1998 A consultation paper Our Healthier Nation was published, setting outthe government’s intended approach to public health. It placed consider-able emphasis on improving the health of the worse-off in society and toreducing health inequalities.
A document A First Class Service: Quality in the new NHS was publishedsetting out the government’s plans for improving quality and clinicalgovernance. This involved the establishment of the National Institutefor Clinical Excellence and the Commission for Health Improvement.
A White Paper Designed to Care – Renewing the National Health Servicein Scotland was published setting out the reforms of the organization ofthe NHS in Scotland which will take place under the Scottish Parliament.This involved the establishment of primary care trusts under which mentalhealth services, local health care cooperatives and community hospitalswould operate.
A White Paper NHS in Wales: Putting Patients First was published inJanuary setting out the arrangements for the organization of the NHS inWales under the responsibility of the Welsh Assembly. This involvedthe establishment of local health groups (equivalent to PCGs in England).

102
United Kingdom
European Observatory on Health Care Systems
1999 Primary care groups went “live” on 1 April 1999.
Report of the Royal Commission on Long Term Care for the Elderly,With Respect to Old Age: Long Term Care – Rights and Responsibili-ties, was published.
The White Paper, Saving Lives: Our Healthier Nation, setting out thegovernment’s strategy on public health, was published.
A document Fit for the Future – A New Approach was published inMarch 1999 which set out the Government’s proposals for the future ofthe health and personal social services in Northern Ireland.
Reform implementation
As the preceding account has demonstrated reform of the NHS in the UnitedKingdom during the 1990s has involved some radical changes of direction.
The 1991 reforms
The reforms introduced by the Conservative Government in 1991 were part ofa wider policy aimed at introducing a greater element of market discipline intothe public sector where it was felt that such discipline had been lacking. Theresult of which, it was claimed, was inefficient bureaucracy and services thatwere not sufficiently responsive to user needs.
The introduction of market-based approaches to the public sector wascontroversial and attracted a good deal of opposition. This was especially trueof the NHS. From the outset, health care professionals (i.e. doctors, nurses andother professions allied to medicine) and the general public were generallyseen as opposed to the direction of change. Most support came from NHSmanagers who experienced an increase in power vis-à-vis doctors.
Despite this opposition, however, the government pressed ahead with itsplans. The late 1980s and early 1990s was a period when strongly heldconviction-led policies were pursued at the expense of a more consensualapproach. Certainly this resulted in the implementation of major change, albeitsometimes at the cost of morale in different parts of the service.
Over time however, possibly as a result of the continuing electoral unpopu-larity of some of the more radical changes, the government softened its stance.The emphasis on competition and the internal market was reduced as a systemof regulated or managed competition was developed. The term ‘purchasing’
103
United Kingdom
Health Care Systems in Transition
was increasingly replaced by the term ‘commissioning’ as attempts were madeto move away from models based on spot purchasing to those on a more strategic,planned approach.
GP fundholding
The implementation process of GP fundholding is of particular interest. Whenfundholding was first introduced, it was an experimental scheme restricted to303 practices. Even among the architects of the reforms it was widely seen asa ‘sideshow’ and not part of the main agenda. At the outset the scheme wasstrongly opposed by the British Medical Association. Over the ensuing sevenyears, however, the scheme expanded dramatically in scale and scope. By 1998there were over 3500 fundholding practices covering 15 000 GPs. The BMAhad long since withdrawn its opposition as increasing numbers of its membersjoined the scheme.
A number of factors can be identified as contributing to the unexpectedgrowth of fundholding. Firstly the experience of the early fundholders showedthat they were able to improve the services received by their patients. Holdingbudgets gave them small but effective levers for improving services at theprimary–secondary care interface. Others noted these advantages and soughtto share them by joining the scheme. At the same time there is no doubt thatthe government’s growing support for fundholding led them to offer a range ofinducements (e.g. support for computer systems) that were not available tonon-fundholders. Some GPs, although not attracted to fundholding per se, feltthat by not becoming fundholders they would be seen as laggards and behindthe times; such a perception, it was feared, could lead to the loss of patients. Asa result they became reluctant fundholders. Taken together these factors contri-buted to the accelerated growth of fundholding.
Not all GPs, however, joined the bandwagon. Many continued to harbourdeep-seated ideological objections to fundholding on the grounds that it wasinequitable and led to the rationing of services. These GPs sometimes formednon-fundholding commissioning groups. These have been important in thethinking leading to proposals for primary care groups.
Policy evaluation
Another area where there was a marked change of stance in the government’sposition was the evaluation of policy changes. In 1991 the government setitself firmly against evaluation of the reforms. It denied the need for an officialprogramme of monitoring and evaluation and expressed the view that calling
104
United Kingdom
European Observatory on Health Care Systems
on outside academics or others to perform this role would be a sign of weakness.The consequence of this stance was that there was little firm evidence on thesuccesses and failures of the largest reform to be undertaken in the history ofthe NHS.
Gradually, however, this governmental stance shifted as it became apparentthat it lacked good evidence of performance of the NHS. This hampered itspolitical agenda as well as the scope for finessing policy on the basis of evidence.It was also totally inconsistent with the launch of the NHS R&D programmethat was postulated on the need to base action on evidence. As a consequenceof these various pressures, programmes of official evaluation started to befunded. This process has developed so far that it is now virtually impossiblefor a new policy initiative to be announced without an accompanying commit-ment being made to its evaluation. (In passing, it should be noted that this pro-evaluation stance is posing its own problems. Ministers and civil servantsfrequently look for definitive answers from research in complex areas of socialchange that cannot be provided.)
The most up-to-date review of the evidence relating to the performance ofthe internal market reforms is contained in the King’s Fund publication Learningfrom the NHS Internal Market: a Review of the Evidence (15). Material drawnfrom this source is presented in the conclusions of this report.
Current reforms
The change of government in 1997 led to a change of direction in health policyin the United Kingdom. A system based upon competition within the internalmarket is in the process of being replaced by one based upon partnership andcollaboration. Although certain key elements of the 1991 reforms are beingretained, e.g. the separation of responsibility for commissioning health servicesfrom the responsibility for providing them, the present government’s expectationis that health authorities, trusts and other agencies will operate in partnershipto bring about improvements in health services. The production of a healthimprovement programme by each health authority – in collaboration with otherlocal agencies – is one vehicle for achieving this objective.
Another feature of the new government’s approach has been to place greateremphasis on the quality of care and health outcomes. To this end it hasestablished a National Institute for Clinical Excellence (NICE), charged withthe task of assembling evidence on best clinical practice and disseminating itthroughout the NHS, and a Commission for Health Improvement (CHImP) toensure that performance at the local level meets expectations. A number of
105
United Kingdom
Health Care Systems in Transition
commentators have pointed out that these agencies represent something of areturn to a command and control approach following the devolution of theinternal market period.
Yet another important feature of the present government’s approach is theimportance it attaches to addressing social deprivation and to bringing about areduction in health inequalities. One aspect of this policy has been thedesignation of 26 health action zones (HAZs). These are specifically designatedareas of deprivation that are receiving central government funding – and certainnew freedoms and flexibility – in order to bring about health improvements intheir areas. Each HAZ is expected to pursue a seven-year programme, in thefirst instance. Partnership working between health authorities, trusts, primarycare groups, local authorities, the voluntary sector and private industry is a keyfeature of the HAZ approach. It is far too early to comment on the success ofthe HAZ experiments (the first eleven HAZs were set up only in April 1998,with another fifteen following later in the year) although the programme is thesubject of a Department of Health-funded independent national evaluation.
A final feature of the new government’s approach worthy of mention is theabolition of GP fundholding and its replacement with primary care groups(PCGs). While in opposition the government was opposed to GP fundholdingon the grounds that it created inequitable services between the patients offundholding GPs and those of non-fundholding GPs, and that it imposed heavytransaction costs through the proliferation of small-scale contracts. As a result,it has sought to retain the primary care-based focus of provision and commission-ing on a comprehensive basis by creating 481 PCGs. These were set up on1 April 1999 and in contrast to fundholding, which was optional, all GPs havebeen required to join a PCG. Each PCG is managed by a board with GP, otherprimary care and health authority representation. They cover populationsranging from 46 000 to 257 000 patients. The government recognizes thatindividual PCGs are presently at different stages in their readiness to assumenew functions and has therefore designated four stages for PCG development.These range from level one (where the PCG acts as an advisory committee tothe health authority) to level four (where it becomes a free-standing bodyaccountable to the health authority for commissioning care and with the addedresponsibility for the provision of community health services).

106
United Kingdom
European Observatory on Health Care Systems

107
United Kingdom
Health Care Systems in Transition
Conclusions
The UK National Health Service was established over 50 years ago. Atthe time it was designed to provide comprehensive and universal accessto health care on the basis of need rather than ability to pay. For this
reason the overwhelming majority of services were provided free at the pointof use. It was also decided to fund health care from general taxation rather thanadopt the social insurance system used by a number of other European countries.These features remain an important part of the present NHS. Despite, the growthof user charges in some areas (e.g. pharmaceuticals, dental and ophthalmicservices, long-term care for elderly people), most primary and secondary healthcare is still provided free at the point of use. Successive public opinion pollsindicate that this system continues to command widespread public support andresults show a strong attachment to the NHS as a national institution. Further-more, despite frequent funding ‘crises’ resulting from tight finance limits setby successive governments, there has been no serious attempt to move awayfrom a system of general tax-based funding.
However despite this continuity, there have been many management andorganizational changes affecting the way in which services are delivered. Themost radical of these was introduced in 1991 when the Conservative Govern-ment of the day, under the leadership of Margaret Thatcher, introduced aninternal market. These changes have been described earlier in this report.However, it is worth reiterating that they represented a fundamental attempt tochange the culture of the NHS by introducing private sector and market-stylemechanisms into a large, public sector bureaucracy. (The earlier Griffiths’general management reforms of 1984 started this process but the reforms of1991 represented a more widespread and radical programme).
Evidence on the performance of the internal market, in terms of the criteriaof efficiency, equity, choice and responsiveness, and accountability, has recentlybeen reviewed by Le Grand et al (1998) (15). They suggest that much of theevidence is inconclusive.

108
United Kingdom
European Observatory on Health Care Systems
On efficiency it is possible to point to increases in the Department of Health’scost-weighted index of activity over the early period of the reforms. This in-crease is more likely to have arisen through increases in funding than as aconsequence of the reforms themselves. And yet there were substantial increasesin management and transaction costs, although attributing these to the reformsthemselves is problematic.
The main research finding on equity relates to the two-tier system associatedwith GP fundholding (GPFH). This feature in particular was heavily criticizedby the present Labour Government when they were in opposition.
There is little research evidence to suggest that trust status improved thequality of care or that patient choice increased. However GP fundholders didsucceed in bringing about a number of improvements in the quality of services,albeit on a small scale. They seemed to be more successful than health authoritypurchasers in obtaining responsiveness from providers.
Regarding accountability, the reforms were associated with a quite markedincrease in central control and upward accountability. These imposed substantialmanagement costs in addition to costs associated with the functioning of theinternal market.
Overall, Le Grand et al (15) conclude that it is perhaps remarkable thatsuch a radical programme of reform should produce so few marked changes onthe key criteria of performance. One possible explanation they put forward isthat the internal market was not really put to the test; that is, its functioningwas hampered because the incentives were too weak and the constraints toostrong.
On the other hand, the 1991 reforms did bring about some marked changesin culture and organization. The involvement of GPs in decision-making andan emphasis on devolved purchasing or commissioning is one such change.The general belief in the desirability of the purchaser–provider split is anotherone. Emphasis on the need for services to be both clinically effective and cost-effective – within an environment of accountability – was also strengthenedthrough the 1991 reforms.
Indeed it is these elements that have been retained in the reform programmecurrently being implemented by the Labour Government elected in 1997.Despite their opposition to the internal market whilst in opposition, separationof commissioning and providing roles, emphasis on primary care-baseddevolved decision-making, and a continued quest for improvements in clinicaland cost effectiveness all remain important features of their approach. However,in contrast to the previous Conservative Government, they attach more impor-tance to collaborative working and partnership as mechanisms for achieving

109
United Kingdom
Health Care Systems in Transition
their objectives, rather than competition. Greater emphasis on the eliminationof health inequalities and on health outcomes are also key features of the presentgovernment’s approach.
An ambitious new agenda for developing the NHS in collaboration withother agencies has been set out. It remains to be seen how successful thesepartnerships will be in achieving the fundamental objectives of greaterefficiency, more equity, better quality, stronger responsiveness and cleareraccountability.

110
United Kingdom
European Observatory on Health Care Systems
111
United Kingdom
Health Care Systems in Transition
References
1. ALLSOP, J. Health policy and the NHS: towards 2000. London, Longman,1995.
2. BAGGOTT, R. Health and Health Care in Britain. London, Macmillan,1998.
3. DEPARTMENT OF HEALTH Modernising Social Services: Promoting Inde-pendence, Improving Protection, Raising Standards. London, HMSO,1998.
4. DEPARTMENT OF HEALTH Our Healthier Nation: A Contract for Health.London, The Stationery Office, 1998.
5. DEPARTMENT OF HEALTH A First Class Service: Quality in the new NHS.London, The Stationery Office, 1998.
6. DEPARTMENT OF HEALTH The Government’s Expenditure Plans 1998-1999.London, The Stationery Office, 1998.
7. DEPARTMENT OF HEALTH The new NHS: modern, dependable. London,The Stationary Office, 1998.
8. DIXON, J. & HARRISON, A. Funding the NHS. A little local difficulty?BMJ, 314(7075): 216-219 (1997).
9. FLYNN, R. & WILLIAMS , G. ed. Contracting for Health: Quasi-marketsand the National Health Service. Oxford, Oxford University Press, 1997.
10. HAM, C. Health Policy in Britain: The Politics and Organisation of theNational Health Service. Basingstoke, Macmillan, 1999 New edition.
11. HARRISON, A. J. & Prentice, S. Acute Futures. London, King’s Fund,1996.
12. HUNTER, D. J. Desperately Seeking Solutions: Rationing Health Care.London, Addison-Wesley Longman, 1997.
13. KLEIN, R. The New Politics of the National Health Service. New York,Longman, 1995.
112
United Kingdom
European Observatory on Health Care Systems
14. LAING, W. & BUISSON Laing’s Healthcare Market Review 1998-99. Lon-don, Laing & Buisson, 1998.
15. LE GRAND, J., et al. ed. Learning from the NHS Internal Market: a Re-view of the Evidence. London, King’s Fund, 1998.
16. MACPHERSON, G. ed. Our NHS: a Celebration of 50 years. London, BMJPublishing Group, 1998.
17. MAYS, N. & DIXON, J. Purchaser Plurality in UK Health Care: Is a con-sensus emerging and is it the right one? London, King’s Fund, 1996.
18. MAYS, N., et al. Total Purchasing: A Step Towards Primary Care Groups.London, King’s Fund, 1998.
19. NEW, B., et al. ed. Rationing: Talk and Action in Health Care. London,King’s Fund and BMJ Publishing Group, 1997.
20. OECD OECD Health Data 98: A comparative analysis of 29 countries,[online]. Available at Accessed on
21. RANADE, W. ed. Markets and Health Care: A Comparative Analysis.London, Addison Wesley Longman, 1998
22. ROYAL COMMISSION ON LONG TERM CARE With Respect to Old Age: LongTerm Care - Rights and Responsibilites. London, The Stationery Office,1999
23. WHO REGIONAL OFFICE FOR EUROPE Health for all database, World HealthOrganization, 1999

113
United Kingdom
Health Care Systems in Transition
Appendix I
The section on Organizational structure and management sets out thestructure and organization of the NHS in England. Some of the maindifferences between this system and those applying in Scotland, Wales
and Northern Ireland are set out below. A number of these arrangements are inthe process of changing following the establishment of the Scottish Parliamentand the Welsh Assembly.
Scotland
The Department of Health of the Scottish Office is responsible for health policyand the administration of the NHS in Scotland. The government’s Chief MedicalOfficer for Scotland heads the Public Health Policy Unit and is the Secretaryof State’s chief medical adviser. The Chief Executive (CE) of the NHS in Scot-land leads the central management of the service and is accountable to ministersfor the efficiency and performance of the service. The CE heads the ManagementExecutive which oversees the work of the 15 area health boards (i.e. thecounterparts of English health authorities). As in England, the health boardsare responsible for the planning and commissioning of health services for theirresident populations and the trusts are responsible for the provision of services.
The NHS in Scotland employs approximately 132 000 staff, including 63 000nurses, midwives and health visitors and 8500 doctors. In addition, there aremore than 7000 family practitioners, including doctors, dentists, opticians andcommunity pharmacists.
The White Paper Designed to Care –Renewing the National Health Servicein Scotland sets out the government’s reform proposals for the NHS in Scotland.While there are broad similarities of emphasis with those adopted in England,there is no provision for the creation of levels one to three of primary caregroups. Instead provision was made for the creation of primary care trusts. The
114
United Kingdom
European Observatory on Health Care Systems
implementation of the White Paper Designed to Care has resulted in a numberof trust mergers and the establishment of primary care trusts. There are now28 new NHS trusts of which 13 are primary care trusts.
The recently elected Scottish Parliament will also have major new respon-sibilities for health. The White Paper describes these in the following terms:
It will be for the Scottish Parliament to decide the details of its relationshipwith health bodies, including funding arrangements. Devolution providesan opportunity to build on the strengths of the NHS in Scotland, as well ason the Scottish tradition of community responsibility for those needing care.
At present it is too soon to comment on exactly how these new arrange-ments will work.
Wales
The Director of the Welsh Office Health Department is accountable to theSecretary of State for the management and performance of the NHS in Wales.The Director, under the Permanent Secretary, is the Secretary of State’s principalpolicy adviser on the NHS.
The Welsh Office Health Department comprises five divisions: namely,Health Financial Management, Health Services and Management, HealthStrategy, Primary and Community Health and the Public Health Division.
In Wales, there are no counterparts to the English regional offices of theNHS Executive. The five Welsh health authorities are directly accountable tothe Director of the Health Department.
The White Paper NHS in Wales: Putting Patients First, published in January1998, sets out the government’s plans for reform. As in Scotland, there arebroad similarities with the English plans although a major difference is thatlocal health groups based on local authority areas – instead of primary caregroups – will assume responsibility for commissioning services. These groupswill, however, also have a strong primary care representation and it is expectedthat eventually indicative budgets will be extended to individual GP practices.
Since 1999, the newly-elected Welsh Assembly holds responsibility for healthfunctions previously exercised by the Secretary of State. The Assembly has powersto:
• draw up strategic policies for health and health services and to allocateresources;
115
United Kingdom
Health Care Systems in Transition
• configure the NHS in Wales in a way that is consistent with its broaderobjectives;
• hold NHS organizations to account for their performance;
• promote the provision of particular services in Wales.
Northern Ireland
Northern Ireland has a joint Department of Health and Social Services whichcovers the range of business covered by the Department of Health and theDepartment of Social Security in England. The Department is headed by thePermanent Secretary and comprises a number of core groups. These are theResources and Social Security Group, Health and Social Policy Group, Healthand Social Services Executive, and five professional groups.
There are four health and social services boards (HSSBs) that are directlyaccountable to the Department of Health and Social Services. As the names ofthese boards imply, a major difference between them and the rest of the UnitedKingdom is that they are responsible for both health and social services. It iswidely believed that this makes the coordination between health and socialcare services less problematic in Northern Ireland than in the rest of the UnitedKingdom.
A document published in March 1999, Fit for the Future – A New Approachsets out the Government’s proposals for the future of the health and personalsocial services in Northern Ireland.
Resource distribution
The NHS in England accounts for about 80% of total UK expenditure althoughspending per head of population is lower in England than in the other threecountries. In 1995–1996, Scotland received 25% more funding per capita thanEngland, and Wales and Northern Ireland received 18% and 5% more respec-tively. Differences in need do not seem to account for these differences, nor dothey seem to be associated with better health outcomes in the higher spendingcountries.

116
United Kingdom
European Observatory on Health Care Systems

117
United Kingdom
Health Care Systems in Transition
Abbreviations
BMA British Medical Association
CHImP Commission for Health Improvement
CMO Chief Medical Officer
DGH District General Hospital
DHA District Health Authority
DoH Department of Health
GP General practitioner
GPFH General practice fundholding
HA Health Authority
HAZ Health Action Zone
HImP Health Improvement Programme
HPSS Health and Personal Social Services
LA Local Authority
NHSE National Health Services Executive
NICE National Institute for Clinical Excellence
PCG Primary Care Group
PCT Primary Care Trust
PPRS Pharmaceutical Price Regulation Scheme
RHA Regional Health Authority
TPP Total Purchasing Pilot
UKCC United Kingdom Central Council for Nursing, Midwiferyand Health Visiting