Unit Eight: Principles of Critical Appraisal -...
44
47 Unit Eight: Principles of Critical Appraisal Learning Objectives To understand the components that relate to quality of a quantitative and qualitative primary study To understand the term ‘bias’ and types of bias To gain experience in the assessment of the quality of a health promotion or public health primary study (qualitative and quantitative) 1) QUANTITATIVE STUDIES Validity Validity is the degree to which a result from a study is likely to be true and free from bias. 1 Interpretation of findings from a study depends on both internal and external validity. Internal validity The extent to which the observed effects are true for people in a study. 1 Common types of bias that affect internal validity include; allocation bias, confounding, blinding, data collection methods, withdrawals and dropouts, statistical analysis, and intervention integrity (including contamination). Unbiased results are internally valid. External validity (generalisability or applicability) The extent to which the effects in a study truly reflect what can be expected in a target population beyond the people included in the study. 1 Note: Only results from internally valid studies should be considered for generalisability. Critical appraisal tools 1) RCTs, non‐randomised controlled studies, uncontrolled studies The Quality Assessment Tool for Quantitative Studies (http://www.city.hamilton.on.ca/phcs/EPHPP/ ). Developed by the Effective Public Health Practice Project, Canada. This tool assesses both internal and external validity. Content and construct validity have been established. 2 Rates the following criteria relevant to public health studies: 1) selection bias (external validity) 2) allocation bias 3) confounding 4) blinding (detection bias) 5) data collection methods 6) withdrawals and dropouts (attrition bias) 7) statistical analysis 8) intervention integrity 2) Interrupted time series designs Methods for the appraisal and synthesis of ITS designs are included on the Effective Practice and Organisation of Care website (www.epoc.uottawa.ca ).
Transcript of Unit Eight: Principles of Critical Appraisal -...
47
Unit Eight: Principles of Critical Appraisal
Learning Objectives
To understand the components that relate to quality of a quantitative and qualitative primary study To understand the term ‘bias’ and types of bias To gain experience in the assessment of the quality of a health promotion or public health primary study (qualitative and quantitative)
1) QUANTITATIVE STUDIES
Validity Validity is the degree to which a result from a study is likely to be true and free from bias.1 Interpretation of findings from a study depends on both internal and external validity.
Internal validity The extent to which the observed effects are true for people in a study.1 Common types of bias that affect internal validity include; allocation bias, confounding, blinding, data collection methods, withdrawals and dropouts, statistical analysis, and intervention integrity (including contamination). Unbiased results are internally valid.
External validity (generalisability or applicability) The extent to which the effects in a study truly reflect what can be expected in a target population beyond the people included in the study.1 Note: Only results from internally valid studies should be considered for generalisability.
Critical appraisal tools 1) RCTs, non‐randomised controlled studies, uncontrolled studies
The Quality Assessment Tool for Quantitative Studies (http://www.city.hamilton.on.ca/phcs/EPHPP/). Developed by the Effective Public Health Practice Project, Canada. This tool assesses both internal and external validity. Content and construct validity have been established.2 Rates the following criteria relevant to public health studies: 1) selection bias (external validity) 2) allocation bias 3) confounding 4) blinding (detection bias) 5) data collection methods
6) withdrawals and dropouts (attrition bias)
7) statistical analysis 8) intervention integrity
2) Interrupted time series designs
Methods for the appraisal and synthesis of ITS designs are included on the Effective Practice and Organisation of Care website (www.epoc.uottawa.ca).
48
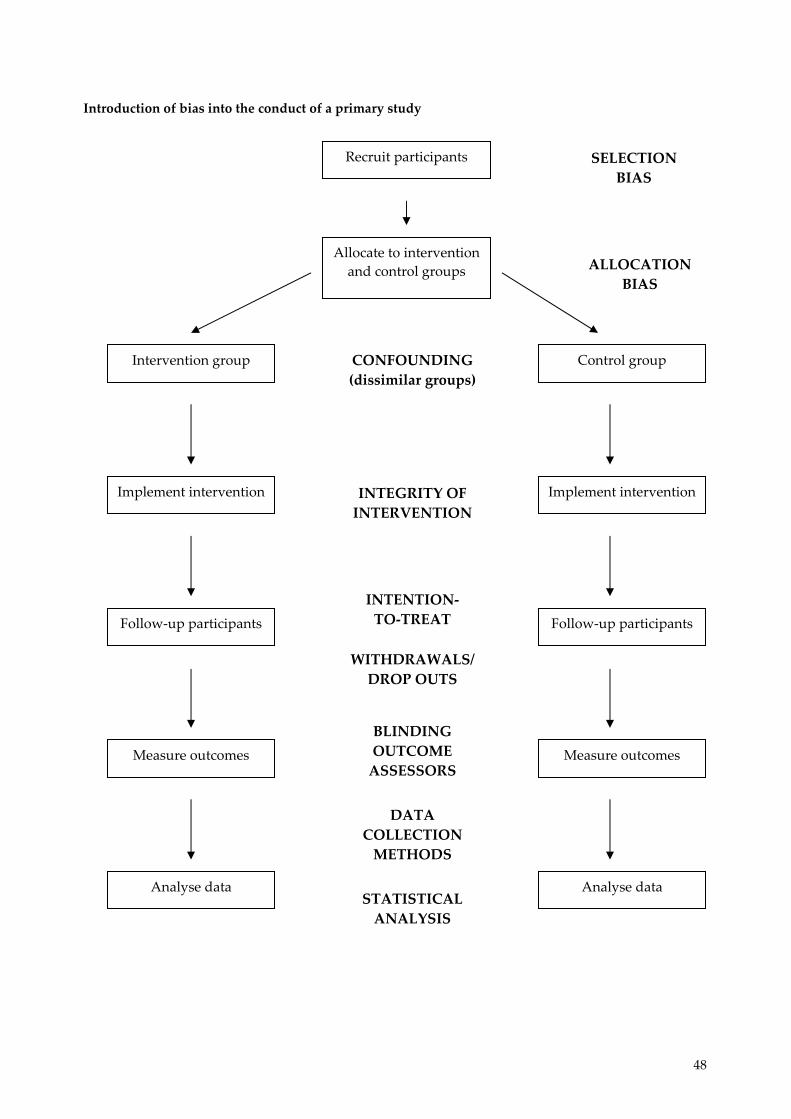
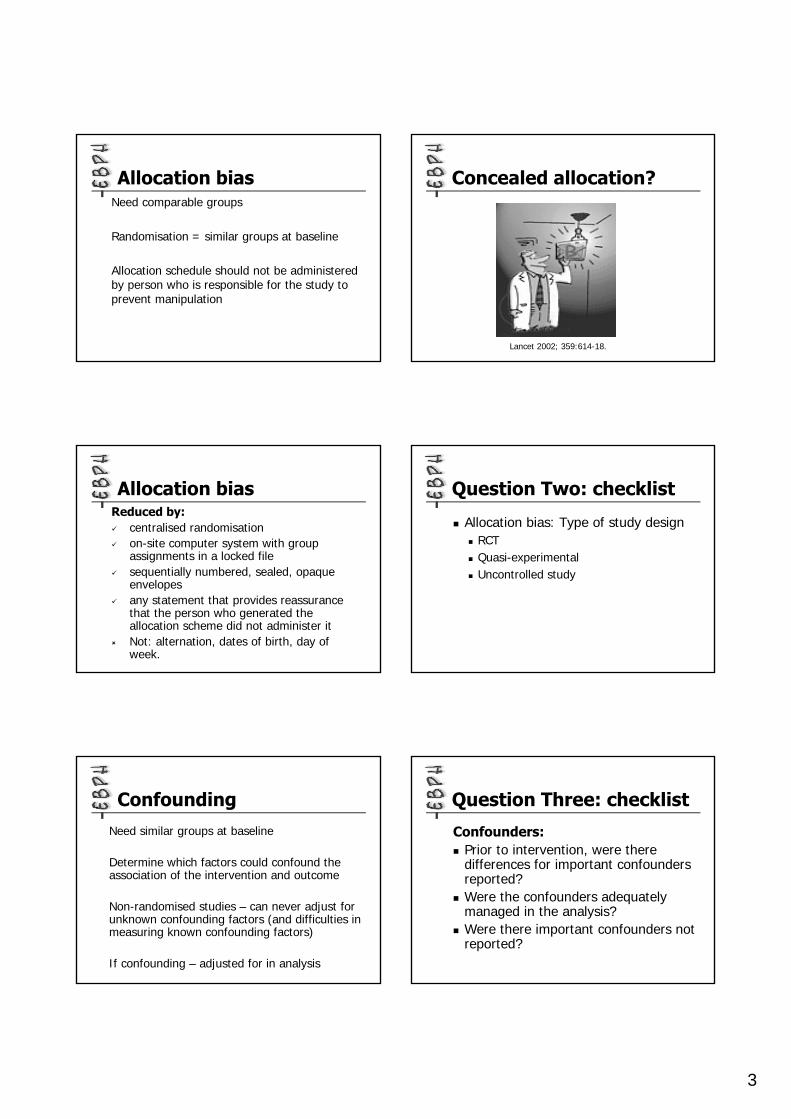
Introduction of bias into the conduct of a primary study
Recruit participants
Allocate to intervention and control groups
Intervention group Control group
Implement intervention
Follow‐up participants
Measure outcomes
Analyse data
Implement intervention
Follow‐up participants
Measure outcomes
Analyse data
SELECTION BIAS
ALLOCATION BIAS
CONFOUNDING (dissimilar groups)
INTEGRITY OF INTERVENTION
INTENTION‐TO‐TREAT
WITHDRAWALS/ DROP OUTS
BLINDING OUTCOME ASSESSORS
DATA COLLECTION METHODS
STATISTICAL ANALYSIS
49
Types of bias in health promotion and public health studies Bias A systematic error or deviation in results. Common types of bias in health promotion and public health studies arise from systematic differences in the groups that are compared (allocation bias), the exposure to other factors apart from the intervention of interest (eg. contamination), withdrawals from the study (attrition bias), assessment of outcomes (detection bias), including data collection methods, and inadequate implementation of the intervention. The following sections of this unit describe the types of bias to be assessed using The Quality Assessment Tool for Quantitative Studies (http://www.city.hamilton.on.ca/phcs/EPHPP/) developed by the Effective Public Health Practice Project, Canada. Further information is also provided in the Quality Assessment Dictionary provided in the following pages. 1) Selection bias Selection bias is used to describe a systematic difference in characteristics between those who are selected for study and those who are not. As noted in the Quality Assessment Dictionary, it occurs when the study sample (communities, schools, organisations, etc) does not represent the target population for whom the intervention was intended. Examples: Results from a teaching hospital may not be generalisable to those in non‐teaching hospitals Results which recruited volunteers may not be generalisable to the general population Results from low SES schools or inner city schools may not be generalisable to all schools Examples from www.re‐aim.org Example: Eakin and her associates (1998) illustrate selection bias in a smoking cessation study offered to participants in a planned‐parenthood program. They begin by explicitly reporting their inclusion criteria ‐‐female smokers between 15 and 35 years of age who are patients at a planned‐parenthood clinic. During a routine visit to the clinic the patient services staff described the study and solicited participants. Those women who declined (n=185) were asked to complete a short questionnaire that included questions to assess demographics, smoking rate, and reasons for non‐participation. Participants (n=518) also completed baseline demographic and smoking rate assessments. They tracked recruitment efforts and reported that 74% percent of the women approached agreed to participate in the study. To determine the representativeness of the sample two procedures were completed. First, based on information from patient medical charts, those who were contacted were compared on personal demographics to those who were not contacted. Second, participants were compared to non‐participants on personal demographics and smoking rate. The study found that those contacted did not differ from those not contacted on any of the test variables. Also, the results suggested that participants were slightly younger than non‐participants, but there were no other differences between these groups. This suggests that Eakin and her associates were fairly successful in contacting and recruiting a fairly representative sample of their target population. Example: The Language for Health (Elder et al., 2000) nutrition education intervention provides a good example of determining the representativeness of study participants to a given target population. The behaviour change intervention was developed to target Latino participants in English as a second language (ESL) classes at seven schools. To examine representativeness, the 710 participants in the study were compared to the overall Latino ESL student population in the city. This comparison revealed that the intervention participants did not differ from the general ESL student
50
population on gender, age, or education level. As such, the authors concluded that the study had strong generalisability to the greater target population (Elder et al., 2000). Example: All the participating schools were state primary schools sited outside the inner city area. Socio‐demographic measures suggested that the schools’ populations generally reflected the Leeds school aged population, although there was a slight bias towards more advantaged children. The schools had 1‐42% children from ethnic minorities and 7‐29% entitled to free school meals compared with 11% and 25% respectively for Leeds children as a whole. 2) Allocation bias Bias can result from the way that the intervention and control groups are assembled.3 Unless groups are equivalent or balanced at baseline, differences in outcomes cannot confidently be attributed to the effects of the intervention.4 Studies which show that comparison groups are not equivalent at baseline have high allocation bias.
Random allocation is the best method to produce comparison groups that are balanced at baseline for known and unknown confounding factors, and therefore reduce allocation bias. This is usually achieved by toin‐cossing or developing computer‐generated random number tables. This ensures that every participant in the study has an equal chance (50%/50%) of being in the intervention or control group. Ideally, the coin‐tossing or computer‐generated randomisation should be carried out by individuals external to the study. Once the allocation scheme is developed, the allocation of participants to intervention and control group should be carried out by someone who is not responsible for the study to prevent manipulation by researchers and participants. Therefore, once the allocation scheme has been developed it is important that allocation to intervention and control group is concealed. Concealment of allocation is the process to prevent foreknowledge of group assignment.1 Methods to conceal allocation include allocation by persons external to the study and sequentially numbered, sealed opaque envelopes. Unfortunately, information on concealment of allocation is very rarely reported in primary studies. Example: Worksites were randomised within blocks: unionised versus non‐unionised; single versus multiple buildings; and three worksites that were part of a single large company. Worksites were randomly assigned by the study biostatistician using a process conducted independently from the intervention team. Example: Subjects were randomised to one of three arms: (1) Direct Advice, (2) Brief Negotiation or (3) Control by household with each monthly batch forming a single permuted block. Randomisation of intervention arms were sent to CF (the investigator) in sealed opaque envelopes. At the health check participants were asked to consent to a randomised trial of the effect of health professionals’ communication style on patient’s health behaviour, namely physical activity. If consent was given, the envelope was opened and the appropriate intervention carried out. There are also quasi‐randomised methods of allocating participants into intervention and control groups. These include alternation (eg. first person intervention, second person control), allocation by date of birth, day of week, etc. These methods are not able to conceal allocation, do not guarantee that every participant has an equal chance of being in either comparison group, and consequentially do not guarantee that groups will be similar at baseline.
51
Example: Families then were randomly assigned to an intervention (n = 65) or control group (n = 70). An alternate‐day randomisation system was used to simplify intervention procedures and more importantly to avoid waiting‐room contamination of control families by intervention families exiting the rooms with books and handouts. Non‐randomised studies often involve the investigators choosing which individuals or groups are allocated to intervention and control groups. Therefore, these study designs have high allocation bias and are likely to produce uneven groups at baseline. Even if every attempt has been made to match the intervention and control groups it is impossible to match for unknown confounding factors. Furthermore, there are inherent problems in assessing known confounding factors, as measurement tools for collecting the information may not be valid. 3) Confounding Confounding is a situation where there are factors (other than the intervention) present which influence the outcome under investigation. A confounding factor has to be related to both the intervention and the outcome. For example, Body Mass Index at baseline would be a confounding factor when investigating the effect of school based nutrition intervention on preventing obesity. A factor can only confound an association if it differs between the intervention and control groups. The assessment of confounding is the next stage in the critical appraisal process after determining the method of allocation. Remember, randomisation of participants or groups to intervention/control group is the best way to distribute known and unknown confounding factors evenly. Differences between groups in baseline characteristics that relate to the outcome may distort the effect of the intervention under investigation. Before beginning to answer this critical appraisal question it is important to determine the potential confounding factors relating to the particular intervention under question. Good knowledge of the subject area is essential when determining potential confounders. Example: Presence of confounders: Intervention and control subjects were similar on baseline variables. Adjustment for confounders: We assessed the effect of the intervention after adjusting for sex, age, baseline BMI and type of school. 4) Blinding of outcome assessors (detection bias) Outcome assessors who are blind to the intervention or control status of participants should logically be less biased than outcome assessors who are aware of the status of the participants. Detection bias is important in health promotion studies where outcomes are generally subjective. For example, if outcome assessors were required to interview children regarding their food consumption in the past 24 hours, they may be more likely to prompt the intervention group to respond favourably. Example: Questionnaires were developed based on a review of other STD/HIV risk questionnaires and our findings from focus groups and in‐depth interviews. When administering the 3‐ and 9‐month follow‐up questionnaires, interviewers were blind to the study group assignment of adolescents.
52
5) Data collection methods As highlighted, a number of outcomes measured in health promotion are subjectively reported. Although a number of outcomes can be measured objectively, such as Body Mass Index or pregnancy, generally health promotion interventions are trying to change behaviour, which usually requires subjective self‐reporting (unless behaviour is directly observed). Subjective outcome data must be collected with valid and reliable instruments. Critical appraisal therefore requires the reader to assess whether the outcomes have been measured with valid and reliable instruments. Example: We used three validated tools to evaluate the effect of the intervention on psychological well‐being; the self‐perception profile for children; a measure of dietary restraint; and the adapted body shape perception scale. 6) Withdrawals (attrition bias) Attrition bias relates to the differences between the intervention and control groups in the number of withdrawals from the study. It arises because of inadequacies in accounting for losses of participants due to dropouts, leading to missing data on follow‐up.4 If there are systematic differences in losses to follow‐up the characteristics of the participants in the intervention and control groups may not be as similar as they were at the beginning of the study. For randomised controlled trials, the effect of randomisation is lost if participants are lost to follow‐up. An intention‐to‐treat analysis, where participants are analysed according to the group they were initially allocated, protects against attrition bias. For cluster‐level interventions all members of the cluster should be included in the evaluation, regardless of their exposure to the intervention.5 Thus, a sample of eligible members of the cluster is generally assessed, not only those who were sufficiently motivated to participate in the intervention.5 Therefore, it is said that studies tracking change in entire communities are likely to observe smaller effect sizes than other studies tracking change in intervention participants alone.5 Example: Twenty one (14%) of the 148 patients who entered the trial dropped out, a rate comparable to that in similar trials. Of these, 19 were in the intervention group and dropped out during treatment (eight for medical reasons, seven for psychiatric reasons, four gave no reason, one emigrated, and one was dissatisfied with treatment). Example: Completed follow‐up responses were obtained from 87% of surviving intervention patients and 79% of surviving control patients. There were no significant differences between respondents and non‐respondents in age, sex, educational achievement, marital status, or baseline health status. 7) Statistical analysis A trial/study must have a sufficient sample size to have the ability (or power) to detect significant differences between comparison groups. A lack of a significant effect could be due to the study having insufficient numbers, rather than the intervention being ineffective. The publication of the study should report whether a sample size calculation was carried out. For group/cluster studies the study should report that it took the clustering into account when calculating sample size. These types of study designs should also analyse the data appropriately; if schools/classrooms were allocated to intervention and control groups then they must be analysed at
53
this level. Often this is not the case, as the intervention is allocated to schools (for practical reasons) and individual outcomes (eg. behaviour change) are analysed. In these instances, a cluster analysis (taking into account the different levels of allocation and analysis) should be reported. Example: A power calculation indicated that with five schools in each arm, the study would have 80% power to detect and underlying difference in means of a normally distributed outcome measure of ≥1.8 standard deviations at the 5% significance level and 65% to detect a difference of 1.5 SD. This took into account the cluster randomisation design. Example: The statistical model took into account the lack of independence among subjects within the school, known as the clustering effect. 8) Integrity of intervention Critical appraisal should determine if results of ineffectiveness within primary studies is simply due to incomplete delivery of the intervention (failure of implementation) or a poorly conceptualised intervention (failure of intervention concept or theory)6,7. Evaluating a program that has not been adequately implemented is also called a Type III error8. Assessing the degree to which interventions are implemented as planned is important in preventive interventions which are often implemented in conditions that present numerous obstacles to complete delivery.6 A review of smoking cessation in pregnancy9 found that in studies which measured the implementation of the intervention the implementation was less than ideal.
In order to provide a comprehensive picture of intervention integrity five dimensions of the intervention should be measured. These five factors are adherence, exposure, quality of delivery, participant responsiveness, and program differentiation (to prevent contamination).6
Adherence: the extent to which specified program components were delivered as prescribed in program manuals. Exposure: an index that may include any of the following: (a) the number of sessions implemented; (b) the length of each session; or (c) the frequency with which program techniques were implemented. Quality of delivery: a measure of qualitative aspects of program delivery that are not directly related to the implementation of prescribed content, such as implementer enthusiasm, leader preparedness and training, global estimates of session effectiveness, and leader attitude towards the program. Participant responsiveness: a measure of participant response to program sessions, which may include indicators such as levels of participation and enthusiasm. Program differentiation: a manipulation check that is performed to safeguard against the diffusion of treatments, that is, to ensure that the subjects in each experimental condition received only the planned interventions. Contamination may be a problem within many public health and health promotion studies where intervention and control groups come into contact with each other. This bias is minimised through the use of cluster RCTs.
These data provide important information that enhances the ability to interpret outcome assessments, identify competing explanations for observed effects and measure exposure to the intervention.5 However, very few studies disentangle the factors that ensure successful outcomes, characterise the
54
failure to achieve success, or attempt to document the steps involved in achieving successful implementation of complex interventions.10,11 In relation to the appraisal of process evaluations the EPPI‐Centre has developed a 12‐question checklist, available at: http://eppi.ioe.ac.uk/EPPIWeb/home.aspx?page=/hp/reports/phase/phase_process.htm. Does the study focus on the delivery of a health promotion intervention? Screening questions
1. Does the study focus on a health promotion intervention? 2. Does the intervention have clearly stated aims? 3. Does the study describe the key processes involved in delivering the intervention?
Detailed questions 4. Does the study tell you enough about planning and consultation? 5. Does the study tell you enough about the collaborative effort required for the intervention? 6. Does the study tell you enough about how the target population was identified and
recruited? 7. Does the study tell you enough about education and training?
B) What are the results? 8. Were all the processes described and adequately monitored? 9. Was the intervention acceptable?
C) Will the results help me? 10. Can the results be applied to the local population? 11. Were all important processes considered? 12. If you wanted to know whether this intervention promotes health what outcomes would you
want to measure? Examples of assessment of the intervention implementation Example: This study evaluated a 19‐lesson, comprehensive school‐based AIDS education program lasting one year in rural southwestern Uganda. Quantitative data collection (via questionnaire) found that the program had very little effect on overall knowledge, overall attitude, intended condom use, and intended assertive behaviour. Data from the focus group discussions suggested that the program was incompletely implemented, and that key activities such as condoms and the role‐play exercises were only completed superficially. The main reasons for this were a shortage of classroom time, as well as teachers’ fear of controversy (condoms are an unwelcome intrusion into African tradition and may be associated with promiscuity). Teacher’s tended to teach only the activities that they preferred, leaving out the activities they were reluctant to teach. One problem with the intervention was that the program was additional to the standard curriculum, so teaching time was restricted. It was also found that neither teachers nor students were familiar with roleplay. Furthermore, a number of teachers also left the intervention schools (or died). Therefore, it is suggested that AIDS education programs in sub‐Saharan Africa may be more fully implemented if they are fully incorporated into national curricula (see interpretation or results unit) and examined as part of school education. References: Kinsman J, Nakiyingi J, Kamali A, Carpenter L, Quigley M, Pool R, Whitworth J. Evaluation of a comprehensive school‐based AIDS education programme in rural Masaka, Uganda. Health Educ Res. 2001 Feb;16(1):85‐100. Kinsman J, Harrison S, Kengeya‐Kayondo J, Kanyesigye E, Musoke S, Whitworth J. Implementation of a comprehensive AIDS education programme for schools in Masaka District, Uganda. AIDS Care. 1999 Oct;11(5):591‐601.
55
Example: Gimme 5 Fruit, Juice and Vegetable intervention. This school‐based intervention included components to be delivered at the school and newsletters with family activities and instructions for intervention at home. Overall, there were small changes in fruit, juice, and vegetable consumption. Teacher self‐reported delivery of the intervention was 90%. However, all teachers were observed at least once during the 6‐week intervention and it was found that only 51% and 46% of the curriculum activities were completed in the 4th and 5th grade years. Reference: Davis M, Baranowski T, Resnicow K, Baranowski J, Doyle C, Smith M, Wang DT, Yaroch A, Hebert D. Gimme 5 fruit and vegetables for fun and health: process evaluation. Health Educ Behav. 2000 Apr;27(2):167‐76.
REFERENCES
1. Cochrane Reviewers’ Handbook Glossary, Version 4.1.5.
www.cochrane.org/resources/handbook/glossary.pdf, 6 December 2004 [date last accessed] 2. Thomas H, Micucci S, Thompson OʹBrien MA, Briss P. Towards a reliable and valid instrument
for quality assessment of primary studies in public health. Unpublished work. 2001. 3. Clarke M, Oxman AD, editors. Cochrane Reviewers’ Handbook 4.2.0 [updated March 2003].
http://www.cochrane.dk/cochrane/handbook/handbook.htm 4. Undertaking Systematic Reviews of Research on Effectiveness. CRD’s Guidance for those
Carrying Out or Commissioning Reviews. CRD Report Number 4 (2nd Edition). NHS Centre for Reviews and Dissemination, University of York. March 2001. http://www.york.ac.uk/inst/crd/report4.htm
5. Sorensen G, Emmons K, Hunt MK, Johnston D. Implications of the results of community
intervention trials. Annu Rev Public Health. 1998;19:379‐416. 6. Dane AV, Schneider BH. Program integrity in primary and early secondary prevention: are
implementation effects out of control? Clin Psychol Rev 1998;18:23‐45. 7. Rychetnik L, Frommer M, Hawe P, Shiell A. Criteria for evaluating evidence on public health
interventions. J Epidemiol Community Health 2002;56:119‐27. 8. Basch CE, Sliepcevich EM, Gold RS, Duncan DF, Kolbe LJ. Avoiding type III errors in health
education program evaluations: a case study. Health Educ Q. 1985 Winter;12(4):315‐31. 9. Lumley J, Oliver S, Waters E. Interventions for promoting smoking cessation during pregnancy.
In: The Cochrane Library, Issue 3, 2004. Chichester, UK: John Wiley & Sons, Ltd. 10. Steckler A, Linnan L (eds). Process Evaluation for Public Health Interventions and Research.
Jossey‐Bass, USA, 2002. 11. Green J, Tones K. Towards a secure evidence base for health promotion. Journal of Public Health
Medicine 1999;21(2):133‐9.
56
ADDITIONAL READING
Rychetnik L, Frommer M, Hawe P, Shiell A. Criteria for evaluating evidence on public health interventions. J Epidemiol Community Health 2000;56:119‐27. Kahan B, Goodstadt M. The IDM Manual for Using the Interactive Domain Modal Approach to Best Practices in Health Promotion. www.utoronto.ca/chp/bestp.html#Outputs/Products Guyatt GH, Sackett DL, Cook DJ, for the Evidence‐Based Medicine Working Group. Users’ Guides to the Medical Literature. II. How to Use an Article About Therapy or Prevention. A. Are the Results of the Study Valid? Evidence‐Based Medicine Working Group. JAMA 1993;270(21):2598‐2601.
Notes on terms/statistics used in primary studies: Adapted from the Cochrane Reviewers’ Handbook Glossary, Version 4.1.5. Available at www.cochrane.org/resources/handbook/glossary.pdf Bias A systematic error or deviation in results. Common types of bias in health promotion and public health studies arise from systematic differences in the groups that are compared (allocation bias), the exposure to other factors apart from the intervention of interest (eg. contamination), withdrawals from the study (attrition bias), assessment of outcomes (detection bias), including data collection methods, and inadequate implementation of the intervention. Blinding Keeping secret group assignment (intervention or control) from the study participants or investigators. Blinding is used to protect against the possibility that knowledge of assignment may affect subject response to the intervention, provider behaviours, or outcome assessment. The importance of blinding depends on how objective the outcome measure is; blinding is more important for less objective measures. Confidence Interval (CI) The range within with the ‘true’ value (eg. size of effect of the intervention) is expected to lie within a given degree of certainty (eg. 95%). It is about the precision of the effect. CI’s therefore indicate the spread or range of values which can be considered probable. The narrower the CI the more precise we can take the findings to be. Confounding A situation in which the measure of the effect of an intervention or exposure is distorted because of the association of exposure with other factors that influence the outcome under investigation. Intention to treat An intention‐to‐treat analysis is one in which all the participants in the trial are analysed according to the intervention to which they are allocated, whether they received it or not. Odds ratios The ratio of the odds of an event (eg. prevention of smoking, unintended pregnancy) in the intervention group to the odds of an event in the control group.
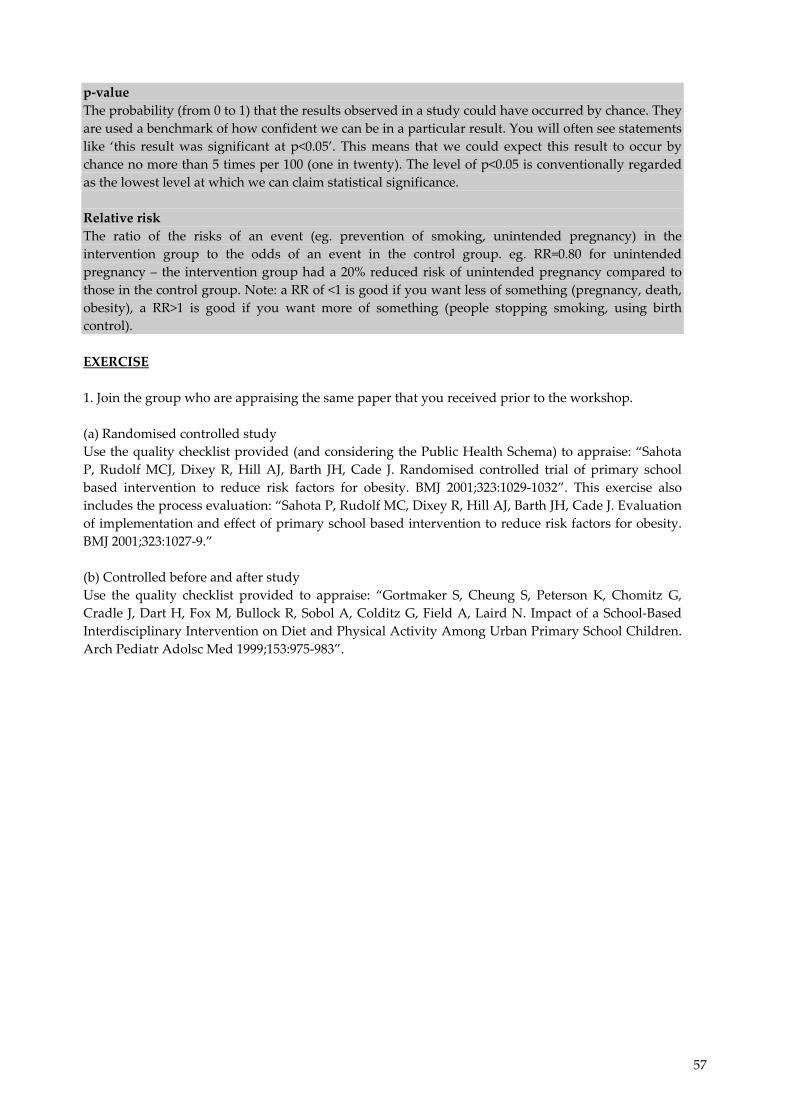
57
p‐value The probability (from 0 to 1) that the results observed in a study could have occurred by chance. They are used a benchmark of how confident we can be in a particular result. You will often see statements like ‘this result was significant at p<0.05’. This means that we could expect this result to occur by chance no more than 5 times per 100 (one in twenty). The level of p<0.05 is conventionally regarded as the lowest level at which we can claim statistical significance. Relative risk The ratio of the risks of an event (eg. prevention of smoking, unintended pregnancy) in the intervention group to the odds of an event in the control group. eg. RR=0.80 for unintended pregnancy – the intervention group had a 20% reduced risk of unintended pregnancy compared to those in the control group. Note: a RR of <1 is good if you want less of something (pregnancy, death, obesity), a RR>1 is good if you want more of something (people stopping smoking, using birth control). EXERCISE 1. Join the group who are appraising the same paper that you received prior to the workshop. (a) Randomised controlled study Use the quality checklist provided (and considering the Public Health Schema) to appraise: “Sahota P, Rudolf MCJ, Dixey R, Hill AJ, Barth JH, Cade J. Randomised controlled trial of primary school based intervention to reduce risk factors for obesity. BMJ 2001;323:1029‐1032”. This exercise also includes the process evaluation: “Sahota P, Rudolf MC, Dixey R, Hill AJ, Barth JH, Cade J. Evaluation of implementation and effect of primary school based intervention to reduce risk factors for obesity. BMJ 2001;323:1027‐9.” (b) Controlled before and after study Use the quality checklist provided to appraise: “Gortmaker S, Cheung S, Peterson K, Chomitz G, Cradle J, Dart H, Fox M, Bullock R, Sobol A, Colditz G, Field A, Laird N. Impact of a School‐Based Interdisciplinary Intervention on Diet and Physical Activity Among Urban Primary School Children. Arch Pediatr Adolsc Med 1999;153:975‐983”.

58
59
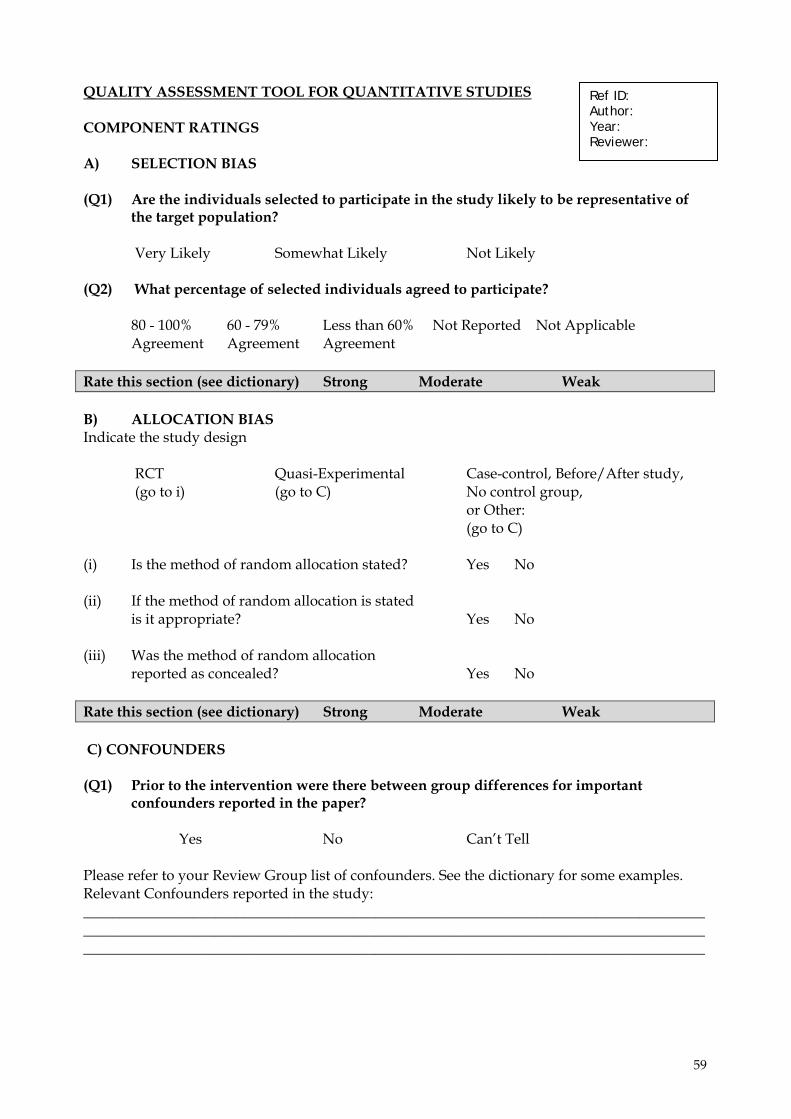
QUALITY ASSESSMENT TOOL FOR QUANTITATIVE STUDIES COMPONENT RATINGS A) SELECTION BIAS (Q1) Are the individuals selected to participate in the study likely to be representative of
the target population? Very Likely Somewhat Likely Not Likely (Q2) What percentage of selected individuals agreed to participate?
80 - 100% 60 - 79% Less than 60% Not Reported Not Applicable Agreement Agreement Agreement
Rate this section (see dictionary) Strong Moderate Weak B) ALLOCATION BIAS Indicate the study design RCT Quasi-Experimental Case-control, Before/After study, (go to i) (go to C) No control group,
or Other: (go to C)
(i) Is the method of random allocation stated? Yes No (ii) If the method of random allocation is stated
is it appropriate? Yes No (iii) Was the method of random allocation
reported as concealed? Yes No Rate this section (see dictionary) Strong Moderate Weak C) CONFOUNDERS (Q1) Prior to the intervention were there between group differences for important
confounders reported in the paper? Yes No Can’t Tell Please refer to your Review Group list of confounders. See the dictionary for some examples. Relevant Confounders reported in the study: _______________________________________________________________________________________________________________________________________________________________________________________________________________________________________________________________
Ref ID: Author: Year: Reviewer:
60
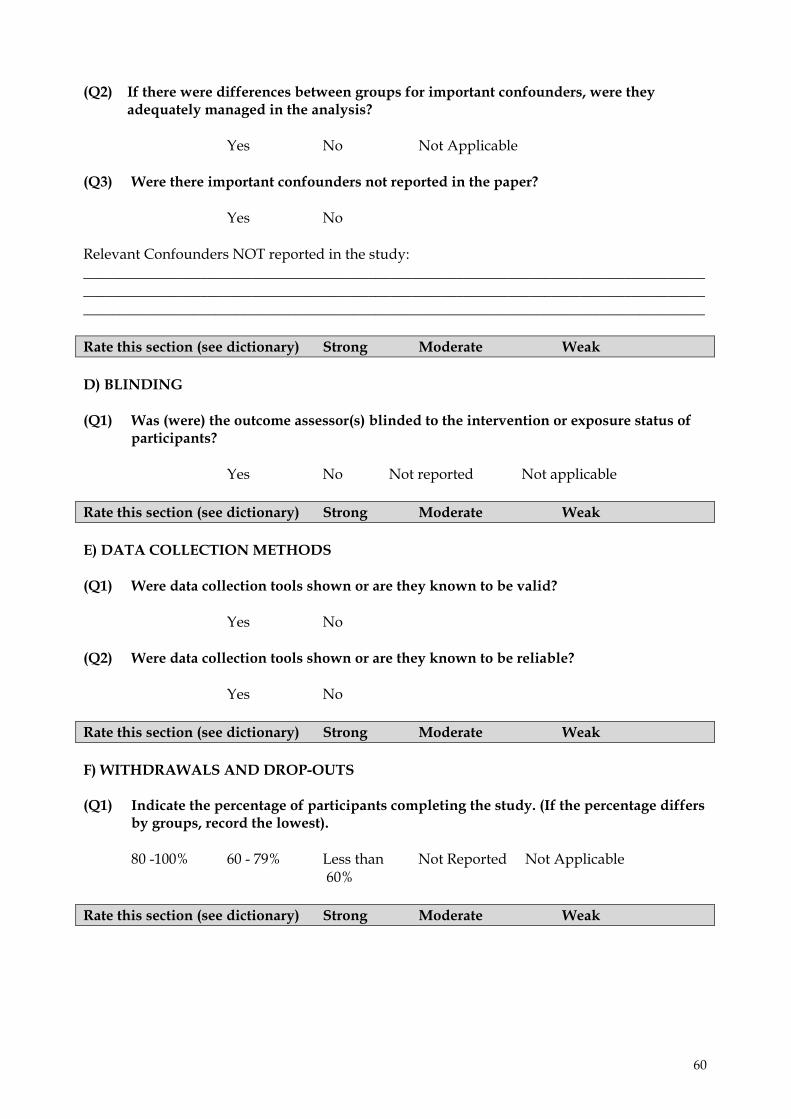
(Q2) If there were differences between groups for important confounders, were they adequately managed in the analysis?
Yes No Not Applicable
(Q3) Were there important confounders not reported in the paper? Yes No Relevant Confounders NOT reported in the study: _______________________________________________________________________________________________________________________________________________________________________________________________________________________________________________________________ Rate this section (see dictionary) Strong Moderate Weak D) BLINDING (Q1) Was (were) the outcome assessor(s) blinded to the intervention or exposure status of
participants? Yes No Not reported Not applicable Rate this section (see dictionary) Strong Moderate Weak E) DATA COLLECTION METHODS (Q1) Were data collection tools shown or are they known to be valid?
Yes No (Q2) Were data collection tools shown or are they known to be reliable? Yes No Rate this section (see dictionary) Strong Moderate Weak F) WITHDRAWALS AND DROP-OUTS (Q1) Indicate the percentage of participants completing the study. (If the percentage differs
by groups, record the lowest).
80 -100% 60 - 79% Less than Not Reported Not Applicable 60%
Rate this section (see dictionary) Strong Moderate Weak
61
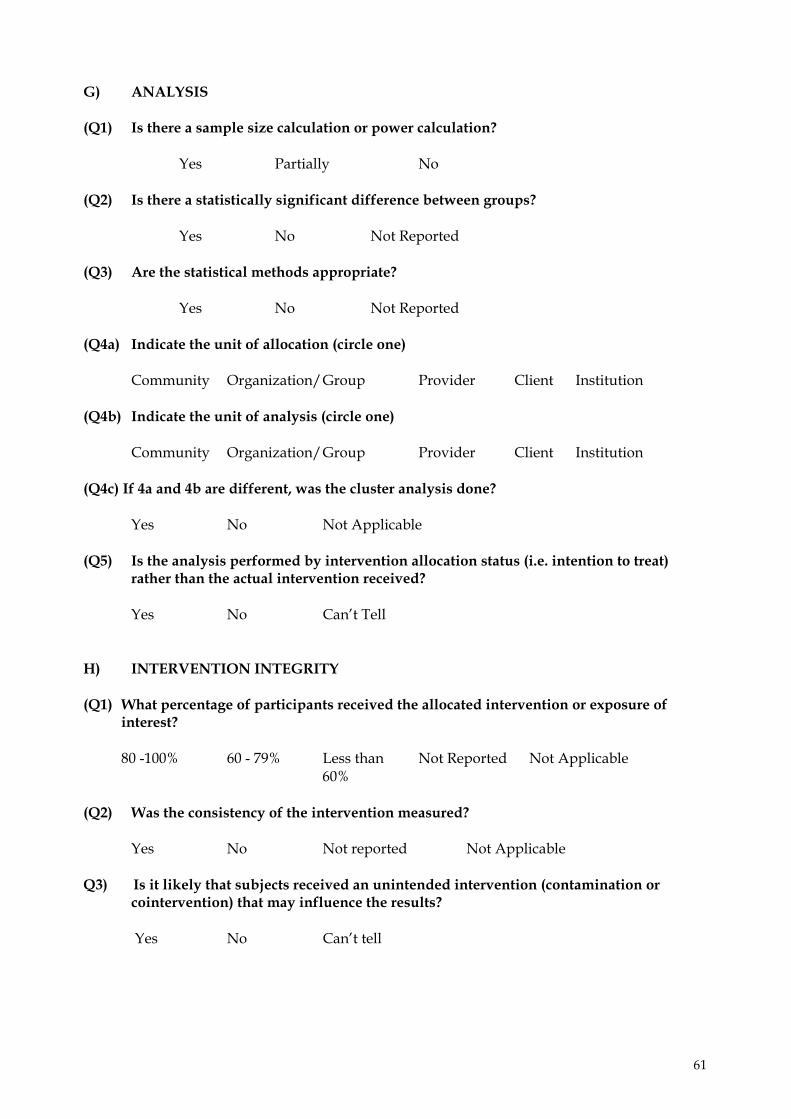
G) ANALYSIS (Q1) Is there a sample size calculation or power calculation?
Yes Partially No (Q2) Is there a statistically significant difference between groups?
Yes No Not Reported (Q3) Are the statistical methods appropriate?
Yes No Not Reported (Q4a) Indicate the unit of allocation (circle one)
Community Organization/ Group Provider Client Institution (Q4b) Indicate the unit of analysis (circle one)
Community Organization/ Group Provider Client Institution
(Q4c) If 4a and 4b are different, was the cluster analysis done?
Yes No Not Applicable (Q5) Is the analysis performed by intervention allocation status (i.e. intention to treat)
rather than the actual intervention received?
Yes No Can’t Tell H) INTERVENTION INTEGRITY (Q1) What percentage of participants received the allocated intervention or exposure of
interest?
80 -100% 60 - 79% Less than Not Reported Not Applicable 60%
(Q2) Was the consistency of the intervention measured?
Yes No Not reported Not Applicable
Q3) Is it likely that subjects received an unintended intervention (contamination or cointervention) that may influence the results? Yes No Can’t tell
62
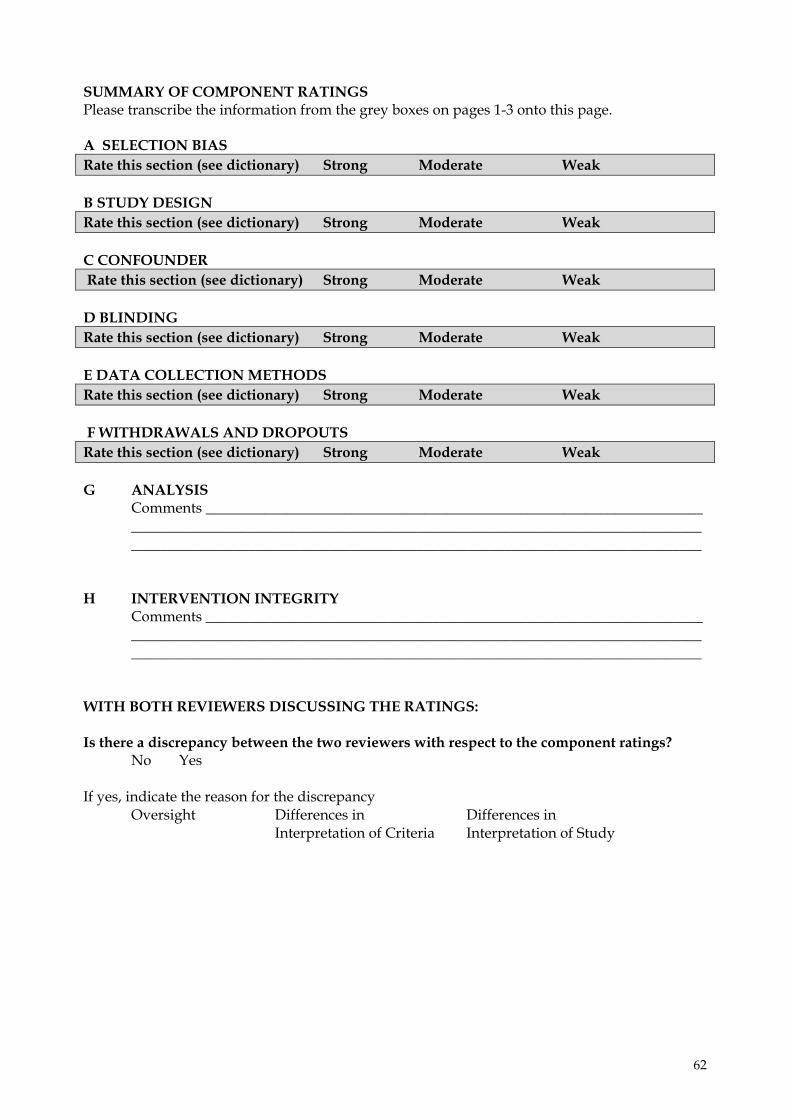
SUMMARY OF COMPONENT RATINGS Please transcribe the information from the grey boxes on pages 1-3 onto this page. A SELECTION BIAS Rate this section (see dictionary) Strong Moderate Weak B STUDY DESIGN Rate this section (see dictionary) Strong Moderate Weak C CONFOUNDER Rate this section (see dictionary) Strong Moderate Weak D BLINDING Rate this section (see dictionary) Strong Moderate Weak E DATA COLLECTION METHODS Rate this section (see dictionary) Strong Moderate Weak F WITHDRAWALS AND DROPOUTS Rate this section (see dictionary) Strong Moderate Weak G ANALYSIS Comments ____________________________________________________________________
____________________________________________________________________________________________________________________________________________________________
H INTERVENTION INTEGRITY
Comments ____________________________________________________________________ ____________________________________________________________________________________________________________________________________________________________
WITH BOTH REVIEWERS DISCUSSING THE RATINGS: Is there a discrepancy between the two reviewers with respect to the component ratings? No Yes If yes, indicate the reason for the discrepancy
Oversight Differences in Differences in Interpretation of Criteria Interpretation of Study
63
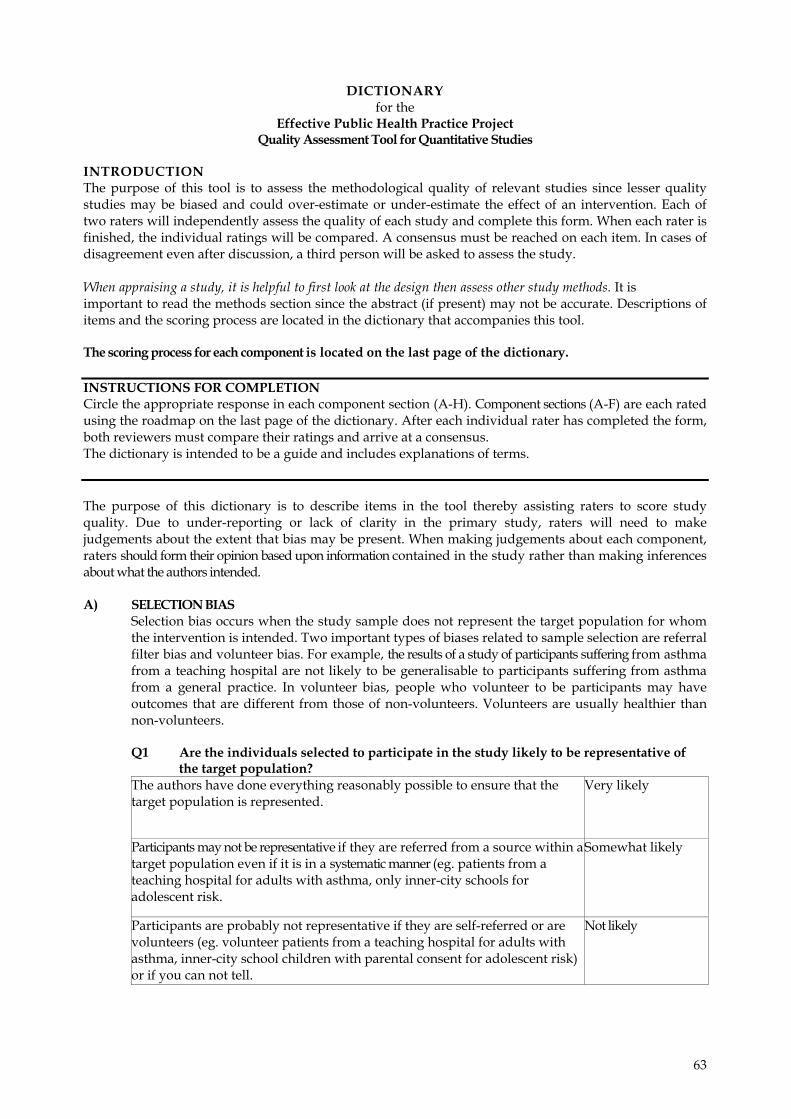
DICTIONARY for the
Effective Public Health Practice Project Quality Assessment Tool for Quantitative Studies
INTRODUCTION The purpose of this tool is to assess the methodological quality of relevant studies since lesser quality studies may be biased and could over-estimate or under-estimate the effect of an intervention. Each of two raters will independently assess the quality of each study and complete this form. When each rater is finished, the individual ratings will be compared. A consensus must be reached on each item. In cases of disagreement even after discussion, a third person will be asked to assess the study. When appraising a study, it is helpful to first look at the design then assess other study methods. It is important to read the methods section since the abstract (if present) may not be accurate. Descriptions of items and the scoring process are located in the dictionary that accompanies this tool. The scoring process for each component is located on the last page of the dictionary. INSTRUCTIONS FOR COMPLETION Circle the appropriate response in each component section (A-H). Component sections (A-F) are each rated using the roadmap on the last page of the dictionary. After each individual rater has completed the form, both reviewers must compare their ratings and arrive at a consensus. The dictionary is intended to be a guide and includes explanations of terms. The purpose of this dictionary is to describe items in the tool thereby assisting raters to score study quality. Due to under-reporting or lack of clarity in the primary study, raters will need to make judgements about the extent that bias may be present. When making judgements about each component, raters should form their opinion based upon information contained in the study rather than making inferences about what the authors intended. A) SELECTION BIAS
Selection bias occurs when the study sample does not represent the target population for whom the intervention is intended. Two important types of biases related to sample selection are referral filter bias and volunteer bias. For example, the results of a study of participants suffering from asthma from a teaching hospital are not likely to be generalisable to participants suffering from asthma from a general practice. In volunteer bias, people who volunteer to be participants may have outcomes that are different from those of non-volunteers. Volunteers are usually healthier than non-volunteers. Q1 Are the individuals selected to participate in the study likely to be representative of
the target population? The authors have done everything reasonably possible to ensure that the target population is represented.
Very likely
Participants may not be representative if they are referred from a source within atarget population even if it is in a systematic manner (eg. patients from a teaching hospital for adults with asthma, only inner-city schools for adolescent risk.
Somewhat likely
Participants are probably not representative if they are self-referred or are volunteers (eg. volunteer patients from a teaching hospital for adults with asthma, inner-city school children with parental consent for adolescent risk) or if you can not tell.
Not likely
64
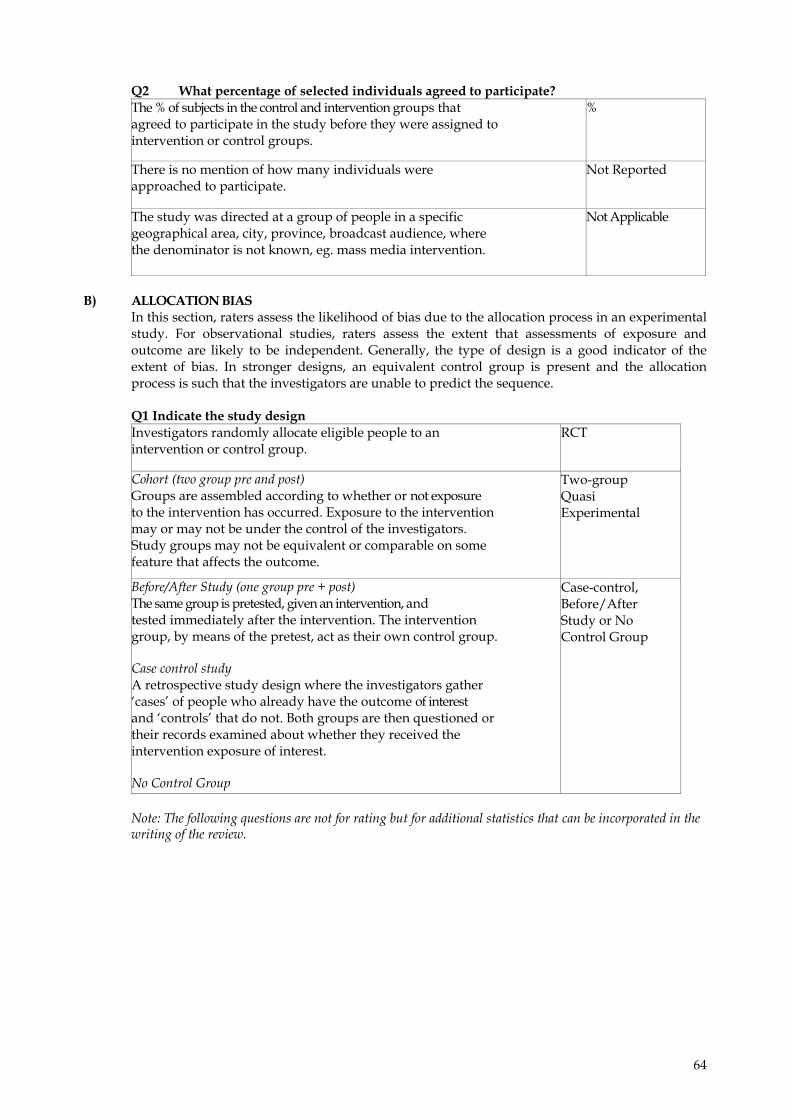
Q2 What percentage of selected individuals agreed to participate? The % of subjects in the control and intervention groups that agreed to participate in the study before they were assigned to intervention or control groups.
%
There is no mention of how many individuals were approached to participate.
Not Reported
The study was directed at a group of people in a specific geographical area, city, province, broadcast audience, where the denominator is not known, eg. mass media intervention.
Not Applicable
B) ALLOCATION BIAS
In this section, raters assess the likelihood of bias due to the allocation process in an experimental study. For observational studies, raters assess the extent that assessments of exposure and outcome are likely to be independent. Generally, the type of design is a good indicator of the extent of bias. In stronger designs, an equivalent control group is present and the allocation process is such that the investigators are unable to predict the sequence.
Q1 Indicate the study design
Investigators randomly allocate eligible people to an intervention or control group.
RCT
Cohort (two group pre and post) Groups are assembled according to whether or not exposure to the intervention has occurred. Exposure to the intervention may or may not be under the control of the investigators. Study groups may not be equivalent or comparable on some feature that affects the outcome.
Two-group Quasi Experimental
Before/After Study (one group pre + post) The same group is pretested, given an intervention, and tested immediately after the intervention. The intervention group, by means of the pretest, act as their own control group. Case control study A retrospective study design where the investigators gather ‘cases’ of people who already have the outcome of interest and ‘controls’ that do not. Both groups are then questioned or their records examined about whether they received the intervention exposure of interest. No Control Group
Case-control, Before/After Study or No Control Group
Note: The following questions are not for rating but for additional statistics that can be incorporated in the writing of the review.
65
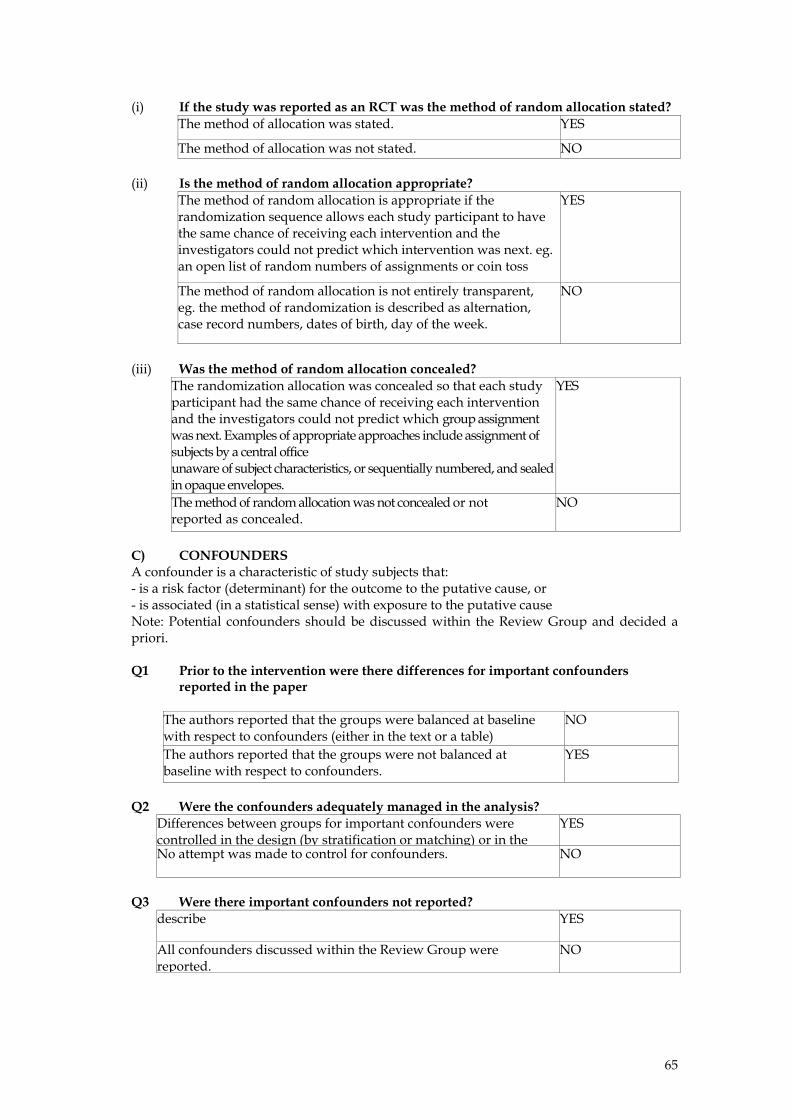
(i) If the study was reported as an RCT was the method of random allocation stated? The method of allocation was stated. YES
The method of allocation was not stated. NO (ii) Is the method of random allocation appropriate?
The method of random allocation is appropriate if the randomization sequence allows each study participant to have the same chance of receiving each intervention and the investigators could not predict which intervention was next. eg. an open list of random numbers of assignments or coin toss
YES
The method of random allocation is not entirely transparent, eg. the method of randomization is described as alternation, case record numbers, dates of birth, day of the week.
NO
(iii) Was the method of random allocation concealed?
The randomization allocation was concealed so that each study participant had the same chance of receiving each intervention and the investigators could not predict which group assignment was next. Examples of appropriate approaches include assignment of subjects by a central office unaware of subject characteristics, or sequentially numbered, and sealed in opaque envelopes.
YES
The method of random allocation was not concealed or not reported as concealed.
NO
C) CONFOUNDERS A confounder is a characteristic of study subjects that: - is a risk factor (determinant) for the outcome to the putative cause, or - is associated (in a statistical sense) with exposure to the putative cause Note: Potential confounders should be discussed within the Review Group and decided a priori. Q1 Prior to the intervention were there differences for important confounders
reported in the paper
Q2 Were the confounders adequately managed in the analysis?
Differences between groups for important confounders were controlled in the design (by stratification or matching) or in the
YES
No attempt was made to control for confounders. NO
Q3 Were there important confounders not reported?
describe YES
All confounders discussed within the Review Group were reported.
NO
The authors reported that the groups were balanced at baseline with respect to confounders (either in the text or a table)
NO
The authors reported that the groups were not balanced at baseline with respect to confounders.
YES
66
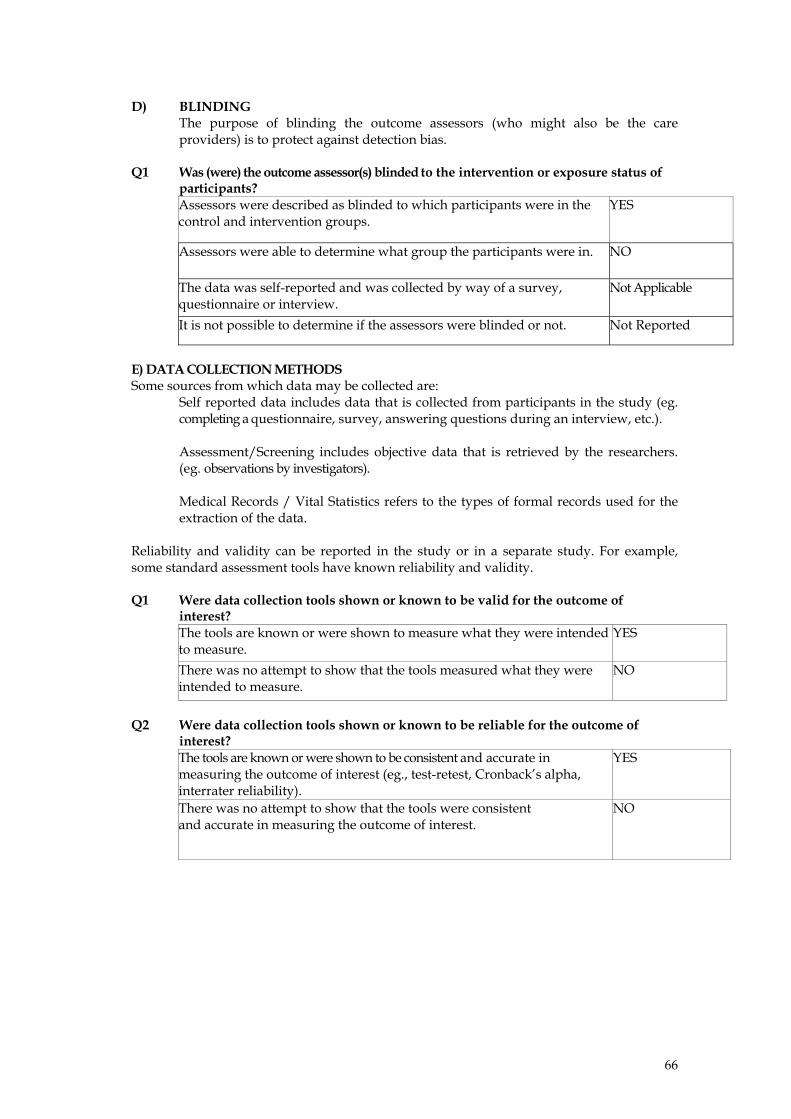
D) BLINDING The purpose of blinding the outcome assessors (who might also be the care providers) is to protect against detection bias.
Q1 Was (were) the outcome assessor(s) blinded to the intervention or exposure status of
participants? Assessors were described as blinded to which participants were in the control and intervention groups.
YES
Assessors were able to determine what group the participants were in.
NO
The data was self-reported and was collected by way of a survey, questionnaire or interview.
Not Applicable
It is not possible to determine if the assessors were blinded or not. Not Reported
E) DATA COLLECTION METHODS Some sources from which data may be collected are:
Self reported data includes data that is collected from participants in the study (eg. completing a questionnaire, survey, answering questions during an interview, etc.). Assessment/Screening includes objective data that is retrieved by the researchers. (eg. observations by investigators). Medical Records / Vital Statistics refers to the types of formal records used for the extraction of the data.
Reliability and validity can be reported in the study or in a separate study. For example, some standard assessment tools have known reliability and validity. Q1 Were data collection tools shown or known to be valid for the outcome of
interest? The tools are known or were shown to measure what they were intended to measure.
YES
There was no attempt to show that the tools measured what they were intended to measure.
NO
Q2 Were data collection tools shown or known to be reliable for the outcome of
interest? The tools are known or were shown to be consistent and accurate in measuring the outcome of interest (eg., test-retest, Cronback’s alpha, interrater reliability).
YES
There was no attempt to show that the tools were consistent and accurate in measuring the outcome of interest.
NO
67
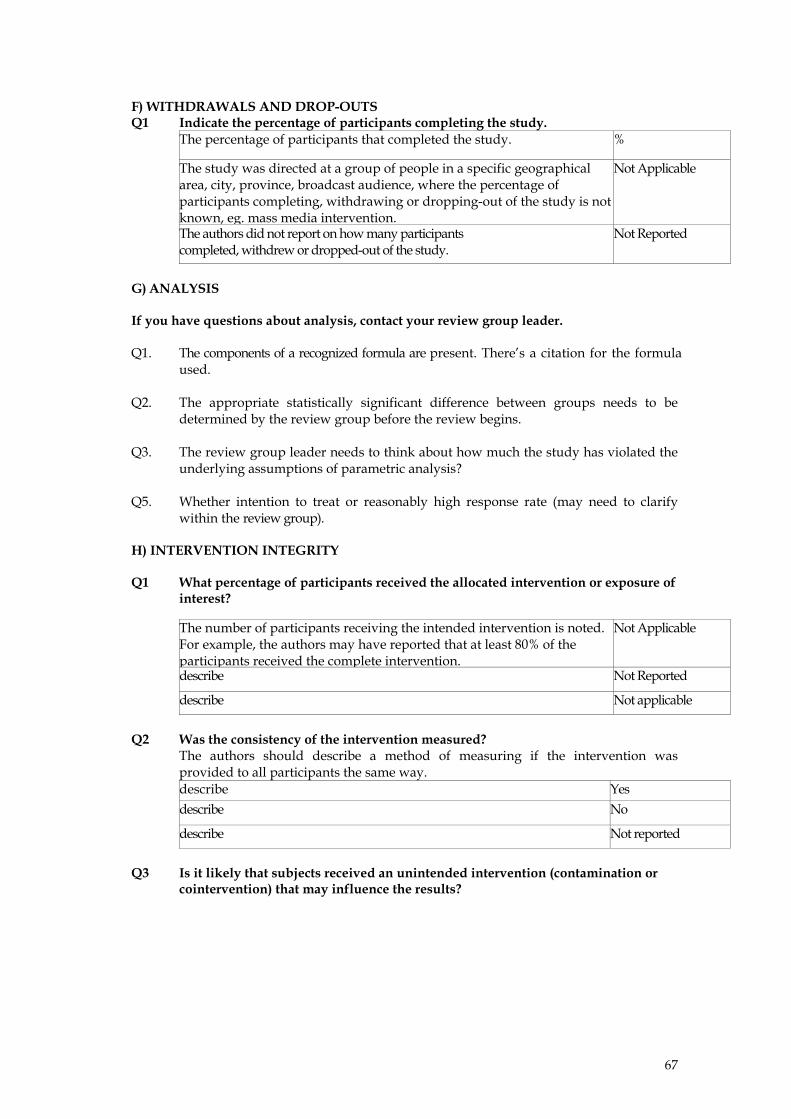
F) WITHDRAWALS AND DROP-OUTS Q1 Indicate the percentage of participants completing the study.
The percentage of participants that completed the study.
%
The study was directed at a group of people in a specific geographical area, city, province, broadcast audience, where the percentage of participants completing, withdrawing or dropping-out of the study is not known, eg. mass media intervention.
Not Applicable
The authors did not report on how many participants completed, withdrew or dropped-out of the study.
Not Reported
G) ANALYSIS If you have questions about analysis, contact your review group leader. Q1. The components of a recognized formula are present. There’s a citation for the formula
used. Q2. The appropriate statistically significant difference between groups needs to be
determined by the review group before the review begins. Q3. The review group leader needs to think about how much the study has violated the
underlying assumptions of parametric analysis? Q5. Whether intention to treat or reasonably high response rate (may need to clarify
within the review group). H) INTERVENTION INTEGRITY Q1 What percentage of participants received the allocated intervention or exposure of
interest?
The number of participants receiving the intended intervention is noted. For example, the authors may have reported that at least 80% of the participants received the complete intervention.
Not Applicable
describe Not Reported
describe Not applicable
Q2 Was the consistency of the intervention measured?
The authors should describe a method of measuring if the intervention was provided to all participants the same way. describe Yes describe No
describe Not reported
Q3 Is it likely that subjects received an unintended intervention (contamination or
cointervention) that may influence the results?
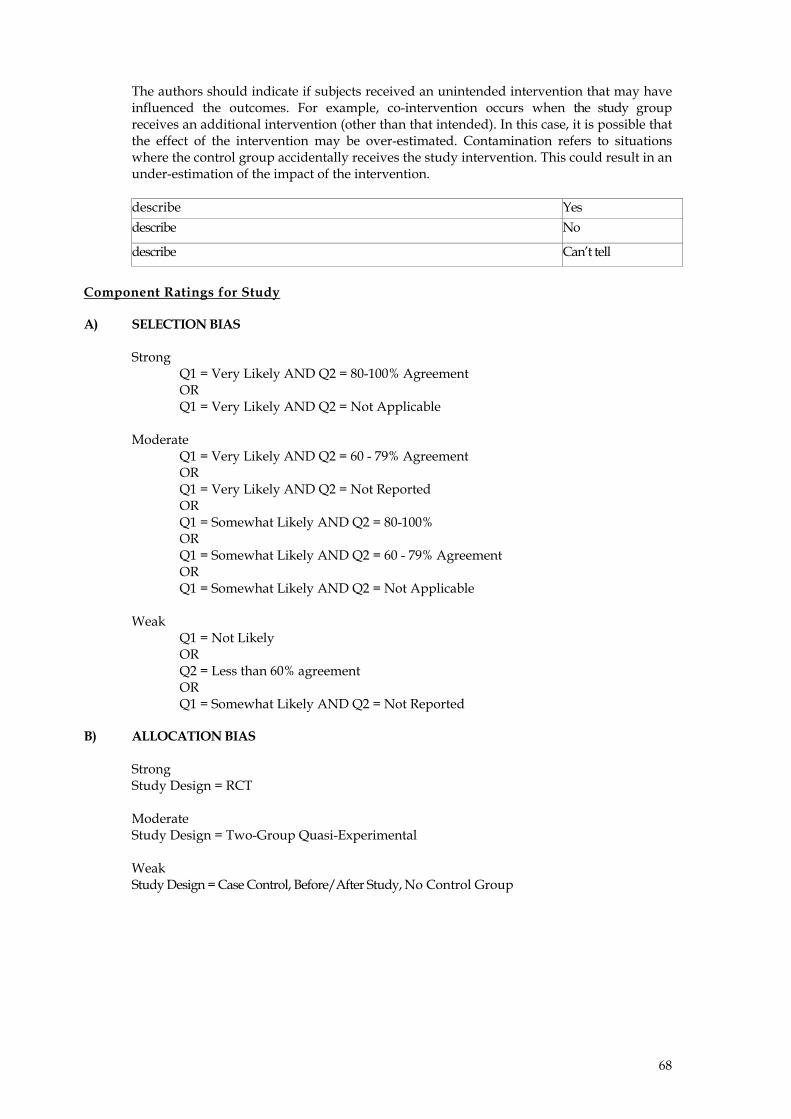
68
The authors should indicate if subjects received an unintended intervention that may have influenced the outcomes. For example, co-intervention occurs when the study group receives an additional intervention (other than that intended). In this case, it is possible that the effect of the intervention may be over-estimated. Contamination refers to situations where the control group accidentally receives the study intervention. This could result in an under-estimation of the impact of the intervention. describe Yes describe No
describe Can’t tell
Component Ratings for Study A) SELECTION BIAS
Strong
Q1 = Very Likely AND Q2 = 80-100% Agreement OR Q1 = Very Likely AND Q2 = Not Applicable
Moderate
Q1 = Very Likely AND Q2 = 60 - 79% Agreement OR Q1 = Very Likely AND Q2 = Not Reported OR Q1 = Somewhat Likely AND Q2 = 80-100% OR Q1 = Somewhat Likely AND Q2 = 60 - 79% Agreement OR Q1 = Somewhat Likely AND Q2 = Not Applicable
Weak
Q1 = Not Likely OR Q2 = Less than 60% agreement OR Q1 = Somewhat Likely AND Q2 = Not Reported
B) ALLOCATION BIAS
Strong Study Design = RCT
Moderate Study Design = Two-Group Quasi-Experimental
Weak Study Design = Case Control, Before/After Study, No Control Group
69
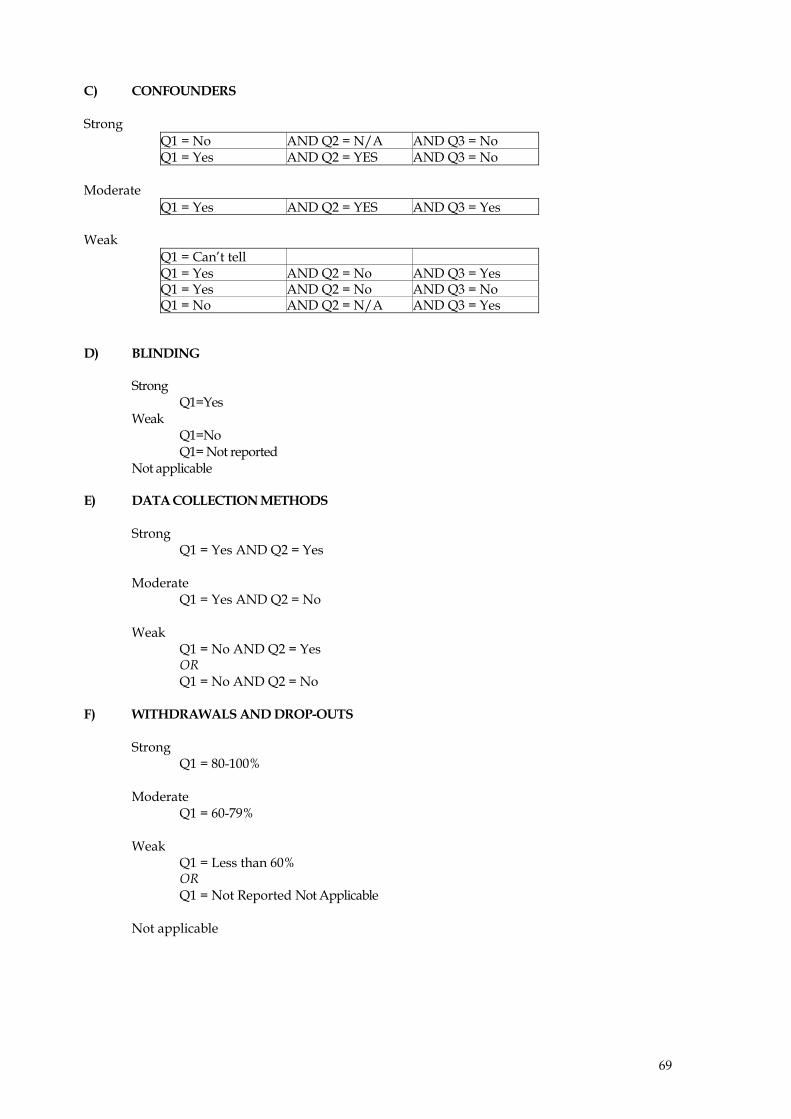
C) CONFOUNDERS Strong
Q1 = No AND Q2 = N/A AND Q3 = No Q1 = Yes AND Q2 = YES AND Q3 = No
Moderate
Q1 = Yes AND Q2 = YES AND Q3 = Yes Weak
Q1 = Can’t tell Q1 = Yes AND Q2 = No AND Q3 = Yes Q1 = Yes AND Q2 = No AND Q3 = No Q1 = No AND Q2 = N/A AND Q3 = Yes
D) BLINDING Strong Q1=Yes Weak Q1=No Q1= Not reported Not applicable E) DATA COLLECTION METHODS
Strong Q1 = Yes AND Q2 = Yes
Moderate
Q1 = Yes AND Q2 = No
Weak Q1 = No AND Q2 = Yes OR Q1 = No AND Q2 = No
F) WITHDRAWALS AND DROP-OUTS
Strong
Q1 = 80-100%
Moderate Q1 = 60-79%
Weak
Q1 = Less than 60% OR Q1 = Not Reported Not Applicable
Not applicable

70
71
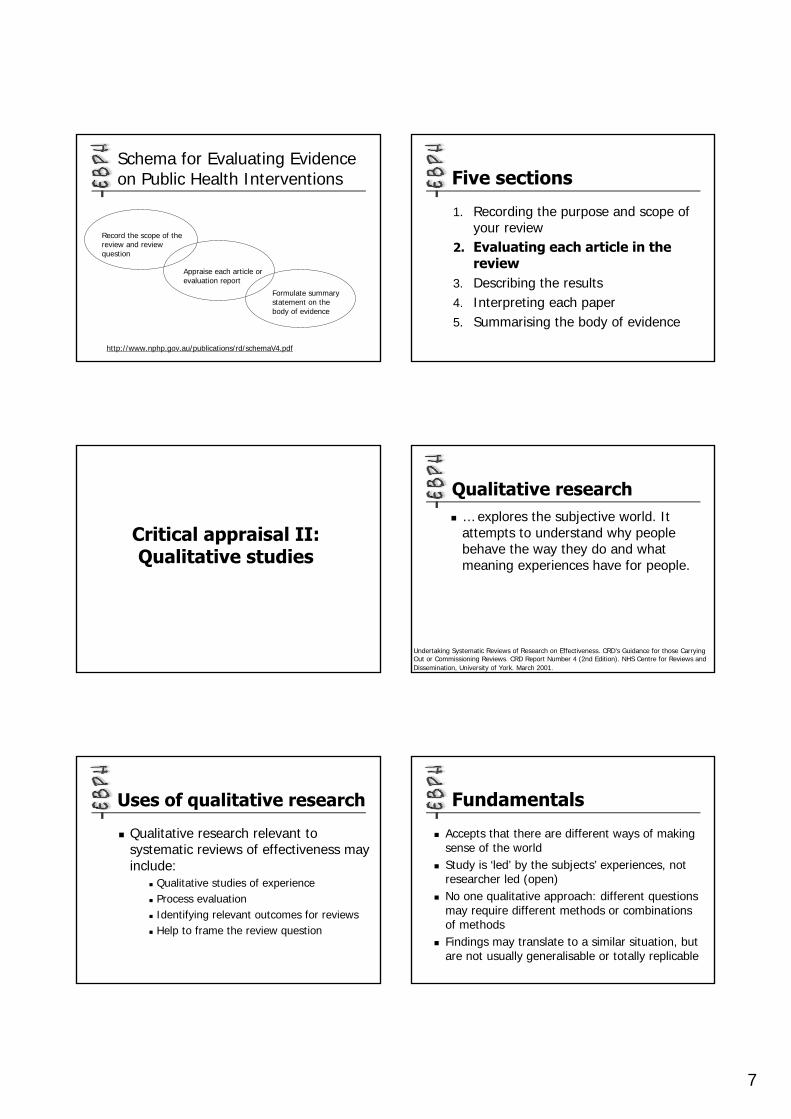
2) QUALITATIVE STUDIES Qualitative research explores the subjective world. It attempts to understand why people behave the way they do and what meaning experiences have for people.1 Qualitative research may be included in a review to shed light on whether the intervention is suitable for a specific target group, whether special circumstances have influenced the intervention, what factors might have contributed if an intervention did not have the expected effects, what difficulties must be overcome if the study is to be generalised to other populations.2 These are all important questions often asked by the users of systematic reviews. Reviewers may choose from a number of checklists available to assess the quality of qualitative research. Sources of information on quality appraisal include:
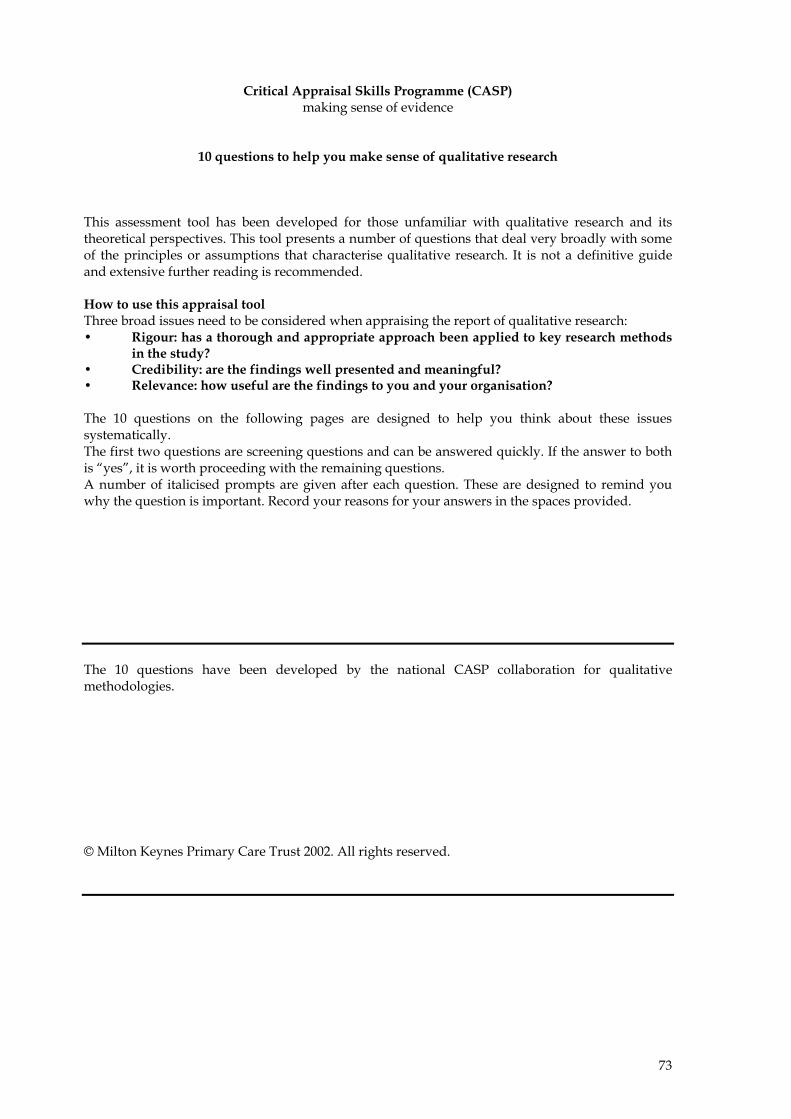
- CASP appraisal tool for Qualitative Research – included in this manual, http://www.phru.nhs.uk/casp/qualitat.htm
- Spencer L, Ritchie J, Lewis J, Dillon L. Quality in Qualitative Evaluation: A framework for assessing research evidence. Government Chief Social Researcher’s Office. Crown Copyright, 2003. www.strategy.gov.uk/files/pdf/Quality_framework.pdf
- Health Care Practice Research and Development Unit (HCPRDU), University of Salford, UK. Evaluation Tool for Qualitative Studies, http://www.fhsc.salford.ac.uk/hcprdu/tools/qualitative.htm
- Greenhalgh T, Taylor R. Papers that go beyond numbers (qualitative research). BMJ 1997;315:740‐3.
- Popay J, Rogers A, Williams G. Rationale and standards for the systematic review of qualitative literature in health services research. Qual Health Res 1998;8:341‐51.
- Mays N, Pope C. Rigour and qualitative research. BMJ 1995;311:109‐12. In relation to the appraisal of process evaluations the EPPI‐Centre has developed a 12‐question checklist, available at: http://eppi.ioe.ac.uk/EPPIWeb/home.aspx?page=/hp/reports/phase/phase_process.htm.
REFERENCES
1. Undertaking Systematic Reviews of Research on Effectiveness. CRD’s Guidance for those
Carrying Out or Commissioning Reviews. CRD Report Number 4 (2nd Edition). NHS Centre for Reviews and Dissemination, University of York. March 2001. http://www.york.ac.uk/inst/crd/report4.htm
2. Hedin A, and Kallestal C. Knowledge‐based public health work. Part 2: Handbook for
compilation of reviews on interventions in the field of public health. National Institute of Public Health. 2004. http://www.fhi.se/shop/material_pdf/r200410Knowledgebased2.pdf
ADDITIONAL READING
Jones R. Why do qualitative research? BMJ 1995;311:2.

72
Pope C, Mays N. Qualitative Research: Reaching the parts other methods cannot reach: an introduction to qualitative methods in health and health services research. BMJ 1995;311:42‐45. EXERCISE 1. Appraise the qualitative study using the Critical Appraisal Skills Programme (CASP)
qualitative worksheet in small groups and report back to the group. “Cass A, Lowell A, Christie M, Snelling PL, Flack M, Marrnganyin B, Brown I. Sharing the true stories: improving communication between Aboriginal patients and healthcare workers. Med J Aust 2002;176:466‐70.”
73
Critical Appraisal Skills Programme (CASP) making sense of evidence
10 questions to help you make sense of qualitative research
This assessment tool has been developed for those unfamiliar with qualitative research and its theoretical perspectives. This tool presents a number of questions that deal very broadly with some of the principles or assumptions that characterise qualitative research. It is not a definitive guide and extensive further reading is recommended. How to use this appraisal tool Three broad issues need to be considered when appraising the report of qualitative research: • Rigour: has a thorough and appropriate approach been applied to key research methods
in the study? • Credibility: are the findings well presented and meaningful? • Relevance: how useful are the findings to you and your organisation? The 10 questions on the following pages are designed to help you think about these issues systematically. The first two questions are screening questions and can be answered quickly. If the answer to both is “yes”, it is worth proceeding with the remaining questions. A number of italicised prompts are given after each question. These are designed to remind you why the question is important. Record your reasons for your answers in the spaces provided. The 10 questions have been developed by the national CASP collaboration for qualitative methodologies. © Milton Keynes Primary Care Trust 2002. All rights reserved.
74
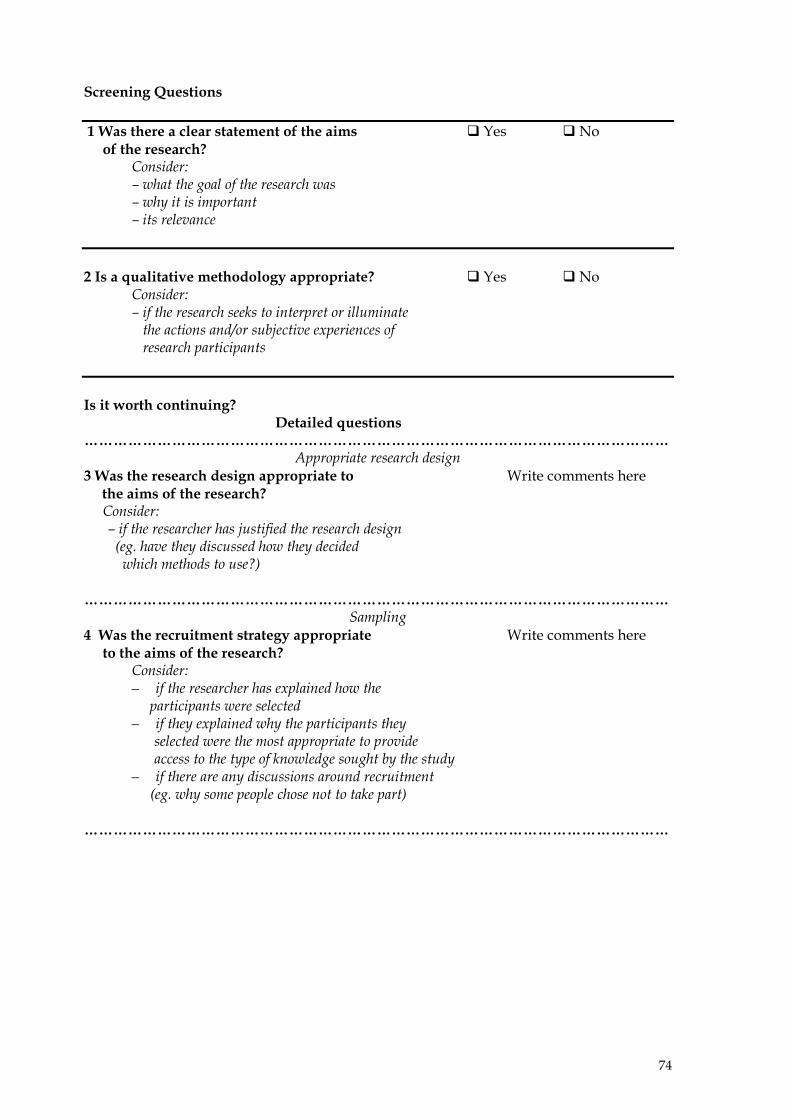
Screening Questions 1 Was there a clear statement of the aims Yes No of the research?
Consider: – what the goal of the research was – why it is important – its relevance
2 Is a qualitative methodology appropriate? Yes No
Consider: – if the research seeks to interpret or illuminate the actions and/or subjective experiences of research participants
Is it worth continuing? Detailed questions …………………………………………………………………………………………………………
Appropriate research design 3 Was the research design appropriate to Write comments here the aims of the research? Consider:
– if the researcher has justified the research design (eg. have they discussed how they decided which methods to use?)
………………………………………………………………………………………………………… Sampling
4 Was the recruitment strategy appropriate Write comments here to the aims of the research?
Consider: – if the researcher has explained how the
participants were selected – if they explained why the participants they
selected were the most appropriate to provide access to the type of knowledge sought by the study
– if there are any discussions around recruitment (eg. why some people chose not to take part)
…………………………………………………………………………………………………………
75
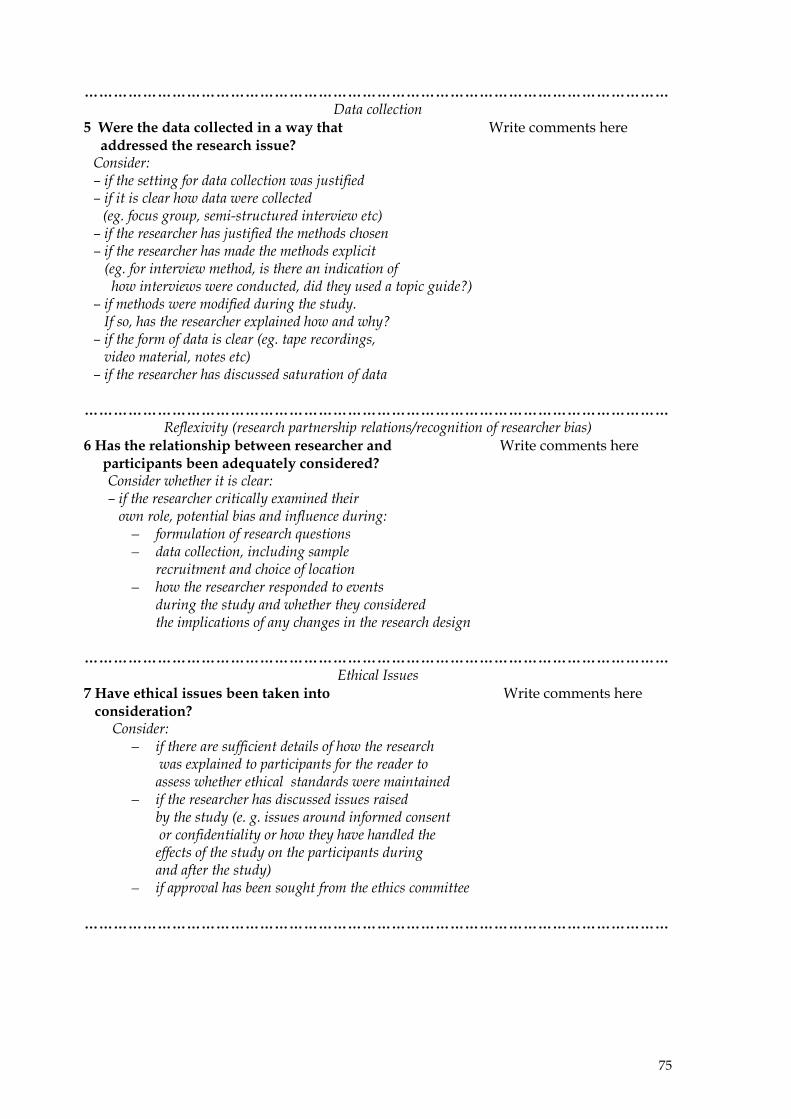
………………………………………………………………………………………………………… Data collection
5 Were the data collected in a way that Write comments here addressed the research issue? Consider: – if the setting for data collection was justified – if it is clear how data were collected
(eg. focus group, semi-structured interview etc) – if the researcher has justified the methods chosen – if the researcher has made the methods explicit (eg. for interview method, is there an indication of how interviews were conducted, did they used a topic guide?) – if methods were modified during the study. If so, has the researcher explained how and why? – if the form of data is clear (eg. tape recordings, video material, notes etc) – if the researcher has discussed saturation of data
…………………………………………………………………………………………………………
Reflexivity (research partnership relations/recognition of researcher bias) 6 Has the relationship between researcher and Write comments here
participants been adequately considered? Consider whether it is clear: – if the researcher critically examined their own role, potential bias and influence during:
– formulation of research questions – data collection, including sample
recruitment and choice of location – how the researcher responded to events
during the study and whether they considered the implications of any changes in the research design
………………………………………………………………………………………………………… Ethical Issues
7 Have ethical issues been taken into Write comments here consideration?
Consider: – if there are sufficient details of how the research
was explained to participants for the reader to assess whether ethical standards were maintained
– if the researcher has discussed issues raised by the study (e. g. issues around informed consent or confidentiality or how they have handled the effects of the study on the participants during and after the study)
– if approval has been sought from the ethics committee
…………………………………………………………………………………………………………
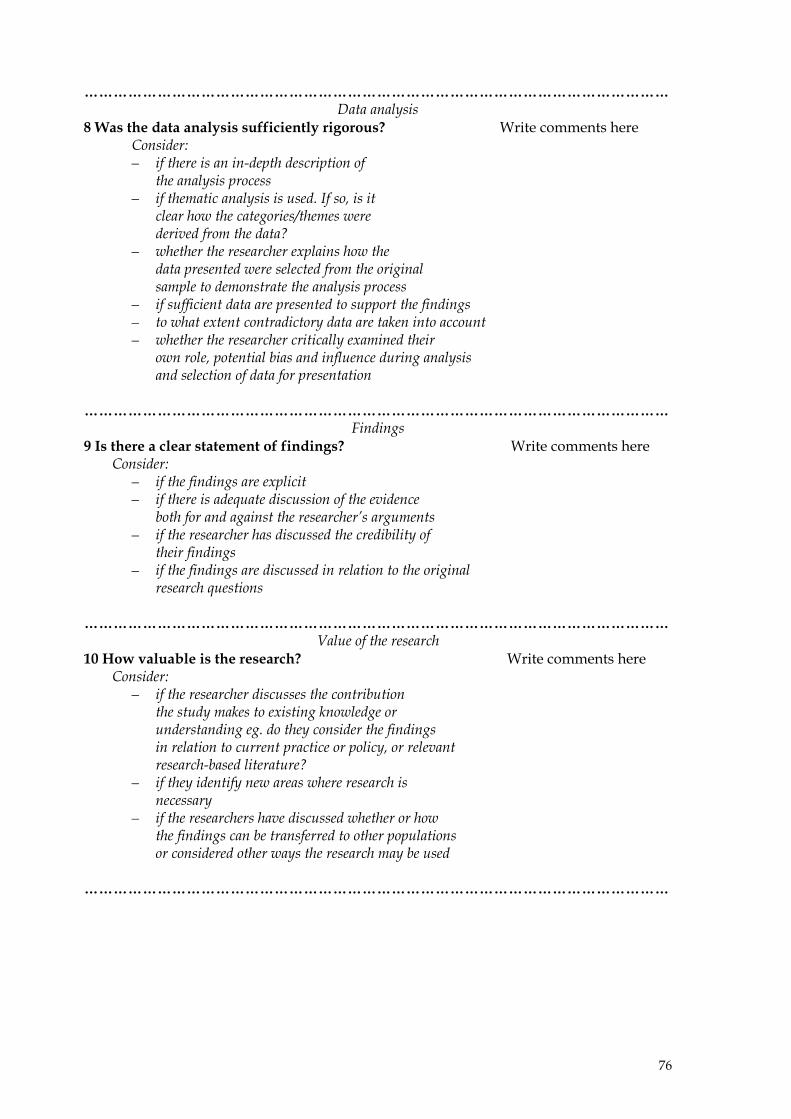
76
………………………………………………………………………………………………………… Data analysis
8 Was the data analysis sufficiently rigorous? Write comments here Consider: – if there is an in-depth description of
the analysis process – if thematic analysis is used. If so, is it
clear how the categories/themes were derived from the data?
– whether the researcher explains how the data presented were selected from the original sample to demonstrate the analysis process
– if sufficient data are presented to support the findings – to what extent contradictory data are taken into account – whether the researcher critically examined their
own role, potential bias and influence during analysis and selection of data for presentation
………………………………………………………………………………………………………… Findings
9 Is there a clear statement of findings? Write comments here Consider:
– if the findings are explicit – if there is adequate discussion of the evidence
both for and against the researcher’s arguments – if the researcher has discussed the credibility of
their findings – if the findings are discussed in relation to the original
research questions
………………………………………………………………………………………………………… Value of the research
10 How valuable is the research? Write comments here Consider:
– if the researcher discusses the contribution the study makes to existing knowledge or understanding eg. do they consider the findings in relation to current practice or policy, or relevant research-based literature?
– if they identify new areas where research is necessary
– if the researchers have discussed whether or how the findings can be transferred to other populations or considered other ways the research may be used
…………………………………………………………………………………………………………

77
The Schema for Evaluating Evidence on Public Health Interventions The Schema includes questions that encourage reviewers of evidence to consider whether the evidence demonstrates that an intervention was adequately implemented in the evaluation setting(s), whether information is provided about the implementation context, and whether interactions that occur between public health interventions and their context were assessed and reported. It is used to appraise individual papers and to formulate a summary statement about those articles and reports. The Schema can be downloaded from: http://www.nphp.gov.au/publications/phpractice/schemaV4.pdf.
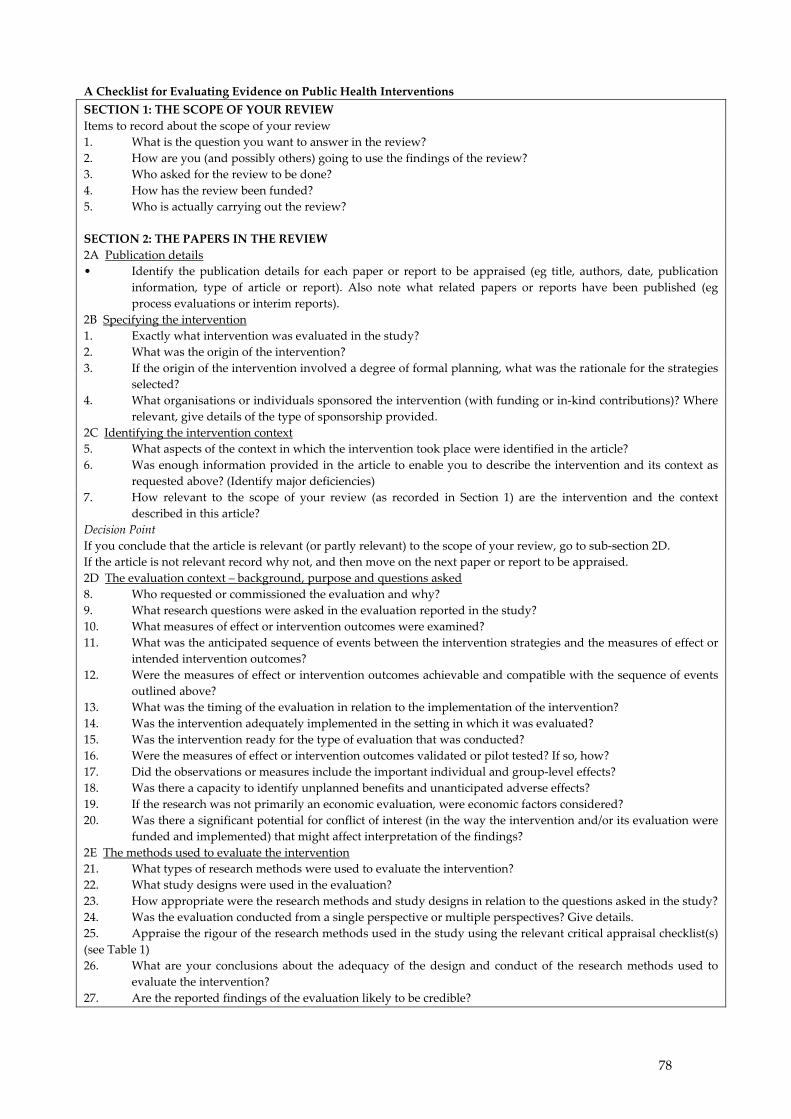
78
A Checklist for Evaluating Evidence on Public Health Interventions SECTION 1: THE SCOPE OF YOUR REVIEW Items to record about the scope of your review 1. What is the question you want to answer in the review? 2. How are you (and possibly others) going to use the findings of the review? 3. Who asked for the review to be done? 4. How has the review been funded? 5. Who is actually carrying out the review? SECTION 2: THE PAPERS IN THE REVIEW 2A Publication details • Identify the publication details for each paper or report to be appraised (eg title, authors, date, publication
information, type of article or report). Also note what related papers or reports have been published (eg process evaluations or interim reports).
2B Specifying the intervention 1. Exactly what intervention was evaluated in the study? 2. What was the origin of the intervention? 3. If the origin of the intervention involved a degree of formal planning, what was the rationale for the strategies
selected? 4. What organisations or individuals sponsored the intervention (with funding or in‐kind contributions)? Where
relevant, give details of the type of sponsorship provided. 2C Identifying the intervention context 5. What aspects of the context in which the intervention took place were identified in the article? 6. Was enough information provided in the article to enable you to describe the intervention and its context as
requested above? (Identify major deficiencies) 7. How relevant to the scope of your review (as recorded in Section 1) are the intervention and the context
described in this article? Decision Point If you conclude that the article is relevant (or partly relevant) to the scope of your review, go to sub‐section 2D. If the article is not relevant record why not, and then move on the next paper or report to be appraised. 2D The evaluation context – background, purpose and questions asked 8. Who requested or commissioned the evaluation and why? 9. What research questions were asked in the evaluation reported in the study? 10. What measures of effect or intervention outcomes were examined? 11. What was the anticipated sequence of events between the intervention strategies and the measures of effect or
intended intervention outcomes? 12. Were the measures of effect or intervention outcomes achievable and compatible with the sequence of events
outlined above? 13. What was the timing of the evaluation in relation to the implementation of the intervention? 14. Was the intervention adequately implemented in the setting in which it was evaluated? 15. Was the intervention ready for the type of evaluation that was conducted? 16. Were the measures of effect or intervention outcomes validated or pilot tested? If so, how? 17. Did the observations or measures include the important individual and group‐level effects? 18. Was there a capacity to identify unplanned benefits and unanticipated adverse effects? 19. If the research was not primarily an economic evaluation, were economic factors considered? 20. Was there a significant potential for conflict of interest (in the way the intervention and/or its evaluation were
funded and implemented) that might affect interpretation of the findings? 2E The methods used to evaluate the intervention 21. What types of research methods were used to evaluate the intervention? 22. What study designs were used in the evaluation? 23. How appropriate were the research methods and study designs in relation to the questions asked in the study? 24. Was the evaluation conducted from a single perspective or multiple perspectives? Give details. 25. Appraise the rigour of the research methods used in the study using the relevant critical appraisal checklist(s) (see Table 1) 26. What are your conclusions about the adequacy of the design and conduct of the research methods used to
evaluate the intervention? 27. Are the reported findings of the evaluation likely to be credible?
79
Decision Point If you conclude from Section 2 that the reported findings are likely to be credible go to Section 3. If the findings are unlikely to be credible go to Section 4 to answer question 2 only, and then move to the next paper to be appraised. SECTION 3: DESCRIBING THE RESULTS FROM THE PAPERS SELECTED The study findings 1. What findings were reported in the study? 2. If the study specified measurable or quantifiable targets, did the intervention achieve these objectives? 3. Were reported intervention effects examined among sub‐groups of the target population? 4. Should any other important sub‐group effects have been considered that were not considered? 5. Was the influence of the intervention context on the effectiveness of the intervention investigated in the study? 6. How dependent on the context is the intervention described in the article? 7. Were the intervention outcomes sustainable? 8. Did the study examine and report on the value of the measured effects to parties interested in or affected by
them? SECTION 4: INTERPRETING EACH ARTICLE Your interpretations 1. How well did the study answer your review question(s)? Give details. 2. Are there other lessons to be learned from this study (eg lessons for future evaluations) Decision Point If you are conducting the review for the purpose of making recommendations for a particular policy or practice setting, continue in Section 4 to answer questions 3 – 8. Otherwise move on to Section 5. 3. Are the essential components of the intervention and its implementation described with sufficient detail and
precision to be reproducible? 4. Is the intervention context, as described in the article being examined, comparable to the intervention context
that is being considered for future implementation of the intervention? 5. Are the characteristics of the target group studied in the article comparable to the target group for whom the
intervention is being considered? 6. If an economic evaluation was conducted, did the paper or report include and address the details required in
order to make an informed assessment about the applicability and transferability of the findings to other settings?
7. If enough information was provided, are the findings of the economic evaluation relevant and transferable to your setting?
8. Are the effects of the intervention likely to be considered important in your setting? SECTION 5: SUMMARISING THE BODY OF EVIDENCE 5A Grouping, rating and weighing up the papers and reports (see Table 2 for example of presenting findings) 1. Group articles with similar research questions and similar intervention strategies. With each group, complete
the following: 2. Rate the quality of each study, from 1 (weak) to 3 (strong). 3. Assess the consistency of the findings among the stronger studies, from 1 (inconsistent) to 3 (consistent). 4. Determine the degree to which the stronger studies with consistent findings are applicable to your review
context. 5A Formulating a summary statement 5. Did studies that examined similar intervention strategies, with similar research questions, produce consistent
results? 6. Did studies with different research questions produce compatible results? 7. Overall, what does the body of evidence tell you about the intervention? 8. Are there important gaps in the evidence? If so, what are they? 9. To what degree are the review findings useful for your purposes, as identified in Section 1? 10. What are your recommendations based on this review?

80
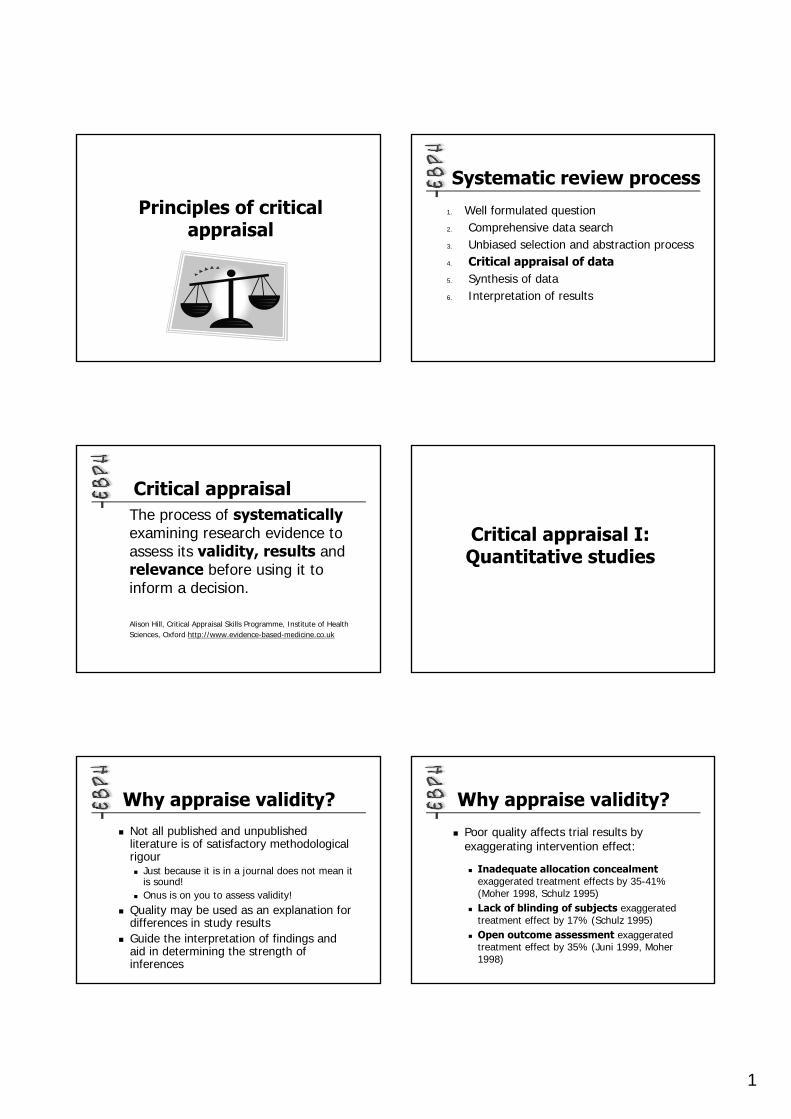
1
Principles of critical appraisal
Systematic review process
1. Well formulated question2. Comprehensive data search3. Unbiased selection and abstraction process4. Critical appraisal of data5. Synthesis of data6. Interpretation of results
Critical appraisalThe process of systematicallyexamining research evidence to assess its validity, results and relevance before using it to inform a decision.
Alison Hill, Critical Appraisal Skills Programme, Institute of Health Sciences, Oxford http://www.evidence-based-medicine.co.uk
Critical appraisal I: Quantitative studies
Why appraise validity?Not all published and unpublished literature is of satisfactory methodological rigour
Just because it is in a journal does not mean it is sound!Onus is on you to assess validity!
Quality may be used as an explanation for differences in study resultsGuide the interpretation of findings and aid in determining the strength of inferences
Why appraise validity?
Poor quality affects trial results by exaggerating intervention effect:
Inadequate allocation concealmentexaggerated treatment effects by 35-41% (Moher 1998, Schulz 1995)Lack of blinding of subjects exaggerated treatment effect by 17% (Schulz 1995)Open outcome assessment exaggerated treatment effect by 35% (Juni 1999, Moher 1998)
2
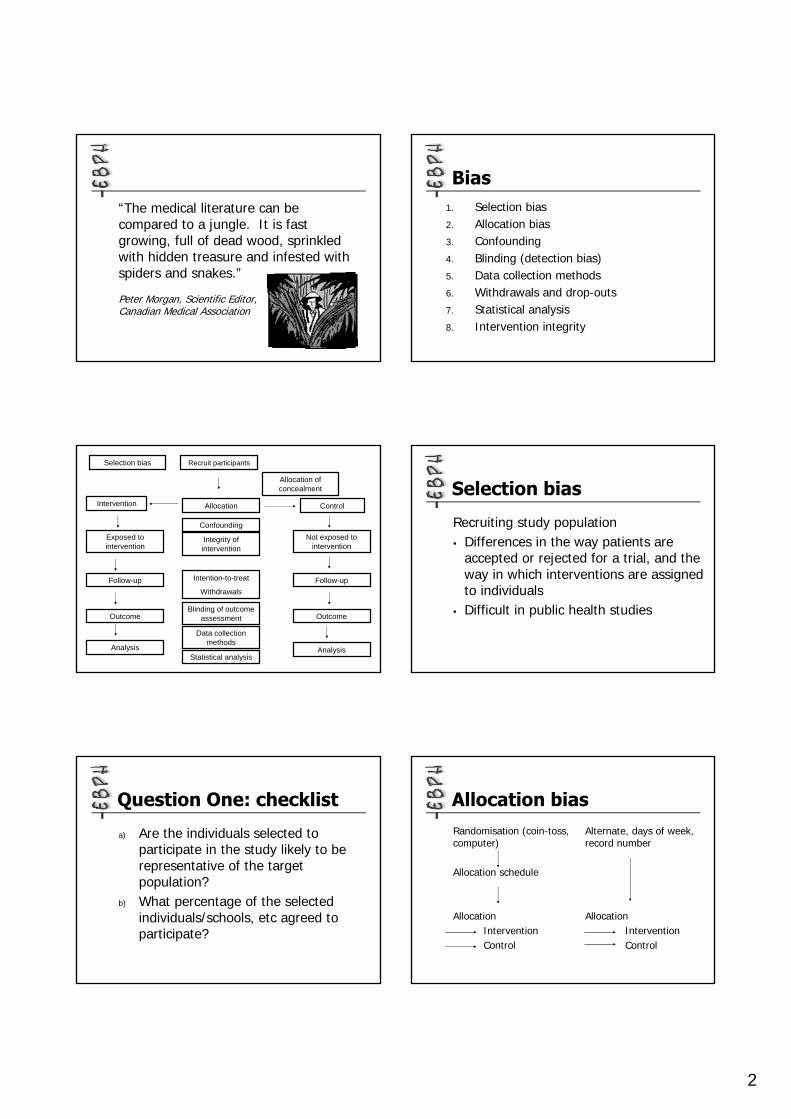
“The medical literature can be compared to a jungle. It is fast growing, full of dead wood, sprinkled with hidden treasure and infested with spiders and snakes.”
Peter Morgan, Scientific Editor,Canadian Medical Association
Bias1. Selection bias2. Allocation bias3. Confounding4. Blinding (detection bias)5. Data collection methods6. Withdrawals and drop-outs7. Statistical analysis8. Intervention integrity
Recruit participants
Allocation
Exposed to intervention
Not exposed to intervention
Follow-upFollow-up
Outcome Outcome
Allocation of concealment
Blinding of outcome assessment
Intention-to-treat
Withdrawals
Data collection methods
Selection bias
Integrity of intervention
Intervention Control
Analysis AnalysisStatistical analysis
Confounding
Selection bias
Recruiting study populationDifferences in the way patients are accepted or rejected for a trial, and the way in which interventions are assigned to individualsDifficult in public health studies
Question One: checklist
a) Are the individuals selected to participate in the study likely to be representative of the target population?
b) What percentage of the selected individuals/schools, etc agreed to participate?
Allocation biasRandomisation (coin-toss, computer)
Allocation schedule
Allocation InterventionControl
Alternate, days of week, record number
Allocation InterventionControl
3
Allocation biasNeed comparable groups
Randomisation = similar groups at baseline
Allocation schedule should not be administered by person who is responsible for the study to prevent manipulation
Concealed allocation?
Lancet 2002; 359:614-18.
Allocation biasReduced by:
centralised randomisationon-site computer system with group assignments in a locked filesequentially numbered, sealed, opaque envelopesany statement that provides reassurance that the person who generated the allocation scheme did not administer itNot: alternation, dates of birth, day of week.
Question Two: checklist
Allocation bias: Type of study designRCTQuasi-experimentalUncontrolled study
ConfoundingNeed similar groups at baseline
Determine which factors could confound the association of the intervention and outcome
Non-randomised studies – can never adjust for unknown confounding factors (and difficulties in measuring known confounding factors)
If confounding – adjusted for in analysis
Question Three: checklist
Confounders:Prior to intervention, were there differences for important confounders reported?Were the confounders adequately managed in the analysis?Were there important confounders not reported?
4
Blinding outcome assessorsDetection bias –
Blinding of outcome assessors to prevent systematic differences between groups in the outcome assessment
Question Four: checklist
BlindingWere the outcome assessors blind to the intervention status of participants?
YesNoNot applicable (if self-reported)Not reported
Data collection methods
More often subjective outcomes in health promotion
Require valid and reliable tools
Question Five: checklist
Data collection methodsWere data collection methods shown or known to be valid and reliable for the outcome of interest?
Withdrawals from studyAttrition bias -
Systematic differences between groups in losses of participants from the study
Look at withdrawals, drop-outs
Question Six: checklist
Withdrawals and drop-outsWhat is the percentage of participants completing the study?
5
Statistical analysis
Power / sample size calculationIntention-to-treat
Cluster studiesAllocate by school/community etcGenerally analyse at individual level
Unit of analysis errorsAppropriate sample size determination
Question Seven: checklist
Is there a sample size calculation?Is there a statistically significant difference between groups?Are the statistical methods appropriate?Unit of allocation and analysis?
Was a cluster analysis done?
Intention to treat analysis
Integrity of intervention
= Fidelity= Implementation= Delivery of intervention as planned
Integrity of intervention
PH/HP are complex – multiple componentsIntegrity – delivery of intervention
Adherence to specified programExposure – no. of sessions, length, frequencyQuality of deliveryParticipant responsivenessPotential for contamination
RELATED TO FEASIBILITY
School-based AIDS program
19-lesson comprehensive school based program
Unit 1: Basic information on HIV/AIDSUnit 2: Responsible behaviour: delaying sexUnit 3: Responsible behaviour: protected sexUnit 4: Caring for people with AIDS
School-based AIDS program
Program had no effect on knowledge and attitudes and intended behaviourNo contaminationFocus groups:
Program not implementedRole plays and condoms not coveredTeachers only taught topics they preferred
Shortage of class time, condoms is controversial, teachers left or died
6
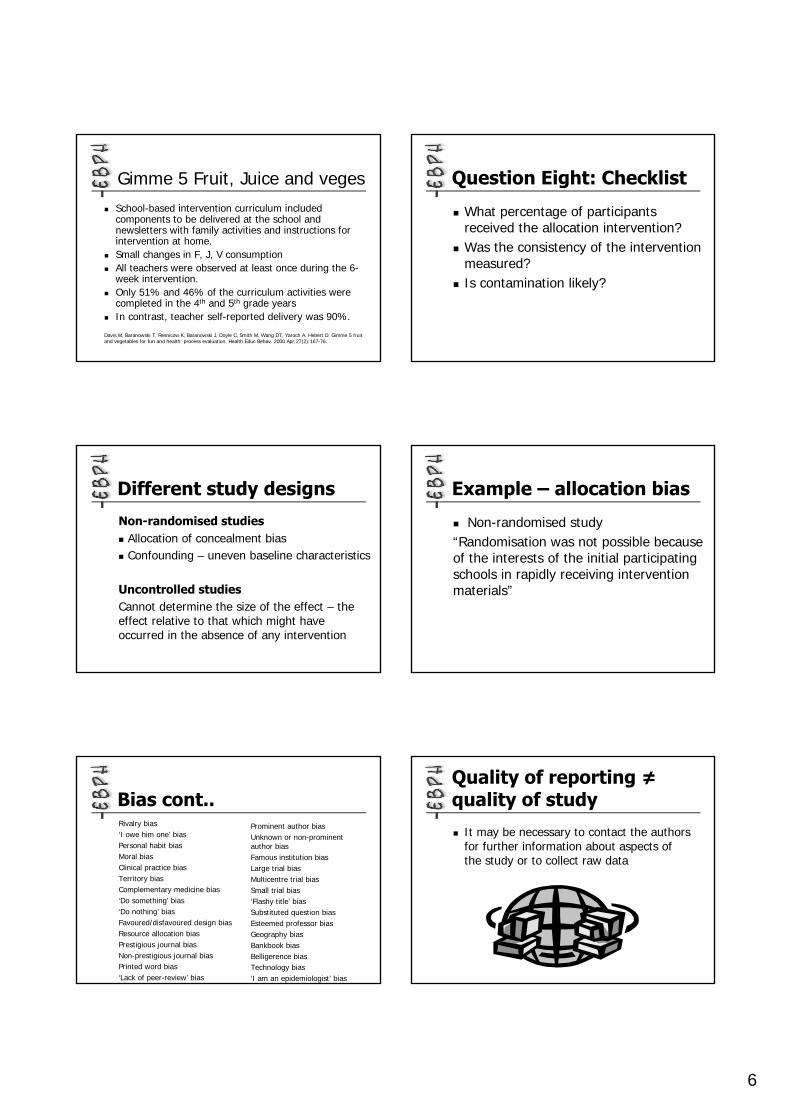
Gimme 5 Fruit, Juice and vegesSchool-based intervention curriculum included components to be delivered at the school and newsletters with family activities and instructions for intervention at home.Small changes in F, J, V consumptionAll teachers were observed at least once during the 6-week intervention. Only 51% and 46% of the curriculum activities were completed in the 4th and 5th grade yearsIn contrast, teacher self-reported delivery was 90%.
Davis M, Baranowski T, Resnicow K, Baranowski J, Doyle C, Smith M, Wang DT, Yaroch A, Hebert D. Gimme 5 fruit and vegetables for fun and health: process evaluation. Health Educ Behav. 2000 Apr;27(2):167-76.
Question Eight: Checklist
What percentage of participants received the allocation intervention?Was the consistency of the intervention measured?Is contamination likely?
Different study designs
Non-randomised studiesAllocation of concealment biasConfounding – uneven baseline characteristics
Uncontrolled studiesCannot determine the size of the effect – the effect relative to that which might have occurred in the absence of any intervention
Example – allocation bias
Non-randomised study“Randomisation was not possible because of the interests of the initial participating schools in rapidly receiving intervention materials”
Bias cont..Rivalry bias‘I owe him one’ biasPersonal habit biasMoral biasClinical practice biasTerritory biasComplementary medicine bias‘Do something’ bias‘Do nothing’ biasFavoured/disfavoured design biasResource allocation biasPrestigious journal biasNon-prestigious journal biasPrinted word bias‘Lack of peer-review’ bias
Prominent author biasUnknown or non-prominent author biasFamous institution biasLarge trial biasMulticentre trial biasSmall trial bias‘Flashy title’ biasSubstituted question biasEsteemed professor biasGeography biasBankbook biasBelligerence biasTechnology bias‘I am an epidemiologist’ bias
Quality of reporting ≠ quality of study
It may be necessary to contact the authors for further information about aspects of the study or to collect raw data
7
Schema for Evaluating Evidence on Public Health Interventions
Record the scope of the review and review question
Appraise each article or evaluation report
Formulate summary statement on the body of evidence
http://www.nphp.gov.au/publications/rd/schemaV4.pdf
Five sections
1. Recording the purpose and scope of your review
2. Evaluating each article in the review
3. Describing the results4. Interpreting each paper5. Summarising the body of evidence
Critical appraisal II: Qualitative studies
Qualitative research… explores the subjective world. It attempts to understand why people behave the way they do and what meaning experiences have for people.
Undertaking Systematic Reviews of Research on Effectiveness. CRD’s Guidance for those Carrying Out or Commissioning Reviews. CRD Report Number 4 (2nd Edition). NHS Centre for Reviews and Dissemination, University of York. March 2001.
Uses of qualitative research
Qualitative research relevant to systematic reviews of effectiveness may include:
Qualitative studies of experienceProcess evaluationIdentifying relevant outcomes for reviewsHelp to frame the review question
Fundamentals
Accepts that there are different ways of making sense of the worldStudy is ‘led’ by the subjects’ experiences, not researcher led (open)No one qualitative approach: different questions may require different methods or combinations of methodsFindings may translate to a similar situation, but are not usually generalisable or totally replicable
8
CASP appraisal checklist1. Clear aims of research (goals, why it is
important, relevance)2. Appropriate methodology3. Sampling strategy4. Data collection5. Relationship between researcher and
participants6. Ethical issues7. Data analysis8. Findings9. Value of research (context dependent)
1. Aim of research
Describes why the research is being carried out
GoalImportanceRelevance
2. Appropriate methodology
Does it address any of the following?What is happening?How does it happen?Why does it happen?
Eg, why women choose to breastfeed, why is there miscommunication, how did the intervention work?
3. Qualitative research methods
Observation – non-verbal and verbal behaviour by notes, audio, video
Interviews – semi- or unstructured
Text – diaries, case notes, letters
Focus groups – semi- or unstructured
4. Recruitment method
How were participants selected?Eg. Maximum variation approach?
Why was this method chosen?
5. Data collection
How was data collected?Did the researchers discuss saturation of data?Are the methods explicit?
9
6. ReflexivityTypes of interview
Meaning given to data questions asked
Area being studied Venue
Researcher
7. Ethical issues
ConsentConfidentialityProfessional responsibilityAdviceReporting
8. Data analysis
Interpretations are made by the researcher
Often uses thematic analysisTranscribe data, re-reads it and codes it into themes/categories
Is there a description of the analysis?How were the themes derived?
Credibility of the analysis
Method of analysisClarity of approachUse of all of the dataTriangulationRespondent validation
9. Statement of findings
Findings are explicitQuality of the argumentReplicability by another researcherAlternative explanations explored
10. Value of research
Contribution to knowledgePotential new areas of research or interventionsApplicability of results
10
Other qualitative checklist
See NHS CRD Report Number 4http://www.york.ac.uk/inst/crd/report4.htm
Quality frameworkGovernment Chief Social Researcher’s Office, UK
http://www.strategy.gov.uk/files/pdf/Quality_framework.pdf