Unit Costs, Cost-Effectiveness, and Financing of Nutrition...
77
Policy Research WORKING PAPERS Population, Health, and Nutrtion Population andHuman Resources Department The World Bank August 1992 WPS 952 Unit Costs,Cost-Effectiveness, and Financing of Nutrition Interventions Susan Horton Relativeunit costsand cost-effectiveness for different nutrition interventions are reported here. The main impact of nutrition interventions assessed is not the reductionof mortalitybut the improvement in qualityof life for survivors. PDI;cyReseuchWo&ingPupaidissaninahcfndingsofwozkinpsgand enaogetheexchangoofideasamongBank staffand allotdeds in divcopmsmui& sucsepapers.distri utedbytheReseax chAdvisoyStaff.canythenamesofthcauhorsflct oydeairvibc.and shouldbused and itedaccordingly.Theftndings.intma utins. andcmtdudonsy othtaahonrown.ceyshould not be atunbuted to the Wodd Ban, its Board of Dimtrs, its management, or any of its member countrie& Public Disclosure Authorized Public Disclosure Authorized Public Disclosure Authorized Public Disclosure Authorized Public Disclosure Authorized Public Disclosure Authorized Public Disclosure Authorized Public Disclosure Authorized
Transcript of Unit Costs, Cost-Effectiveness, and Financing of Nutrition...

Policy Research
WORKING PAPERS
Population, Health, and Nutrtion
Population and Human ResourcesDepartment
The World BankAugust 1992
WPS 952
Unit Costs, Cost-Effectiveness,and Financing
of Nutrition Interventions
Susan Horton
Relative unit costs and cost-effectiveness for different nutritioninterventions are reported here. The main impact of nutritioninterventions assessed is not the reduction of mortality but theimprovement in quality of life for survivors.
PDI;cyReseuchWo&ingPupaidissaninahcfndingsofwozkinpsgand enaogetheexchangoofideasamongBank staff andallotdeds in divcopmsmui& sucsepapers.distri utedbytheReseax chAdvisoyStaff.canythenamesofthcauhorsflctoydeairvibc.and shouldbused and itedaccordingly.Theftndings.intma utins. andcmtdudonsy othtaahonrown.ceyshouldnot be atunbuted to the Wodd Ban, its Board of Dimtrs, its management, or any of its member countrie&
Pub
lic D
iscl
osur
e A
utho
rized
Pub
lic D
iscl
osur
e A
utho
rized
Pub
lic D
iscl
osur
e A
utho
rized
Pub
lic D
iscl
osur
e A
utho
rized
Pub
lic D
iscl
osur
e A
utho
rized
Pub
lic D
iscl
osur
e A
utho
rized
Pub
lic D
iscl
osur
e A
utho
rized
Pub
lic D
iscl
osur
e A
utho
rized

Polley Research
Population, Health, and Nulrltlon
WPS 952
This paper - a product of the Population, Health, and Nutrition Division, Population and HumanResources Department - is part of a larger effort in the department to quantify the costs of malnutritionand its alleviation. Copies of the paper are available free from the World Bank, 1818 H Street NW,Washington DC 20433. Please contact Otilia Nadora, room S6-065, extension 31091 (August 1992, 66pages).
Horton summarizes what is known about unit There is little difference in cost between pro-costs, the cost structure, cost-effectiveness, and grams operated by nongovenmuent organizationsfinancing of eight nutrition interventions: and those operated by governitiits. The morematemal and child health (MCH) feeding, school expensive programs are not necessarily less cost-feeding, nutrition education, the promotion of effective, but may include more complementarybreastfeeding, targeted food subsidies, micronu- inputs.tient supplementation, micronutrient fortifica-tion, and growth monitoring. Among items that * The cost per death averted was about $1,500she reports: for both a targeted supplementary feeding
program in Tamil Nadu and a vitamin A capsule* Mass media nutrition education campaigns distribution scheme in Bangladesh.
and the promotion of breastfeeding cost about$1-$5 per beneficiary; face-to-face nutrition * The cost per child removed from moderate.programs cost more ($23 per beneficiary in the and severe malnutrition ranged from $33 (TamilDominican Republic). Nadu) to $331 (targeted food subsidy, Pbilip-
pines) to $493 (face-to-face nutrition program,e Food distribution programs of different Dominican Republic).
types have fairly similar costs. For distributingabout 1,000 calories a day per beneficiary per * Nutrition expenditures seem to account foryear $75 for untargeted food rations, $64 for about 10 percent of health spending, both fortargeted food rations, $74 for MCH and school donors and for individual countries (Chile is anfeeding programs, and $134 for highly targeted outlier with 35 percent).feeding programs. Micronutrient interventionscost from $0.04 to $4 per person-year of protec- Impact data on these topics are scarce, andtion; supplementation is more expensive than these estimates should be interpreted cautiously.fortification.
* Medium-sized feeding programs (100,000 to500,000 beneficiaries) are the least expensive.
The Policy Research Working Paper Series disseninates the fndings of work under way in the Bank. An objective of the seriesis to get these findings out quickly, even if presentations are less than fully polished. The fmdings, interpretations, andconclusions in these papers do not necessarily represent official Bank policy.
Produced by the Policy Research Dissemination Center

Tableof ContertAJ
Executive summary
List of tables
List of acronyms
1. Methodology 2
II. Unit costs 7
111. Cost structure 12
IV. Cost-effectiveness 16
V. Financing 18
VI. Summary 22
Appendices:
A. Summary of main interventions in Chile 44
B. Summary of main interventions in Philippines 50
C. Summary of main interventions in Malawi 59
D. List of contacts 62
Bibliography 63
ii
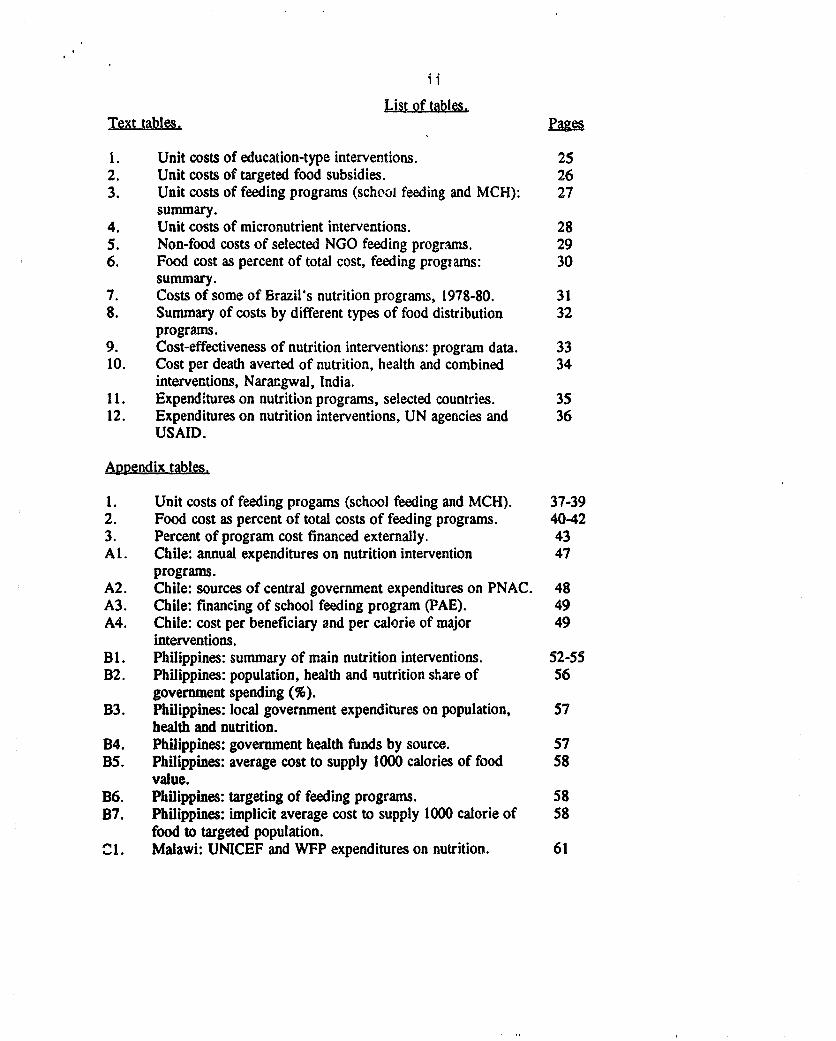
List of tables.Text tables, Page
1. Unit costs of education-type interventions. 252. Unit costs of targeted food subsidies. 263. Unit costs of feeding programs (school feeding and MCH): 27
summary.4. Unit costs of micronutrient interventions. 285. Non-food costs of selected NGO feeding programs. 296. Food cost as percent of total cost, feeding progtams: 30
summary.7. Costs of some of Brazil's nutrition programs, 1978-80. 318. Summary of costs by different types of food distribution 32
programs.9. Cost-effectiveness of nutrition interventions: program data. 3310. Cost per death averted of nutrition, health and combined 34
interventions, Narangwal, India.11. ExpendItures on nutrition programs, selected countries. 3512. Expenditures on nutrition interventions, UN agencies and 36
USAID.
ApDendix tables.
1. Unit costs of feeding progams (school feeding and MCH). 37-392. Food cost as percent of total costs of feeding programs. 40423. Percent of program cost financed externally. 43Al. Chile: annual expenditures on nutrition intervention 47
programs.A2. Chile: sources of central government expenditures on PNAC. 48A3. Chile: financing of school feeding program (PAE). 49A4. Chile: cost per beneficiary and per calorie of major 49
interventions.Bl. Philippines: summary of main nutrition interventions. 52-55B2. Philippines: population, health and nlutrition share of 56
government spending (%).B3. Philippines: local government expenditures on population, 57
health and nutrition.B4. Philippines: government health funds by source. 57B5. Philippines: average cost to supply 1000 calories of food 58
value.B6. Philippines: targeting of feeding programs. 58B7. Philippines: implicit average cost to supply 1000 calorie of 58
food to targeted population.C1. Malawi: UNICEF and WFP expenditures on nutrition. 61
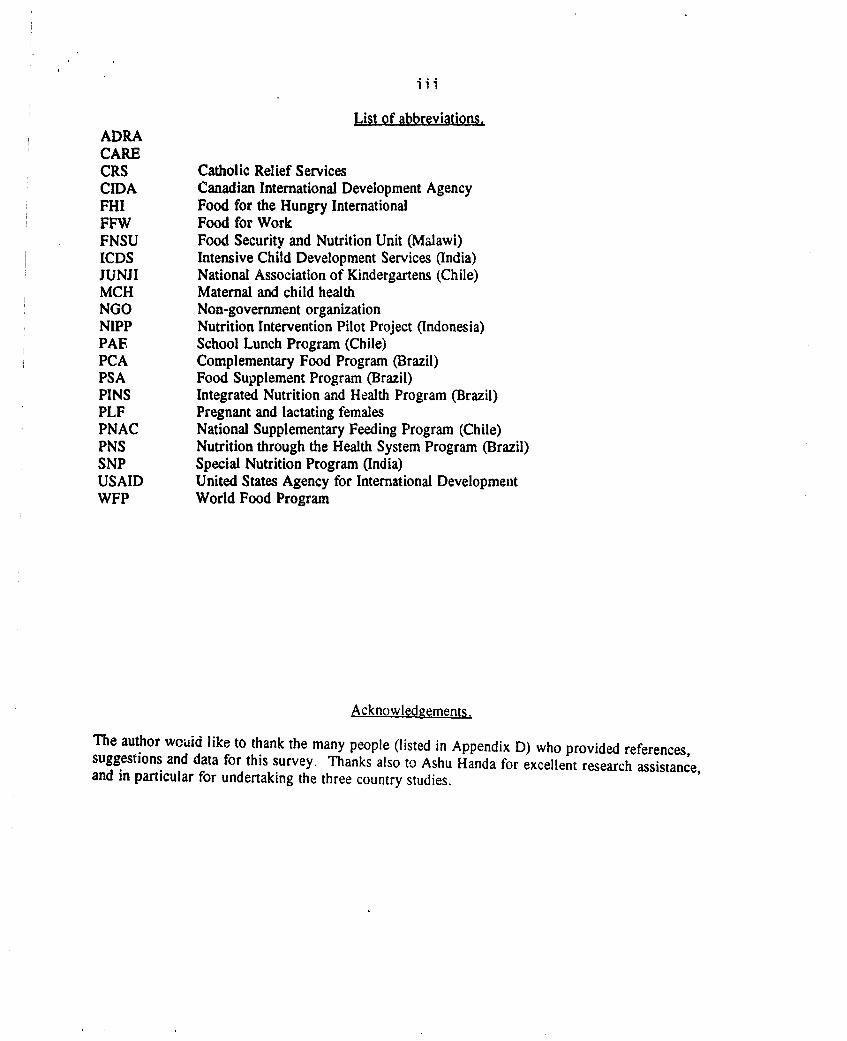
List of abbreviations.ADRACARECRS Catholic Relief ServicesCIDA Canadian International Development AgencyFHI Food for the Hungry InternationalFFW Food for WorkFNSU Food Security and Nutrition Unit (Malawi)ICDS Intensive Child Development Services (India)JUNJI National Association of Kindergartens (Chile)MCH Maternal and child healthNGO Non-government organizationNIPP Nutrition Intervention Pilot Project (Indonesia)PAF School Lunch Program (Chile)PCA Complementary Food Program (Brazil)PSA Food Supplement Program (Brazil)PINS Integrated Nutrition and Health Program (Brazil)PLF Pregnant and lactating femalesPNAC National Supplementary Feeding Program (Chile)PNS Nutrition through the Health System Program (Brazil)SNP Special Nutrition Program (India)USAID United States Agency for International DevelopmentWFP World Food Program
Acknowledgements.
The author weuid like to thank the many people (listed in Appendix D) who provided references,suggestions and data for this survey. Thanks also to Ashu Handa for excellent research assistance,and in particular for undertaking the three country studies.

y ~~~~~~~~~Executive summMr.
This paper summarizes what is known about unit costs, cost structure, cost-effectiveness and
financing of nutrition interventions. Eight different interventions are covered (maternal and child
feeding - MCH, school feeding, nutrition education, breastfeeding promotion, targeted food subsidies,
micronutrient supplementation, micronutrient fortification and growth monitoring).
The following data were obtained on unit costs: mass media nutrition education campaigns
cost about $1-5 per beneficiary, with a similar range for (hypothetical) data for breastfeeding
promotion. Face-to-face nutrition programs are more costly ($23 per beneficiary in the Dominican
Republic). (Data for education programs are current dollars, different years). Food distribution
programs of different types have fairly similar costs, since food typically forms the major component
of costs. Estimates here suggest that the cost of distributing 1000 calories per day per beneficiary per
year is as follows: $75 for untargeted food rations (1 program), $64 for targeted food rations
(median, 4 programs), $74 for MCH and school feeding programs (medi-an, 52 programs), and $134
for highly targeted feeding programs (I program) (all costs in 1988 US $). Micronutrient
intervention costs range from $0.04 to $4 per person-year of protection, with supplementation being
more expensive than fortification (current dollars, 14 programs).
Some crosstabulations were undertaken of data for 52 feeding programs, to examine the
effects of program design on costs. Program costs do not differ consistently by region (sub-Saharan
Africa, North Africa, Latin America and Asia), with the possible exception that programs in South
Asia cost $10 per year less. There is no consistent difference between costs of school feeding and
MCH programs. Program scale does affect costs: medium sized programs (100,000 - 500,000
beneficiaries) are the least expensive. Finally, there is little difference in cost between costs operated
by NGO's and those operated by governments, although those with external finance might have
higher costs. All these results have to be interpreted cautiously since there may be consistent biases
in data quality. Also the more expensive programs are not necessarily less cost-effective, but may
include more complementary inputs. It is necessary to examine impact data in conjunction with costs.
The study also examines cost structure, in particular the share of food and non-food costs in
program costs. The differences across program types are not very large. Non-food costs account for
about 17% of the total for targeted food rations (median, 4 programs), 25% for feeding programs
(median, 81 programs, although the share can be as high as 71% in highly targeted feeding programs
such as that in Tamil Nadu), 20-34% in food for work programs (2 programs) and 29°o for I
micronutrient supplementation program.
Again, cross-tabs were undertaken to find the effect of program design, using data for 81
feeding programs. In sub-Saharan African non-food costs are a lower share than food costs; medium
size programs have the o-west non-food share if programs 2 diviied into three size groups; and
NGO-operated (non-government organization) programs have lower mean non-food shares than those
operated by governments. Lower non-food shares may imply more administrative efficiency, but they
may also imply fewer complementary inputs.
Cost-effectiveness methods are useful when trying to compare across prog,ams of different
types. Although the methodology is widely used in the health area, it is less frequently used for
nutrition interventions. The study here summarizes available data on cost per death-averted, cost per
child removed from moderate or severe malnutrition, cost per case of blindness prevented, and cost
per discounted healthy life year gained. Although cost per death averted is the measure most
conmmonly used in health studies, it is not a very useful measure for nutrition interventions. The main
impact of nutrition interventions is not the reduction of mortality, but the improvement in quality of
life for survivors. However data to calculate cost per discounted healthy life year gained are almost
never available for individual nutrition intervention programs.
The cost per death averted was around $1500 both for a targeted supplementary feeding
program in Tamil Nadu and a vitamin A capsule distribution scheme in Bangladesh. The cost per
child removed from moderate and severe malnutrition ranged from $33 (Tamil Nadu), $331 (targeted

food subsidy, Philippines), to $493 (face-to-face nutrition education, Dominican Republic). The same
cost for a mass-media nutrition education scheme ranged from $5-12 (costs in current prices). Costs
per death averted would therefore generally be well above the $1500 figure, except for mass media
projects (and the impact data on the latter are not very good). Data from the Narangwal study
suggests that nuwrition interventions are most cost-effective for prenatal supplementation ($187 per
death averted, 1988 prices), and become progressively more costly as children get older.
Financing data are also scanty. Nutrition expenditures seem to account for about 10% of
health expenditures, both for donors and for individual countries (Chile is an outlier with 35%). For
the 5 countries for which data were available, the share of nutrition expenditures in GDP ranged from
0.06 to 0.41% (three of the five were in the range 0.16-0.18%). About 90% of expenditures were
financed by the central government, and 10% by local government. The poorer the country, the
larger the share of central government financing from foreign sources.
More work is needed to improve data on costs, impacts and financing.
One priority area for future work includes better cost breakdowns for all programs (the food/non-food
distinction is not very helpful: programs with high non-food costs for reasons of inefficiency cannot
be distinguished from those with high non-food costs due to complementary service provision). One
particular omission in the data is that there appear to be no data for the food/non-food cost breakdown
for untargeted food subsidies. Another priority would be to obtain project cost data for nutrition
education interventions and breastfeeding promotion (there are currently no data reported from any
breastfeeding promortion projects): these data could be obtained for existing projects with limited
work. More analysis of feeding programs could be undertaken using existing standardized project
reports (USAID PVO Child Survival data, USAID Outreach data, WFP project proposals), to
increase information about effects of project design. Another fruitful avenue for exploring the effect
of project scale on costs would be to analyze existing feeding program data at the lowest service
delivery unit level (e.g. anghanwadi level data for the Intensive Child Development Services

program - ICDS - for India).
Impact data are in general weak and available niainlv for (possibly unrepresentative) research
studies. Hence data on cost-effectiveness are particularly deficient. This is also a priority area, since
otherwise there is a possibility of misallocating health resources towards other types of interventions
for which cost-effectiveness data are more readiiy available and more persuasive. Information on
financing are also very limited. Data on all aspects tend to be (unsurprisingly) least good for Africa.

Increased pressure on government budgets in recent years has led to greater interest in issues
of cost and effectiveness of government expenditure, and this has been true in the social sectors as in
other areas. There has been a relatively large amount of work already done on the cost and
effectiveness of education, health and social security expenditures, but relatively less attenticn has
been paid to government expenditures on nutrition programs as distinct from health. This paper tries
to sumrnarize what is known in the existing literature on unit costs, cost structire, cost-effectiveness
and financing of nutrition programs. The paper tries to cover 8 different types of nutrition
interventions (MCH feeding programs, school feeding programs, nutrition education, breastfeeding
promotion, targeted food subsidies, micronutrient supplementation, micronutrient fortification and
growth monitoring). Insufficient information was obtained to assess several other inter. entions
(comprehensive early childhood interventions, home gardens and food safety and quality control).
Since a large number of interventions are covered, the paper relies on existing surveys of the
costs of individual types of interventions. However in view of the paucity of available literature,
there is some new analysis of project level data, either obtained from existing compilations, or
directly from project documents (in particular World Food Program - WFP - project proposals).
Suggestions are also made as to where further cost data might be obtained, particularly for those types
of interventions where existing studies are most scarce. As regards financing, there are eoually very
few studies. Previous studies containing data on government expenditure on nutrition interventions
were found only for Brazil and India (in general, expenditures on nutrition are not presented
separately from those on health). The present study therefore presents results from three country case
studies, on Chile, Philippines and Malawi, to give some idea of the range of financing levels and
sources in three countries of different levels of per capita income.
Section I of the paper discusses some of the methodological issues on costs, section II presents
unit cost figures, section III deals with cost structure (in particular the share of food costs in total
2
costs of an intervention), section IV covers cost-effectiveness, section V financing, and section VI
summarizes. The bulk of the results are presented in tables, with a brief text discussion. There is
much that can (and has been) said about cost and effectiveness of interventions without recourse to
actual cost data. Rather than repeat the conclusions of other studies, this paper tri; - to amass as large
a database as available, in order to draw some new conclusions.
I. Methodology.
This section discusses some of the methodological problems, both with respect to defining
cost-effectiveness, and with obtaining data on costs and impact of nutrition interventions. Cost-
effectiveness methodology is widely used in the health area (as a more readily quantified alternative to
cost-benefit), and it therefore seems natural to extend this to nutrition interventions. Cost-
effectiveness studies have been very widely undertaken for child survival initiatives in developing
countries, for instance. Stewart (1988) for example surveys the cost-effectiveness of four types of
child survival interventions, and Brenzel (1989) surveys 28 immunization projects in 16 developing
countries. However there is a paucity of such studies in the nutrition area.
There are very few attempts to undertake cost-benefit analysis of nutrition interventions
(Scandizzo and Swamy, 1982, for the food distribution system in India, and for micronutrients Levin,
1985, Correa, 1980 and Popkin et al, 1980). Cost-benefit studies will not be discussed here.
It is interesting to speculate as to why so few cost-effectiveness studies exist for nutrition
interventions. One reason is perhaps that less is spent on nutrition interventions than on some health
interventions (nutrition expenditures form about 10% of health expenditures in developing countries).
More importantly, it is murch more difficult to assess the impact of nutrition interventions which occur
over a reasonably long period of time, with equally long-lasting results, as compared to the impact of
an immunization program with a very well defined, short duration "input", and an easily measured
3
outcome. It is no accident that the greatest number of cost-efisctiveness and cost-benefit studies for
nutrition interventions are for micronutrient projects, which have inputs and outcomes which are
easier to measure and define.
More importantly, the most commonly used measure in health (cost per death-averted) is not
very appropriate for nutrition interventions. It is rather an extreme outcome measure to use for
nutrition interventions. Nutritional improvements have many effects other than lower mortality, such
as decreased morbidity and hence decreased use of health care facilities, improved learning and
ability, higher productivity and hence earnings, increased activity levels, etc. The effects on cases of
severe malnutrition (both PEM and micronutrient deficiency) and hence on decreasing the probability
of death, is therefore only the "tip of the iceberg". Huffman and Steel (1990) discuss what they call
the "dark side of child survival", arguing that narrowly focussed health initiatives may decrease
mortality but do little for the quality of life for survivors, whereas nutrition interventions have
generalized effects on both morbidity and mortality. Thus an alternative cost-effectiveness measure
which combines mortality and morbidity information into a measure of "healthy days saved" is
probably preferable, but data requirements mean that such a measure has been only rarely used.
Using cost per death averted may make nutrition interventions compare unfavourably with health
interventions. The simplest health interventions (immunization, ORT) have cost-effectiveness figures
as low as $50-$100 (Stewart, 1988), whereas the lowest such figure for an actual feeding program is
around $1500 (for Tamil Nadu's highly selective feeding program, in a region with very high
prevalence of moderate and severe malnutrition, discussed in Ho, 1985). Estimates for prenatal
maternal supplementary feeding are lower ($187 per death averted converted to 1988 dollars, for
Narangwal, India). Many other health initiatives (e.g. water and sanitation projects, vaccines against
cholera and rotavirus) have cost-effectiveness figures also around $1500 (Stewart, 1988).
Nevertheless, it is clear that on a cost per death averted basis, interventions involving feeding do not

4
compare very favourably to health interventions (except for prenatal supplementation). However,
arguably this is a problem of the measure being used, not that nutrition interventions are intrinsically
more costly.
Other cost-effectiveness measures have been used, for example the cost of a given
improvement in height (Burger et al, 1990), the cost per '000 calories delivered (Pinstrup-Andersen,
1988, although arguably this is more an output than an outcome measure), and value of a food
transfer to the recipient compared to its cost to the donor (Katona-Apte, 1986, Reutlinger and Katona-
Apte, 1983: this is the measure of cost-effectiveness used by the WFP). Information on calories
transferred can usefully be modified using information on leakage (i.e. proportion of target group
amongst beneficiaries) to calculate cost per '000 calories per beneficiary in target group. Anderson
(1979) for example presents information on the cost per calorie delivered to a child with a calorie
deficit, and the cost per calorie delivered to a (severely) malnourished child. This type of calculation
may be useful (in the absence of outcome data), for comparing programs of the same intervention
type. For example there may be lower unit costs of nutrition interventions in countries in Latin
America with good infrastructure but relatively lower rates of malhutrition, and higher unit costs in
countries in Africa with weak infrastructure but possibly higher rates of malnutrition. Similarly unit
cost data could be used to compare interventions which are untargeted, with similar targeted
interventions: the former may have l wer costs per beneficiary, but on a cost-per-target-beneficiary
basis the latter programs may be more cost-effective. In practice however, it is not easy to obtain
comparative data on cost per target beneficiary, since the definition of the target group tends to vary
across countries and across studies. However none of the alternative cost-effectiveness measures
discussed in this paragraph allow comparison across different project types, and are therefore of more
limited usefulness.
The above paragraphs have discussed some of the theoretical problems involved when

5
applying cost-effectiveness to nutrition interventions. There are of course the usual practical problems
even with estimating costs. Most nutrition interventions are joint with other interventions: MCH
feeding and growth monitoring occur in conjunction with health services, food stamp or food subsidy
targeting frequently uses the health or social welfare system, and school feeding programs use the
facilities of the education system. Often the overhead costs of these other vehicles are not taken into
account, such that the costs of nutrition interventions are underestimated. At the same time, if these
other services are not available (as in many cases in Africa), nutrition interventions can appear
prohibitively expensive, if the full cost of setting up the delivery system is assigned to the nutrition
project alone. Similarly there are biases in the costs reported of those projects where aid donors
(such as USAID or WFP) require (or encourage) local co-financing. Developing country
governments are encouraged to assign local expenses to the nutrition intervention in order to report a
desirable level of local input. If the full cost of health worker salaries are included in the cost of a
MCH feeding project via health centres, this is likely to overestimate the actual cost of the nutrition
intervention. Cost data from NGO's also have problems, in that these organizations often maintain
cost data not by program, but by source of funding, and do not fully cost items which are supplied
free or at less than market value. There exist therefore very few studies with carefully collected cost
data (e.g. Anderson, 1977), other than research projects (which may be highly unrepresentative).
Since unit cost data are difficult to come by, existing studies tend to cite over and over again
data from the same few projects. Some types of interventions are covered better than others. Data
on unit costs of school feeding programs are relatively common (both MCH and school feeding),
although usually not presented in a standardized format allowing comparison across projects, and
impact data are scarce. Likewise data on costs of food subsidies exist, although usually not in the
form of cost per number of calories per beneficiary, and there are almost no impact studies which can
be related to costs (with the sole exception of Garcia and Pinstrup-Andersen, 1987). Cost data are
6
more readily available on micronutrient interventions, and there are also more cost-effectiveness
studies in this area. Data on the other nutrition interventions (nutrition education, breastfeeding
promotion, growth monitoring) listed earlier are even more scanty.
The present study is therefore forced to use cost data which are less than ideal, in an effort to
learn something about operation of projects other than research ones. There is a fair amount of
consistency even with these less-than-ideal data, but there is also a lot of noise in the data. It is also
not clear whether it is worth advocating that agencies operating nutrition interventions expend a great
amount of effort in collecting cost data. USAID did a field test of a cost information system
developed for PL-480 Title II programs operated by NGO's, and came to the conclusion that it was
not worth the effort (Bremer and Gilmore, 1986). The authors argued that although the on-site costs
of different interventions differed (school feeding, MCH, and food-for-work), this information was
not used as an allocative devices for food aid. The same authors concluded that cross-country
comparisons were also potentially dangerous. It would be politically extremely difficult to make
value judgements about aid allocations, if for example it were shown that programs in Africa were
more costly or less cost-effective that those in South Asia. However some of the programs (in
particular the WFP and the USAID-funded PVO Child Survival Program) have made more efforts at
standardizing cost and beneficiary data, and this lead might be followed especially by the larger
NGO's and by the USAID title II food aid program.
Well-controlled impact data are even scarcer than good cost data. Indeed, some nutritionists
have argued that one should not expect to see impacts of feeding programs on children's growth,
when children are over 3 years old (Beaton, 1990). Haaga et al (1984) and others have discussed the
methodology involved in interpreting change in nutritional status in the program setting. One
problem with existing data is that the definition of severe malnutrition (in terms of number of
standard deviations below the median, or percentiles of the reference population) is not always
7
consistent between studies (in particular the studies for India sometimes employ different reference
standards). In calculating numbers of deaths averted, studies usually assume a particular death rate
for severely malnourished children, and hence base effectiveness results on the reduction in numbers
of severely malnourished children. There are ethical problems in collecting these data (severely
malnourished children, once identified by health personnel, are usually referred for treatment). Thus
these data are somewhat imprecise.
Having outlined some of the methodological and data problems, the next three sections go on
to discuss in turn unit costs, cost structure, and cost-effectiveness of selected nutrition interventions.
X1. Unit costs.
Unit cost data are more readily available than cost-effectiveness data, since it is relatively
easier to calculate the number of beneficiaries of a project (or the volume of food delivered), than
programn impact. However it is not very meaningful to compare unit costs across different programs.
For example the cost of a radio message containing nutrition education information may be $1-5 per
person, and a feeding program might cost $70-90 per person per year per '000 calories delivered per
day, but these cannot meaningfully be compared in this form. Unit cost information is more useful
when comparing different interventions of the same type, but even this has to be done with care. Is a
$5 radio message simply more costly for the same outcome as a $1 one, or might it be more
effective?
For feeding programs one important standardization which can be undertaken is to take
account of the size of the ration and the number of feeding days. (Throughout this paper we use cost
per beneficiary measures for unit costs of feeding programs, rather than the less preferable cost per
unit of food delivered.) Mateus (1989), Beaton and Ghassemi (1979) and Ghassemi (1989) performed
an enormous service in compiling unit costs of feeding programs, but stopped short of standardizing
8
by calories delivered per day. Without standardization it is difficult to compare for example MCH
and school feeding programs. The latter tend to have smaller ration sizes which are supplied for
fewer days per year. Unit costs of feeding programs are therefore presented here as the cost per '000
calories per personi per day per year. (In undertaking the calculation, it is assumed that there are no
economies of scale in ration size or in number of days per year fed. I.e. the reported data are simply
multiplied by 1000/actual number of calories in ration, and by 365/actual number of days per year
fed)
We discuss below some of the practical issues involved in calculating unit costs, before
discussing the results, which are presented in tables 14 and Appendix table 1. Section I has already
mentioned some of the problems involved in calculating costs, such as the difficulties involved with
joint costs, and the cost of items not supplied at market prices. Data on the number of beneficiaries
are also suspect. Although some feeding programs are very intensive, others are of the "truck and
dump" variety. Bremer and Gilmore (1986) describe the NGO's general strategy of managing food
distribution with limited resources as follows:
" 1) They concentrate complementary inputs on a few carefully chosen sites wherethey can implement an integrated program combining food and other inputs.
2) They devote the remaining resources to comparatively intensive developmentactivities that do not use food aid, while implementing the food distribution programsas efficiently as possible (i.e. as cheaply as possible consistent with soundmanagement and control.)"
In the "truck and dump" types of feeding programs operated by NGO's, information on numbers of
beneficiaries tends to be inexact. This may also be true of many government-operated distribution
systems. Brazil is one of the countries which has undertaken the most evaluations of its food
programs. Checks on numbers of beneficiaries suggested that reported and actual numbers of
beneficiaries differed widely (Musgrove, 1989, World Bank documents). Thus the cost per
beneficiary data are prone to errors.

9
The unit cost data presented in the tables here are drawn from compilations by other authors.
For the feeding programs the costs were standardized by this author. In addition, the feeding
program data were supplemented by costs of 13 WFP feeding programs, calculated by the author
from a sample of WFP project documents. The WFP allots between 20 and 30% of its resources for
feeding programs for what they term vulnerable groups (MCH and primary school). In 1989 for
example such feeding programs accounted for 28% of their commitments (WFP Annual Report,
1990). The 13 projects examined here are those which were reviewed at the 25th and 26th sessions
of the WFP donors' review group (costs were calculated for any phase of these projects for which
data were on file at CIDA - Canadian International Development Agency, not necessarily the exact
phase under review at those sessions). Costs were calculated from project proposal documents,
excluding non-recurrent costs. According to the sample of evaluation documents available, most
projects have beneficiary numbers quite similar to those projected in the proposals (evaluation data are
more scanty and less standardized than proposal data). In those cases in which project size increases
unexpectedly, additional budget requests are usually made. Thus the WFP are prospective not actual
project data, but projects usually operate pretty much on the planned scale (if not necessarily the
planned schedule).
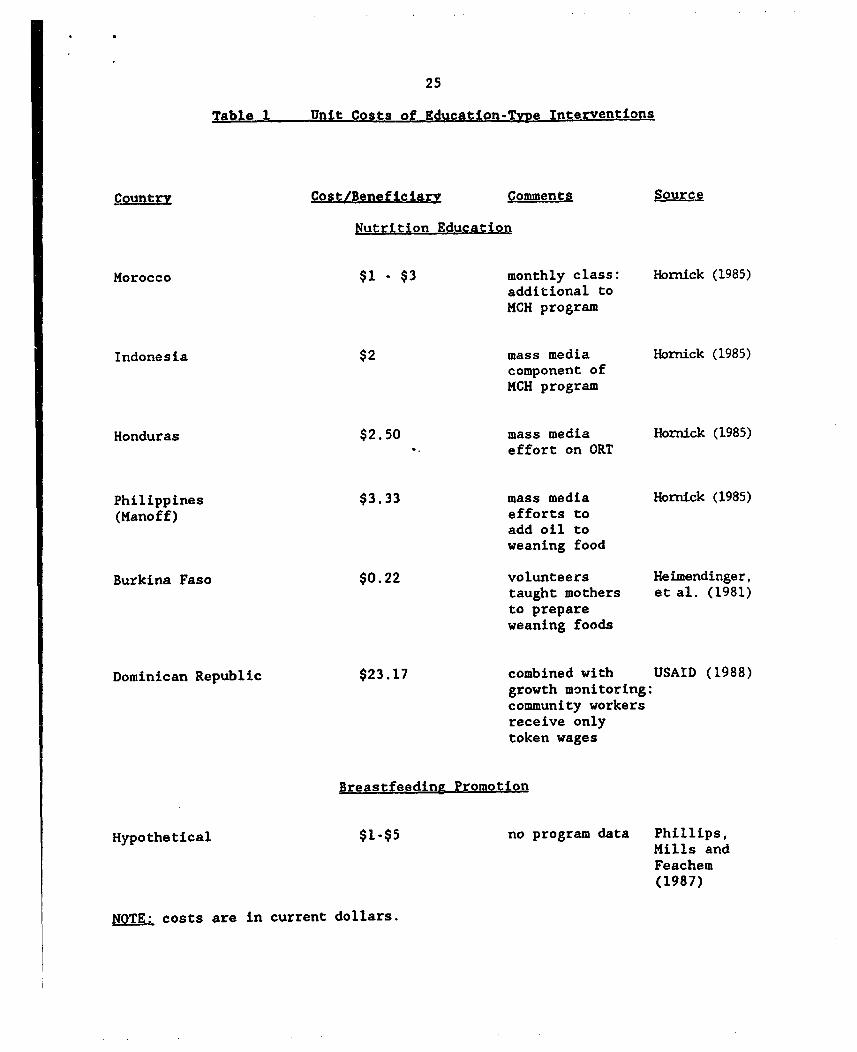
Table 1 presents information on education-type interventions, both nutrition education, and
breastfeeding promotion. Mass media nutrition education campaigns are quite inexpensive, ranging
from $1-5 per beneficiary. Breastfeeding promotion efforts (including changed legislation on infant
formula, education efforts in hospitals for both mothers and hospital staff, and policies encouraging
"rooming in") are also estimated to cost $1-5 per mother. Levine and Huffman (1990) present
additional data on costs and savings of breastfeeding promotion, although not in the unit cost format
used here. Costs of face-to-face nutrition education programs such as that in the Dominican Republic
(integrated with growth monitoring) are higher ($23 per beneficiary), and costs of other programs to

10
encourage breastfeeding (nursing breaks, workplace creches, maternity leave) are over $100 per
beneficiary.
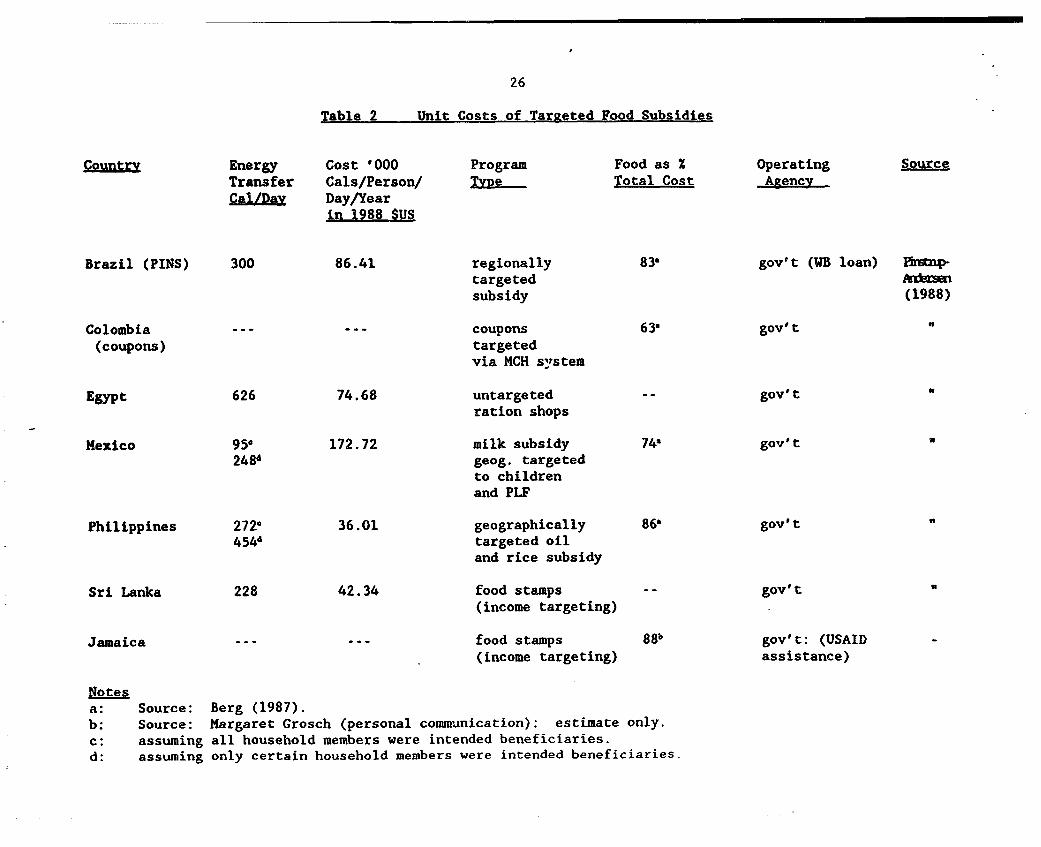
Table 2 presents information on the unit costs of targeted food subsidies, adapted from
Pinstrup-Andersen (1988). There is a large variation. Costs, standardized as described above, range
from $36-172 per beneficiary, with a median of $75 and a mean of $82. The item subsidized
obviously affects costs: milk subsidies are expensive on a cost per calorie basis, whilst subsidies on
oil seem to be cheaper than those on grains. There exist data on too few programs to make other
generalizations.
Table 3 presents summary information on the 52 feeding programs studied, calculated from
the data in Appendix table 1. There exists again an enormous range of costs ($19-300, with a median
of $74 and a mean of $89, i.e. on average very slightly higher than the costs of targeted food
subsidies in table 2).
Cross-tabulations were undertaken to see how program cost varied with location, project size,
project type (school feeding as compared to MCH), and the operating agency. This type of analysis
has been undertaken only infrequently before, due to lack of data on sufficient numbers of projects.
Information was available here on project location for all 52 programs, project type (school feeding
versus MCH) for 48 programs (those of mixed type were excluded), project scale for 24 programs,
and project operating agency for 51 programs.
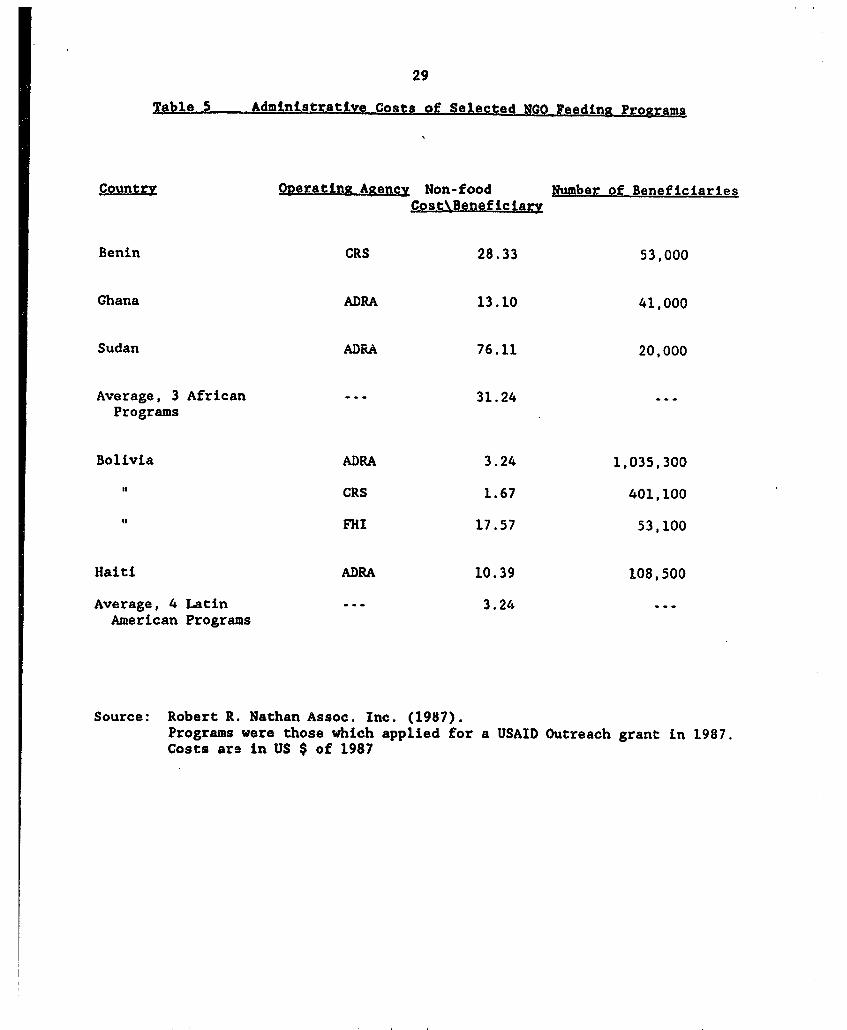
Robert R. Nathan Associates (1987) did attempt some earlier analysis of costs of feeding
programs, reproduced here as table 5. Their results were extremely tentative since they were based
on only 7 programs, possibly an unusual subset of programs (those applying for USAID Outreach
grants), and only contained data on the non-food costs. Nathan Associates concluded that the African
programs were on average 10 times as expensive as the Latin American ones (in terms of non-food
costs only), and that the cost difference might partly be attributed to their much smaller scale (the
11
African programs had about a tenth as many beneficiaries per program). If one assumes that non-
food costs are around 30% of the costs of Latin American feeding programs, then Nathan Associates'
data would suggest that African programs would still cost about 3 times as much as Latin American
ones, if food costs in Africa and Latin America were about the same. However these data are not
standardized by size of ration and number of days fed, and it proved impossible to retrieve the data
on ration size and days fed from all the NGO's concerned.
The data here suggest that the Nathan Associates' results are somewhat unrepresentative. The
costs of programs in Asia and Latin America are lower than those in North and sub-Saharan Africa
(by $10-20 per beneficiary) if the median is used, but programs in South Asia and sub-Saharan Africa
are about $10 cheaper per beneficiary than those in North Africa and Latin America if the mean is
used. It is possible that there are differences in cost structure, an issue addressed in section III.
Costs of ocean transport and food distribution are quite likely higher in Africa due to lower
population density and weaker infrastructure, but programs elsewhere may compensate by including
more complementary inputs.
As regards the comparison between school feeding and MCH programs, there seems to be
little difference. Mateus (1989) had commented that school feeding programs were cheaper on a
straight cost per beneficiary per year basis, but this disappears once the smaller ration size and fewer
feeding days of the school feeding programs is taken into account. MCH programs could potentially
include more complementary non-food inputs than school feeding programs, which could account for
the larger range of costs for MCH programs. (One might also suspect that the most costly school
feeding programs are somewhat inefficient).
As regards program scale, this is an issue on which there has been very little information.
Cost functions have been very standardly calculated for health interventions (e.g. hospitals), but rarely
if ever for nutrition interventions. The limited data here suggest that small programs are the most

12
costly (small implies less than 100,000 beneficiaries), and medium sized ones the least costly (where
medium implies 100,000 to less than 500,000 beneficiaries). The most expensive programs tend to be
small scale, likely because these intensive feeding programs simply cannot be afforded on a larger
scale. These data should be interpreted cautiously since it may be the case that small projects have
more complementary inputs, and do not necessarily suffer from diseconomies of scale. The scale
issue is one which could fruitfully be examined for homogeneous programs (or using information on
delivery unit variation within one program such as the ICDS).
There seems to be little difference in cost by operating agency (government versus NGO),
although there may be differences by availability of external funding (the data were not complete
enough to allow further investigation of funding source, but this might be an interesting point to
investigate in future work).
Table 4 presents information on unit costs of micronutrient interventions (this is table 7.12
from Levin et al, 1990). The costs per person-year of protection are very low, ranging from about 4
cents to about $4. The costs vary somewhat by micronutrient, iron being the most expensive on
average, and supplementation in general seems more expensive than fortification.
111. Cost structure.
Ihis section focusses on one aspect of cost structure, namely the share of food and non-food
costs in project cost (where food costs include any costs of ocean transport, where applicable). This
measure of cost structure is the one most widely mentioned in other studies (Berg, 1987, Beaton and
Ghassemi, 1979, Anderson, 1979, Mateus, 1983, Pinstrup-Andersen, 1988, Sahn, 1980, etc.). This
criterion cannot however be used for nutrition education, growth monitoring, and breastfeeding
promotion programs. Micronutrient interventions can be included if the cost of the micronutrier!
source is included in place of food costs. Data on the share of food in total costs are presented in

13
tables 2, 6, and 8 (the results in table 6 are calculated from figures in Appendix tables 1 and 2).
Table 2 presents information on food subsidies, table 6 on feeding programs, and table 8 has
summary information for a range of programs also including micronutrients and food for work.
There are no clear guidelines as to what a desirable level of non-food costs is: high values
may either indicate administrative inefficiencies, or a high level of complementary inputs. The non-
food cost share of a targeted food subsidy (particularly a food coupon scheme) is a somewhat
nebulous concept. For the Jamaican food stamp project the costs are those of printing the stamps,
security, and mailing them out: costs of identification and screening beneficiaries are omitted (these
are incurred by other agencies). Thus the non-food cost share would decline if the face value of the
stamps were for example doubled. This would however not imply that the program had become more
efficient. Thus non-food cost share data have to be interpreted somewhat cautiously.
Table 2 shows that food costs range from 63-88% of program costs for targeted food
subsidies (with a mean of 79% and a median of 83%). Non-food costs are a slightly higher fraction
for feeding programs (table 6), and range from 11-95% (with a mean of 70% and a median of 75%:
note however that data are available for a far greater number of feeding programs than food
subsidies). Some of the outliers in the feeding program data likely reflect bad data, where non-food
costs are inadequately quantified, or cases where the programs have a large share of complementary
inputs.
There exist some interesting variations across feeding programs. Programs in Latin America
have larger non-food cost shares, and Africa smaller ones, than for other regions. Bearing in mind
that no consistent region,l differences in unit costs were found (table 3), one possibility is that the
food costs alone in Africa are higher (in particular transportation costs), whereas in Latin America
due to better infrastructure there are larger complementary inputs. As regards program scale, the
medium-size programs which were earlier found to have lower unit costs, also have lower non-food
14
cost shares. This may reflect either scale economies, or also the fact that programs with intensive
health inputs tend to be smaller. There is little differenca in non-food cost share by operating agency.
NGO-operated programs (and also WFP-funded ones) have lower mean non-food cost shares than
government-operated ones (although the medians are not different.
Table 7 provides some information on non-food costs for programs within one country,
namely Brazil. There was some experimentation in program design which yields some interesting
information. Firstly, the exclusion or inclusion of health inputs can change the share of food in total
costs from 25% to 73% (data from the Nutrition through the Health System - PNS - program).
Secondly, the Complementary Food Program (PCA) distributing weaning foods has a lower share of
non-food costs than the PNS variant without health inputs, but only because of the much higher unit
costs of food (blended foods being more expensive than traditional ones). Finally, the degree of
subsidization of foods also affects the share of food in total costs, but at the same time has quite
dramatic effects on participation (The Integrated Nutrition and Health Program - PINS - study
experimented with different levels of subsidy). Data on the proportion of families continuing to buy
subsidized foods after two years were as follows: 74% in the group with the 60% subsidy continued
buying, 37% in the group with the 45% subsidy and a growth monitoring requirement, 55% in the
group with the 45% subsidy (and no growth monitoring), and 25% in the group with the 30%
subsidy. Participation data such ase these are extremely useful as an additional way to assess cost
data, but are rarely available.
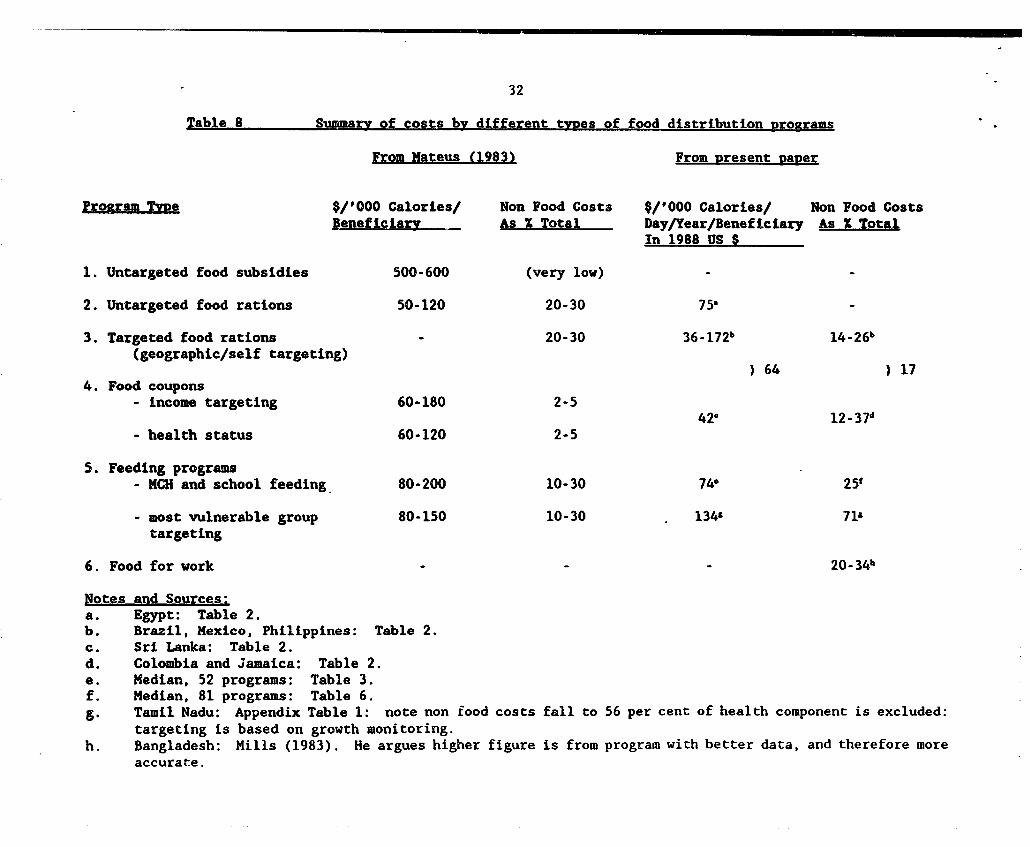
Table 8 provides a typology of the costs of different programs, both unit costs and non-food
cost share in total costs. For comparison, older information on these topics are included from Mateus
(1983). The latter document is somewhat of an advocacy piece on targeting food subsidies, and the
data in his table appear to be notional, rather than being based on specific project data. Since the
Mateus study has been cited (for example by Kennedy and Alderman, 1987, one of the more
15
influential articles in the area of costs), the present author is concerned to update somewhat the
impression conveyed by Mateus' figures. Two of the most striking aspects of Mateus' figures are the
extremely high cost per beneficiary of untargeted food subsidies, and the extremely low administrative
costs of food coupons. Neither of these could be substantiated with more recent empirical data.
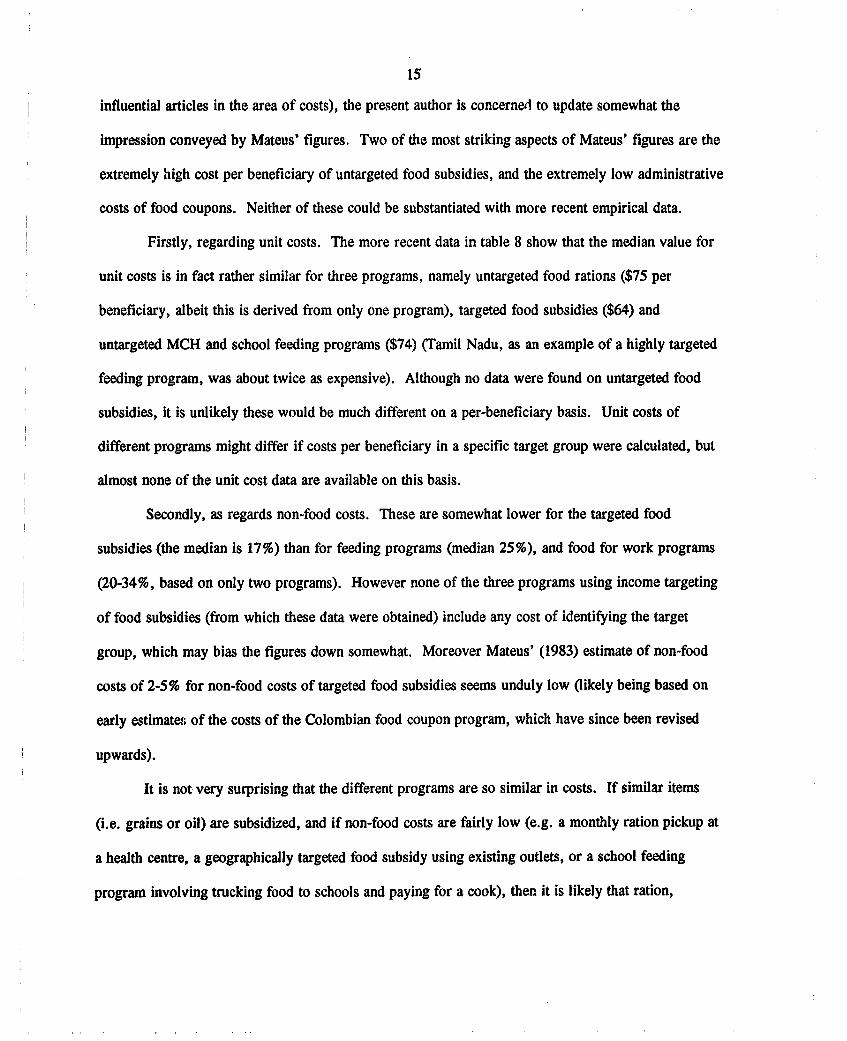
Firstly, regarding unit costs. The more recent data in table 8 show that the median value for
unit costs is in fact rather similar for three programs, namely untargeted food rations ($75 per
beneficiary, albeit this is derived from only one program), targeted food subsidies ($64) and
untargeted MCH and school feeding programs ($74) (Tamil Nadu, as an example of a highly targeted
feeding program, was about twice as expensive). Although no data were found on untargeted food
subsidies, it is unlikely these would be much different on a per-beneficiary basis. Unit costs of
different programs might differ if costs per beneficiary in a specific target group were calculated, but
almost none of the unit cost data are available on this basis.
Secondly, as regards non-food costs. These are somewhat lower for the targeted food
subsidies (the median is 17%) than for feeding programs (median 25%), and food for work programs
(20-34%, based on only two programs). However none of the three programs using income targeting
of food subsidies (from which these data were obtained) include any cost of identifying the target
group, which may bias the figures down somewhat. Moreover Mateus' (1983) estimate of non-food
costs of 2-5% for non-food costs of targeted food subsidies seems unduly low Oikely being based on
early estimates of the costs of the Colombian food coupon program, which have since been revised
upwards).
It is not very surprising that the different programs are so similar in costs. If similar items
(i.e. grains or oil) are subsidized, and if non-food costs are fairly low (e.g. a monthly ration pickup at
a health centre, a geographically targeted food subsidy using existing outlets, or a school feeding
program involving trucking food to schools and paying for a cook), then. it is likely that ration,
16
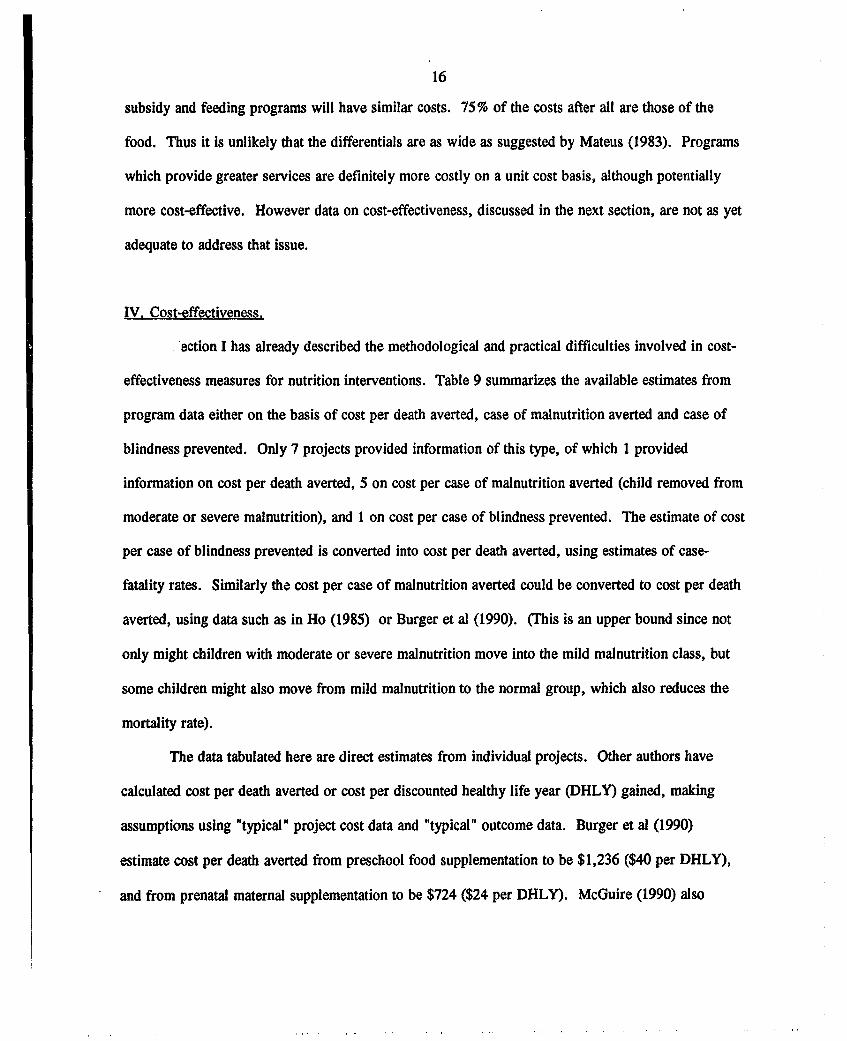
subsidy and feeding programs will have similar costs. 75% of the costs after all are those of the
food. Thus it is unlikely that the differentials are as wide as suggested by Mateus (1983). Programs
which provide greater services are definitely more costly on a unit cost basis, although potentially
more cost-effective. However data on cost-effectiveness, discussed in the next section, are not as yet
adequate to address that issue.
IV. Cost-effectiveness.
ection I has already described the methodological and practical difficulties involved in cost-
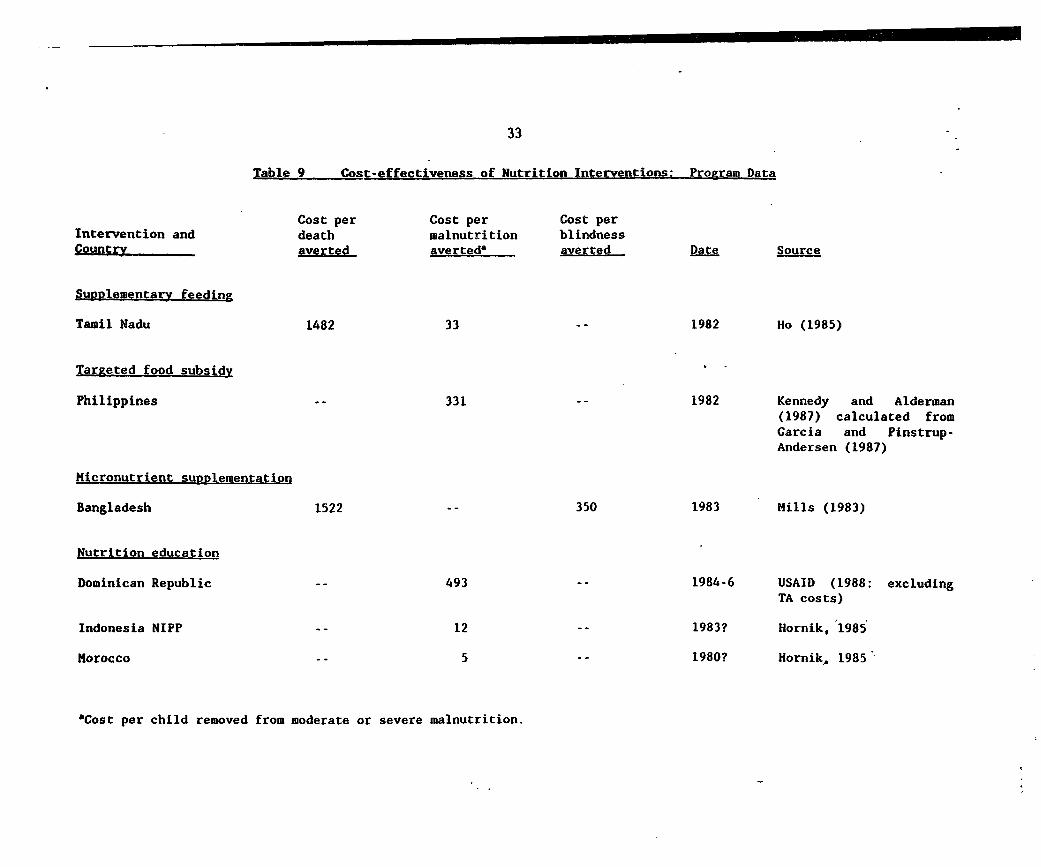
effectiveness measures for nutrition interventions. Table 9 summarizes the available estimates from
program data either on the basis of cost per death averted, case of malnutrition averted and case of
blindness prevented. Only 7 projects provided information of this type, of which 1 provided
information on cost per death averted, 5 on cost per case of malnutrition averted (child removed from
moderate or severe malnutrition), and 1 on cost per case of blindness prevented. The estimate of cost
per case of blindness prevented is converted into cost per death averted, using estimates of case-
fatality rates. Similarly the cost per case of malnutrition averted could be converted to cost per death
averted, using data such as in Ho (1985) or Burger et al (1990). (This is an upper bound since not
only might children with moderate or severe malnutrition move into the mild malnutrition class, but
some children might also move from mild malnutrition to the normal group, which also reduces the
mortality rate).
The data tabulated here are direct estimates from individual projects. Other authors have
calculated cost per death averted or cost per discounted healthy life year (DHLY) gained, making
assumptions using "typical" project cost data and "typical" outcome data. Burger et al (1990)
estimate cost per death averted from preschool food supplementation to be $1,236 ($40 per DHLY),
and from prenatal maternal supplementation to be $724 ($24 per DHLY). McGuire (1990) also

17
provides information on cost per death averted and per DHLY gained for a wide range of nutrition
interventions.
The cost per death averted figures in table 9 are $1482 for (hig>'ly targeted) supplementary
feeding in Tamil Nadu, and $1522 for a vitamin A capsule distribution scheme in Bangladesh. These
figures (as discussed in section I) are comparable to some other health interventions, but definitely
more costly than EPI and ORT interventions. Tamil Nadu is evidently at the low end of cost per
death averted as compared to food subsidies and face-to-face nutrition education: the cost per child
removed from moderate or severe malnutrition in Tamil Nadu is $33 compared to $331 for a food
subsidy in the Philippines, and $493 for a nutrition education/growth monitoring project in the
Dominican Republic. Comparable costs for mass media nutrition education efforts are lower ($12 for
Indonesia NIPP and $5 for Morocco), although the outcome data for these projects are not as well
controlled as some of the other studies.
Table 10 presents estimates of costs per death averted from the Narangwal project. Data are
available for 3 different types of intervention (nuttition, medical care, and combined nutrition and
medical care), for three different age groups (perinatal, infants, and children 1-3). The study was
unusual in that it included a control group. It was also primarily a research study and not a large-
scale service-delivery project. There are some interesting findings. Firstly, cost per death averted
increases with age: perinatal deaths are the least expensive to avert, followed by infant deaths, with
child deaths being the most costly to avert. The type of intervention which is the least costly varies
with age. For perinatal deaths, nutrition interventions (pre-natal maternal supplementation) alone are
the cheapest, whereas for infant and child deaths, medical interventions alone are most cost-effective.
The high figures for cost per death averted for children 1-3 ($3053 for nutrition interventions alone,
$1617 if combined with medical interventions) underscore the discussion in section I earlier.
Another useful source of information to supplement cost-effectiveness calculations, are
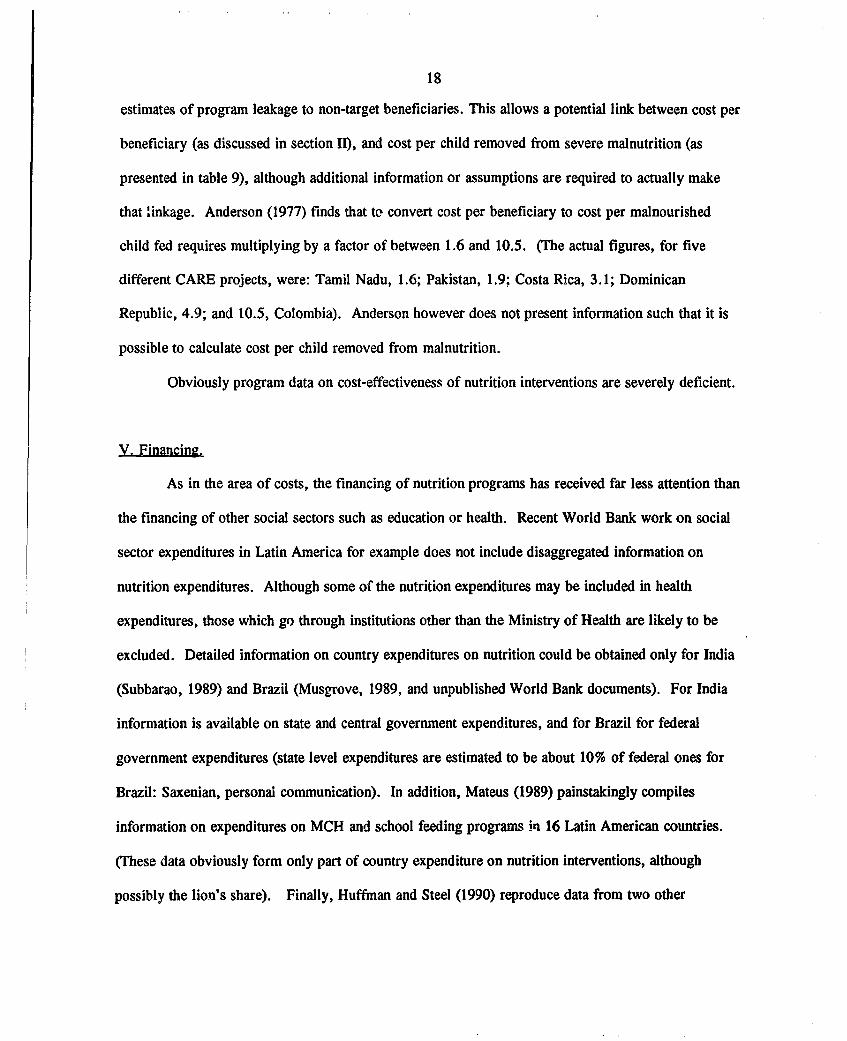
18
estimates of program leakage to non-target beneficiaries. This allows a potential link between cost per
beneficiary (as discussed in section II), and cost per child removed from severe malnutrition (as
presented in table 9), although additional information or assumptions are required to actually make
that linkage. Anderson (1977) finds that to convert cost per beneficiary to cost per malnourished
child fed requires multiplying by a factor of between 1.6 and 10.5. (he actual figures, for five
different CARE projects, were: Tamil Nadu, 1.6; Pakistan, 1.9; Costa Rica, 3.1; Dominican
Republic, 4.9; and 10.5, Colombia). Anderson however does not present information such that it is
possible to calculate cost per child removed from malnutrition.
Obviously program data on cost-effectiveness of nutrition interventions are severely deficient.
V. Financing.
As in the area of costs, the financing of nutrition programs has received far less attention than
the financing of other social sectors such as education or health. Recent World Bank work on social
sector expenditures in Latin America for example does not include disaggregated information on
nutrition expenditures. Although some of the nutrition expenditures may be included in health
expenditures, those which go through institutions other than the Ministry of Health are likely to be
excluded. Detailed information on country expenditures on nutrition could be obtained only for India
(Subbarao, 1989) and Brazil (Musgrove, 1989, and unpublished World Bank documents). For India
information is available on state and central government expenditures, and for Brazil for federal
government expenditures (state level expenditures are estimated to be about 10% of federal ones for
Brazil: Saxenian, personal communication). In addition, Mateus (1989) painstakingly compiles
information on expenditures on MCH and school feeding programs iti 16 Latin American countries.
(These data obviously form only part of country expenditure on nutrition interventions, although
possibly the lion's share). Finally, Huffman and Steel (1990) reproduce data from two other

19
sources, on expenditures on health and nutrition by UN agencies in 1987, and on allocations for
health and nutrition under child survival by USAID in 1988. Figures are generally available only for
expenditures by international agencies and national or local governments (Mateus 1989 is an
exception). Figures for private aAid NGO funding of nutrition interventions (which may be an
important component for some countries) are not readily available. To supplement these data,
country studies were undertaken for Chile, Malawi and the Philippines (Appendices A, B and C
respectively).
The available data are reproduced and summarized here in table 11 (on expenditures by
country) and table 12 (expenditures by UN agencies and USAID). Appendix tables 1 and 3 also
contain additional information on the percentage of nutrition expenditures financed externally.
One finding from tables 11 and 12 is that nutrition interventions account for only about 10% of
expenditures on health (9% for Malawi, 10% fo- the Philippines, 11% for Brazil, 13% for UN
agencies, and 15% for USAID child survival). Chile however is unusual in that its nutrition
programs account for 35% of health expenditure. Nutrition expenditures as a share of GDP vary
widely, from a low of 0.06 in the Philippines, to a high of 0.41 in Chile, with the other three
countries in the table clustered at 0.16-0.18.
Mateus' data allow comparison of expenditures on feeding programs in 16 Latin American
countries (table 11). Whilst these programs do not .ccount for all expenditures on nutrition
interventions, they certainly are an impoartant and expensive component. The countries with large
total (i.e. domestic plus foreign) expenditures on feeding programs are not necessarily the poorest.
Although expenditures on feeding programs are large in Bolivia and Haiti, they are also large in
Brazil, Chile, Jamaica, Mexico and Costa Rica which are better off, and small in (relatively poor)
Peru. Poorer countries do tend to attract a higher proportion of external financing (Appendix tables 1
and 3). As regards domestic resources applied to feeding programs, the best performers are Chile,
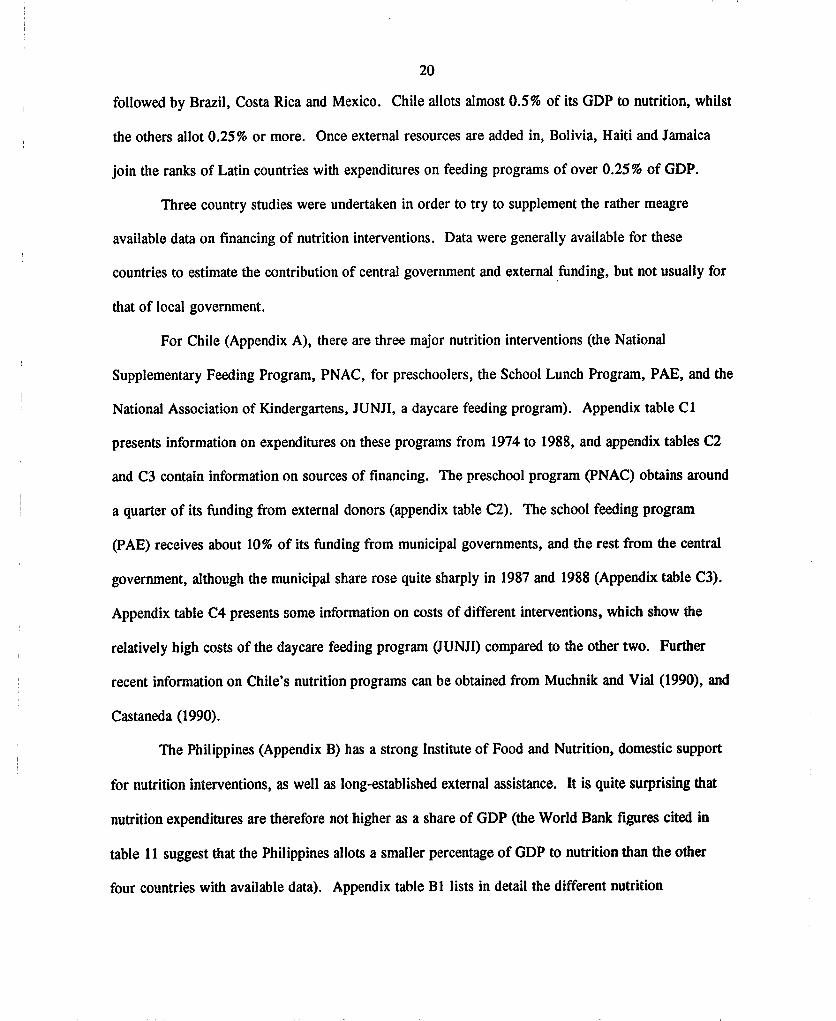
20
followed by Brazil, Costa Rica and Mexico. Chile allots almost 0.5% of its GDP to nutrition, whilst
the others allot 0.25% or more. Once external resources are added in, Bolivia, Haiti and Jamaica
join the ranks of Latin countries with expenditures on feeding programs of over 0.25% of GDP.
Three country studies were undertaken in order to try to supplement the rather meagre
available data on financing of nutrition interventions. Data were generally available for these
countries to estimate the contribution of central government and external funding, but not usually for
that of local government.
For Chile (Appendix A), there are three major nutrition interventions (the National
Supplementary Feeding Program, PNAC, for preschoolers, the School Lunch Program, PAE, and the
National Association of Kindergartens, JUNJI, a daycare feeding program). Appendix table Cl
presents information on expenditures on these programs from 1974 to 1988, and appendix tables C2
and C3 contain information on sources of financing. The preschool program (PNAC) obtains around
a quarter of its funding from external donors (appendix table C2). The school feeding program
(PAE) receives about 10% of its funding from municipal governments, and the rest from the central
government, although the municipal share rose quite sharply in 1987 and 1988 (Appendix table C3).
Appendix table C4 presents some information on costs of different interventions, which show the
relatively high costs of the daycare feeding program (JUNJI) compared to the other two. Further
recent information on Chile's nutrition programs can be obtained from Muchnik and Vial (1990), and
Castaneda (1990).
The Philippines (Appendix B) has a strong Institute of Food and Nutrition, domestic support
for nutrition interventions, as well as long-established external assistance. It is quite surprising that
nutrition expenditures are therefore not higher as a share of GDP (the World Bank figures cited in
table 11 suggest that the Philippines allots a smaller percentage of GDP to nutrition than the other
four countries with available data). Appendix table B1 lists in detail the different nutrition

21
interventions, by Ministry, expenditure level, and number of beneficiaries, and World Bank estimates
of total nutrition and health expenditures are reproduced in Appendix table B2. About 90% of the
financing for nutrition interventions is from central government, and 10% from local government
(Appendix table B4). The central government contribution is divided into receipts from taxes (80%
of the total expenditures on nutrition), with the other 10% contributed by central government coming
about equally from user fees and from foreign contributions (Appendix table B4). As regards local
government contributions, about three quarters is from city governments, with the rest from
provincial governments. (Municipal governments contribute a very small amount: Appendix table
B3).
Appendix tables B5-7 present some comparative cost information for USAID-supported
programs. There are differences by operating agency: CARE tends to report higher costs than CRS
(Catholic Relief Services), however CARE tend to document costs better than most other NGO's. Of
the 3 intervention types (school feeding, MCH and food for work), MCH programs are the cheapest.
ARE reports the highest cost program is food for work, whereas CRS report the highest cost
program is school feeding. Food for work and school feeding interventions cost 1.5-2 times as much
as MCH programs. However once targeting is taken account of, they cost 4 to 6 times as much as
MCH programs, per beneficiary with 2nd or 3rd degree malnutrition. Further information on
programs in the Philippines is available in USAID (1982) and Aguillon (1986).
Data for Malawi are much more scanty. The majority of expenditures are financed
externally. Domestic funding goes to the relatively new Food Security and Nutrition Institute, and as
a contribution towards the WFP-financed feeding programs. Appendix table Cl presents information
on WFP and UNICEF expenditures. There are few published sources describing nutrition
interventions in Malawi, other than World Food Program project documents.

22
VI. Summary.
This paper has tried to draw together a large amount of disparate information on costs, cost-
effectiveness and financing of nutrition interventions in developing countries. This final section
summarizes what information was obtained, but does not draw specific conclusions.
Section I on methodology discussed the problems of the cost per death-averted measure, and
raised the issue that this measure is not highly appropriate for nutrition interventions. Practical
difficulties in measurement were also discussed, both problems in obtaining cost data, and the fact
that impact data are so scarce.
Section II discussed how to standardize appropriately information on unit costs, and presented
data on 52 feeding programs, 6 nutrition education programs (1 of which incorporated growth
monitoring), 1 (hypothetical) breastfeeding promotion program, and 14 micronutrient fortification or
supplementation programs. The costs of distributing 1000 calories per day per beneficiary per year
was found to be about $75 for untargeted food rations (1 program), $64 for targeted food rations
(median, 4 programs), $74 for MCH and school feeding programs (median, 52 programs), and $134
for highly targeted feeding programs (1 program) (all costs in 1988 US $). Costs of nutrition
education ranged from $1-23 per beneficiary, and of breastfeeding promotion from $1-5 per
beneficiary. Micronutrient intervention costs ranged from $0.04 to $4 per person-year of protection.
Section II also examined how program size, geographic location, operating agency, and type,
affected unit costs of feeding programs. Program size does appear to matter, with the lowest costs
being reported for medium-size programs. Location does not matter, except perhaps that programs in
South Asia were slightly cheaper to run. There is no consistent difference between MCH and school-
feeding programs, and between government-operated and NGO-operated programs. Externally
financed programs might be somewhat more expensive, but this could not be fully investigated
without better data.

23
Section III examined cost structure, and in particular the food/non-food breakdown for 81
feeding programs, 5 food subsidy programs, and I micronutrient intervention. Non-food costs
account for about 17% of the total for targeted food rations (median, 4 programs), 25% for feeding
programs (median, 81 programs), 20-34% in food for work programs (2 programs) and 29% for
micronutrient supplementation programs (1 program). Non-food costs are lower in sub-Saharan
Africa than in other regions, in medium-size programs, and possibly in NGO-operated programs. A
summary table (table 8) highlighted some of the main findings of sections II and III, and compared
them to the previous "received wisdom" on the topic.
Only limited information could be obtained on cost-effectiveness (section IV). A total of 8
estimates were available, 2 on cost per death-averted, 5 on cost per child removed from moderate or
severe malnutrition (from which cost per death-averted could be extrapolated), and I on cost per case
of blindness prevented (from which cost per death-averted was estimated). Data from the Narangwal
project were also cited, on cost per death-averted for different age groups, for nutrition and medical
interventions alone and combined. These figures are given in tables 9 and 10.
Section V on financing presented information on share of nutrition interventions in health
budgets and GNP for 5 countries, and share in health budgets for 2 donor agencies. Information on
expenditures on feeding programs was cited, for 16 Latin American countries. Information on the
share of external financing was presented for 81 feeding programs. Three country studies were
undertaken, providing somewhat fragmentary evidence on local versus central government funding.
In general nutrition expenditures seem to account for about 10% of the health budget, both for
individual developing countries, and for external donors. The share of nutrition expenditures in GDP
had a median of 0.16% of GDP. About 90% of domestic nutrition finance seemed to come from
central government, and 10% local government. External finance accounted for a larger share of
nutrition expenditures in poorer countries.
24
More work is needed to improve data on costs, impacts and financing. An urgent priority is
to obtain some project cost data for breastfeeding promotion (none is available). More work on the
impact of project design could fruitfully be done using standardized project proposals or reports (in
particular WFP proposals, USAID PVO Child Survival data and USAID Outreach grant data seem
promising). Work could be done on project scale using service-delivery-unit level data (anghanwadi
level data for the ICDS in India might be promising). More work could be done disaggregating
components of costs (in more detail than the food/non-food breakdown used here). Again, WFP
proposal documents might be a useful starting point. Many existing agencies could improve their
record keeping, both with respect to standardized cost treatment, and with regard to recording
estimates of impact. Better cost data need not involve much additional resources, but better impact
data would. Nevertheless, better data are important so that important nutritional interventions are not
de-emphasized in child survival initiatives relative to health interventions whose benefits are more
easily quantified.
25
Table 1 Unit Costs of Education-Type Interventions
Country Cost/Beneficiary Comments Source
Nutrition Education
Morocco $1 - $3 monthly class: Hornick (1985)additional toMCH program
Indonesia $2 mass media Hornick (1985)component ofMCH program
Honduras $2.50 mass media Hornick (1985)effort on ORT
Philippines $3.33 mass media Hornick (1985)(Manoff) efforts to
add oil toweaning food
Burkina Faso $0.22 volunteers Heimendinger,taught mothers et al. (1981)to prepareweaning foods
Dominican Republic $23.17 combined with USAID (1988)growth monitoring:community workersreceive onlytoken wages
Breastfeeding Promotion
Hypothetical $1-$5 no program data Phillips,Mills andFeachem(1987)
NOTE: costs are in current dollars.
26
Table 2 Unit Costs of Targeted Food Subsidies
Country Energy Cost '000 Program Food as X Operating SourceTransfer Cals/Person/ Type Total Cost AgencyCal/Day Day/Year
in 1988 SUS
Brazil (PINS) 300 86.41 regionally 83' gov't (WB loan) Th5t4targeted hre#nsubsidy (1988)
Colombia --- ... coupons 63' gov't(coupons) targeted
via MCH system
Egypt 626 74.68 untargeted -- gov'tration shops
Mexico 95g 172.72 milk subsidy 74^ gov't248' geog. targeted
to childrenand PLF
Philippines 2726 36.01 geographically 86' gov't454' targeted oil
and rice subsidy
Sri Lanka 228 42.34 food stamps -- gov't(income targeting)
Jamaica --- --- food stamps 88b gov t: (USAID(income targeting) assistance)
Notesa: Source: Berg (1987).b: Source: Margaret Grosch (personal communication): estimate only.c: assuming all household members were intended beneficiaries.d: assuming only certain household members were intended beneficiaries.

27
Table 3 Unit Costs of Peeding Programs (MCH ind School Feeding)Costs in USS of 198
Categorv Range Median Mean Number of Programs
All Programs 19.25 - 300 74.48 88.51 52
Asia 32.1 - 300 70.01 91.29* 21North Africa 65.53 - 104.7 87.34 88.63 5Sub-Saharan Africa 55.80 - 96.25 81.46 78.95 5Latin America 19.25 - 272.54 67.18 87.96 21
School Feeding 19.25 - 208.59 81.46 88.74 11MCH 26.75 - 272.54 73.84 85.64 37
Small ( < 100,000) 26.75 - 272.54 96.48 121.92 7Medium (1 500,000) 24.38 - 96.25 68.11 62.99 10Large ( 2 500,000) 19.25 - 139.0 96.90 89.85 7
Gov't. Operated 19.25 - 272.54 75.11 91.73 37NGO Operated 24.38 - 300 77.98 89.70 14
Source: Calculated from Appendix Table 1.
Notes:* Falls to 80.32 for South Asia only.Costs are in $ of 1988, cost per '000 calories/day/year

28
Table 4. Unit costs of micronutrient interventions.
EstimatedCost per
Estimated Person perCost per Cost Year ofPerson per Person Protection
Country/Year (US $) (1987 US S) (US S)Iodine
Oil inj.' Peru 1978 1.30 2.30 .46Oil inj.' Zaire 1977 0.35 0.67 .14Oil inj.' Indonesia 1986 l.00/inj 1.05 .21Water fort.' Italy 1986 0.04 0.04 .04Salt' India 1987 0.02-0.04 0.02-0.04 .04
Oil irLj.2 Bangladesh 1983 0.70 0.76 0.25
Vitamin A
Sugar fort.' Guatemala 1976 0.07 0.14 .14Capsule' Haiti 1978 0.13-0.19 0.23-0.34 .46-.68Capsule' Indonesia/ 0.10 0.21 .42
Philippines 1975
Capsule2 Bangladesh 1983 0.05 0.05 0.05
Iron
Salt fort.' India 1980 0.07 0.10 .10Sugar fort.' Guatemala 1980 0.07 0.10 .10Sugar fort.' 1980 0.60 0.84 .84Tablets' 1980 1.89-3.17 2.65-4.44 2.65-4.44
Sources:
1. Levin et al (1990)
2. Mills (1983)
29
Table A Administrative Costs of Selected NGO Feeding Programs
Country Dperating Agency Non-food Number of BeneficiariesCost\Beneficiary
Benin CRS 28.33 53,000
Ghana ADRA 13.10 41,000
Sudan ADfA 76.11 20,000
Average, 3 African --- 31.24 ---
Programs
Bolivia ADRA 3.24 1,035,300
n CRS 1.67 401,100
of FHI 17.57 53,100
Haiti ADRA 10.39 108,500
Average, 4 Latin --- 3.24American Programs
Source: Robert R. Nathan Assoc. Inc. (1987).Programs were those which applied for a USAID Outreach grant in 1987.Costs are in US $ of 1987

30
Table 6 Food Cost as Percent of Total Cost. Poeding Programs: Summary
Category Range Median Mean Number of Programs
All Programs 11 -95 75 69.7 81
Asia 22 - 95 76 74.4 26North Africa (69 -92) (v-) (80.5) 2Sub-Saharan Africa 80 - 90 84 84.4 5Latin America 11 - 90 71 65.1 48
School Feeding 25 - 95 71 71.5 19MCH 11 - 95 63 68.4 39
Small ( < 100,000) 43 - 90 79.5 74.5 6Medium (1 - 500,000) 58 - 90 85 82.0 8Large ( 2 500,000) 31 - 92 69 70.7 7
Gov't. Operated 11 - 95 77 70.4 67NGO Operated 54 - 90 74.5 77.3 14
[Targeted Food 63 - 88 83 78.8 5]Subsidies
[Micronutrient 29 11interventions
Source: Calculated from Appendix Table 1 (excluding references from Mateus) andAppendix Table 2 (including references from Mateus).Food costs include external transport where applicable.Food costs bracketed in appendix are not included in the calculation.Micronutrient data from iodine program in Bangladesh, Mills (1983).

Table 7 Costs of Some of Brazil's Nutrition Programs. 1978-80
Proexaw NaMe Descrintio Food As % Unit Cost Unit Cost Cost/Beneficiary/YearTotal Cost (cruzeiro (cruzeiro per (cruzeiro)
per kgi 000 cals)
PNS Model A Food distribution 2510 - 27 2.8 - 8.0 595*
PNS Model B via health posts 73
PCA Distribution of 86 100 22-26 1,460*special weaning foods
PINS Model A Food subsidy 91 37 10PINS Model B experiment 66 33 9PINS Model C 67 83 23 29*PINS Model D 80 22 6PINS Average -- 31 9
Source: Musgrove (19X9). Conversion to cruzeiro/kg by author using data in Musgrove (1989). The PNS programdistributes food via health posts. Model A includes the cost of complementary health services, B excludes them.The PCA distributes food via community centres. The PINS operated a subsidy experiment, Model A had a 60%subsidy, B a 45% subsidy, but participants had to undertake regular monitoring to be eligible. Version C hada 45% subsidy, Version D a 30% subsidy.
*Note, these data are not standardized by size of ration. PCA provides a smaller quantity of food.
32
Table 8 Summary of costs by different tvDes of food distribution programs
From Mateus (l983) From present paper
Progrsm TVDO $/'O0O Calories/ Non Food Costs $/'000 Calories/ Non Food CostsBeneficiarv As X Total Day/Year/Beneficiary As X Total
In 1988 US S
1. Untargeted food subsidies 500-600 (very low) -
2. Untargeted food rations 50-120 20-30 75^ -
3. Targeted food rations - 20-30 36-172b 14-26b(geographic/self targeting)
164 1174. Food coupons
- income targeting 60-180 2-542c 12-37d
- health status 60-120 2-5
5. Feeding programs- MCH and school feeding 80-200 10-30 74 25'
- most vulnerable group 80-150 10-30 134' 71'targeting
6. Food for work - - - 20-34b
Notes and Sources:a. Egypt: Table 2.b. Brazil, Mexico, Philippines: Table 2.c. Sri Lanka: Table 2.d. Colombia and Jamaica: Table 2.e. Median, 52 programs: Table 3.f. Median, 81 programs: Table 6.g. Tamil Nadu: Appendix Table 1: note non food costs fall to 56 per cent of health component is excluded:
targeting is based on growth monitoring.h. Bangladesh: Mills (1983). He argues higher figure is from program with better data, and therefore more
accurate.
33
Table 9 Cost-effectiveness of Nutrition Interventions: Program Data
Cost per Cost per Cost perIntervention and death malnutrition blindnessCountry averted averted' averted Date Source
Supplementary feeding
Tamil Nadu 1482 33 -- 1982 Ho (1985)
Targeted food subsidy
Philippines -- 331 -- 1982 Kennedy and Alderman
(1987) calculated fromGarcia and Pinstrup-Andersen (1987)
Micronutrient suRplementation
Bangladesh 1522 -- 350 1983 Mills (1983)
Nutrition education
Dominican Republic -- 493 -- 1984-6 USAID (1988: excludingTA costs)
Indonesia NIPP -- 12 -- 1983? Hornik, 1985Morocco
5 1980? Hornik, 1985
'Cost per child removed from moderate or severe malnutrition.

34
Table 10. Cost-effectiveness of nutrition, health and combined interventions.Narangwal. India.
Awe TyRe of intervention
Nutrition Nutrition + Medical careonly Medical care only
perinatal 570 710 1,010(74) (92) (131)
infant (<1) 1,640 1,800 1,110(213) (233) (144)
child (1-3) 23,540 31,030 7,690(3,053) (4,025) (997)
Source: Taylor et al (1984). Costs are in Rupees of 1971, wi,.h US $ amounts inbrackets. To convert to US $ of 1988, multiply by 2.45.

35
Table 11 Expenditures on Nutrition Programs. Selected Countries
Country Year As X Domestic Total SourceHealth Contrib. Exp.Budzet as X GDP as X GDP
Brazil 1986 10.8 0.18 - Musgrove (1989)World Bank Docs.
India - state govt 1986-7 1.86). 0.16 - Subbarao (1989)- central govt 0.5)
Chile 1988 34.8 0.41 - Author's calculationsMalawib 1988 8.5 0.16 0.56Philippines 1985 10.0 0.06 -
MCH and School Feeding Programs Only
Brazil 1987 -- 0.27 0.27 Mateus (1989)Bolivia 1987 -- 0.18 0.52Chile 1987 -- 0.53 0.57Costa Rica 1987 -- 0.29 0.29Dominican Republic 1987 -- 0.12 0.15Ecuador 1987 -- 0.19 0.22Guatemala 1987 -- 0.04 0.14Haiti 1987 -- 0.01 0.41Honduras 1987 -- 0.02 0.16Jamaica 1987 -- 0.10 0.30Mexico 1987 -- 0.24 0.44Panama 1987 -- 0.03 0.01Paraguay 1987 -- 0.06 0.09Peru 1987 -- 0.02 0.04Uruguay 1987 -- 0.17 0.17Venezuela 1987 -- 0.13 0.13
Notes
a X of government budget.
b domestic contribution to WFP project only

36
Table 12. ExRenditures on nutrition interventions. UN agencies and USAID.
Agency S Spent an $ Spent onDirect Nutrition Health
UN Agencies: FY 1987
FAO 450,000
UNICEF 31,660,000 165,000,000
WHO 6,800,000 138,000,000
UNDP 180,000 2,072,000
TOTAL UN AGENCIES 39,090,000 305,072,000
USAID FY 1988
USAID Child Survival 26,000,000 170,000,000
Source: reproduced from Huffman and Steel, 1990.
Direct nutrition is defined as projects having a direct impact on the nutritionstatus of the individual. Examples include direct feeding projects, growthmonitoring and nutrition surveillance. Not included are health or food security.

37
A_oendi 2able I Unit Costs of Weedina Programs (School Feedlna *nd MM)2
Ration hzi Cost'000 CaLs Number of Pcogram Food as I I Cost Funding Operating SourcelyF (1988 SUS)a BeneficiarLes T. De Total Costb Total Cost Agency -Agenc
EstetnallyFinanced
Indle-Posbak 400 365 60.51 -- wC 77 -- - Cov't Seaton and Chassemi(-atens';, )
(1979)Morocc, 774 365 87.34 __ MCD __ __ USAID CRS eSri La'ka 185 365 97.16 -- MCD 60 -- USAID CARETunisia 560 300 88.69 -- NCR -- -- USAID CR5?IndLa (SUP) 300 300 70.01 -- MCd 75 -- Cov't
(Andhra Pradesh)
NMeangual 400 120 76-106 -- MCH -- -- G Cov't Ohassemi (1989)Fhiltppines 400 90 232-369 -- 7 __ __ USAID
Morocco 526 365 65.53 MG MCH -- -- USAID CRSSrl Lanka 190 365 32.21 -- I -- -- USAID CARE?India (ICDS) 330 365 66.67 -- MCD -- -- WFP Cov'ttil_ Nadu
InudsentMidday Meals 418 200 67.02 -- SF 75 -- - Covt (1981)Tmtl Nadu SUPModifled 347 300 52.57 -- MCR 95 -- *tinLl Nadu SUP -- -- 69.55 -- MCH 95 -- - *
t S 282 300 71.61 -- NCd 87 -- -
Tamil "t to child -- - 60.49 -- MCH 94 -- -*
Nldday Meals Madras 418 -- 132.47 -- SF 95 -- -
Tamil Nadu 280 -- 65.14 -- MCH 91 -- -balwadles aon-ANP 296 __ 114.44 __ MCH 94 -- -
Tamil Nadu AMP 397 -- 73.84 -- MCH 80 -- -s
Bolivia (4) 150 365 52.48 na 8CH 81 _ ME? Gov't O Msteusd (1989)
Do.nican Rtcublic 490 365 67.18 92,000 MCH 82 Cov'ttc4mpteme cay coeding)
Costa Rlc- (2 progs) 240 365 272.54 67,500 MCH 82 -- - Cov tEcuadoc (2 progs) 498 365 89.16 550,000 MCH 82 Cov'tGuatemala - CARE 625 365 28.90 286,000 MCH 90 US-ID CAREGuatemala - UFP 891 365 55.19 35,000 MCH 72 WEP Cov'tHonduras (3progs) 1286 365 26.75 (e4,0O00) MCH 90 -r t Iv tady
Paraguay 684 365 96.48 33,000 mCII 83 Cov't

38
Country Ratlon Days Cost/'000 Cals Nummbe of Prostm Food as X Z Cost Funding Operating Souree
ITC (1988 SUSi 8eneficiaries Ty"e Total Cost Total C0ot Aaency AsencyEaterna llyFinanced
Bolivia (4 pross) 325 165 53.53 -s laf3 SF 82 -- USAID moO mateusd(1989)
EcuAdor 365 165 61.10 200,000 SF 84 G Cov't(collacclon)
Custemala 456 165 19.25 1,093.000 SF 49 -- Gov't
Hbnduras (2 pros.) 180 165 24.38 MM3 SF 71 USAID CARE/EEC
Paraguay 324 165 208.59 76,493 SF 25 -- _ Gov't
El SaLvador 2317 1300 182.5 75.11 164,250 NCM 58 57 WFP Gov't Wppe documents
Gambia 625 858 196 81.46 376,202 SF 90 93 4VFP- Cov't
Horocco 2288 Exp II 900 140 96.90 1,024.350 SF 69 56 UFP Gov't
Somalia 2349 Exp 1 734 335 96.25 270,000 refugee, MCM 84 81 UFP Gov'tExp II 719 280 86.21 496,000 and 141 SF 30 83 FPG Cov't
Tunisia 3408 843 120 104.70 775,400 Sr 92 66 WFP Gov't
Nepal 3718 622 293 56.50 377,650 WHI 3 i 86 93 WFP Gov't
BraaLl 3242 1265 313 44.79 160,000 MC0 8l 14 WFP Gov't
Malawt Exp II 668 365? 75.20 258.112 7
C+ho pit.i) 87 74 WFP Gov't
Exp III 733 365? 55.80 506,495 g 81 69 UFP Cov't
India SNPIICDS 2206Exp IV 386 270 115.18 2,120,000 MCH 67 67 WFP Cov't
Paraguay 2376 Exp 11 307 224 139.0 736,200 VFH 3 III 65 63 -WFP Gov't
Bolvia 2795 1175 200 126.7 70,500 SF 77 73 WFP Gov't
Colombia 305 365 130.93 -- MCH TH 54 49 USAID CARE Anderson (1977)
Costa Rica 959 200 159.06 -- ECH SUPE 74 94 - CARE
Dominican Repubilo 337 165 63.92 -- MCH TR 77 29 - CARE
India 340 200 68.62 -- HCH SUPE 75 39 - CARE
Pakistan 298 365 127.29 -- MCH TH 70 6 - CARE
Brazil PROAPE 500 365(?) 112.98 -- MCH 44 11 us Gov't Pinstrup-Anderson
(1988)
India TamLil Nadu 300 365(7) 134.10 -- MCH 29 WB Cov't
Indonesia HIPP -- -- -- -- MCH Sl -B Cov't
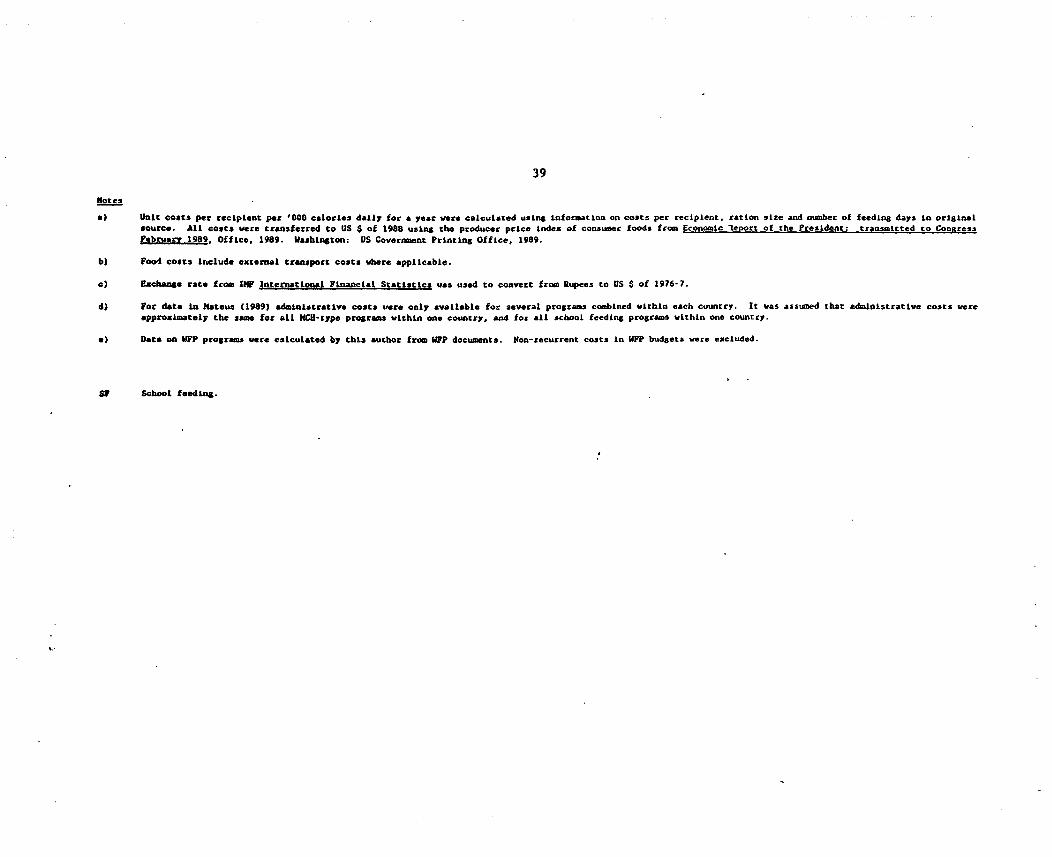
39Notes
a) Unit costs per recipLent per '000 calorLes daily for a year vere calculated using information on costs per recipLent, cation sLze and number of feeding days in originalsource. All costs were transferred to US S of 1988 using the producer pice index of consumter foods from Economic teport of the President: transmiLted to CongressFebruary 1989, OffIce, 1989. Washington: US Government Printing Office, 1989.
b) Foo4 costs Irclude external transport costs where appicable.
c) ehLaugse rate from IPF InternatloQal Financial Statistics was used to convert from Rupees to US $ of 1976-7.d) For data In Mateus (1989) adminLstrative costs vere only avaLlable for several program combined within each cuunrry. It was assumed that admLnistrative costs were
approxImately the same for aLl MCM-type programs within one country, and for aLl school feeding programs within one country.a) Data on bFP programs were calculated by this author from W?P documents. Pon-recurrent costs In UFP budgets oere excluded.
S School feeding.

40
ARpendix Table 2: Food as % of Total Costs of Feeding Programs
Country Operating Number of Program Food As % SourceAgency Beneficiaries Mepe Total Cost
India Special Nutrition Program Gov't. - MCH 77 Sahn (1980)
India - Poshak- exploratory phase (42)n- extensive primary health centre 79- extensive secondary health centre n (76)- intensive take-home n (42)- intensive supervised
i (35)
India CRS 89 n
India: Indo-Dutch project for child n.a. - 79
India ICDs- rural Gov't. - 66 n- tribal 69 n
India: Child care nutrition centre n.a. - 56 n
India: Kasa MCHN project n.a. - " 22 n
Brazil- MCHN Gov't. -- MCH 51 Mateus (1989)- PCA t n 551 n- PSA
-n 51
Bolivia Several PVO's -- 81
Chile Cov't. - " 82
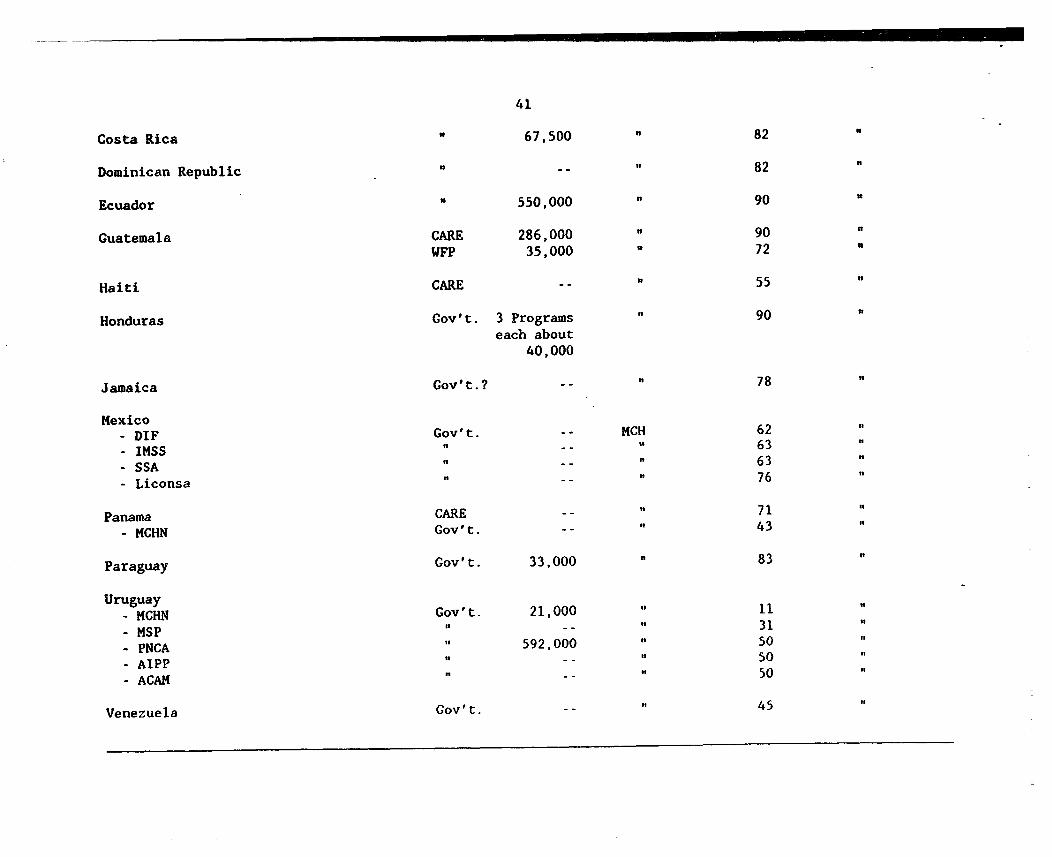
41
Costa Rica n 67,500 82
Dominican Republic - - 82
Ecuador n 550,000 90
Guatemala CARE 286,000 n 90WFP 35,000 n 72
Haiti CARE - - 55
Honduras Gov't. 3 Programs 90each about
40,000
Jamaica Gov't.? -- 78
Mexico- DIF Gov't. -- MCH 62- IMSS -- 63- SSA ., 63- Liconsa -- " 76
Panama CARE -- n 71.- MCHN Gov't. -- 43
Paraguay Gov't. 33,000 83
Uruguay- MCHN Gov't. 21,000 " 11 n- MSP 31- PNCA " 592,000 " 50- AIPP ,, , 50- ACAM " n 50
Venezuela Gov't. -i- 45

42
Brazil Gov't. -- School 51Feeding
Bolivia Several NGO's -i- 82
Chile Gov't. -- " 78
Costa Rica n 74
Dominican Republic n - school 81
feeding
Ecuador 2 Programs:200,000 84128,000 n 84
Guatemala ' 1,093,000 49
Honduras CARE 2 Programs:+ ECC 300,000 " 71 t
294,000 n 71
Jamaica Gov't. -- 78
Mexico- INI Gov't. 55- PIF' " *-- 61 - PIF ~~~~~~~n 61
Panama . 71
Paraguay 76,000 " 25
Uruguay - PNCA " 126,000 ' (unilikely)
Vernezuela - . 82

l~~~~~~~~~~~~~~~~~~ 3* S ~~~_ 3 _-
Appendix Table 3: Per Cent of Program Cost Financed Externally
Country Program Type % Cost Financed Externally
Brazil MCH 0SF 0
Bolivia MCH 88SF 18
Chile MCH 6SF 5
Costa Rica MCH 0SF 0
Dominican Republic MCH 20SF 20
Ecuador MCH 69SF 88
Guatemala MCH 69SF 49
Haiti MCH 98
Honduras MCH 90SF 71
Jamaica MCH 50SF 88
Mexico -- 61
Panama MCH 64SF 70
Paraguay MCH 71SF 25
Peru MCH 63
Uruguay MCH + SF 0
Venezuela MCH + SF 0
Source: Mateus (1989).
-44-
Appendix A: Summary of main interventions in Chile.
Appendix tables Al to A4 provide some information on costs and financing, anda brief description of the main programs follows.
1. National SuRRlementary Feeding Program (PNAC)
-Started in 1937, this is the oldest program, and has the largest number ofbeneficiaries. Around 1.2m children under 6 are covered (80% of infants underone year and 70% of 2-5 year olds). Pregnant and lactating mothers coveredalso.
- The supplement is distributed via public health system and varies by age andnutritional/health status. Rations are provided on a monthly basis. E.g. 0-5month olds receive 2kg of 26% milk per month in the basic program.
- To promote targetting of poor income groups, the service was linkedformally to primary health service in 1980. This has kept down administrationcosts. Food costs represented 98% of budget in 1989.
- Finances come from the Ministry of Health, Central Government, andMunicipalities. The latter must finance transport and distribution of foodvia the primary health care facilities. Project costs are linked closely withfood prices and supply. Costs per beneficiary vary significantly betweengroups.
- Substantial leakage to high income groups occur through the basicprogram. Further targeting will be required to avoid this.
2. Corporation for Infant Nutrition (CONIN)
Established by INTA (National Nutrition Institute) in 1975 to provideinpatient care for infants suffering severe malnutrition. 80% of fundingcomes from the central government, 20% from private sources via INTA. Infantsare identified through the National Health Service nutrition surveillancesystem. In 1985 cost per beneficiary was approximately US$600.
3. Colocacion Familiar para Ninos Desnutridos (COFADE)
Children in Metro Santiago suffering from 2nd and 3rd degreemalnutrition are placed with a foster family. The family is given US$46 permonth(1987) to help care for the child. Funds come from the municipality (ofSantiago) involved (40%) and from the Health Service Area (60%) (Min. ofHealth Budget). 150 children served per year- very low cost program,especially when compared to CONIN.
45
4. Junta Nacional de Jardines Infantiles (JUNJI)
- Formed as an autonomous body in 1970 to provide a comprehensive daycareprogram for pre-school children in urban areas. A complementary feedingprogram is an integral part of the project
- The day care facility operates M-F 8:30 a.m.- 5:30 p.m. all year exceptFebruary, and nursery care is provided for 0-2 yr olds, mid level care for 2-4yr olds, transitional level for 4-5 yr olds. Language, psychomotor and socialskills are developed.
- This program is the most expensive on a cost/beneficiary basis:
1986 1989
personnel 54% 60.35%food 35% 31.9%other 10.9% 7.8%
Cost/beneficiary is around US$418 due to high salarieR of university trainedpre-school teachers.
- Total coverage is below need. 45% of children enrolled in JUNJI were inthe greater Santiago metropolitan area. Poorer regions and rural areasreceive much less help. In 1987, 59% of pre-school subsidies went to familiesin the two lowest income quintiles (22% went to the two upper quintiles)
5. Centros de Alimentacion v Estimulo (CADELI
In response to the high cost and inadequate coverage of JUNJI, Centrosde Alimentacion y Estimulo were established in 1987 it: urban neighborhoods.
- Community based approach with volunteers from the neighborhood. Servicesare offered half day only. Lunches and snacks provide about 750 cal. per day(50% of average dietary requirement). CADEL centres average about 30 childreneach, there are about 360 of them in most urban and semi-urban areas. Foodcosts represent 75% of CADEL expenditures.
6. Other Preschool Proarams
-Private non-profit agencies such as CARITAS and FNACO operate day careprograms. FNACO assists about 45,000 children per year, and CARITAS and JJII(Fundacion Jardines Infantiles) about 37,000 children per year.
7. Proorama de Alimentacion Escolar (PAE)
- Provides free lunches and a breakfast or snack to poor children betweenthe ages of 6 and 14 attending public and private primary schools, and all
46
students in rural residential primary and secondary schools.
- Means tested system ueed to target beneficiaries, based on family income,mother's education, teacher's opinion, nutritional status, etc.
- 189 davi coverage, and additional summer coverage for low incomechildren (Jan/Feb). About 700 calories and 20g protein (33% ofRDA ofprotein/calories) are provided each day. Daily participation rates fluctuatedepending on enrollment and socioeconomfic level of region. 57% of studentsenrolled in eligible rural schools are served, and 28% in urban eligibleschools:
1988 1985
Beneficiaries 610,714 616,526(534,465 exc JUNJI)
- Cost per beneficiary (per year) is around US$19 for breakfast and US$51 forlunch (US$70 for a full ration). 85% of budget is allocated to food costs.Municipalities usually fund just under 10% of the program.
Sources: Muchnik and Vial (1990), World Bank unpublished documents, Castaneda(1990).

47
An2endix table Al. Chile: annual expenditures on nutrition interventionDroarams. umillion 1987 Us S
YEAR PNAC PAZ JUNJ1I(CADEL included TOALafter 1987)
1974 35.4 - 6.4 -
1975 36.2 - 5.1
1976 36.4 - 6.5
1977 43.1 10.8
1978 36.9 35.8 19.2 91.9
1979 40.1 37.3 19.7 97.1
1980 29.3 38.7 17.1 85.1
1981 36.3 44.7 16.8 97.3
1982 37.9 43.0 17.9 98.8
1983 29.7 43.8 16.9 90.4
1984 47.9 46.7 16.0 110.6
1985 42.1 47.6 17.0 106.7
1986 35.9 43.1 18.2 97.2
1987 44.0 34.4 17.2 95.6
1988 42.7 31.5 19.8 94.0
Source: Muchnik and Vial (1990)

48
A&Mendix table A2. Chile: sources of cntral governMent expenditures
on PNAC (million 1986 Us S$
BUDGET FROM FOREIGN TOTALMINISTRY AF ABMT DONATIONS BUDGE
1978 35.0 n.a. n.a.
1979 38.1 n.a. n.a.
1980 27.8 n.a. n.a.
1981 34.5 n.a. n.a.
1982 35.9 n.a. n.a.
1983 28.2 n.a. n.a.
1984 35.1 10.3 45.4
1985 29.7 10.3 40.0
1986 26.1 9,.0 35.1
1987 38.5 3.2 41.7
1988 31.1 9.8 40.9
- not including municipal expenditures- 1986 period average exchange rate used - Ch $193.016:US $1.00- Source: World Bank unpublished documents

49
A,oendix table A3. Chile: Financing of school feeding grooras (PAB).(1988 US$m)
Year Central Govt Municipal Govt1981 47.3 0.51982 41.4 4.61983 43.7 5.71984 45.3 5.01985 47.7 4.11986 44.0 5.61987 34.7 7.51988 34.9 8.6
Based on CH$245.048: US$1.00Source: World Bank unpublished documents
Appendix table C4. Cost ver beneficiary and ver calorie of maior interventions.
Total K Cal. I of Cost/Ben Cost/Kcal Cal/BenefAnnual Delivered Benef. per year (US cents) per day1
PROGRAM Cost (USSM) (Million) ('000) (USS) _
PNAC 39.7 135,457 1,042.0 38.1 0.0293 130.2
PAR 35.0 80,244 557.3 62.8 0.0436 394.0
JUNJI 16.0 10,571 55.9 300.0 0.1510 518.0
I Average calories received per beneficiary per day, assuming the totalamount of calories provided were distributed in 365 days.Sources Muchnik and Vial (1990).
-50-
Appendix B
Summarv of Main Nutrition Interventions in the Philig2ines
Four major categories of nutrition interventions exist, classified by the NationalNutrition Council (NNC) as follows:
1. Food Assistance (5.158)
2. Nutrition/Nutrition Related Health Services (3.920)
3. Incremental Food Production (5.462)
4. Nutrition Communication (0:835)
(Figures in brackets give numbers of beneficiaries in first 3 quarters of 1989 in milLions.)
The NNC was established in 1974 by the government of Philippines in recognition ofnutrition as a national priority. USAID PL480 title II assistance has played a major role!n the country. Since 1960 over $300m in food has been shipped to Philippines. In 1989,52,435 metric tonnes of food were shipped to Philippines ($13.825m) through two agencies,CARE and CRS (Catholic Relief), mostly for MCH and School feeding programs.
Appendix table.Dl summarizes the main interventions within each of the 4 groups above, anda brief description follows.
1. FOOD ASSISTANCE PROGRAM
- Short term rehabilitation approach for malnourished and at-risk groupscollaborative effort of government and NGO's.
2. NUTRITION/NUTRITION RELATED HEALTH SERVICES
- Rehabilitation of moderate/severe malnutrition cases, and control ofnutrition-related communicable diseases
- Nutrition and related health services for schools
- Food and micronutrient supply to target groups
- Information dissemination and education
4. INCREMENTAL FOOD PRODUCTION
- To increase awareness among government and NGO's on nutrition issues andimportance
- Classes on nutrition, breastfeeding, targeting parents
- Dissemination through mass media: 'Nutrition School-on-the-Air"

51
Foreign Assistance
In 1989 PL480 supplied 521,435 metric tonnes of food at a cost of S13.825 million.These commodities went through four types of intervention, run by CRS and CARE. Appendixtables B5-B7 present information on costs and targeting of these programs (from USAID,1982)
Sources: World Bank unpublished docements, USAID (1982), Aguillon (1986).

52
Appendix Table B1
Philippines: Summary of Main Nutrition Intervention
goIE ct3.&~ Description Ministry Target Poe. Fun"
FOOD ASSISTANCE PROGRAM
1. Nutrition Support Provide Insumix and teach DA 34,064 n.a.proper preparation ofindigenous weaning foods
2. Milk Program 200,000 litres of milk DA n.a. n.a.distributed
3. Targeted Food Aims to reduce prevalence of severe MOH 1,119,726 18.394,833Assistance Program and moderate malnutrition in +3.800.893cA"tn Cost)
pre-schoolers; provides 1/3 - 22,195,726-1/4 of RDA of calories andprotein
4. Akbayan Sa same as (3) HOH 50,000 350,000 (not LociudingKalvsugan (ASK) Ain. Cost)(WFP assisted)
5. Targeted Food same as (3) MSWD 100,000 2,400,000Assistance(WFP, PHI 2607)
6. Supplementary Feeding same as (3) MSWD 897,090 20,913,237 (DSWD)(CRS Supported) 62,253,416 (CRS)
7. Disaster/Emergency Ready to eat food for disaster MSWD 2,114,944 23,881.346Assistance victims and stranded individuals;
food for work to assist refugees
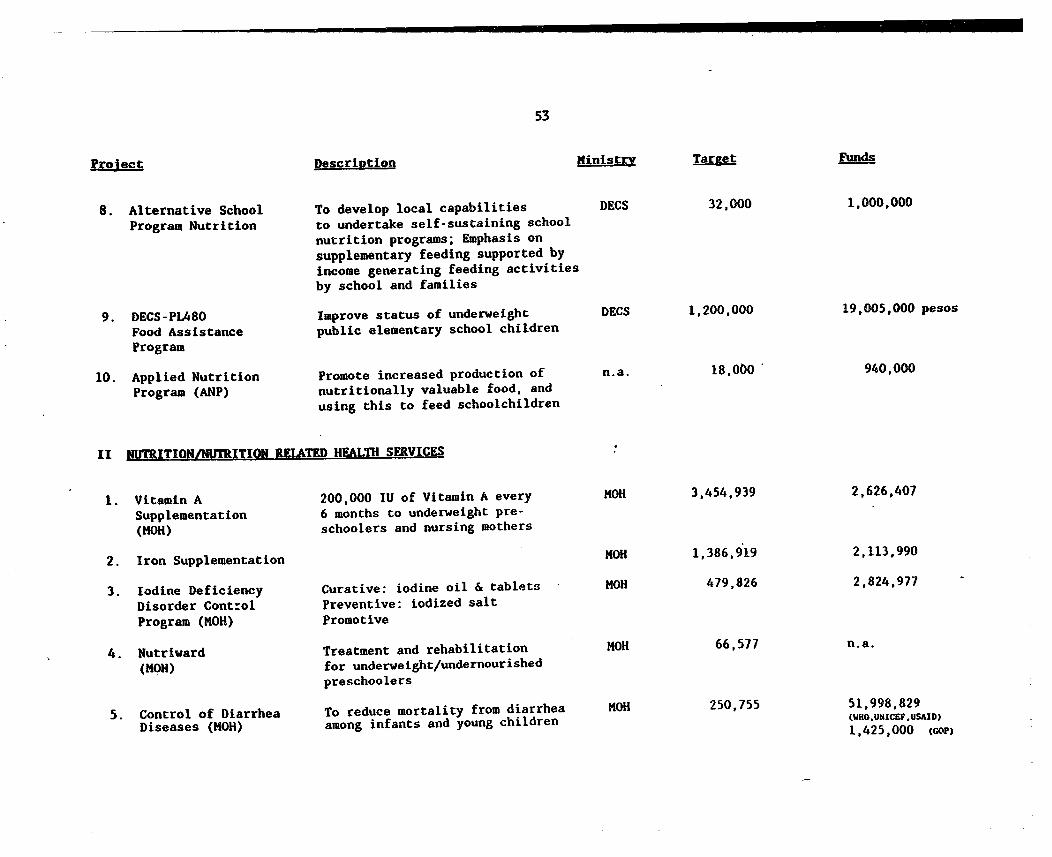
53
Project Description Kinistry Target Funds
8. Alternative School To develop local capabilities DECS 32,000 1,000,000Program Nutrition to undertake self-sustaining school
nutrition programs; Emphasis onsupplementary feeding supported byincome generating feeding activitiesby school and families
9. DECS-PL480 Improve status of underweight DECS 1,200,000 19,005,000 pesosFood Assistance public elementary school childrenProgram
10. Applied Nutrition Promote increased production of n.a. 18,000 940,000Program (ANP) nutritionally valuable food, and
using this to feed schoolchildren
II NUTRITIONMNUTRITION RELATED HEALTH SERVICES
1. Vitamin A 200,000 IU of Vitamin A every MOH 3,454,939 2,626,407Supplementation 6 months to underweight pre-(MOH) schoolers and nursing mothers
2. Iron Supplementation MOH 1,386,919 2,113,990
3. Iodine Deficiency Curative: iodine oil & tablets MOH 479,826 2,824,977Disorder Control Preventive: iodized saltProgram (OH) Promotive
4. Nutriward Treatment and rehabilitation MOH 66,577 n.a.(MOH) for underweight/undernourished
preschoolers
5. Control of Diarrhea To reduce mortality from diarrhea MOH 250,755 51,998,829Diseases (MOH) among infants and young children (WHO.UNICEF.USAID)
1,425,000 (Gop)

54
poject Description Ministry Target
III INCREMENTAL FOOD PRODUCTION
1. Promotion of Improved DA 2,129,797 n.a.Crop Technology
2. Distribution of Seed and DA 337,059 n.a.Planting Inputs
3. Establishment of Home DA 160,955 n.a.Gardens (Training)
4. Annual Health & Disease DA 71,393 n.a.Management
5. Annual Dispersal (improved DA 5,505 n.a.breeds to enhance income)
6. Fresh Water Agriculture DA 8,891 n.a.Development
7. Fish Processing Technique DA 14,946 n.a.Development
8. Promotion of Business Activity DA 18,257 n.a.to Develop EntrepreneurialSkills
9. Self-Employment Parents of supplementary DSWD 88,189 2 7,8 80,000 psoiAssistance Program feeding program enrollees taught
self-employment skills and foodproduction to augment income
10. Communal Gardens Parents of underweight children n.a. 88,104 27,886,307taught to undertake communalgardens
11. Alay Tanim at Practical educational exp. ATP 100 seed centres 1,000,000Pangka-buhayan to improve economic productivity, 2252 supervisors/(ATP) health & nutrition status teachers provided
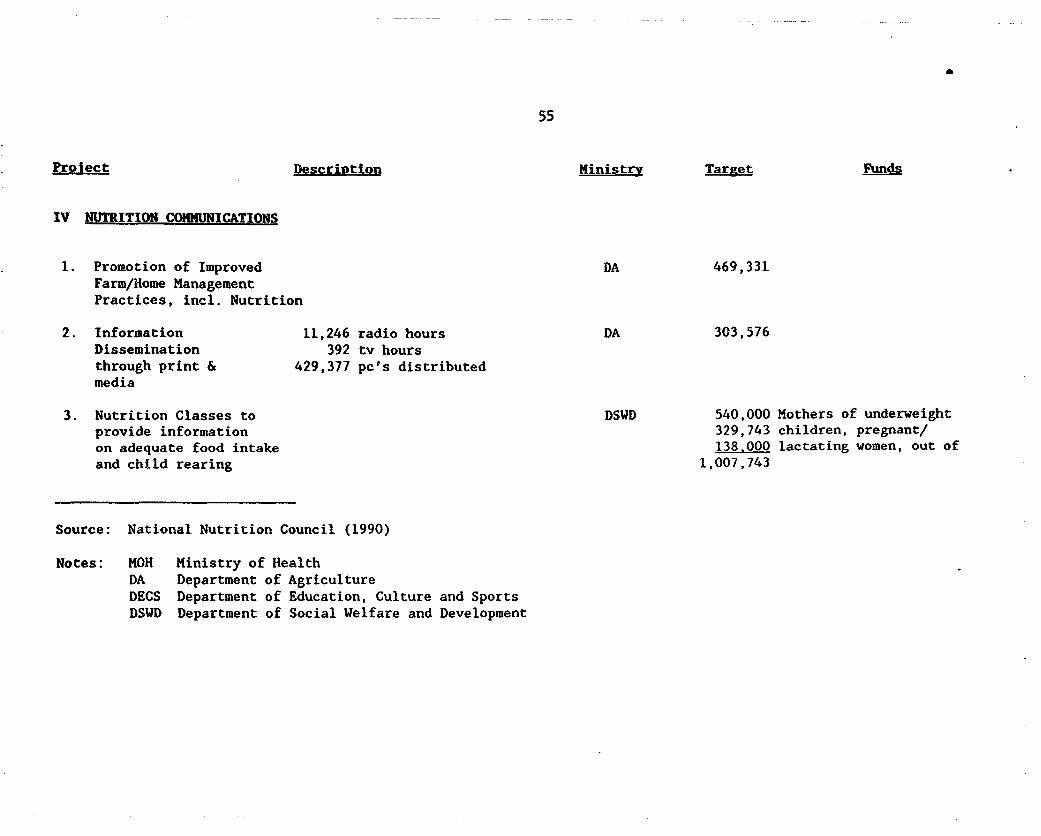
55
Protect Description Ministry Target Funds
IV NUTRITION COMMUNICATIONS
1. Promotion of Improved DA 469,331Farm/Home ManagementPractices, incl. Nutrition
2. Information 11,246 radio hours DA 303,576Dissemination 392 tv hoursthrough print & 429,377 pc's distributedmedia
3. Nutrition Classes to DSWD 540,000 Mothers of underweightprovide information 329,743 children, pregnant/on adequate food intake 138.000 lactating women, out ofand child rearing 1,007,743
Source: National Nutrition Council (1990)
Notes: MOH Ministry of HealthDA Department of AgricultureDECS Department of Education, Culture and SportsDSWD Department of Social Welfare and Development
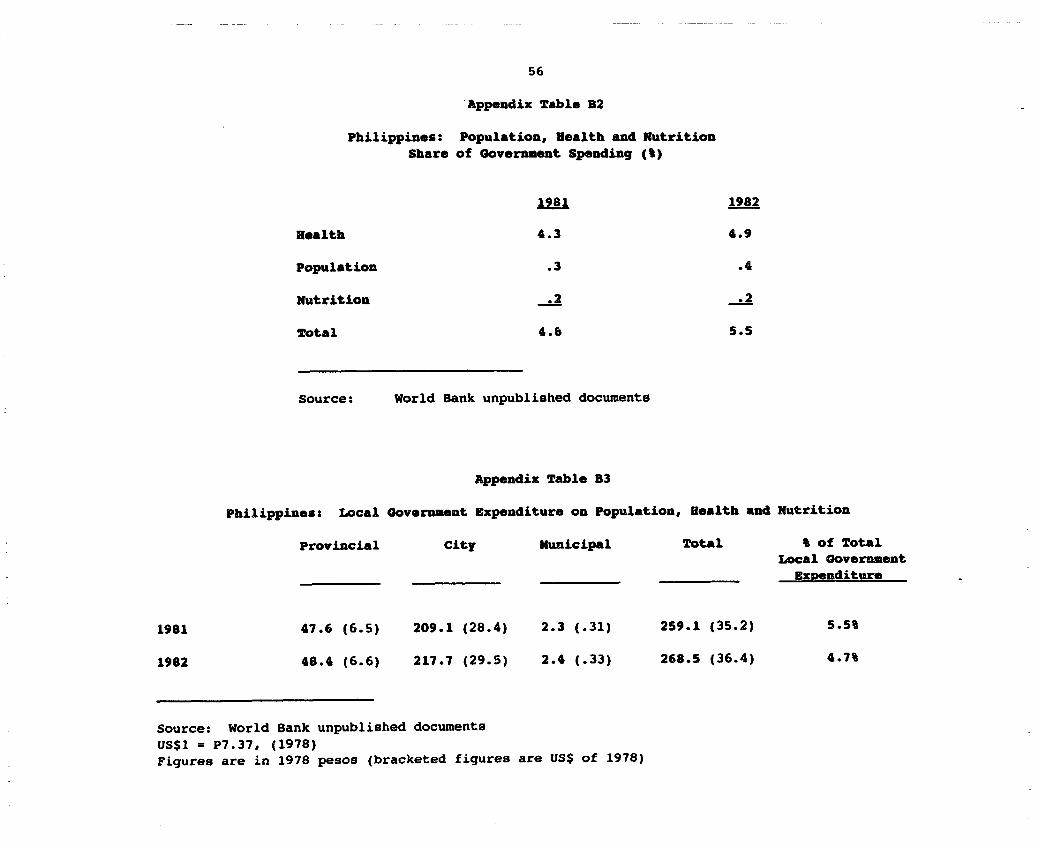
56
Appendix Table 82
Philippines: Population, Health and NutritionShare of Government Spending (%)
1981 1982
Health 4.3 4.9
Population .3 .4
Nutrition .2 .2
Total 4.8 5.5
Source: World Bank unpublished documents
Appendix Table 83
Philippines: Local Government Expenditure on Population, Health and Nutrition
Provincial City Municipal Total t of TotalLocal Government
____________ ___________ ___________ Ex2enditure
1981 47.6 (6.5) 209.1 (28.4) 2.3 (.31) 259.1 (35.2) 5.5%
1982 48.4 (6.6) 217.7 (29.5) 2.4 (.33) 268.5 (36.4) 4.7%
Source: World Bank unpublished documentsUS$1 = P7.37, (1978)
Figures are in 1978 pesos (bracketed figures are US$ of 1978)
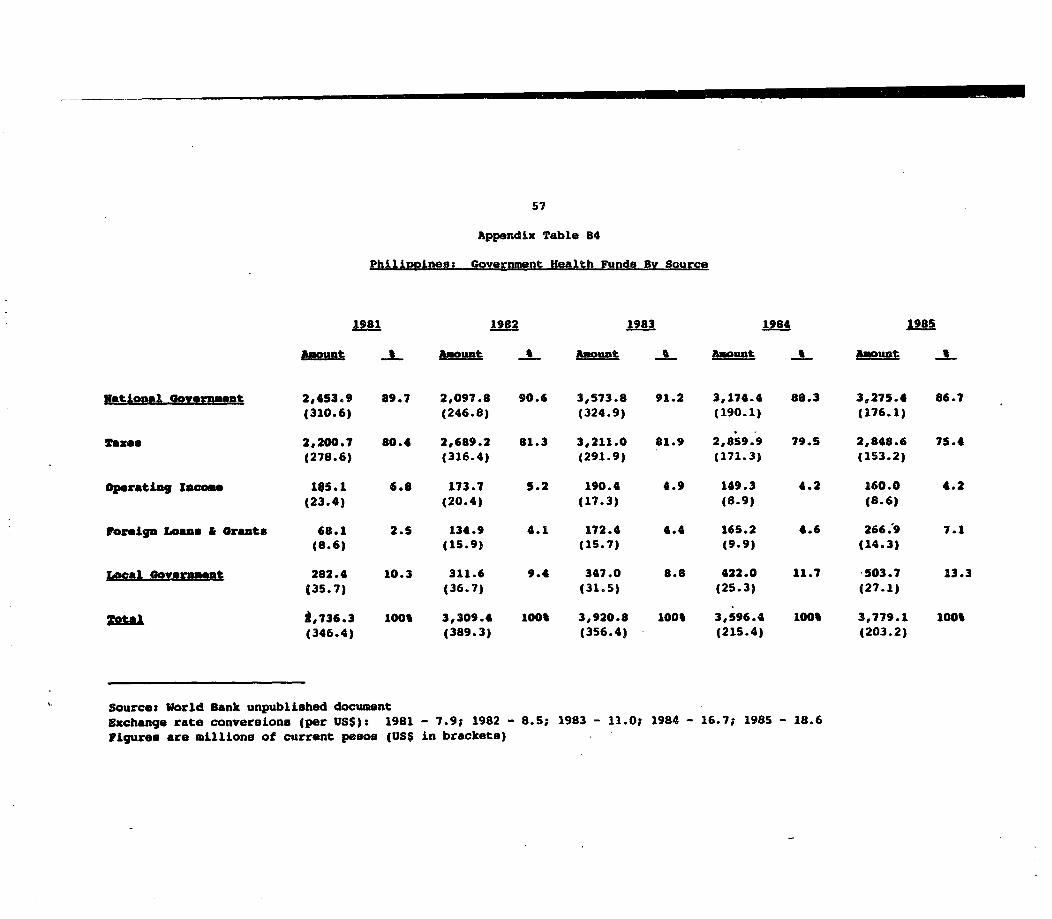
57
Appendix Table B4
Phillndlnegs Government Health Funds By Source
1981 1982 1983 1984
A-MuQt * Amount L Aunt It sount Au
National Gowernment 2,453.9 89.7 2,097.8 90.6 3,573.8 91.2 3,174.4 88.3 3,275.4 86.7(310.6) (246.8) (324.9) (190.1) (176.1)
Tazes 2,200.7 80.4 2,689.2 81.3 3,211.0 81.9 2,859.9 79.5 2,848.6 7S.4(278.6) (316.4) (291.9) (171.3) (153.2)
Operating In one 185.1 6.8 173.7 5.2 190.4 4.9 149.3 4.2 160.0 4.2(23.4) (20.4) (17.3) (8.9) (8.6)
Foreign Loans & Grants 68.1 2.5 134.9 4.1 172.4 4.4 165.2 4.6 266.9 7.1(8.6) (15.9) (15.7) (9.9) (14.3)
Local Government 282.4 10.3 311.6 9.4 347.0 8.8 422.0 11.7 503.7 13.3(35.7) (36.7) (31.5) (25.3) (27.1)
ZgaLv *,736.3 100% 3,309.4 100% 3,920.8 100% 3,596.4 100% 3,779.1 100%(346.4) (389.3) (356.4) (215.4) (203.2)
Source: World Bank unpublished documentExchange rate conversions (per US$): 1981 - 7.9; 1982 - 8.5; 1983 - 11.0; 1984 - 16.7; 1985 - 18.6Figures are millions of current pesos (US$ in brackets)

58
ADgendix table B5. Average Cost to suD2ly 1000 Calories of Food Value(Based on Total Program Cost)(U.S. Cents per 1000 Calories)
MCH DaX Care School Feeding FFWE CRS CRS CAR C CAR
1979 12 21 N.A. 17 29 16 32
1980 14 20 19 28 29 18 31
1981 22 24 N.A. 44 34 26 37
Source: USAID (1982)
Appendix table B6.
Percent of Sam2le with 2nd and 3rd Degree Malnutrition
Nol.CRS 77.0CARE 95.0
DAY CARE (CRS)MSSD Sample 37.5Urban 13.6Rural 57.0
SCHOOL EEEDINGCRS 23.0CARE 35.2
A2pendig table 87
I2gLut Average Cost to SupplY 1°0Q Calories of Foodto Targeted Population (2nd and 3rd Degree Malnourished)
(U.S. Cents per 1000 Calories)
MCH SDay Care chool FeedingCAverage Urban Rural CRS CARE
1979 15.6 22.1 N.A. N.A. N.A. 73.9 82.4
1980 18.2 21.1 150.7 13.9 33.3 121.7 82.4
1981 28.6 25.3 N.A. N.A. N.A. 191.3 96.6
Source: USAID (1982)

-59-
Appendix C Summary of Main Interventions in Malawi
Appendix table El provides information on expenditures on nutrition by UNICEFand the World Food Program, and a brief text discussion follows.
* Malnutrition is a serious problem: approximately half the childrenunder age 5 are stunted due to chronic malnutrition (i.e. below -2 SD ofheight for age) among 2 year olds, 2/3 are already stunted.
The major cause is household food insecurity. Also, the staple food inthe country has very low nutritional value as usually prepared forchildren.
- Estate-oriented development strategy has been the main course offood insecurity, especially for small holders. Success of estateagriculture did not spill over to other producers or sectors.
- The principal staple is porridge made from steamed maize flour.The nutritional value depends on consistency of the porridge;small children are given very thin recipes, hence nutritionalvalue is very low.
Extent of poverty in rural areas of Malawi is another cause of theproblem.
- A recent WB report cited that 55% of households cultivated lessthan 1 hectare of land. 26% cultivated less than .5 hectare.
Through substantial donor and other pressure the government of Malawihas recently started to recognize the need and importance of a coherentnutrition program. The Food Security and Nutrition Unit (FSNU) wasestablished in 1986 in response to this pressure. Its objective is toreach food security and nutrition goals in the most effective manner.
The FSNU is understaffed and underfunded, although it has receivedsubstantial help from HIID and Cornell/UNICEF. The latter are moreinvolved in food security and nutrition issues.
As of early 1989, the FSNU has only been able to provide a policy paper.This is still under discussion.
As a result, the nutrition problem in Malawi is being tackled by foreignNGO's, WFP and UNICEF.
- UNICEF has an area based project, and also assists the FSNU inpreparing and evaluating data, growth monitoring, education, and asmall micronutrient supplementation project.
- The major intervention is the supplementary feeding program of WFP(project 525).
- WFP feeding program is integrated with most activitieslinked to nutrition education, growth monitoring andpreventive health care (immunization).

60
Health Centre based feeding program
food supplement gives incentive for attendance at nutritionclinics
- but only about 60% of targeted children and 70% of targeted
mothers attend, due to distance, work, etc.
- Ministry of health will begin to deliver services in communitiesalso, not just at centres. This community based supplementationfeeding program is a new part of expansion 3
Source: World Bank unpublished documents and World Food Program project
documents.

A*pendix table Cl. UNICEE and WFP ex2enditures on nutrition in M&lawi
US DollarEstimated
Activity Comments 1989 1990
UNICE
Growth Training 37,000 22,000Monitoring Scales 18,000 14,300
Micro-nutrients Iron Supplements 8,400 8,400Retinol 18,174 18,174Iodine 22,300 22,300
National Planning: Includes Tech. Assist from 225,000 345,000Nutritional Cornell and Wshops, surveysSurveillance equipment
Area Base Project: Nichis! district (pop'n - 12,000) 100,000 80,000(Water, sanitation Nkhata Bay Districtchealth & nutrition Mangochi District ------ ------education, GM Ekwendeni Mission Hospital 34,000 ------agricultural inputs)
Nutrition Education Printing 50,000 copies ------ 64,000of Nutrition Facts Book
Cassava Cuttings to Emergency Response 145.000 ------drought affected areaTotal 607,874 734,174
feeding programs MCH, NRC's, hospitals and community 7,000,000 7,000,000program: local contribution 31X
62
APPENDIX D: List of contacts (excluding country study).
The author would like to thank the following people for providing references, documents,suggestions and assistance:
Harold Alderman IFPRI and Cornell projectMary Ann Anderson USAIDGeorge Beaton University of TorontoHelen Bratcher CRSJennifer Bremer Robert R. Nathan AssociatesCatherine Castaneda Philippine Council for Health Research and
DevelopmentDavid de Ferranti World BankPeter Greaves JNSP UNICEFJim Green World BankMargaret Grosh World BankRobert Hecht World BankRudi Horner CARERobert Hornik University of PennsylvaniaSandra Huffman Center to Prevent Childhood MalnutritionKaren Lashman Consultant, World BankSubbarao Kalanidhi World BankEileen Kennedy IFPRITom Marchione USAID (Food for Peace)Francisco Mardones Instituto de Nutricion, Universidad de ChileAbel Mateus World Banklose Mora LTS Corp.Phi Musgrove World BankPeggy Parlatto Academy for Educational DevelopmentPer Pinstrup-Anderson Cornell UniversityVikki Quinn UNICEF, MalawiSonya Rabeneck CIDAShlomo Reutlinger World BankMichelle Robichaud CIDABea Rogers Tufts UniversityHelen Saxenian World BankMr. Schulteis WFP/FAOKen Sklaw Johns Hopkins University (Institute for
International Programs)Hope Sukin USAIDCornelius Tuinnenberg World BankPenny van Esterik York University

63
Bibliography.
Aguillon, D.B. The food and nutrition program: progress and problems 1975-87.Manila: National Nutrition Council, 1986.
Alderman, H. Food subsidies and the poor. In G. Pschacharopoulos, ed., Essays onpovertv. equity and growth, World Bank Comparative Studies, forthcoming.
Anderson, M. A. CARE preschool nutrition project: phase II report. NewYork: CARE, 1977.
Austin, J. and M. Zeitlin (eds.). Nutrition interventions in developing countries: anoverview. Cambridge, Ma: Oelgeschlager, Gunn and Hain, 1981.
Beaton, G. Nutrition research in human biology: changing perspectives andinteipretations. University of Toronto, 1990. (mimeo.)
Beaton, G. H. and H. Ghassemi. Supplementary feeding programmes for youngchildren in developing countries. Report to UNICEF and ACC Sub-committeon Nutrition of the UN, 1979. (mimeo.)
Berg, A. Malnutrition: what can be done? Baltimore: Johns Hopkins, 1987.
Bremer, J. and J. Gilmore. A cost information system for PL-480 Title 11 programsimplemented by PVO's: findings from the Haiti field test. Washington DC:Robert R. Nathan Associates, draft 1986 (mimeo.)
Brenzel, L. The costs of EPI: a review of cost and cost-effectiveness studies(1979-1987). Washington DC: John Snow Inc, REACH project, 1989.
Burger, S., J-P. Habicht, K. Peterson and P. Pinstrup-Andersen. Protein-energymalnutrition. In Evolving health sector priorities in developing countries, editedby Jamison, D. T. and W. H. Mosley, forthcoming. Draft, 1990.
Castaneda, T. Para combatir la pobreza. Santiago, Chile: Centro de EstudiosPdblicos, 1990.
Garcia, M. and P. Pinstrup-Andersen. The pilot food price subsidy scheme in thePhilippines: its impact on income, food consumption and nutritional status.Washington DC: International Food Policy Research Institute Research Reportno. 61, 1987.
Ghassemi, H. "Supplementary feeding" revisited. Rome: FAO Food Policy andNutrition Division of the UN, 1989.
Gopaldas, T. et al. Project Poshak. vols 1 and 2. New Delhi: CARE India, 1975.

64
Haaga, I., L. Clark, B. Edmonston, I-P Habicht, C. Kenrick, K. Kurz, J. Mason andK. Test. Evaluating effects of child feeding programs: report of workshop onnutritional surveillance in evaluation of Food for Peace programs. CornellNutritional Surveillance Program, 1984, draft.
Heimendinger, J., M. F. Zeitlin and J. E. Austin. Formulated foods. Study IV inAustin, J. and M. Zeitlin (eds.) Nutrition interventions in developing countries:an overview. Cambridge, Ma: Oelgeschlager, Gunn and Hain, 1981.
Ho, T. J. Economic issues in assessing nutrition projects: costs, affordability and costeffectiveness. Washington DC: World Bank PHN Technical Note 85-14, 1985.
Hornick, R. Nutrition education: a state of the art review. Geneva: UN ACC-SCNNutrition Policy Discussion paper no 1, 1985.
Huffman, S. and C. Combest. Promotion of breastfeeding: yes, it works! Bethesda,Md: Center to Prevent Childhood Malnutrition, draft, undated (mimeo.)
Huffman, S. L. and A. Steel. Do child survival interventions reduce malnutrition: thedark side of child survival. Bethesda, Md: Center to Prevent ChildhoodMalnutrition, 1990.
Katona-Apte, I. A commodity-appropriateness evaluation of 4 WFP projects: a briefexposition. In Nutritional aspects of food aid. M. Forman (ed), Geneva: UNSubcommittee on Nutrition/ACC, 1986.
Kennedy, E. and H. H. Alderman. Comparative analyses of nutritional effectivenessof food subsidies and other food-related interventions. Washington DC: IFPRIJoint WHO-UNICEF Nutrition Support Program, 1987.
Knudsen, O.K. Economics of supplemental feeding of malnourishedchildren: leakages, costs, and benefits. World Bank Staff Working Paperno. 451, 1981.
Levin, H. M. A benefit-cost analysis of nutritional interventions for anemia reduction.Washington DC: World Bank PHN Technical Note 85-12, 1985.
Levine, R. G. and S. L. Huffman. The economic value of breastfeeding at thenational, public sector, hospital, and household level. Bethesda, Md: Center toPrevent Childhood malnutrition, 1990.
Levin, H. M., E. Pollitt, R. Galloway and J. McGuire. Micronutrient deficiencydisorders. In Evolving health sector priorities in developing countries, editedby Jamison, D. T. and W. H. Mosley. Washington DC: World Bank, 1990.
Mateus, A. Targeting food subsidies for the needy: the use of cost-benefit analysis andinstitutional design. World Bank Staff Working Papers no. 617, 1983.

65
Mateus, A. Feeding Latin America's children. Washington DC: World Bank LACreport no. IDP-0049, 1989.
McGuire, J. S. The payoff for improving nutrition. Washington DC: World Bank,draft, 1990 (mimeo.).
Mills, M. Bangladesh food and nutrition sector review mission: cost-effectiveness offood and nutrition intervention programs. Washington DC: World Bank, draft,1983. (mimeo.)
Muchnik, E. and I. Vial. Impacto del P.N.A.C. en preescolares de Santiago.Santiago: Universidad Cat6lica de Chile, Departmento de economfa agraria,monograph, 1990.
Musgrove, P. Fighting malnutrition: an evaluation of Brazilian Food and Nut:itionPrograms. Washington DC: World Bank Discussion Paper no. 60, 1989.
National Nutrition Council. Philippine Food and nutrition program plan *1990.Manila: National Nutrition Council, 1990.
Parker, R.L., C.E. Taylor, A.A. Kielmann, A.K. Srinivas Murthy and t.S. Uberoi.The Narangwal experiment on interactions of nutrition andinfections: 111. Measurement of services and costs and their relation tooutcome. Indian Journal of Medical Research, 68: 42-54, 1978.
Pfeffermann, G. and C. C. Griffin. Nutrition and health programs in LatinAmerica: targeting social expenditures. Washington DC: World Bank, inassociation with International Center for Economic Growth, Panama City,1989.
Phillips, M.A., A.J. Mills and R. G. Feachem. Cost-effectiveness of interventions forthe control of diarrhoeal diseases: the costs of breast-feeding promotion.London: Department of Tropical Hygiene, draft 1985 (not for quotation orcitation).
Pinstrup-Andersen, P. Assuring food security and adequate nutrition for the poor. InBell, D.E. and M.R. Reich. Health. nutrition and economic crises. Dover,Ma: Auburn Publishing Co., 1988.
Reutlinger, S. and J. Katona-Apte. The nutritional impact of food aid: criterion for theselection of cost-effective foods. Washington DC: World Bank, Agricultureand Rural Development Department ARU DIscussion Paper 12, 1983.
Robert. R. Nathan Associates, Inc. Assessment of the PL-480 Outreach andenhancement grant programs. Submitted to USAID[FVA, 1987.
Rogers, B. L. Feeding programs and food-related income transfers. (Cornell project).
66
Sahn, D. E. The integrated MCN project in India: recommendations based on areview of past experiences. Ann Arbor MI: Community Systems Foundation,submitted to USAID, 1980.
Scandizzo, P. L. and G. Swamy. Benefits and costs of food distribution policies: theIndia case. World Bank Staff Working Papers no. 509, 1982.
Stewart, K. J. Cost effectiveness of child survival initiatives: a literature review.Washington DC: USAID. Background paper for the fourth report to Congresson CHild Survival, 1988.
Subbarao, K. Improving nutrition in India. Washington DC: World Bank DiscussionPapers no. 49, 1989.
Taylor, C.E., R. Faruqee, R.S.S. Sarma, R.Parker, and W. Reinke. Child andmaternal health services in rural India: the Narangwal experiments. vol 2.Integrated family planning and health care. Baltimore: Johns Hopkins, 1984.
Tognetti, J. A review of breastfeeding program evaluations. Background paper formeeting "A retrospective and prospective look at international breastfeedingpromotion programs" sponsored by INCS and Office of Nutrition, USAID, Dec16-18, 1985.
USAID. Growth monitoring and nutrition education: impact evaluation of an effectiveapplied nutrition program in the Dominican Republic. CRS/CARITAS,1983-86. Washington DC: USAID Office of Nutrition, 1988.
USAID. A study of the impact of a food assistance program in the Philippines.Washington DC: USAID Document no. PB85-131936, 1982.
World Food Program. Annual Report 1990. Rome: FAO, 1990.

Policy Research Working Paper Serles
ContactTitle Author Date for paper
WPS934 Public Hospital Costs and Quality Maureen A Lewis July 1992 P. Trapanlin the Dominican Republic Margaret B. Sulvetta 31947
Gerard M. LaForgia
WPS935 The Precautonary Demand for Voum-Jong Choe July 1992 S. LipscombCommodity Stocks 33718
WPS936 Taxation, Information Asymmetries, Andrew Lyon July 1992 C. Jonesand a Firm's Financing Choices 3;d99
WPS937 How Soft is the Budget Constraint Evan Kraft July 1992 CECSEfor Yugoslav Firms? Milan Vodopivec 37178
WPS938 Health, Govemment, and the Poor: Nancy Birdsall July 1992 S. RothschildThe Case for the Private Sector Estelle James 37460
WPS939 How Macroeconomic Policies Affect Daniel Kaufmann July 1992 D. KaufmannProject Performance in the Social Yan Wang 37305Sectors
WPS940 Private Sector Approaches to Karen G. Foreit August 1992 0. NadoraEffective Family Planning 31091
WPS941 Projecting the Demographic Impact RodoHfo A. Bulatao August 1992 0. Nadoraof AIDS Eduard Bos 31091
WPS942 Efficient Environmental Regulation: Arik Levinson August 1992 WDRCase Studies of Urban Air Pollution Sudhir Shetty 31393(Los Angeles, Mexico City, Cubatao,and Ankara)
WPS943 Burden-sharing among Official and Ashl DemirgOg-Kunt August 1992 K. WaeltiPrivate Creditors Eduardo Fernandez-Arias 37664
WPS944 How Public Sector Pay and Gail Stevenson August 1992 PHREEEmployment Affect Labor Markets: 33680Research Issues
WPS945 Managing the Civil Service: What Barbara Nunberg August 1992 P. InfanteLDCs Can Learn from Devebped 37642Country Reforms
WPS946 Retraining Displaced Workers: What Duane E. Leigh August 1992 PHREECan Developing Countries Leam from 33680OECD Nations?
WPS947 Strategies for Creating Transitonal Stephen L Mangum August 1992 PHREEJobs during Structural Adjustment Garth L Mangum 33680
Janine Bowen

Policy Research Working Paper Series
ContactTitle Author Date for paper
WPS948 Factors Affecting Private Financial Mohua Mukherjee July 1992 R. LynnFlows to Eastern Europe, 1989-91 32169
WPS949 The Impact of Formal Finance on the Hans Binswanger August 1992 H. BinswangerRural Economy of India Shahidur Khandker 31871
WPS950 Service: The New Focus in Hans JOrgen Peters August 1992 A. ElcockInternational Manufacturing and Trade 33743
WPS951 Piecemeal Trade Reform in Partially Glenn W. Harrison August 1992 D. BallantyneLiberalized Economies: Thomas F. Rutherford 38004An Evaluation for Turkey David G. Tarr
WPS952 Unit Costs, Cost-Effectiveness, and Susan Horton August 1992 0. NadoraFinancing of Nutriion Interventions 31091