
Interpreting data … Drawing and comparing Box and Whisker diagrams (Box plots)
Upload
loreen-langCategory
view
216download
0
Unit 8: Day 3Box and Whisker PlotsMs. Hall

Too bad this is not a box and whisker plot, but it is a great way to remember it!
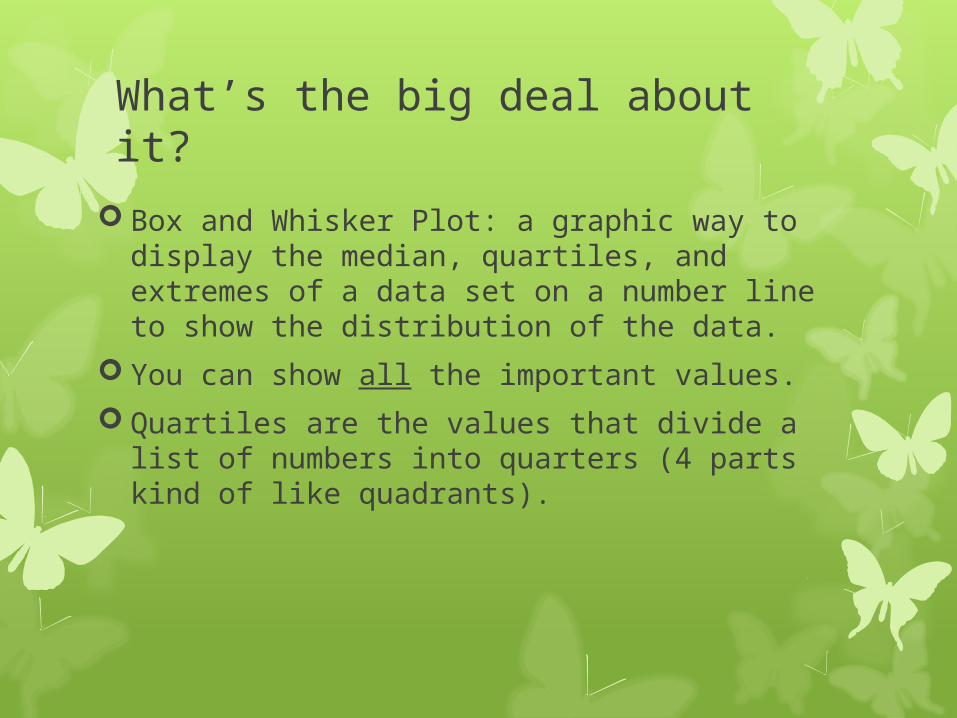
What’s the big deal about it?
Box and Whisker Plot: a graphic way to display the median, quartiles, and extremes of a data set on a number line to show the distribution of the data.
You can show all the important values.
Quartiles are the values that divide a list of numbers into quarters (4 parts kind of like quadrants).
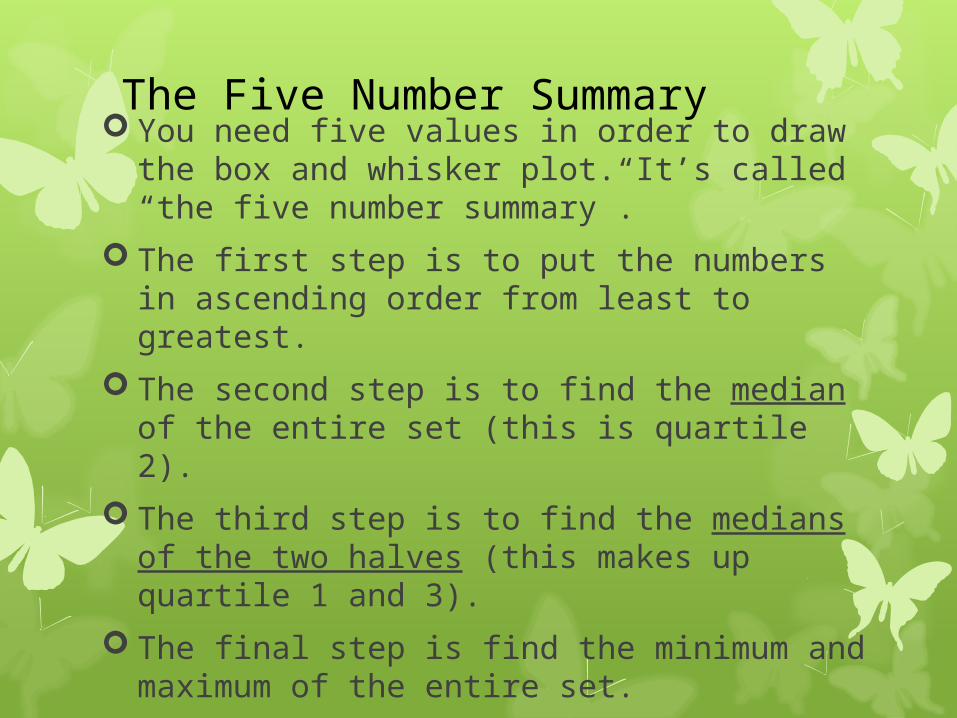
You need five values in order to draw the box and whisker plot. It’s called “the five number summary”.
The first step is to put the numbers in ascending order from least to greatest.
The second step is to find the median of the entire set (this is quartile 2).
The third step is to find the medians of the two halves (this makes up quartile 1 and 3).
The final step is find the minimum and maximum of the entire set.
The Five Number Summary
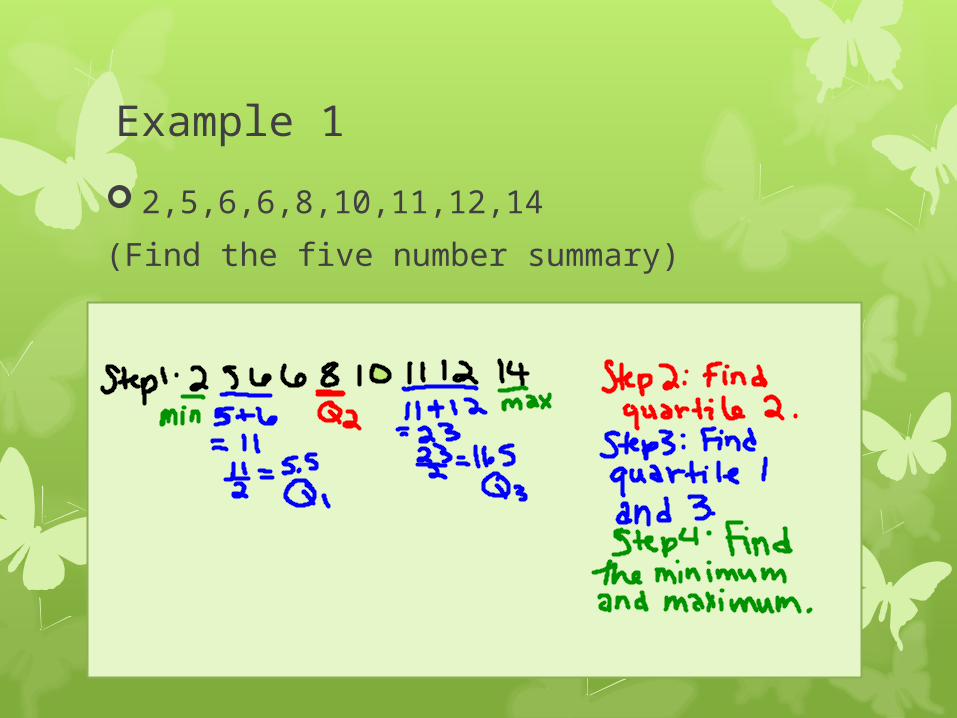
Example 1
2,5,6,6,8,10,11,12,14
(Find the five number summary)
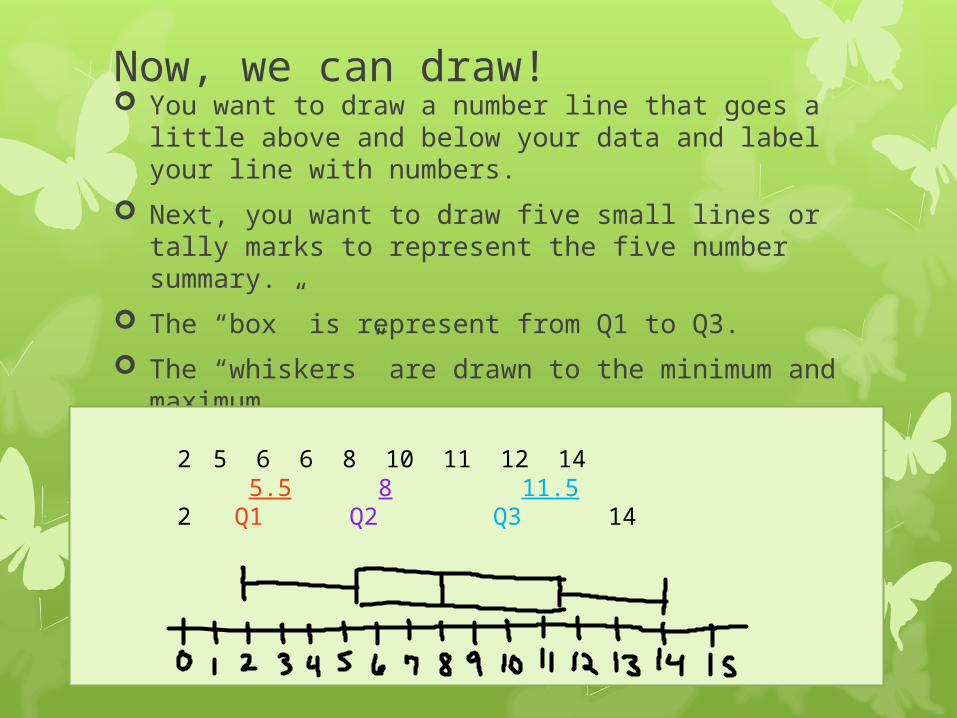
Now, we can draw! You want to draw a number line that goes a little
above and below your data and label your line with numbers.
Next, you want to draw five small lines or tally marks to represent the five number summary.
The “box” is represent from Q1 to Q3.
The “whiskers” are drawn to the minimum and maximum.
2 5 6 6 8 10 11 12 14 5.5 8 11.52 Q1 Q2 Q3 14
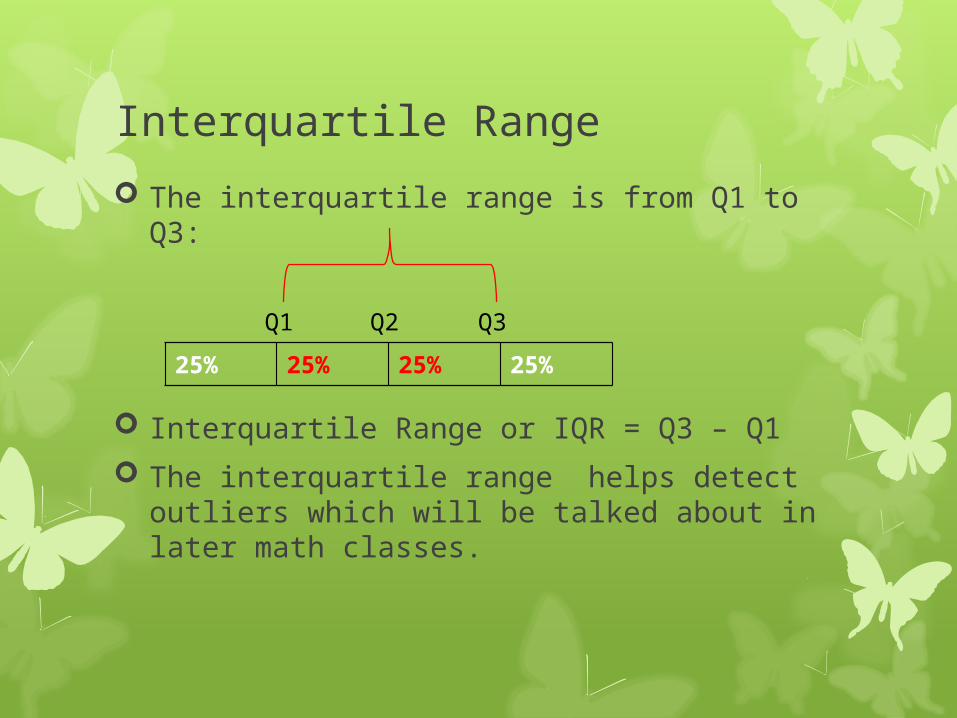
Interquartile Range
The interquartile range is from Q1 to Q3:
Interquartile Range or IQR = Q3 – Q1
The interquartile range helps detect outliers which will be talked about in later math classes.
25% 25% 25% 25%
Q1 Q2 Q3
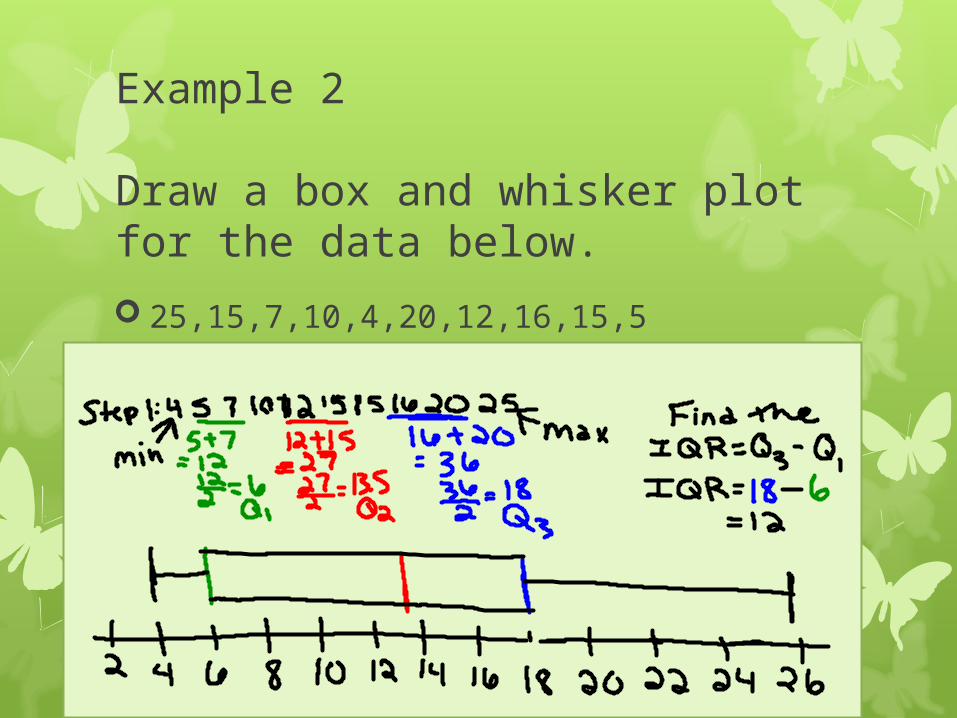
Example 2
Draw a box and whisker plot for the data below.
25,15,7,10,4,20,12,16,15,5
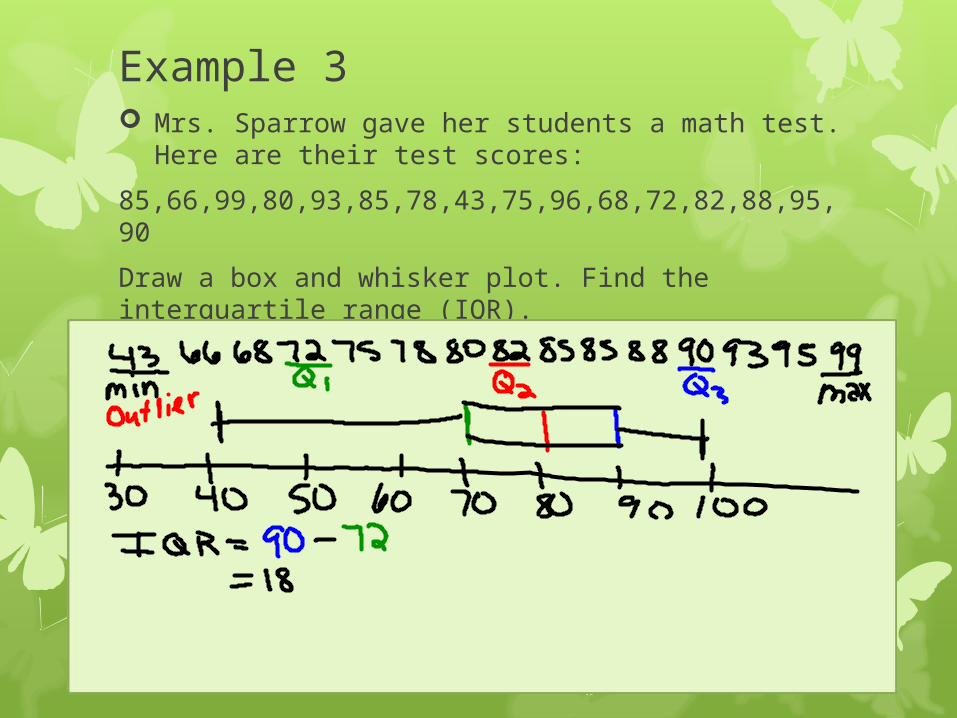
Example 3
Mrs. Sparrow gave her students a math test. Here are their test scores:
85,66,99,80,93,85,78,43,75,96,68,72,82,88,95,90
Draw a box and whisker plot. Find the interquartile range (IQR).
Now it’s your turn to try it on your own.
Homework Problem:
Easter Egg HuntSuppose 15 kids go to a local Easter egg hunt. Here are the number of eggs they found: 10, 16, 8, 12, 5, 30, 13, 14, 27, 7, 15, 12, 17, 9, 10
1. Find the five number summary and IQR of the eggs. 2. Now, the kid, who got 14 treats, noticed some leftover eggs as she was walking back which brings her total up to 19 eggs. Does her new total change any of the five number summary or the interquartile range?