
Unit 7: Trigonometric Functions
55
Unit 7: Trigonometric Functions Graphing the Trigonometric Function
-
Upload
rajah-decker -
Category
Documents
-
view
40 -
download
2
description
Unit 7: Trigonometric Functions. Graphing the Trigonometric Function. E.Q: E.Q 1. What is a radian and how do I use it to determine angle measure on a circle? 2. How do I use trigonometric functions to model periodic behavior?. CCSS: F.IF. 2, 4, 5 &7E; f.tf. 1,2,5 &8. Mathematical Practices:. - PowerPoint PPT Presentation
Transcript of Unit 7: Trigonometric Functions
Unit 7: Trigonometric Functions
Graphing the Trigonometric Function
CCSS: F.IF. 2, 4, 5 &7E; F.TF. 1,2,5 &8
E.Q: E.Q1. What is a radian and how do I use it to
determine angle measure on a circle?2. How do I use trigonometric functions to
model periodic behavior?

Mathematical Practices:
1. Make sense of problems and persevere in solving them. 2. Reason abstractly and quantitatively. 3. Construct viable arguments and critique the reasoning of
others. 4. Model with mathematics. 5. Use appropriate tools strategically. 6. Attend to precision. 7. Look for and make use of structure. 8. Look for and express regularity in repeated reasoning.
Right Triangle Trigonometry
SOH CAH TOA
CHO SHA CAO
Graphing the Trig Function

5
Graphing Trigonometric Functions
Amplitude: the maximum or minimum vertical distance between the graph and the x-axis. Amplitude is always positive

The amplitude of y = a sin x (or y = a cos x) is half the distance between the maximum and minimum values of the function.
amplitude = |a| If |a| > 1, the amplitude stretches the graph vertically.If 0 < |a| > 1, the amplitude shrinks the graph vertically.If a < 0, the graph is reflected in the x-axis.
2
32
4
y
x
4
2
y = – 4 sin xreflection of y = 4 sin x y = 4 sin x
y = sin x
2
1y = sin x
y = 2 sin x

7
Period: the number of degrees or radians we must graph before it begins again.
Graphing Trigonometric Graphing Trigonometric FunctionsFunctions
y
x
2
sin xy period: 2 2sin y
period:
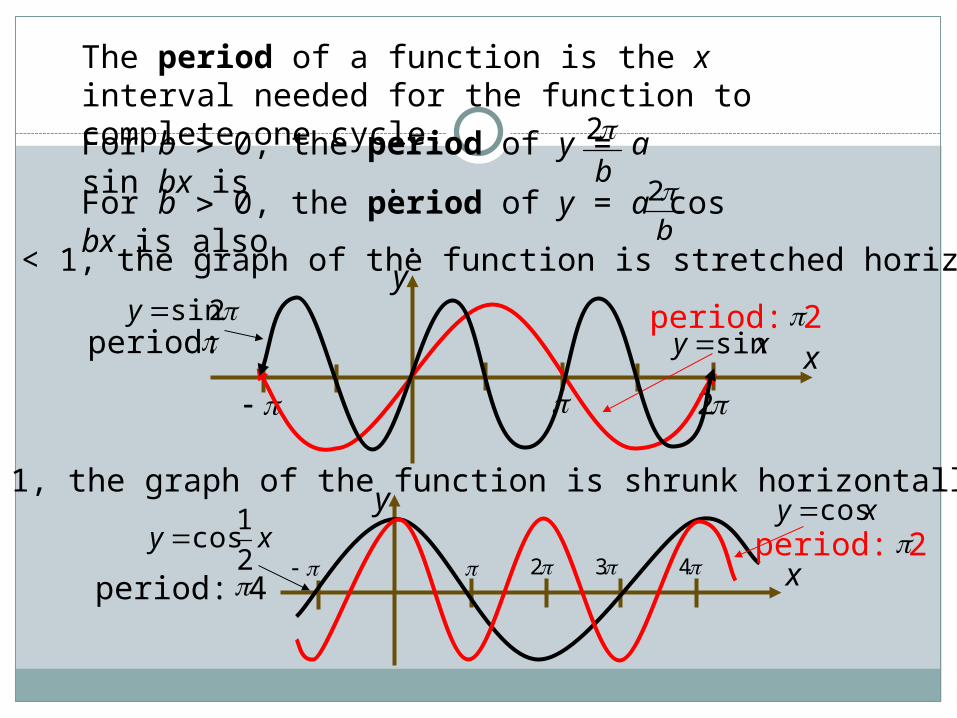
The period of a function is the x interval needed for the function to complete one cycle.
For b 0, the period of y = a sin bx is .b
2
For b 0, the period of y = a cos bx is also .b
2
If 0 < b < 1, the graph of the function is stretched horizontally.
If b > 1, the graph of the function is shrunk horizontally.y
x 2 3 4
cos xy period: 2
2
1cos xy
period: 4

The sine function
θ sin θ
0 0
π/2 1
π 0
3π/2 −1
2π 0
y
x
I I
I I I IV
I
45°
90°
135°
180°
270°
225°
0°
315°
90° 180° 270°0 360°
I II
III IV
sin θ
θ
Imagine a particle on the unit circle, starting at (1,0) and rotating counterclockwise around the origin. Every position of the particle corresponds with an angle, θ, where y = sin θ. As the particle moves through the four quadrants, we get four pieces of the sin graph: I. From 0° to 90° the y-coordinate increases from 0 to 1 II. From 90° to 180° the y-coordinate decreases from 1 to 0 III. From 180° to 270° the y-coordinate decreases from 0 to −1IV. From 270° to 360° the y-coordinate increases from −1 to 0
Interactive Sine Unwrap
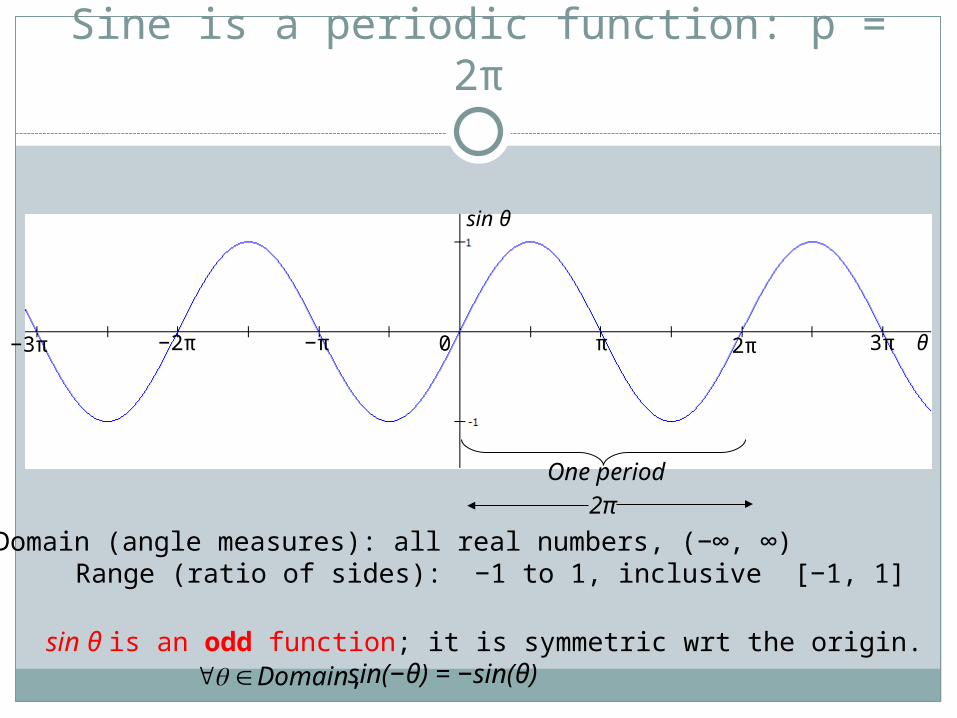
Sine is a periodic function: p = 2π
,Domain
One period
2π
0 3π2ππ−2π −π−3π
sin θ
θ
sin θ: Domain (angle measures): all real numbers, (−∞, ∞) Range (ratio of sides): −1 to 1, inclusive [−1, 1]
sin θ is an odd function; it is symmetric wrt the origin. sin(−θ) = −sin(θ)
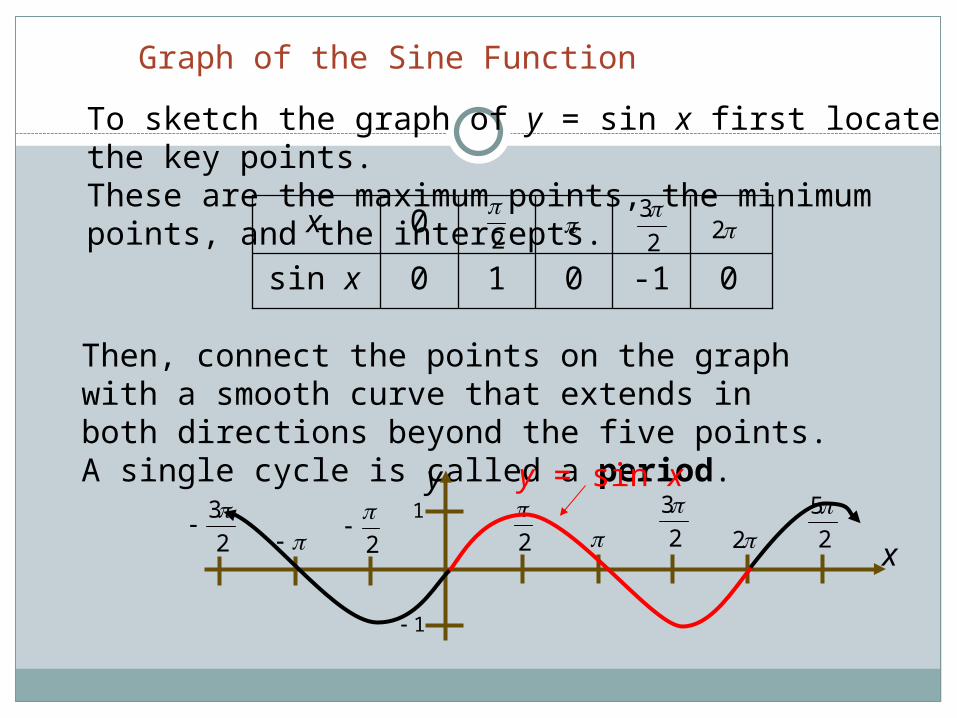
Graph of the Sine Function
To sketch the graph of y = sin x first locate the key points.These are the maximum points, the minimum points, and the intercepts.
0-1010sin x
0x2
2
32
Then, connect the points on the graph with a smooth curve that extends in both directions beyond the five points. A single cycle is called a period.
y
2
3
2
22
32
2
5
1
1
x
y = sin x

The cosine function
θ cos θ
0 1
π/2 0
π −1
3π/2 0
2π 1
y
x
I I
I I I IV
I
45°
90°
135°
180°
270°
225°
0°
315°
90° 180° 270°0 360°
IV
cos θ
θ
III
I
II
Imagine a particle on the unit circle, starting at (1,0) and rotating counterclockwise around the origin. Every position of the particle corresponds with an angle, θ, where x = cos θ. As the particle moves through the four quadrants, we get four pieces of the cos graph: I. From 0° to 90° the x-coordinate decreases from 1 to 0 II. From 90° to 180° the x-coordinate decreases from 0 to −1 III. From 180° to 270° the x-coordinate increases from −1 to 0IV. From 270° to 360° the x-coordinate increases from 0 to 1

Graph of the Cosine Function
To sketch the graph of y = cos x first locate the key points.These are the maximum points, the minimum points, and the intercepts.
10-101cos x
0x2
2
32
Then, connect the points on the graph with a smooth curve that extends in both directions beyond the five points. A single cycle is called a period.
y
2
3
2
22
32
2
5
1
1
x
y = cos x

Cosine is a periodic function: p = 2π
One period2π
π 3π−2π 2π−π−3π 0θ
cos θ
cos θ: Domain (angle measures): all real numbers, (−∞, ∞) Range (ratio of sides): −1 to 1, inclusive [−1, 1]
cos θ is an even function; it is symmetric wrt the y-axis. cos(−θ) = cos(θ) ,Domain
15
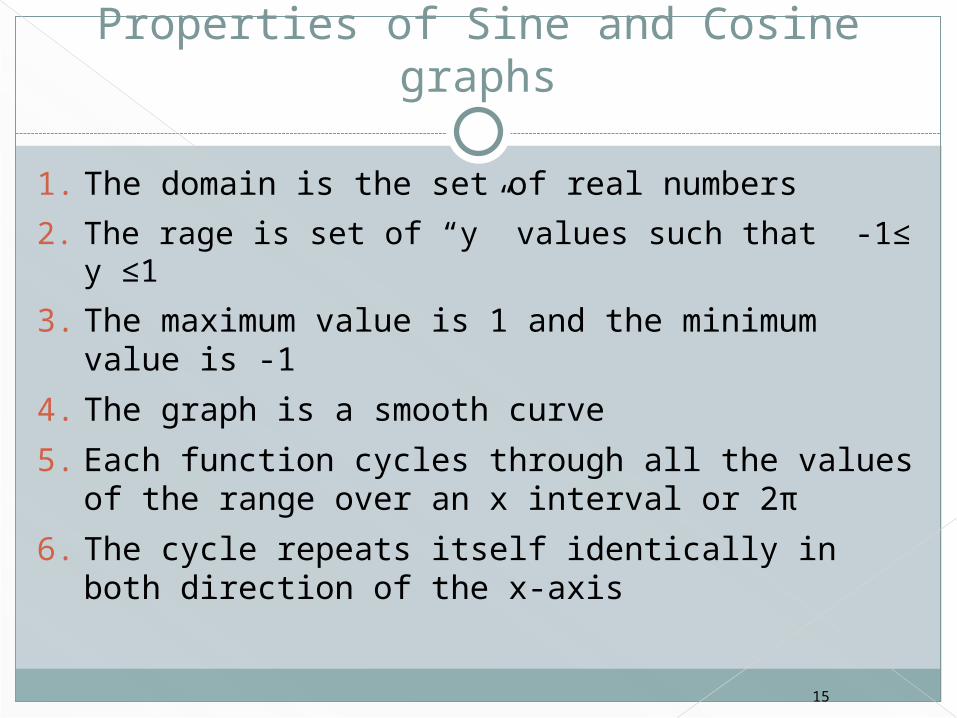
Properties of Sine and Cosine graphs
1. The domain is the set of real numbers
2. The rage is set of “y” values such that -1≤ y ≤1
3. The maximum value is 1 and the minimum value is -1
4. The graph is a smooth curve
5. Each function cycles through all the values of the range over an x interval or 2π
6. The cycle repeats itself identically in both direction of the x-axis

Sine Graph
Given : A sin Bx Amplitude = IAIperiod = 2π/B
Example: y=5sin2X
› Amp=5
› Period=2π/2 = π
ππ/2π/4 3π/4
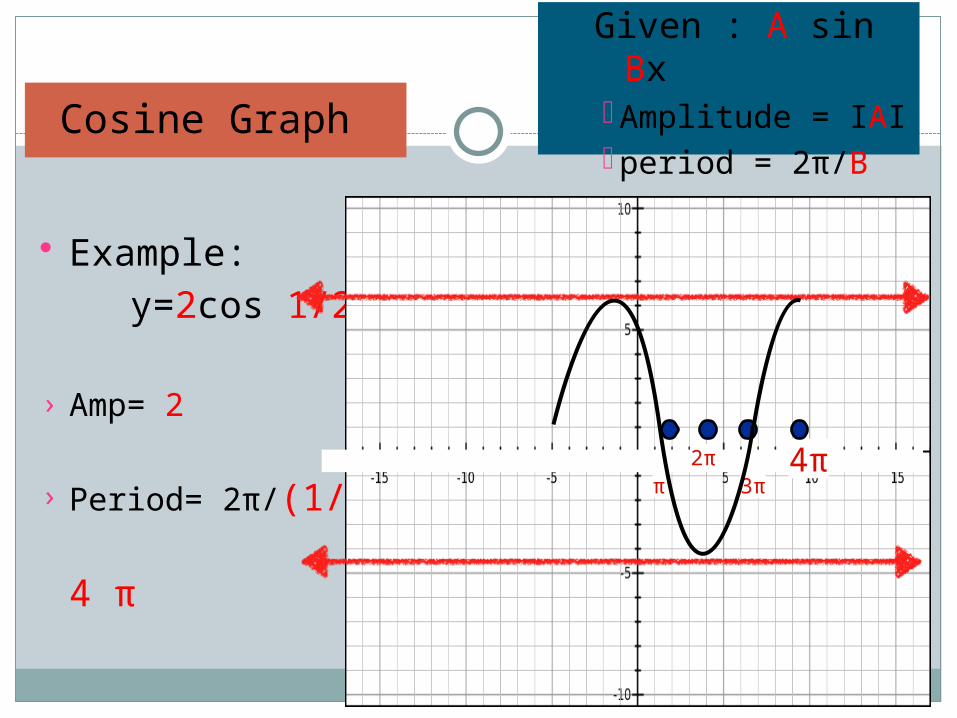
Example: y=2cos 1/2 X
› Amp= 2
› Period= 2π/(1/2) 4 π
Cosine Graph
Given : A sin Bx Amplitude = IAIperiod = 2π/B
4π2ππ 3π
y
1
123
2
x 32 4
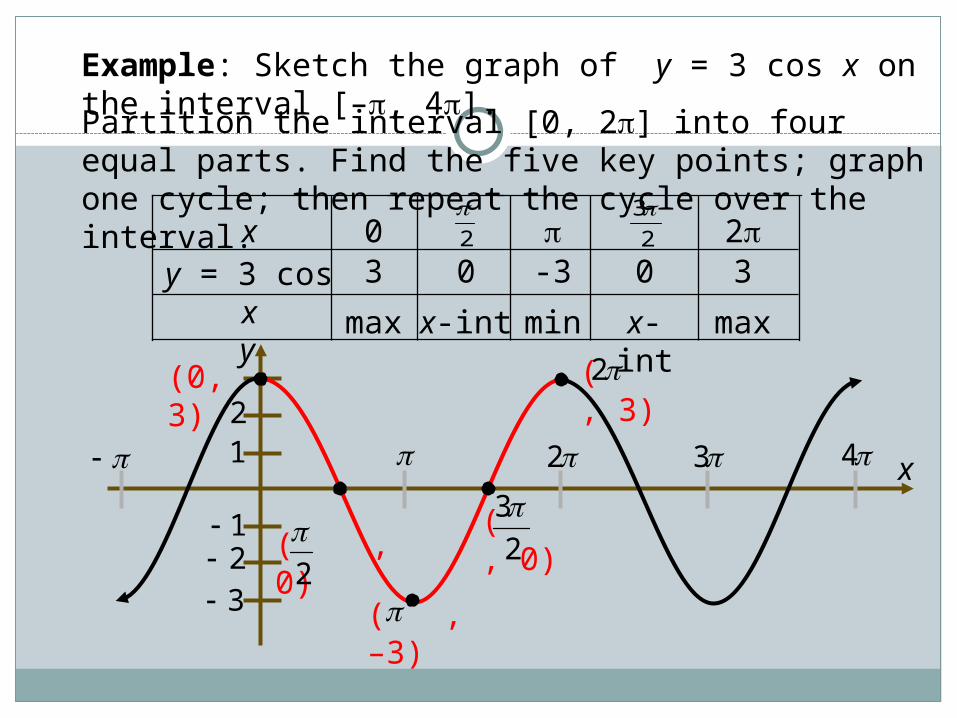
Example: Sketch the graph of y = 3 cos x on the interval [–, 4].
Partition the interval [0, 2] into four equal parts. Find the five key points; graph one cycle; then repeat the cycle over the interval.
maxx-intminx-intmax
30-303y = 3 cos x20x 2
2
3
(0, 3)
2
3( , 0)( , 0)
2
2( , 3)
( , –3)
y
x2
y = cos (–x)
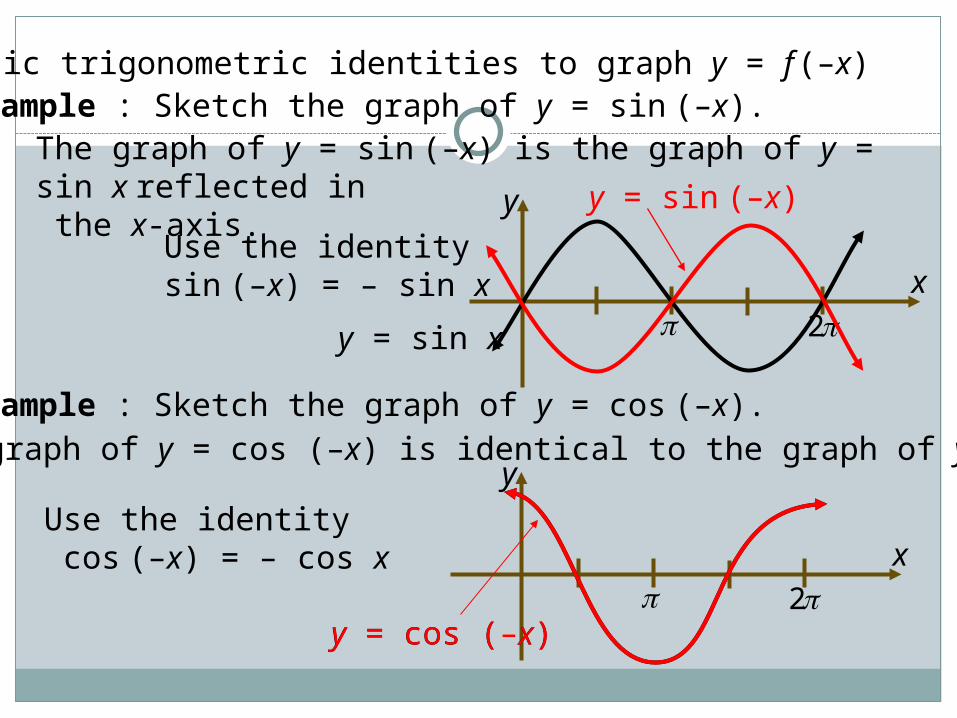
Use basic trigonometric identities to graph y = f (–x)Example : Sketch the graph of y = sin (–x).
Use the identity sin (–x) = – sin x
The graph of y = sin (–x) is the graph of y = sin x reflected in the x-axis.
Example : Sketch the graph of y = cos (–x).
Use the identity cos (–x) = – cos x
The graph of y = cos (–x) is identical to the graph of y = cos x.
y
x2y = sin x
y = sin (–x)
y = cos (–x)

2
y
2
6
x2
6
53
3
26
6
3
2
3
2
020–20y = –2 sin 3x
0x
Example: Sketch the graph of y = 2 sin (–3x).
Rewrite the function in the form y = a sin bx with b > 0
amplitude: |a| = |–2| = 2
Calculate the five key points.
(0, 0) ( , 0)3
( , 2)2
( , -2)6
( , 0)
3
2
Use the identity sin (– x) = – sin x: y = 2 sin (–3x) = –2 sin 3x
period:b
2 23
=
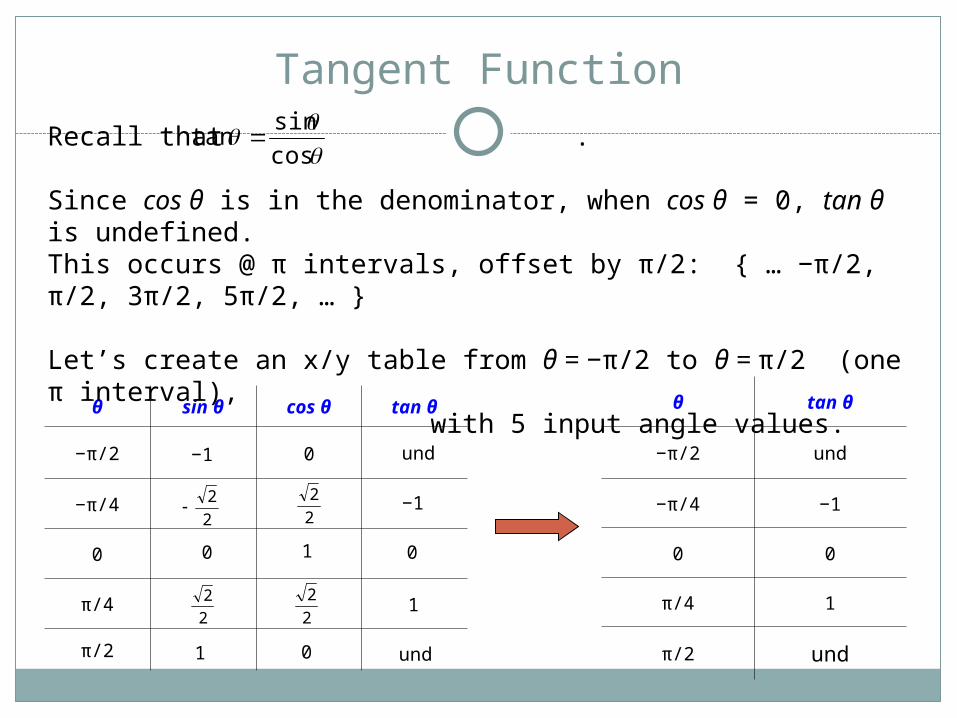
Tangent Function
θ sin θ cos θ tan θ
−π/2
−π/4
0
π/4
π/2
θ tan θ
−π/2 und
−π/4 −1
0 0
π/4 1
π/2 und
Recall that .
Since cos θ is in the denominator, when cos θ = 0, tan θ is undefined. This occurs @ π intervals, offset by π/2: { … −π/2, π/2, 3π/2, 5π/2, … }
Let’s create an x/y table from θ = −π/2 to θ = π/2 (one π interval), with 5 input angle values.
cossin
tan
22
22
22
22
1
1
1
−1
−1
0
0 0
und
und
0

Graph of Tangent Function: Periodic
θ tan θ
−π/2Und (-∞)
−π/4 −1
0 0
π/4 1
π/2 Und(∞)
,Domaintan θ is an odd function; it is symmetric wrt the origin. tan(−θ) = −tan(θ)
0 θ
tan θ
−π/2 π/2
One period: π
tan θ: Domain (angle measures): θ ≠ π/2 + πn Range (ratio of sides): all real numbers (−∞, ∞)
3π/2−3π/2
Vertical asymptotes where cos θ = 0
cossin
tan
y
x
2
3
2
32
2
Tangent Function
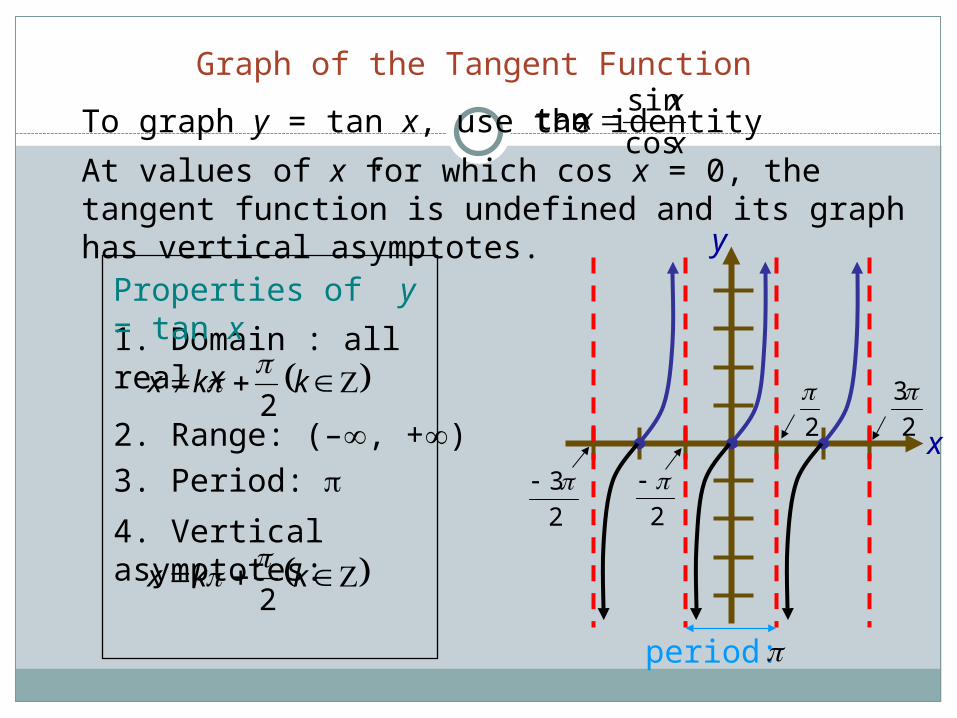
Graph of the Tangent Function
2. Range: (–, +)
3. Period:
4. Vertical asymptotes: kkx
2
1. Domain : all real x kkx
2
Properties of y = tan x
period:
To graph y = tan x, use the identity .x
xx
cos
sintan
At values of x for which cos x = 0, the tangent function is undefined and its graph has vertical asymptotes.
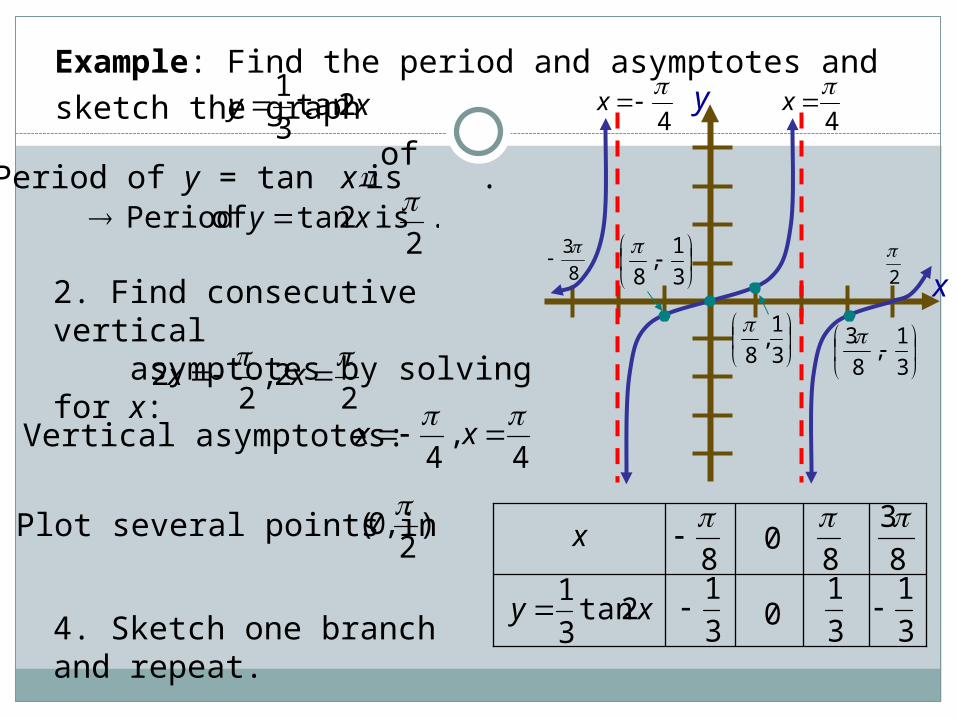
2. Find consecutive vertical asymptotes by solving for x:
4. Sketch one branch and repeat.
Example: Find the period and asymptotes and sketch the graph
of xy 2tan3
1
22 ,
22
xx
4 ,
4
xxVertical asymptotes:
)2
,0(
3. Plot several points in 1. Period of y = tan x is .
2
. is 2tan of Period xy
x
xy 2tan3
1
8
3
1 0
08
3
18
3
3
1
y
x2
8
3
4
x
4
x
3
1,
8
3
1,
8
3
1,
8
3
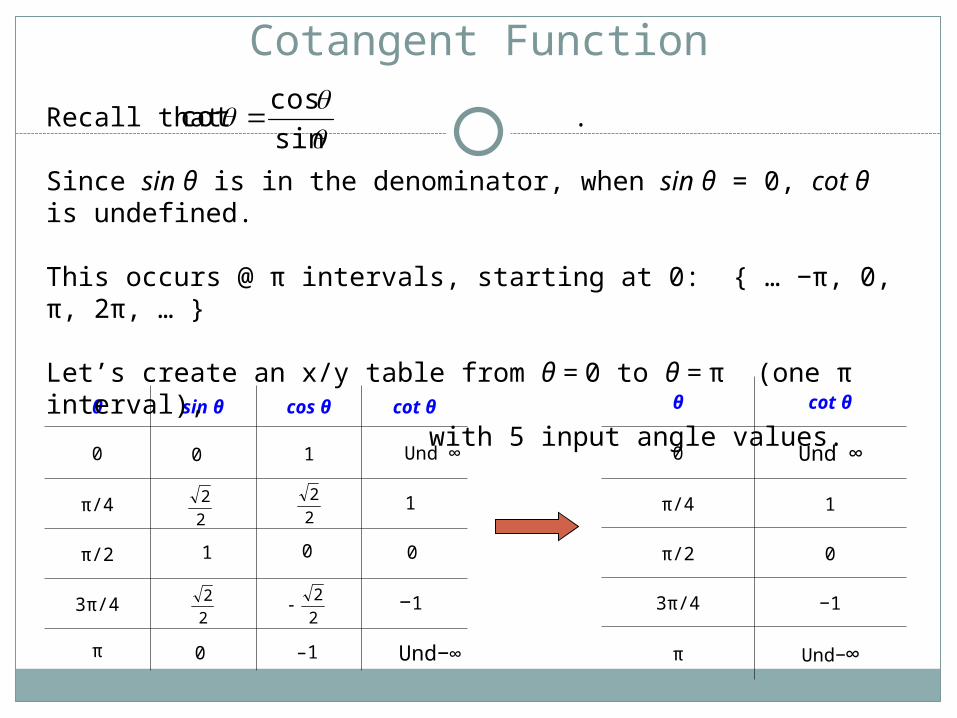
Cotangent Function
θ sin θ cos θ cot θ
0
π/4
π/2
3π/4
π
θ cot θ
0 Und ∞
π/4 1
π/2 0
3π/4 −1
π Und−∞
Recall that .
Since sin θ is in the denominator, when sin θ = 0, cot θ is undefined.
This occurs @ π intervals, starting at 0: { … −π, 0, π, 2π, … }
Let’s create an x/y table from θ = 0 to θ = π (one π interval), with 5 input angle values.
sin
coscot
22
2
2
22
2
2
0
−1
0
0
1
1
1 0
Und−∞
Und ∞
–1

Graph of Cotangent Function: Periodic
θ cot θ
0 ∞
π/4 1
π/2 0
3π/4 −1
π −∞
,Domaincot θ is an odd function; it is symmetric wrt the origin. tan(−θ) = −tan(θ)
cot θ: Domain (angle measures): θ ≠ πn Range (ratio of sides): all real numbers (−∞, ∞)
3π/2−3π/2
Vertical asymptotes where sin θ = 0
sin
coscot
π-π −π/2 π/2
cot θ

Graph of the Cotangent Function
2. Range: (–, +)
3. Period: 4. Vertical asymptotes:
kkx
1. Domain : all real x kkx
Properties of y = cot x
y
x
2
2
2
32
3
2
xy cot
0xvertical asymptotes xx 2x
To graph y = cot x, use the identity .x
xx
sin
coscot
At values of x for which sin x = 0, the cotangent function is undefined and its graph has vertical asymptotes.
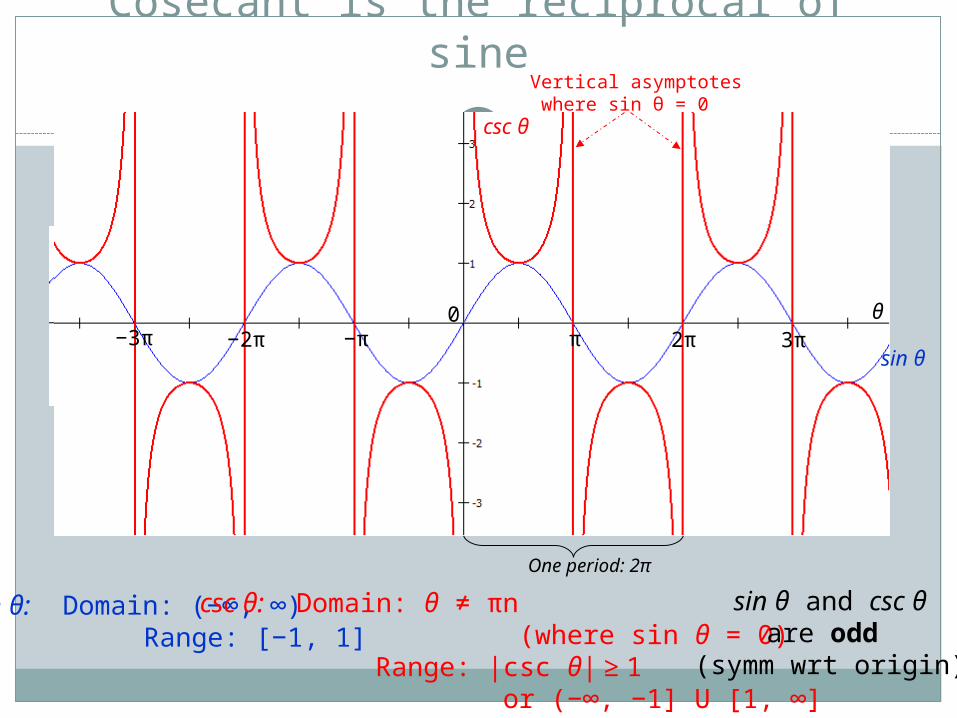
Cosecant is the reciprocal of sine
sin θ: Domain: (−∞, ∞) Range: [−1, 1]
csc θ: Domain: θ ≠ πn (where sin θ = 0) Range: |csc θ| ≥ 1 or (−∞, −1] U [1, ∞]
sin θ and csc θare odd
(symm wrt origin)
One period: 2π
π 2π 3π0
−π−2π−3π
Vertical asymptotes where sin θ = 0
θ
csc θ
sin θ

2
3
x
2
2
2
2
5
y
4
4
Graph of the Cosecant Function
2. range: (–,–1] [1, +) 3. period:
where sine is zero.
4. vertical asymptotes: kkx
1. domain : all real x kkx
sin
1csc
xx To graph y = csc x, use the identity .
Properties of y = csc x xy csc
xy sin
At values of x for which sin x = 0, the cosecant function
is undefined and its graph has vertical asymptotes.

Secant is the reciprocal of cosine
cos θ: Domain: (−∞, ∞) Range: [−1, 1]
One period: 2π
π 3π−2π 2π−π−3π 0θ
sec θ
cos θ
Vertical asymptotes where cos θ = 0
sec θ: Domain: θ ≠ π/2 + πn (where cos θ = 0) Range: |sec θ | ≥ 1 or (−∞, −1] U [1, ∞]
cos θ and sec θare even
(symm wrt y-axis)
2
3
y
x
2
2
2 3
2
5
4
4
xy cos
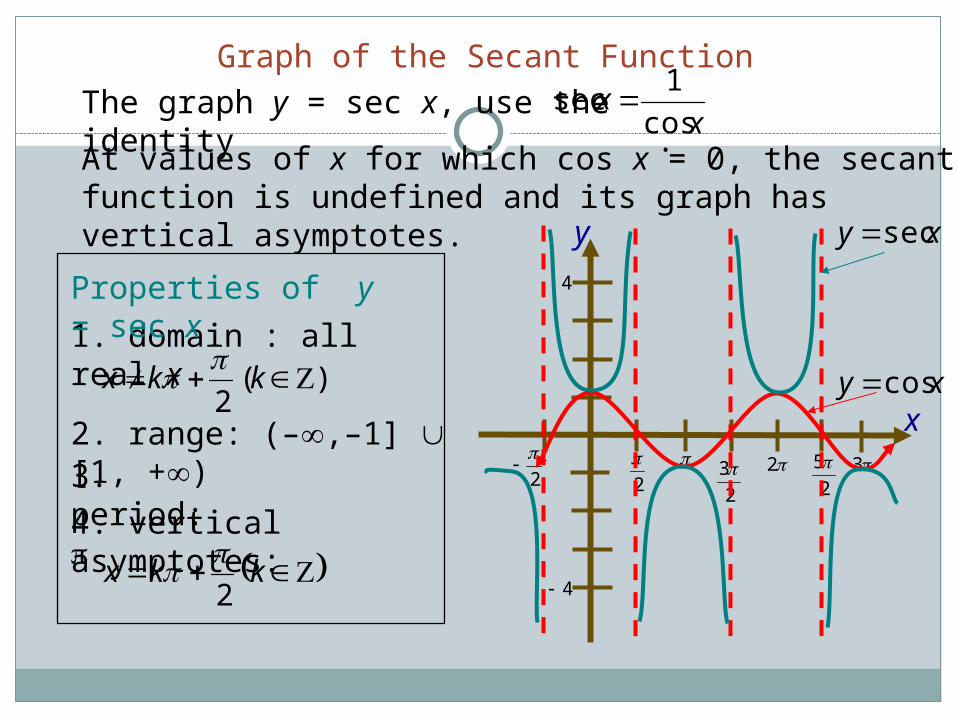
Graph of the Secant Function
2. range: (–,–1] [1, +) 3. period: 4. vertical asymptotes:
kkx 2
1. domain : all real x)(
2 kkx
cos
1sec
xx The graph y = sec x, use the identity .
Properties of y = sec x
xy sec
At values of x for which cos x = 0, the secant function is undefined and its graph has vertical asymptotes.

Summary of Graph Characteristics
Def’n
∆ о Period Domain Range Even/Odd
sin θ
csc θ
cos θ
sec θ
tan θ
cot θ
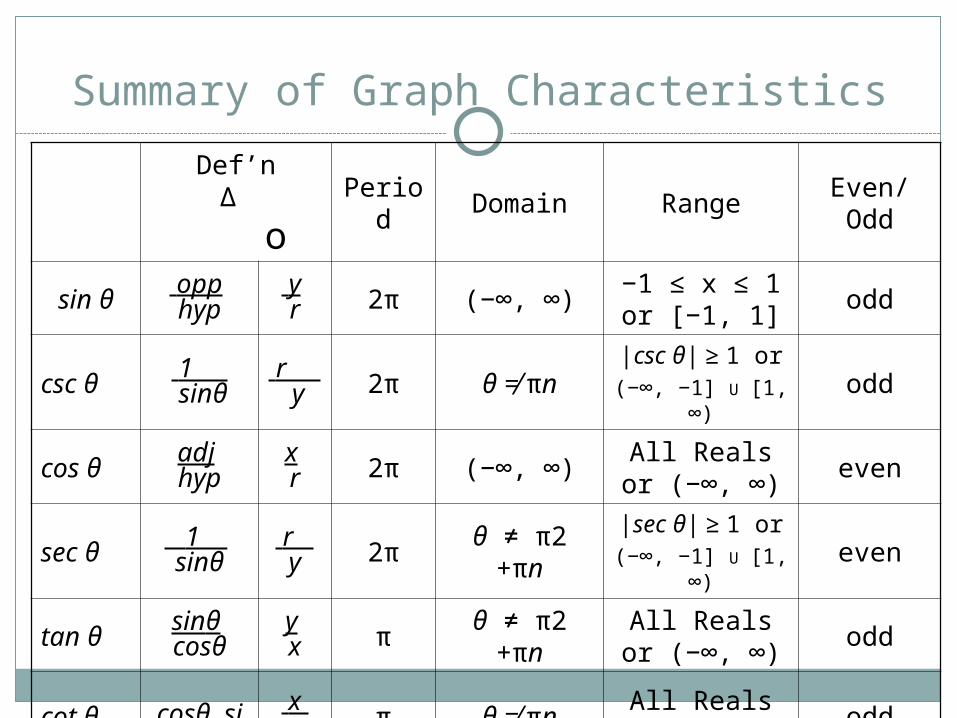
Summary of Graph Characteristics
Def’n
∆ о Period Domain Range Even/Odd
sin θ opp hyp
y r 2π (−∞, ∞)
−1 ≤ x ≤ 1 or [−1, 1]
odd
csc θ 1 .sinθ
r .y 2π θ ≠ πn
|csc θ| ≥ 1 or(−∞, −1] U [1, ∞)
odd
cos θadj hyp
x r 2π (−∞, ∞)
All Reals or (−∞, ∞)
even
sec θ 1 . sinθ
r y 2π θ ≠ π2 +πn
|sec θ| ≥ 1 or(−∞, −1] U [1, ∞)
even
tan θsinθ cosθ
y x π θ ≠ π2 +πn
All Reals or (−∞, ∞)
odd
cot θ
cosθ .sinθ
x y π θ ≠ πn
All Reals or (−∞, ∞)
odd

•Without looking at your notes, try to sketch the basic shape of each trig function:
1) Sine:
2) Cosine:
3) Tangent:
14. 2: Translations of Trigonometric Graphs

More Transformations
We have seen two types of transformations on trig graphs: vertical stretches and horizontal stretches.
There are three more: vertical translations (slides), horizontal translations, and reflections (flips).

More TransformationsHere is the full general form for the sine function:
Just as with parabolas and other functions, h and k are translations: h slides the graph horizontally (opposite of sign) k slides the graph verticallyAlso, if a is negative, the graph is flipped vertically.
hxbaky sin
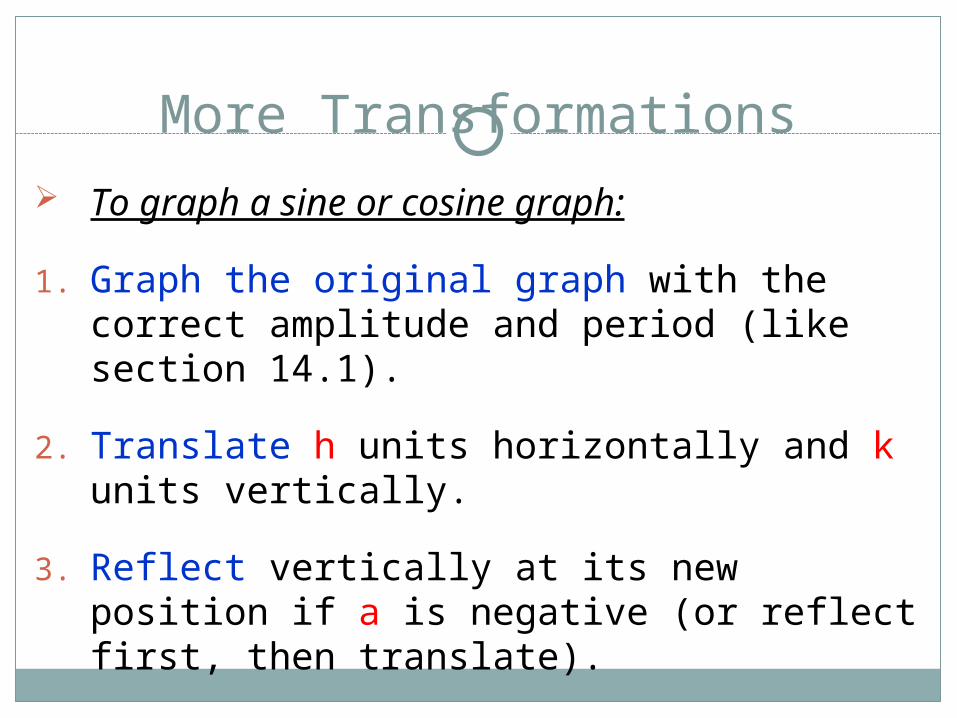
More Transformations To graph a sine or cosine graph:
1. Graph the original graph with the correct amplitude and period (like section 14.1).
2. Translate h units horizontally and k units vertically.
3. Reflect vertically at its new position if a is negative (or reflect first, then translate).

Examples Describe how each graph would be
transformed:
1.
2.
3.
xy sin2
)sin(2 xy
2cos
xy
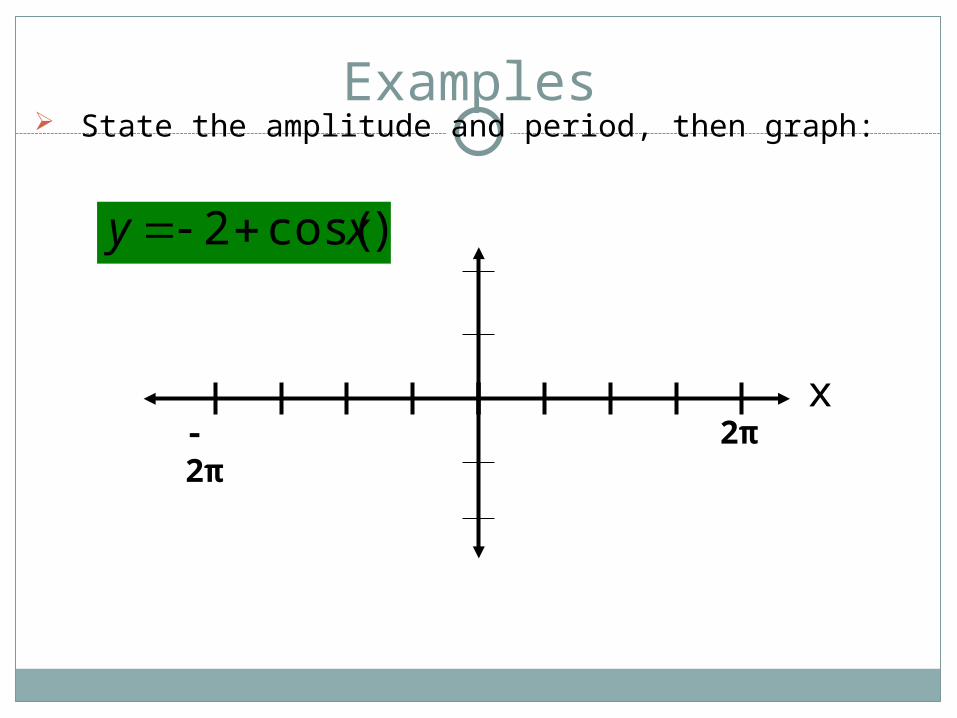
Examples State the amplitude and period, then graph:
)cos(2 xy
x2π-2π
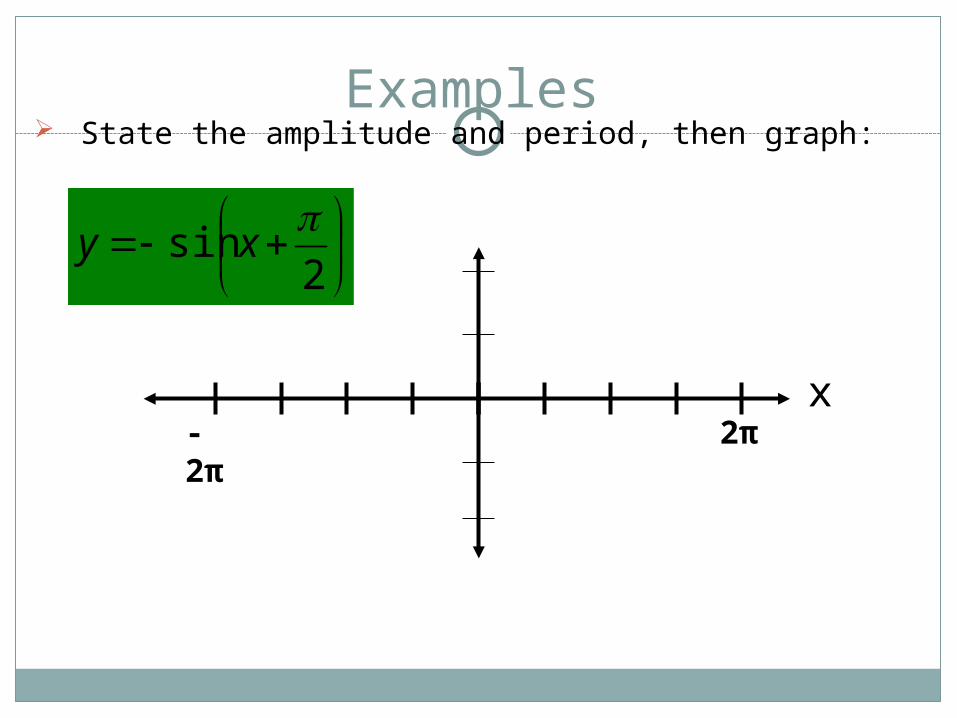
Examples State the amplitude and period, then graph:
2sin
xy
x2π-2π
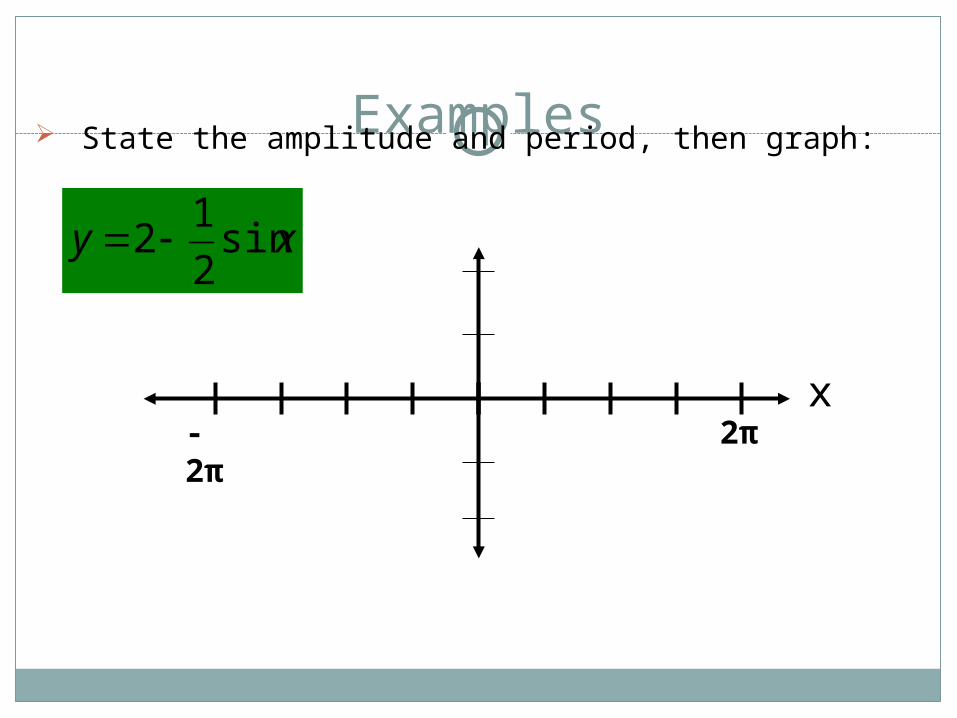
Examples State the amplitude and period, then graph:
xy sin2
12
x2π-2π
Examples
Write an equation of the graph described:
The graph of y = cos x translated up 3
units, right π units, and reflected vertically.
14.3: trigonometric Identities
Reciprocal IdentitiesQuotient IdentitiesPythagorean IdentitiesOpposite Angles Identity

Some Vocab
1. Identity: a statement of equality between two expressions that is true for all values of the variable(s)
2. Trigonometric Identity: an identity involving trig expressions
3. Counterexample: an example that shows an equation is false.
Prove that sin(x)tan(x) = cos(x) is not a trig identity by producing a
counterexample.
You can do this by picking almost any angle measure.
Use ones that you know exact values for: 0, π/6, π/4, π/3, π/2, and π
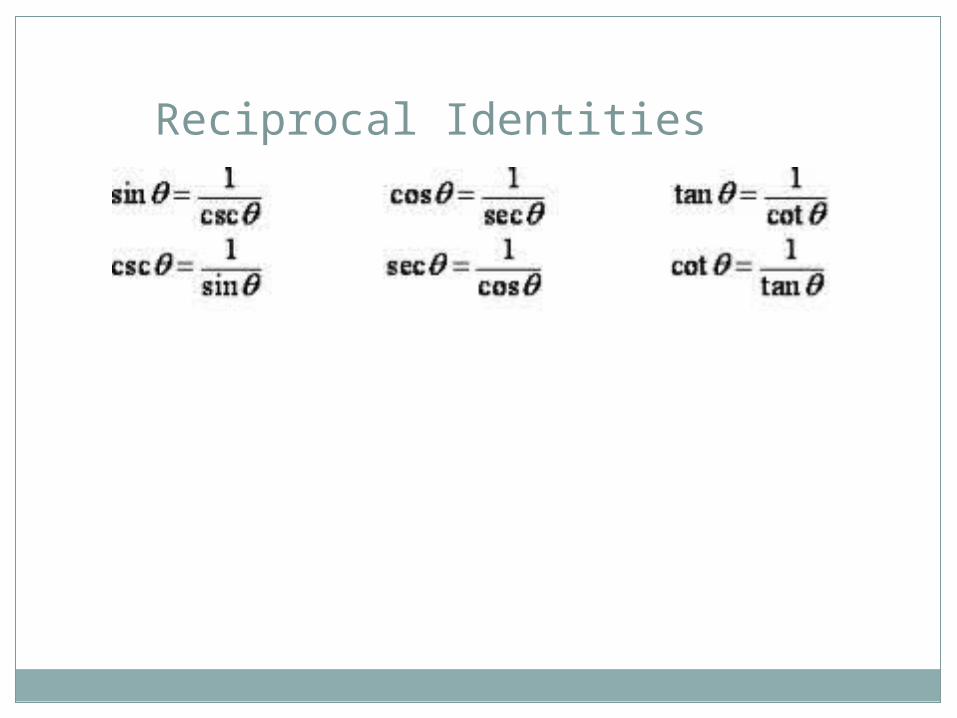
Reciprocal Identities
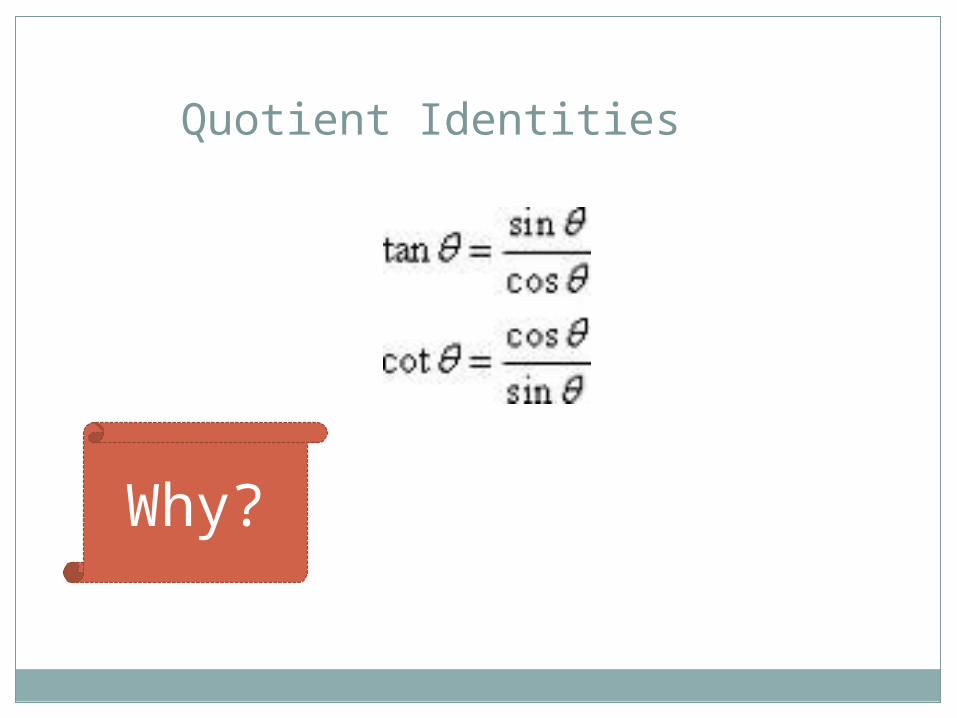
Quotient Identities
Why?

Do you remember the Unit Circle?
What is the equation for the unit circle?
x2 + y2 = 1
• What does x = ? What does y = ? (in terms of trig
functions)sin2θ + cos2θ = 1
Pythagorean Identity!

Take the Pythagorean Identity and discover a new one!
Hint: Try dividing everything by cos2θ
sin2θ + cos2θ = 1 .cos2θ cos2θ cos2θ tan2θ + 1 = sec2θ
Quotient
Identity
Reciprocal
Identityanother
Pythagorean Identity
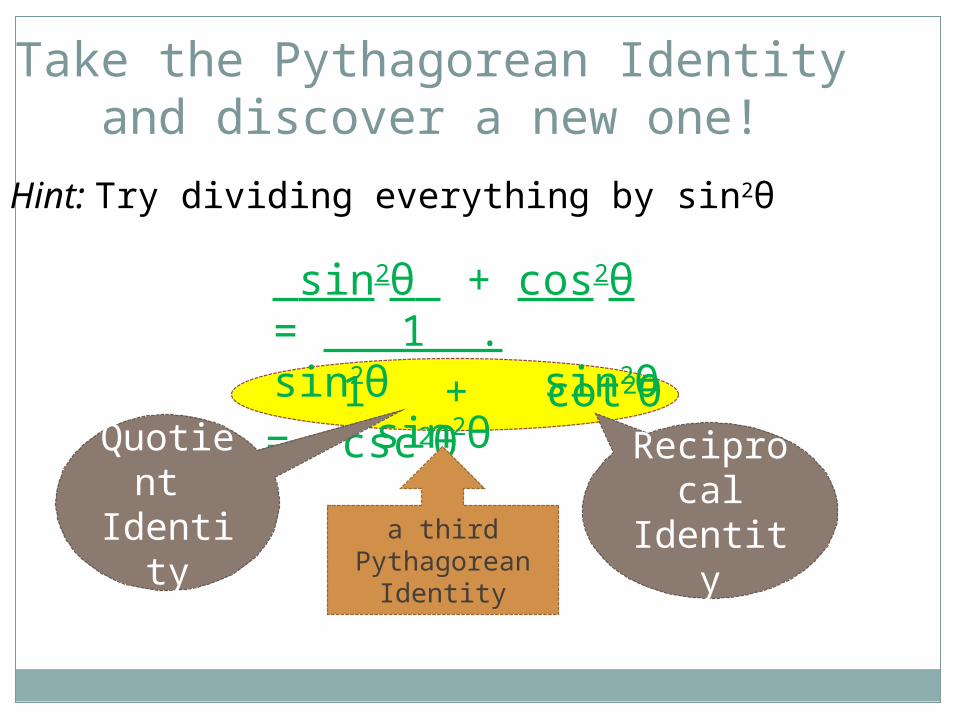
Take the Pythagorean Identity and discover a new one!
Hint: Try dividing everything by sin2θ
sin2θ + cos2θ = 1 .sin2θ sin2θ sin2θ 1 + cot2θ = csc2θ
Quotient
Identity
Reciprocal
Identitya third
Pythagorean Identity

Opposite Angle Identitiessometimes these are called even/odd identities

Simplify each expression.
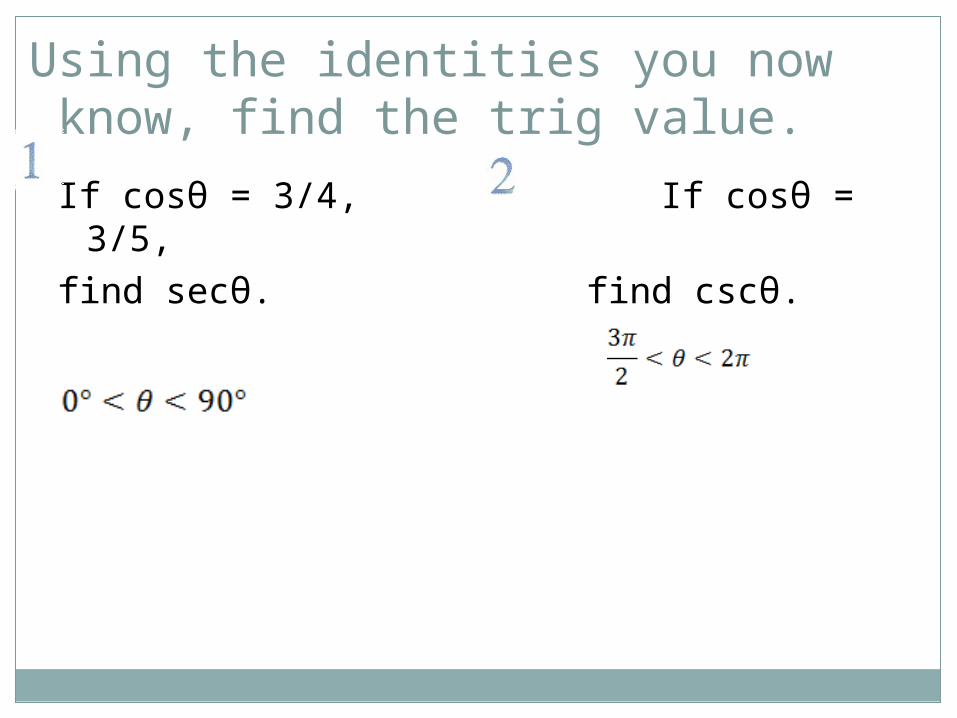
Using the identities you now know, find the trig value.
If cosθ = 3/4, If cosθ = 3/5, find secθ. find cscθ.
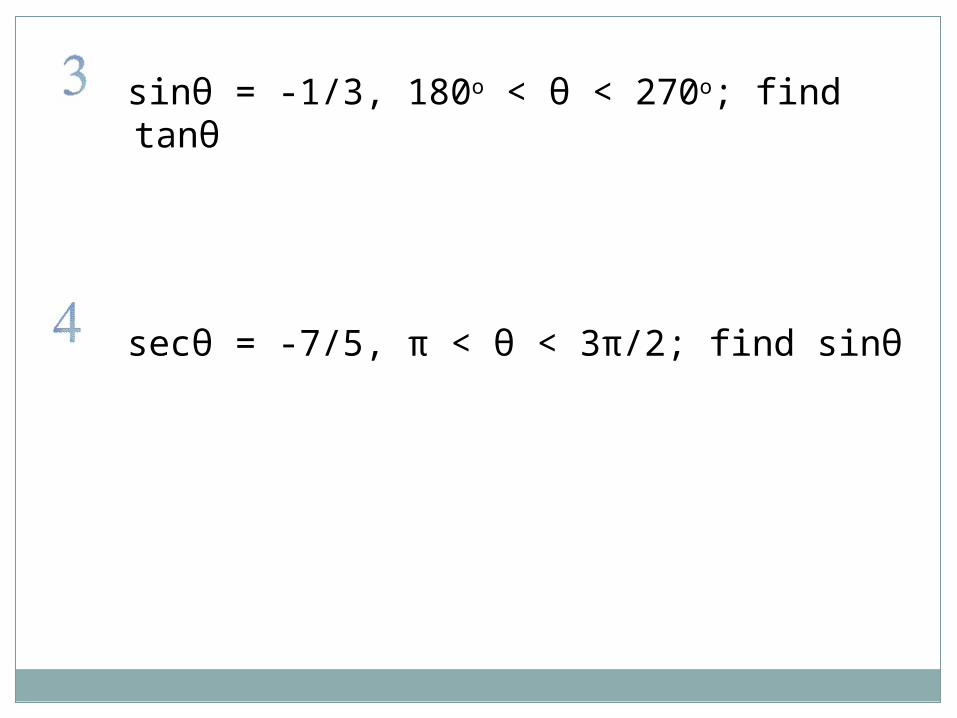
sinθ = -1/3, 180o < θ < 270o; find tanθ
secθ = -7/5, π < θ < 3π/2; find sinθ
– Similarities and Differences
a) How do you find the amplitude and period for sine and cosine functions?
b) How do you find the amplitude, period and asymptotes for tangent?
c) What process do you follow to graph any of the trigonometric functions?


