
Unit 5 Measuring and Monitoring Economic...
60
348 Measuring the Economy Millions of workers and businesses participate in the U.S. economy. Measuring the country’s economy requires special economic tools. Unit 5 Measuring and Monitoring Economic Performance Macroeconomics
Transcript of Unit 5 Measuring and Monitoring Economic...

348
Measuring the EconomyMillions of workers and businesses participate in the U.S. economy. Measuring the country’s economy requires special economic tools.
Unit 5Measuring and Monitoring Economic Performance
Macroeconomics

CONCEPT REVIEW
Macroeconomics is the study of the economy as a whole and howmajor sectors of the economy interact.
CHAPTER 12 KEY CONCEPT
National income accounting uses statistical measures of income,spending, and output to help people understand what is happeningto a country’s economy.
WHY THE CONCEPT MATTERS
Your economic decisions—combined with those of millions ofother people—determine the fate of the nation’s economy. Can youafford to buy a new car? Is now a good time to change jobs? Shouldyou take a risk in the stock market or keep your money safe in thebank? Understanding what is happening to the country’s economywill help you make better economic decisions.
CHAPTER
How has free enterprise transformedPoland’s economy? See the Case Studyon pages 376–377.
349Economic Indicators and Measurements
12
More at ClassZone.com
Economic Indicatorsand Measurements
SECTION 1Gross Domestic
Product andOther Indicators
SECTION 2Business Cycles
SECTION 3StimulatingEconomicGrowth
CASE STUDYPoland: Economic
Freedom andEconomicGrowth
Go to ECONOMICS UPDATE forchapter updates and current newson the economy of Poland. (SeeCase Study, pp. 376–377.)
Go to ANIMATED ECONOMICS forinteractive lessons on the graphsand tables in this chapter.
Go to INTERACTIVE REVIEW forconcept review and activities.

1SECT ION
350 Chapter 12
OBJECT IVES KEY TERMS TAKING NOTES
As you read Section 1, complete ahierarchy chart like the one belowto record what you learn aboutnational income accounting.Use the Graphic Organizer atInteractive Review @ ClassZone.com
In Section 1, you will
• define GDP and describe howit is measured
• explain how GDP has certainlimitations
• identify other national incomeaccounting measures
national income accounting, p. 350gross domestic product (GDP), p. 350nominal GDP, p. 352real GDP, p. 352nonmarket activities, p. 354underground economy, p. 354gross national product (GNP), p. 355net national product (NNP), p. 355national income (NI), p. 355personal income (PI), p. 355disposable personal income (DPI), p. 355
What Is GDP?
KEY CONCEPTS
As you have read, microeconomics and macroeconomics look at the economythrough different lenses. While microeconomics examines the actions of individualsand single markets, macroeconomics examines the economy as a whole. Macroecon-omists analyze the economy using national income accounting, statistical measuresthat track the income, spending, and output of a nation. The most important ofthose measures is gross domestic product (GDP), the market value of all final goodsand services produced within a nation in a given time period.
The Components of GDP
To be included in GDP, a good or service hasto fulfill three requirements. First, it has to befinal rather than intermediate. For example,the fabric used to make a shirt is an inter-mediate good; the shirt itself is a final good.Second, the good or service must be producedduring the time period, regardless of when it issold. For example, cars made this year but soldnext year would be counted in this year’s GDP.Finally, the good or service must be producedwithin the nation’s borders. Products made inforeign countries by U.S. companies are notincluded in the U.S. GDP.
Gross Domestic Product andOther Indicators
National incomeaccounting is a wayof evaluating a country’seconomy using statisticalmeasures of its income,spending, and output.
Gross domesticproduct (GDP) isthe market value of allfinal goods and servicesproduced within a nationin a given time period.
QUICK REFERENCE
Products Included in GDPCars made in the United States are an exampleof goods counted toward U.S. gross domesticproduct (GDP).
National IncomeAccounting
GDP

0
1
1
2
2
3
4
5
6
7
8
9
10
Key:
Consumption (C)
Investment (I)
Net Exports (X)
GovernmentSpending (G)
Source: U.S. Bureau of Economic Analysis, 2005 data
Gro
ss D
om
esti
c Pr
od
uct
(in
tri
llio
ns
of
do
llars
)
C I G
X
FIGURE 12.1 COMPONENTS OF U.S. GROSS DOMESTIC PRODUCT
Find an update on the U.S.GDP at ClassZone.com
351Economic Indicators and MeasurementsEconomic Indicators and Measurements
Calculating GDP
Although there are several different ways to calculate GDP, economists often use theexpenditures approach. With this method, they group national spending on final goodsand services according to the four sectors of the economy: spending by households, orconsumption; spending by businesses, or investment; government spending; and totalexports minus total imports, or net exports. Economists identify consumption withthe letter C; investment with the letter I; government spending with the letter G; andnet exports with the letter X. To calculate GDP, economists add the expenditures fromall sectors together: C+I+G+X=GDP.
Consumption includes all spending by households on durable goods, nondurablegoods, and services. You drive to the movies in a durable good (an item that doesnot wear out quickly). You purchase a service when you pay for the movie (since youare not buying to own something). And you obtain a nondurable good (a good thatis used up relatively soon after purchase) when you buy popcorn.
Investment, which measures what businesses spend, has two categories. One is fixedinvestment, which includes new construction and purchases of such capital goods asequipment, machinery, and tools. The other is inventory investment. This category,also called unconsumed output, is made up of the unsold goods that businesses keepon hand.
Government spending includes all the expenditures of federal, state, and local gov-ernments on goods and services. Examples include spending for defense, highways,
ANALYZE GRAPHS1. In 2005, net exports was a negative number. What does this say about
the relative amounts of exports and imports?
2. Did households, businesses, or the government contribute the most toU.S. GDP in 2005?

2
4
6
8
10
12
14
1955 1965 1975 1985 1995 20051960 1970 1980 1990 2000
Year
Gro
ss D
om
esti
c Pr
od
uct
(in
tri
llio
ns
of
do
llars
)
FIGURE 12.2 U.S. NOMINAL AND REALGROSS DOMESTIC PRODUCT
NOMINAL GDP
REAL GDP (IN 2000 DOLLARS)
Source: U.S. Bureau of Economic Analysis
352 Chapter 12
and public education. However, government spending on transfer payments, such associal security and unemployment benefits, is not included. These payments allowthe recipients to buy goods and services, and these are counted as consumption.
Net exports, the final component of GDP, represents foreign trade. This componenttakes into account the goods and services produced in the United States but soldin foreign countries—in other words, exports. However, U.S. consumers and busi-nesses also buy, or import, goods made in foreign countries. Cars, car parts, andcrude oil are the largest imports in dollar value. The GDP counts only net exports—the value of U.S. exports minus the value of U.S. imports.
Two Types of GDP
Economists use GDP to gauge how well a country’s economy is doing. When GDPis growing, an economy creates more jobs and more business opportunities. WhenGDP declines, jobs and more business opportunities become less plentiful. To geta clearer picture of a country’s economic health, economists calculate two forms ofGDP—nominal and real.
The most basic form is nominal GDP, which is stated in the price levels for theyear in which the GDP was measured. If prices never changed, nominal GDP wouldbe sufficient. But prices tend to increase over time. In Figure 12.2, find the linethat represents nominal GDP. If you estimate the difference from 1990 to 2005, thenominal GDP of the United States about doubled. However, during this time priceswent up, adding dollars to GDP without adding value to the nation’s output.
To factor out rising prices, economists use real GDP, which is nominal GDPadjusted for changes in prices. Real GDP is an estimate of the GDP if prices were to
ANALYZE GRAPHS1. About how much did nominal GDP increase from 1990 to 2000?
2. About how much did real GDP increase over the same period?
3. Why do the two lines cross at the year 2000?
Nominal GDP statesGDP in terms of thecurrent value of goods andservices.
Real GDP states GDPcorrected for changes inprices from year to year.
QUICK REFERENCE

353Economic Indicators and Measurements
remain constant from year to year. To find real GDP, economists compare nominalGDP to a base year. Look again at Figure 12.2, which uses 2000 as a base year. Sincereal GDP eliminates price differences, the line for real GDP rises more graduallythan the line for nominal GDP. Real GDP provides a more accurate measure of eco-nomic performance.
APPLICATION Applying Economic Concepts
A. If output remained the same, how would a year of falling prices affect nominal GDP?How would it affect real GDP?
MATH CHALLENGE
F I G U R E 12 .3 Understanding Nominal and Real GDP
To better understand nominal and real GDP, imaginea country that produces only one good: TVs. If youknow the price of TVs and the number produced, youcan calculate that country’s nominal and real GDP.Use the table to find the data for these calculations.
Step 1: Calculate nominal GDP for 2004. NominalGDP is the product of the number of TVs producedand the price of TVs that year.
The table shows that nominal GDP grew each year. If you judged only by nominalGDP, the economy of this country would seem to be growing.
Step 2: Analyze the nominal GDP figures. Why did nominal GDP increase from2004 to 2005? The number of TVs produced increased. Why did nominal GDPincrease from 2005 to 2006? The price of TVs increased.
The output of the country’s economy grew from 2004 to 2005, but it stayed thesame from 2005 to 2006, despite the increase in prices. Calculating real GDPproduces a better estimate of how much a country’s economy is growing.
Step 3: Calculate real GDP for 2006. Real GDP is the product of the number of TVsproduced in the current year and the price of TVs in the base year. In this case, use2004 as the base year.
Since 2004 is the base year, nominal and real GDP are the same for 2004. Real GDPallows you to compare the output of the country’s economy in different years.
2004 2005 2006
TVsProduced
500 600 600
TV Price $100 $100 $120
NominalGDP
$50,000 $60,000 $72,000
Real GDP,base: 2004
$50,000 $60,000 $60,000
Numberproduced
� Price in that year �Nominal
GDP500 � $100 � $50,000
Numberproduced
�Price in thebase year
� Real GDP 600 � $100 � $60,000

354 Chapter 12
What GDP Does Not Measure
KEY CONCEPTS
Although GDP provides an important estimate of how well the economy is performing,it does not measure all output. It does not measure nonmarket activities, such as homechildcare or performing one’s own home repairs. GDP also does not measure outputfrom the underground economy, market activities that go unreported because theyare illegal or because those involved want to avoid taxation. Further, GDP does notmeasure “quality of life” issues related to economic output.
Nonmarket Activities
Some productive activities do not take placein economic markets. For example, there is noeffective way to measure the output of plumb-ers who install or repair plumbing systems intheir own homes or people who do volunteerwork for schools or hospitals. By far the biggestnonmarket activity, also left out of GDP, con-sists of the many services—cooking, cleaning,childcare—provided by homemakers.
Underground Economy
Also missing from GDP is the undergroundsector of the economy. Some activities are keptunderground because they are illegal—drug dealing, smuggling, gambling, andselling stolen goods, for example. When goods are rationed or otherwise restricted,illegal trading occurs on what is called the black market. Other underground activi-ties are themselves legal, but the way the payment is handled is not. For example,a plumber who does repairs for a neighbor might receive payment in cash and notdeclare it as taxable income. Estimates suggest that the underground economy wouldmake up 8 to 10 percent of the U.S. GDP.
Quality of Life
Countries with high GDPs have high living standards. But GDP does not show howthe goods and services are distributed. The United States has the largest GDP of anycountry, but more than 10 percent of its people still live in poverty. GDP also doesnot express what products are being built and services offered: for example, are theremore jails being built than schools?
APPLICATION Explaining an Economic Concept
B. If you get paid in cash to baby-sit, mow lawns, or do other chores for neighbors, areyou part of the underground economy? Why or why not?
Nonmarket activitiesare services that havepotential economic valuebut are performed withoutcharge.
Undergroundeconomy describesmarket activities that gounreported because theyare illegal or because thoseinvolved want to avoidtaxation.
QUICK REFERENCE
Nonmarket Activities Housework isan example of a productive activity notmeasured by GDP.

355Economic Indicators and Measurements
Other Economic Performance Measures
KEY CONCEPTS
GDP is not the only measure that economists use to gauge economic performance.Several other measures are derived by making adjustments to GDP.• Gross national product (GNP) is the market value of all final goods and services a
country produces in a given time period. GNP equals GDP plus the income fromgoods and services produced by U.S. companies and citizens in foreign countriesbut minus the income foreign companies and citizens earn here.
• Net national product (NNP) is GNP minus depreciation of capital stock—in otherwords, the value of final goods and services less the value of capital goods thatbecame worn out during the time period.
• National income (NI) is the total income earned in a nation from the production ofgoods and services in a given time period. It is calculated by subtracting indirectbusiness taxes, such as property and sales taxes, from NNP.
• Personal income (PI) is the income received by a country’s people from all sourcesin a given time period. It can be calculated from NI by subtracting social securitytaxes, corporate profit taxes, and corporate profits not paid to stockholders and byadding social security, unemployment, and welfare payments.
• Disposable personal income (DPI) is personal income minus personal income taxes.It shows how much money is actually available for consumer spending.
APPLICATION Making Inferences
C. Under what circumstances might a country’s GNP be greater than its GDP?
Gross nationalproduct (GNP) isthe market value of allfinal goods and servicesproduced by a country.
Net national product(NNP) is the value of finalgoods and services less thevalue of capital goods thathave become worn out.
National income (NI)is the total income earnedin a nation from theproduction of goods andservices.
Personal income (PI)is the income received bya country’s people from allsources.
Disposable personalincome (DPI) is personalincome minus taxes.
QUICK REFERENCE
F I G U R E 12 .4 National Income Accounting
GDP + income earned abroad by U.S. businesses and citizens– income earned in U.S. by foreign businesses and citizens
= GNP – depreciation of capital stock
= NNP – indirect business taxes
= NI – income earned but not received+ income received but not earned
= PI – personal taxes
= DPI
ANALYZE CHARTSWhat three figures do you need in order to calculate personal income (PI)?
ECONOMICSSKILLBUILDER
F I G U R E 12 .5 COMPONENTS OF U.S. GDP(IN BILLIONS OF DOLLARS)
For more on synthesizing economic data,see the Skillbuilder Handbook, page R23.
Year ConsumptionExpenditure
InvestmentExpenditure
GovernmentExpenditure
Net ExportExpenditure
NominalGDP
1980 1,757 479 566 13 2,789
1985 2,720 736 879 115 4,220
1990 3,840 861 1,180 78 5,803
1995 4,976 1,144 1,369 91 7,398
2000 6,739 1,736 1,722 380 9,817
2005 8,746 2,105 2,363 727 12,487
356 Chapter 12
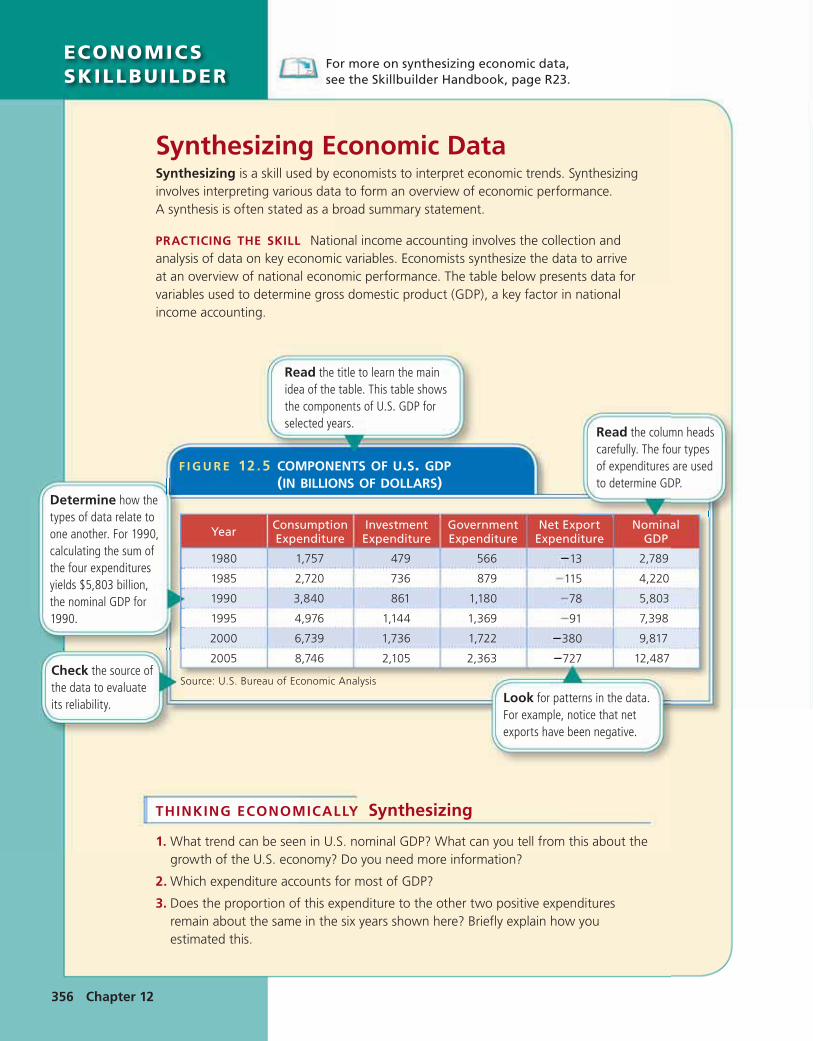
Synthesizing Economic DataSynthesizing is a skill used by economists to interpret economic trends. Synthesizinginvolves interpreting various data to form an overview of economic performance.A synthesis is often stated as a broad summary statement.
PRACTICING THE SKILL National income accounting involves the collection andanalysis of data on key economic variables. Economists synthesize the data to arriveat an overview of national economic performance. The table below presents data forvariables used to determine gross domestic product (GDP), a key factor in nationalincome accounting.
Determine how thetypes of data relate toone another. For 1990,calculating the sum ofthe four expendituresyields $5,803 billion,the nominal GDP for1990.
THINKING ECONOMICALLY Synthesizing
1. What trend can be seen in U.S. nominal GDP? What can you tell from this about thegrowth of the U.S. economy? Do you need more information?
2. Which expenditure accounts for most of GDP?
3. Does the proportion of this expenditure to the other two positive expendituresremain about the same in the six years shown here? Briefly explain how youestimated this.
Read the column headscarefully. The four typesof expenditures are usedto determine GDP.
Read the title to learn the mainidea of the table. This table showsthe components of U.S. GDP forselected years.
Check the source ofthe data to evaluateits reliability. Look for patterns in the data.
For example, notice that netexports have been negative.
Source: U.S. Bureau of Economic Analysis

ClassZone.com
357
ECONOMICS IN PR ACTICE
SECTION 1 AssessmentREVIEWING KEY CONC EP TS
2. What are the four components of GDP?
3. What is an example of a durable good? a nondurable good?
4. Name two economic activities that GDP does not measure.
5. Why are transfer payments not included as a government expenditurewhen calculating GDP?
6. Using Your Notes Write a briefsummary of the methods usedto calculate national income andthe purposes of each accountingmethod. Refer to your completedhierarchy chart.
Use the Graphic Organizer at Interactive Review @ ClassZone.com
7. Drawing Conclusions List some things that have become moreexpensive during your lifetime. Explain how a rise in price levelaffects nominal GDP and real GDP.
8. Making Inferences If consumption is especially high comparedwith other years, what might you generalize about the health ofthe economy?
9. Explaining an Economic Concept What is the undergroundeconomy? What impact does it have on a nation’s GDP?
10. Drawing Conclusions Imagine that a new country is discoveredon an island in the middle of the Pacific Ocean. The country’speople have never left the island, and no foreigners have everbeen there. What would the relationship be between thecountry’s GDP and its GNP? Why?
11. Challenge How would the following affect GDP?a. Government transfer payments increase.b. Student sells used CD to record store.c. Car owner pays auto repair shop $500 to fix his car.
Identifying Intermediate andFinal GoodsLook at the following list of goodsand who purchased them.
Categorize EconomicInformation Decide whether eachgood is an intermediate good or afinal good.
Challenge Why is it important tomake a distinction in national incomeaccounting between intermediateand final goods?
Goods Purchaser
copier paper accounting firm
refrigerator home consumer
stainless steel manufacturer
eggs home consumer
eggsfactory that makesfrozen bakedgoods
battery car owner
paint furniture maker
1. Explain the relationship between the terms in each of these pairs.
a. nominal GDPreal GDP
c. personal incomedisposable personalincome
b. gross national productnet national product
C RIT IC AL THINKING
National IncomeAccounting
GDP

2SECT ION
358 Chapter 12
OBJECT IVES KEY TERMS TAKING NOTES
As you read Section 2, complete acluster diagram like the one belowto record what you learn aboutbusiness cycles. Use the GraphicOrganizer at Interactive Review@ ClassZone.com
In Section 2, you will
• describe the phases of thebusiness cycle
• discuss aggregate demand andaggregate supply
• identify the causes of thechanges in the business cycle
• explain how economistspredict business cycle changes
• outline major business cyclesin U.S. history
business cycle, p. 358economic growth, p. 358recession, p. 359depression, p. 359stagflation, p. 359aggregate demand, p. 360aggregate supply, p. 360macroeconomic equilibrium, p. 361leading indicators, p. 364coincident indicators, p. 364lagging indicators, p. 364
What Is the Business Cycle?
KEY CONCEPTS
Economic changes often follow a broad pattern. During the 1990s, the U.S. econ-omy expanded. In 2001, the economy slowed down. It then returned to a period ofgrowth. Such changes are an example of the business cycle, a series of periods ofexpanding and contracting economic activity. The business cycle is measured byincreases or decreases in real GDP. The cycle has four distinct stages: expansion,peak, contraction, and trough.
STAGE 1 Expansion
In the expansion phase, real GDP grows from a low point, or trough, as you can see inthe graph in Figure 12.6. The expansion is a period of economic growth, an increasein a nation’s real gross domestic product(GDP). During an expansion, jobs arerelatively easy to find, so unemploymentgoes down. More and more resources areneeded to keep up with spending demand.As resources become more scarce, theirprices rise. The length of each phase mayvary both within a cycle and from cycle tocycle. The longest expansion in U.S. his-tory took place over the course of ten yearsfrom 1991 to 2001.
Business Cycles
The business cycleis the series of growingand shrinking periodsof economic activity,measured by increases ordecreases in real GDP.
Economic growth isthe increase in a nation’sreal GDP over a periodof time.
QUICK REFERENCE
BusinessCycle
stages
Business Cycles Workersand businesses ride the upsand downs of the economy.

359Economic Indicators and MeasurementsEconomic Indicators and Measurements
STAGE 2 Peak
The point at which real GDP is the highest represents the peak of the business cycle.As prices rise and resources tighten, businesses become less profitable. From thatpoint on, real GDP declines as businesses curtail production.
STAGE 3 Contraction
The contraction phase begins after the peak. As producers cut back, resourcesbecome less scarce and prices tend to stabilize or fall. Unemployment rises becauseemployers produce less. Sometimes the contraction phase becomes a recession, acontraction lasting two or more quarters (six months or more). On rare occasions,as in the 1930s, a contraction turns into a depression, an extended period of highunemployment and limited business activity. While prices usually remain about thesame or go down during the contraction phase, sometimes they go up. These areperiods of stagflation—stagnation in business activity and inflation of prices.
STAGE 4 Trough
The final phase of the business cycle is the trough, the point at which real GDP andemployment stop declining. A business cycle is complete when it has gone throughall four phases, from trough to trough or from peak to peak.
APPLICATION Explaining an Economic Concept
A. In terms of the business cycle, what is unusual about stagflation?
QUICK REFERENCE
Recession is a prolongedeconomic contraction last-ing two or more quarters(six months or more).
Depression is anextended period of highunemployment andreduced business activity.
Stagflation describesperiods during which pricesrise at the same time thatthere is a slowdown inbusiness activity.
QUICK REFERENCE
Time
Rea
l GD
P
FIGURE 12.6 THE BUSINESS CYCLE
ANALYZE CHARTS1. What stage occurred before point A?
2. What stage will occur after point D?
3. How might the business cycle curve change if nominal GDP was used instead ofreal GDP?
a In the expansion phase,real GDP grows rapidly.
b The peak is where realGDP reaches its highestpoint in the cycle.
c In the contraction phase,real GDP declines.
d The trough marks theend of the contraction.
b
a
dc

FIGURES 12.7 AND 12.8 AGGREGATE DEMAND AND SUPPLY CURVES
FIGURE 12.8 AGGREGATE SUPPLYFIGURE 12.7 AGGREGATE DEMAND
Pric
e le
vel
Real GDP
Pric
e le
vel
Real GDP
AS
AD
360 Chapter 12
Aggregate Demand and Supply
KEY CONCEPTS
One way to understand business cycles is through the concepts of demand andsupply. In this case the concepts apply not to a single product or business but to theeconomy as a whole.
Aggregate Demand
Aggregate demand is the total amount of goods and services that households, busi-nesses, government, and foreign purchasers will buy at each and every price level.In Figure 12.7, the vertical axis, labeled “Price level,” shows the average price of allgoods and services. The horizontal axis, labeled “Real GDP,” shows the economy’stotal output. The aggregate demand curve (AD) is downward sloping. As the pricelevel decreases the purchasing power of money increases.
Aggregate Supply
Aggregate supply is the total amount of goods and services that producers will pro-vide at each and every price level. Note that in Figure 12.8 the aggregate supply curve(AS) does not look like the supply curves in Chapter 5. The aggregate supply curveis almost horizontal when real GDP is low—during times of recession or depres-sion—because businesses try not to raise their prices when the economy is weak.The middle part of the aggregate supply curve slopes upward, with prices increasingas real GDP increases. But during times of high inflation, prices rise without con-tributing to real GDP, and the aggregate supply curve becomes almost vertical.
Aggregate demand isthe sum of all the demandin the economy.
Aggregate supply isthe sum of all the supply inthe economy.
QUICK REFERENCE
ANALYZE GRAPHS1. What does a normal demand or supply graph use
as an x-axis? What does it use as a y-axis?
2. Why are the x and y axes different for theaggregate demand and supply graphs?
Use an interactive aggregatedemand and aggregate supplygraph at ClassZone.com

AS3 AS1 AS2AS
AD1
AD3
AD2
AD
FIGURES 12.9 AND 12.10 CHANGES IN AGGREGATE DEMAND AND SUPPLY
FIGURE 12.10 CHANGE IN AGGREGATESUPPLY
FIGURE 12.9 CHANGE IN AGGREGATEDEMAND
Pric
e le
vel
Real GDP
Pric
e le
vel
Real GDP
P2
P1
P3
Q3 Q1 Q2 Q3 Q1Q2
P2P1P3
361Economic Indicators and Measurements
Macroeconomic Equilibrium
When the quantity of aggregate demand equals the quantity of aggregate supply,the economy reaches macroeconomic equilibrium. Figures 12.9 and 12.10 illustrate avariety of different possibilities, but let’s consider one particular example shown inFigure 12.9. Macroeconomic equilibrium occurs where the aggregate demand curve(AD1) intersects the aggregate supply curve (AS). P1 indicates the equilibrium pricelevel, and Q1 shows the equilibrium level of real GDP.
Think about business cycles. An increase in aggregate demand shifts the aggre-gate demand curve to the right (AD2). Aggregate demand becomes greater at allprice levels, and equilibrium real GDP rises (Q2), marking an expansion phase. Ifaggregate demand were to decrease, the aggregate demand curve would shift to theleft (AD3). This would result in a lower equilibrium real GDP (Q3)—in other words,an economic contraction.
Shifts in aggregate supply affect real GDP in a similar way, as you can see inFigure 12.10. An increase in aggregate supply shifts the aggregate supply curve tothe right (AS2). As aggregate supply increases, the price level goes down (P2) andequilibrium real GDP rises (Q2), marking an expansion phase. If aggregate supplywere to decrease, the aggregate supply curve would shift to the left (AS3). The resultwould be a higher price level (P3) and lower equilibrium real GDP (Q3)—in otherwords, stagflation.
APPLICATION Analyzing Cause and Effect
B. Assuming aggregate demand remains the same, why does the price level go up whenaggregate supply decreases?
ANALYZE GRAPHS1. As aggregate demand decreases, what happens to price level and real GDP?
2. As aggregate supply decreases, what happens to price level and real GDP?
Macroeconomicequilibrium is thepoint where the quantityof aggregate demandequals the quantity ofaggregate supply.
QUICK REFERENCEQUICK REFERENCE

362 Chapter 12
Why Do Business Cycles Occur?
KEY CONCEPTS
You have seen that shifts in aggregate demand and aggregate supply indicate changesin the business cycle. But what causes these shifts? Four factors are especially impor-tant: (1) decisions made by businesses, (2) changes in interest rates, (3) the expecta-tions of consumers, and (4) external shocks to the economy. These factors involve the“ripple effect,” the cause-and-effect interactions that ripple through the economy.
FACTOR 1 Business Decisions
When businesses decide to decrease or increase production, their decisions can havefar-reaching effects. If enough businesses make similar decisions, it can lead to achange in the business cycle.
Demand slump Consider the ripple effectof a decision by businesses in the record-ing industry. In response to a slump indemand, the producers decide to reduceproduction of compact discs. First, theyreduce the number of hours worked attheir compact disc manufacturing facili-ties. Some workers get laid off, otherswork shorter hours. In a related move,the recording businesses cut back on theirinvestment in new CD manufacturingequipment. That decision will lead to adecrease in the demand for machinery,which puts producers of the machinery in the same situation that the recording busi-nesses were in. The machinery businesses will also cut back on production and lay offworkers. The recording industry businesses also decide to reduce the number of newrecordings they commission, thereby reducing the income of musicians, recordingengineers, record promoters, and other associated workers. All of the workers thatare now unemployed or working less must cut back on their purchases.
The single decision by the recording industry businesses had numerous conse-quences. By itself, it might not be enough to change the business cycle for the entirecountry. But if enough businesses make similar decisions, a contraction in the busi-ness cycle might result.
New technology Alternatively, business decisions can also increase aggregate sup-ply and fuel an expansion. For example, suppose computer chip manufacturersadopt a new technology that greatly reduces production costs. Those manufacturersbecome more productive—the supply of their products increases and the cost oftheir products goes down. Businesses that make products that use computer chipscan make their products more cheaply. Other businesses may now be able to makenew products with the more readily available computer chips. All of these busi-nesses hire more workers to handle the increased production. The aggregate supplyincreases, and the economy experiences an expansion.
Find an update on factorsaffecting the business cycleat ClassZone.com

363Economic Indicators and Measurements
FACTOR 2 Changes in Interest Rates
Another event that has a ripple effect in the economy and causes shifts in aggregatedemand and supply is a change in interest rates. Rising interest rates, for example,make it more costly for consumers to borrow money to make purchases—from tele-visions to cars to houses. This decreased purchasing power lowers the level of aggre-gate demand and promotes a contraction in the economy. When interest rates fall,the opposite happens. Aggregate demand rises, promoting an expansion.
Consider what may happen to businesses when interest rates rise. With thehigher cost of borrowing money, businesses may cut back on their investment incapital goods. As you saw earlier, such a cutback would lead to less business activityfor the producers of capital goods. As the aggregate supply decreases, a contractionin the economy is likely. But falling interest rates would lead to an increase in aggre-gate supply and an economic expansion.
Higher or lower interest rates also affect the housing market. When interest ratesare low, people are inclined to purchase housing rather than rent, so housing salesand all related economic activities increase, contributing to an economic expansion.When interest rates rise, the high cost of loans limits mortgage eligibility, so morepeople rent. Housing sales slow down, contributing to an economic contraction.
FACTOR 3 Consumer Expectations
Every month, 5,000 households are surveyed to find out how people are feelingabout the economy, and the results are published in the Consumer Confidence Sur-vey report. Why? The way consumers are feeling about prices, business activity, andjob prospects influences their economic choices, and their choices can bring aboutchanges in aggregate demand. For example, when consumers are confident about thefuture and believe that they are economically secure, they tend to consume more,driving up aggregate demand and encouraging an economic expansion.
FACTOR 4 External Issues
A nation’s economy can also be strongly influenced by issues and events beyond itscontrol or outside of its borders. Examples include such natural disasters as Hur-ricanes Katrina and Rita, which struck the Gulf Coast in the summer of 2005. Thehurricanes damaged oil refineries, oil wells, and offshore oil platforms. The effectsof Katrina and Rita, combined with conflicts in other oil-producing countries, ledto higher oil prices and slowed down the growth of the U.S. economy.
The oil embargo of 1973 is another example. The Organization of the PetroleumExporting Countries (OPEC) reduced the amount of oil supplied to Western nationsthat had supported Israel in the Yom Kippur and October wars. The price of oil roseby 400 percent. The higher prices raised production costs and resulted in an eco-nomic contraction in the United States.
APPLICATION Analyzing Cause and Effect
C. Describe the ripple effect of a natural disaster like Hurricane Katrina on the economy.
.
External IssuesNatural disasters can affectthe economy. Hurricane Katrinawashed this oil-drilling platforminto this bridge.

10.5
11.0
11.5
12.0
8.5
9.0
9.5
10.0
1998
Sources: The Conference Board; U.S. Bureau of Economic Analysis; National Bureau of Economic Research
1999 2000 2001 2002 2003 2004
INDEX OF LEIFIRST QUARTER GDPSECOND QUARTER GDPTHIRD QUARTER GDPFOURTH QUARTER GDPRECESSION (MAR.-NOV. 2001)
FIGURE 12.11 U.S. LEADING ECONOMIC INDICATORS (LEI ) AND REAL GDP
Rea
l GD
P (i
n t
rilli
on
s o
f 20
00 d
olla
rs)
Year and quarter
Ind
ex of LEI
364 Chapter 12
Predicting Business Cycles
KEY CONCEPTS
Economists try to predict changes in the business cycle to help businesses and thegovernment make informed economic choices. They base their predictions on setsof economic indicators.• Leading indicators are measures of economic performance that usually change six
to nine months before real GDP changes. Examples include new building permits,orders for capital goods and consumer goods, consumer expectations, averagemanufacturing workweek, stock prices, and the money supply. Economists look fortrends in these indicators that last several months before they predict a change.
• Coincident indicators are measures of economic performance that usually change atthe same time as real GDP changes. These indicators include such items as employ-ment, sales volume, and personal income.
• Lagging indicators are measures of economic performance that usually changeafter real GDP changes. Such indicators are useful for confirming the end of anexpansion or contraction in the business cycle. They include length of unemploy-ment and the ratio of consumer credit to personal income.
APPLICATION Using a Decision-Making Process
D. If you were the manager of an electronics store, how might you use the news thatleading indicators suggest a contraction in the economy in six months?
Leading indicatorsare measures of economicperformance that usuallychange before real GDPchanges.
Coincident indicatorsare measures of economicperformance that usuallychange at the same timeas real GDP changes.
Lagging indicatorsare measures of economicperformance that usuallychange after real GDPchanges.
QUICK REFERENCE
ANALYZE GRAPHS1. Find a period of at least four quarters in which the index of leading economic indicators accurately
predicted a change in real gross domestic product.
2. Do changes in the real gross domestic product always echo changes in the index of leading economicindicators? What does this say about predicting changes in the nation’s economy?

365Economic Indicators and Measurements
Business Cycles in U.S. History
KEY CONCEPTS
The U.S. economy has experienced many booms and busts throughout the nation’s history. Some historians suggest that the depression that struck Europe and the United States in the 1870s may have been worse than the Great Depression of the 1930s. But the differences in the amount and kinds of data collected between the two periods make direct comparisons difficult.
The National Bureau of Economic Research (NBER) has tracked business cycles in the United States since 1929. It has also estimated U.S. business cycles dating back to the mid-1800s. According to the NBER, the U.S. economy went through about 20 cycles in the 1900s. Notable cycles include the Great Depression of the 1930s, the decade-long expansion of the 1990s, and the financial crisis that began around 2007.
The Great Depression
For more than a decade, beginning with the stock market crash in 1929, the United States and much of the world suffered a terrible eco-nomic contraction. Not until the United States entered World War II in 1941 did the American economy begin a full recovery. From 1929 to 1933, real GDP in the United States declined by about a third. Sales in some big businesses, including General Motors Corpora-tion, declined by as much as 50 percent. In the resulting cutbacks, millions of workers lost their jobs. The unemployment rate skyrock-eted from 1929 to 1933, leaving one in four American workers job-less. Businesses failed at a higher than usual rate, and banks failed at a tremendously high rate. The number of bank closings, either temporary or permanent, soared from 659 in 1929 to 4,000 in 1933.
President Herbert Hoover, who had been elected in 1928, was not able to bring about a recovery. Franklin D. Roosevelt, accepting the nomination to run for president against Hoover in 1932, promised Americans “a new deal,” and the programs he enacted after win-ning the election came to be known by that name. Roosevelt’s New Deal programs focused on federal spending to help the economy revive. Through a number of government agencies created just for this purpose, many Americans were put back to work—employed by the federal government itself. At the same time, American businesses came under closer government regulation, intended to prevent problems like those that led to theDepression. Spending by the federal government rose from about 3 percent of GDP in the 1920s to about 10 percent in the mid-1930s.
Economists debate to what degree spending on New Deal programs contributed to a recovery. But when the United States entered World War II in 1941, government spending rose even higher, and the Great Depression finally ended.
The Great Depression Millions of Americans were thrown into poverty during the 1930s. These people received soup from a charity kitchen.
The New Deal In this cartoon, Franklin D. Roosevelt is surrounded by children representing programs created as part of the New Deal.
366 Chapter 12
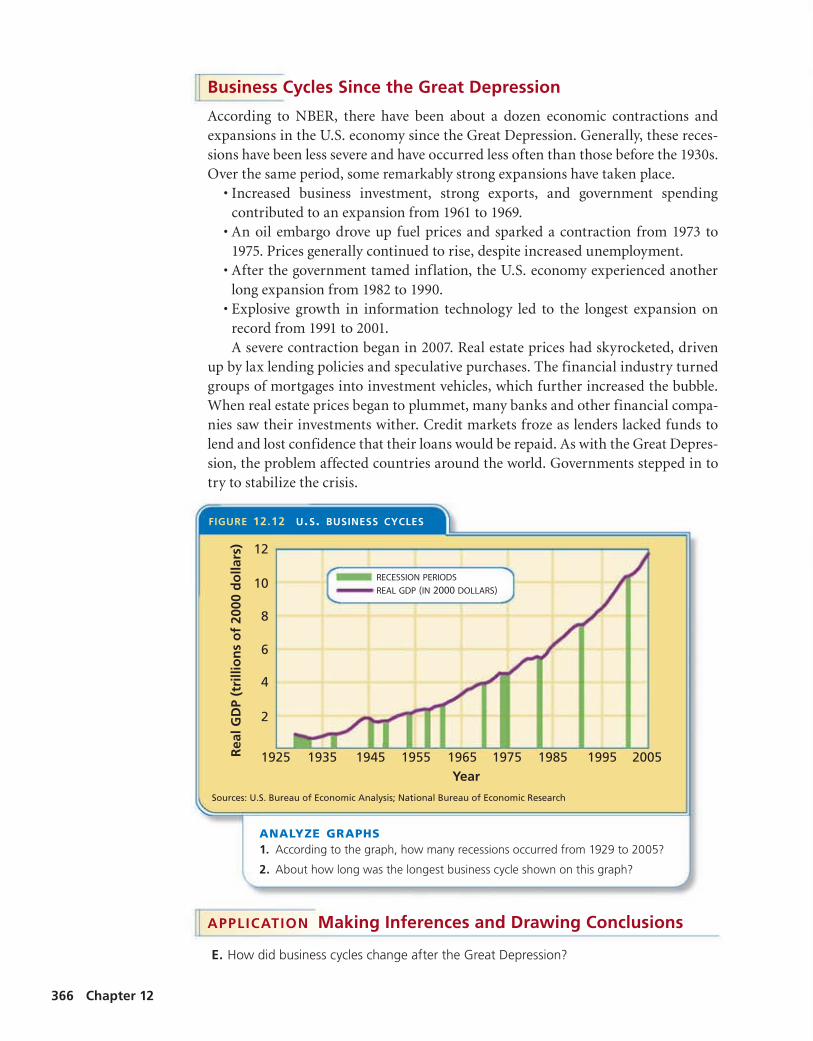
Business Cycles Since the Great Depression
According to NBER, there have been about a dozen economic contractions and expansions in the U.S. economy since the Great Depression. Generally, these reces-sions have been less severe and have occurred less often than those before the 1930s. Over the same period, some remarkably strong expansions have taken place.
• Increased business investment, strong exports, and government spending contributed to an expansion from 1961 to 1969.
• An oil embargo drove up fuel prices and sparked a contraction from 1973 to 1975. Prices generally continued to rise, despite increased unemployment.
• After the government tamed inflation, the U.S. economy experienced another long expansion from 1982 to 1990.
• Explosive growth in information technology led to the longest expansion on record from 1991 to 2001.A severe contraction began in 2007. Real estate prices had skyrocketed, driven
up by lax lending policies and speculative purchases. The financial industry turned groups of mortgages into investment vehicles, which further increased the bubble. When real estate prices began to plummet, many banks and other financial compa-nies saw their investments wither. Credit markets froze as lenders lacked funds to lend and lost confidence that their loans would be repaid. As with the Great Depres-sion, the problem affected countries around the world. Governments stepped in to try to stabilize the crisis.
APPLICATION Making Inferences and Drawing Conclusions
E. How did business cycles change after the Great Depression?
2
4
6
8
10
12
1925 1935 1945 1955 1965 1985 1995 20051975Year
Rea
l GD
P (t
rilli
on
s o
f 20
00 d
olla
rs)
FIGURE 12.12 U.S. BUSINESS CYCLES
Sources: U.S. Bureau of Economic Analysis; National Bureau of Economic Research
RECESSION PERIODS
REAL GDP (IN 2000 DOLLARS)
ANALYZE GRAPHS1. According to the graph, how many recessions occurred from 1929 to 2005?
2. About how long was the longest business cycle shown on this graph?

ClassZone.com
367
AS1
AD1
Pric
e le
vel
Real GDP
P1
Q1
MACROECONOMIC EQUILIBRIUM
ECONOMICS IN PRACTICE
SECTION 2 AssessmentREVIEWING KEY CONC EP TS
2. Between which two points of the business cycle is a contraction measured?
3. What is the difference between demand and aggregate demand?
4. Name four factors that can trigger changes in the business cycle.
5. Name three coincident indicators of the Great Depression.
6. Using Your Notes Write a brief statement of your expectations for the economy from the point of view of the consumer. Use your completed cluster diagram and make references to what you have learned about the business cycle.
Use the Graphic Organizer at Interactive Review @ ClassZone.com
7. Comparing and Contrasting Economic Information What are the similarities and differences between the Great Depression and the recession that began in 2007?
8. Solving Economic Problems Did President Roosevelt’s New Deal focus on generating aggregate demand, or was its main focus on increasing aggregate supply? Explain.
9. Analyzing Cause and Effect Are the components that are considered leading economic indicators causes or effects of changes in the business cycle?
10. Challenge In the 1990s many people speculated that the economy had been transformed by new technologies. Paul A. Volcker, former chairman of the U.S. Federal Reserve Bank, described it this way: “The speed of communication, the speed of information transfer, the cheapness of communication, the ease of moving things around the world are a difference in kind as well as degree.” Do you think that business cycles are inevitable? Can they ever be eliminated entirely? Explain your answer.
Interpreting Graphs The graph shows an economy at its macroeconomic equilibrium, where the aggregate demand curve (AD1) intersects the aggregate supply curve (AS1). P1 indicates the equilibrium price level, and Q1 shows the equilibrium level of real GDP.
Draw Aggregate Demand and Aggregate Supply Curves Read the following scenarios. Copy the graph above onto your own paper. Read the following scenarios. Then graph the changes that would occur in the Scenario 1 in blue. Graph the changes that would occur in the Scenario 2 in red.
Scenario 1: In a booming economy, interest rates begin to rise. Manufacturers and other producers, wary of borrowing money at higher rates, begin to cut back on production.
Scenario 2: Consumer confidence is high. Most people are optimistic about their job prospects and security, and they are willing to spend money on luxuries.
Challenge As a consumer, how might your confidence be affected in Scenario 1?
1. Explain the relationship between the terms in each of these pairs.
a. contractionexpansion
c. leading indicatorslagging indicators
b. aggregate demandaggregate supply
Business Cycle
stages
C RIT IC AL THINKING
Use @ ClassZone.com to complete this activity.

3SECT ION
368 Chapter 12
OBJECT IVES KEY TERMS TAKING NOTES
As you read Section 3, completea summary chart like the onebelow to record what you learnabout economic growth. Use theGraphic Organizer at InteractiveReview @ ClassZone.com
In Section 3, you will
• explain how economistsmeasure growth
• analyze the causes ofeconomic growth
• discuss how productivity andeconomic growth are related
real GDP per capita, p. 369
labor input, p. 371
capital deepening, p. 371
productivity, p. 372
multifactor productivity, p. 372
What Is Economic Growth?
KEY CONCEPTS
In Section 2 you learned about the business cycle, the pattern of expansion and con-traction in a nation’s economy. In this section you will learn more about economicgrowth, as measured by changes in real gross domestic product (GDP).
Gauging Economic Growth
Before Adam Smith (whom you learned about in Chapter 1, Section 4), many peoplebelieved that population growth and higher taxation were the secrets to economicgrowth. The theory held that more people paying more taxes was the best way tofill a nation’s treasury. Another view, called mercantilism, argued that increasednational wealth came through exporting more goods than a country imports. Inthis way, the country would gain gold or silver currency from other countries.
Adam Smith, however, saw that the real “wealth of nations” lay in their productivecapacities. Taxes could be so high that they limit the amount of funds available forbusiness investment and consumer spending, thereby reducing economic growth.In Smith’s view, foreign trade allows a country to focus its resources on what it doesbest. The more efficiently a nation uses its resources, the more productive it will beand the larger its economy will grow. Smith’s views proved to be accurate, and theyserve as the basis for modern economics.
The best measure of economic growth is not simply the amount of money anation has or how much its population increases, but rather the increase in its realGDP. The rate at which real GDP changes is a good indicator of how well a country’sresources are being utilized.
Stimulating EconomicGrowth
What Is Economic
Growth?

5,000
10,000
15,000
20,000
25,000
30,000
35,000
40,000
19651960 1970 1975 1980 1985 1990 1995 2000 2005
Rea
l GD
P p
er c
apit
a (2
002
do
llars
)
FIGURE 12.13 U.S. REAL GDP PER CAPITA
Source: U.S. Bureau of Labor Statistics
369Economic Indicators and MeasurementsEconomic Indicators and Measurements
Population and Economic Growth
Population growth influences economic growth. A country’s real GDP might begrowing, but if its population is growing at an even faster rate, the increase in realGDP might simply reflect more workers contributing to the economy. Think of apotluck dinner. If each person brings one dish, the amount of food per person willbe the same whether you invite 10 people or 100.
To get a clearer picture of economic growth, economists use a measure calledreal GDP per capita, which is real GDP divided by total population. Real GDP percapita reflects each person’s share of real GDP. In terms of the potluck dinner, ifeach person brings more than one dish to the next potluck, the amount of food perperson will have increased.
Real GDP per capita is the usual measure of a nation’s standard of living. Nationswith higher real GDP per capita tend to have populations that are better educatedand healthier. However, real GDP per capita does not mean that each person gets thatamount of money. Some people will get more, others less. It also does not measurequality of life. For example, people might have to work longer hours to achieve higherrates of economic growth, leaving them with less leisure time.
APPLICATION Explaining an Economic Concept
A. Why does a nation’s real GDP have to increase at a faster rate than its population forsignificant economic growth to take place?
ANALYZE GRAPHS1. About how much was real GDP per capita in 1990?
2. About how many years did it take for real GDP per capita to double from its levelin 1960?
Real GDP per capita isreal GDP divided by totalpopulation.
QUICK REFERENCE
Find an update on U.S.real GDP per capita atClassZone.com

370
What Determines Economic Growth?
KEY CONCEPTS
What drives economic growth? Why are some nations growing at a faster pace thanothers? Four key factors influence the rate of economic growth—natural resources,human resources, capital, and technology and innovation.
FACTOR 1 Natural Resources
One factor in economic growth is access to natural resources, especially arable land,water, forests, oil, and mineral resources. However, some countries, such as Japan,have very limited natural resources, yet their economies have grown rapidly. Others,such as India, which has the fourth-largest reserve of coal in the world and arableland covering more than half its territory, have developed more slowly.
CONNECTING ACROSS THE GLOBE1. Synthesizing Economic Information What role do natural resources play in a country’s economic
strength? Explain your answer.
2. Drawing Conclusions Figure 12.14 illustrates oil production and consumption in Nigeria and Japan.What would happen to each country’s economy if it produced less oil? What if each produced more?
A GLOBAL PERSPECTIVEPERSPECTIVE
0
1
2
3
4
5
6
Bar
rels
per
day
(in
mill
ion
s)
consumption
production
JapanNigeria
FIGURE 12.14 OIL PRODUCTION ANDCONSUMPTION
Source: U.S. Central Intelligence Agency, 2003 data
Do Natural Resources Guarantee Wealth?Not necessarily. In fact, countries with abundantnatural resources generally do not perform aswell economically as countries with fewer naturalresources—a phenomenon economists refer toas “the resource curse.” In Nigeria, for example,although oil is plentiful, personal income is low. GDPper capita is about $1,400 (in U.S. dollars). Poverty iswidespread, with an estimated 60 percent of Nigeria’spopulation below the poverty line—and Nigeria hasthe largest population of any African country.
At the other end of the spectrum is Japan. Althoughthe country has few natural resources, the strength ofJapan’s economy is second only to that of the UnitedStates. GDP per capita is about $30,000 (in U.S. dollars).What Nigeria lacks, but Japan has, are the basic structuresof a free market economy—private ownership, theprofit motive, an effective government, and economiccompetition. These economic institutions are moreimportant than natural resources for generatingeconomic growth. Japan, with few natural resources,achieved economic success by developing alternativesources of wealth—industry and foreign trade.

371Economic Indicators and Measurements
FACTOR 2 Human Resources
Another key factor in economic growth is the labor force. Economists measure thispartly through labor input—the size of the labor force multiplied by the length ofthe workweek. The steady declines in the length of the workweek in most countriessince the early 1900s have been more than made up for by the growth in the popula-tion, so labor input has grown. Perhaps even more important than the raw numbers,however, is the level of human capital—the skills and knowledge—that the laborforce brings to its tasks. Some economists believe that human capital is the singlemost important component in economic growth.
FACTOR 3 Capital
You learned in Chapter 1 that natural resources, labor, and capital come togetherthrough the creativity of an entrepreneur to produce goods and services. Capitalis critical to this process and to economic growth. More and better capital goodsincrease output: the more machines a factory has and the better designed they are,the more goods the factory can churn out. Multiply this by the number of factoriesacross a nation and the increased output equals higher GDP.
The economy also grows when more capital is available per worker. An increasein the capital to labor ratio is called capital deepening. In other words, workers areprovided with more and better equipment to work with. The Industrial Revolutionis a prime example of capital deepening. Sewing machines, for example, allowedclothing manufacturers to make more clothing per worker than if the workers hadbeen sewing by hand.
FACTOR 4 Technology and Innovation
Technology and innovation are also important factors in economicgrowth. These factors promote the efficient use of other resources,which in turn leads to increased output. Some of the key technologicaldevelopments that have contributed to economic growth include steampower, electricity, and the automobile.
Innovations can also increase economic growth. Something assimple as adjusting an order form can contribute to economic growthby reducing the amount of time needed to complete a task. Otherinnovations might improve customer service or reduce the amount ofmaterial needed to create a product.
Information technology has had a strong impact on economicgrowth. Technological advances in producing the information tech-nology itself have led to a dramatic decline in prices. With lowerprices for technology, firms are engaging in capital deepeningwithout having to spend more money.
APPLICATION Writing About Economics
B. Using the four factors, explain how developing countries like Nigeria might improvetheir economic growth.
Labor input is thesize of the labor forcemultiplied by the length ofthe workweek.
QUICK REFERENCE
Technology andInnovationTechnological advancementshave increased economicgrowth.
Capital deepening isan increase in the ratio ofcapital to labor.
QUICK REFERENCE

372 Chapter 12
Productivity and Economic Growth
KEY CONCEPTS
Productivity refers to the amount of output produced from a set amount of inputs.When the same amount of inputs produces more output, productivity has increased.In Chapter 9, you learned about labor productivity—the amount of goods or servicesproduced by a worker in an hour. But the broader sense of productivity includes theproductivity of both labor and capital.
For example, imagine that you begin building bookshelves. The inputs wouldinclude your labor plus capital, in the form of the workshop, hammers, glue, andother supplies. At first, it may take you a week to complete one bookshelf. In theprocess, you may waste materials as you make mistakes, and you may find that someof your tools are not ideal for the task. But after you have built several bookshelvesand acquired the right tools for the job, your productivity increases. Using the sameamount of input, you might now be able to produce two bookshelves per week.
This section concerns the productivity of a country’s entire economy. As a countrybecomes more productive, its economy is likely to grow.
How Is Productivity Measured?
To measure the productivity of a single business, you would compare the inputs tothe outputs. Using the bookshelf example, you would compare the amount of capitaland number of hours worked to the number of bookshelves produced. But how canwe measure the productivity of a nation’s economy, which is made up of millions ofdifferent people and businesses? Economists use a measurement called multifactor
productivity, the ratio between an industry’s economic output and its labor and capitalinputs. By collecting multifactor productivity data on a country’s major industries andbusiness sectors, economists can estimate the productivity of the entire economy.
What Contributes to Productivity?
Several factors contribute to changes in productivity.
Quality of Labor A better educated, healthier workforce tends to be more produc-tive. Using the bookshelf example, if you were to take classes in woodworking, yourenhanced knowledge would enable you to produce more and better shelves. In gen-eral, the more educated the workforce, the more productive it is. As for health, peopleare usually more productive when they feel well than when they feel sluggish or ill.
Technological Innovation Historically, as during the Industrial Revolution, newmachines and technologies helped countries produce more output from the sameamount of inputs. In recent times, the desktop computer and computer technologygenerally have generated productivity gains.
Energy Costs Gas, electricity, and other fuels power the technologies that increaseproductivity. When energy costs rise, those tools become more expensive to use andproductivity declines. By the same token, when energy costs fall, using advancedtools becomes less expensive and productivity rises.
Productivity is the ratioof the amount of outputproduced to the amountof input.
QUICK REFERENCE
Multifactor productiv-ity is the ratio between theamount of output producedby an industry or businesssector and the amount ofinputs used.
QUICK REFERENCE

373Economic Indicators and Measurements
Financial Markets The easier it is for funds to flow to where they are needed, themore productive the economy becomes. Banks, stock markets, and similar institu-tions allow a country’s funds to be put to their best use. When such institutions donot exist or when they do not function efficiently, productivity is reduced.
How Are Productivity and Growth Related?
Economic growth is a measure of change in production. It does not consider howmuch effort or how many resources it took to produce that quantity of production.Productivity, on the other hand, is a measure of efficiency. It reflects the amount ofeffort and resources it took to produce a certain quantity.
A country could experience economic growth—as measured by real GDP—without increasing its productivity. Such growth would be tied to an increase in thequantity of natural resources, labor, capital, or technology. If the productivity of acountry increases, its real GDP can grow without increasing the quantity of inputs.
As shown in Figure 12.15, productivity in the United States grew at a steady pacefrom 1950 to 2000. Among other things, a better educated labor force and advancesin information technology contributed to the increase. The dips in the graph repre-sent productivity setbacks, such as tighter financial markets during recessions.
APPLICATION Drawing Conclusions
C. Some countries have limited natural resources but high economic growth. Does thisprove that worldwide economic growth is unlimited by natural resources?Why or why not?
FIGURE 12.15 U.S. PRIVATE BUSINESSMULTIFACTOR PRODUCTIVITY
Source: U.S. Bureau of Labor Statistics
Rea
l val
ue-
add
ed o
utp
ut
(in
dex
yea
r 20
00=
100)
30
40
10
20
1955 1965 1975 1985 19951950 1960 1970 1980 1990 2000
50
60
Year
708090
100
ANALYZE GRAPHS1. What happened to productivity in the three years after the 1973 oil embargo? Why?
2. Compare this graph with Figure 12.13 on page 369, which shows real per capitaGDP. How closely is economic growth related to productivity?
374 Chapter 12
Thomas Robert Malthus:The Population Problem
In the late 1700s, many European thinkers and writers predicted a future of peace andharmony in which poverty and hunger would be eliminated. Discussing humanity’sfuture with his father led Thomas Robert Malthus to question whether the prevail-ing view was perhaps too rosy. Malthus saw a problem that others had overlooked,namely, that the world’s population seemed likely to outgrow the available supply offood. He published his ideas in 1798 in “An Essay on the Principle of Population asIt Affects the Future Improvement of Society.”
A Natural Limit to Economic Growth?
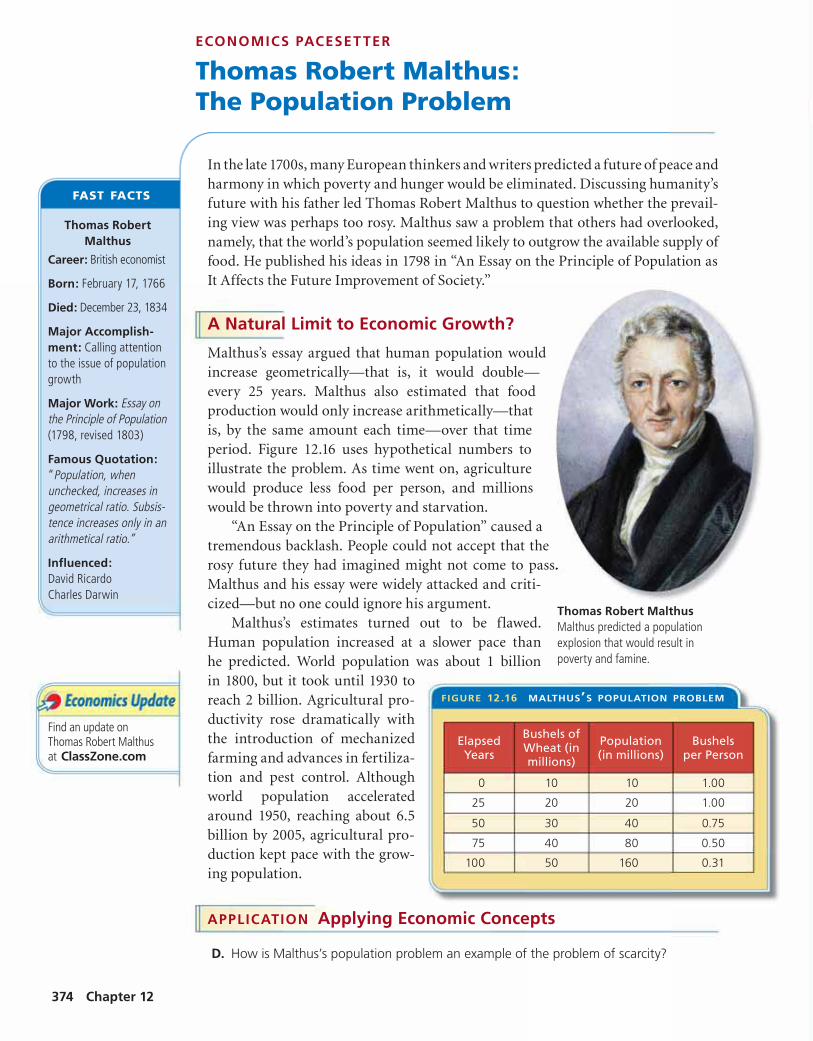
Malthus’s essay argued that human population wouldincrease geometrically—that is, it would double—every 25 years. Malthus also estimated that foodproduction would only increase arithmetically—thatis, by the same amount each time—over that timeperiod. Figure 12.16 uses hypothetical numbers toillustrate the problem. As time went on, agriculturewould produce less food per person, and millionswould be thrown into poverty and starvation.
“An Essay on the Principle of Population” caused atremendous backlash. People could not accept that therosy future they had imagined might not come to pass.Malthus and his essay were widely attacked and criti-cized—but no one could ignore his argument.
Malthus’s estimates turned out to be flawed.Human population increased at a slower pace thanhe predicted. World population was about 1 billionin 1800, but it took until 1930 toreach 2 billion. Agricultural pro-ductivity rose dramatically withthe introduction of mechanizedfarming and advances in fertiliza-tion and pest control. Althoughworld population acceleratedaround 1950, reaching about 6.5billion by 2005, agricultural pro-duction kept pace with the grow-ing population.
APPLICATION Applying Economic Concepts
D. How is Malthus’s population problem an example of the problem of scarcity?
Thomas Robert MalthusMalthus predicted a populationexplosion that would result inpoverty and famine.
ECONOMICS PACESET TER
Thomas RobertMalthus
Career: British economist
Born: February 17, 1766
Died: December 23, 1834
Major Accomplish-ment: Calling attentionto the issue of populationgrowth
Major Work: Essay onthe Principle of Population(1798, revised 1803)
Famous Quotation:“Population, whenunchecked, increases ingeometrical ratio. Subsis-tence increases only in anarithmetical ratio.”
Influenced:David RicardoCharles Darwin
FAST FACTS
FIGURE 12.16 MALTHUS’S POPULATION PROBLEM
ElapsedYears
Bushels ofWheat (inmillions)
Population(in millions)
Bushelsper Person
0 10 10 1.00
25 20 20 1.00
50 30 40 0.75
75 40 80 0.50
100 50 160 0.31
Find an update onThomas Robert Malthusat ClassZone.com

ClassZone.com
375
ECONOMICS IN PR ACTICE
SECTION 3 AssessmentREVIEWING KEY CONC EP TS
2. Name the key measurement of economic growth.
3. What four factors drive economic growth?
4. How are productivity and growth related?
5. Briefly explain the problem Malthus identified.
6. Using Your Notes Write apersuasive paragraph arguingone side or the other ofeconomic growth possibilities.Refer to your completedsummary chart.
Use the Graphic Organizerat Interactive Review @ ClassZone.com
7. Solving Economic Problems In 2000, the world’s populationwas about 6 billion, and about 800 million of those people didnot have enough to eat. By 2050, the world’s population isexpected to grow to about 9 billion. What steps should we takenow to avoid having more than 1 billion people without enoughto eat by 2050? Employ the ideas you learned about in thissection in formulating your solution.
8. Explaining an Economic Concept Why is real GDP per capitaa useful measure? Why couldn’t real GDP or GDP per capita beused for the same purpose?
9. Analyzing Cause and Effect Globalization opens internationalboundaries to companies, creating markets that stretch aroundthe world. What role might global competition play in thedevelopment of innovations?
10. Challenge Going to school is your job. Your product is increasingyour knowledge, and your grades are the main measure of this.Increasing your productivity would result in better grades—andmore free time. Adapt the factors that contribute to economicproductivity to explain how you might increase your productivityas a student.
Stimulating Economic GrowthGovernment policies affect economicgrowth. Some policies haveimmediate effects that last for a shorttime. Other policies take longer toshow results but have lasting impact.
Create a Healthy EconomyReflecting on what you learned inthis section, consider the followingpossible government actions.
• open a protected wilderness areafor coal mining
• increase funding for scholarshipsfor low-income students
• provide tax breaks for companiespurchasing new equipment
• strengthen laws protecting therights of inventors
Explain how each potential actionmight lead to economic growth.
Challenge Estimate the costs andthe benefits of each action. Whichactions would have the most lastingpositive effect on the economy?
1. Explain the differences between the terms in each of these pairs.
a. economic growthreal GDP per capita
b. capital deepeninglabor input
C RIT IC AL THINKING
What Is Economic
Growth?
A busy factory is one route toeconomic growth.

Find an update on this CaseStudy at ClassZone.com
376 Chapter 12
Case Study
Poland: Economic Freedomand Economic GrowthBackground Communists ruled Poland and controlled its economy from 1948to 1989. After holding its first free elections in 1990, Poland made rapid progresstoward full democracy and a free market economy. Economic reforms includedending government price controls, privatizing industries formerly controlled bythe government, and entering the international marketplace. As Poland movedaway from government control of the economy, it experienced a surge in economicgrowth—outdistancing many other former Communist countries in eastern andcentral Europe. In 2004, Poland became a member of the European Union, furtherincreasing its economic potential.
What’s the issue? How successful is Poland’s economy? Read these documentsto learn about the challenges and rewards of the country’s economic transition.
A.OnlineNewsArticle
Wroclaw, a city insouthwest Poland,offers one exampleof the country’ssuccess throughembracing globalcapitalism. Thisarticle describesthat phenomenon.
Wroclaw, Poland: Europe’sNext Appliance Capital?Appliance Manufacturers Pour into SouthwestPoland
Money and companies are pouring in—not just theprestige nameplates like Bombardier, Siemens, Whirlpool,Toyota, and Volvo, but also the network of suppliers thatinevitably follows them. At first, most of the new jobswere of the semi-skilled variety. Now they have beenfollowed by design and engineering work that aims totap into the largest concentration of university students inEastern Europe.
“Everyone is coming, and they are coming very fast,”reports Josu Ugarte . . . who heads the appliancemanufacturing operations here of Mondragon, the giantSpanish industrial cooperative. He predicts, confidently,that the region around Wroclaw will soon surpassNorthern Italy as Europe’s appliance capital. . . .
The secret isn’t just lower wages. It’s also the attitudeof workers who take pride and are willing to do what isnecessary to succeed, even if it means outsourcing partsproduction or working on weekends or altering vacationschedules. . . .
Source: “Europe’s Capitalism Curtain” WashingtonPost.com July 23, 2004
Thinking Economically How has Poland’s human capital contributed to thecountry’s economic growth?
Many manufacturershave opened factories inWroclaw, Poland. ThisVolvo factory producesbuses.

377Economic Indicators and Measurements
THINKING ECONOMICALLY Synthesizing
1. Which economic measurements and indicators are evident in documents A and C? Explain whatthey convey about the strengths and weaknesses of Poland’s economy.
2. What factors have driven Poland’s economic growth?
3. Compare documents A and C, written about six months apart. What continued economic trendsand new economic strengths do they describe?
B. PoliticalCartoon
Poland’s farmers weresceptical about thebenefits of EuropeanUnion membership.This cartoon reflectstheir change of heartas agricultural exportsincreased and theyreceived new subsidiesfrom the EuropeanUnion.
Thinking Economically Does the cartoon emphasize thefree market benefits of the European Union or other benefits?
Reaping the European Union HarvestHow the new central European members learnt to stop worrying andlove the European Union
After grumbling furiously about dangers to their sovereignty and their social values whenthey joined the European Union in May, Poles are discovering themselves now to beamong the Union’s most loyal citizens. Some three-quarters say they are happy with EUmembership—and no wonder. In its first eight months of membership Poland got some
2.5 billion [ is the euro, the currency of the European Union] ($3.4 billion) from the EUbudget, or roughly twice what it paid in, according to the newspaper Rzeczpospolita. Ruralincomes have risen by one-third for small farmers and two-thirds for big ones, reversingeight years of stagnation and decline, thanks to munificent EU subsidies and an influx offoreign buyers offering high prices for Polish meat and fruit.
Poland’s total exports rose by more than 30% in the first nine months of 2004, helpedby the abolition of customs formalities. EU rules have opened the skies to budget airlines,boosting tourist numbers by 20% last year. Higher-than-expected tax revenues have meantlower-than-expected budget deficits. . . .
Source: The Economist, January 8, 2005
Joining theEuropeanUnion broughttremendousgrowth to Poland’seconomy. Thisarticle explainssome of theelements that ledto the success.
Thinking Economically According to the document, how has membership in the EUhelped Poland’s economic growth?
C. MagazineArticle
Source: The Economist
Complete the following activity either on yourown paper or online at ClassZone.com
378 Chapter 12
CHAPTER 12 AssessmentREVIEWING KEY CONC EP TS
Review this chapter using interactiveactivities at ClassZone.com
aggregate demandaggregate supplybusiness cyclecapital deepeningcoincident indicatorsdepressiondisposable personal income (DPI)economic growthgross domestic product (GDP)gross national product (GNP)lagging indicatorsleading indicators
macroeconomic equilibriumnational income (NI)national income accountingnet national product (NNP)nominal GDPnonmarket activitiesper capita real GDPpersonal income (PI)real GDPrecessionstagflationunderground economy
1 , the market value of all goods and servicesproduced in a nation, is one of the key measure-ments used in 2 . 3 is especially useful becauseit gives the market value of all goods and servicescorrected for price level changes. Another veryuseful measurement is 4 , which shows theactual amount of money people have to spend.
The economy goes through regular changescalled the 5 . Economists watch 6 , such asbuilding permits issued and stock prices, topredict changes in the economy. Low points in theeconomy are usually self-correcting, but in timesof a 7 , such as the one that happened in the1930s, government intervention may be needed.
Several factors influence 8 , including anincrease in capital. 9 , an increase in the ratiobetween capital and labor, increases productivity,helping the economy grow. Economists use 10 , real GDP divided by whole population,
to distinguish an increase in population from ahigher level of economic output.
Choose the key concept that best completesthe sentence. Not all key concepts will be used.
Gross Domestic Product and Other Indicators(pp. 350–357)
1. What is the purpose of national incomeaccounting?
2. In what way is GDP a baseline for other economicindicators?
Business Cycles (pp. 358–367)
3. What do leading indicators say about the economy?
4. Explain how a business decision might have a rippleeffect that would tilt the economy on a new phaseof the business cycle.
Stimulating Economic Growth (pp. 368–377)
5. Explain how a country with few natural resourcescan still have economic growth.
6. What are the four key factors that influence economicgrowth?
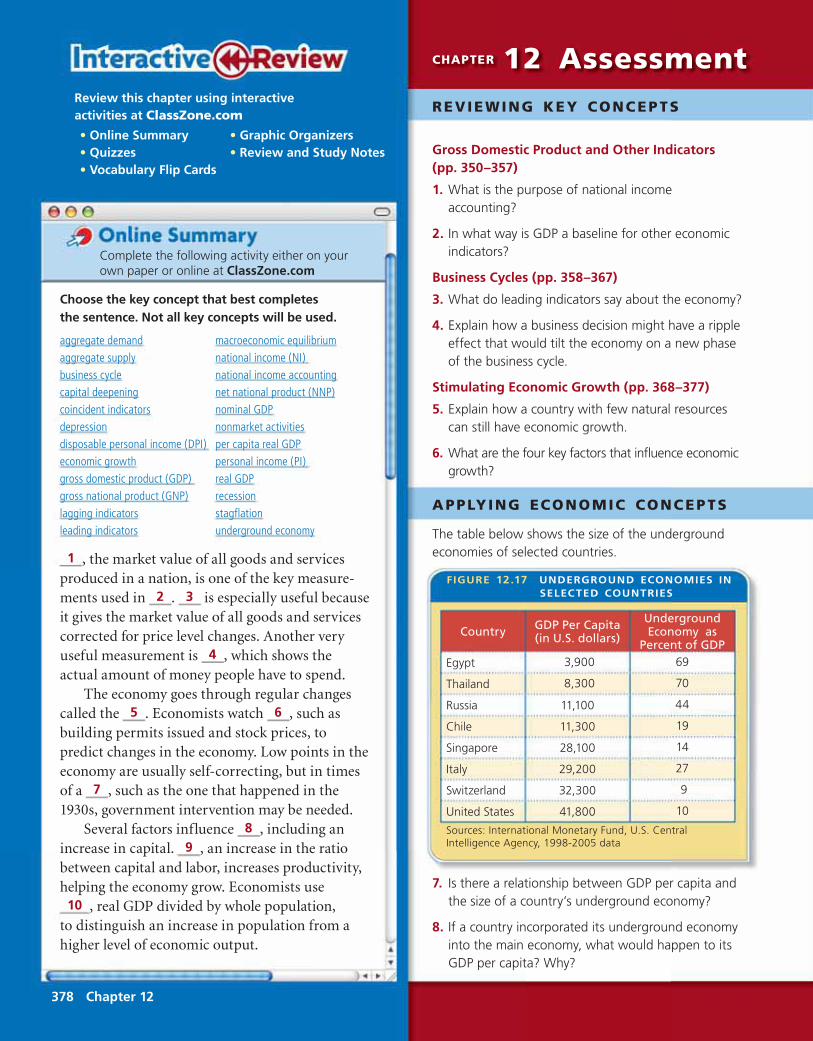
The table below shows the size of the undergroundeconomies of selected countries.
7. Is there a relationship between GDP per capita andthe size of a country’s underground economy?
8. If a country incorporated its underground economyinto the main economy, what would happen to itsGDP per capita? Why?
APPLYING ECONOMIC CONC EP TS
• Online Summary• Quizzes• Vocabulary Flip Cards
• Graphic Organizers• Review and Study Notes
FIGURE 12.17 UNDERGROUND ECONOMIES INSELECTED COUNTRIES
Country GDP Per Capita(in U.S. dollars)
UndergroundEconomy as
Percent of GDP
Egypt 3,900 69
Thailand 8,300 70
Russia 11,100 44
Chile 11,300 19
Singapore 28,100 14
Italy 29,200 27
Switzerland 32,300 9
United States 41,800 10
Sources: International Monetary Fund, U.S. CentralIntelligence Agency, 1998-2005 data

Economic Indicators and Measurements 379
S I M U L AT I O NC RIT IC AL THINKING
9. Creating Graphs Copy the blank graph onto yourown paper. Then use the data in the table to createa line graph showing the percent change in U.S. realgross domestic product from 1999 through 2003.
Use @ ClassZone.comto complete this activity.
10. Analyzing and Interpreting Data Which yearhad the highest growth? The lowest?
11. Analyzing Cause and Effect The governmentenacted tax cuts and issued child tax credit refundsin 2003. What component of GDP would likely haveincreased because of these?
12. Distinguishing Fact from Opinion Does the graphsupport or counter the idea that the September 11,2001 terrorist attacks caused a recession?
13. Challenge How could GDP grow by 5 percent ayear but leave the economy no better off—or evenworse off? Give two different explanations.
Surveying Consumer ConfidenceThe Consumer Confidence Survey is one poll usedto determine consumer expectations. Another is theABC/Washington Post Consumer Comfort Index, whichmakes 1,000 phone calls to adults each month and asksthe following questions:
• National Economy: “Would you describe the state ofthe nation’s economy these days as excellent, good, notso good, or poor?”
• Personal Finances: “Would you describe the stateof your own personal finances these days as excellent,good, not so good, or poor?”
• Buying Climate: “Considering the cost of things todayand your own personal finances, would you say now isan excellent time, a good time, a not so good time, or apoor time to buy the things you want and need?”
To understand the consumer comfort index better, takea survey of your class.
Step 1. Break into five small groups and discuss each ofthe questions. The point is to share your thoughts, notto debate who is right or wrong.
Step 2. Return to your desk and write down youranswers to each of the questions anonymously.
Step 3. Collect the anonymous answers from thewhole class. Have one person tabulate the answers toeach question on the board.
Step 4. Now calculate the consumer confidence of yourclass. For each question, add up the number of positiveresponses (either “excellent” or “good”). Then subtractthe number of negative responses (either “not so good”or “poor”). Divide by the total number of students andmultiply by 100.
Add the result from all three questions together, andthen divide by three. That will yield an overall comfortlevel. A level of 100 would mean everyone is satisfiedwith everything. A level of �100 would mean thateveryone felt negatively about everything.
Step 5. Discuss the result. Does it seem to accuratelyreflect the mood of the class? What would happen tothe nation’s GDP if all consumers felt as you do?
FIGURE 12.18 PERCENT CHANGE IN REAL GDP FROMPRECEDING PERIOD
Year and quarter
Perc
ent
chan
ge
–2.0
0
2.0
4.0
6.0
8.0
2001 2002 20031999 2000
Year Quarter 1 Quarter 2 Quarter 3 Quarter 4
1999 3.4 3.4 4.8 7.3
2000 1.0 6.4 –0.5 2.1
2001 –0.5 1.2 –1.4 1.6
2002 2.7 2.2 2.4 0.2
2003 1.7 3.7 7.2 3.6
Source: U.S. Bureau of Economic Analysis

380
Economic ChallengesThe national economy faces many challenges. Economics can help us understand and cope with these challenges.
CONCEPT REVIEW
Business cycle is the series of growing and shrinking periods ofeconomic activity, measured by increases or decreases in real grossdomestic product.
CHAPTER 13 KEY CONCEPT
Unemployment has a variety of causes. Some level ofunemployment is expected, even when an economy is healthy.
WHY THE CONCEPT MATTERS
As the nation’s economy goes through business cycles, it will facethe twin problems of unemployment and inflation. You may findyourself unemployed at some point during your working years, ifonly for a short period. For some people, persistent unemploymentleads to poverty. During periods of inflation, you may have a jobbut your wages may buy less.
CHAPTER
How did inflation in the 1970s affectpeople and businesses? See the CaseStudy on pages 404–405.
381Facing Economic Challenges
13
Go to INTERACTIVE REVIEW forconcept review and activities.
More at ClassZone.com
SECTION 1Unemployment
in Today’sEconomy
SECTION 2Poverty and
IncomeDistribution
SECTION 3Causes and
Consequencesof Inflation
CASE STUDYThe Effects ofInflation in the
1970s
Facing EconomicChallenges
Go to ECONOMICS UPDATE for chapterupdates and further information oninflation in the 1970s. (See Case Study,pp. 404–405.)
Go to SMART GRAPHER to completegraphing activities in this chapter.

1SECT ION
382 Chapter 13
OBJECT IVES KEY TERMS TAKING NOTES
As you read Section 1, complete a cluster diagram like the one below to record and organize what you learn about unemployment. Use the Graphic Organizer at Interactive Review @ ClassZone.com
In Section 1, you will
• explain how economists measure unemployment
• identify the different types of unemployment
• discuss the impact that unemployment has on the economy and on individuals
unemployment rate, p. 382
underemployed, p. 383
full employment, p. 383
frictional unemployment, p. 384
seasonal unemployment, p. 384
structural unemployment, p. 384
cyclical unemployment, p. 384
Measuring Unemployment
KEY CONCEPTS
During the economic downturn that started in 2007, companies in the United States laid off millions of workers. The impact of such decisions is far-reaching. Because the unemployed cannot buy as many goods and services as they did when they had a paycheck, other companies lose business. Some of those companies might lose so much revenue that they might also need to lay off workers. If businesses across the country decide to stop hiring or to cut back, the unemployment rate rises. The unemployment rate is the percentage of the labor force that is jobless and actively looking for work.
The Unemployment Rate
The civilian labor force, as you learned in Chapter 9, is made up of people over the age of 16 who are employed or actively looking and available for work. It does not include people in the military or those in schools, prisons, or other institutions. To determine the unemployment rate, the U.S. Bureau of Labor Statistics (BLS) surveys the labor
Unemployment in Today’s Economy
The unemployment rate is the percentage of the labor force that is job-less and looking for work.
QUICK REFERENCE
Unemployment
MeasuringUnemployment
Unemployment Job fairs allow people looking for work to meet with many potential employers.

2
4
6
8
10
1950 1955 1960 1965 1970 1975 1980 1985 1990 1995 2000 2005
Perc
ent
of
wo
rk f
orc
e
YearSource: U.S. Bureau of Labor Statistics
FIGURE 13.1 U.S. UNEMPLOYMENT RATE
383Facing Economic Challenges
force in 60,000 households each month. Workers over the age of 16 who are notworking but are able to work and who have looked for work sometime during theprevious four weeks are considered unemployed. The BLS then divides the numberof unemployed persons by the total number of workers in the civilian labor force toarrive at the unemployment rate. While very useful, the unemployment rate doesnot account for discouraged workers who have stopped looking for work. Nor doesit count the underemployed, those who work part-time when they want full-timeemployment or those who work at a job below their skill level. These include recentlylaid-off workers who may be in a temporary, lower-paying job.
Full Employment
Despite its name, full employment does not mean a zero unemployment rate. Instead,it means a level of unemployment in which none of the unemployment is caused bydecreased economic activity. Even in a healthy economy there is always some levelof unemployment. Sometimes people become unemployed when they relocate orwhen they leave one job to try to find another job that suits them better. Sometimesthe available jobs do not match up with the skills of the available workers. In otherwords, some amount of unemployment is inevitable.
Economists generally agree that an unemployment rate of four to six percentindicates full employment in the United States. In other countries, with differentlabor markets and economic policies, full employment may occur at higher or lowerrates of unemployment.
APPLICATION Explaining an Economic Concept
A. Explain why the unemployment rate is based on a country’s civilian labor force, notits entire population.
The underemployedare part-time workers whowant to work full-timeor people working belowtheir skill level.
Full employmentmeans no unemploymentcaused by decreasedeconomic activity.
QUICK REFERENCE
ANALYZE GRAPHS1. From 1950 to 2005, when was the unemployment rate the highest?
2. From 1950 to 2005, when was the unemployment rate the lowest? Find an update on theU.S. unemployment rateat ClassZone.com

384 Chapter 13
Types of Unemployment
KEY CONCEPTS
Economists pay attention not only to the unemployment statistics, but also to thereasons for unemployment. Economists recognize four types of unemployment:• Frictional unemployment, temporary unemployment experienced by people
changing jobs
• Seasonal unemployment, unemployment linked to seasonal work
• Structural unemployment, a situation where jobs exist but workers looking forwork do not have the necessary skills for these jobs
• Cyclical unemployment, unemployment caused by a part of the business cycle withdecreased economic activity
TYPE 1 Frictional Unemployment
Frictional unemployment refers to the temporary unemployment of workers movingfrom one job to another. The frictionally unemployed might include a parent whohas spent time at home raising children and decides to move back into the workforce; a magazine designer who leaves his job to seek work as a designer at a bookpublisher; or a recent college graduate who is looking for her first full-time job.Frictional unemployment is a reflection of workers’ freedom to find the work bestsuited for them at the highest possible wage. Economists consider frictional unem-ployment normal and not a threat to economic stability.
TYPE 2 Seasonal Unemployment
Demand for some jobs changes dramatically from season toseason, resulting in seasonal unemployment. Demand forconstruction workers, for example, typically falls in the wintermonths when construction activities are more difficult. Tourismpeaks at certain times of the year, and different regions havedifferent tourist seasons. Migrant farm workers, who movefrom one area to another following the growing schedules ofthe crops, are hard hit by seasonal unemployment. The wintermonths are especially slow, resulting in economic hardship formany migrant families.
TYPE 3 Structural Unemployment
Structural unemployment results when the available jobs donot match up well with the skills and experience of the avail-able workers. A dynamic economy will often create struc-tural unemployment as businesses become more efficient andrequire fewer workers to create the same amount of output.There are a number of possible triggers for structural unem-ployment. New technology can replace human workers or require workers to retrain.New industries requiring specialized education can leave less well-educated workers
Frictional unemploy-ment is temporaryunemployment of peoplechanging jobs.
Seasonal unemploy-ment is unemploymentlinked to seasonal work.
Structural unemploy-ment is when jobs existbut do not match the skillsof available workers.
Cyclical unemploy-ment is unemploymentcaused by a part ofthe business cycle withdecreased economicactivity.
QUICK REFERENCE
Seasonal UnemploymentDemand for lifeguards is highduring the warmer months.

385Facing Economic Challenges
out of work. A change in consumer demand—from compact discs to computermusic files, for example—can shift the type of workers needed. Offshore outsourcing,when jobs once held by Americans are staffed overseas, is another cause of struc-tural unemployment.
TYPE 4 Cyclical Unemployment
Cyclical unemployment results when the economy hits a low point in the businesscycle and employers decide to lay off workers. Workers who lose their jobs duringa recession can have trouble finding new jobs because the economy as a whole isscaling back, and the demand for labor declines. When the economy picks up again,many workers are again able to find jobs.
The duration of unemployment in these four types ranges widely, but the averageduration of unemployment is relatively short. More than a third of the unemployedare out of work for five weeks or less.
APPLICATION Making Inferences
B. If you owned a clothing factory, how would a high rate of unemployment affect yourbusiness?
CONNECTING ACROSS THE GLOBE
1. Synthesizing Economic Information Explain how outsourcing might change the American economy.
2. Evaluating What career do you want to pursue? Explain whether it has the potential to be outsourced.
Offshore Outsourcing: Scourge or Boon?Many American workers fear losing their jobs to offshoreoutsourcing—the contracting of work to suppliers in othercountries. But the likelihood of offshore outsourcing varieswidely from one occupation to the next. According to a reportissued by the McKinsey Global Institute in 2005, about 11percent of all service jobs in the United States have the potentialto be outsourced to another country. Jobs in informationtechnology, engineering, and accounting are much more likelyto be outsourced than jobs in health care, retail sales, and otherfields that require direct personal interaction.
The offshore outsourcing trend has created some structuralunemployment, as laid-off workers seek new jobs. But ultimately,it should make the U.S. economy more efficient. The firms thatsave money by outsourcing will be more competitive. As thesebusinesses grow, they will hire more U.S. workers.
For some U.S. workers, outsourcing may offer unique opportunities. India has been so successfulin securing business outsourced by other countries that it has a shortage of qualified labor. Becausemany jobs outsourced to India require workers to be fluent in English or European languages, onestudy predicts that 120,000 Europeans, Americans, and Australians will be working in India by 2010.
A GLOBAL PERSPECTIVEPERSPECTIVE
Office worker in India

386 Chapter 13
The Impact of Unemployment
KEY CONCEPTS
Although some unemployment is unavoidable, excessive or persistent unemploy-ment hurts the economy in several ways. It reduces efficiency; it hurts the leasteconomically secure; and it damages workers’ self-confidence.
Efficiency Unemployment is inefficient. It wastes human resources, one of the keyfactors of economic growth.
Inequality Unemployment does not follow equal opportunity rules. In an economicslowdown, those with the least experience lose their jobs first—usually minoritiesand the young (see the graphs below). Also, with fewer jobs available, people on thelower rungs of the employment ladder have less opportunity to advance.
Discouraged Workers People who are unemployed—or underemployed—for longperiods of time may begin to lose faith in their abilities to get a job that suits theirskills. Potentially productive workers may give up their search for work. If they areunderemployed, they may not be motivated to do their best work.
APPLICATION Writing About Economics
C. In 1889, Jane Addams founded the Hull House Association in Chicago to help newlyarrived immigrants adjust to the challenges of city life. In 1910, she wrote that “of allthe aspects of social misery nothing is so heartbreaking as unemployment.” Write aparagraph explaining the impact of unemployment on immigrants.
0
2
4
6
8
10
12
14
16
18
20
Perc
ent
of
wo
rk f
orc
e
20 to 24years
Source: U.S. Bureau of Labor Statistics, 2005 data
25 to 34years
16 to 19years
35 to 44years
45 to 54years
55 to 64years
65 andolder
FIGURE 13.2 UNEMPLOYMENT RATESBY AGE
0
2
4
6
8
10
12
14
16
18
20
Perc
ent
of
wo
rk f
orc
e
Hispanic
Source: U.S. Bureau of Labor Statistics , 2005 data
White
Black
Asian
FIGURE 13.3 UNEMPLOYMENT RATESBY RACE
ANALYZE GRAPHS1. Which group, either age or race, has the highest rate of unemployment?
2. What happens to the unemployment rate as people get older?
3. If the majority of people aged 65 and older are retired, why is the unemployment rate forthat group so low?

ClassZone.com
387Facing Economic Challenges
ECONOMICS IN PR ACTICE
SECTION 1 AssessmentREVIEWING KEY CONC EP TS
2. Explain how the unemployment rate is calculated.
3. Why are economists interested in the unemployment rate?
4. Name a job that might be affected by structural unemployment.Explain why it might be affected.
5. What is full employment?
6. Using Your Notes Writea brief summary of thissection, covering measuringunemployment, types ofunemployment, and theimpact of unemployment. Refer to your completed cluster diagram.
Use the Graphic Organizer at Interactive Review @ ClassZone.com
7. Solving Economic Problems Unemployment insurance providesmoney to workers who have lost their jobs through no fault oftheir own. In most states, the insurance is funded entirely byemployers. What else might business and government do to helpunemployed workers?
8. Analyzing Cause and Effect In June 2005, claims forunemployment insurance in Illinois from construction workersmade up about 14 percent of all claims. In December 2005,they made up about 21 percent. Why might more constructionworkers file for unemployment benefits in December than inJune? What type of unemployment best explains the difference?
9. Applying Economic Concepts Give specific examples from theGreat Depression of the 1930s of ways in which the widespreadunemployment (1) affected efficiency, (2) was distributedunequally, and (3) eroded self-esteem.
10. Challenge Think about the type of career you hope to havewhen you are finished with your education. Do you think it ismore likely or less likely than others to be affected by each of thevarious types of unemployment? Explain each of your answers.
Identifying Types ofUnemploymentRead the following descriptions ofunemployment scenarios.
Categorize EconomicInformation Decide which of thefour types of unemployment eachscenario describes.
• Because of reduced demand, anappliance company temporarilycloses one of its factories and laysoff workers.
• In September, a part-time studentat the University of Central Floridain Orlando loses his job at a themepark.
• A newspaper journalist leaves herjob to make a switch into televisionjournalism. She has been lookingfor a new job for several months.
• A local travel agency has to closedown because of the widespreadavailability of direct online bookingoptions.
Challenge Young people are twoto three times more likely than olderpeople to be unemployed. Why is this?
1. Explain the relationship between the terms in each of these pairs.
a. frictional unemploymentstructural unemployment
b. seasonal unemploymentcyclical unemployment
Unemployment
MeasuringUnemployment
C RIT IC AL THINKING

2SECT ION
388 Chapter 13
OBJECT IVES KEY TERMS TAKING NOTES
As you read Section 2, completea summary chart like the onebelow to pull together the mostimportant ideas about povertyand income distribution. Use theGraphic Organizer at InteractiveReview @ ClassZone.com
In Section 2, you will
• explain how economistsmeasure poverty
• discuss the causes of poverty
• describe how economistsmeasure income inequality
• identify what antipovertyprograms are available
poverty, p. 388
poverty threshold, p. 388
poverty rate, p. 389
income distribution, p. 390
income inequality, p. 390
Lorenz curve, p. 391
welfare, p. 392
workfare, p. 393
What Is Poverty?
KEY CONCEPTS
Persistent unemployment sometimes leads to poverty, a situation in which aperson lacks the income and resources to achieve a minimum standard of living.This minimum standard varies from country to country because different countrieshave different ways of life. Someone who herds sheep and lives in a hut would prob-ably be considered poor in the United States. But such a person might be thought tohave a comfortable life in some other countries. Because of such disparities, there isno universal standard for what constitutes poverty.
The U.S. government has established its own standard for poverty based onincome levels. This poverty threshold is the official minimum income needed forthe basic necessities of life in the United States.
The Poverty Threshold
The poverty threshold, also called the poverty line, is the amount of income thegovernment has determined to be necessary for meeting basic expenses. People withincomes below that threshold are considered to live in poverty. The threshold, firstformulated in the early 1960s, was calculated by finding the cost of nutritionallysound food and then multiplying by three, on the assumption that food costs areabout a third of a person’s expenses.
The threshold differs according to the size of the household and is adjustedannually to reflect changing prices. In 2005, the poverty threshold for a family offour in the United States was about $20,000. That same year, the median income fora family of four was over $65,000.
Poverty and IncomeDistribution
Poverty is the condi-tion where a person’sincome and resourcesdo not allow him or herto achieve a minimumstandard of living.
Poverty thresholdis the minimum incomeneeded to pay for thebasic expenses of living.
QUICK REFERENCE
What IsPoverty?

Find an update on theU.S. poverty rate atClassZone.com
389Facing Economic Challenges
The Poverty Rate
The poverty rate is the percentage of people living in households that have incomesbelow the poverty threshold. Unlike the unemployment rate, the poverty rate isbased on the population as a whole. Through census information, the poverty ratecan be estimated for individuals, households, or specific segments of the population,such as African-American children or single-parent households.
The overall poverty rate in the United States declined between 1993 and 2000 to alow of 11.3 percent. It began to rise in 2000 and by 2004 had climbed to 12.7 percent,with 37 million people living below the poverty line. (See Figure 13.4.)
Poverty, like unemployment, does not hit all sectors of society equally. Childrenare especially at risk. Children made up more than half of the 1.3 million increasein the number of people living in poverty between 2002 and 2003. The number offamilies below the poverty line that are headed by a single mother also rose. Minoritiesand families that live in either an inner city or a rural area tend to have higher thanaverage poverty rates. While the numbers tell the statistical story of poverty, onlypersonal voices can convey the toll of being poor. James Baldwin, an African-Americanwriter born in poverty, wrote that “anyone who has ever struggled with povertyknows how extremely expensive it is to be poor.”
APPLICATION Drawing Conclusions
A. Why is the poverty rate based on the entire population, while the unemployment rateis based on the civilian work force?
QUICK REFERENCE
The poverty rate isthe percentage of peopleliving in households thathave incomes below thepoverty threshold.
Source: U.S. Census Bureau
0
5
10
15
20
25
Perc
ent
of
tota
l po
pu
lati
on
1960 1965 1970 1975 1980 1985 1990 1995 2000 2005
FIGURE 13.4 U.S. POVERTY RATE, 1959–2004
ANALYZE GRAPHS1. From 1959 to 2004, when was the poverty rate the highest? When was it lowest?
2. What decade saw the largest drop in the rate of poverty?

390 Chapter 13
The Problem of Poverty
KEY CONCEPTS
Across the globe, about half of the world’s 6 billion people live in poverty. In theUnited States, one of the world’s wealthiest countries, almost 40 million peoplelive below the poverty level. Even good economic times, such as the boom that theUnited States experienced in the 1990s, do little to move large numbers of people outof poverty. Why is an adequate income out of reach for so many people?
Factors Affecting Poverty
Four major factors have the strongest influence on who lives in poverty in the UnitedStates: education, discrimination, demography, and changes in the labor force.
Education As you learned in Chapter 9, usually there is a direct relationship betweenlevel of education and income: the higher the level of education, the higher theincome. In the United States, the poverty rate of people who did not complete highschool is 12 times higher than that of people with a college education.
Discrimination White males tend to have higher incomes than racial minorities andwomen, even when there are no differences in education or experience. Certain groupssometimes face wage discrimination or occupational segregation and may find itdifficult to move beyond low-paying jobs. Government initiatives, as well as thepressures of the competitive marketplace, have helped to reduce job discrimination.
Demographic Trends In the 1950s, about one-fourth of all marriages ended indivorce. Now, almost half of all marriages end in divorce. Over the same period,births to unmarried mothers jumped from about 5 percent of all births to over 30percent. Such demographic trends lead to higher poverty rates because single-parentfamilies are more likely to have economic problems than two-parent families.
Changes in the Labor Force The shift in the labor force from mainly manufacturingto mainly service industries is one of the changes that affects the distribution ofpoverty. When manufacturing jobs were plentiful, even relatively low-skilled workerswere able to earn a good wage. As the jobs shifted from manufacturing to service,the wages did not always follow. Workers in many service jobs, such as fast-foodclerks, tend to earn lower wages than similarly skilled workers in manufacturing.
Income Distribution
The United States has one of the highest median family incomes in the world, yetmillions of Americans live below the poverty line. This disparity is reflected in thecountry’s income distribution, the way income is divided among people in a nation.
All countries have some degree of income inequality, an unequal distribution ofincome. Unless everyone earns the same amount, there will always be a differencebetween the incomes of the wealthiest citizens and those of the poorest. Comparedto other advanced nations, the United States has relatively high income inequality.However, less advanced countries tend to have the most extreme differences betweenwhat the rich earn and what the poor earn.
Income distributionis the way income isdivided among people.
Income inequality isthe unequal distributionof income.
QUICK REFERENCE

391Facing Economic Challenges
A Lorenz curve graphically illustrates the degree of income inequality in anation. The Lorenz curve in Figure 13.5, for example, plots income distribution inthe United States. If income were distributed equally, then 20 percent of the populationwould receive 20 percent of the income, 40 percent would receive 40 percent, and soon. That distribution would be represented with a diagonal line.
However, income is not equally divided. The Lorenz curve in Figure 13.5 showsthat the lowest 20 percent of the population (Group 1) receives only about 3.4 percentof the nation’s total income. The lowest 40 percent (Group 2)—which includes thelowest 20 percent plus the next 20 percent—receive about 12.1 percent of the nation’stotal income. The more the Lorenz curve dips away from the diagonal line of equality,the greater the level of income inequality.
In the United States, the income gap between the lower 80 percent of the popu-lation and the top 20 percent grew steadily throughout the late 1900s. In 1970, therichest 20 percent of Americans earned on average 9 times more than the poorest.By 1997, they were earning 15 times more. Households are not stuck in one group.When people gain experience and education, their incomes tend to increase. Whenthey retire or make poor economic decisions, their incomes decrease.
APPLICATION Applying Economic Concepts
B. In 2004, the richest 20 percent of households in the United States received about 50percent of the nation’s income. Based on that proportion, if $100 was shared amongfive people, how much would the richest one receive? How much would each of theother four get if they shared the rest equally?
0
20
40
60
80
100
20 40 60 80 100
GROUP 1
GROUP 2
GROUP 3
GROUP 4
GROUP 5
3.412.1
26.8
50.0
Cumulative percent of households
Cu
mu
lati
ve p
erce
nt
of
inco
me
FIGURE 13.5 INCOME DISTRIBUTION INTHE UNITED STATES
Source: U.S. Census Bureau, 2004 data
ANALYZE GRAPHS1. According to the graph, about how much of the total income in the United
States is earned by the lowest 60 percent of households?
2. How would the graph change if the lower groups earned a greater percent of thenation’s total income?
a If income were evenlydivided, a line of incomeequality would result.
b The actual income distri-bution is reflected by theLorenz curve.
c Each point reflects thecumulative income ofthat cumulative percentof households.
c
a
Lorenz curve is a curvethat shows the degreeof income inequality in anation.
QUICK REFERENCE
b

392 Chapter 13
Antipoverty Programs
KEY CONCEPTS
In 1964, in his first State of the Union Address, President Lyndon Johnson pledged:“This administration today, here and now, declares unconditional war on poverty inAmerica.” Johnson’s antipoverty programs were among many that the U.S. govern-ment has tried in an effort to close the income gap. These programs are often referredto as welfare, government economic and social programs that provide assistance tothe needy. Some of these programs, however, have been criticized for wasting govern-ment funds and for harming rather than helping the recipients. During the 1980s and1990s, the government changed its approach, and it now uses tax breaks, grants, jobtraining, and other “self-help” initiatives in addition to cash benefits.
Programs for Low-Income Households
The national food stamp program, which was established by the Food Stamp Actof 1964, helps ensure that no one will go hungry. Qualifying individuals and familiesreceive electronic benefit transfers, which have replaced the paper food stampsthat had been used originally. Recipients are given a card tied to an account intowhich the government makes monthly deposits of food benefits. The card can be
used only to purchase food at grocery stores. Since 1975, thenumber of food stamp recipients has f luctuated from yearto year from about 16 million to about 27 million. In 2005,almost 26 million people participated in the program.
The Medicaid program is another antipoverty measure forlow-income households. Medicaid offers health care for thepoor and is funded by both the federal and state governments.The expense to each state is often as much as 25 percent ofthe state budget. Medicaid is the only health care coverage forabout 40 million Americans, nearly half of them children.
Another antipoverty program is the earned-incometax credit. This program provides the working poor arefund of payroll taxes and other taxes deducted from theirpaychecks. About 21 million people received these credits in2004. One benefit of the program is that the money refundedto the recipients generally gets spent in their own commu-nities. This spending helps to boost the economies of poorneighborhoods.
General Programs
The U.S. government’s Social Security program—which pays benefits to retirees,survivors, and the disabled—is the largest government program in the world. In theyear 2004 alone, it paid out $500 billion, and that amount is expected to increase aspeople born during the baby boom after World War II reach retirement age. It wasestablished in 1935 by the Social Security Act.
Welfare is governmenteconomic and socialprograms that provideassistance to the needy.
QUICK REFERENCE
Food Stamps The foodstamp program helps thosewith low incomes to buygroceries.

393Facing Economic Challenges
The Social Security program is funded through a special payroll tax. At retire-ment, all workers—rich and poor alike—are entitled to monthly checks to help withliving expenses. Another payroll tax helps to fund Medicare, a government healthinsurance program for seniors. Medicare became part of the Social Security programin 1965. These benefits have been key in reducing the number of older Americansin poverty. From 1960 to 1995, the poverty rate of those aged 65 and over fell fromabout 35 percent to about 10 percent.
The Social Security Act also established a system of unemployment insuranceadministered through state governments. People who lose their jobs through nofault of their own are eligible to receive income while they look for work. Each stateadministers its own unemployment insurance program. Most of the programs arefunded by taxes paid by employers, but in a few states employees contribute too.These benefits, which usually last no more than 26 weeks, help people avoid financialproblems while they seek new employment.
Other Programs
Other antipoverty programs supplement the largestprograms. One is the Community Services BlockGrant program, which provides blocks of federalmoney to local communities to address such issuesas employment, education, and housing. Job trainingis another. One such program provides grants tocommunity colleges to develop training for high-tech, high-growth jobs. Another way to providejobs for the unemployed and at the same timeboost the economy of a struggling neighborhoodis through Empowerment Zones. The governmenttries to attract businesses to these specially desig-nated neighborhoods by not charging them certaintaxes. Businesses that operate in EmpowermentZones provide needed services and offer employ-ment opportunities to area residents.
In 1996, the federal welfare program under-went substantial revision in a series of changes often referred to as welfare-to-work.These changes included new incentives for working, which older welfare programsoften did not provide. Workfare, for example, is a program that requires welfarerecipients to do some kind of work in return for their benefits. Their work providesa useful service and also helps prepare the workers for future jobs. Direct financialaid, now called Temporary Assistance for Needy Families (TANF), now has a limitof five years.
APPLICATION Explaining an Economic Concept
C. In terms of government spending, what is a fundamental difference between the foodstamp program and the Empowerment Zone initiative?
Workfare is a programthat requires welfarerecipients to do some kindof work.
QUICK REFERENCE
Job Training Job training helps unemployed people tolearn new skills.
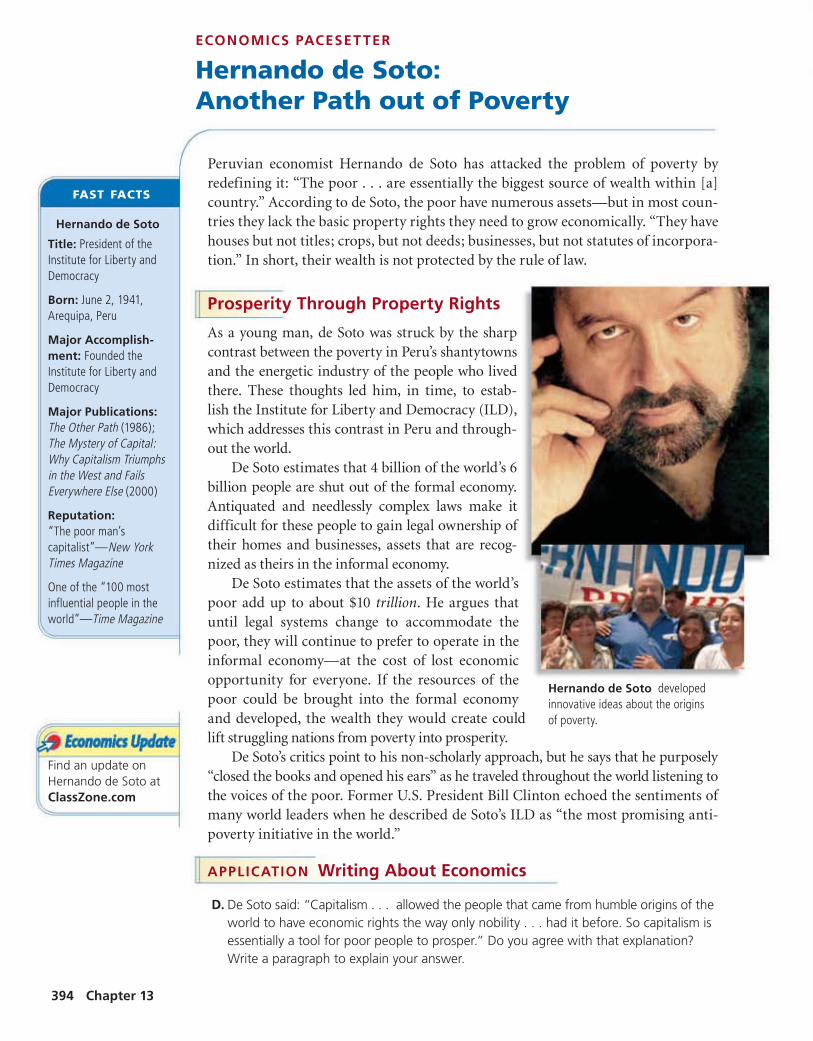
Find an update on Hernando de Soto at ClassZone.com
394 Chapter 13
ECONOMICS PACESET TER
Hernando de Soto: Another Path out of Poverty
Peruvian economist Hernando de Soto has attacked the problem of poverty by redefining it: “The poor . . . are essentially the biggest source of wealth within [a] country.” According to de Soto, the poor have numerous assets—but in most coun-tries they lack the basic property rights they need to grow economically. “They have houses but not titles; crops, but not deeds; businesses, but not statutes of incorpora-tion.” In short, their wealth is not protected by the rule of law.
Prosperity Through Property Rights
As a young man, de Soto was struck by the sharp contrast between the poverty in Peru’s shantytowns and the energetic industry of the people who lived there. These thoughts led him, in time, to estab-lish the Institute for Liberty and Democracy (ILD), which addresses this contrast in Peru and through-out the world.
De Soto estimates that 4 billion of the world’s 6 billion people are shut out of the formal economy. Antiquated and needlessly complex laws make it difficult for these people to gain legal ownership of their homes and businesses, assets that are recog-nized as theirs in the informal economy.
De Soto estimates that the assets of the world’s poor add up to about $10 trillion. He argues that until legal systems change to accommodate the poor, they will continue to prefer to operate in the informal economy—at the cost of lost economic opportunity for everyone. If the resources of the poor could be brought into the formal economy and developed, the wealth they would create could lift struggling nations from poverty into prosperity.
De Soto’s critics point to his non-scholarly approach, but he says that he purposely “closed the books and opened his ears” as he traveled throughout the world listening to the voices of the poor. Former U.S. President Bill Clinton echoed the sentiments of many world leaders when he described de Soto’s ILD as “the most promising anti-poverty initiative in the world.”
APPLICATION Writing About Economics
D. De Soto said: “Capitalism . . . allowed the people that came from humble origins of the world to have economic rights the way only nobility . . . had it before. So capitalism is essentially a tool for poor people to prosper.” Do you agree with that explanation? Write a paragraph to explain your answer.
Hernando de Soto
Title: President of the Institute for Liberty and Democracy
Born: June 2, 1941, Arequipa, Peru
Major Accomplish-ment: Founded the Institute for Liberty and Democracy
Major Publications: The Other Path (1986); The Mystery of Capital: Why Capitalism Triumphs in the West and Fails Everywhere Else (2000)
Reputation: “The poor man’s capitalist”—New York Times Magazine
One of the “100 most influential people in the world”—Time Magazine
FAST FACTS
Hernando de Soto developed innovative ideas about the origins of poverty.

ClassZone.com
395Facing Economic Challenges
ECONOMICS IN PR ACTICE
SECTION 2 AssessmentREVIEWING KEY CONC EP TS
1. Explain the relationship between the terms in each of these pairs.
Understanding World PovertyDifferent parts of the world havedifferent levels of poverty.
Analyze and Interpret Data Usethe information in the table toanswer these questions.
1. The table uses a poverty thresholdof living on less than $2 a day. Whydoesn’t North America appear?
2. China has a population of about 1.3billion people. About how many ofthem, in millions, live in poverty?
Challenge Do the same factors thataffect poverty in the United Statesapply to the rest of the world?
7. Making Inferences and Drawing Conclusions A number ofantipoverty programs are targeted specifically at children:
• State Children’s Health Insurance Program (SCHIP) provideshealth insurance to low income children who do not qualify forMedicaid and have no health insurance
• National School Lunch Program provides free or reduced pricelunches to eligible children
• School Breakfast Program provides cash to schools for offeringbreakfasts to more than 8 million children nationally
What are the economic benefits of antipoverty programs aimedat children?
8. Solving Economic Problems Antipoverty programs in theUnited States are least effective for immigrant families and fornon-elderly people without children. Why might this be so?
9. Analyzing Cause and Effect How does the earned income taxcredit aid both the working poor and their communities?
10. Challenge In 2005, the poverty threshold for a family of fourwas an annual income of just over $19,800. Based on thisincome, devise a monthly budget for a family of four. Assumethat no taxes or payroll deductions will reduce the family’sincome. Also assume that the family lives in an apartmentthat costs $700 per month. Provide a detailed account of yourestimated allowances for food, clothing, and other expenses.
2. Why is it difficult to determine a universal poverty threshold?
3. What groups are especially hard hit by poverty?
4. What four factors help explain the distribution of poverty?
5. What does the Lorenz curve show?
6. Using Your Notes Describefive different antipovertyprograms and the problemseach combats. Refer to yourcompleted summary chart.
Use the Graphic Organizer at Interactive Review @ ClassZone.com
a. poverty thresholdpoverty rate
c. welfareworkfare
b. income distributionincome inequality
FIGURE 13.6 PERCENT OFPOPULATION INPOVERTY
C RIT IC AL THINKING
Region Percent
Sub-Saharan Africa 75
South-Central Asia 75
World 53
China 47
North Africa 29
Latin America / Caribbean 26
Eastern Europe 14
Source: World Bank, 2004 data
What IsPoverty?
Food aid from the United States and othernations assists those in extreme poverty.
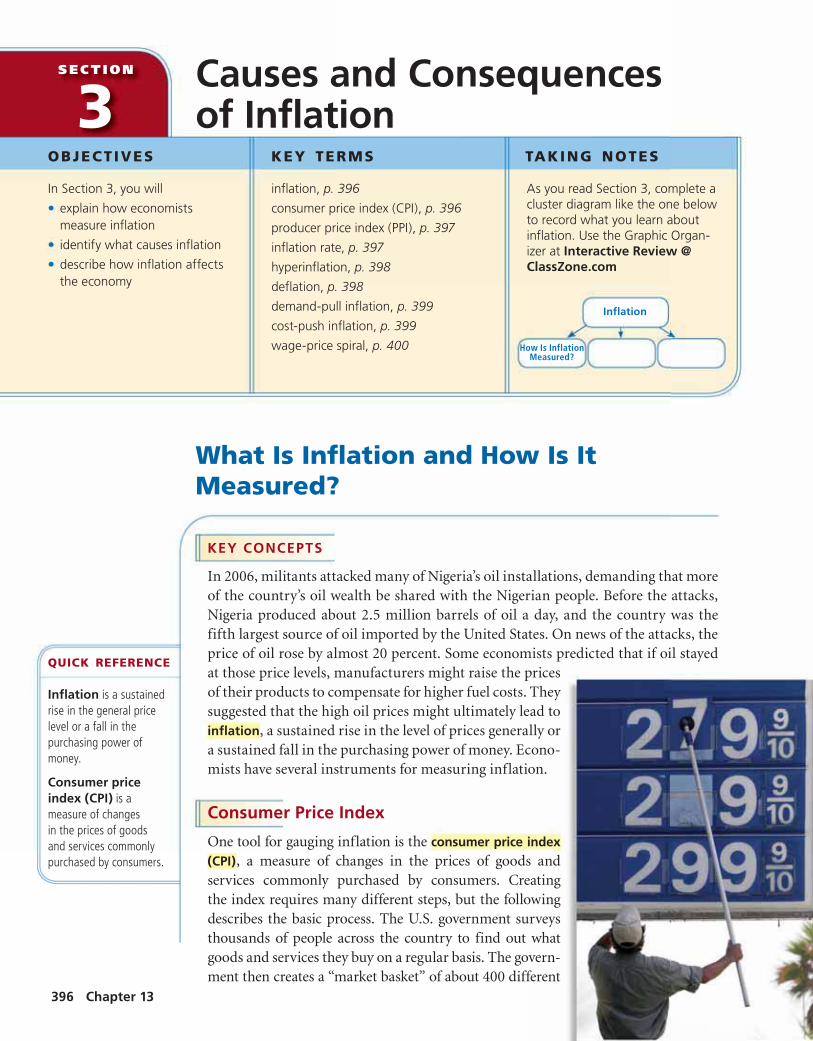
3SECT ION
396 Chapter 13
OBJECT IVES KEY TERMS TAKING NOTES
As you read Section 3, complete acluster diagram like the one belowto record what you learn aboutinflation. Use the Graphic Organ-izer at Interactive Review @ClassZone.com
In Section 3, you will
• explain how economistsmeasure inflation
• identify what causes inflation
• describe how inflation affectsthe economy
inflation, p. 396
consumer price index (CPI), p. 396
producer price index (PPI), p. 397
inflation rate, p. 397
hyperinflation, p. 398
deflation, p. 398
demand-pull inflation, p. 399
cost-push inflation, p. 399
wage-price spiral, p. 400
What Is Inflation and How Is ItMeasured?
KEY CONCEPTS
In 2006, militants attacked many of Nigeria’s oil installations, demanding that moreof the country’s oil wealth be shared with the Nigerian people. Before the attacks,Nigeria produced about 2.5 million barrels of oil a day, and the country was thefifth largest source of oil imported by the United States. On news of the attacks, theprice of oil rose by almost 20 percent. Some economists predicted that if oil stayedat those price levels, manufacturers might raise the pricesof their products to compensate for higher fuel costs. Theysuggested that the high oil prices might ultimately lead toinflation, a sustained rise in the level of prices generally ora sustained fall in the purchasing power of money. Econo-mists have several instruments for measuring inflation.
Consumer Price Index
One tool for gauging inflation is the consumer price index
(CPI), a measure of changes in the prices of goods andservices commonly purchased by consumers. Creatingthe index requires many different steps, but the followingdescribes the basic process. The U.S. government surveysthousands of people across the country to find out whatgoods and services they buy on a regular basis. The govern-ment then creates a “market basket” of about 400 different
Causes and Consequencesof Inflation
Inflation is a sustainedrise in the general pricelevel or a fall in thepurchasing power ofmoney.
Consumer priceindex (CPI) is ameasure of changesin the prices of goodsand services commonlypurchased by consumers.
QUICK REFERENCE
Inflation
How Is InflationMeasured?

397Facing Economic Challenges
goods and services purchased by a typical household. The basket is adjusted to accountfor how much of a household’s budget goes to purchase each type of item. For example,families tend to spend more on food than on lawn care, so the market basket is balancedto reflect this.
Each month, government workers research the current prices of the items in themarket basket. What consumers spend to fill the basket can then be compared to pricesin the reference base, which reflects the level of prices in the three years 1982 to 1984. Thosenumbers are given the value of 100. See the Connect to Math sidebar for more information.
Producer Price Index
The CPI shows the level of inflation experienced by consumers, but producers alsoexperience inflation. The tool that gauges that kind of inflation is the producer price
index (PPI), a measure of changes in wholesale prices. The PPI is constructed inroughly the same way as the CPI, but it reflects the prices producers receive fortheir goods rather than the prices consumers pay. The difference between consumerprices and producer prices lies in all the additional fees consumers pay, such as salestaxes or shipping charges. Like the CPI, the PPI is tied to a reference base of producerprices. More than 10,000 PPIs for individual products and groups of products areavailable. The indices are grouped either by stage of production (finished goods,intermediate goods, and raw materials, for example) or by industry. Index changesfrom period to period are calculated in the same general way as the CPI.
Because producers tend to encounter inflation before consumers, PPI tends tolead CPI as an indicator of inflation. Economists use CPI and PPI to calculate theinflation rate, the rate of change in prices over a set period of time.
Producer price index(PPI) is a measure ofchanges in wholesaleprices.
Inflation rate is therate of change in pricesover a set period of time.
QUICK REFERENCE
Source: U.S. Bureau of Labor Statistics
Ind
ex (
1982
to
198
4 1
00)
Year1970 1975 1980 1985 1990 1995 2000 2005
FIGURE 13.7 U.S. CONSUMER PRICE INDEX
20
40
60
80
100
120
140
160
180
200
ANALYZE CHARTS1. If you paid $500 to fill the market basket in 1984, about how much would you
pay to fill the basket in 2005?
2. Prices doubled from 1971 to 1980. How long did it take them to double againafter 1980?
Find an update about theU.S. consumer price indexat ClassZone.com
Suppose the originalvalue of the marketbasket was $500 andthe current year’s value is$550. To determine CPI,you divide the new valueby the original value andmultiply by 100. Thecurrent CPI, then, is 110.
$550 / $500 x 100 = 110
CONNECT TO MATH

398 Chapter 13
Types of Inflation
The different types of inflation are defined according to the degree or level of theinflation rate. Rates below 1 percent are negligible, and those between 1 and 3 percentare moderate. If a moderate rate continues over a period of time, the result is creepinginflation. A rapid increase in price level is known as galloping inflation. If gallopinginflation gets out of hand, the result is hyperinflation—a rapid, uncontrolled rate ofinflation in excess of 50 percent per month. One of the most dramatic episodes ofhyperinflation happened in Germany in 1922 and 1923. At the height of the crisis,prices rose at a rate of about 322 percent per month. Deflation, a decrease in thegeneral price level, happens more rarely. The Great Depression of the 1930s in theUnited States was marked by deflation.
APPLICATION Applying Economic Concepts
A. If the price of milk goes up, is that inflation? Why or why not?
Calculations for Year C
To calculate the rate of inflation, economists evaluatethe prices of many different goods. This hypotheticalexample uses a simplified market basket consistingof prices for milk, bread, and juice. The table showsthat the prices of milk and bread increased from YearB to Year C, but the price of juice decreased. To seethe general trend in prices, you must look at the totalprice of the market basket of milk, bread, and juice.The steps below show how to use this simplifiedmarket basket to calculate the rate of inflation forYear C. The base year is Year A.
Step 1: Calculate each year’s consumer priceindex (CPI).
Step 2: Use the CPI to calculate the rate of inflation.
The rate of inflation in Year C was about 4.5 percent.
Choosing a market basket To calculate the rate of inflation, economists use acomplicated market basket of hundreds of goods. The market basket is intended torepresent the goods that are purchased by a typical urban consumer.
MATH CHALLENGE
F I G U R E 13.8 Calculat ing the Rate of Inf lat ion
Price of a Market Basket
Year A Year B Year C
1 gallonmilk
$2.50 $2.40 $2.60
1 loaf bread $1.00 $1.35 $1.53
1 gallonjuice
$2.00 $2.30 $2.20
Price ofbasket
$5.50 $6.05 $6.33
CPI, base:Year A 100 110 115
Hyperinflation is arapid, uncontrolled rate ofinflation in excess of 50percent per month.
Deflation is a decreasein the general price level.
QUICK REFERENCE
Price of market basket
Price of basket in base year× 100 = CPI
$6.33× 100 = 115
$5.50
CPI − CPI for preceding year
CPI for preceding year× 100 = Rate of Inflation
115 − 110× 100 = 4.5
110

399Facing Economic Challenges
What Causes Inflation?
KEY CONCEPTS
Economists generally distinguish between two kinds of inflation, each with a differentcause. When the inflationary forces are on the demand side of the economy, theresult is demand-pull inflation, a situation where total demand is rising faster thanthe production of goods and services. When the forces that lead to inflation origi-nate on the supply side of the economy, the result is cost-push inflation, a situationwhere increases in production costs push up prices.
Demand-Pull Inflation
In demand-pull inflation, total demand rises faster than the production of goodsand services, creating a scarcity that then drives up prices. Suppose, for example,that consumers gain confidence in the economy and decide they want to buy moredurable goods—new refrigerators, stoves, second cars, and so on. It takes producerssome time to recognize this rise in demand and to gear up for higher production.During this lag period, consumer demand pushes up prices on the currently avail-able goods. Figure 13.9 illustrates how demand-pull inflation happens.
As you will learn in Chapter 16, the U.S. government creates and controls moneythrough the Federal Reserve Bank. If the government creates too much money duringthe lag period before an increase in production makes more goods available, therewill be too much money chasing too few goods, and prices will rise. The creation ofexcess money is the main reason for demand-pull inflation.
Demand-pull infla-tion results when totaldemand rises faster thanthe production of goodsand services.
Cost-push inflationresults when increases inthe costs of productionpush up prices.
QUICK REFERENCE
F I G U R E 13.9 Demand-Pull Inflation
ANALYZE CHARTS1. In the first scenario, did the demand curve shift or the supply curve?
2. In the second scenario, which curve shifts when the supply of money increases?
$20$15
$10
$15
Consumers demandmore of a product
Producers are slowto respond
Prices rise
Government createsmore money
Consumers havemore money to spend
Prices rise

400 Chapter 13
Cost-Push Inflation
In cost-push inflation, prices are pushedupward by rising production costs. Whenproduction costs increase, producers makeless of a profit. If consumer demand is strong,producers may raise their prices in order tomaintain their profits. A general trend ofrising prices leads to inflation.
Cost-push inflation is often the result ofsupply shocks—sharp increases in prices ofraw materials or energy. For example, in 1973and 1974, many members of the Organizationof Petroleum Exporting Countries (OPEC)limited the amount of oil they sold to the United States and other Western countries.The resulting rapid rise in the price of oil led to cost-push inflation.
Wages are a large part of the production costs for many goods, so rising wages canlead to cost-push inflation. A wage-price spiral is a cycle in which increased wages lead tohigher production costs, which in turn result in higher prices, which then lead to demandsfor higher wages. You can see the wage-price spiral in motion in Figure 13.10.
APPLICATION Categorizing Economic Information
B. What type of inflation would result if bad weather hit farmers hard over a long stretchof time?
A wage-price spiralis a cycle that begins withincreased wages, whichlead to higher productioncosts, which in turn resultin higher prices, whichresult in demands for evenhigher wages.
QUICK REFERENCE
Cost-Push Infl ation Shortages of rawmaterials or energy can lead to cost-push infl ation.
F I G U R E 13.10 Wage-Price Spiral
ANALYZE CHARTS1. Using the cotton industry as an example, explain how the cycle might proceed. Use
the cotton workers, cotton growers, textile mills, and other intermediate industries inyour explanation.
2. Do employers grant wage increases whenever employees ask for a raise? What economicprinciples determine wage levels?
. 9
Workers receivea wage increase The wage increase drives up
the production costs
Producers raise prices to pay forhigher production costs
Workersdemand a wageincrease to payhigher prices
7.99
9.99$
$

401Facing Economic Challenges
What Is the Impact of Inflation?
KEY CONCEPTS
Since the 1960s, the impact of inflation on the United States economy has been signifi-cant. Inflation has raised interest rates, limited the growth of the stock market, forcedagricultural bankruptcies, and slowed production. It has also had a huge impact onpolitics. More than half of those who voted for Ronald Reagan in 1980 said that hispromise to stop the long-running inflation of the 1970s was the decisive factor. Infla-tion is a major challenge to economic stability. For the economy as a whole and forindividual consumers, inflation has an especially strong impact on the purchasingpower of the dollar and on interest rates.
EFFECT 1 Decreasing Value of the Dollar
With inflation, today’s dollar buys less than last year’s. The consumer price index,illustrated in Figure 13.7, shows that the real value of a dollar has declined steadily.The rising index represents the declining value of the dollar.
Consider how this declining value affects people who are on a fixed income.Suppose, for example, that your cousin started college with a savings of $10,000 tosee him through. He planned to spend $2,500 a year on carefully budgeted expenses.However, because of inflation, each of those dollars bought less each year. To pay forexactly the same things he bought in his freshman year for $2,500, by the time hewas a senior he needed $2,750. Inflation had pushed prices up by 10 percent overthe four-year period. Senior citizens living on a fixed retirement income—as well asanyone else with a fixed income—are especially vulnerable to the decreasing valueof the dollar through inflation.
YOUR ECONOMIC CHOICES
?
▲ Apartment$750 per month
▲ Condominium$200,000 mortgage
INFLATION AND PURCHASES
Buy now or wait?If condominium prices haveskyrocketed, does it make moresense to buy a condo now or tocontinue renting until the marketcools off?

402 Chapter 13
Conversely, inflation can help borrowers. With infla-tion, those who borrow at a fixed rate of interest can repaytheir debts with dollars that are worth less, making theirrepayments smaller than they would have been withoutinflation. Suppose someone borrows $100 at 5 percentinterest, promising to pay the lender $105 after a year. Ifinflation rises at 5 percent, the $105 the borrower pays thelender will have the same purchasing power as the $100of the original loan. The borrower essentially paid no realinterest on the money he borrowed.
EFFECT 2 Increasing Interest Rates
As prices increase, interest rates also tend to increase. Lenders raise their interestrates to ensure they earn money on their loans despite inflation. Higher interestrates mean that borrowing money becomes more expensive. For example, a $10,000loan at 10 percent interest to be repaid over the course of five years would have amonthly payment of $212.47. At 5 percent interest, the monthly payment would beonly $188.71. At the end of five years, you would have paid over $1,425 more for theloan at the higher rate. When interest rates are high, businesses are less likely to bor-row to expand or to make capital improvements. Consumers are less likely to makepurchases of high-priced items that they would need to finance. People carryingdebt on credit cards have to make higher monthly payments as their rates rise.
EFFECT 3 Decreasing Real Returns on Savings
Inflation also has a significant effect on savings. People who save at a fixed interestrate get a lower rate of return on their savings. While the interest paid on savingstends to increase during inflationary times, the difference between the rate of returnand the rate of inflation still leaves them at a disadvantage.
For example, if someone puts $100 in a savings account that pays 5 percent interestper year, they will have $105 at the end of a year. But if the rate of inflation for the yearwas 10 percent, that $105 will buy only about what $95 bought when they depositedtheir money. Although they have more dollars, that money will buy less. Inflation,then, can discourage savings, leading more people to make purchases today ratherthan saving for tomorrow.
Inflation is the most commonly used economic term in the popular media,far outpacing the distant second, unemployment. Inflation worries many people,especially those who remember the volatile 1970s. Much of the worry centers on aperson’s individual standard of living: Will my wages keep up with rising prices?Will my savings see me through retirement? Fear of inflation has contributed to theshift away from the traditional American belief in saving over consumption.
APPLICATION Writing About Economics
C. According to opinion polls, most Americans feel inflation is a more serious problemthan unemployment. Write a paragraph stating your view on which is more serious.Use convincing reasons and examples.
Increasing InterestRates Higher interestrates make borrowingmore expensive.

ClassZone.com
403Facing Economic Challenges
ECONOMICS IN PR ACTICE
SECTION 3 AssessmentREVIEWING KEY CONC EP TS
2. What are the stages in a wage-price spiral?
3. Use a specific example to explain cost-push inflation.
4. Use a specific example to explain demand-pull inflation.
5. What are three effects of inflation?
6. Using Your Notes If youwere a business owner, whatdecisions might you makeon news of a steady risein inflation? Refer to yourcompleted cluster diagram and provide specific examples.
Use the Graphic Organizer at Interactive Review @ ClassZone.com
7. Analyzing Cause and Effect Why would producers tend toexperience inflation before consumers? What type of inflationwould the producers experience?
8. Explaining an Economic Concept How does the creation ofexcess money cause a demand-pull inflation? Refer to Figure 13.9to help you answer this question.
9. Applying an Economic Concept Imagine that union leadersare meeting with the owners of a steel manufacturer to negotiatea new five-year contract for union employees. Explain how bothsides of the union-management negotiation team must take theunpredictability of future inflation into account.
10. Challenge The cost of attending college has been rising fasterthan the inflation rate, at times twice as fast. For proof, ask yourschool guidance counselor for a catalog from a private collegethat shows prices from several years ago. Compare the old pricesto the current prices shown on the college website. Calculate thepercentage increase for this school.
Estimating the Effects of InflationSuppose that a natural disasterdisrupts the production of oil sodramatically that prices for oil andrelated products double in a shortperiod of time. In this graph ofmacroeconomic equilibrium, P1shows the price level before thenatural disaster.
Draw Aggregate Supply andDemand Curves On your ownpaper, recreate the graph ofmacroeconomic equilibrium. Thendraw the new aggregate supply curvethat would result from the naturaldisaster scenario, and indicate whereP2 would fall.
Challenge Explain what will happento total economic output because ofthe change in prices. How does thenew graph show this?
1. Explain the relationship between the terms in each of these pairs.
a. consumer price indexproducer price index
c. demand-pull inflationcost-push inflation
b. hyperinflationdeflation
C RIT IC AL THINKING
Inflation
How Is InflationMeasured?
AS1
Pric
e le
vel
Real GDP
P1
Q1
MACROECONOMIC EQUILIBRIUM
AD1
Use @ClassZone.com to complete this activity.

Find an update on this CaseStudy at ClassZone.com
404 Chapter 13
Case Study
The Effects of Inflationin the 1970sBackground Periods of high inflation can wreak havoc with a country’seconomy. In the 1970s, for example, the United States experienced the biggest andmost sustained period of inflation in the country’s history. By 1979, inflation hadrisen into the “double digits,” that is, to 10 percent per year or higher. The pricesof consumer goods—everything from food and gas to cars and houses—rosedramatically. Those on fixed incomes were particularly hard-hit, because as pricesrose their limited budgets bought less.
What’s the issue? How did inflation affect people and businesses in the 1970s?Study these sources to discover what it was like to live with a high rate of inflation.
In the late 1960s,the rate of infla-tion began risingin many countries.This article ex-plains inflation’seffects on the U.S.economy.
The Industrialized World and Infl ationHow inflation affected the U.S. economy
For the years 1967 through 1978, the U.S. inflation rateaveraged 6.1 per cent a year, compared with an averageof 2 per cent for the years 1952 through 1967. Evenduring the 1973–74 recession, unlike most previousrecessions, the inflation rate continued at a relativelyhigh rate. In the late 1970s inflation speeded up again,reaching unprecedented levels.
Inflation would not be so bad, in the opinion of someeconomists, if it were accompanied by substantialincreases in output and employment. But economicgrowth in the United States slowed during the high-inflation 1970s, bringing on a condition that economistsdescribe as “stagflation.” Another measure of economichealth—productivity, or output per worker—also sloweddramatically in [those] years throughout the industrializedworld, and in the United States and Great Britain for a timefailed to increase at all. For the United States, a countrylong accustomed to ever-increasing material wealth, thefall-off in economic growth and the constantly erodingvalue of the dollar were traumatic developments. If the trends continued, the averageAmerican could no longer anticipate a constantly rising standard of living.
Source: The Search for a New Economic Order, The Ford Foundation, 1982
Thinking Economically Explain how the effects of inflation might be offsetby increases in output and employment.
A.EconomicAnalysis

405Facing Economic Challenges
THINKING ECONOMICALLY Synthesizing
1. Name one example from each document that shows how inflation has a negative impact onthe economy.
2. Inflation is a general rise in price levels. Are the examples of price increases in documents Band C symptoms of inflation or isolated price increases?
3. Compare the tone of documents A and C. Do economists care as much about inflation asconsumers? Explain your answer.
B. Cartoon
In this cartoon byLarry Katzman,a father offers anearly lesson ineconomics. Thinking
EconomicallyWhich type ofinflation doesthe cartoonreflect? Explainyour answer.
C. NewspaperEditorial
Prices rose dra-matically duringthe 1970s. This ed-itorial reflects theanger many con-sumers felt aboutthe situation.
Protesting Infl ationConsumers grew impatient with the government’s inability to controlinflation.
Here we are, spending more and getting less, but the [government] economists areoptimistic. What makes them so happy? The rate of inflation may have dropped 1 per cent.Just suppose the rate of inflation had gone down from 5 per cent to 4 per cent. . . . To methis is another increase of four cents, and a further shrinkage of my dollar.
Obviously this type of economics is good for someone. It certainly isn’t good for me, or myfriends, or my relatives. Everyone is complaining, but the experts are satisfied.
I have a family of meat eaters. . . . Long ago I discovered a marvelous cut of meat calledskirt steak. It used to cost 89 cents a pound. It has inched its way up and has recently takena leap to $1.59 and overtaken sirloin steak. Chopped meat is now where my skirt steak usedto be. . . . Even the lowly onion is no longer cheap. A weekly trip to the supermarket, whichin 1969 cost $50, now costs $70.
Source: The New York Times, September 29, 1972
Thinking Economically Why might a small decrease in a large rate of inflation satisfygovernment economists but frustrate consumers?
Sou
rce:
ww
w.C
arto
on
Sto
ck.c
om

FIGURE 13.11 LAYOFFS AND OUTSOURCING
IndustryEmployees
Laid OffReplaced byOutsourcing
Mining 6,123 0
Apparel Manufacturing 11,583 4,102
Computer and Electronic Products 14,979 6,481
Transportation Equipment 40,634 6,223
Retail Trade 143,660 5,298
Transportation and Warehousing 59,098 2,090
Educational Services 1,429 0
Health Care and Social Assistance 44,212 621
Complete the following activity either on yourown paper or online at ClassZone.com
406 Chapter 13
CHAPTER 13 AssessmentREVIEWING KEY CONC EP TS
Review this chapter using interactiveactivities at ClassZone.com
• Online Summary• Quizzes• Vocabulary Flip Cards
• Graphic Organizers• Review and Study Notes
consumer price index (CPI)cost-push inflationcyclical unemploymentdeflationdemand-pull inflationfrictional unemploymentfull employmenthyperinflationincome distributionincome inequalityinflationinflation rate
Lorenz curvepovertypoverty ratepoverty thresholdproducer price index (PPI)seasonal unemploymentstructural unemploymentunderemployedunemployment ratewage-price spiralwelfareworkfare
There are different types of unemployment. 1
represents workers changing jobs to increase theirworking satisfaction or to accommodate a moveto another region. 2 results from significantchanges in the economy and in the way work isdone. Even during periods of 3 about 4 to 6percent of the work force is still unemployed.
Nearly 40 million people in the United Stateshave incomes below the 4 , even though thenation has one of the highest median incomesin the world. The poorest receive assistancethrough 5 . In recent years 6 , which requiresan exchange of labor for government benefits, hasreplaced some direct cash payments.
7 , a rise in the general level of prices, isanother economic challenge. To monitor it,government economists developed the 8 , whichtracks what consumers pay for a market basket ofitems, and the 9 , which tracks prices from theproducers’ point of view. They monitor the 10
using these indices.
Choose the key concept that best completesthe sentence. Not all key concepts will be used.
Unemployment in Today’s Economy (pp. 382–387)
1. What are the four main kinds of unemploymentand how do they differ from one another?
2. What are three negative impacts of unemployment?
Poverty and Income Distribution (pp. 388–395)
3. Which of the following persons is most likely tolive in poverty: a senior citizen, a disabled adult, acollege graduate, or a child? Explain your answerwith specific facts and reasons.
4. Describe three antipoverty programs you feel aremost useful and give reasons for your position.
Causes and Consequences of Inflation (pp. 396–405)
5. Describe two causes of inflation.
6. Which consequence of inflation would be the mosttroublesome to you personally? Explain your answer.
The table below shows employees laid off fromselected industries in 2004. It also shows how many ofthese jobs were replaced by outsourcing.
7. What type of unemployment is it when an industrylays off workers but outsources their jobs? Namean example from the table.
8. Which industries’ job cuts are probably due tochanges in the business cycle?
APPLYING ECONOMIC CONC EP TS
Source: U.S. Census Bureau, 2004 data

Facing Economic Challenges 407
C RIT IC AL THINKING
9. Creating Graphs The population can be dividedinto five equal groups—or quintiles—accordingto income. Income mobility means moving fromone quintile to another. A study done by the U.S.Treasury Department between 1979 and 1988showed the following about taxpayers who startedout in the lowest quintile:
• 14.2 percent of the taxpayers in the bottomquintile in 1979 were still there in 1988
• 20.7 percent had moved to the next higherquintile
• 25 percent had moved to the middle quintile
• 25.3 percent had moved to the second highestquintile
• 14.4 percent of those who started in the lowestquintile had moved into the highest quintile
Create a bar graph that illustrates these facts aboutincome mobility in the United States.Use @ ClassZone.comto complete this activity.
10. Analyzing and Interpreting Data Whatconclusions can you draw about income mobilitybased on the above data?
11. Analyzing Cause and Effect Think of threepossible reasons a person might be able to movefrom one level of income to another.
12. Explaining an Economic Concept Whichantipoverty programs use market forces to achievetheir goals? Explain your answer.
13. Analyzing and Interpreting Data Consider thefollowing data:
Consumer Price Index: up by 6 percentUnemployment Rate: up to 7 percentGross Domestic Product: up by 1 percent
What’s the economic problem? To correct theproblem, which of these measures would youaddress first and why?
14. Challenge Which economic challenge—unemployment, poverty, or inflation—represents thegreatest threat to social stability, in your opinion?Explain your answer with reasons and examples.
The Pursuit of Happiness
Do you need money to be happy? Since income alonedoes not tell the whole story of someone’s quality oflife, some people think other measures besides incomeshould be used to determine a household’s well-being.Many elements beyond material possessions also affecta person’s quality of life.
To better understand the relationship betweenwealth and happiness, create a quality-of-life thresholdby following the steps below.
Step 1. As a whole class, discuss the differencesbetween income and quality of life.
Step 2. Break into five small groups and devise aquality-of-life threshold, a standard below which aperson would be considered seriously impoverished.
Step 3. Try to find a measure for each of your criteria.For example, if one standard is “lives in warm climate,”define the temperature range that qualifies as warm.
Step 4. Report your criteria to the rest of the class andexplain how you would measure each.
Step 5. With the whole class, debate the relative meritsof each quality-of-life threshold and its measurement.
Challenge Write a paragraph explaining how thequality-of-life threshold you developed relates toHernando de Soto’s ideas about property and prosperity(see page 394).
S I M U L AT I O N


![Page 353[1]](https://static.fdocuments.us/doc/165x107/55a15d3f1a28ab4f6a8b466d/page-3531.jpg)
