
Unit 5 Reviewpages.lockerby.net/tushinghamk/Tushingham MDM4U/Unit 5... · Web viewCalculate the...
60
Unit 5 Review Multiple Choice Identify the letter of the choice that best completes the statement or answers the question. ____ 2. A tetrahedron has four equal triangular faces. The faces of a tetrahedral die are labelled with the numbers one, three, five, and seven. What is the expected value of the random variable representing the number observed on a single roll of this die? a. 3 c. 4 b. 3.5 d. 5 ____ 3. What is the probability of a sum of 5 resulting from the roll of two six- sided dice? a. c. b. d. ____ 5. The probability of drawing a red card from a deck of 52 playing cards is 0.5. Which of the following statements is not necessarily true? a. The expected value for the number of red cards in a 7 card hand will be 3.5. b. Over many repeated drawings you would expect the ratio of red cards drawn to total number of drawings to be close to 1:2. c. The expected value for the number of black cards in an 8 card hand will be 4. d. If you successively draw and replace a card 100 times, you will see 50 red cards. ____ 6. What is the probability of rolling less than 3 on a single roll of a six- sided die? a. c. b. d. ____ 7. A game is played by spinning a wheel that is divided into four sectors, each with a different point value. The central angle and point value for each sector is shown in the chart below. Central Angle Point Value 144° 20
Transcript of Unit 5 Reviewpages.lockerby.net/tushinghamk/Tushingham MDM4U/Unit 5... · Web viewCalculate the...

Unit 5 Review
Multiple ChoiceIdentify the letter of the choice that best completes the statement or answers the question.
____ 2. A tetrahedron has four equal triangular faces. The faces of a tetrahedral die are labelled with the numbers one, three, five, and seven. What is the expected value of the random variable representing the number observed on a single roll of this die?a. 3 c. 4b. 3.5 d. 5
____ 3. What is the probability of a sum of 5 resulting from the roll of two six-sided dice?a. c.
b. d.
____ 5. The probability of drawing a red card from a deck of 52 playing cards is 0.5. Which of the following statements is not necessarily true?a. The expected value for the number of red cards in a 7 card hand will be 3.5.b. Over many repeated drawings you would expect the ratio of red cards drawn to total
number of drawings to be close to 1:2.c. The expected value for the number of black cards in an 8 card hand will be 4.d. If you successively draw and replace a card 100 times, you will see 50 red cards.
____ 6. What is the probability of rolling less than 3 on a single roll of a six-sided die?a. c.
b. d.
____ 7. A game is played by spinning a wheel that is divided into four sectors, each with a different point value. The central angle and point value for each sector is shown in the chart below.Central Angle Point Value
144°108°72°36°
20304050
How many total points would you expect to get for 100 spins of the wheel?a. 3500 c. 2500b. 3000 d. 2000
____ 8. Which of the following is an example of a discrete random variable?a. the time needed by a student to complete a physics labb. the number of red cars observed in a student parking lotc. the mass of a green pepper selected at random from a bind. the cost of a U.S. dollar in Canadian currency on a given day
____ 9. The following table shows the probability distribution for the possible sums that result from rolling two 6-sided dice.

X P(X) X P(X)1 0 7
2 8
3 9
4 10
5 11
6 12
What is the probability that the sum rolled is even and less than 9?a. c.
b. d.
____ 10. What is the probability of drawing exactly 2 red cards in a hand of 3 cards drawn from a deck of 52 cards?a. c.
b. d.
____ 11. A game involves tossing three coins. If two or more of the coins are heads, the player wins a prize. Each play costs $0.25. What value of prize will make this a fair game?a. $0.40 c. $0.45b. $0.50 d. $0.38
____ 12. The following table is a valid probability distribution for a random variable X. What must be the value for P(2) to complete the table?
X P(X)0 0.151 0.223 0.4
a. 0.15 c. 0.25b. 0.2 d. 0.3
____ 13. A random variable X is defined as the number of heads observed when a coin is tossed 4 times. The probability distribution for this random variable is shown below.
X 0 1 2 3 4

P(X)
Which of the following statements is not true?a. The probability of no heads is the same as the probability of 4 heads.b. The most likely outcome is 2 heads.c.
The expected value is .
d. The probability of not tossing 2 heads is greater than the probability of tossing 2 heads.____ 15. A student is preparing a probability distribution as shown below.
X P(X)0 0.31 0.32 0.334 0.3
A value is needed for P(3) to complete the table. Which statement below is true?a. The required value for P(3) is 0.3.b. The required value for P(3) is 0.2.c. The required value for P(3) is –0.2.d. There is no possible value for P(3) that can make this a valid probability distribution.
Short Answer
16. Explain why the mass of ice cream in a randomly chosen sundae is not an example of a discrete random variable.
18. Explain the similarities and differences between a relative frequency distribution and a probability distribution for a given experiment.
19. Calculate the expected value for the given probability distribution.
X P(X)6 0.158 0.35
10 0.5
20. A game is played by drawing cards from a deck that has all the face cards removed including the aces. The player draws a card and is paid the face value of the card in dollars. Each play costs $5.00. How much would you expect to win or lose if you played the game 20 times?
21. A soft drink company has a promotion. Each cap liner for 1 000 000 bottles is printed with either a prize or a cheerful invitation to buy more product. The value of each liner along with its frequency is shown in the table.
Value of Liner Number of Liners0 949 779

1 50 0005 200
100 2010 000 1
What is the expected value for an individual liner?
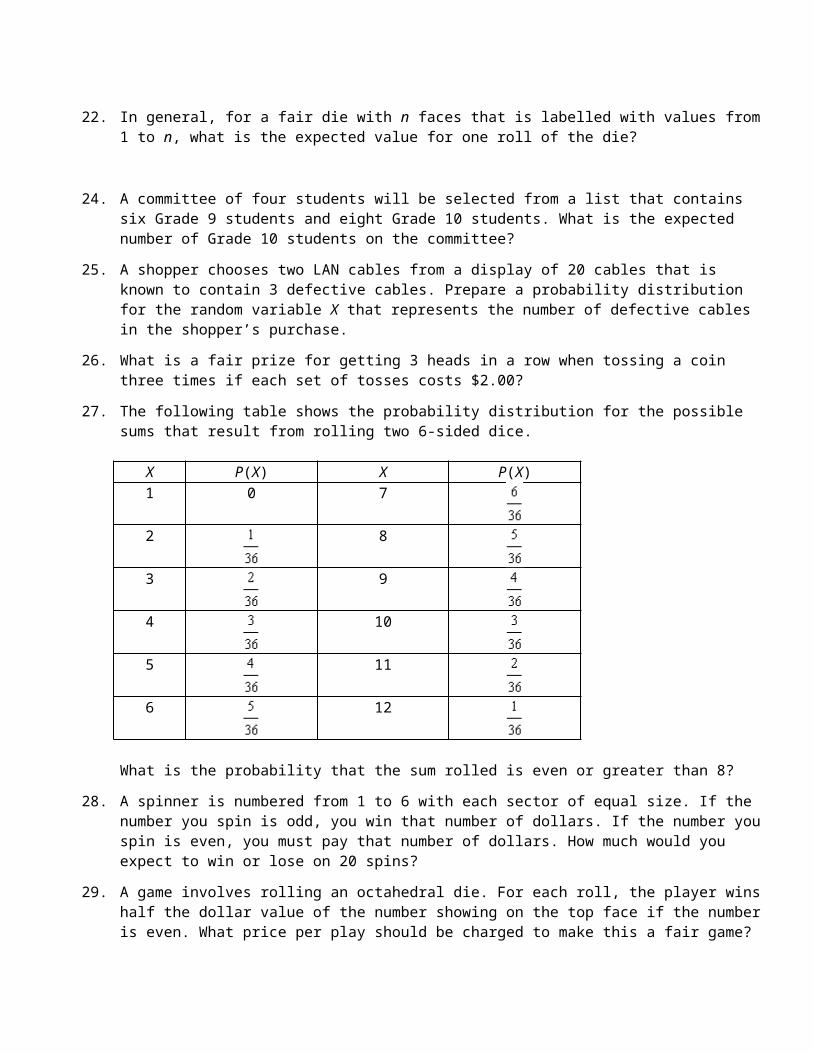
22. In general, for a fair die with n faces that is labelled with values from 1 to n, what is the expected value for one roll of the die?
24. A committee of four students will be selected from a list that contains six Grade 9 students and eight Grade 10 students. What is the expected number of Grade 10 students on the committee?
25. A shopper chooses two LAN cables from a display of 20 cables that is known to contain 3 defective cables. Prepare a probability distribution for the random variable X that represents the number of defective cables in the shopper’s purchase.
26. What is a fair prize for getting 3 heads in a row when tossing a coin three times if each set of tosses costs $2.00?
27. The following table shows the probability distribution for the possible sums that result from rolling two 6-sided dice.
X P(X) X P(X)1 0 7
2 8
3 9
4 10
5 11
6 12
What is the probability that the sum rolled is even or greater than 8?
28. A spinner is numbered from 1 to 6 with each sector of equal size. If the number you spin is odd, you win that number of dollars. If the number you spin is even, you must pay that number of dollars. How much would you expect to win or lose on 20 spins?
29. A game involves rolling an octahedral die. For each roll, the player wins half the dollar value of the number showing on the top face if the number is even. What price per play should be charged to make this a fair game?
30. Explain why the probability of rolling a sum of 4 or a sum of 10 should be the same when rolling two six-sided dice
Problem
32. A mail order department in a large retail chain files customer orders for pickup using the last two digits of the customer’s phone number. Assume that the occurrence of any two digit number from 00 to 99 is equally likely. Calculate the expected value of the two digit number given by any individual customer and explain why this value is of no use to the store.
33. What is the probability of a sum of 5 resulting from the roll of three six-sided dice?
34. Prepare a table to show the probability distribution for the sum obtained by rolling two octahedral (eight-sided) dice. Use this table to show whether or not the probability of an even sum is equal to the probability of an odd sum.
35. The information in the table below was extracted from the 1996 Canadian census.
Number of Persons Living in Household
Relative Frequency
1 0.362 0.283 0.144 0.155 0.05
>5(use 6.3 for average)
0.02
a) Based on this information, predict the expected population of a city that had a total of 8 000 households.b) Explain why using this information to predict the population of an individual street in the city could be
unreliable.
36. The owner of a self-serve car wash conducted a study to see how long his customers took. The times in the table below are rounded to the nearest 5 minutes.
Time 10 15 20 25 30 35 40Frequency 2 6 18 16 10 7 1
a) Based on the experimental probability from the table, calculate the expected value for the time that a customer takes.
b) If the owner charges a flat rate per visit and needs an income of at least $15.00 per hour per space, what is the lowest rate rounded to the nearest dollar that will provide at least this level of income?
37. The eighteenth hole at a public golf course is a par 4. This means that a good golfer should be able to play the hole in 4 strokes. The table below summarizes the scores of a sample of 200 golfers who recently played the hole.
No. of Strokes 1 2 3 4 5 6 7 8 9 10Frequency 0 3 24 45 51 38 24 9 5 1
a) What is the expected value for the number of strokes a golfer will take on this hole?b) Is it reasonable that the expected value for the hole should differ from the par value?

38. Four nested squares with side lengths as shown form a target with four distinct regions.
1357
a) State the relative frequency distribution for the number of hits per region if the probability of hitting a given region is proportional to its area.
b) A prize structure is designed that will give an equal payout for each area with a prize value of $1.00 for the largest region. What will the prizes be for the other three regions?
c) Based on your prize structure and a price per play of $2.00, what is the expected value of the game?
39. A target made of four nested squares has a centre square with an area of 64 cm2. The probability of hitting each region of the target is proportional to the area of the region.a) What side lengths should be chosen for the outer squares if we want the probability of hitting each region
to be the same?b) What type of probability distribution will we have once these lengths have been chosen?
40. The chart below lists the actual prizes and probability of winning those prizes for one draw of a popular government lottery.
Numbers Matched Value of Prize Probability of Prize3 of 6 $10.00 1 in 564 of 6 $65.13 1 in 10315 of 6 $1830.41 1 in 55 490
5 of 6 plus bonus $102 960.50 1 in 2 330 6356 of 6 $2 059 000.00 1 in 13 938 816
a) Based on these prize values and probabilities, calculate the expected prize value for a single ticket.

b) It could be shown that over 99% of all persons who buy lottery tickets will never win either of the two largest prizes. Based on this fact, what is the expected return on a $1.00 ticket for the 99% of the players who will never win the largest prizes?
c) Home research question: The lottery corporation states that 45% of all ticket sales are paid out as prizes. How do they manage to ensure that this happens?
Unit 5 ReviewAnswer Section
MULTIPLE CHOICE
2. ANS: C REF: Knowledge and UnderstandingOBJ: 5.1 Probability Distributions and Expected Value LOC: CP2.04TOP: Probability Distributions and Predictions
3. ANS: B REF: Knowledge and UnderstandingOBJ: 5.1 Probability Distributions and Expected Value LOC: CP2.03TOP: Probability Distributions and Predictions
5. ANS: D REF: Knowledge and UnderstandingOBJ: 5.1 Probability Distributions and Expected Value LOC: CP2.06TOP: Probability Distributions and Predictions
6. ANS: A REF: Knowledge and UnderstandingOBJ: 5.1 Probability Distributions and Expected Value LOC: CP2.01TOP: Probability Distributions and Predictions
7. ANS: B REF: Knowledge and UnderstandingOBJ: 5.1 Probability Distributions and Expected Value LOC: CP2.04TOP: Probability Distributions and Predictions
8. ANS: B REF: Knowledge and UnderstandingOBJ: 5.1 Probability Distributions and Expected Value LOC: CP2.02TOP: Probability Distributions and Predictions
9. ANS: A REF: Knowledge and UnderstandingOBJ: 5.1 Probability Distributions and Expected Value LOC: CP2.01TOP: Probability Distributions and Predictions
10. ANS: D REF: Knowledge and UnderstandingOBJ: 5.1 Probability Distributions and Expected Value LOC: CP2.01TOP: Probability Distributions and Predictions
11. ANS: B REF: Application OBJ: 5.1 Probability Distributions and Expected ValueLOC: CP2.04 TOP: Probability Distributions and Predictions
13. ANS: C REF: Application OBJ: 5.1 Probability Distributions and Expected ValueLOC: CP2.01 TOP: Probability Distributions and Predictions
15. ANS: D REF: Knowledge and UnderstandingOBJ: 5.1 Probability Distributions and Expected Value LOC: CP2.06TOP: Probability Distributions and Predictions
SHORT ANSWER

16. ANS:A discrete random variable can take on only a finite number of whole number values. The measured mass of the ice cream would include decimal values.We could set up a discrete random variable by specifying rounding to the nearest gram for an allowed range or by setting up intervals into which each sundae could be categorized.
REF: Communication OBJ: 5.1 Probability Distributions and Expected ValueLOC: CP2.02 TOP: Probability Distributions and Predictions
18. ANS:A relative frequency distribution records the actual outcomes observed while performing the experiment and expresses the frequency of each individual outcome as a fraction of the total outcomes observed. A probability distribution states the theoretical probability for each possible outcome of the experiment but does not require that the experiment actually be performed. If the mathematical model chosen to model the experiment is appropriate, then the two distributions should be very close to identical after a large number of trials.
REF: Communication OBJ: 5.1 Probability Distributions and Expected ValueLOC: CP1.08 TOP: Probability Distributions and Predictions
19. ANS:8.7
REF: Knowledge and Understanding OBJ: 5.1 Probability Distributions and Expected ValueLOC: CP2.04 TOP: Probability Distributions and Predictions
20. ANS:You would expect to win $10.00 for 20 plays.
REF: Application OBJ: 5.1 Probability Distributions and Expected ValueLOC: CP2.04 TOP: Probability Distributions and Predictions
21. ANS:The expected value of a liner is 6.3 cents.
REF: Application OBJ: 5.1 Probability Distributions and Expected ValueLOC: CP2.04 TOP: Probability Distributions and Predictions
22. ANS:
REF: Knowledge and Understanding OBJ: 5.1 Probability Distributions and Expected ValueLOC: CP2.06 TOP: Probability Distributions and Predictions
24. ANS:E(X) = 2.29
REF: Application OBJ: 5.1 Probability Distributions and Expected ValueLOC: CP2.04 TOP: Probability Distributions and Predictions
25. ANS:

X P(X)0
1
2
REF: Application OBJ: 5.1 Probability Distributions and Expected ValueLOC: CP2.03 TOP: Probability Distributions and Predictions
26. ANS:A win should pay $16.00.
REF: Application OBJ: 5.1 Probability Distributions and Expected ValueLOC: CP2.06 TOP: Probability Distributions and Predictions
27. ANS:
REF: Knowledge and Understanding OBJ: 5.1 Probability Distributions and Expected ValueLOC: CP2.01 TOP: Probability Distributions and Predictions
28. ANS:On 20 spins you would expect a loss of $10.00.
REF: Application OBJ: 5.1 Probability Distributions and Expected ValueLOC: CP2.04 TOP: Probability Distributions and Predictions
29. ANS:A fair game would charge $1.25 per play.
REF: Application OBJ: 5.1 Probability Distributions and Expected ValueLOC: CP2.04 TOP: Probability Distributions and Predictions
30. ANS:The probability distribution is symmetrical. The least likely outcomes are a sum of 2 or 12, each of which can happen in only one way.Similarly the sums of 3 or 11 can each be formed in two possible ways. The next matched pair is the 4 and 10, each of which can be formed in three possible ways.
REF: Communication OBJ: 5.1 Probability Distributions and Expected ValueLOC: CP2.06 TOP: Probability Distributions and Predictions
PROBLEM
32. ANS:

By applying the formula for the sum of the first 99 natural numbers and multiplying by the probability of any
individual number, we get E(X)= = 49.5. This value is meaningless to the company for two reasons. The
expected value does not match any actual two digit number. Furthermore, the expected value is not of interest. The point of the system is that it presorts orders into 100 sections of approximately equal size before they are filed alphabetically within each section. There is no other benefit or value associated with the number.
REF: Communication OBJ: 5.1 Probability Distributions and Expected ValueLOC: CP2.06 TOP: Probability Distributions and Predictions
33. ANS:There are 216 possible outcomes for the three rolls. Of these, the following have a sum of 5: 1 + 1 + 3; 1 + 2
+ 2; 1 + 3 + 1; 2 + 1 + 2; 2 + 2 + 1; 3 + 1 + 1. The probability is .
REF: Knowledge and Understanding OBJ: 5.1 Probability Distributions and Expected ValueLOC: CP2.04 TOP: Probability Distributions and Predictions
34. ANS:
X P(X) X P(X) X P(X)2 7 12
3 8 13
4 9 14
5 10 15
6 11 16
The total probability for both the even and the odd sums is . Either event is equally likely.
REF: Knowledge and Understanding OBJ: 5.1 Probability Distributions and Expected ValueLOC: CP2.03 TOP: Probability Distributions and Predictions
35. ANS:a) The simplest method is to use the table to get the average number of persons per household and then
multiply by the number of households.Average per household = (1)(0.36) + (2)(0.28) + (3)(0.14) + (4) (0.15) + (5) (0.05) + (6.3)(0.02) = 2.316For 9000 households, the population would be 20 844.
b) For an individual street, the housing mix is unlikely to be representative of the overall national average that is reflected in the table. For example, a typical residential street would be highly unlikely to have 36% of the houses with a single occupant. Similarly, a street with many apartment buildings would be likely to have a smaller frequency of larger family units than the national average.
REF: Application OBJ: 5.1 Probability Distributions and Expected Value

LOC: CP2.06 TOP: Probability Distributions and Predictions36. ANS:
a) From the table, we have 60 trials of the experiment.
b) If we assume that there is a continuous supply of customers eager to wash their cars, based on an average visit of 24.25 minutes, the owner would expect 2.47 visits per hour per space. If he needs at least $15.00 per hour per space, he should charge $6.07 per visit. Rounded to the nearest dollar, the owner should charge $6.00 per visit.
REF: Application OBJ: 5.1 Probability Distributions and Expected ValueLOC: CP2.04, CP2.06 TOP: Probability Distributions and Predictions
37. ANS:
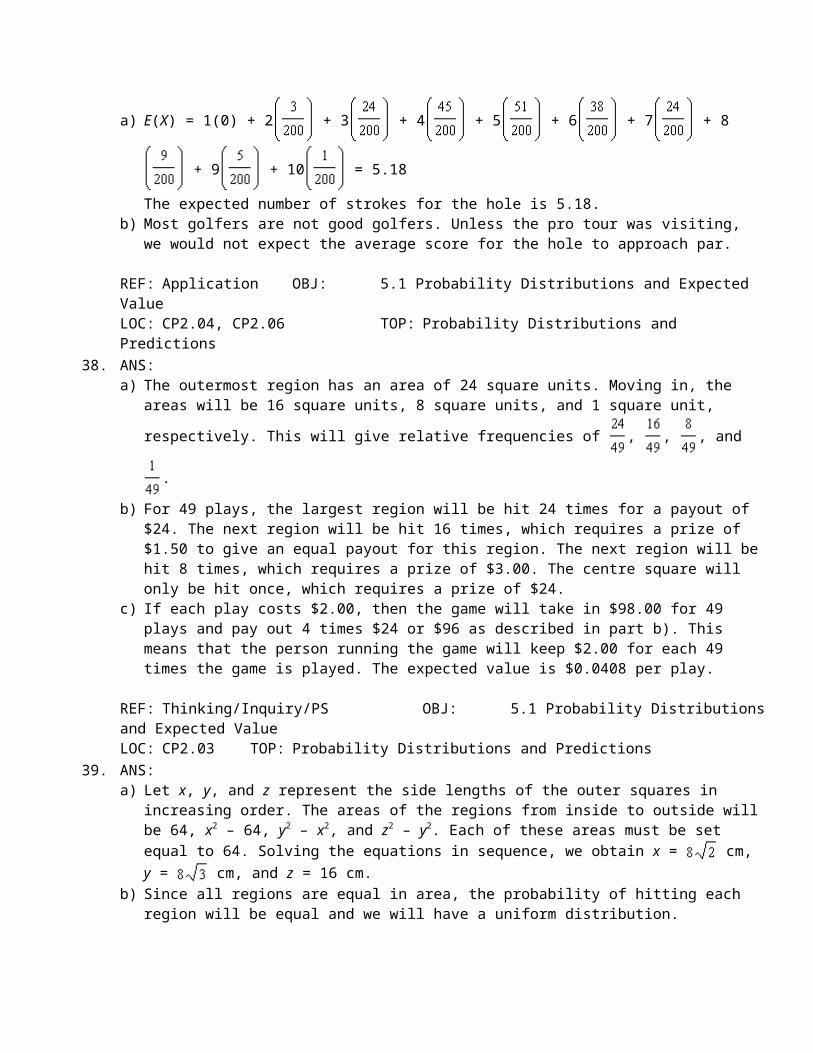
a) E(X) = 1(0) + 2 + 3 + 4 + 5 + 6 + 7 + 8 + 9 + 10
= 5.18
The expected number of strokes for the hole is 5.18.b) Most golfers are not good golfers. Unless the pro tour was visiting, we would not expect the average
score for the hole to approach par.
REF: Application OBJ: 5.1 Probability Distributions and Expected ValueLOC: CP2.04, CP2.06 TOP: Probability Distributions and Predictions
38. ANS:a) The outermost region has an area of 24 square units. Moving in, the areas will be 16 square units, 8
square units, and 1 square unit, respectively. This will give relative frequencies of , , , and .
b) For 49 plays, the largest region will be hit 24 times for a payout of $24. The next region will be hit 16 times, which requires a prize of $1.50 to give an equal payout for this region. The next region will be hit 8 times, which requires a prize of $3.00. The centre square will only be hit once, which requires a prize of $24.
c) If each play costs $2.00, then the game will take in $98.00 for 49 plays and pay out 4 times $24 or $96 as described in part b). This means that the person running the game will keep $2.00 for each 49 times the game is played. The expected value is $0.0408 per play.
REF: Thinking/Inquiry/PS OBJ: 5.1 Probability Distributions and Expected ValueLOC: CP2.03 TOP: Probability Distributions and Predictions
39. ANS:a) Let x, y, and z represent the side lengths of the outer squares in increasing order. The areas of the regions
from inside to outside will be 64, x2 – 64, y2 – x2, and z2 – y2. Each of these areas must be set equal to 64. Solving the equations in sequence, we obtain x = cm, y = cm, and z = 16 cm.

b) Since all regions are equal in area, the probability of hitting each region will be equal and we will have a uniform distribution.
REF: Thinking/Inquiry/PS OBJ: 5.1 Probability Distributions and Expected ValueLOC: CP2.03 TOP: Probability Distributions and Predictions
40. ANS:a) Let X represent the value of the prize won.
E(X) = 10 + 65.13 + 1830.41 + 102 960.5 +
2 059 000 = 0.466
The expected prize value is $0.47.b) Repeat the previous calculation without the final two terms.
E(X) = 10 + 65.13 + 1830.41 = 0.275
A long-term lottery player can reasonably expect to get back $0.28 for every $1.00 spent.c) A variety of web sites will identify the prize structure used for Lotto 649. The $10.00 prize level is fixed,
so the total payout at this level is not controllable. After the $10 prizes have been paid, the difference between 45% of ticket sales and the value of the $10 prizes is placed in a prize pool. The money in this pool is shared. Tickets with 6 matching numbers share 50% of the pool, tickets that match 5 plus a bonus share 15%, tickets that match 5 numbers share 12%, and tickets that match 4 numbers share 23%.Note to gambling teachers: Individual prize amounts would be remarkably even from draw to draw if all players in the lottery actually chose their numbers randomly. On a week that has a high percentage of numbers drawn in the 40s, the payout of $10.00 prizes drops well below expected values, while individual higher prizes other than the first prize move to values double or more the expected value.With careful application of this insight, you might be able to lose as little as 50 cents on the dollar.
REF: Application OBJ: 5.1 Probability Distributions and Expected ValueLOC: CP2.06 TOP: Probability Distributions and Predictions
Unit 5 Review
Multiple ChoiceIdentify the letter of the choice that best completes the statement or answers the question.
____ 1. Which shape of distribution best describes a normal distribution?a. U-shaped c. mound-shapedb. uniform d. skewed
____ 3. If X~N(10, 32), then the standard deviation equalsa. 10 c. 3b. 9 d. 1
____ 4. If X~N( 2, 22), then equalsa. 2 c. 2b. 0 d. 4
____ 5. If X~N(15, 22), then 68% of the data fall in the intervala. 9–21 c. 13–17

b. 11–19 d. 15–17____ 6. If X~N , what percent of the data fall between and ?
a. 34% c. 50%b. 47.5% d. 95%
____ 7. If X~N(12.4, ) and 95% of the data lie in the interval 11.8–13.0 the equalsa. 1.2 c. 0.09b. 0.3 d. 0.06
____ 9. IQ is normally distributed with a mean of 100 and a standard deviation of 15. What percent of the population has an IQ less than 55?a. 0% c. 0.3%b. 0.15% d. 5%
____ 10. The masses of 500 boxes of sugar are approximately normally distributed with a mean of 150g and a standard deviation of 3g. How many of these boxes would you expect to have a mass greater than 150g?a. 250 c. 256b. 253 d. 259
____ 11. The nicotine content in a certain brand of cigarettes has a normal distribution with a mean of 1.5 mg and a standard deviation of 0.2 mg. What percent of these cigarettes have a nicotine content less than 0.7 mg?a. 5% c. 0.15%b. 0.3% d. less than 0.15%
____ 12. Suppose that masses of newborn children are normally distributed with a mean of 3.4 kg and a standard deviation of 0.8 kg. A newborn is potentially at risk if the baby’s mass falls in the lowest 2.5%. These babies have a mass less thana. 3.4 kg c. 1.8 kgb. 2.6 kg d. 1.0 kg
____ 13. The variable has a normal distribution with 99.7% of the area under its curve falling symmetrically between x = 50 and x = 170. Its mean and standard deviation are respectivelya. 110 and 20 c. 120 and 20b. 110 and 202 d. 120 and 202
____ 14. Diameters of ball bearings produced in a certain plant have a mean of 24.50 mm and a standard deviation of 0.15 mm. In what interval will the diameters of acceptable ball bearings fall if the manufacturer rejects the smallest 2.5% and largest 0.15%? (Assume a normal distribution)a. 24.05–24.80 c. 24.20–24.80b. 24.05–24.95 d. 24.20–24.95
____ 15. A university accepts only applicants scoring in the top 16% on an entrance test. Each year the test scores are normally distributed with a standard deviation of 30. What is the highest value that the mean can have for Fred to be accepted with a score of 520?a. 460 c. 520b. 490 d. 550
Short Answer
16. The line of symmetry of a normal curve divides the curve into two parts. What is the area under each of these parts of the curve?
17. If X~N(10, 22), what is the mean?
18. X~N(12.2, ) and 99.7% of data fall within the interval 11.6–12.8. What is the standard deviation?
19. If X~N(105, 42), then what percent of the data are contained in the interval 97–105?

20. For X~N , what percent of the data fall between and ?
21. The time that a certain top sprinter takes to run the 100-m dash is normally distributed with a mean of 9.8 s and a standard deviation of 0.2 s. In what percent of his sprints will his time be less than 10.0 s?
23. A machine fills bottles with cola. The mean fill is 341 mL with a standard deviation of 2 mL. The manufacturer decides to accept only the 99.7% of bottles whose fill is closest to the mean. What fill interval does this represent?
24. In a certain country, heights of men are normally distributed with a mean of 1.70 m and a standard deviation of 0.15 m. Doorways all have a height of 2.00 m. What percent of men in this country have to get used to ducking?
25. A lake in Ontario has a mean June water temperature of 20.3°C and a standard deviation of 2.1°C. How many days in June (30 days) would you expect to find comfortable for swimming if you will only swim when the water temperature is at least 20.3°C?
26. A traffic study showed that vehicle speeds on a particular highway were normally distributed with a mean of 102.5 km/h and a standard deviation of 5.1 km/h. What percent of vehicles had a speed between 92.3 km/h and 107.6 km/h?
27. The numbers of books checked out daily at a local library are normally distributed with a mean of 240. Find the standard deviation if on 2.5% of the days there are fewer than 210 books checked out?
28. The lengths of time that people are kept on hold when calling a computer company are normally distributed with a mean of 7.2 minutes. Find the standard deviation if 97.35% of callers are put on hold from between 3.0 minutes and 13.5 minutes.
29. Find the variance if X~N(0, ) and 95% of the data are between 7 and 7.
30. IQ scores are normally distributed with a mean of 100 and a standard deviation of 15. The Regular People Club does not accept people with IQs lower than 85 or higher than 115. How many people in a group of 400 would you expect to be refused membership in the club?
Problem
32. How is a normal curve used to find the percent of the data that lie within an interval?
33. State the mean, standard deviation, and variance if X~N(4, 32).
34. IQ is normally distributed with a mean of 100. Which are there more of: people with an IQ less than 80 or people with an IQ greater than 110? Explain.
35. A manufacturer of mens’ pants knows that the waist measurements of men (in inches) are normally distributed with a mean of 34 and a standard deviation of 3.2. To guarantee that the middle 95% of men can buy a pair of his pants that are not too small, what whole-number sizes must be manufactured?
36. If X~N(26, 32), which interval contains a greater percent of the data: Explain.
37. The noon-day temperature (in °C) in Chillsville last winter can be represented by the normal distribution X~N( 6, 32). How often was it above 0°C at noon in Chillsville last winter?
38. If X~N(7, 42), find two intervals that each contain 16% of the data.
39. The lengths, in centimetres, of wooden pencils are normally distributed with a mean of 15 and a standard deviation of 0.1. Find two intervals of pencil lengths that will each include 81.5% of pencils.

Unit 5 ReviewAnswer Section
MULTIPLE CHOICE
1. ANS: C REF: Knowledge and Understanding OBJ: 3.4 Normal DistributionLOC: ST3.02 TOP: Tools for Analyzing Data
3. ANS: C REF: Knowledge and Understanding OBJ: 3.4 Normal DistributionLOC: ST3.02 TOP: Tools for Analyzing Data
4. ANS: A REF: Knowledge and Understanding OBJ: 3.4 Normal DistributionLOC: ST3.02 TOP: Tools for Analyzing Data
5. ANS: C REF: Knowledge and Understanding OBJ: 3.4 Normal DistributionLOC: ST3.02 TOP: Tools for Analyzing Data
6. ANS: A REF: Knowledge and Understanding OBJ: 3.4 Normal DistributionLOC: ST3.02 TOP: Tools for Analyzing Data
7. ANS: B REF: Knowledge and Understanding OBJ: 3.4 Normal DistributionLOC: ST3.02 TOP: Tools for Analyzing Data
9. ANS: B REF: Knowledge and Understanding OBJ: 3.4 Normal DistributionLOC: ST3.02 TOP: Tools for Analyzing Data
10. ANS: A REF: Knowledge and Understanding OBJ: 3.4 Normal DistributionLOC: ST3.02 TOP: Tools for Analyzing Data
11. ANS: D REF: Knowledge and Understanding OBJ: 3.4 Normal DistributionLOC: ST3.02 TOP: Tools for Analyzing Data
12. ANS: C REF: Knowledge and Understanding OBJ: 3.4 Normal DistributionLOC: ST3.02 TOP: Tools for Analyzing Data
13. ANS: A REF: Application OBJ: 3.4 Normal DistributionLOC: ST3.02 TOP: Tools for Analyzing Data
14. ANS: D REF: Application OBJ: 3.4 Normal DistributionLOC: ST3.02 TOP: Tools for Analyzing Data
15. ANS: B REF: Application OBJ: 3.4 Normal DistributionLOC: ST3.02 TOP: Tools for Analyzing Data
SHORT ANSWER
16. ANS:
The area under each of these parts of the curve is .
REF: Knowledge and Understanding OBJ: 3.4 Normal DistributionLOC: ST3.02 TOP: Tools for Analyzing Data
17. ANS:The mean is 10.
REF: Knowledge and Understanding OBJ: 3.4 Normal DistributionLOC: ST3.02 TOP: Tools for Analyzing Data
18. ANS:

The standard deviation is 0.2.
REF: Knowledge and Understanding OBJ: 3.4 Normal DistributionLOC: ST3.02 TOP: Tools for Analyzing Data
19. ANS:The percent of the data contained in the interval is 47.5%.
REF: Knowledge and Understanding OBJ: 3.4 Normal DistributionLOC: ST3.02 TOP: Tools for Analyzing Data
20. ANS:The percent of the data that fall between and is 81.5%.
REF: Knowledge and Understanding OBJ: 3.4 Normal DistributionLOC: ST3.02 TOP: Tools for Analyzing Data
21. ANS:Approximately 84% of his sprints will be less than 10.0 s.
REF: Knowledge and Understanding OBJ: 3.4 Normal DistributionLOC: ST3.02 TOP: Tools for Analyzing Data
23. ANS:The fill interval this represents is 335–347 mL.
REF: Application OBJ: 3.4 Normal Distribution LOC: ST3.02TOP: Tools for Analyzing Data
24. ANS:The percent of men in this country that have to get used to ducking is 2.5%.
REF: Application OBJ: 3.4 Normal Distribution LOC: ST3.02TOP: Tools for Analyzing Data
25. ANS:You would expect to find 15 days that are comfortable for swimming.
REF: Application OBJ: 3.4 Normal Distribution LOC: ST3.02TOP: Tools for Analyzing Data
26. ANS:The percent of vehicles with a speed between 91.3 km/h and 107.6 km/h is 81.5%.
REF: Application OBJ: 3.4 Normal Distribution LOC: ST3.02TOP: Tools for Analyzing Data
27. ANS:The standard deviation is 15.
REF: Application OBJ: 3.4 Normal Distribution LOC: ST3.02TOP: Tools for Analyzing Data
28. ANS:The standard deviation is 2.1 minutes.
REF: Application OBJ: 3.4 Normal Distribution LOC: ST3.02TOP: Tools for Analyzing Data

29. ANS:The variance is 12.25.
REF: Knowledge and Understanding OBJ: 3.4 Normal DistributionLOC: ST3.02 TOP: Tools for Analyzing Data
30. ANS:The number refused membership in the club is 128 people.
REF: Application OBJ: 3.4 Normal Distribution LOC: ST3.02TOP: Tools for Analyzing Data
PROBLEM
32. ANS:The percent of data that lie between two specific values a and b is the area under the normal curve between a and b. The specific normal curve with the required mean and standard deviation must be used.
REF: Communication OBJ: 3.4 Normal DistributionLOC: ST3.02 TOP: Tools for Analyzing Data
33. ANS:The mean = 4.The standard deviation = 3.The variance = 9.
REF: Knowledge and Understanding OBJ: 3.4 Normal DistributionLOC: ST3.02 TOP: Tools for Analyzing Data
34. ANS:An IQ of 80 is further from the mean than an IQ of 100. Because a normal curve is symmetrical about the mean, the area to the left of IQ = 80 is less than the area to the right of IQ = 110. So there will be more people with an IQ greater than 100.
REF: Application OBJ: 3.4 Normal Distribution LOC: ST3.02TOP: Tools for Analyzing Data
35. ANS:To fit 95% of the waistlines, the manufacturer needs to be within 2 standard deviations of the mean or between 27.6 inches and 40.4 inches. To guarantee pants that are not too small, the manufacturer needs to make pants in sizes from 28 to 41 inclusive.
REF: Thinking/Inquiry/PS OBJ: 3.4 Normal DistributionLOC: ST3.02 TOP: Tools for Analyzing Data
36. ANS:Both intervals have the same width i.e. 3. But since the normal curve peaks at the mean, the area under the curve will be larger over the interval closer to the mean. The mean is 26, so the interval will contain a greater percent of the data.
REF: Thinking/Inquiry/PS OBJ: 3.4 Normal DistributionLOC: ST3.02 TOP: Tools for Analyzing Data
37. ANS:

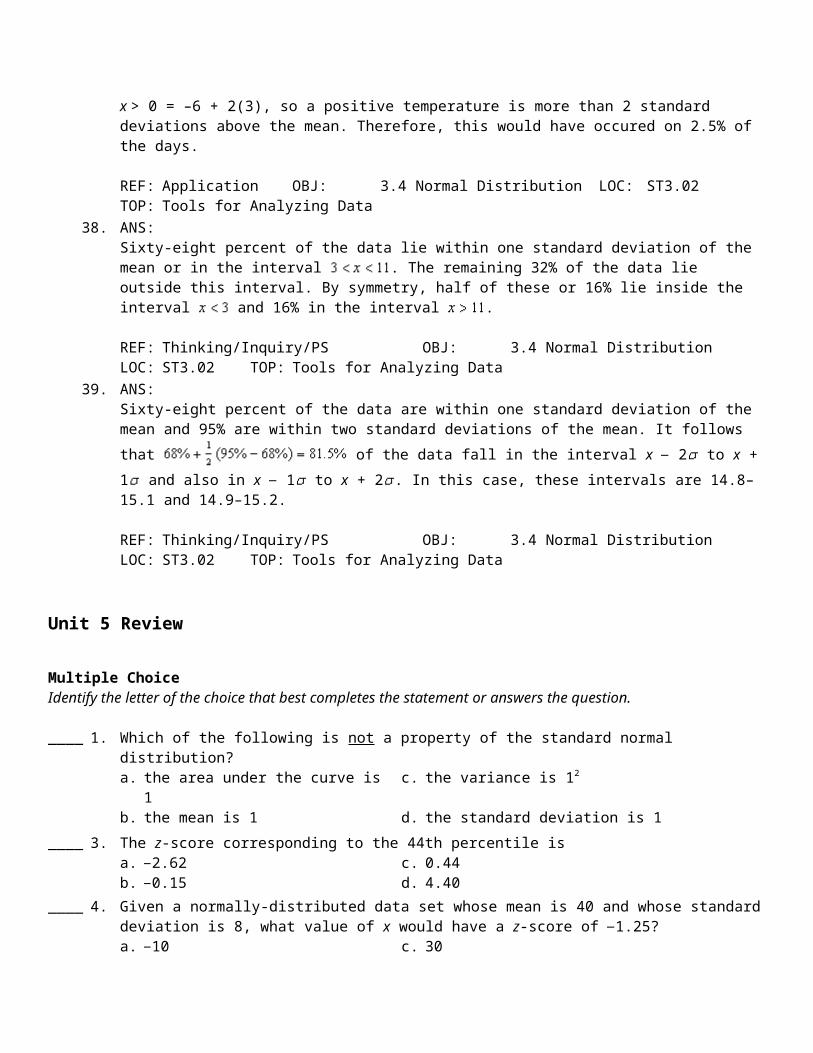
x > 0 = –6 + 2(3), so a positive temperature is more than 2 standard deviations above the mean. Therefore, this would have occured on 2.5% of the days.
REF: Application OBJ: 3.4 Normal Distribution LOC: ST3.02TOP: Tools for Analyzing Data
38. ANS:Sixty-eight percent of the data lie within one standard deviation of the mean or in the interval . The remaining 32% of the data lie outside this interval. By symmetry, half of these or 16% lie inside the interval
and 16% in the interval .
REF: Thinking/Inquiry/PS OBJ: 3.4 Normal DistributionLOC: ST3.02 TOP: Tools for Analyzing Data
39. ANS:Sixty-eight percent of the data are within one standard deviation of the mean and 95% are within two standard
deviations of the mean. It follows that of the data fall in the interval x 2 to
x + 1 and also in x 1 to x + 2 . In this case, these intervals are 14.8–15.1 and 14.9–15.2.
REF: Thinking/Inquiry/PS OBJ: 3.4 Normal DistributionLOC: ST3.02 TOP: Tools for Analyzing Data
Unit 5 Review
Multiple ChoiceIdentify the letter of the choice that best completes the statement or answers the question.
____ 1. Which of the following is not a property of the standard normal distribution?a. the area under the curve is 1 c. the variance is 12
b. the mean is 1 d. the standard deviation is 1____ 3. The z-score corresponding to the 44th percentile is
a. 2.62 c. 0.44b. 0.15 d. 4.40
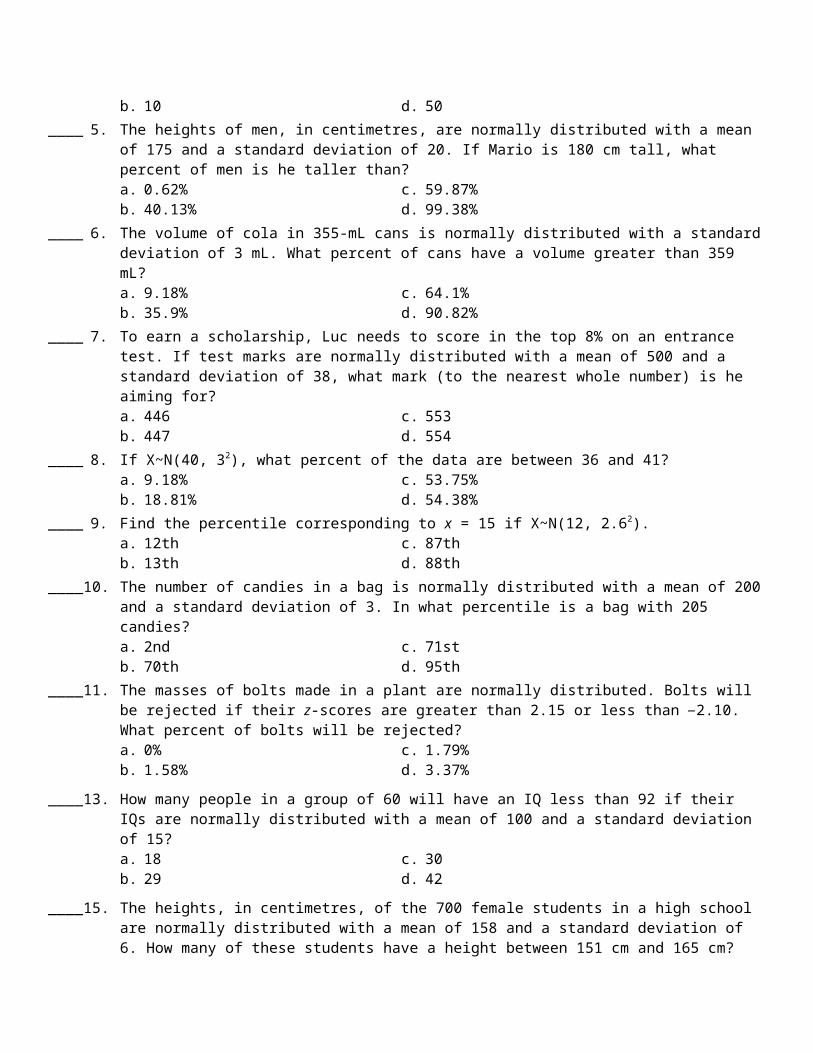
____ 4. Given a normally-distributed data set whose mean is 40 and whose standard deviation is 8, what value of x would have a z-score of 1.25?a. 10 c. 30b. 10 d. 50
____ 5. The heights of men, in centimetres, are normally distributed with a mean of 175 and a standard deviation of 20. If Mario is 180 cm tall, what percent of men is he taller than?a. 0.62% c. 59.87%b. 40.13% d. 99.38%
____ 6. The volume of cola in 355-mL cans is normally distributed with a standard deviation of 3 mL. What percent of cans have a volume greater than 359 mL?a. 9.18% c. 64.1%b. 35.9% d. 90.82%
____ 7. To earn a scholarship, Luc needs to score in the top 8% on an entrance test. If test marks are normally distributed with a mean of 500 and a standard deviation of 38, what mark (to the nearest whole number) is he aiming for?a. 446 c. 553

b. 447 d. 554____ 8. If X~N(40, 32), what percent of the data are between 36 and 41?
a. 9.18% c. 53.75%b. 18.81% d. 54.38%
____ 9. Find the percentile corresponding to x = 15 if X~N(12, 2.62).a. 12th c. 87thb. 13th d. 88th
____ 10. The number of candies in a bag is normally distributed with a mean of 200 and a standard deviation of 3. In what percentile is a bag with 205 candies?a. 2nd c. 71stb. 70th d. 95th
____ 11. The masses of bolts made in a plant are normally distributed. Bolts will be rejected if their z-scores are greater than 2.15 or less than 2.10. What percent of bolts will be rejected?a. 0% c. 1.79%b. 1.58% d. 3.37%
____ 13. How many people in a group of 60 will have an IQ less than 92 if their IQs are normally distributed with a mean of 100 and a standard deviation of 15?a. 18 c. 30b. 29 d. 42
____ 15. The heights, in centimetres, of the 700 female students in a high school are normally distributed with a mean of 158 and a standard deviation of 6. How many of these students have a height between 151 cm and 165 cm?a. 527 c. 530b. 528 d. 531
Short Answer
16. Calculate the z-score, to one decimal place, of x = 7.2 if = 8.1 and = 3.
17. Ravi’s math contest result put him in the 97th percentile. If 4000 students competed, how many had a score higher than Ravi’s score?
18. What percentile corresponds to a normal z-score of 1.24?
19. What normal z-score corresponds to the 14th percentile?
20. Suppose X~N(50, 42). What value of x would have a z-score of 2.10?
21. Waiting times in minutes for a teller in a bank are normally distributed with a mean of 6.0 and standard deviation of 1.2. What z-score corresponds to a waiting time of 6.9 minutes?
22. The numbers of peanuts in a bag are normally distributed with a mean of 150 and a standard deviation of 8. What percent of bags have fewer than 140 peanuts?
23. IQ scores are normally distributed with a mean of 100 and a standard deviation of 15. What IQ (to the nearest whole number) is required to be in the top 15?
24. In X~N(12, 22), what percent of the data is between 10 and 13?
25. Rosa has a pulse rate of 60 bpm. If pulse rates of humans are normally distributed with a mean of 72 bpm and a standard deviation of 9 bpm, what percentile is Rosa’s pulse rate in?

26. The lengths of nails, in millimetres, at a certain plant are normally distributed with a mean of 20.00 and a standard deviation of 0.21. Nails produced will be rejected unless their lengths are between 19.71 mm and 20.42 mm. What percent of the nails are accepted?
27. The masses, in grams, of 750 packages of cheese are normally distributed. A package will be rejected if its z-score is 2.57 or less. How many of these packages face rejection?
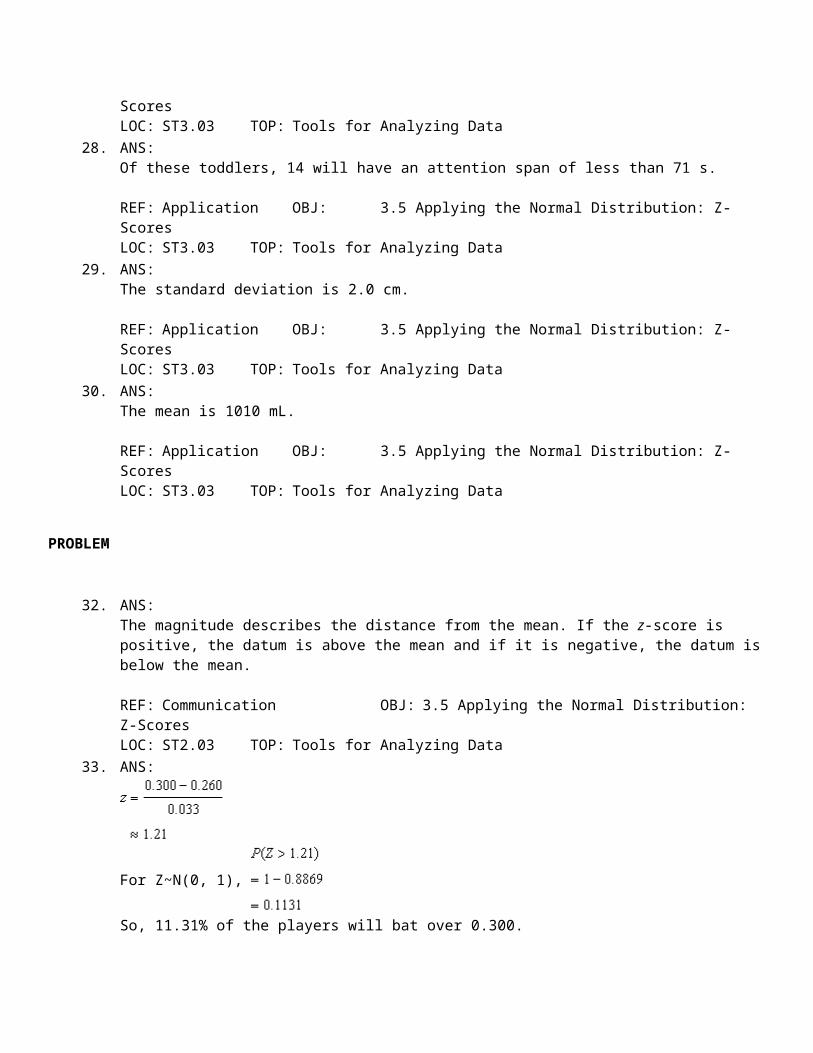
28. The maximum attention spans, in seconds, of 40 two-year-olds are normally distributed with a mean of 75 and a standard deviation of 10. How many of these toddlers will have an attention span of less than 71 s?
29. The lengths of sunfish in Grenadier Pond are normally distributed with a mean of 15 cm. Find the standard deviation, to one decimal place if 91% of these fish have a length less than 17.7 cm.
30. The volumes of apple juice in cartons are normally distributed with a standard deviation of 120 mL. Find the mean, to the nearest whole number, if 34% of these cartons contain less that 961 mL of juice.
Problem
32. Explain what information is given by the magnitude and sign of the z-score of a piece of data.
33. Batting averages in a softball league are normally distributed with a mean of 0.260 and a standard deviation of 0.033. What percent of players have a batting average greater then 0.300?
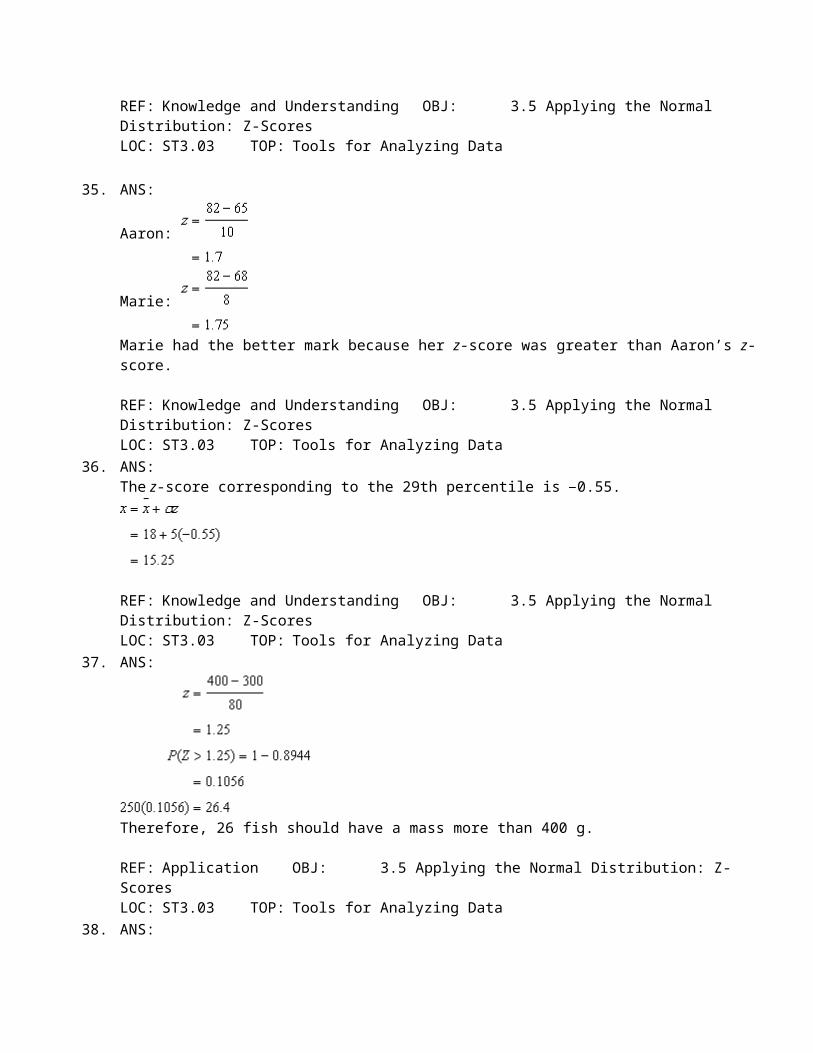
35. Both Aaron and Marie, who attended different schools, finished grade 12 with final averages of 82. The mean of these averages in Aaron’s school was 65 and the standard deviation was 10. In Marie’s school, the mean was 68 and the standard deviation was 8. Use z-scores to determine who had the better mark.
36. For X~N(18, 52), find the value of x that corresponds to the 29th percentile.
37. How many of the 250 perch netted by a fisherman would you expect to have a mass more than 400 g, if the distribution of their masses in approximately normal with a mean of 300 g and a standard deviation of 80 g?
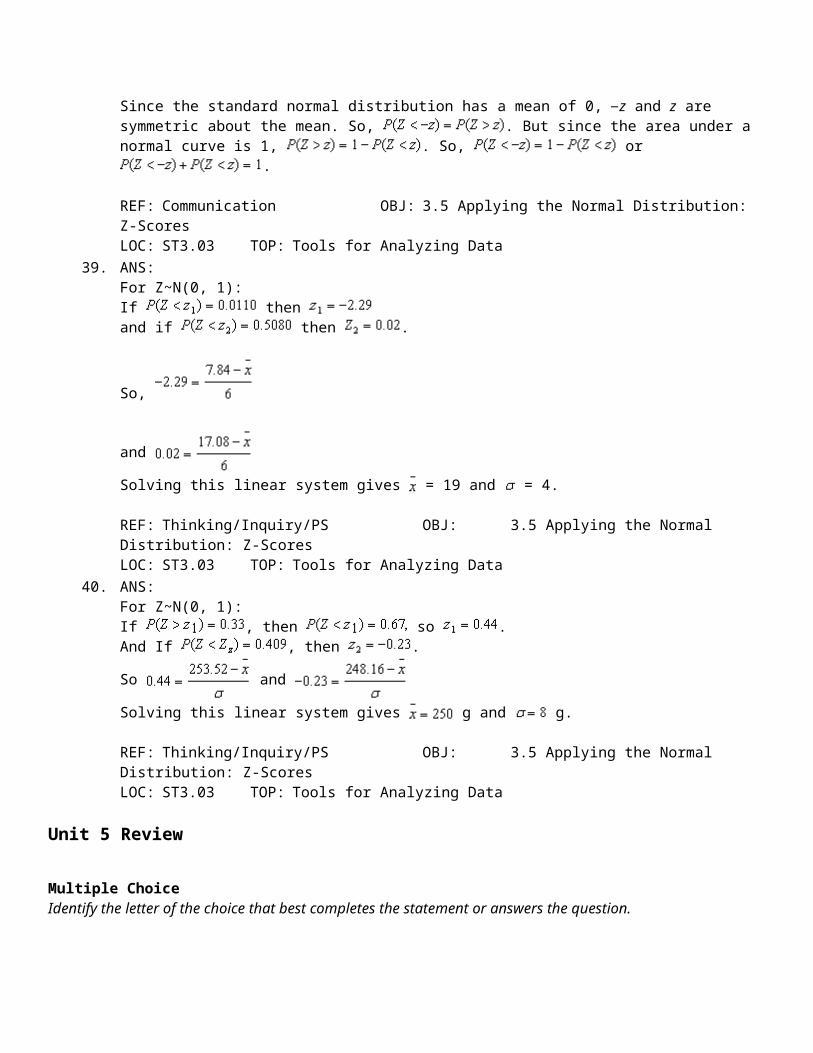
38. Freya was using a z-score table and noticed that . She saw that this pattern holds for other z-scores. Explain why this pattern occurs.
39. Find and for normally distributed x, if 1.1% of the data are less than 7.84 and 50.8% of the data are less than 17.08.
40. The masses of Burgerville’s half-pounders are normally distributed. Of these burgers, 33% have masses greater then 253.52 g and 40.9% of them have masses less than 248.16 g. Find the mean and standard deviation of the half-pounder masses.

Unit 5 ReviewAnswer Section
MULTIPLE CHOICE
1. ANS: B REF: Knowledge and UnderstandingOBJ: 3.5 Applying the Normal Distribution: Z-Scores LOC: ST3.02TOP: Tools for Analyzing Data
2. ANS: A REF: Knowledge and UnderstandingOBJ: 3.5 Applying the Normal Distribution: Z-Scores LOC: ST2.03TOP: Tools for Analyzing Data
3. ANS: B REF: Knowledge and UnderstandingOBJ: 3.5 Applying the Normal Distribution: Z-Scores LOC: ST2.03TOP: Tools for Analyzing Data
4. ANS: C REF: Knowledge and UnderstandingOBJ: 3.5 Applying the Normal Distribution: Z-Scores LOC: ST2.03TOP: Tools for Analyzing Data
5. ANS: C REF: Knowledge and UnderstandingOBJ: 3.5 Applying the Normal Distribution: Z-Scores LOC: ST3.03TOP: Tools for Analyzing Data
6. ANS: A REF: Knowledge and UnderstandingOBJ: 3.5 Applying the Normal Distribution: Z-Scores LOC: ST3.03TOP: Tools for Analyzing Data
7. ANS: D REF: Knowledge and UnderstandingOBJ: 3.5 Applying the Normal Distribution: Z-Scores LOC: ST3.03TOP: Tools for Analyzing Data
8. ANS: C REF: Knowledge and UnderstandingOBJ: 3.5 Applying the Normal Distribution: Z-Scores LOC: ST3.03TOP: Tools for Analyzing Data
9. ANS: C REF: Knowledge and UnderstandingOBJ: 3.5 Applying the Normal Distribution: Z-Scores LOC: ST2.03TOP: Tools for Analyzing Data
10. ANS: D REF: Knowledge and UnderstandingOBJ: 3.5 Applying the Normal Distribution: Z-Scores LOC: ST3.03TOP: Tools for Analyzing Data
11. ANS: D REF: Knowledge and UnderstandingOBJ: 3.5 Applying the Normal Distribution: Z-Scores LOC: ST3.03TOP: Tools for Analyzing Data
12. ANS: B REF: Knowledge and UnderstandingOBJ: 3.5 Applying the Normal Distribution: Z-Scores LOC: ST3.03TOP: Tools for Analyzing Data
13. ANS: A REF: Application OBJ: 3.5 Applying the Normal Distribution: Z-ScoresLOC: ST3.03 TOP: Tools for Analyzing Data
14. ANS: A REF: Application OBJ: 3.5 Applying the Normal Distribution: Z-ScoresLOC: ST3.03 TOP: Tools for Analyzing Data
15. ANS: D REF: Application OBJ: 3.5 Applying the Normal Distribution: Z-ScoresLOC: ST3.03 TOP: Tools for Analyzing Data

SHORT ANSWER
16. ANS:The z-score is 0.3.
REF: Knowledge and Understanding OBJ: 3.5 Applying the Normal Distribution: Z-ScoresLOC: ST2.03 TOP: Tools for Analyzing Data
17. ANS:The number of students with a score higher than Ravi’s is 120.
REF: Knowledge and Understanding OBJ: 3.5 Applying the Normal Distribution: Z-ScoresLOC: ST2.03 TOP: Tools for Analyzing Data
18. ANS:The percentile that corresponds to a z-score of 1.24 is the 89th percentile.
REF: Knowledge and Understanding OBJ: 3.5 Applying the Normal Distribution: Z-ScoresLOC: ST3.03 TOP: Tools for Analyzing Data
19. ANS:The normal z-score is z = 1.08.
REF: Knowledge and Understanding OBJ: 3.5 Applying the Normal Distribution: Z-ScoresLOC: ST3.03 TOP: Tools for Analyzing Data
20. ANS:The value of x would be 58.4.
REF: Knowledge and Understanding OBJ: 3.5 Applying the Normal Distribution: Z-ScoresLOC: ST3.03 TOP: Tools for Analyzing Data
21. ANS:The z-score of 0.75 corresponds to a waiting time of 6.9 minutes.
REF: Knowledge and Understanding OBJ: 3.5 Applying the Normal Distribution: Z-ScoresLOC: ST3.03 TOP: Tools for Analyzing Data
22. ANS:The percent of bags that have fewer than 140 peanuts is 10.56%.
REF: Knowledge and Understanding OBJ: 3.5 Applying the Normal Distribution: Z-ScoresLOC: ST3.03 TOP: Tools for Analyzing Data
23. ANS:An IQ of 116 is required to be in the top 15.
REF: Knowledge and Understanding OBJ: 3.5 Applying the Normal Distribution: Z-ScoresLOC: ST3.03 TOP: Tools for Analyzing Data
24. ANS:The percent of the data between 10 and 13 is 53.28%.
REF: Knowledge and Understanding OBJ: 3.5 Applying the Normal Distribution: Z-ScoresLOC: ST3.03 TOP: Tools for Analyzing Data
25. ANS:Rosa’s pulse rate is in the 9th percentile.

REF: Knowledge and Understanding OBJ: 3.5 Applying the Normal Distribution: Z-ScoresLOC: ST3.03 TOP: Tools for Analyzing Data
26. ANS:The percent of the nails that are accepted is 89.34%.
REF: Knowledge and Understanding OBJ: 3.5 Applying the Normal Distribution: Z-ScoresLOC: ST3.03 TOP: Tools for Analyzing Data
27. ANS:Of these packages, 4 face rejection.
REF: Application OBJ: 3.5 Applying the Normal Distribution: Z-ScoresLOC: ST3.03 TOP: Tools for Analyzing Data
28. ANS:Of these toddlers, 14 will have an attention span of less than 71 s.
REF: Application OBJ: 3.5 Applying the Normal Distribution: Z-ScoresLOC: ST3.03 TOP: Tools for Analyzing Data
29. ANS:The standard deviation is 2.0 cm.
REF: Application OBJ: 3.5 Applying the Normal Distribution: Z-ScoresLOC: ST3.03 TOP: Tools for Analyzing Data
30. ANS:The mean is 1010 mL.
REF: Application OBJ: 3.5 Applying the Normal Distribution: Z-ScoresLOC: ST3.03 TOP: Tools for Analyzing Data
PROBLEM
32. ANS:The magnitude describes the distance from the mean. If the z-score is positive, the datum is above the mean and if it is negative, the datum is below the mean.
REF: Communication OBJ: 3.5 Applying the Normal Distribution: Z-ScoresLOC: ST2.03 TOP: Tools for Analyzing Data
33. ANS:
For Z~N(0, 1),
So, 11.31% of the players will bat over 0.300.
REF: Knowledge and Understanding OBJ: 3.5 Applying the Normal Distribution: Z-Scores
LOC: ST3.03 TOP: Tools for Analyzing Data
35. ANS:
Aaron:
Marie:
Marie had the better mark because her z-score was greater than Aaron’s z-score.
REF: Knowledge and Understanding OBJ: 3.5 Applying the Normal Distribution: Z-ScoresLOC: ST3.03 TOP: Tools for Analyzing Data
36. ANS:The z-score corresponding to the 29th percentile is 0.55.
REF: Knowledge and Understanding OBJ: 3.5 Applying the Normal Distribution: Z-ScoresLOC: ST3.03 TOP: Tools for Analyzing Data
37. ANS:
Therefore, 26 fish should have a mass more than 400 g.
REF: Application OBJ: 3.5 Applying the Normal Distribution: Z-ScoresLOC: ST3.03 TOP: Tools for Analyzing Data
38. ANS:Since the standard normal distribution has a mean of 0, z and z are symmetric about the mean. So,
. But since the area under a normal curve is 1, . So, or .
REF: Communication OBJ: 3.5 Applying the Normal Distribution: Z-ScoresLOC: ST3.03 TOP: Tools for Analyzing Data
39. ANS:For Z~N(0, 1):If then and if then .
So,
and
Solving this linear system gives = 19 and = 4.
REF: Thinking/Inquiry/PS OBJ: 3.5 Applying the Normal Distribution: Z-ScoresLOC: ST3.03 TOP: Tools for Analyzing Data
40. ANS:For Z~N(0, 1):If , then so .And If , then .
So and
Solving this linear system gives g and g.
REF: Thinking/Inquiry/PS OBJ: 3.5 Applying the Normal Distribution: Z-ScoresLOC: ST3.03 TOP: Tools for Analyzing Data
Unit 5 Review
Multiple ChoiceIdentify the letter of the choice that best completes the statement or answers the question.
____ 2. Which of the following is not an example of a Bernoulli Trial?a. A coin is tossed 20 times and the number of heads is recorded.b. A container contains 49 numbered balls. Six are drawn one at a time from the container.c. A couple produces 18 children. The number of female children is recorded.d. A batter has a lifetime average of .300. The number of hits in 5 successive at-bats is
recorded.
____ 3. In the expression , which value represents the number of trials?
a. 2 c. 5b. 3 d. 8
____ 4. In the expression , which value represents the probability of failure?
a. 0.6 c. (0.4)2
b. 0.4 d. (0.6)5
____ 6. Which expression describes the probability of k “3s” being rolled on 20 successive rolls of a six-sided die?

a. c.
b. d.
____ 7. A baseball player hits the ball to left field 20% of the time, to centre field 35% of the time, and to right field 45% of the time. Which of the following expressions gives the probability distribution for the number of hits to centre field for a game in which the batter gets 5 hits?a. c.
b. d.
____ 8. The probability of a computer memory chip being defective is 0.02. Which of the following statements is true?a. In a shipment of 100 chips, two will be defective.b. The expected number of defective chips in a shipment of 500 is ten.c. In a shipment of 1000 chips, it is certain that at least one will be defective.d. All statements above are false.
____ 9. A young couple plans to have a family with four children. Assuming that the behaviour of their first child does not cause them to alter their plans, what is the expected number of girls for their family?a. 2.5 c. 2b. 2.25 d. 1.5
____ 10. The probability of success for a binomial experiment is greater than 0.5. Which is the most accurate description of the graph of its probability distribution?a. symmetrical c. highest point is right of centreb. highest point is left of centre d. all bars have equal height
____ 11. What is the smallest p value that will give a probability of at least 0.5 that an experiment will be successful four times in four trials?a. c. 0.9
b. 0.85 d.
____ 12. A young couple hopes to have two children. They would like the first to be a boy and the second to be a girl. What is the probability that their first two children will arrive as described?a. 0 c. 0.5b. 0.25 d. 0.75
____ 13. In the expression , which value represents the number of failures?
a. 6 c. 4b. 2 d. 1
____ 14. Which statement regarding the probability distribution for a binomial experiment with p = 0.5 is not true?

a. The probability of no successes must equal the probability of no failures.b. The graph of the distribution is symmetrical.c. The expected value of the experiment is half the number of trials.d. The more trials that are made, the higher the probability that all trials will be successful.
Short Answer
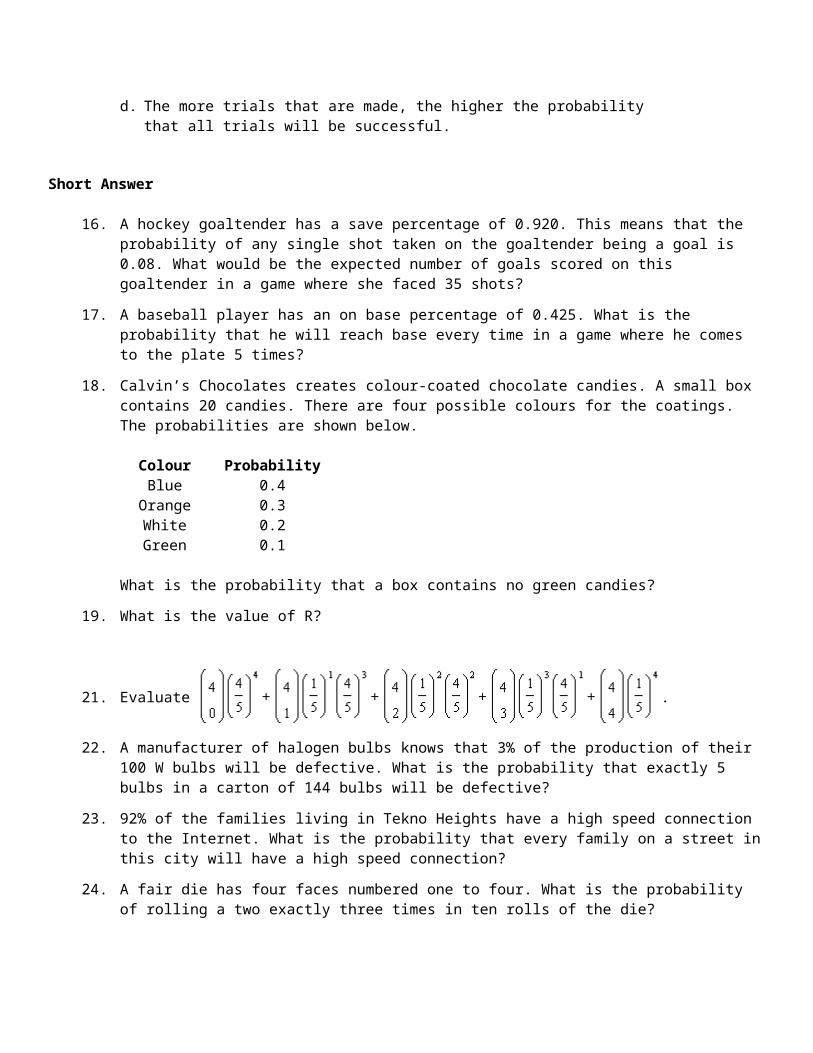
16. A hockey goaltender has a save percentage of 0.920. This means that the probability of any single shot taken on the goaltender being a goal is 0.08. What would be the expected number of goals scored on this goaltender in a game where she faced 35 shots?
17. A baseball player has an on base percentage of 0.425. What is the probability that he will reach base every time in a game where he comes to the plate 5 times?
18. Calvin’s Chocolates creates colour-coated chocolate candies. A small box contains 20 candies. There are four possible colours for the coatings. The probabilities are shown below.
Colour ProbabilityBlue 0.4
Orange 0.3White 0.2Green 0.1
What is the probability that a box contains no green candies?
19. What is the value of R?
21. Evaluate .
22. A manufacturer of halogen bulbs knows that 3% of the production of their 100 W bulbs will be defective. What is the probability that exactly 5 bulbs in a carton of 144 bulbs will be defective?
23. 92% of the families living in Tekno Heights have a high speed connection to the Internet. What is the probability that every family on a street in this city will have a high speed connection?
24. A fair die has four faces numbered one to four. What is the probability of rolling a two exactly three times in ten rolls of the die?
25. Suggest a simple formula for the probability of k successes in n attempts for a binomial experiment in which the probability of success is equal to the probability of failure.
26. Explain why the probability of drawing six red cards drawn in a 13 card bridge hand cannot be determined
using the expression .

27. Create a question related to the colour of drawn playing cards for which the expression will
give the value of the requested probability.
28. A packet of carrot seeds has a germination rate of 92%. In other words, the probability of any seed sprouting is 0.92. How many seedlings would you expect in a row of 50 seeds?
29. A packet of vegetable seeds has a germination rate of 96%. What is the probability that exactly 10 of 12 seeds planted will sprout?
30. Bilal is an enthusiastic reader. The probability that he will purchase a novel on any given trip to the mall is 0.4. He plans to make five trips to the mall next week. What is the probability that he will purchase only one book?
Problem
31. a) Explain why recording the value rolled for each of 50 rolls of a six-sided die is not a binomial experiment.
b) Describe a binomial experiment that involves rolling a die 50 times.
32. A student writes a five question multiple-choice quiz. Each question has four possible responses. The student guesses at random for each question. Calculate the probability for each possible score on the test from 0 to 5.
33. There are 10 members on a committee. The probability of any member attending a randomly chosen meeting is 0.9. The committee cannot do business if more than 3 members are absent. What is the probability that 7 or more members will be present on a given date?
34. A school fills each of its Grade 9 mathematics classes with 22 students. Assume that the likelihood of a male or female being given a place in a class is equal. Design a simulation that could be used to model the distribution of males and females in these classes.
35. A small math class consists of 16 students. What is the probability that the difference in the number of male and female students in the class is greater than 4?
36. A baseball player has a batting average of 0.350. Compare the expected value for his number of hits in a game with 6 at bats to the probability of the number of hits he is most likely to get.
38. Describe a simulation that would model the binomial distribution for the number of donations obtained by a volunteer for a charity if the neighbourhood being canvassed has a long-term contribution rate of 30% and the volunteer visits 20 homes.
39. A salesman has a 20% probability of making a sale to any customer who enters his department. On a typical day, he will meet 30 customers. What minimum number of sales will he have an 88% certainty of making for any given day?
40. A manufacturing company produces precut tubing for lawn chairs. Management has decided that they can accept 15% of their production outside the specified tolerances. The floor manager samples 10 parts per hour from the production and stops the line if 2 parts or more from the sample are outside tolerance.a) If the actual defect rate was 16%, what is the probability that the line would be shut down?b) For the same defect rate, what is the probability that the line would be shut down if the sample was
increased to 20 parts but production was still stopped when 2 defective parts were found in a sample? Would you recommend making this change?

Unit 5 ReviewAnswer Section
MULTIPLE CHOICE
2. ANS: A REF: Knowledge and Understanding OBJ: 5.3 Binomial DistributionsLOC: CP2.05 TOP: Probability Distributions and Predictions
3. ANS: D REF: Knowledge and Understanding OBJ: 5.3 Binomial DistributionsLOC: CP2.05 TOP: Probability Distributions and Predictions
4. ANS: A REF: Knowledge and Understanding OBJ: 5.3 Binomial DistributionsLOC: CP2.05 TOP: Probability Distributions and Predictions
6. ANS: A REF: Knowledge and Understanding OBJ: 5.3 Binomial DistributionsLOC: CP2.05 TOP: Probability Distributions and Predictions
7. ANS: C REF: Application OBJ: 5.3 Binomial DistributionsLOC: CP2.05, CP2.06 TOP: Probability Distributions and Predictions
8. ANS: B REF: Knowledge and Understanding OBJ: 5.3 Binomial DistributionsLOC: CP2.06 TOP: Probability Distributions and Predictions
9. ANS: C REF: Knowledge and Understanding OBJ: 5.3 Binomial DistributionsLOC: CP2.04, CP2.05 TOP: Probability Distributions and Predictions
10. ANS: C REF: Knowledge and Understanding OBJ: 5.3 Binomial DistributionsLOC: CP2.05 TOP: Probability Distributions and Predictions
11. ANS: A REF: Knowledge and Understanding OBJ: 5.3 Binomial DistributionsLOC: CP2.05 TOP: Probability Distributions and Predictions
12. ANS: B REF: Knowledge and Understanding OBJ: 5.3 Binomial DistributionsLOC: CP2.05 TOP: Probability Distributions and Predictions
13. ANS: C REF: Knowledge and Understanding OBJ: 5.3 Binomial DistributionsLOC: CP2.05 TOP: Probability Distributions and Predictions
14. ANS: D REF: Communication OBJ: 5.3 Binomial DistributionsLOC: CP2.05 TOP: Probability Distributions and Predictions
SHORT ANSWER
16. ANS:2.8 goals
REF: Application OBJ: 5.3 Binomial Distributions LOC: CP2.04, CP2.05TOP: Probability Distributions and Predictions
17. ANS:0.0139
REF: Application OBJ: 5.3 Binomial Distributions LOC: CP2.05, CP2.06TOP: Probability Distributions and Predictions
18. ANS:0.1216

REF: Application OBJ: 5.3 Binomial Distributions LOC: CP2.06TOP: Probability Distributions and Predictions
19. ANS:0.21875
REF: Knowledge and Understanding OBJ: 5.3 Binomial DistributionsLOC: CP2.05 TOP: Probability Distributions and Predictions
21. ANS:1
REF: Knowledge and Understanding OBJ: 5.3 Binomial DistributionsLOC: CP2.05 TOP: Probability Distributions and Predictions
22. ANS:0.169
REF: Application OBJ: 5.3 Binomial Distributions LOC: CP2.05TOP: Probability Distributions and Predictions
23. ANS:0.1887
REF: Application OBJ: 5.3 Binomial Distributions LOC: CP2.05TOP: Probability Distributions and Predictions
24. ANS:0.2503
REF: Knowledge and Understanding OBJ: 5.3 Binomial DistributionsLOC: CP2.05 TOP: Probability Distributions and Predictions
25. ANS:
REF: Knowledge and Understanding OBJ: 5.3 Binomial DistributionsLOC: CP2.05 TOP: Probability Distributions and Predictions
26. ANS:The hand of cards is dealt one card at a time from a deck of 52 cards. As each card is dealt, the probability of the next card being red changes depending on the number of red cards left in the deck. For comparison, the value given by the expression in the question is 0.2095. The correct value of 0.2385 is given by the number of
possible arrangements for six red and seven black cards, which is , divided by the total number of
possible hands, which is .
REF: Communication OBJ: 5.3 Binomial DistributionsLOC: CP2.05 TOP: Probability Distributions and Predictions
27. ANS:A card is drawn from a deck of cards, its colour is recorded, and the card is returned to a random spot in the deck. This experiment is repeated five times. What is the probability that four red (or black) cards will be drawn?
REF: Communication OBJ: 5.3 Binomial DistributionsLOC: CP2.05 TOP: Probability Distributions and Predictions
28. ANS:46
REF: Application OBJ: 5.3 Binomial Distributions LOC: CP2.04, CP2.05TOP: Probability Distributions and Predictions
29. ANS:0.0702
REF: Application OBJ: 5.3 Binomial Distributions LOC: CP2.05TOP: Probability Distributions and Predictions
30. ANS:0.2592
REF: Application OBJ: 5.3 Binomial Distributions LOC: CP2.05TOP: Probability Distributions and Predictions
PROBLEM
31. ANS:a) A binomial experiment may have only two possible outcomes: success or failure. By recording each value
observed, there are six possible outcomes for the experiment described.b) We could choose one value as a successful outcome and consider any other outcome to be a failure. We
would then have a binomial distribution with the general term .
REF: Communication OBJ: 5.3 Binomial DistributionsLOC: CP2.05 TOP: Probability Distributions and Predictions
32. ANS:
REF: Application OBJ: 5.3 Binomial Distributions LOC: CP2.05TOP: Probability Distributions and Predictions
33. ANS:The total probability is the sum of the probabilities for having 7, 8, 9 or 10 members present.
The total probability is 0.9872.
REF: Application OBJ: 5.3 Binomial Distributions LOC: CP2.05TOP: Probability Distributions and Predictions
34. ANS:A simple simulation could involve using a coin and assigning one face to represent a male student and the other face to represent a female student. The coin would be tossed 22 times to simulate filling one class. Successive repetitions could provide as many sample classes as needed to model the probability distribution.
REF: Thinking/Inquiry/PS OBJ: 5.3 Binomial DistributionsLOC: CPV.03 TOP: Probability Distributions and Predictions
35. ANS:There are five cases where the gender split is 4 or less. These are 8M/8F, 9M/7F, 9F/7M, 10M/6F, and 10F/6M. Subtract the sum of these probabilities from 1 to obtain the requested probability. Define X as the random variable representing the number of males in the class.
P(X = 6, 7, 8, 9, 10) = 0.1964 + 2(0.1746) + 2(0.1222) = 0.79This represents the probability that the gender split is 4 or less. The requested probability is 0.21.
REF: Application OBJ: 5.3 Binomial Distributions LOC: CP2.05TOP: Probability Distributions and Predictions
36. ANS:The expected value for a binomial distribution is E(X) = np. In this case, we have 6 trials and a probability of success of 0.350. The expected number of hits is 2.1.
The actual probability of getting r hits in 6 at bats is given by . This gives
P(X = 1) = 0.2437, P(X = 2) = 0.328, and P(X = 3) = 0.235.The most likely number of hits is closest to the expected value, while the next most likely numbers of hits are on either side of the expected value.
REF: Application OBJ: 5.3 Binomial Distributions LOC: CP2.05TOP: Probability Distributions and Predictions
38. ANS:For a non-technological solution, we could make a spinner with its face divided into a 30% area that would be considered success, with the remaining 70% representing failure. The individual who performs the simulation will then spin 20 times and record the number of successes for the 20 spins (X would be the random variable representing the number of successes in 20 tries). This procedure would be repeated many times and the number of successes for each 20 spin trial would be recorded in a distribution chart or graph that shows the frequency for each possible value of the random variable. The experimental probability should approximate the binomial probability once the number of trials is large enough.
REF: Communication OBJ: 5.3 Binomial DistributionsLOC: CPV.03 TOP: Probability Distributions and Predictions
39. ANS:Let X represent the number of sales made. Calculate the probability for each value of X starting at 0. Once we have a total probability of 10% for the first n values, then we will have a 90% probability that X > n.

The salesman will make 3 or fewer sales on 12.3% of the days he works. He would expect to make 4 or more sales on the remaining 87.7% of the days he works.
REF: Thinking/Inquiry/PS OBJ: 5.3 Binomial DistributionsLOC: CP2.05 TOP: Probability Distributions and Predictions
40. ANS:a) We can find the probability that the line will not be shut down with this procedure, which is the
probability of having 0 or 1 defects in the sample.
P(X = 0 or 1) = 0.508The probability that the line would be shut down for a 16% defect rate is 0.492 or just slightly less than half.
b) Repeat the calculations from above for a sample of 20.
P(X = 0 or 1) = 0.1471By changing the sample size to 20, we now have an 85.3% probability that the line will be shut down. I would not recommend making this change. If we check what would happen when applying the test to a 14% defect rate (which is acceptable), we would be shutting down the line 79.2% of the time.
REF: Thinking/Inquiry/PS OBJ: 5.3 Binomial DistributionsLOC: CP2.05 TOP: Probability Distributions and Predictions
Unit 5 Review

Multiple ChoiceIdentify the letter of the choice that best completes the statement or answers the question.
____ 1. For which of the following binomial experiments could the normal approximation not be applied?a. n = 10 and p = 0.5 c. n = 100 and p = 0.4b. n = 20 and p = 0.2 d. n = 20 and p = 0.3
____ 2. What is the value of for the normal approximation to a binomial experiment with 50 trials and a 40% likelihood of success for any given trial?a. c. 20b. 22.5 d. 25
____ 3. A coin is tossed five times. What is the probability of observing exactly three heads?a. c.
b. d.
____ 4. A Bernoulli trial has a probability of success of 0.4. What is the smallest number of trials for which a normal distribution can be used to approximate its probability distribution?a. 12.5 c. 10b. 20 d. 13
____ 5. The z-score for a particular value of X is 0.18. What is the total probability of this or any smaller value of X occurring?a. 42.9% c. 96.4%b. 57.1% d. 3.6%
____ 6. In order to approximate the probability that X = 15 or X = 16 for a binomial distribution, what boundary values should we choose to obtain our z-scores?a. 15 < X < 16 c. 14.5 < X < 16.5b. 14 < X < 17 d. none of the above
____ 7. The probability distribution for a binomial experiment with n = 10 and p = 0.4 is graphed. Which of the following statements is least likely to be true?a. The highest bar should be above X = 4.b. The graph will be higher on the left than on the right.c. The graph will be highly symmetrical.d. The bar above X = 3 will be higher than the bar above X = 5.
____ 8. The normal approximations to two binomial experiments are compared. Both have 20 trials, but the first has p = 0.4 and the second has p = 0.7. Which statement is not true?a. Both binomial distributions may be approximated by a suitable normal distribution.b. The first distribution is more symmetrical than the second.c. The highest point for the first distribution is found above X = 8.d. The normal approximation is a closer fit to the actual binomial distribution for the second
experiment than for the first.____ 9. Which of the following binomial experiments has the normal approximation with the smallest standard
deviation?a. n = 50 and p = 0.45 c. n = 40 and p = 0.55b. n = 20 and p = 0.45 d. n = 10 and p = 0.55
____ 10. The probability of a parent allowing a child to play in the sprinkler when the temperature is above 28°C is 0.8. What is the probability that exactly 15 of 20 children will be allowed to play in their sprinklers on a day above this temperature?a. 0.75 c. 0.1746
b. 0.714 d. 0.315____ 11. What is the value of the standard deviation for the normal approximation to a binomial distribution with 600
trials and a probability of success of 0.6?a. 12 c. 6b. d. 0.24
____ 12. What is the z-score associated with observing 5 or fewer heads for 8 tosses of a fair coin?a. c.
b. d.
____ 13. A die is rolled 12 times. Calculate the probability that a 5 appears exactly twice.a. 0.1667 c. 0.0139b. 0.2961 d. 0.0004
____ 15. An antibiotic is effective against a particular strain of streptococcus 70% of the time. What is the probability that at least 70 of 100 cases will respond when treated with this antibiotic?a. 54.4% c. 70%b. 45.6% d. 49%
Short Answer
16. What is the mean value for a binomial experiment with 45 repetitions and a probability of success of 0.25?
17. Calculate the standard deviation for the normal approximation to the binomial distribution for an experiment with 300 trials and a probability of success of 0.27.
18. Express the z-score for a particular value of X in a binomial distribution in terms of X, n, p, and q where q = 1 – p.
19. A golfer makes 80% of her putts from a distance of 5 metres or less from the hole. In order to calculate the probability that she would make 23 out of 27 putts or better on a given day, what boundary value should be chosen for X in order to find the appropriate z-score?
20. What is the z-score needed to approximate the probability of observing 5 or fewer heads when tossing a fair coin 8 times?
21. What information is provided by the values given in a table of areas under the normal distribution curve?
22. The probability of success for a binomial experiment is 0.25. What is the smallest number of trials for which we may apply the normal approximation?
23. Describe how to find the probability that A X B using the normal approximation to the binomial distribution.
25. A bag contains 120 marbles, of which 15 are known to be white. Marbles are drawn one at a time from the bag. The colour is recorded and the marble is returned to the bag. What is the probability that exactly 3 of 16 marbles drawn will be white?
26. What is the mean value for the normal approximation to a binomial experiment with 75 repetitions and a probability of success of 32%?

27. A student guesses at all 10 questions on a true/false test. What is the probability that he will get exactly 5 answers correct?
28. It is known that 10% of the population is left-handed. In a random sample of 200 people, what is the probability that exactly 18 are left-handed?
29. Compare the standard deviation for the normal approximation to a binomial experiment with p = 0.43 for 100 trials and 400 trials.
30. What is the range of probabilities for which the normal approximation may be applied if 40 Bernoulli trials are performed?
Problem
31. The normal approximation to a binomial distribution becomes less accurate for a fixed value of n as the value of p moves farther away from 0.5. However, for a fixed value of p, the approximation becomes more accurate as the value of n increases. Demonstrate that this is likely to be true by comparing the probabilities of the three values closest to the expected value for n = 14, p = 0.3 and n = 34, p = 0.3.
32. A student is asked to compare the normal approximations for two binomial experiments, one of which has n = 40 and p = 0.45 and the other has n = 40 and p = 0.6. The student knows that the value of the mean must be greater than 5 in order to apply the normal approximation. He claims that the second distribution will be a closer fit than the first because the mean for the second is 24, which is larger than the mean for the first which is 18. “24 is further from 5 than 18, so the second must get a better fit from the normal approximation.” Discuss the accuracy of this claim.
33. A weighted die is tossed 30 times. The probability of rolling a 6 with this unfair die is 0.25. What is the probability of observing a 6 more than 10 times for the 30 tosses?
34. A coin is tossed 30 times. Calculate the probability that either 17 or 18 heads will be observed and then find the value provided by the normal approximation for the same interval. What is the percentage error resulting from the approximation?
35. A car salesman has a long-term average of selling a car to 7% of the potential customers he meets. What is the probability he will sell at least 5 cars in a given week if he meets 80 potential customers?
37. Describe the similarities and differences for the normal approximations to the binomial distributions for which n = 50, p = 0.2 and n = 50, p = 0.8.
38. The largest z-score available in most tables is 2.99, which corresponds to a probability of 99.86%. A fair coin is tossed 200 times.a) What number of heads observed would correspond to a z-score of 2.99?b) Make a probability statement involving the number of heads found in a).
39. Rudoph’s Electronics makes sets of Christmas lights. On average, 4% of the bulbs produced by their supplier will be defective. Rudolph samples 300 bulbs from each shipment. If more than 3% of the bulbs are defective, he refuses the shipment. What is the probability that a given shipment will be accepted?
40. It is known that 65% of the population prefers white grape juice, while 35% prefers purple. A caterer estimates he will need 1 bottle of grape juice for every 4 guests at a dinner party. There will be 300 persons in attendance. What is the probability that 55 bottles of white grape juice will be enough for the party?

Unit 5 ReviewAnswer Section
MULTIPLE CHOICE
1. ANS: B REF: Knowledge and UnderstandingOBJ: 5.4 Normal Approximation of the Binomial Distribution LOC: STV.03TOP: Probability Distributions and Predictions
2. ANS: C REF: Knowledge and UnderstandingOBJ: 5.4 Normal Approximation of the Binomial Distribution LOC: STV.03TOP: Probability Distributions and Predictions
3. ANS: A REF: Knowledge and UnderstandingOBJ: 5.4 Normal Approximation of the Binomial Distribution LOC: CPV.01TOP: Probability Distributions and Predictions
4. ANS: D REF: Knowledge and UnderstandingOBJ: 5.4 Normal Approximation of the Binomial Distribution LOC: STV.03TOP: Probability Distributions and Predictions
5. ANS: B REF: Knowledge and UnderstandingOBJ: 5.4 Normal Approximation of the Binomial Distribution LOC: ST2.03TOP: Probability Distributions and Predictions
6. ANS: C REF: Knowledge and UnderstandingOBJ: 5.4 Normal Approximation of the Binomial Distribution LOC: STV.03TOP: Probability Distributions and Predictions
7. ANS: C REF: CommunicationOBJ: 5.4 Normal Approximation of the Binomial Distribution LOC: ST3.02TOP: Probability Distributions and Predictions
8. ANS: D REF: Knowledge and UnderstandingOBJ: 5.4 Normal Approximation of the Binomial Distribution LOC: ST3.02TOP: Probability Distributions and Predictions
9. ANS: D REF: Knowledge and UnderstandingOBJ: 5.4 Normal Approximation of the Binomial Distribution LOC: ST3.02TOP: Probability Distributions and Predictions
10. ANS: C REF: Application OBJ: 5.4 Normal Approximation of the Binomial DistributionLOC: ST3.03 TOP: Probability Distributions and Predictions
11. ANS: A REF: Knowledge and UnderstandingOBJ: 5.4 Normal Approximation of the Binomial Distribution LOC: STV.03TOP: Probability Distributions and Predictions
12. ANS: C REF: Knowledge and UnderstandingOBJ: 5.4 Normal Approximation of the Binomial Distribution LOC: ST2.03TOP: Probability Distributions and Predictions
13. ANS: B REF: Knowledge and UnderstandingOBJ: 5.4 Normal Approximation of the Binomial Distribution LOC: CP2.05TOP: Probability Distributions and Predictions
15. ANS: A REF: Application OBJ: 5.4 Normal Approximation of the Binomial DistributionLOC: CP2.05, STV.03 TOP: Probability Distributions and Predictions
SHORT ANSWER

16. ANS:11.25
REF: Knowledge and Understanding OBJ: 5.4 Normal Approximation of the Binomial DistributionLOC: CP2.04, CP2.05 TOP: Probability Distributions and Predictions
17. ANS:7.69
REF: Knowledge and Understanding OBJ: 5.4 Normal Approximation of the Binomial DistributionLOC: STV.03 TOP: Probability Distributions and Predictions
18. ANS:
From , we replace to obtain .
REF: Communication OBJ: 5.4 Normal Approximation of the Binomial DistributionLOC: ST2.03 TOP: Probability Distributions and Predictions
19. ANS:A value of 23 in the discrete distribution corresponds to the range from 22.5 to 23.5 in the continuous approximation. We need to calculate P(X 22.5). We will also need to recognize that the z-score will give the cumulative probability for all values less than 22.5, so we will need to use 1 minus the probability from the z-score table.
REF: Communication OBJ: 5.4 Normal Approximation of the Binomial DistributionLOC: ST2.03 TOP: Probability Distributions and Predictions
20. ANS:1.06
REF: Knowledge and Understanding OBJ: 5.4 Normal Approximation of the Binomial DistributionLOC: ST2.03 TOP: Probability Distributions and Predictions
21. ANS:When we identify the z-score that corresponds to a particular value of X, the value listed in the table for this z-score gives the total probability of all outcomes less than or equal to that value of X.
REF: Knowledge and Understanding OBJ: 5.4 Normal Approximation of the Binomial DistributionLOC: ST3.02 TOP: Probability Distributions and Predictions
22. ANS:The smallest number of trials allowed would be 21.
REF: Knowledge and Understanding OBJ: 5.4 Normal Approximation of the Binomial DistributionLOC: STV.03 TOP: Probability Distributions and Predictions
23. ANS:Assuming that A and B are discrete values for numbers of successes, we will find z-scores for A – 0.5 and B + 0.5. Take the area under the curve for the z-score derived from B and subtract the area under the curve for the z-score derived from the A value. The difference is the probability for the discrete interval in question.
REF: Communication OBJ: 5.4 Normal Approximation of the Binomial DistributionLOC: STV.03 TOP: Probability Distributions and Predictions

25. ANS:The probability is 0.1928 or almost 20%.
REF: Application OBJ: 5.4 Normal Approximation of the Binomial DistributionLOC: CP2.05 TOP: Probability Distributions and Predictions
26. ANS:24
REF: Knowledge and Understanding OBJ: 5.4 Normal Approximation of the Binomial DistributionLOC: STV.03 TOP: Probability Distributions and Predictions
27. ANS:The probability is 0.2461 or almost 25%.
REF: Knowledge and Understanding OBJ: 5.4 Normal Approximation of the Binomial DistributionLOC: CP2.05 TOP: Probability Distributions and Predictions
28. ANS:0.0875
REF: Knowledge and Understanding OBJ: 5.4 Normal Approximation of the Binomial DistributionLOC: CP2.05, CP2.06 TOP: Probability Distributions and Predictions
29. ANS:For 100 trials, = = 4.95. For 400 trials, = = 9.90. When the number of trials is increased by a factor k, the standard deviation of the normal approximation increases by .
REF: Knowledge and Understanding OBJ: 5.4 Normal Approximation of the Binomial DistributionLOC: STV.03 TOP: Probability Distributions and Predictions
30. ANS:We are allowed to use the normal approximation when the values of np and n(1 – p) are both greater than 5. If we consider the smallest value, we must solve 40p 5, which gives a solution of p 0.125. Switching the values for p and (1 – p ), we get a maximum possible value for p of 0.875. The range of allowable probabilities for applying the normal approximation would be 0.125 p 0.875.
REF: Knowledge and Understanding OBJ: 5.4 Normal Approximation of the Binomial DistributionLOC: STV.03 TOP: Probability Distributions and Predictions
PROBLEM
31. ANS:For the distribution with n = 14, we have an expected value of 4.2, so evaluate P(X = 3), P(X = 4), and P(X = 5). For the distribution with n = 34, we have an expected value of 10.2, so evaluate P(X = 9), P(X = 10), and P(X = 11).
For n = 14, P(X = 3) = = 0.1943, P(X = 4) = 0.2290, and P(X = 5) = 0.1963.
For n = 34, we have P(X = 9) = 0.1385, P(X = 10) = 0.1483, and P(X = 11) = 0.1387.

In the first case, the difference between the left and right values is 0.002, while in the second case the difference is 0.0002, which is smaller by a factor of 10. An obsessive student might feel compelled to calculate some z-scores and see what values would be delivered to correspond to each of these binomial probabilities by the normal approximation. The key idea is that the normal distribution is perfectly symmetrical, so the built-in error will become smaller as a binomial distribution becomes more symmetrical.
REF: Thinking/Inquiry/PS OBJ: 5.4 Normal Approximation of the Binomial DistributionLOC: STV.03, CP2.05 TOP: Probability Distributions and Predictions
32. ANS:The claim is false. The mean for the first distribution is 2 units left of the mean for p = 0.5. The mean for the second distribution is 4 units to the right of the mean for p = 0.5. When we test for fit, we must consider both np and nq. In the first case, the values are 18 and 22, which both differ by 2 from the mean for a perfectly symmetrical distribution. In the second case, the values are 16 and 24, which both differ by 4 from the mean for a perfectly symmetrical distribution. The first distribution will be a better fit to the normal approximation.
REF: Communication OBJ: 5.4 Normal Approximation of the Binomial DistributionLOC: STV.03 TOP: Probability Distributions and Predictions
33. ANS:The probability of rolling the desired value 10 times or less is given by P(X 10.5). We have a mean of 7.5 and a standard deviation of .
From tables, this corresponds to a probability of 0.8962. Because we are interested in the probability of a frequency greater than 10, the requested probability is 0.1038 or about 10%.
REF: Knowledge and Understanding OBJ: 5.4 Normal Approximation of the Binomial DistributionLOC: STV.03 TOP: Probability Distributions and Predictions
34. ANS:
Direct method: P(X = 17) = = 0.111535 and P(X = 18) = 0.080553, for a total probability
of 0.192088.Normal approximation P(16.5 X 18.5)
z = = 0.5477 and z = = 1.2780
From tables, P(0.5477 z 1.2780) = 0.8994 0.7080 = 0.1914 (linear interpolation applied).The difference between solutions is 6 units out of 1920 for a 0.3% error.
REF: Thinking/Inquiry/PS OBJ: 5.4 Normal Approximation of the Binomial DistributionLOC: STV.03, CP2.05 TOP: Probability Distributions and Predictions
35. ANS:We squeeze into the normal approximation with a mean value of 5.6. If we are interested in the total probability of selling 5 or more cars, we will consider the probability of selling 4 cars or fewer. Making the adjustment from discrete to continuous variables, we need P(X 4.5).
z = = –0.482
From tables, this corresponds to an area of 0.3149 (by interpolation). The probability of selling less than 5 is about 31.5%, so the probability of selling 5 or more is about 68.5%.

REF: Application OBJ: 5.4 Normal Approximation of the Binomial DistributionLOC: STV.03 TOP: Probability Distributions and Predictions
37. ANS:A binomial distribution with perfect symmetry would have p = 0.5 and a midpoint above X = 25. The given distributions are evenly spaced to either side of this value because the p and q values for the two are simply interchanged. The first has a mean 15 units left of X = 25; the second has a mean 15 units right of X = 25. Both have a standard deviation of . Visually, the graphs of the normal approximations are reflections across the line X = 25.
REF: Communication OBJ: 5.4 Normal Approximation of the Binomial DistributionLOC: ST3.02 TOP: Probability Distributions and Predictions
38. ANS:a) For the mean, .
For the standard deviation, .
Solve for x in the equation .
x = 121b) There is a probability of 99.86% that we will observe 121 heads or fewer in 200 tosses of a fair coin.
REF: Thinking/Inquiry/PS OBJ: 5.4 Normal Approximation of the Binomial DistributionLOC: ST2.03 TOP: Probability Distributions and Predictions
39. ANS:We have a binomial distribution with 300 trials and a probability of success of 4%. We may apply the normal approximation since np = 12 and n(1 – p) np. Rudoph will accept up to 3% of the sample as defective, so we need to find the probability that X 9. In order to convert to a continuous variable, we will find the z-score for X 9.5.
z = = = –0.737
From tables, this corresponds to about a 23% chance that Rudolph will accept the shipment.
REF: Application OBJ: 5.4 Normal Approximation of the Binomial DistributionLOC: STV.03 TOP: Probability Distributions and Predictions
40. ANS:55 bottles will serve 220 people so we may find the probability that no more than 220 people will request white.
Converting to a continuous variable, we need the z-score for the probability that X 220.5.

A z-score of 2.99 corresponds to a 99.86% probability. This score would suggest that the caterer is certain to have enough white grape juice.
REF: Application OBJ: 5.4 Normal Approximation of the Binomial DistributionLOC: STV.03 TOP: Probability Distributions and Predictions


