Unit 4- Statistics HW 7C and 7D Due Wednesday– 30 points Section 7C- Grouped Quantitative Discrete...
19
Unit 4- Statistics HW 7C and 7D Due Wednesday– 30 points Section 7C- Grouped Quantitative Discrete Data
-
Upload
nathaniel-nelson -
Category
Documents
-
view
217 -
download
0
Transcript of Unit 4- Statistics HW 7C and 7D Due Wednesday– 30 points Section 7C- Grouped Quantitative Discrete...

Unit 4- StatisticsHW 7C and 7D Due
Wednesday– 30 points
Section 7C- Grouped Quantitative Discrete Data


Grouped Quantitative Discrete Data
O You can group data values if there are many different data values with low frequencies.
O Grouping data class intervalsO You still have a modal class, which means what??O Compare these two Tables:
O Data values: Frequency Table
O Vs
9 10 13 14 15
19 20 21 21 23
25 26 26 27 28
29 30 31 31 32
34 35 36 37 38
41 42 49 55 40
Number of cars
Tally Frequency
Relative frequency—how do we calculate it?
0 to 9 1
10 to 19
5
20 to 29
10
30 to 39
9
40 to 49
4
50 to 59
1
Total 30

Column graph for grouped data is the same
O Just have the intervals on the x-axis
O Most likely you will have grouped intervals for your data.
O How would you group GPA?O How would you group ages of students at GWHS

Stem and Leaf PlotsO Stem and Leaf plots is a method of writing
data in groups without losing information about the actual data value
O For numbers with 2 digitsO The first digit is the STEMO The second digit is the LEAFO So, in the number 27, 2 is the stem and 7 is
the leafO Examples:

Back to Back Stem and Leaf Plots
O A back to back stem and leaf plots allows us to compare sets which are related.
O The example is times for the 100 meter freestyle recorded by members of a swimming team
O Name two descriptions of the data

Done with Exercise 7C, now it’s your turn to complete a question
One partner should complete the Zinc half of a stem and leaf, and the other partner should complete the Lead part
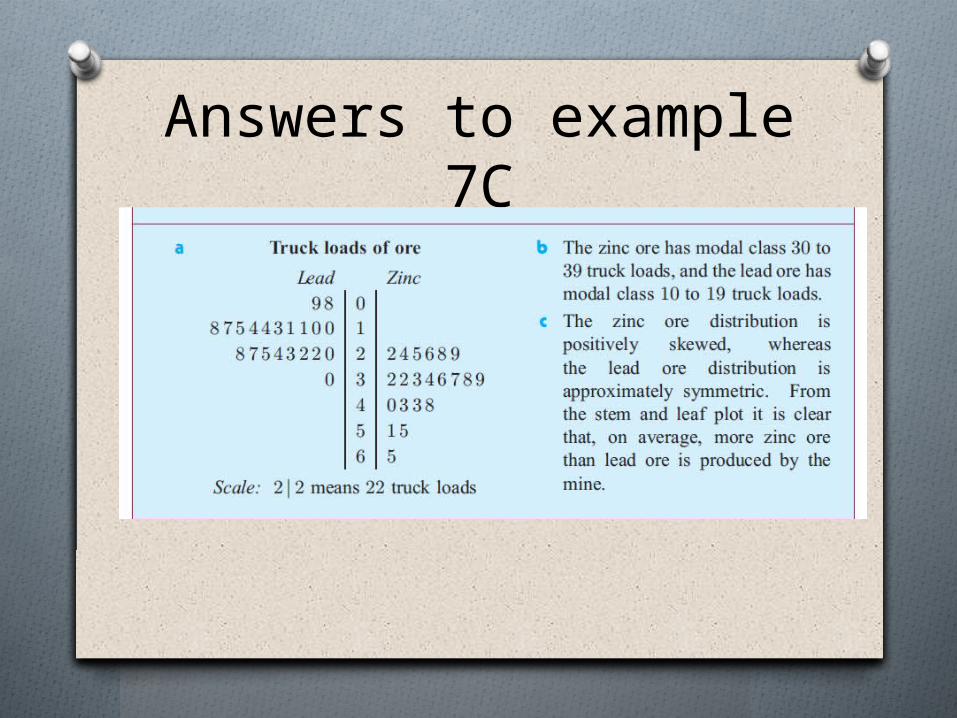
Answers to example 7C

This is how I feel

Section 7D- Quantitative CONTINUOUS Data
O When we measure data that is continuous, we cannot write down an exact value. Instead we write down an approximation which is only as accurate as the measuring device.
O Quantitative Continuous Data is measured using a FREQUENCY HISTOGRAM or just a HISTOGRAM
O There are no gaps between the columnsO And the modal class is the ______ barO **** to choose intervals, us the squareroot of the
number of data points. For large data sets, we use more classes than less****

Done with Exercise 7D, now it’s your turn to complete a question

Answers to Example 7D

Section 7E- Measuring the Centre of Data
O Mean- averageO Mean for entire population is μ muO Mean for sample population is Ë “x bar”
O Median- middle value, or average of the two middle values
O Mode- value that occurs the MOST, there can be two modes
O The calculator will find the mean and median for youO Examples of mean
O The average height of adult females is 5 feet 5 inchesO The average height of adult females in this class is 5 feet
3 inchesO which is the mean for the entire population?O Which is the mean for the sample population?

Find the mean, median, and mode
5 6 8 10 5 6
7 8 9 10 5 5
5 4 8 9 7 10
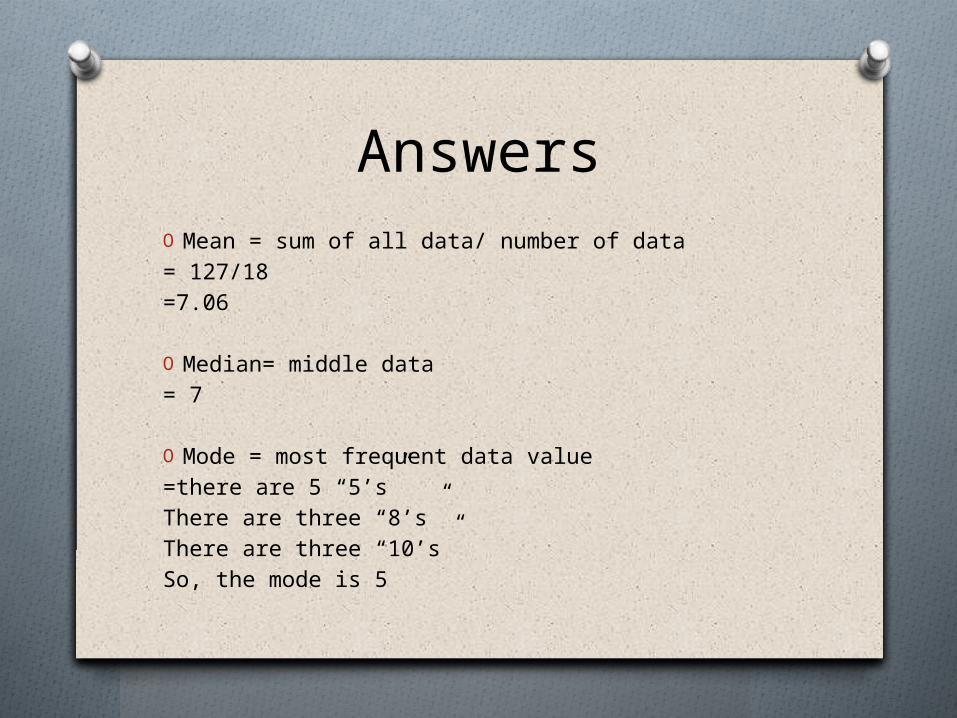
AnswersO Mean = sum of all data/ number of data= 127/18=7.06
O Median= middle data= 7
O Mode = most frequent data value =there are 5 “5’s”There are three “8’s”There are three “10’s”So, the mode is 5

Find the mean, median, and mode using a calculator
5 6 8 10 5 6
7 8 9 10 5 5
5 4 8 9 7 10
Step 1: put data into the calculator-Stat-Enter, Edit-Clear L1 by highlighting L1 and hitting CLEAR and ENTER-Done, so 2nd Quit
Step 2: have the calculator find the mean and median for you-Stat- Go right, Calc- Enter, for 1-variable Stat- Enter

Done with Exercise 7E- Now it’s your turn to do an Example

Answers to Example 7E

Effects of Outliers…central tendency means mean, median, mode