Unit 3 Slideshow 3 - GRAPHS - lc.wnlsd.calc.wnlsd.ca/~tammy.bennett/S01448224.15/Unit 3 - Slideshow...
17
Unit 3 Slideshow 3 - GRAPHS
Transcript of Unit 3 Slideshow 3 - GRAPHS - lc.wnlsd.calc.wnlsd.ca/~tammy.bennett/S01448224.15/Unit 3 - Slideshow...

Unit 3 Slideshow 3 - GRAPHS

Why are graphs helpful for understanding motion? Graphs give us VISUAL, “easy-to-
understand” information about motion.
GRAPH BASICS y-axis
▪ dependent variable, dependent on x-axis changes
x-axis ▪ independent variable, values chosen by
experimenter
y
0 x

1. Always put a TITLE and LABELS on your graph.

2. Use a proper scale. That is, be sure to go up by EQUAL INCREMENTS, and use at least ¾ OF THE GRAPH when plotting points.

2. Use a proper scale. That is, be sure to go up by EQUAL INCREMENTS, and use at least ¾ OF THE GRAPH when plotting points.

3. If the points follow a STRAIGHT LINE PATH, draw a LINE OF BEST FIT.
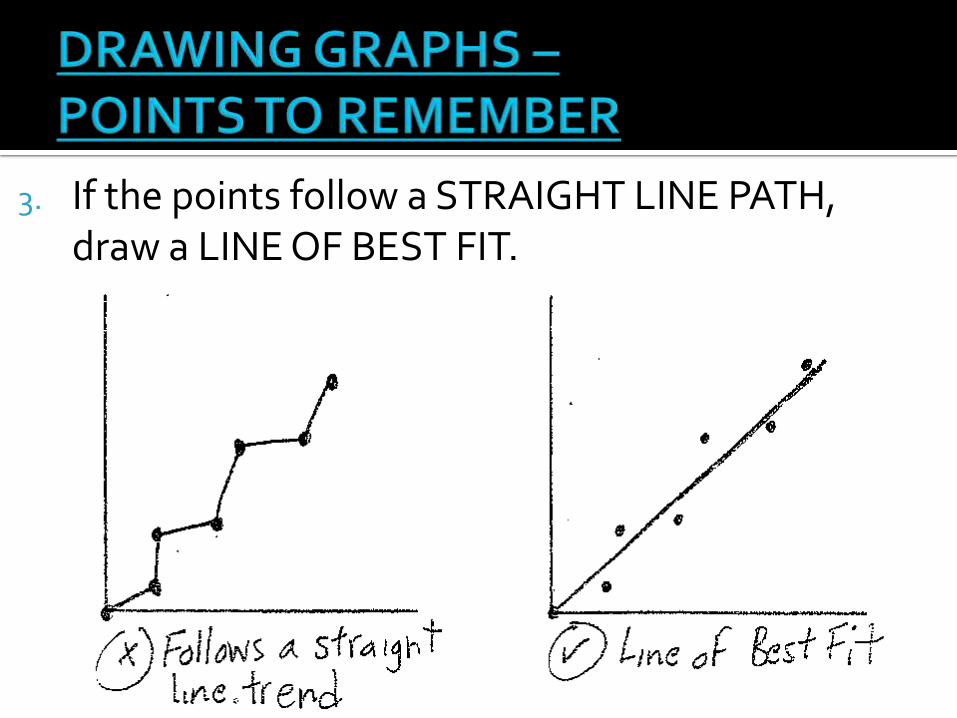
3. If the points follow a STRAIGHT LINE PATH, draw a LINE OF BEST FIT.

4. If the points follow a CURVED LINE PATH, draw a CURVED LINE.

4. If the points follow a CURVED LINE PATH, draw a CURVED LINE.

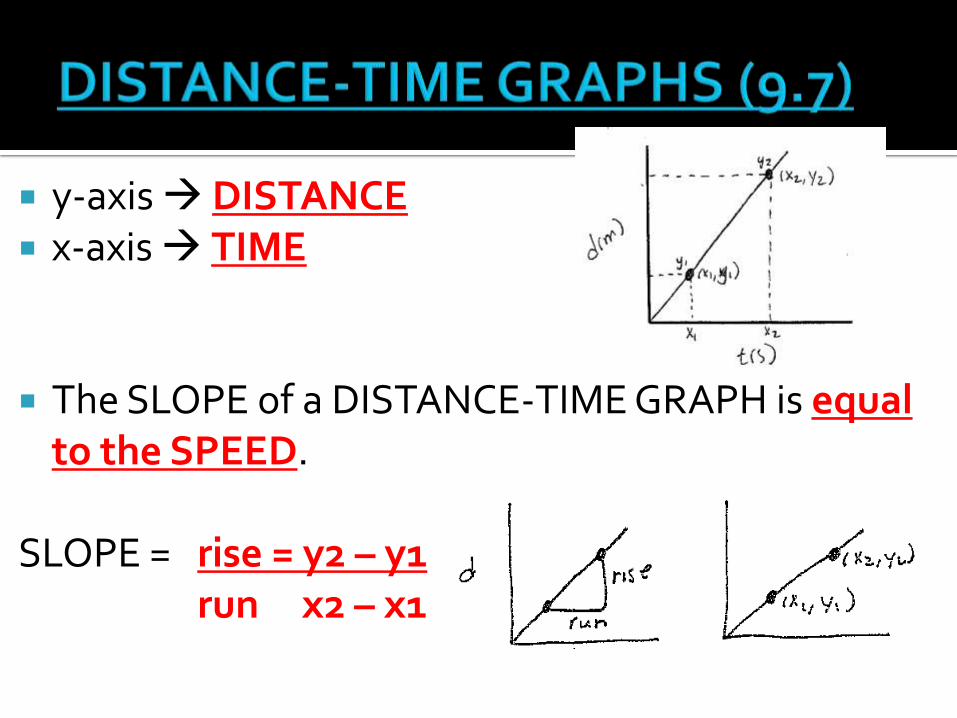
y-axis DISTANCE x-axis TIME
The SLOPE of a DISTANCE-TIME GRAPH is equal to the SPEED.
SLOPE = rise = y2 – y1run x2 – x1
dis
tan
ce (m
)
time (s)
y-axis DISTANCE x-axis TIME
The SLOPE of a DISTANCE-TIME GRAPH is equal to the SPEED.
SLOPE = rise = y2 – y1run x2 – x1
dis
tan
ce (m
)
time (s)

How can you calculate slope of a graph if the line is not perfectly straight?
You can find Vav by DRAWING A STRAIGHT LINE between the INITIAL POINT and the FINAL POINT and calculating the slope of that line.
dis
tan
ce (m
)
time (s)
Vav = slope of the dashed line from initial to final point

How can you calculate slope of a graph if the line is not perfectly straight?
You can find Vav by DRAWING A STRAIGHT LINE between the INITIAL POINT and the FINAL POINT and calculating the slope of that line.
dis
tan
ce (m
)
time (s)
Vav = slope of the dashed line from initial to final point

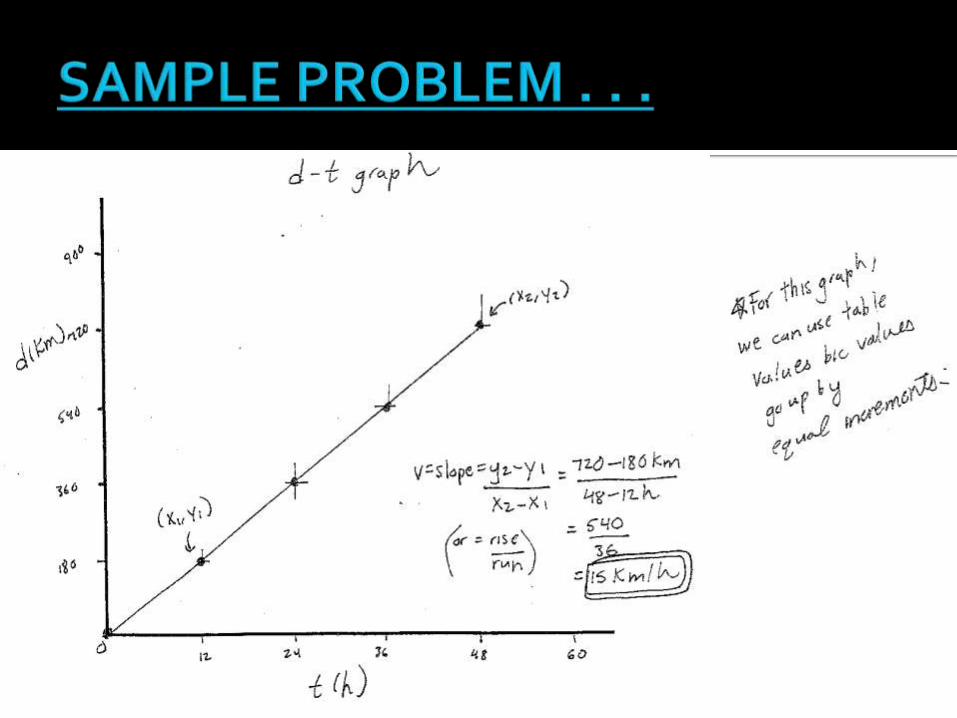
___________________ is biking from Corner Brook to St. John’s. The table below displays his distance every 12 h.
Using the above information,
Draw a DISTANCE-TIME graph.
From the GRAPH, determine his AVERAGE SPEED.
TIME (h) DISTANCE (km)
0 0
12 180
24 360
36 540
48 720


Do #s 2, 3, 5, and 6 on page 365 in text for homework.
HELPFUL HINT
Your graphs will have more ACCURATE results if you make them LARGER in SIZE!