Unit 3 Exponential Growth (25 - 30 %) compound interest, radioactive decay, and value depreciation....
32
Unit 3 Exponential Growth (25 - 30 %)
Transcript of Unit 3 Exponential Growth (25 - 30 %) compound interest, radioactive decay, and value depreciation....

Unit 3
Exponential Growth
(25 - 30 %)

EXPONENTIAL GROWTH
ATLANTIC CANADA MATHEMATICS CURRICULUM: MATHEMATICS 3204/320584
Elaboration—Instructional Strategies/SuggestionsOutcomes
SCO: In this course, studentswill be expected to
Exponential Growth
C2 model real-worldphenomena using exponentialfunctions
B2 demonstrate an intuitiveunderstanding of therecursive nature ofexponential growth
C2 Exponential functions (like y = abx) form another important family of functions.Exponential functions are extremely useful in applications that include populationgrowth, compound interest, radioactive decay, and value depreciation. Consider a verycommon classroom growth example: The teacher has some important data saved on hergraphing calculator. She wants to share it with all 32 students. She asks the class to considerwhich method would be the best to share the data and how much time would be saved (ittakes one minute to link and transmit the data).
Method 1: Teacher links with each student and transmits the data one person at a time.Method 2: Teacher links with one student, then each of them links with a student, and soon.
Solution:
Students may try to find acommon difference with thetable in Method 2. The factthat there is no commondifference when sequences ofdifferences between successiveterms is examined at D
1 and
D2 level signifies that the
relationship is not linear orquadratic.
B2 Upon further study of thepattern in Method 2 (as seen below) students might determine a relationship that they coulddescribe in words as “the number of people (t) with the data during any time period (t
n) can
be determined by doubling the number in theprevious time period.”
Using symbols: t2 = t
1 · 2, t
3 = t
2 · 2 and so on,
leading to −= g1 2n nt t , some students will continuelooking at the pattern to see that it can besymbolized by 2n. Students should state that eachterm in the sequence is a multiple of each previousterm, and that this multiple is the common ratiobetween consecutive terms (e.g., 1n nt t -¸ ).
Another example might be to consider thefollowing pay schedule: Students might describethis pattern as “You get paid one dollar on day one,then each day after you get three times as much asthe previous day.”Thus the amount of moneyearned (M) on any given day can be determined bytripling the amount earned on the previous day.Using symbols:
M2 = M
1 · 3
M5 = M
4 · 3
and so on, leading to Mn = M
n – 1 · 3
continued...
Time period
0
1
2
3
.
31
32
35
# of people with
data
1
2
3
4
.
32
33
36
Method 1
Time period
0
1
2
3
4
5
6
# of people with
data
1
2
4
8
16
32
64
Method 2
Time Period0
1
2
3
4
5
6
.
.
n
# of peoplewith data
0
1
2
3
4
5
6
1 1 2
2 2 2
2 2 4 2
2 2 2 8 2
2 2 2 2 16 2
32 2
64 2
2n
= →
= →
= →
= →
= →
= →
= →= →= →
= →
g
g g
g g g
g
g
g

EXPONENTIAL GROWTH
ATLANTIC CANADA MATHEMATICS CURRICULUM: MATHEMATICS 3204/3205 85
Worthwhile Tasks for Instruction and/or Assessment Suggested Resources
Exponential Growth
Pencil and Paper (C2/B2)
1) This is an old story that is found in many similar versions. According to oneversion, King Shirham of India wanted to reward his Grand Vizier, Sissa BenDahir, for inventing and introducing him to the game of chess. The Grand Vizierrequested as his reward that the king have one grain of rice placed on the firstsquare of the board, two on the second, four on the third, eight on the fourth, andso on, until the board was filled according to this pattern. The king tried to talkhim out of this silliness because he was willing to give him jewels or money, but toeveryone’s amazement, the Grand Visier stood his ground. Did he do the rightthing?
Square123456.
10.
25.
64
Rice on the Square124
Rice on the Board
1
1 + 2 = 3
3 + 4 = 7
Pattern? Complete the chart.Look for a patternand describe it.Determine theamount of rice onthe 64th square.Determine theamount of rice onthe whole board.
2) Imagine you have won a sweepstake, you can chose between a lump sum of$2 000 000 or $10 000/mo for the rest of your life. You decide that in either case,you will deposit half the money in a savings account that earns interest everymonth at a rate of 0.5% per month. Investigate to determine which is the betterdeal? Explain.
Journal (B2)
3) Given the two sequences below, explain why one of them will produce terms thatdepict exponential growth. Explain why the other will not.i)
ii) tn = 0.5tn – 1, t1= 0.25
4) List the first five terms of this sequence:
1 2 24, 3, 3 2 , 2n nt t t t t n N-
= = = + > Î
Describe the sequence. Do you think you could predict the 10th term? Explain.
5) Steve said that f (x) = 3x + 2 – 2(x + 1) defines an exponential function, when the
domain is 0x x R> Î . Is he correct?
... continued
1 2 1 22 , 5, 9n n nt t t t t− −= + = =

EXPONENTIAL GROWTH
ATLANTIC CANADA MATHEMATICS CURRICULUM: MATHEMATICS 3204/320586
Elaboration—Instructional Strategies/SuggestionsOutcomes
SCO: In this course, studentswill be expected to
Exponential Growth
C2 model real-worldphenomena using exponentialfunctions
B2 demonstrate an intuitiveunderstanding of the recursivenature of exponential growth
C25 solve problems involvingexponential and logarithmicequations
C11 describe and translatebetween graphical, tabular,written, and symbolicrepresentations of exponentialand logarithmic relationships
C4 demonstrate anunderstanding of patternsthat are arithmetic, power,and geometric and relatethem to correspondingfunctions
... continued
B2 Students should be able to see that each term in the sequence is triple theprevious term, and could be symbolized using 3n – 1.
Students might consider how to symbolize getting paid $2 on the first day, thentripling each day thereafter. As they develop the table to the left, each term ismultiplied by 3 to get the next term leading to the amount paid on the nth day.
It is often easier for students to work with exponentialsituations by using the relationship between successivefunction values; in fact, their first recourse in evaluatingexponential functions is often through calculating the nextvalue from the present value.
Sequences where determining the nth term requiresknowledge of all preceding terms are called recursive rules.
The replay capabilities on graphing calculators permit recursive patterns to be easilyevaluated. It does not take long, however, for students to realize that even withinstant-replay capability, recursive patterns do not efficiently determine output forvery large input values. For example, students would need many term values to findthe money earned for day 50 of the money tripling function if they know only therecursive definition. Once students understand this difficulty, they will be ready toappreciate that function rules for recursive patterns can be stated in an alternative andarguably more usable way. However, the sequence editor and table feature on thegraphing calculator can make this much more efficient.
This outcome (B2) will be formalized in a later course.
C2/C25 During their study of exponential growth, students should examine someissues that have become important in today’s society, like world population growth,ozone layer depletion, pollution control, etc. The tendency of populations to grow atan exponential rate was pointed out in 1798 by an English economist ThomasMalthus, in his book An Essay on the Principle of Population. Malthus suggested thatunchecked exponential growth would outstrip the supply of food and other resourcesand lead to wars and disease. He wrote “Population, when unchecked, increases in ageometrical ratio. Subsistence increases only in an arithmetic ratio.”
C11/C4 Students should discuss this Thomas Malthus quote and the consequences.During their discussion they will gain a better understanding of geometric andarithmetic ratio.
Students should re-establish that functions whose first term is C and whose otherterms are generated by multiplying the preceding term by a constant, a, can beexpressed in the form f (n) = Can-1, where ≥, 1n n is the number of the term and thevariable a in this situation is the common ratio. By contrast, students shouldremember that terms in arithmetic sequence are generated by a linear function whereeach term results by adding a constant to the previous term.
day12
34
.
n
Money ($)
1
2
2 3
2 3 3
2 3 3 3
2 3n−
⋅⋅ ⋅⋅ ⋅ ⋅
⋅
⋅

EXPONENTIAL GROWTH
ATLANTIC CANADA MATHEMATICS CURRICULUM: MATHEMATICS 3204/3205 87
Worthwhile Tasks for Instruction and/or Assessment Suggested Resources
Exponential Growth
continued ...
Pencil and Paper (C4)
6) Which of the following sequences are arithmetic, which are power, and which are exponential?
a) 3, 5, 7, 9, 11, ...
b) 1 1 1 1
, , ,2 6 18 54
c) –6, –4, –2, 0, 2, 4, 6d) –2.988, –1.963, –0.8889, 0.3333, 2, 5e) 8, 4, 0, -4, -8f) 2, 4, 8, 32g) 0.01235, 0.03704, 0.1111, 0.3333, 1, 3
h) 1 1 1 1
, , ,2 6 10 14
i) 2,2, 8
j) 4, 5, 12, 25, 44
Activity (C2/C25/C4)
7) Ask students to read the following excerpt from the book The Origin of Species byCharles Darwin, published in 1859. It discusses exponential growth. “A strugglefor existence inevitably follows from the high rate at which all organic beings tendto increase. Every being, which during its natural lifetime produces eggs or seeds,must suffer destruction during some period of its life, ... otherwise, on theprinciple of geometrical increase, its numbers would quickly become soinordinately great that no country could support the product. Hence, as moreindividuals are produced than can possibly survive, there must in every case be astruggle for existence ... It is the doctrine of Malthus applied with manifold forceto the whole animal and vegetable kingdoms ... There is no exception to the rulethat every organic being naturally increases at so high a rate, that if not destroyed,the earth would soon be covered by the progeny of a single pair.”Ask students to discuss this in their groups and respond to “Do you think theideas are still relevant?”
Performance (C2/C25/C11/C4)
8) A certain bacteria have a doubling time of 20 minutes. If you started with a singleorganism, with a mass of about 10 –12gm, and it grew exponentially for one day,what would be the total mass produced? What would it be after two days? Howdoes this compare with the mass of the earth (approximately 6 x 10 21 tonnes)? Isthis possible? Explain?
9) a) You have two parents, four grandparents, and eight great-grandparents. If yougo further back in your family tree, how many ancestors would you have ngenerations ago?
b) Decide approximately how many years equals one generation and work outroughly how many of your ancestors would have been alive 2000 years ago. Isthis possible?

EXPONENTIAL GROWTH
ATLANTIC CANADA MATHEMATICS CURRICULUM: MATHEMATICS 3204/320588
Elaboration—Instructional Strategies/SuggestionsOutcomes
SCO: In this course, studentswill be expected to
Exponential Growth
C33 analyse and describe thecharacteristics of exponentialand logarithmic functions
C29 analyse tables and graphsto distinguish between linear,quadratic, and exponentialrelationships
A7 describe and interpretdomains and ranges using setnotation
C25 solve problems involvingexponential and logarithmicequations
C33/C29/A7 Students should examine the characteristics of the curves of exponentialgraphs. Ask students to graph the relationship explored on p. 84 method 2, e.g., graph y =2x and explain why the graph (from left to right) curves slowly at first, then much morequickly. Then graph y = 3x and compare its growth rate with the y = 2x.
Ask students to use technology to explore the behaviour of these two graphs using thewindow settings 10 2x- £ £ , and range 1 10y- £ £ . Have them describe the curvingbehaviour and explore the behaviour at the extreme left and extreme right. Have thempredict the behaviour if using x-values in the domain smaller than –10, or y-values greaterthan 1. Then have students explore the behaviour of these two graphs using the windowsettings 10 1x- £ £ - and 0.1 10y- £ £ . Have them change the range to 0.1 .01y- £ £and the domain to 15 5x- £ £ - . Have students discuss the behaviour of the graph as itapproaches the x-axis. Have them explain why the graphs on this screen look so similar to thegraph on the previous screen.
Ask the students if they think either of the two graphs will ever intersect the x-axis and toexplain their answers.
Ask students to graph using 0 10x£ £ , and 0 60y£ £ . Explore whether this
curve intersects the x-axis. Have students confirm that it will not. Ask students why thisfunction is decreasing. Ask students to describe a situation that could be represented by thisgraph.
This graph could represent the story of the grasshopper jumping towards a fence. It starts 50metres away and jumps halfway to the fence with each jump. If it continues to jump halfwayto the fence with each jump, will it ever hit the fence? The x-axis is a horizontal asymptote—a line to which a curve approaches but will never intersect where x is very large.
All exponential curves have a horizontal asymptote. Ask students: “In all the explorationsabove was the x-axis a horizontal asymptote?”
The family of functions used to describe the patterns of change in the wage-tripling situationor the data-transfer situation are called exponential functions. Properties of exponentialgrowth and decay situations can be studied by examining exponential functions of the formf (x) = ab x.
C25 Exponential functions have another important property. No matter what the currentvalue of the function is, it takes the same length of time to double or triple in size. Byextending the table, students could find the number of hours it takes for the bacteria totriple, or quadruple, etc. In the table below, students can see that the number of bacteriaalways doubles in three hours. This property provides a quick way to estimate the future sizeof a population.
When numbers are small, doubling does not cause a very big increase, so the graph has afairly gentle slope. But when the numbers are large, doubling makes an enormousdifference, and the graph tends to become very steep. This is the typical shape of aexponential growth curve.
Time in hours 0 1 2 3 4 5 6 7Number of bacteria 100 126 160 200 250 316 400 500
150
2
x
y =

EXPONENTIAL GROWTH
ATLANTIC CANADA MATHEMATICS CURRICULUM: MATHEMATICS 3204/3205 89
Worthwhile Tasks for Instruction and/or Assessment Suggested Resources
Exponential Growth
Performance (C33/C29/A7/C25)
1) Use your calculator to draw a graph of the function defined by y = 2 x – 1. Set thewindow, 0 64x£ £ and 0 100y£ £ . Describe how your graph looks.
a) Does this graph model the rice on a checker board problem from p. 85?Explain.
b) Note that even though we would like to see what happens all the way up to 64squares, as soon as x gets to be 5 or 6, the value of y increases very rapidly,almost in a vertical line on a graph. One way to help this problem is to changethe range for the y-value to something much bigger, say 100 000. Make thischange and then redraw the graph of this function.
c) Describe how your graph looks.d) How would you describe the asymptote on this graph?
Performance (C29/C25)
2) Kareem is a car enthusiast. He owns a new Mercedes, worth $60 000, and avintage Corvette, worth $30 000. The new Mercedes will appreciate at 5% peryear, and the Corvette will appreciate in value at 10% per year because both arecollectors’ items.a) How long will it take the value of the Mercedes to double?b) How long will it take for the value of the Corvette to double?c) Establish a formula for the value of the Mercedes after t years.d) Establish a formula for the value of the Corvette after t years.e) Will the two cars ever have the same value? If so, when? If not, explain why
not.
Pencil and Paper (C33/C29/A7)
3) Given the following representations of exponential functions, describe therelationship in words, then write the domain and range for each.

EXPONENTIAL GROWTH
ATLANTIC CANADA MATHEMATICS CURRICULUM: MATHEMATICS 3204/320590
Elaboration—Instructional Strategies/SuggestionsOutcomes
SCO: In this course, studentswill be expected to
Exponential Growth
C34 demonstrate anunderstanding of howparameter changes affect thegraphs of exponentialfunctions
C25 solve problems involvingexponential and logarithmicequations
C34/C25 Consider questions like: “What could I expect to earn on day 22 (given thewage-tripling scheme described earlier) if I were to earn $10 on day one?” “Which carwould be more valuable in three years—a $15,000 car that depreciates 30% every yearor a $12,000 car with a 20% depreciation rate?”
Using exponential functions of the form f (x) = Cax to answer questions like theseamounts to changing the values of C and a. An activity like Exploring the Graphs forExponential Functions (see below) engages students in exploring the effects ofchanging the values of the parameters C and a on the graph of f (x) = Cax.
In the activity Exploring the Graphs of Exponential Functions (NCTM Addenda—Algebra) students are given equations like f (x) = 0.6 x, f (x) = 4(2.3)x, etc. and askedto enter them into a graphing utility, look at their graphs and their tables of values,and to respond to:
1) Describe the trends (growth and decay) in the relation between x and y values.2) Describe any x-values that result in the same y-value.3) Describe the overall affect of C on the tables and graphs for f (x) = Cax.
4) Consider two exponential functions f (x) = ax and g (x) = bx where a and b aredistinct positive numbers.
i) What is the effect if a < b and each is greater than 1; less than 1?ii) What is the effect if a > b and each is < 1 less than 1; greater than 1?
From this investigation students should make conjectures about the effect that C anda have on the function f (x) = Cax. It is important that they test and verify theirconjectures.

EXPONENTIAL GROWTH
ATLANTIC CANADA MATHEMATICS CURRICULUM: MATHEMATICS 3204/3205 91
Worthwhile Tasks for Instruction and/or Assessment Suggested Resources
Exponential Growth
Pencil and Paper (C34) for Advanced-level students
1) Describe what happens to the curve of the graph of the function f (x) = b Ax (whereA > 0) as x increases without limit. What happens to the curves as x decreasesthrough the negative real numbers?
2) Describe what happens to the curve of the graph of the function f (x) = b Ax (whereA < 0) as x increases without limit. What happens to the curve as x decreasesthrough the negative real numbers?
Performance for Advanced-level students
3) Graph the function f (x) = 8 Ax for A = 1, 0.5, and 0.25.a) Show algebraically how the y-coordinate of a point on the graph of f (x) = 8Ax is
related to the y-coordinate of the point vertically above or below it on thegraph of f (x) = 80.5x.
b) Describe how the graph of f (x) = 8Ax changes as A approaches 0.
4) Graph the function f (x) = 8Ax for A = –1, –0.5, –0.25. Describe how the graph off (x) = 8Ax changes as A approaches 0. What transformation would map the graphof f (x) = 8Ax onto the graph of f (x) = 8-Ax ? Explain.
5) a) How are the graphs of f (x) = 5 x and g (x) = –5 x related?b) How are the graphs of f (x) = 5 x and h (x) = 5 –x related?c) Do the graphs f and h intersect? If so, at what point(s)?
Pencil and Paper (C34) for Advanced students:
6) Given the function f, defined by f (x) = b Ax where b > 1, A > 0 and where x is real.a) Prove that there is a doubling time, d such that f (x + d) = 2 f (x) for all x.b) Write an equation that relates A, b, and d and is independent of x.
7) Describe in words the transformations of y = 3 x and y = 2 x that are visible in theequations given:
i) ( ) 313 2
2xy -- - =
ii) ( )2 15 3 xy -+ =
8) Describe the approximate location and position of graphs of the followingequations:
i) ( )1
423
xy
+
- =
ii) ( ) ( )112 2
2xy - -+ =
9) Create a problem where this equation would need to be solved for the variable C.10 000 = C ·20.5x

EXPONENTIAL GROWTH
ATLANTIC CANADA MATHEMATICS CURRICULUM: MATHEMATICS 3204/320592
Elaboration—Instructional Strategies/SuggestionsOutcomes
SCO: In this course, studentswill be expected to
Exponential Growth
C2 model real-worldphenomena using exponentialfunctions
C25 solve problems involvingexponential and logarithmicequations
C11 describe and translatebetween graphical, tabular,written and symbolicrepresentations of exponentialand logarithmic relationships
C2/C11/C25 Students will investigate typical growth patterns (population growth,economic growth, etc.) and learn about the exponential functions used to modelthem. For example, students might be asked to study graphs that deal with varioustypes of growth and answer questions like the following:
1) How are they thesame?
2) How are they different?
3) Describe the growth represented here.
Students might be asked to look at tables of values to findpatterns:
1) Number of bacteria present at different times:
Time in hours 0 1 2 3 4 5 6 7Number 100 126 160 200 250 316 400 500
2) The table gives more detail of population increases from 1955 to 1990. Thenumbers are in billions.
Students should calculate the ratio of each entry in the second row to the entry in theprevious column. Ask students what they notice.
From these tables that contain collected data, students should notice that the growth
ratios are more or less constant, e.g., in the first table 160 126
1.26126 100
= = . In general,
students should learn that if growth ratios are constant, then they can model thegrowth with a function in the form f (x) = Ca x, where C is the size of the startingpopulation and a is the growth rate. Functions of this type are known as exponentialfunctions.
Year 1995 1960 1965 1970 1975 1980 1985 1990Population 2.70 2.98 3.29 3.63 4.01 4.43 4.84 5.29
EXPONENTIAL GROWTH
ATLANTIC CANADA MATHEMATICS CURRICULUM: MATHEMATICS 3204/3205 93
Worthwhile Tasks for Instruction and/or Assessment Suggested Resources
Exponential Growth
Performance (C2/C25/C11)
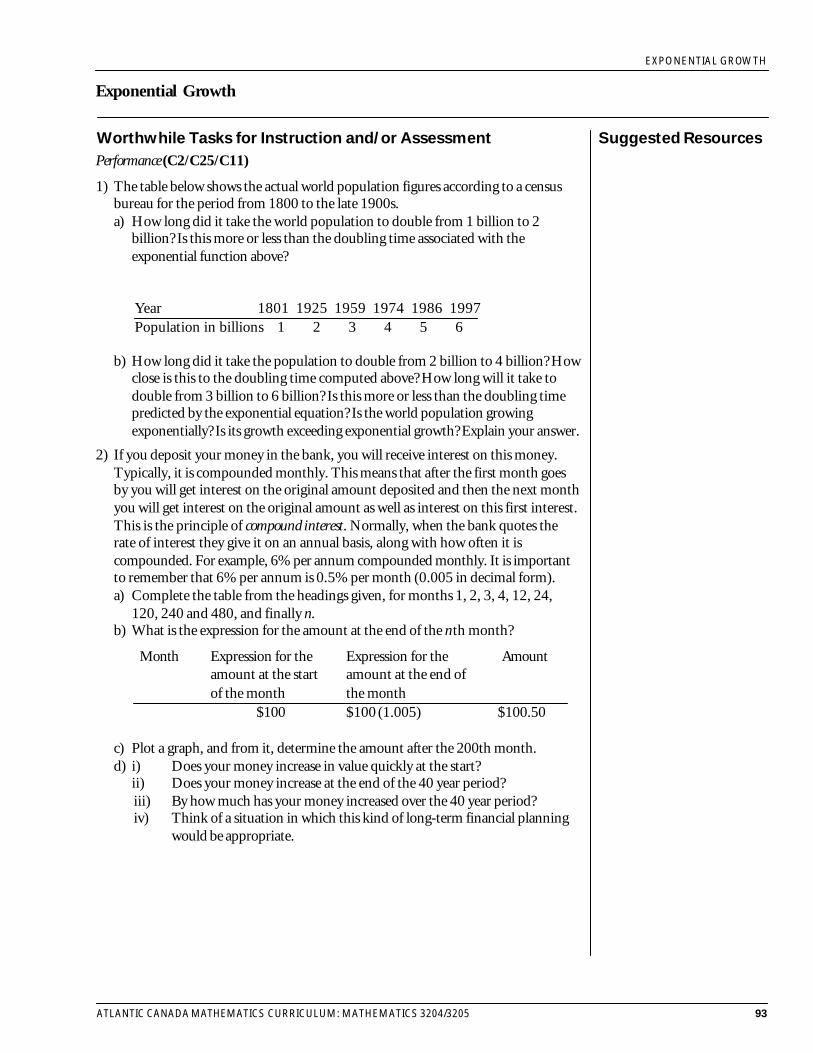
1) The table below shows the actual world population figures according to a censusbureau for the period from 1800 to the late 1900s.a) How long did it take the world population to double from 1 billion to 2
billion? Is this more or less than the doubling time associated with theexponential function above?
b) How long did it take the population to double from 2 billion to 4 billion? Howclose is this to the doubling time computed above? How long will it take todouble from 3 billion to 6 billion? Is this more or less than the doubling timepredicted by the exponential equation? Is the world population growingexponentially? Is its growth exceeding exponential growth? Explain your answer.
2) If you deposit your money in the bank, you will receive interest on this money.Typically, it is compounded monthly. This means that after the first month goesby you will get interest on the original amount deposited and then the next monthyou will get interest on the original amount as well as interest on this first interest.This is the principle of compound interest. Normally, when the bank quotes therate of interest they give it on an annual basis, along with how often it iscompounded. For example, 6% per annum compounded monthly. It is importantto remember that 6% per annum is 0.5% per month (0.005 in decimal form).a) Complete the table from the headings given, for months 1, 2, 3, 4, 12, 24,
120, 240 and 480, and finally n.b) What is the expression for the amount at the end of the nth month?
Year 1801 1925 1959 1974 1986 1997Population in billions 1 2 3 4 5 6
c) Plot a graph, and from it, determine the amount after the 200th month.d) i) Does your money increase in value quickly at the start?
ii) Does your money increase at the end of the 40 year period?iii) By how much has your money increased over the 40 year period?iv) Think of a situation in which this kind of long-term financial planning
would be appropriate.
Month Expression for theamount at the startof the month
$100
Expression for theamount at the end ofthe month$100 (1.005)
Amount
$100.50
EXPONENTIAL GROWTH
ATLANTIC CANADA MATHEMATICS CURRICULUM: MATHEMATICS 3204/320594
Elaboration—Instructional Strategies/SuggestionsOutcomes
SCO: In this course, studentswill be expected to
Exponential Growth
C2 model real-worldphenomena using exponentialfunctions
C11 describe and translatebetween graphical, tabular,written and symbolicrepresentations of exponentialand logarithmic relationships
C2/C11 As stated on the previous pages, students will investigate typical exponentialpatterns. Some exponential patterns show a decay process rather than growth. Whenstudying the graph of the temperature as a cup of coffee cools and the graphs of thedecay of a radioactive element, students will notice that the graphs are decreasingthroughout the domain and approach a horizontal asymptote as the values in thedomain increase. Ask students to explain what is different about an equation thatresults in a graph that depicts a decay process. (See C34.) When studying the graphsof various types of decay (the decay of a swinging pendulum, the cooling of a cup ofcoffee, the decay of a radioactive particle), students should
1) notice how the graphs are alike and how they are different2) be able to describe the decay represented—how quickly the decay occurs, what is
the half-life, what does the asymptote represent
In their continued study of tables of graphs they should be able to describe all thecharacteristics of an exponential relationship, only now as a decay, rather than agrowth process.

EXPONENTIAL GROWTH
ATLANTIC CANADA MATHEMATICS CURRICULUM: MATHEMATICS 3204/3205 95
Worthwhile Tasks for Instruction and/or Assessment Suggested Resources
Exponential Growth
Performance (C2/C11)
1) Carbon 14 is an isotope of carbon found in plants, which have absorbed it from theatmosphere. From the time the carbon 14 is absorbed, it decays exponentially. Thepercentage, y, of carbon 14 in the plant x years after absorption is given by thefollowing equation: y = 10 2 – 0.00005235x. Graph this equation and determine the half-lifeof carbon 14.
2) When one face of a cube is painted red and tossed, the probability that it will land
redside up is 1
6 because each cube has six sides, and only one of those sides is painted
red. Tossing many cubes and knowing how many will show red faces is an
unpredictable, random process. Rarely will 1
6 of the cubes do this on any toss.
However, if you repeat the toss many, many times, the average number that show
red will approach 1
6. So, if one were to toss 100 cubes and remove the red ones,
and continue this, it would take about four tosses for approximately half of thecubes to be removed, so the half-life of a group of cubes is about four tosses. (After
one toss 5
6 remain,
1
6has decayed; after two tosses
56
of 56
, or 25
36 remain; and
after four tosses 5
6 of
5
6 of
5
6 or
625
1296 of the cubes are left, 52 have been
removed).
In this model, assume that the removal of a cube corresponds to the decay of aradioactive nucleus. The chance that a particular radioactive nucleus in a sample ofidentical nuclei will decay in a second is the same for each second that passes, just as
the chance that a cube would come up red was the same for each toss 1
6æ öç ÷è ø . The
smaller the chance of decay, the longer the half-life (time for half of the sample to decay)of a particular radioactive isotope.
Follow this procedure:a) Toss the 100 wooden cubes onto a table surface. Remove all the cubes that land
red side up. Place to the side.b) Gather up the remaining cubes and toss them again. Again, remove all the cubes
that land red side up.c) Repeat this experiment until there are 10 cubes remaining. (Given the small starting
number, statistically numbers below 10 become insignificant. In actual situations, thenumber of atoms is much greater.)
d) Preparing to graph:i) What does the number of trials represent in real-life?ii) What does the number of cubes remaining after each toss represent?iii) What is the dependent variable, and what is the independent variable?
e) Use regression analysis to obtain a graph and an equation that best fits the data.f ) Determine the half-life from your graph and equation. Show all your work.g) Approximately how many radioactive nucleii will remain after 10 time periods?
Explain.h) According to your model how much time will pass for the 100 nucleii to decay to 15?

EXPONENTIAL GROWTH
ATLANTIC CANADA MATHEMATICS CURRICULUM: MATHEMATICS 3204/320596
Elaboration—Instructional Strategies/SuggestionsOutcomes
SCO: In this course, studentswill be expected to
Exponential Growth
A5 demonstrate anunderstanding of the role ofreal numbers in exponentialand logarithmic expressionsand equations
A5 As students model situations and solve problems that can be represented byfunctions like y = Cax, they need to be sure that the expression ax has a meaning forall values of x. The way ax is defined for rational and irrational values of x is explainedbelow.
Rational exponents:
Students should already be familiar with the definition of ax in the case where x is apositive or negative integer.
If m and n are both positive integers,
1/ n na a= , which is the number whose nth power is a
/m n mna a= , which is the number whose nth power is am
/ 1mnm na
a- æ ö= ç ÷è ø
0 1, 0a a= ¹
These four definitions give a meaning to ax for any rational number x.
Irrational exponents:
If x is irrational in y = ax , then the value ax will be an approximation. For example,
given 32y = , students might choose 3 1.72B , and 1.722y B . This results in
B 3.29436 .y However if technology is used to evaluate 32y = , the result will be
B 3.322 .y In this course, students will not need much emphasis on how ax is
defined for irrational values of x. The concept of ax where x is irrational is studied in afuture course.

EXPONENTIAL GROWTH
ATLANTIC CANADA MATHEMATICS CURRICULUM: MATHEMATICS 3204/3205 97
Worthwhile Tasks for Instruction and/or Assessment Suggested Resources
Exponential Growth
Performance (A5)
1) a) Apply the definition of bt, where t is rational, to evaluate the following without
using a calculator: 1 1 2 2 2 6 23 33 3 3 3 3 5 34 28 , 8 , 8 , 8 , 16 , 27 , 32 , 125 , 25
- - - -
b) Evaluate using your calculator.c) Check using a graphing utility.
2) Which of the following is of greatest value? Explain.
a) (33)3 b) 333 c) 333 d) 333
3) Prove that
4) Simplify each expression and evaluate if possible:
a) ( )2 34 2 32× ¸
b) ( ) ( ) ( )23 523 9 3xyz x y x× ¸
c)( )
2 21m n
n n
x x
x x
+æ öç ÷è ø
5) Simplify: i) 5n + 5n ii) 2x + 5 + 2x + 5
6) Explain how 3k + 1 can be the same as 3(3k). Explain how you might use this ideain a question like “... factor 1 – 22x + 1 + 42x ...”.
7) Give the meaning of each power:
a) x –5 b) 1
3y c) 23a d) n–y
8) Evaluate:
a) 3
416 b) 1
264-
c) ( ) ( )2 3 1 13 2 2 3- - - -+ ¸ - d)
11 22 0 2 1
5 10 49
-
æ ö+ - - ç ÷è ø
9) Explain how you could use a graph to evaluate each of the following:
a) 70.3333 b) 722
-
-
c) 3·2 x – 5 = 2 ·10 –2x – 10
( )43 72 2 .≠

EXPONENTIAL GROWTH
ATLANTIC CANADA MATHEMATICS CURRICULUM: MATHEMATICS 3204/320598
Elaboration—Instructional Strategies/SuggestionsOutcomes
SCO: In this course, studentswill be expected to
Exponential Growth
C2 model real-worldphenomena using exponentialfunctions
C3 sketch graphs fromdescriptions, tables, andcollected data
C25 solve problems involvingexponential and logarithmicequations
F1 create and analyse scatterplots and determine theequations for curves of bestfit, using appropriatetechnology
C2/C25/C3/F1 Students should realize that when they work with real data, there isalways some variability due to measurement error. It is often difficult to measureexactly and sometimes it is necessary to measure indirectly. Thus students cannotexpect to generate a model that will fit the data perfectly. No matter how accurate thedata, they may have to simplify a complex situation in order to construct a model.Assuming the growth ratios are constant is a way of simplifying the situation. Whenstudents think they have found a model, they should always graph it and the raw data,to see how well it fits. They need to ask themselves whether any assumptions theymade were justified, and whether some other model might fit the data better.
Up to now, what students have been doing could be described as empirical curvefitting. They have looked for patterns in tables of data and determined a formula todescribe the situation. The tables were not very extensive, and the pattern was notalways perfect. To justify the assumption that exponential functions are the bestmodels for growth, they need to think about the processes by which living thingsgrow, and perhaps conclude that it is only reasonable to assume that growth will beexponential under certain conditions. If growth is constant, however, linear is the bestmodel. For bacteria growth to be exponential, temperature and food supply need to besteady. For populations, the birth and death rates need to be more or less constant.
Students should consider situations as described in the Instructional Activities on thenext page. This will be their first attempt to give a theoretical explanation for theobserved patterns.
Equations like y = 2x, 3x,
1
2
x
, and
1
3
x
, can be determined from tables. Some real
situations will be more complicated, and finding the appropriate model would bevery difficult to do by hand, so, it is expected that students will use technology.
Students should also consider conducting experiments using calculator- or computer-based laboratories. They should determine the equation using exponential regressionand analyse how well the equation fits the data.
Students should also deal with situations in which the dependent variable decreases ina gradual way. Students should be encouraged to conduct an experiment of a situationsuch as a swinging pendulum to find out how a swing gradually slows down ormeasuring the temperature of a cup of coffee to determine how fast it cools. Theycould use the CBL or PSL probes to measure the temperature over time, or a motiondetector (or their naked eye) to time or measure the decreasing amplitude of apendulum.

EXPONENTIAL GROWTH
ATLANTIC CANADA MATHEMATICS CURRICULUM: MATHEMATICS 3204/3205 99
Worthwhile Tasks for Instruction and/or Assessment Suggested Resources
Exponential Growth
Performance (C2/C25/C3/F1)
1) Suppose that a strain of bacteria has a doubling time of one hour at room temperature if aplentiful food supply is provided.a) If 10 organisms are present at the start, find how many there will be after 0, 1, 2, ...
hours, and enter your results in a table.b) Write an algebraic expression for the number after t hours.c) Doubling times for bacteria vary according to the temperature and the strain of
bacteria. Add more rows to your table to show the growth of bacteria with doublingtimes of i) 2 hours ii) 3 hours iii) 30 minutes iv) 20 minutes
d) Find an algebraic expression for each of these growth functions.e) Generalize your formula to bacteria with a doubling time of d hours.f) Sketch the graphs of all your functions on the same axes and label each one. Will the
domains and ranges of these functions result in graphs that are continuous ordiscrete?
g) If C is the number at the start, and d the doubling time, write down a formula forN, the number of bacteria after t hours.
2) Suppose that, in each unit of time, t, the number of deaths is 5% of the population andthe number of births is 15%, so that the increase in each time interval is 10% of thesize at the beginning. The time interval may be a year, a month, or a week, dependingon the species you are dealing with.a) If there are 100 individuals in the population when t = 0, how many will there be
when t = 1, 2, 3, ...?b) What is the ratio of each of these numbers to the one before it?c) Use this growth ratio to work out a formula for the size of the population at any
time t.d) Go through the same steps to find what the formula would be if the increase per unit of
time was 5%.e) Generalize to the situation where there is an increase of r% per unit of time.
3) When Jose and Terri carried out a water cooling experiment, they obtained the resultsgiven in the table below.
Here t stands for the time in minutes since the experiment began and T for thetemperature of the water in degrees Celsius. Room temperature was 20oC.a) Graph the data. What do you think will happen to the water temperature if you
wait long enough?b) Add another row to the table showing the difference between the water
temperature and room temperature. How would you test whether an exponentialmodel would fit these numbers?
c) The first three numbers do not appear to fit the same pattern as the rest. Can yousuggest a reason for this?
d) Find an exponential function that fits the numbers from t = 6 to t = 20 as well aspossible.
e) According to this model, what temperature would you expect the water to be after 30minutes?
4) Kate bought a computer for $2 000, to use in a business she is setting up. If it depreciatesat a rate of 30% per year, what will the depreciated value be after one year, two years, ...five years? Find an expression for its value after n years and show this on a graph.Approximately how long does it take for the value of the computer to reduce to half theinitial amount?
t 0 2 4 6 8 10 12 14 16 18 20T 89.0 83.2 78.0 73.7 70.4 67.4 64.8 62.6 60.0 58.0 55.8
Barnes, Mary. InvestigatingChange: Growth and Decay:Unit 7. Melbourne:Curriculum Corporation,1993.
Brueningsen, Chris, et al.Real-World Math with theCBL System. Dallas: TexasInstruments, 1994.

EXPONENTIAL GROWTH
ATLANTIC CANADA MATHEMATICS CURRICULUM: MATHEMATICS 3204/3205100
Elaboration—Instructional Strategies/SuggestionsOutcomes
SCO: In this course, studentswill be expected to
Exponential Growth
C33 analyse and describe thecharacteristics of exponentialand logarithmic relationships
C29 analyse tables and graphsto distinguish between linear,quadratic, and exponentialrelationships
C33/C29 Students should understand that there is a typical shape for an exponentialgraph. They should be able to talk about how quickly y-values become very large inexponential growth situations. If studentswanted to see the results of larger x-values,they would need to reduce the scale on they-axis by a huge factor, otherwise the graphwould run right off the page. If graph onerepresents y = 2x, then what would be thevalue of y if x = 10 or 15. When x isnegative the value for y = 2x soon becomesso small that it is hard to distinguish thegraph from the x-axis. To get a better ideaof how the graph behaves for negative values for x, students should extend the x-axisand reduce the scale on the y-axis (see graph 2). Ask students to explain why the twographs look so much alike.
Both graphs 1 and 2 are graphs of y = 2x. Students should compare the graphsy = 3x, y = 4x, y = 10x with y = 2x and describe what point they all have in common.When x is positive, which graph lies above the other? When x is negative, whichgraph lies above the other? Students should make conjectures from the abovequestions and test them on y = 1.5x and y = 2.5x. Students should compare graphs of
y = 2 –x and =
1
2
x
y . They should try to graph y = b x when b is negative. What
happens? Explain.

EXPONENTIAL GROWTH
ATLANTIC CANADA MATHEMATICS CURRICULUM: MATHEMATICS 3204/3205 101
Worthwhile Tasks for Instruction and/or Assessment Suggested Resources
Exponential Growth
Journal/Paper and Pencil (C33/C29)
1) Explain why all equations of the form y = Cax where a > 0 and C > 0 and1a ¹ , pass through (0, 1).
2) Explain why the graph of y = 2.5 x approaches the x-axis more quickly than thegraph of y = 1.5 x.
Performance
3) a) Investigate the graphs of ( ) ( )1 1
222 236 , (6 ) , 36 , and 6 .x xx x
y y y y= = = = Explain
what is happening.
b) Based on what you have learned in a) rewrite ( )1
2 25x three different ways.
c) Investigate the graph of 1
32x
y = and ( )1
2 25x
y = . Explain what is happening.
4) Graph y1 = 2 –x, y2 = 2 x. Harry said that if he graphs y1 = 2 –x for 20, 2xx y£ =
for 0x ³ , on the same axes then he gets the graph y3 = x2 + 1. Do you think
Harry is correct? Use mathematical reasoning to correct Harry or defend him.
5) Examine the following tables and indicate which one(s) are suggesting anexponential relationship. Explain your thinking.
X
012345
Y
0.0930.18750.3750.751.53
X
–7–6–5–4–3–2
Y
20 00020020.020.00020.000002
X
–6–4–3–21
Y
–3456–1504–828–352–124

EXPONENTIAL GROWTH
ATLANTIC CANADA MATHEMATICS CURRICULUM: MATHEMATICS 3204/3205102
Elaboration—Instructional Strategies/SuggestionsOutcomes
SCO: In this course, studentswill be expected to
Exponential Growth
C35(Adv) write exponentialfunctions in transformationalform, and as mapping rules tovisualize and sketch graphs
A7 describe and interpretdomains and ranges using setnotation
C35(Adv)/A7 Students should explore exponential relationships so that when theyrepresent the relation with an equation and/or mapping rule, they will be able to estimatethe position of the graph, the orientation, and the behaviour on the coordinate system.
Based on the investigations of the transformations of y = x2 in their previous study, studentsshould explore transformations of the exponential equation y = 2 x .
Students might begin by graphing y = 2 x and y = 2 –x. Have students explore whether theycan position one of them onto the other for comparison. Ask them a series of questions thatwill lead them to discover that y = 2 –x is the image of y = 2 x after a reflection in the y-axis,and this transformation can be recorded in a mapping rule:
Students should continue to investigate all the transformations asthey did for quadratic and trigonometric functions. They should be
able to take an equation like this − +− + = 2( 1)1
( 2) 22
xy and form a
mapping rule . Most importantly they
should be able to visualize the shape and location of the graph on thecoordinate system.
Student thinking might go something like this:
• The graph of y = 2 x, y = 3 x, etc. all pass through the point (0, 1).• This point (0, 1) is called a focal point because the graph looks like it behaves differently
on one side than on the other side.• For example on the graph y = 2 x to the left of the focal point the graph curves slowly
downwards toward the asymptote. On the right of the focal point the graph curvesquickly upwards as the x values increase.
• Thus in graphing the equation , first notice a negative on both the
x and the y which indicates that the graph of y = 2 x will be reflected in both the y- andx-axis, resulting in the graph curving slowly upward towards the asymptote on the rightof the focal point and downward quickly on the left of the focal point.
• The domains include all real numbers , but the ranges are restricted by theasymptotes ( )2y y R< Î .
To find the image of the focal point (0, 1), students would first consider the reflections.Obviously, only the reflection in the x-axis will have an effect, moving (0, 1) to (0, –1). Thenconsider the stretches, and again only the vertical stretch has an effect since the stretchfactors multiply the (0, –1) coordinates to locate the stretched image at (0, –2). Thenstudents deal with the translations moving (0, –2) left 1 and down 2 to (–1, –4). Due to thedouble reflection and the two stretch values, the graph will be increasing, from left to right,rising very sharply (steep slopes for the tangents to the curve) towards the focal point, thencontinuing to increase at a very slow rate as it approaches the horizontal asymptote, which istwo units above the focal point (vertical stretch of 2).
To describe the x-values for which the graph increases, students would write
x R or, in interval notation, ( ),x Î - ¥ ¥ . Y-values can be described as beingrestricted by the asymptotes. Thus, for exponential functions the y-values always lieentirely above or below the horizontal asymptote and can be represented usinginequalities and set notation.
( ) ( ), , .x y x y→ −
( ) 1, 1, 2 2
2x y x y→ − − − −
( ) ( )2 112 2
2x
y− +− + =
( )x R∈
∈
( )2xy =

EXPONENTIAL GROWTH
ATLANTIC CANADA MATHEMATICS CURRICULUM: MATHEMATICS 3204/3205 103
Worthwhile Tasks for Instruction and/or Assessment Suggested Resources
Exponential Growth
Performance (C35(Adv)/A7)
1) An exponential function, f, is defined by f (x) = y = 2 –x+1 – 8.a) Write the equation in transformational form.b) Describe the function as a transformation of y = 2x and graph it.c) State its domain and range and the equation of its asymptote.d) Find its zero(es).e) Solve for x if y = 24.
f) Use a calculator to find f (–0.5) and ( )3f to two decimal places.
2) An exponential function, g, is defined by g(x) = y = –3 x+1 +6.a) Write the equation in transformational form.b) Describe this as a transformation of y = 3x and graph it.c) State the domain, the range and the equation of its asymptote.d) Use a calculator to approximate its zero(es) to two decimal places.e) Solve for x if g (x) = –3.
f) Use a calculator to find g (0.5), ( )2g , and g (–2.6).
g) What relation would describe the region above the graph of g? below the graphof g?
3) a) Draw the graph of y = 2x.b) Use your knowledge of transformations to describe in words each of the
following and graph them on the same coordinate system.A: y = 2 x + 3 B: y + 1 = 2 x
C: –y = 2x D: y = 3(2 x –2) + 5c) Write the mapping rule for each transformation.d) What transformation will change the asymptote of y = 2x?
4) Find the equation of the image y = 2x under each of the following mappings.
a) ( ) ( ), ,x y x y® -
b) ( ) ( ), , 1x y x y® - +
c) ( ) ( ), 3 1, 5x y x y® - +
5) Given that f (x) = y = (1.2) x – 1 – 3.a) What are the domain and the range of the function?b) For what values of x does f increase? decrease?c) What is the approximate zero of f ?d) Describe f as a combination of transformations of y = (1.2) x.
6) For y = 2 x, prove that a horizontal translation of –2 is equivalentto a vertical stretch of 4.
7) What is the equation for the graphat the right? Explain.

EXPONENTIAL GROWTH
ATLANTIC CANADA MATHEMATICS CURRICULUM: MATHEMATICS 3204/3205104
Elaboration—Instructional Strategies/SuggestionsOutcomes
SCO: In this course, studentswill be expected to
Exponential Growth
C35(Adv) write exponentialfunctions in transformationalform and as mapping rules tovisualize and sketch graphs
C33 analyse and describe thecharacteristics of exponentialand logarithmic relationships
C35(Adv)/C33 By exploring equations, tables, and graphs, it should be clear that theexponential graph is either increasing or decreasing and always approaches a horizontalasymptote, e.g., students can see an increasing exponential graph in A and C, butdecreasing in B. The horizontal asymptote in A is y = 0, and in B is y = 1, and C is y= 2 (always determined by the vertical translation). This ensures then that exponentialequations will at the most have one real root, and this will occur only when the graphcrosses the x-axis (as in C).

EXPONENTIAL GROWTH
ATLANTIC CANADA MATHEMATICS CURRICULUM: MATHEMATICS 3204/3205 105
Worthwhile Tasks for Instruction and/or Assessment Suggested Resources
Exponential Growth
Performance (C35(Adv)/C33)
1) Analyse the graph of the function y = –3(x+2) and answer the following questions:a) State the domain and range.b) Are there any zeros for the function? If so, what are they?c) Write the equation for the asymptote, if any.d) Does the function increase or decrease with x? Give reasons for your answers.
2) a) Explain why the following equation is not in transformational formf (x) = –3 · 2 (2x – 6) + 5
b) Put the above equation in transformational form and describe thetransformations of y = 2 x in words and as a mapping rule.
c) State the domain, range, zero(es), and equation for the asymptote.d) Describe the interval for which the graph decreases using symbols.e) If, for some reason, the domain is restricted to 5 0x- £ £ , describe the
corresponding range using set notation.
3) Answer the following questions about the graph drawn onthe right.a) Is the curve exponential? How do you know?b) Is it a transfromation of y = 2 x or y = 3x?c) Are there any reflections? Describe them.d) Are there any stretches? How do you know?e) State the equation for the curve, then check with your
graphing calculator.

EXPONENTIAL GROWTH
ATLANTIC CANADA MATHEMATICS CURRICULUM: MATHEMATICS 3204/3205106
Elaboration—Instructional Strategies/SuggestionsOutcomes
SCO: In this course, studentswill be expected to
Exponential Growth
B1 demonstrate anunderstanding of therelationships that existbetween arithmetic operationsand the operations used whensolving exponential equations
B12 apply real numberexponents in expressions andequations
C24 solve exponential andlogarithmic equations
C25 solve problems involvingexponential and logarithmicequations
B1/B12/C24/C25 When asked to solve an equation in the form 4 = 2 x studentsshould understand that the solution is located at the point where y = 4 and y = 2x
intersect, and this can be found using a graph. Students should realize that they arelooking for an x value that when written as an exponent with a base of 2 gives theresult 4. However, this process may become complicated in equations such as23x + 5 = 0.5. Now it is not as clear what x value would be such that would give
the answer 0.5. However, students understand that =1
0.52
and that − =1
2 12
.
Therefore, they can rewrite + −= =3 5 3x+5 12 0.5 as 2 2x . Because the bases are equal,
students solve the equation for for x.
Many students will understand that a problem occurs when both sides of the equationcannot be expressed with the same base. Trial and error methods should be exploredleading to the need for logarithms (see next page). A few students would enjoy thepuzzle-solving-like opportunity to unravel equations like:
1) 2 1 35 25x+ = 4) ( )2 19 27 3xx x x+ =
2) 2 34 9 55x- - = 5) ( )25 26 5 25 0x x- + =
3) ( )+ =2 19 81 27 xx 6) 13 3 324x x+ + =
5) and 6) are for advanced students only.
Discussion should focus on multiple representations and justification of each. For
example, =32 27d can be expressed as ( )
3113 22 or d d
æ öç ÷è ø
. Students could use this
strategy to solve
1) =
=
==
32
3132
12
27
3
3
9
d
d
d
d
and 2)
( )
32
113 22
3
8
64
64
4
d
d
d
d
=
=
=
=
... continued
3 52 +x
3 5 1x + = −

EXPONENTIAL GROWTH
ATLANTIC CANADA MATHEMATICS CURRICULUM: MATHEMATICS 3204/3205 107
Worthwhile Tasks for Instruction and/or Assessment Suggested Resources
Exponential Growth
Pencil and Paper (B1/B12/C24)
1) Solve the following algebraically:a) 2 4 18 2x x +=b) 74 2x x+=
c) 2 1 35 25x+ =
2) Solve for x (Advanced-level students).
a) ( )23 10 3 9 0x x- + =
b) 13 3 324x x+ + =
c) ( )2 19 27 3xx x x+ =
d)1
2 881x =
3) Find the value for x which ( )( )( )2 2 24 2 4
51232
x x x
x
+ +
= .
4) Solve for the following equations:
a)2 3 21 1
8 2
x x- +æ ö æ ö
=ç ÷ ç ÷è ø è ø
b) ( )2
2 93
15
8x æ ö
- = ç ÷è ø
c) ( )2 19 81 2 7x x+ =
,.. continued

EXPONENTIAL GROWTH
ATLANTIC CANADA MATHEMATICS CURRICULUM: MATHEMATICS 3204/3205108
Elaboration—Instructional Strategies/SuggestionsOutcomes
SCO: In this course, studentswill be expected to
Exponential Growth
B1 demonstrate anunderstanding of therelationships that existbetween arithmetic operationsand the operations used whensolving exponential equations
B12 apply real numberexponents in expressions andequations
C24 solve exponential andlogarithmic equations
C25 solve problems involvingexponential and logarithmicequations
... continued
Discussion with advanced level students might also include recognizing that2 2 12 2 2x x +⋅ = . For example, when advanced level students are asked to solvee
2 12 3 2 5x x+ + ⋅ = algebraically they could rewrite as ( )22 2 3 2 5 0x x+ ⋅ − = and again as
( ) + ⋅ − =2
2 2 3 2 5 0x x then factoring:
{ }φ
⋅ = − =
= − =
= =
∴
0
2 2 5 and 2 1
52 and 2 2
2 0
0
x x
x x
x x
or by substituting a = 2x; ( ) ( )
{ }
+ − =
+ − =+ = − =
= − =
= − =
= − ∴ =
= ∅
0
2 3 5 0
2 5 1 0
2 5 0 and 1 0
2 5 1
5 so, 2 2
25
so, 2 02
0
x
x
a a
a a
a a
a a
a
x
x
... continued
{ }0∴

EXPONENTIAL GROWTH
ATLANTIC CANADA MATHEMATICS CURRICULUM: MATHEMATICS 3204/3205 109
Worthwhile Tasks for Instruction and/or Assessment Suggested Resources
Exponential Growth
... continued
Pencil and Paper (B1)
5) What follows are some examples of student work. You are to explain what thestudent is doing or thinking between step 1 and step 2:a)
( ) ( )
( ) ( )
( )
4 2
22 2
2
2
2
3 3 Step 1
3 3 Step 2
3 3
6 9 3
7 6 0
x x
x x
x x
x x x
x x
− = +
− = + − = +
− + = +
− + =M
b) 1
1 3
4 64 step 1
4 4 step 2
1 3
x
x
x
M
+
+
=
=
\ + =
c) <
<
< <M
2
5
5 6
10 6
1 1
32 64
1 1 step 1
2 2
1 1 step 2
2 2
10 6
x
x
x
Performance (C25)
6) The table represents population increases from 1955 to 1990. The numbers are inbillions.
a) Graph the relationship using the values in the above table and determine theequation that best represents the relationship.
b) Using the equation, determine the population in the year 2010.c) Explain how you would use the equation to predict how long it would take for
the population in year 2010 to double, assuming it continues to grow at thisrate.
Year 1955 1960 1965 1970 1975 1980 1985 1990Population 2.7 2.98 3.29 2.67 4.01 4.43 4.84 5.29
EXPONENTIAL GROWTH
ATLANTIC CANADA MATHEMATICS CURRICULUM: MATHEMATICS 3204/3205110
Elaboration—Instructional Strategies/SuggestionsOutcomes
SCO: In this course, studentswill be expected to
Exponential Growth
C19 demonstrate anunderstanding, algebraicallyand graphically, that theinverse of an exponentialfunction is a logarithmicfunction
C11 describe and translatebetween graphical, tabular,written, and symbolicrepresentations of exponentialand logarithmic relationships
A7 describe and interpretdomains and ranges using setnotations
C19 As students explore and solve exponential equations in various forms, eventuallythey will need to solve for the exponent where they are unable to find common base ofall terms. When this has happened earlier in their learning, students simply read avalue from the graph or used trial and error methods.
It is now time for students to explore this concept in more depth. Ask students tofind x when 3x = 9. Students will quickly say that x = 2 because 32 = 9. Now askstudents to find x when 3x = 7 using a trial and error procedure. (The graphingcalculator is a tool students could use here by drawing the graphs y = 3x and y = 7 andexamining the interaction points.
C19/C11/A7 To symbolize what the calculator has done, students need to beintroduced to the term ‘logarithm.’ This name is used to describe the inverse functionof an exponential function with the same base.
€ Ask students to plot y = 10 x from a table where 5 1x− ≤ ≤ and state the domain
and range.€ Have them then reflect y = 10 x across y = x and plot the resulting curve. Have
them state the domain and range again and compare.€ Discuss with students why they should draw the inverse y = 10 x by reversing the
coordinates in the table for y = 10 x and plotting them (y = x is the line ofsymmetry between the graphs of a function and its inverse).
€ Use the 10x feature (2nd, Log on the TI-83), to enter 10^(2.1) and hit enter. Thenhave them press Log and ANS [answer: (–2nd, (–))] and hit Enter.
€ Ask them to– describe what has happened– discuss how one (10x or LOG) is a function that undoes what the other
function did (the term for this is “inverse function”)– explain how they can show the same process on the graphs they drew– use the ‘log’ button on their calculator and check their table and graph by
finding the logarithm of each of the x-values in the table– create the same two graphs using technology, then examine the table in the
TABLE feature
Students should develop the equation for this new graph as y = log x (log x and log10xmean the same—the base 10 is assumed). They start with y = 10x, switch the x and yto get x = 10y, then solve for y by using the symbol for logarithm (log). Since y wasthe exponent, and log means exponent, then y = log x.
Similarly if they were to begin with y = 2x, the inverse function would be written y = log2 x. Students need to understand how to evaluate log27 using their calculatorsince the ‘log’ button assumes base 10, (see B13, next page).

EXPONENTIAL GROWTH
ATLANTIC CANADA MATHEMATICS CURRICULUM: MATHEMATICS 3204/3205 111
Worthwhile Tasks for Instruction and/or Assessment Suggested Resources
Exponential Growth
Performance (C19/C11/A7)
1) a) Find the equation of the inverse function, h, defined by h(x) = 7 2x and graphit.
b) Is this inverse a function?c) Find the zero(es) of h –1.d) Could you graph h –1 by graphing h(x) first? How?
2) a) Sketch the graph of f (x) = 10x for these values of x. x = 0.1, 0.2, 0.3, 0.4, 0.5,0.6, 0.7, 0.8, 0.9, 1.0.
b) Estimate from the graph the values of x for y = 1, 2, 3, ... , 10.c) Construct a table of values using the values of y in (b) for x and the values of x
in (b) for y. Plot the ordered pairs obtained and join them with a smooth curve.d) What relation would you use to describe the graph expressing y in terms of x?e) State the domain and the range of this graph.
Pencil and Paper (C19/C11/A7)
For questions 3 and 4 below, use the graph of y = log 10 x shown. Give your answerscorrect to two decimal places and check with a calculator.
3) Find an approximate value for each of the following. a) log 10 4 b) log 10 7 c) log 10 8.5 d) log 10 3.5
4) What is the approximate value of x for each of the following? a) log 10 x = 0 b) log 10 x = 1 c) log 10 x = 0.7 d) log 10 x = 0.4 e) log 10 x = 0.65 f) log 10 x = 0.35
5) Explain that the equation of the image of y = log 5 x under a vertical stretch of 2followed by a horizontal translation of –1 and then a vertical translation of 2 is y = 2log 5 (x + 1) + 2.

EXPONENTIAL GROWTH
ATLANTIC CANADA MATHEMATICS CURRICULUM: MATHEMATICS 3204/3205112
Elaboration—Instructional Strategies/SuggestionsOutcomes
SCO: In this course, studentswill be expected to
Exponential Growth
B13 demonstrate anunderstanding of theproperties of logarithms andapply them
C24 solve exponential andlogarithmic equations
B13 Before calculators and computers were readily available, logarithms of numberswere an indispensable aid to scientific calculations. Although this role has been takenover by machines, logarithmic functions are still crucial models for many importantscientific phenomena. It is still important to be comfortable with the algebraicproperties of logarithms as well as exponential functions. Students should strive formental math capabilities with the use of many of these properties. Time should bedevoted to helping students develop strategies. For example, students should be ableto calculate mentally log232 using the strategy of answering “2 to what power equals32?”.
Properties to be developed (assume x and y > 0)
1) If y = ax, then x = loga y2) loga2 + loga3 = loga6 then generalize to log x + log y = log xy and describe this in
words.
3) log log logx
x yy
− =
4) log 9 = 2 log 3 and generalize this to log x2 = 2log x
5)log
logloga
xx
a=
6)1
log log pp
= -
7) loga a =18) logb b
x = x
9)1
loglogb
a
ab
=
These properties are useful when simplifying logarithmic expressions and trying tosolve equations requiring logarithms. Since solving logarithmic equations algebraicallyrequires students to use the strategy of simplifying the equation to a single ‘log’ termof the same base on both sides, students would use various properties above tosimplify the expression.
Students should also be able to solve problems of the type:
a)
b)
( )6 6log 1 log 1x x+ + =
3 510 20x − =

EXPONENTIAL GROWTH
ATLANTIC CANADA MATHEMATICS CURRICULUM: MATHEMATICS 3204/3205 113
Worthwhile Tasks for Instruction and/or Assessment Suggested Resources
Exponential Growth
Pencil and Paper (B13/C24)
1) Express each in logarithmic form.
a) 9 = 3 2 b) 21
39
-= c) 1
3 35 5= d) 1327 3=
2) Express each in exponential form.
a) 7 = log 2 128 b) 2
16 log
64æ ö
- = ç ÷è ø c) log 3 4 = x d) ( )32
1log 2
3=
3) Evaluate each expression.
a) log 9 81 b) log 6 6 c) log 2 1 d) 3
1log
9æ öç ÷è ø
e) log77 f) log 81 9 g) log 2 (2 3) h) log a a
x
i) 2log a a j) log50
4) If log 10 4 = 0.602, find log 10 16 without using a calculator.
5) If log b x = p and log b y = q, find log b (xy), x and y > 0.
6) If log a b = x and log a c = y, find .
7) Prove that log
loglog
ba
b
xx
a=
8) Express each of the following as a single logarithm in simplest form. a) 8log 4 2 b) log 5 48 – log 5 12 + log 5 4 c) 3 log 6 15 – log 6 25 d) log a x + log a y – log a z
e) log b 2x + 3(log b x – log b y) f) 1 2
log log2 3a ax y-
9) Evaluate.
a) + + + + + 3 3 4 4 3 10
1 1 1
16 9 10log 9 log 27 log 64 log log log
b) − + − 2 2 4 8
1
32log 32 log log 8 log 16
c) ( ) + + − 2 3 10 3
1
93log 4 2log 9 log 0.1 log
10) Express each logarithm in terms of m and n where log b x = m and log b y = n.
a) logb
xy
æ öç ÷è ø
b) log b (xy2) c) d)
11) Solve for x:
a) 2log 8 x= b) 2 5
1log 8 log 2log 125
9x = - +
2
loga
bc
( )2logb xy logb
x
y

EXPONENTIAL GROWTH
ATLANTIC CANADA MATHEMATICS CURRICULUM: MATHEMATICS 3204/3205114
Elaboration—Instructional Strategies/SuggestionsOutcomes
SCO: In this course, studentswill be expected to
Exponential Growth


![More Applications of the Polynomial Method to Algorithm …hy2/files/faster-orthog...2n(1 "=2)2o(m) time [Wil05]. The Strong Exponential Time Hypothesis ([IP01,CIP09]) effectively](https://static.fdocuments.us/doc/165x107/60bce3e7b3c79b187c13fb9c/more-applications-of-the-polynomial-method-to-algorithm-hy2filesfaster-orthog.jpg)