Unit 1 The History and Science of Psychology Defining Psychology Role of philosophy Influence of...
39
Unit 1 The History and Science of Psychology
-
Upload
malcolm-hopkins -
Category
Documents
-
view
216 -
download
0
Transcript of Unit 1 The History and Science of Psychology Defining Psychology Role of philosophy Influence of...

Unit 1
The History and Science of Psychology

Defining Psychology
Role of philosophy Influence of biology Importance of outward behavior Psychology is defined as the scientific
study of behavior and mental processes.

The Birth…and Afterbirth of Psychology
Classical origins Wilhelm Wundt
First psychology lab, 1879 at the University of Leipzig
Examined introspection, or the analysis of one’s conscious experiences

Schools of Thought: “Old Skool”
Structuralism E.B. Titchener Introspection Break down immediate sensation, past memories, feelings
Functionalism William James Darwin’s influence Conscious experience is adaptive Stream of consciousness
Titchener James
Break it down!
No, Beotch! Why is it
ADAPTIVE?
Holla!

Schools of Thought:Old Skool
Early contributions of women Limitations on access to education Restrictions on awarding advanced degrees Exclusion from psychological societies
Mary Whiton Calkins Margaret Floy Washburn Rosalie Rayner
Today, women earn the majority of Ph.D.s in psychology and hold nearly half of the leadership roles in psychological societies
Gimme my Ph.D. or I’ll shank ya!
Schools of Thought:Classics
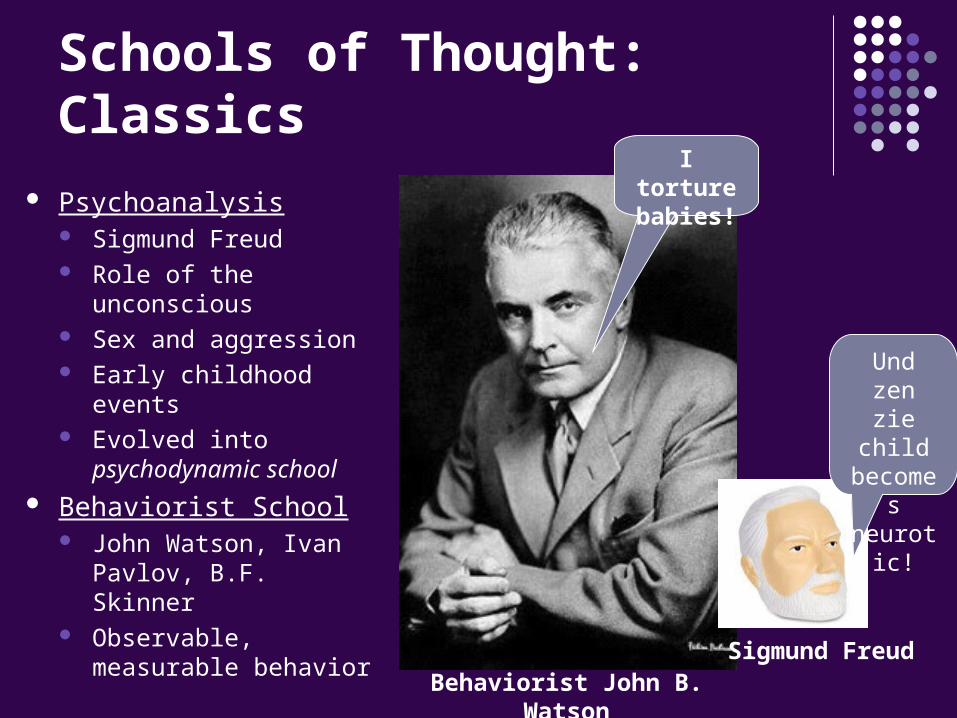
Psychoanalysis Sigmund Freud Role of the
unconscious Sex and aggression Early childhood events Evolved into
psychodynamic school Behaviorist School
John Watson, Ivan Pavlov, B.F. Skinner
Observable, measurable behavior
I torture babies!
Behaviorist John B. Watson
Und zen zie child becomes neurotic!
Sigmund Freud

Schools of Thought:Classics
Gestalt Max Wertheimer,
Fritz Perls Human tendency to
perceive patterns “the whole is greater
than the sum of its parts”
Useful in understanding process of perception
Black spots, or a dalmatian?
Schools of Thought:Classics
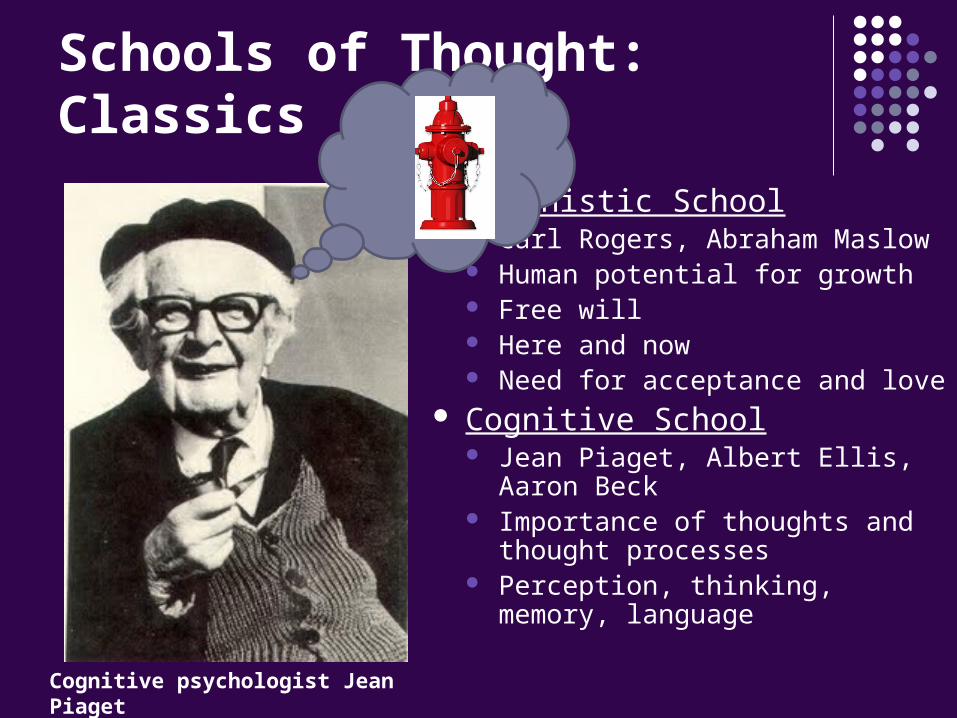
Humanistic School Carl Rogers, Abraham Maslow Human potential for growth Free will Here and now Need for acceptance and love
Cognitive School Jean Piaget, Albert Ellis, Aaron
Beck Importance of thoughts and
thought processes Perception, thinking, memory,
languageCognitive psychologist Jean Piaget

Schools of Thought:New Directions
Today, contemporary schools of thought have expanded to also include the following: Neuroscience Evolutionary Psychology Behavioral Genetics Social-Cultural

Schools of Thought:The Biopsychosocial Approach
Regardless of the particular school of thought, contemporary psychology has come to embrace the biopsychosocial approach Biological influences Psychological influences Social-Cultural influences
OBEY.

Schools of Thought:The Biopsychosocial Approach
Each particular school of thought may emphasize one area more than another
Which area/s do you think each school would emphasize?

Enduring Issues in Psychology Psychologists representing all schools of
thought debate what shapes behavior Some on-going debates include the following:
Nature vs. Nurture Person vs. Situation Mind vs. Body Stability vs. Change Diversity
The failure to resolve the debates suggests both sides are valid and shed light on behavior
An eclectic approach may be most appropriate

Psychology Careers:Education The Degrees
BA – 4 year study MA – 2-3 Years beyond BA Ph.D./Psy.D./Ed.D. – 6-7 years beyond BA M.D. – Psychiatrists (prescribe medication) – medical school
Increased career opportunities for advanced degrees Admission is competitive!
Strong GPA and GRE scores Related work or volunteer experience Close relationships with professors Publish if possible!

Psychology Careers:Fields of Study Research vs. Applied Psychology? The majority of psychology professionals work as therapists in
some capacity Clinical Psychologists Counselors Psychiatrists
Psychology’s Diverse Subfields Cognitive Community Developmental Educational Experimental Forensic Industrial/Organizational Neuropsychologists School Social

Conducting Research
Goals of Psychology Describe Explain Predict Control
Pitfalls of intuition and “common sense” explanations Hindsight bias Overconfidence
Remember psychology’s definition: “The scientific study of behavior and mental processes”

Conducting Research
The Scientific Attitude: Rely on Empiricism! Curiosity: passion to explore and understand Skepticism: questioning results; retesting Humility: understanding humans’ limitations and
the possibility for error Ultimately, psychologists must be critical
thinkers Do not accept “truths” without first testing them Look at evidence, question assumptions, filter out
bias

The Scientific Method
Generate a question Formulate a theory Develop a hypothesis Test hypothesis
Operational definitions Clear and concise
Replication of results
Descriptive Research Methods
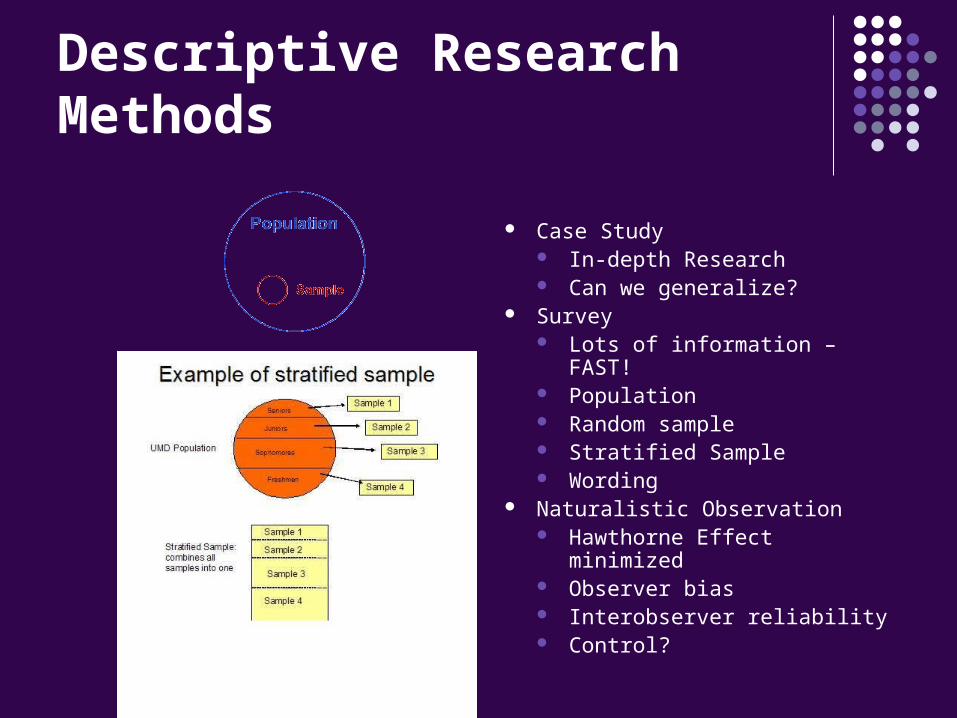
Case Study In-depth Research Can we generalize?
Survey Lots of information – FAST! Population Random sample Stratified Sample Wording
Naturalistic Observation Hawthorne Effect minimized Observer bias Interobserver reliability Control?

Correlational Methods What is the relationship between two factors? Allows prediction, but NOT cause and effect! Correlation vs. causation
A positive or negative relationship does not establish the direction of the relationship
It does not PROVE the if-then Measuring the Strength of Relationship
Correlation Coefficient Between -1 and 1 Stronger relationships are closer to -1 or to 1, closeness to 0
indicates weak or no relationship Positive correlation vs. negative correlation Scatterplots

Reading Scatter Plots:Match the Correlation Coefficient with the Graph!
A. .86 B. -1.0 C. 0 D. .99
Correlational Studies:Pitfalls
Illusory Correlations We can be influenced to see correlations when we
believe they exist Fueled by confirmation bias, or the tendency to only
remember examples that support what we already believe is true
E.g. “Old people are cheap!”

Experimental Method
Researcher deliberately manipulates selected variables and then measures the effects of these manipulations
Because the researcher has this level of control, the experiment can establish causation
However, the level of control can be somewhat artificial, and results may not generalize to the real world outside the lab
Also, it may be unethical to manipulate certain variables
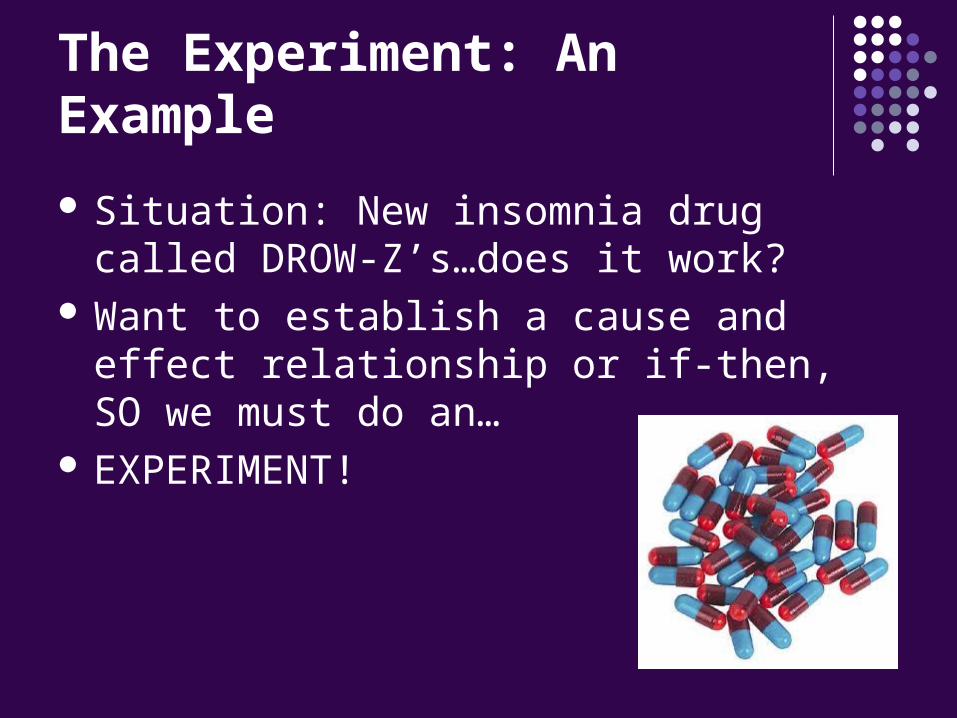
The Experiment: An Example
Situation: New insomnia drug called DROW-Z’s…does it work?
Want to establish a cause and effect relationship or if-then, SO we must do an…
EXPERIMENT!
Personnel - Who is involved?
Experimenter Runs and/or designs the experiment
Subjects/Participants Those being tested Sample - group that represents the larger group we are
generalizing about (i.e. insomniacs) Random Selection - everyone has an equal chance of
being chosen! Confederates
People who help the experimented administer the experiment

Variables - What is happening? Independent Variable
The variable being TESTED Experimenter can manipulate it E.g. exposure to DROW-Z’s
Dependent Variable The RESULT What happens as a result of exposure to the independent
variable E.g. do subjects on DROW-Z’s SLEEP better?
Confounding Variable Throws off results Unwanted!

Experimental vs. Control Groups Experimental Group
The group exposed to manipulation of the independent variable
E.g. receives the DROW-Z’s
Control Group Group NOT exposed to manipulation of the
independent variable E.g. does NOT receive DROW-Z’s May instead receive a PLACEBO
Random assignment to groups All subjects have an equal chance of being in either
the control group or experimental group!

Operational Definitions, Etc. Operational Definitions
What are we measuring and how? Allows experiment to be replicated by others E.g. what is a “better” night’s sleep?
Sample Size: the bigger the better! What is the difference between groups? Replication?

Avoiding PitfallsDouble- and Single-blind procedures
Single - subject doesn’t know who is in control group and who is in experimental group
Double - subject and confederate don’t know who is in which group
Placebo Reduces confounding variable Reduces demand characteristics (subject
bias)

Analyzing Results:Statistical Analysis
Statistics Defined A branch of mathematics used to organize and
analyze data Necessary to use statistics to understand what
results actually MEAN – if they mean anything at all…
Be skeptical of sweeping generalizations E.g. “Males are better at math and science than
females” How was this measured?

Statistical Analysis: Scales of Measurement Nominal Scale
Set of categories for classifying E.g. types of cars in the student lot
Ordinal Scale Scale that indicates relative position; ranks data E.g. class rank
Interval Scale Scale with equal distance between values, but without a
true zero E.g. temperature
Ratio Scale Scale with equal distance between values, but WITH a true
zero E.g. Inches of rain
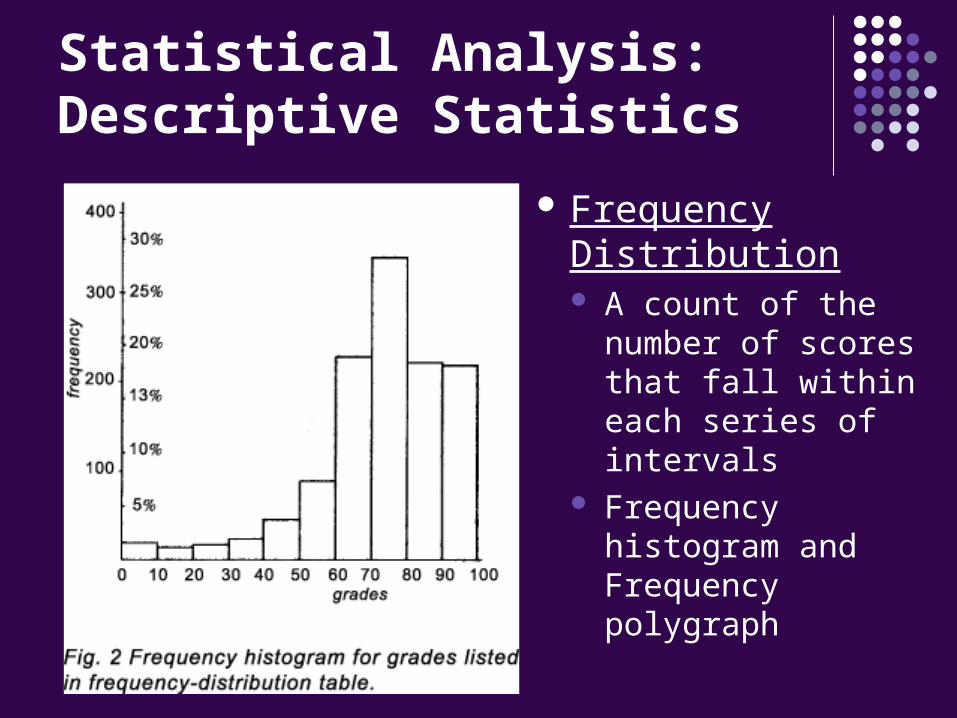
Statistical Analysis:Descriptive Statistics
Frequency Distribution A count of the
number of scores that fall within each series of intervals
Frequency histogram and Frequency polygraph
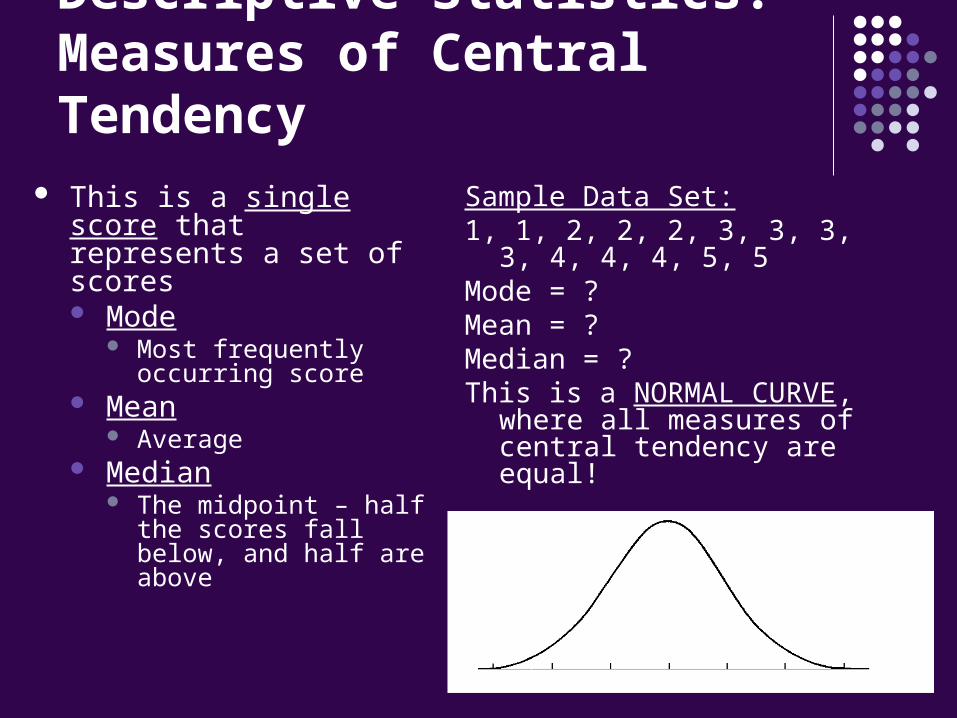
Descriptive Statistics:Measures of Central Tendency
This is a single score that represents a set of scores Mode
Most frequently occurring score
Mean Average
Median The midpoint – half the
scores fall below, and half are above
Sample Data Set:1, 1, 2, 2, 2, 3, 3, 3, 3, 4, 4, 4, 5,
5Mode = ?Mean = ?Median = ?This is a NORMAL CURVE,
where all measures of central tendency are equal!

Descriptive Statistics:The Skewed Distribution Frequency distribution is asymmetrical Mean, median and mode are different values
Negative (left) – just a few very low scores Positive (right) – just a few very high scores How can a few atypical scores distort data?

Descriptive Statistics:The Bimodal Distribution
As the name implies, a bimodal distribution has TWO modes

Descriptive Statistics:Measures of Variation Range – the difference between the highest and lowest score
in a distribution What does it tell you? What DOESN’T it tell you?
Standard Deviation – how much do scores vary from the mean in a distribution? (see table 1.4 in packet p. 36)
1. Calculate mean2. Subtract each score from the mean3. Square that difference4. Add the sum of the squares5. Divide by the number of scores in the distribution6. Take square root of this7. The number is equal to the value of ONE standard deviation

Descriptive Statistics:Measures of Variation So what?
In a normal curve, this number reveals the percentage of scores that falls within a particular range
68% fall within one standard deviation from the mean 95% fall within two standard deviations from the mean 99% fall within three standard deviations from the mean
What must the standard deviation be for this distribution of IQ scores?
Inferential Statistics:Statistical Significance
Significant Difference What is the difference between the experiences of the
control and the experimental groups? What is the chance that the difference happened due to
chance? .05 value generally accepted (1 in 20 due to chance) If it IS a significant difference, how important is that
difference (e.g. difference between IQ scores of first- and later-born children is significant, but due to its very small value, it is not important.
WITHIN vs. BETWEEN group variation?
Inferential Statistics:Reliability
When can we generalize about a population based on the results from our sample? Sample is a representative sample The less variation in the data, the more reliable (if
variability is high in a distribution, the mean becomes less meaningful)
The more examples the better! (ask 2 friends how they like the class vs. asking 25)

Research and Ethics Setting Standards
APA (American Psychological Association) PsyETA (Psychologists for the Ethical Treatment of
Animals) Human Subjects Review Board/Ethics Committee
Must Haves: Informed Consent Confidentiality Justified use of deception Protection from harm/discomfort Debriefing
How did Milgram, Landis, Watson, and Zimbardo challenge ethical standards?