Unit 1 connects to Agile Mind Topics 1 – 4 - Wikispaceshoustonmath.wikispaces.com/file/view/Agile...
28
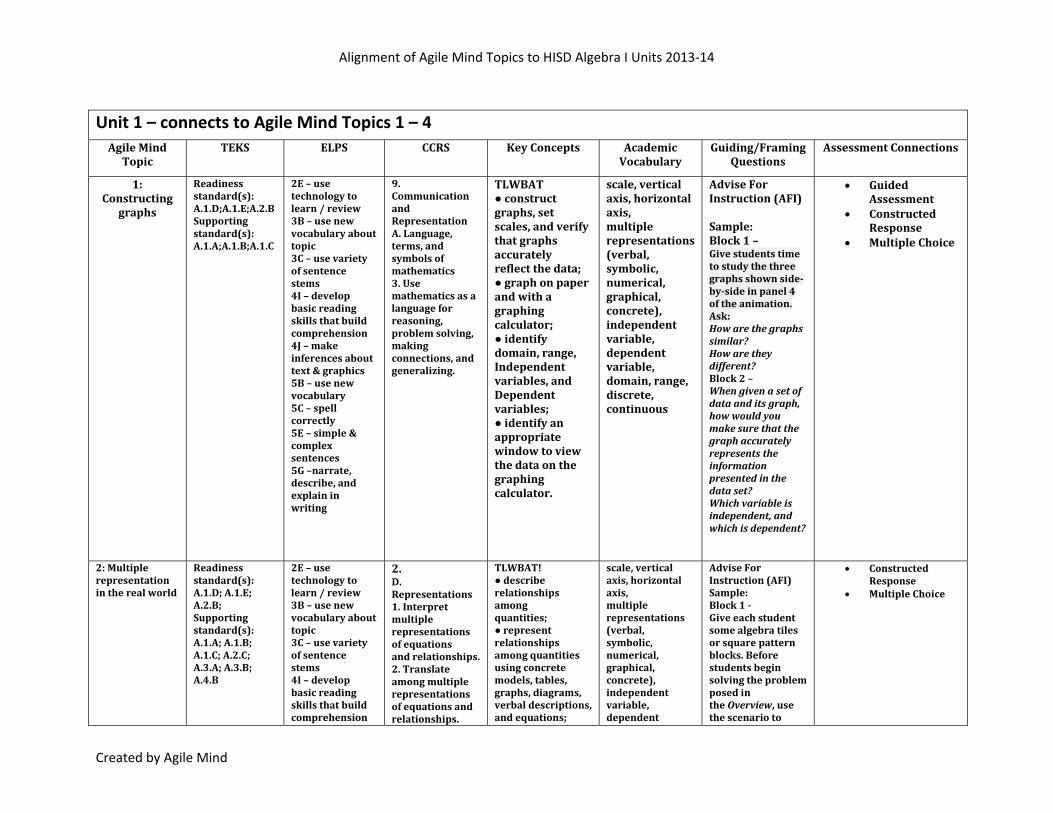
Alignment of Agile Mind Topics to HISD Algebra I Units 2013‐14 Created by Agile Mind Unit 1 – connects to Agile Mind Topics 1 – 4 Agile Mind Topic TEKS ELPS CCRS Key Concepts Academic Vocabulary Guiding/Framing Questions Assessment Connections 1: Constructing graphs Readiness standard(s): A.1.D;A.1.E;A.2.B Supporting standard(s): A.1.A;A.1.B;A.1.C 2E – use technology to learn / review 3B – use new vocabulary about topic 3C – use variety of sentence stems 4I – develop basic reading skills that build comprehension 4J – make inferences about text & graphics 5B – use new vocabulary 5C – spell correctly 5E – simple & complex sentences 5G –narrate, describe, and explain in writing 9. Communication and Representation A. Language, terms, and symbols of mathematics 3. Use mathematics as a language for reasoning, problem solving, making connections, and generalizing. TLWBAT ● construct graphs, set scales, and verify that graphs accurately reflect the data; ● graph on paper and with a graphing calculator; ● identify domain, range, Independent variables, and Dependent variables; ● identify an appropriate window to view the data on the graphing calculator. scale, vertical axis, horizontal axis, multiple representations (verbal, symbolic, numerical, graphical, concrete), independent variable, dependent variable, domain, range, discrete, continuous Advise For Instruction (AFI) Sample: Block 1 – Give students time to study the three graphs shown side byside in panel 4 of the animation. Ask: How are the graphs similar? How are they different? Block 2 – When given a set of data and its graph, how would you make sure that the graph accurately represents the information presented in the data set? Which variable is independent, and which is dependent? Guided Assessment Constructed Response Multiple Choice 2: Multiple representation in the real world Readiness standard(s): A.1.D; A.1.E; A.2.B; Supporting standard(s): A.1.A; A.1.B; A.1.C; A.2.C; A.3.A; A.3.B; A.4.B 2E – use technology to learn / review 3B – use new vocabulary about topic 3C – use variety of sentence stems 4I – develop basic reading skills that build comprehension 2. D. Representations 1. Interpret multiple representations of equations and relationships. 2. Translate among multiple representations of equations and relationships. TLWBAT! ● describe relationships among quantities; ● represent relationships among quantities using concrete models, tables, graphs, diagrams, verbal descriptions, and equations; scale, vertical axis, horizontal axis, multiple representations (verbal, symbolic, numerical, graphical, concrete), independent variable, dependent Advise For Instruction (AFI) Sample: Block 1 Give each student some algebra tiles or square pattern blocks. Before students begin solving the problem posed in the Overview, use the scenario to Constructed Response Multiple Choice
Transcript of Unit 1 connects to Agile Mind Topics 1 – 4 - Wikispaceshoustonmath.wikispaces.com/file/view/Agile...
Alignment of Agile Mind Topics to HISD Algebra I Units 2013‐14
Created by Agile Mind
Unit 1 – connects to Agile Mind Topics 1 – 4Agile Mind Topic
TEKS ELPS CCRS Key Concepts Academic Vocabulary
Guiding/Framing Questions
Assessment Connections
1: Constructing
graphs
Readiness standard(s): A.1.D;A.1.E;A.2.B Supporting standard(s): A.1.A;A.1.B;A.1.C
2E – use technology to learn / review 3B – use new vocabulary about topic 3C – use variety of sentence stems 4I – develop basic reading skills that build comprehension 4J – make inferences about text & graphics 5B – use new vocabulary 5C – spell correctly 5E – simple & complex sentences 5G –narrate, describe, and explain in writing
9. Communication and Representation A. Language, terms, and symbols of mathematics 3. Use mathematics as a language for reasoning, problem solving, making connections, and generalizing.
TLWBAT ● construct graphs, set scales, and verify that graphs accurately reflect the data; ● graph on paper and with a graphing calculator; ● identify domain, range, Independent variables, and Dependent variables; ● identify an appropriate window to view the data on the graphing calculator.
scale, vertical axis, horizontal axis, multiple representations (verbal, symbolic, numerical, graphical, concrete), independent variable, dependent variable, domain, range, discrete, continuous
Advise For Instruction (AFI) Sample: Block 1 – Give students time to study the three graphs shown sidebyside in panel 4 of the animation. Ask: How are the graphs similar? How are they different? Block 2 – When given a set of data and its graph, how would you make sure that the graph accurately represents the information presented in the data set? Which variable is independent, and which is dependent?
Guided Assessment
Constructed Response
Multiple Choice
2: Multiple representation in the real world
Readiness standard(s): A.1.D; A.1.E; A.2.B; Supporting standard(s): A.1.A; A.1.B; A.1.C; A.2.C; A.3.A; A.3.B; A.4.B
2E – use technology to learn / review 3B – use new vocabulary about topic 3C – use variety of sentence stems 4I – develop basic reading skills that build comprehension
2. D. Representations 1. Interpret multiple representations of equations and relationships. 2. Translate among multiple representations of equations and relationships.
TLWBAT! ● describe relationships among quantities; ● represent relationships among quantities using concrete models, tables, graphs, diagrams, verbal descriptions, and equations;
scale, vertical axis, horizontal axis, multiple representations (verbal, symbolic, numerical, graphical, concrete), independent variable, dependent
Advise For Instruction (AFI) Sample: Block 1 Give each student some algebra tiles or square pattern blocks. Before students begin solving the problem posed in the Overview, use the scenario to
Constructed Response
Multiple Choice
Alignment of Agile Mind Topics to HISD Algebra I Units 2013‐14
Created by Agile Mind
4J – make inferences about text & graphics 5B – use new vocabulary 5C – spell correctly 5E – simple & complex sentences 5G –narrate, describe, and explain in writing
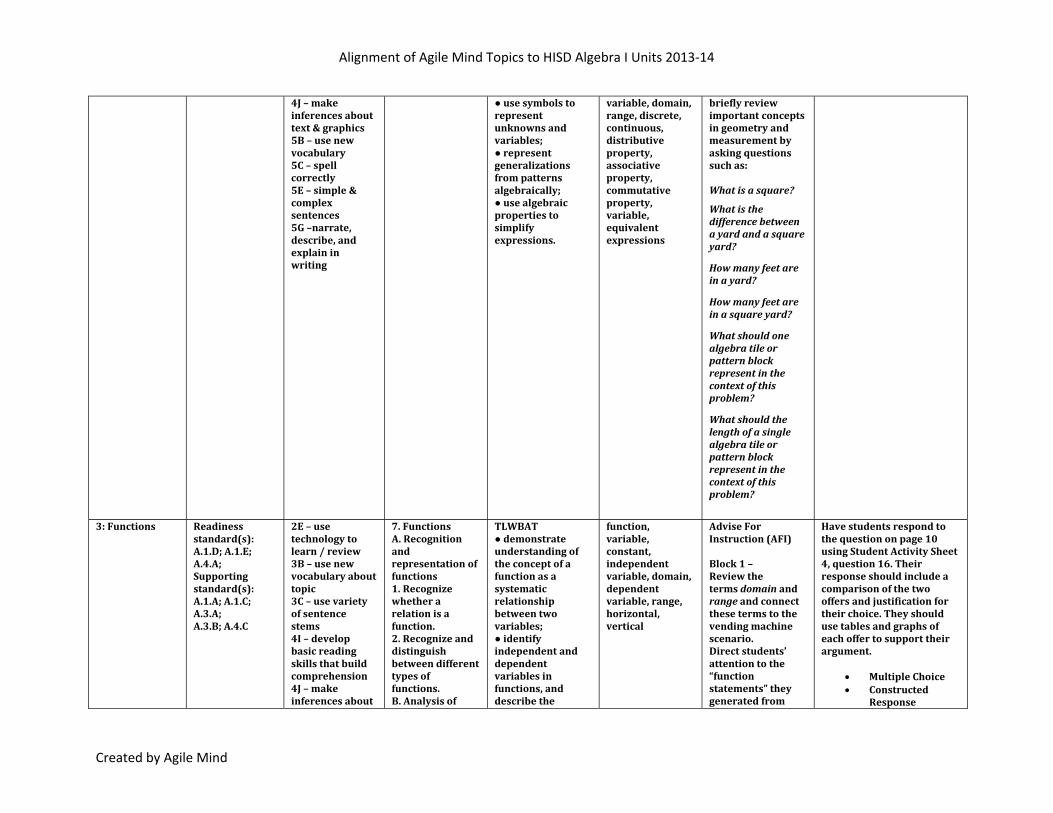
● use symbols to represent unknowns and variables; ● represent generalizations from patterns algebraically; ● use algebraic properties to simplify expressions.
variable, domain, range, discrete, continuous, distributive property, associative property, commutative property, variable, equivalent expressions
briefly review important concepts in geometry and measurement by asking questions such as:
What is a square?
What is the difference between a yard and a square yard?
How many feet are in a yard?
How many feet are in a square yard?
What should one algebra tile or pattern block represent in the context of this problem?
What should the length of a single algebra tile or pattern block represent in the context of this problem?
3: Functions Readiness
standard(s): A.1.D; A.1.E; A.4.A; Supporting standard(s): A.1.A; A.1.C; A.3.A; A.3.B; A.4.C
2E – use technology to learn / review 3B – use new vocabulary about topic 3C – use variety of sentence stems 4I – develop basic reading skills that build comprehension 4J – make inferences about
7. Functions A. Recognition and representation of functions 1. Recognize whether a relation is a function. 2. Recognize and distinguish between different types of functions. B. Analysis of
TLWBAT ● demonstrate understanding of the concept of a function as a systematic relationship between two variables; ● identify independent and dependent variables in functions, and describe the
function, variable, constant, independent variable, domain, dependent variable, range, horizontal, vertical
Advise For Instruction (AFI) Block 1 – Review the terms domain and range and connect these terms to the vending machine scenario. Direct students’ attention to the “function statements” they generated from
Have students respond to the question on page 10 using Student Activity Sheet 4, question 16. Their response should include a comparison of the two offers and justification for their choice. They should use tables and graphs of each offer to support their argument.
Multiple Choice Constructed
Response

Alignment of Agile Mind Topics to HISD Algebra I Units 2013‐14
Created by Agile Mind
text & graphics 5B – use new vocabulary 5C – spell correctly 5E – simple & complex sentences 5G –narrate, describe, and explain in writing
functions 1. Understand and analyze features of a function. C. Model real world situations with functions 2. Develop a function to model a situation.
domain and range of a function; ● represent functions using words, tables, symbols, and graphs; ● use function notation to represent functions and to determine specific values of either the domain or range.
page 4 of the Overview.
Conduct a class discussion of which functions more clearly or strongly represent dependent relationships. Ask the students to try to represent some of the relationships using function notation.
What is the independent variable?
What is the dependent variable?
How would you describe the domain of your function?
How would you describe your function's range?
4: Analyzing graphs
Readiness standard(s): A.1.D; A.1.E; Supporting standard(s): A.1.A; A.1.B; A.1.C; A.2.C
2E – use technology to learn / review 3B – use new vocabulary about topic 3C – use variety of sentence stems 4I – develop basic reading skills that build comprehension 4J – make inferences about text & graphics 5B – use new vocabulary 5C – spell
8. Problem Solving and Reasoning A. Mathematical problem solving 1. Analyze given information. 2. Formulate a plan or strategy. 3. Determine a solution. 4. Justify the solution. 5. Evaluate the problemsolving process. B. Logical reasoning 1. Develop and
TLWBAT ● interpret graphs; ● create verbal descriptions for given graphs; ● answer questions based on the information given in graphs; ● graph realworld data on paper And with a motion detector.
Ordered pairs, coordinates, xaxis, yaxis, scale, independent variable, rate, dependent variable, increasing, decreasing, elapsed time, time zero
After looking at specific details about the race, have the class think about what each runner's specific race was like. Divide the class in 3 sections and ask each section to create a table and write an interpretation of an assigned runner's race. Have each group present their description to the class and discuss. Compare and
MARS task: Graphs
Guided Assessment
Multiple Choice

Alignment of Agile Mind Topics to HISD Algebra I Units 2013‐14
Created by Agile Mind
correctly 5E – simple & complex sentences 5G –narrate, describe, and explain in writing
evaluate convincing arguments. 2. Use various types of reasoning. C. Real world problem solving 1. Formulate a solution to a real world situation based on the solution to a mathematical problem. 2. Use a function to model a real world situation. 3. Evaluate the problemsolving process.
contrast the three races. Ask: How are the details represented in the table? In the graph? Why are the labels on the axes of graphs important?
Unit 2 Part I – connects to Agile Mind Topics 10 Agile Mind Topic
TEKS ELPS CCRS Key Concepts Academic Vocabulary
Guiding/Framing Questions
Assessment Connections
10 Solving linear equations
Readiness standard(s): A.4.A; A.5.C;
A.7.B; Supporting standard(s): A.4.B; A.7.A;
A.7.C
C.1a – use prior knowledge and experience to understand meanings in English C.1g demonstrate an increasing ability to distinguish between formal and informal English and an increasing knowledge of when to use each one commensurate
2.C1 Recognize and use algebraic field properties, concepts, procedures, and algorithms to solve equations, inequalities, and systems of linear equations. • CCRS 2.D1 Interpret multiple representations of equations and relationships.
TLWBAT analyze
situations involving linear functions and formulate linear equations to solve problems;
investigate methods for solving linear equations using concrete models, graphs, and the properties of equality, select
table/tabular responses, solving analytically (algebraically), solving by hand, undoing, function, equation, graph, table, solve, substitute, replace, input, output, functional relationships
What kind of function would model this situation? How could you use the function to help you determine how many miles you drove? Have students: Write a function rule that models this situation. Write an equation that you could solve to find how many miles you drove if the total rental
• Guided Assessment • Constructed Response • Multiple Choice
Alignment of Agile Mind Topics to HISD Algebra I Units 2013‐14
Created by Agile Mind
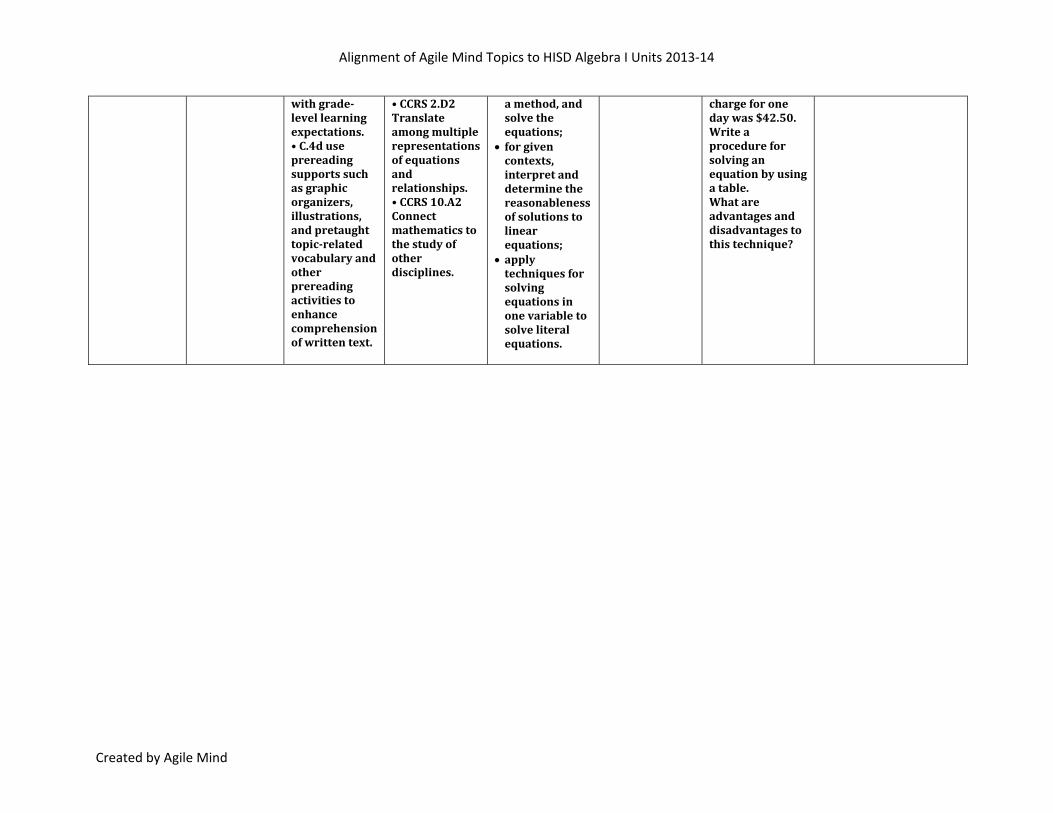
with gradelevel learning expectations. • C.4d use prereading supports such as graphic organizers, illustrations, and pretaught topicrelated vocabulary and other prereading activities to enhance comprehension of written text.
• CCRS 2.D2 Translate among multiple representations of equations and relationships. • CCRS 10.A2 Connect mathematics to the study of other disciplines.
a method, and solve the equations;
for given contexts, interpret and determine the reasonableness of solutions to linear equations;
apply techniques for solving equations in one variable to solve literal equations.
charge for one day was $42.50. Write a procedure for solving an equation by using a table. What are advantages and disadvantages to this technique?
Alignment of Agile Mind Topics to HISD Algebra I Units 2013‐14
Created by Agile Mind
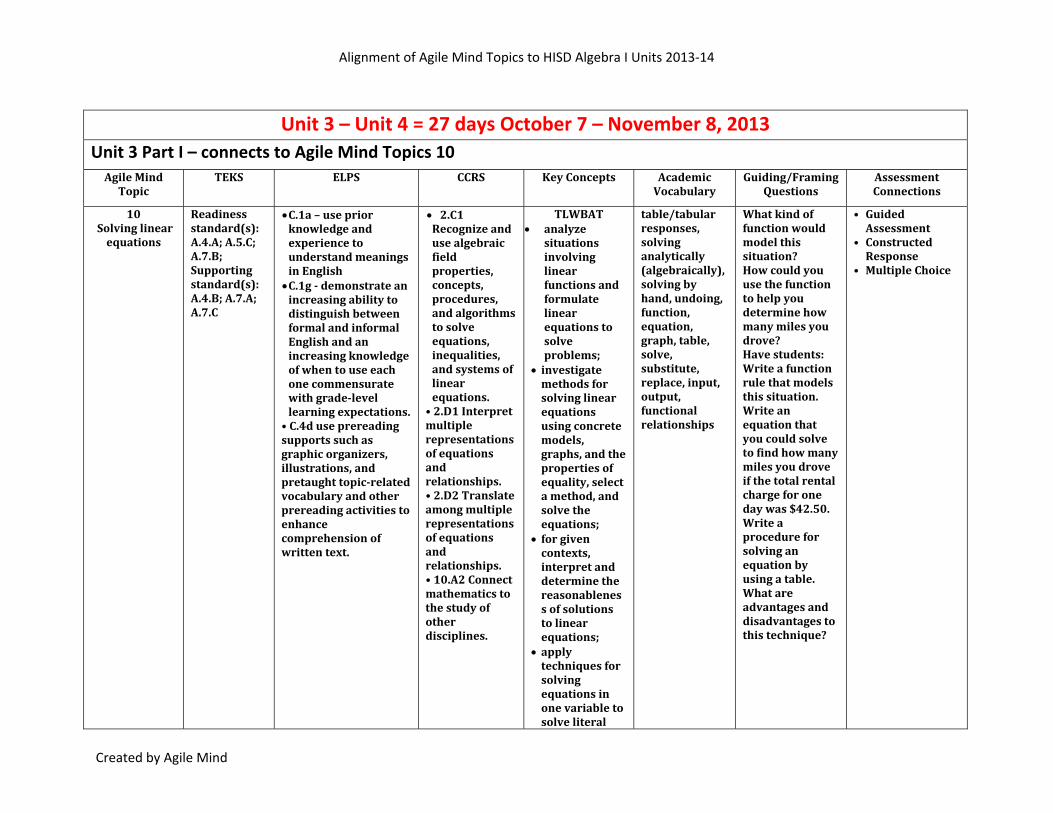
Unit 3 – Unit 4 = 27 days October 7 – November 8, 2013 Unit 3 Part I – connects to Agile Mind Topics 10Agile Mind Topic
TEKS ELPS CCRS Key Concepts Academic Vocabulary
Guiding/Framing Questions
Assessment Connections
10 Solving linear equations
Readiness standard(s): A.4.A; A.5.C; A.7.B; Supporting standard(s): A.4.B; A.7.A; A.7.C
C.1a – use prior knowledge and experience to understand meanings in English C.1g demonstrate an increasing ability to distinguish between formal and informal English and an increasing knowledge of when to use each one commensurate with gradelevel learning expectations. • C.4d use prereading supports such as graphic organizers, illustrations, and pretaught topicrelated vocabulary and other prereading activities to enhance comprehension of written text.
2.C1 Recognize and use algebraic field properties, concepts, procedures, and algorithms to solve equations, inequalities, and systems of linear equations. • 2.D1 Interpret multiple representations of equations and relationships. • 2.D2 Translate among multiple representations of equations and relationships. • 10.A2 Connect mathematics to the study of other disciplines.
TLWBAT analyze
situations involving linear functions and formulate linear equations to solve problems;
investigate methods for solving linear equations using concrete models, graphs, and the properties of equality, select a method, and solve the equations;
for given contexts, interpret and determine the reasonableness of solutions to linear equations;
apply techniques for solving equations in one variable to solve literal
table/tabular responses, solving analytically (algebraically), solving by hand, undoing, function, equation, graph, table, solve, substitute, replace, input, output, functional relationships
What kind of function would model this situation? How could you use the function to help you determine how many miles you drove? Have students: Write a function rule that models this situation. Write an equation that you could solve to find how many miles you drove if the total rental charge for one day was $42.50. Write a procedure for solving an equation by using a table. What are advantages and disadvantages to this technique?
• Guided Assessment
• Constructed Response
• Multiple Choice
Alignment of Agile Mind Topics to HISD Algebra I Units 2013‐14
Created by Agile Mind
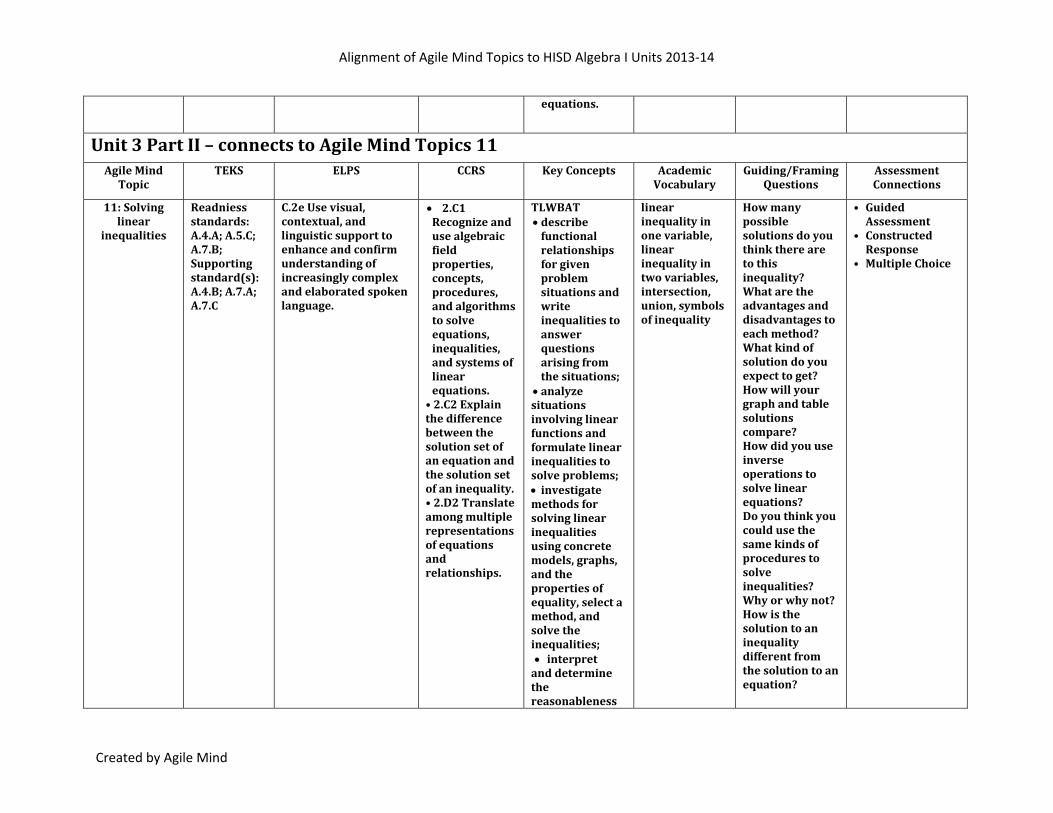
equations.
Unit 3 Part II – connects to Agile Mind Topics 11 Agile Mind Topic
TEKS ELPS CCRS Key Concepts Academic Vocabulary
Guiding/Framing Questions
Assessment Connections
11: Solving linear
inequalities
Readniess standards: A.4.A; A.5.C; A.7.B; Supporting standard(s): A.4.B; A.7.A; A.7.C
C.2e Use visual, contextual, and linguistic support to enhance and confirm understanding of increasingly complex and elaborated spoken language.
2.C1 Recognize and use algebraic field properties, concepts, procedures, and algorithms to solve equations, inequalities, and systems of linear equations. • 2.C2 Explain the difference between the solution set of an equation and the solution set of an inequality. • 2.D2 Translate among multiple representations of equations and relationships.
TLWBAT describe functional relationships for given problem situations and write inequalities to answer questions arising from the situations;
analyze situations involving linear functions and formulate linear inequalities to solve problems; investigate methods for solving linear inequalities using concrete models, graphs, and the properties of equality, select a method, and solve the inequalities; interpret and determine the reasonableness
linear inequality in one variable, linear inequality in two variables, intersection, union, symbols of inequality
How many possible solutions do you think there are to this inequality? What are the advantages and disadvantages to each method? What kind of solution do you expect to get? How will your graph and table solutions compare? How did you use inverse operations to solve linear equations? Do you think you could use the same kinds of procedures to solve inequalities? Why or why not? How is the solution to an inequality different from the solution to an equation?
• Guided Assessment
• Constructed Response
• Multiple Choice
Alignment of Agile Mind Topics to HISD Algebra I Units 2013‐14
Created by Agile Mind
of solutions to linear inequalities for given contexts; graph linear inequalities on a number line and in the plane.
Unit 4 – connects to Agile Mind Topics 11 Agile Mind Topic
TEKS ELPS CCRS Key Concepts Academic Vocabulary
Guiding/Framing Questions
Assessment Connections
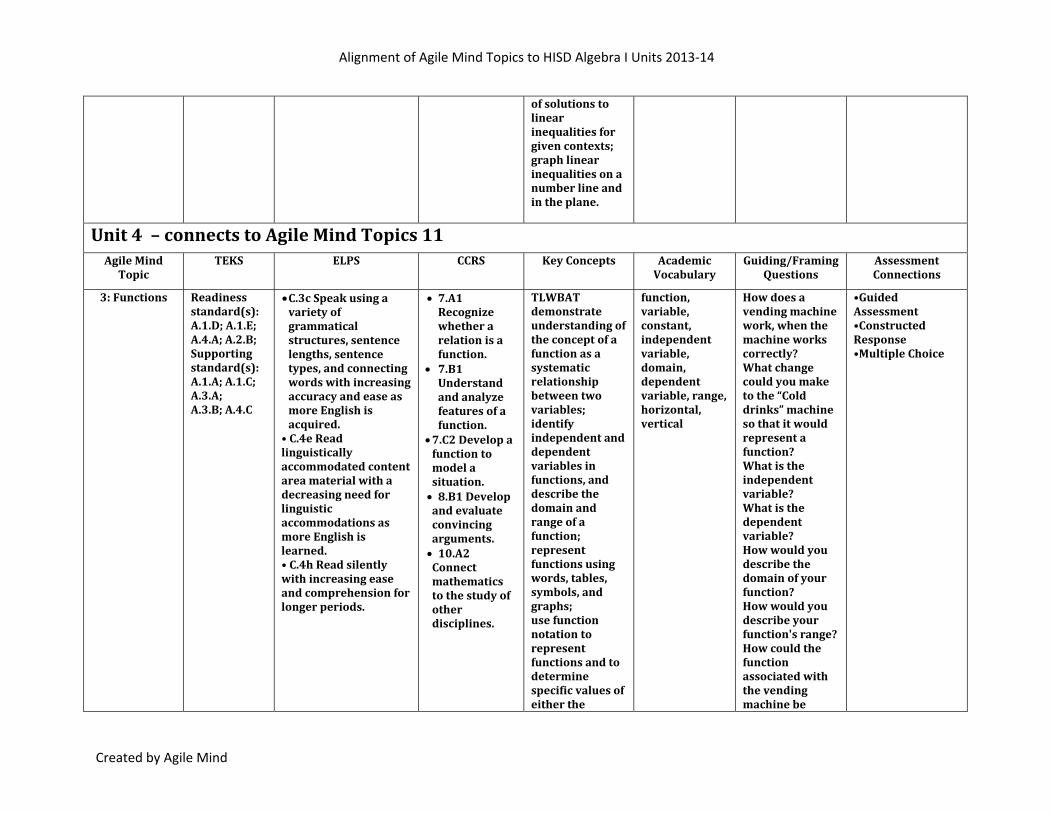
3: Functions Readiness standard(s): A.1.D; A.1.E; A.4.A; A.2.B; Supporting standard(s): A.1.A; A.1.C; A.3.A; A.3.B; A.4.C
C.3c Speak using a variety of grammatical structures, sentence lengths, sentence types, and connecting words with increasing accuracy and ease as more English is acquired. • C.4e Read linguistically accommodated content area material with a decreasing need for linguistic accommodations as more English is learned. • C.4h Read silently with increasing ease and comprehension for longer periods.
7.A1 Recognize whether a relation is a function.
7.B1 Understand and analyze features of a function.
7.C2 Develop a function to model a situation. 8.B1 Develop and evaluate convincing arguments. 10.A2 Connect mathematics to the study of other disciplines.
TLWBAT demonstrate understanding of the concept of a function as a systematic relationship between two variables; identify independent and dependent variables in functions, and describe the domain and range of a function; represent functions using words, tables, symbols, and graphs; use function notation to represent functions and to determine specific values of either the
function, variable, constant, independent variable, domain, dependent variable, range, horizontal, vertical
How does a vending machine work, when the machine works correctly? What change could you make to the “Cold drinks” machine so that it would represent a function? What is the independent variable? What is the dependent variable? How would you describe the domain of your function? How would you describe your function's range? How could the function associated with the vending machine be
•Guided Assessment •Constructed Response •Multiple Choice
Alignment of Agile Mind Topics to HISD Algebra I Units 2013‐14
Created by Agile Mind
domain or range.
written using "ifthen" statements or "causeandeffect" statements? How does one part of the function associated with the vending machine cause or depend on the other part?
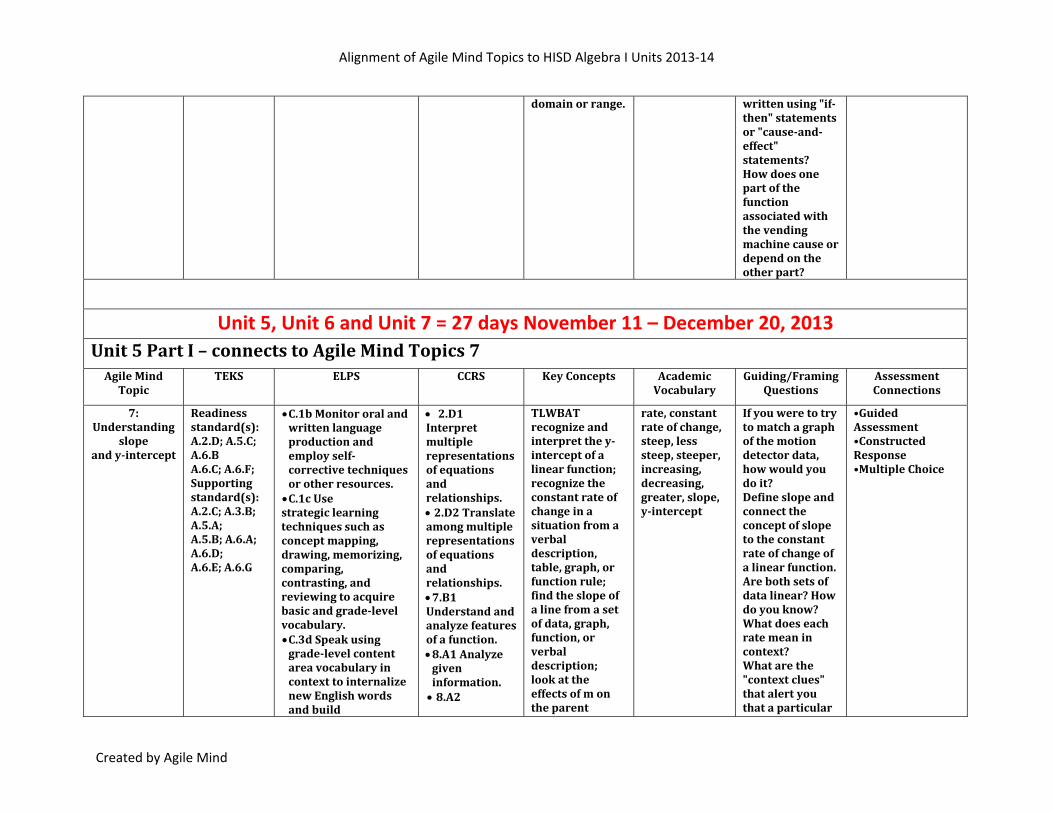
Unit 5, Unit 6 and Unit 7 = 27 days November 11 – December 20, 2013 Unit 5 Part I – connects to Agile Mind Topics 7 Agile Mind Topic
TEKS ELPS CCRS Key Concepts Academic Vocabulary
Guiding/Framing Questions
Assessment Connections
7: Understanding
slope and yintercept
Readiness standard(s): A.2.D; A.5.C; A.6.B A.6.C; A.6.F; Supporting standard(s): A.2.C; A.3.B; A.5.A; A.5.B; A.6.A; A.6.D; A.6.E; A.6.G
C.1b Monitor oral and written language production and employ selfcorrective techniques or other resources. C.1c Use strategic learning techniques such as concept mapping, drawing, memorizing, comparing, contrasting, and reviewing to acquire basic and gradelevel vocabulary. C.3d Speak using gradelevel content area vocabulary in context to internalize new English words and build
2.D1 Interpret multiple representations of equations and relationships. 2.D2 Translate among multiple representations of equations and relationships. 7.B1 Understand and analyze features of a function. 8.A1 Analyze given information. 8.A2
TLWBAT recognize and interpret the yintercept of a linear function; recognize the constant rate of change in a situation from a verbal description, table, graph, or function rule; find the slope of a line from a set of data, graph, function, or verbal description; look at the effects of m on the parent
rate, constant rate of change, steep, less steep, steeper, increasing, decreasing, greater, slope, yintercept
If you were to try to match a graph of the motion detector data, how would you do it? Define slope and connect the concept of slope to the constant rate of change of a linear function. Are both sets of data linear? How do you know? What does each rate mean in context? What are the "context clues" that alert you that a particular
•Guided Assessment •Constructed Response •Multiple Choice
Alignment of Agile Mind Topics to HISD Algebra I Units 2013‐14
Created by Agile Mind
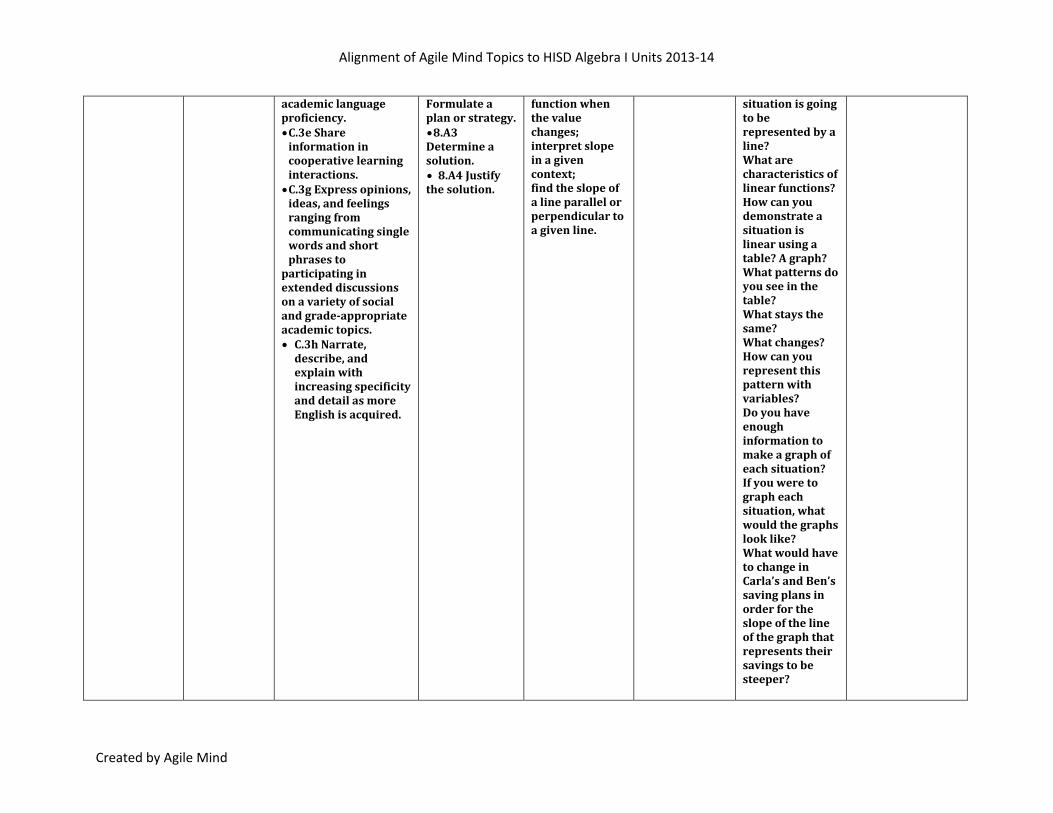
academic language proficiency. C.3e Share information in cooperative learning interactions. C.3g Express opinions, ideas, and feelings ranging from communicating single words and short phrases to participating in extended discussions on a variety of social and gradeappropriate academic topics. C.3h Narrate, describe, and explain with increasing specificity and detail as more English is acquired.
Formulate a plan or strategy. 8.A3 Determine a solution. 8.A4 Justify the solution.
function when the value changes; interpret slope in a given context; find the slope of a line parallel or perpendicular to a given line.
situation is going to be represented by a line? What are characteristics of linear functions? How can you demonstrate a situation is linear using a table? A graph? What patterns do you see in the table? What stays the same? What changes? How can you represent this pattern with variables? Do you have enough information to make a graph of each situation? If you were to graph each situation, what would the graphs look like? What would have to change in Carla’s and Ben’s saving plans in order for the slope of the line of the graph that represents their savings to be steeper?
Alignment of Agile Mind Topics to HISD Algebra I Units 2013‐14
Created by Agile Mind
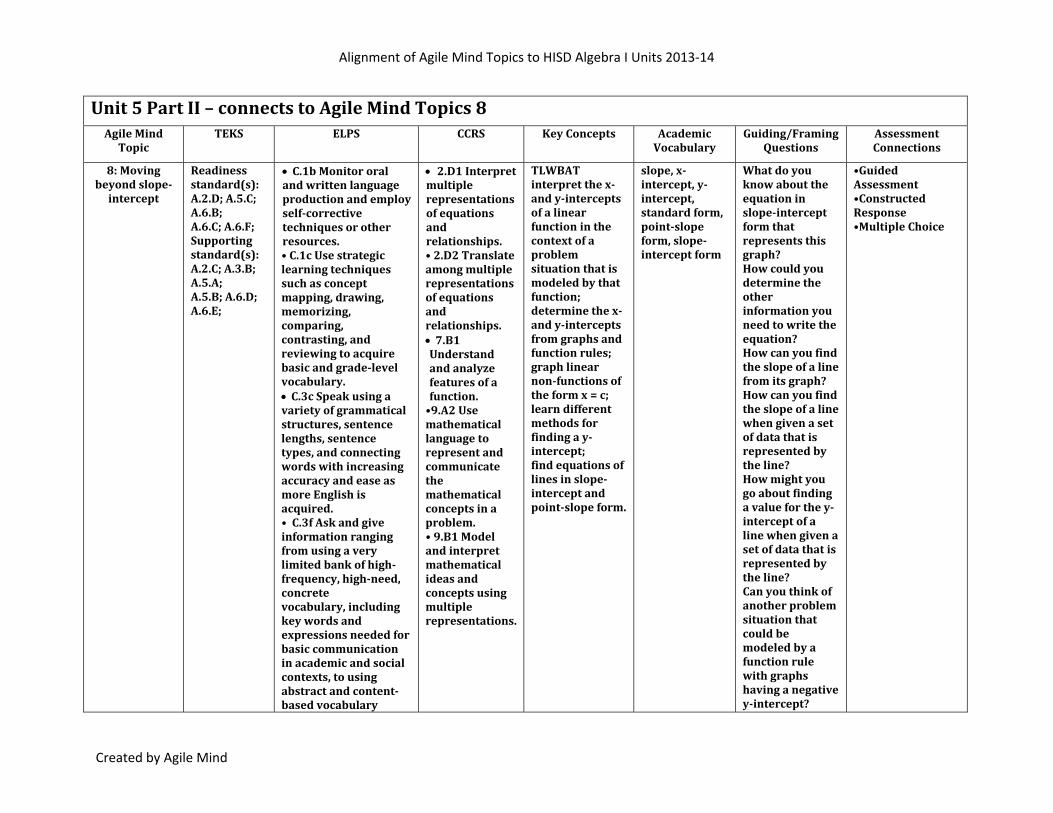
Unit 5 Part II – connects to Agile Mind Topics 8 Agile Mind Topic
TEKS ELPS CCRS Key Concepts Academic Vocabulary
Guiding/Framing Questions
Assessment Connections
8: Moving beyond slopeintercept
Readiness standard(s): A.2.D; A.5.C; A.6.B; A.6.C; A.6.F; Supporting standard(s): A.2.C; A.3.B; A.5.A; A.5.B; A.6.D; A.6.E;
C.1b Monitor oral and written language production and employ selfcorrective techniques or other resources. • C.1c Use strategic learning techniques such as concept mapping, drawing, memorizing, comparing, contrasting, and reviewing to acquire basic and gradelevel vocabulary. C.3c Speak using a variety of grammatical structures, sentence lengths, sentence types, and connecting words with increasing accuracy and ease as more English is acquired. • C.3f Ask and give information ranging from using a very limited bank of highfrequency, highneed, concrete vocabulary, including key words and expressions needed for basic communication in academic and social contexts, to using abstract and contentbased vocabulary
2.D1 Interpret multiple representations of equations and relationships. • 2.D2 Translate among multiple representations of equations and relationships. 7.B1 Understand and analyze features of a function. •9.A2 Use mathematical language to represent and communicate the mathematical concepts in a problem. • 9.B1 Model and interpret mathematical ideas and concepts using multiple representations.
TLWBAT interpret the x and yintercepts of a linear function in the context of a problem situation that is modeled by that function; determine the x and yintercepts from graphs and function rules; graph linear nonfunctions of the form x = c; learn different methods for finding a yintercept; find equations of lines in slopeintercept and pointslope form.
slope, xintercept, yintercept, standard form, pointslope form, slopeintercept form
What do you know about the equation in slopeintercept form that represents this graph? How could you determine the other information you need to write the equation? How can you find the slope of a line from its graph? How can you find the slope of a line when given a set of data that is represented by the line? How might you go about finding a value for the yintercept of a line when given a set of data that is represented by the line? Can you think of another problem situation that could be modeled by a function rule with graphs having a negative yintercept?
•Guided Assessment •Constructed Response •Multiple Choice
Alignment of Agile Mind Topics to HISD Algebra I Units 2013‐14
Created by Agile Mind
during extended speaking assignments.
Can you think of a problem situation that could be modeled by a function rule with a graph having a negative xintercept?
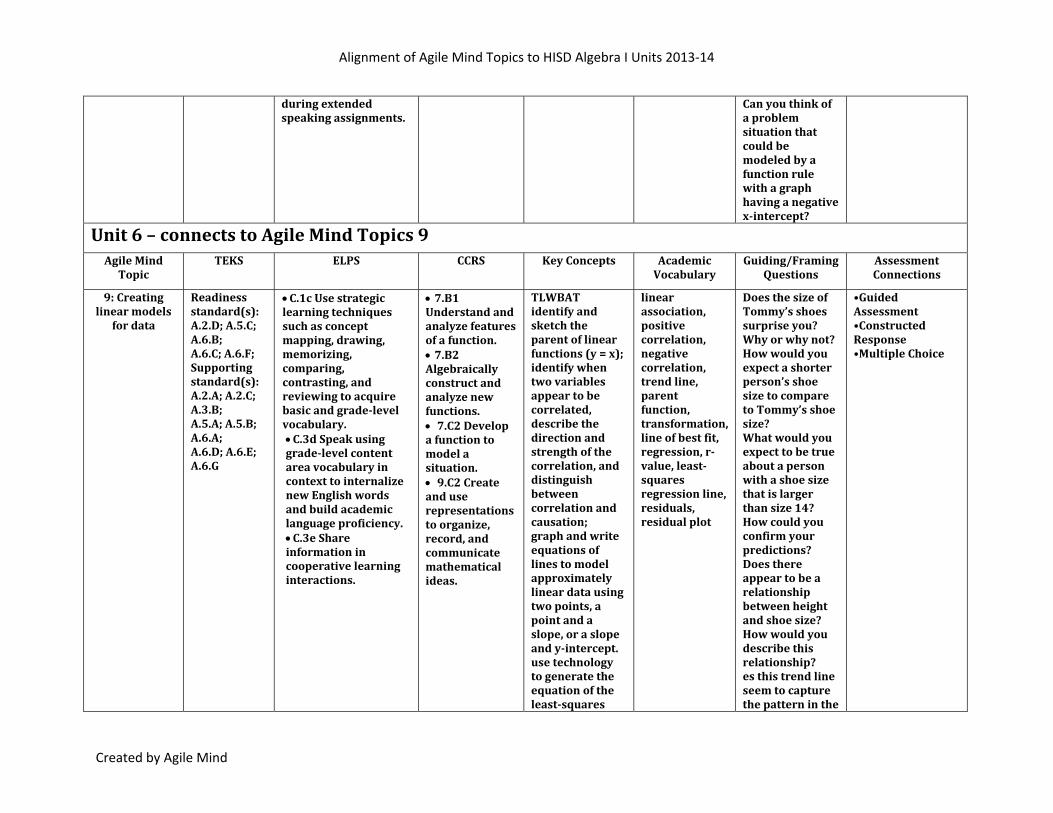
Unit 6 – connects to Agile Mind Topics 9 Agile Mind Topic
TEKS ELPS CCRS Key Concepts Academic Vocabulary
Guiding/Framing Questions
Assessment Connections
9: Creating linear models
for data
Readiness standard(s): A.2.D; A.5.C; A.6.B; A.6.C; A.6.F; Supporting standard(s): A.2.A; A.2.C; A.3.B; A.5.A; A.5.B; A.6.A; A.6.D; A.6.E; A.6.G
C.1c Use strategic learning techniques such as concept mapping, drawing, memorizing, comparing, contrasting, and reviewing to acquire basic and gradelevel vocabulary. C.3d Speak using gradelevel content area vocabulary in context to internalize new English words and build academic language proficiency. C.3e Share information in cooperative learning interactions.
7.B1 Understand and analyze features of a function. 7.B2 Algebraically construct and analyze new functions. 7.C2 Develop a function to model a situation. 9.C2 Create and use representations to organize, record, and communicate mathematical ideas.
TLWBAT identify and sketch the parent of linear functions (y = x); identify when two variables appear to be correlated, describe the direction and strength of the correlation, and distinguish between correlation and causation; graph and write equations of lines to model approximately linear data using two points, a point and a slope, or a slope and yintercept. use technology to generate the equation of the leastsquares
linear association, positive correlation, negative correlation, trend line, parent function, transformation, line of best fit, regression, rvalue, leastsquares regression line, residuals, residual plot
Does the size of Tommy’s shoes surprise you? Why or why not? How would you expect a shorter person’s shoe size to compare to Tommy’s shoe size? What would you expect to be true about a person with a shoe size that is larger than size 14? How could you confirm your predictions? Does there appear to be a relationship between height and shoe size? How would you describe this relationship? es this trend line seem to capture the pattern in the
•Guided Assessment •Constructed Response •Multiple Choice
Alignment of Agile Mind Topics to HISD Algebra I Units 2013‐14
Created by Agile Mind
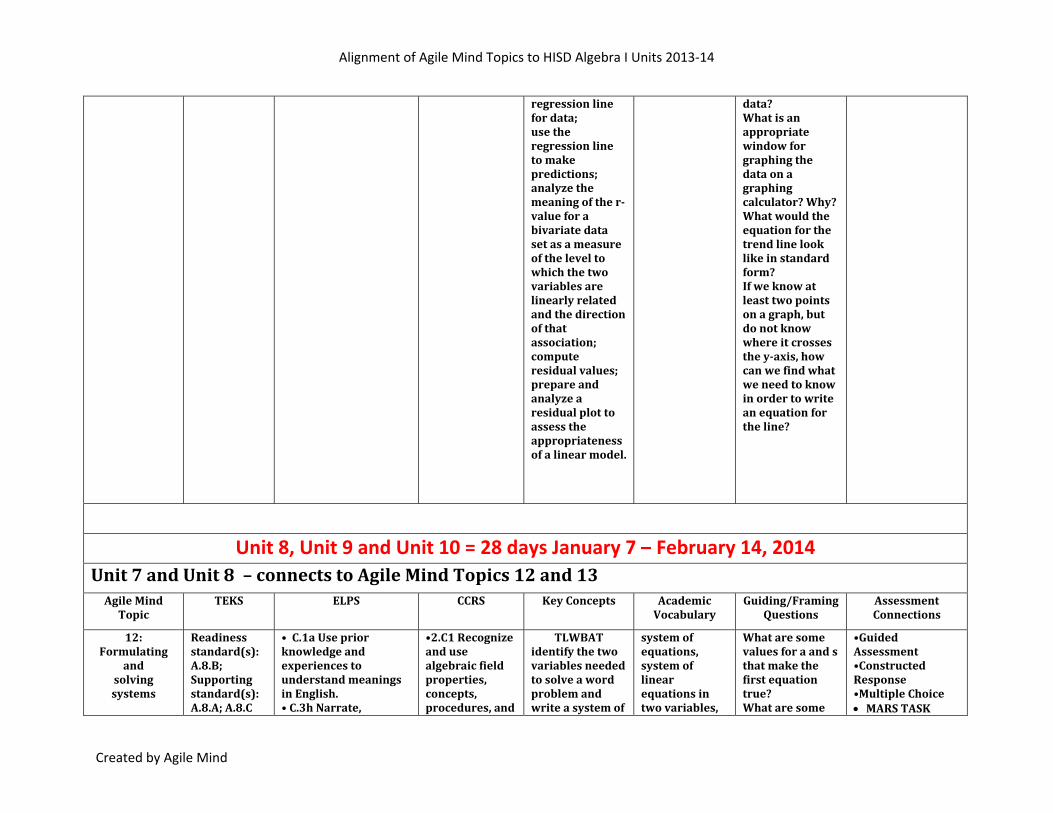
regression line for data; use the regression line to make predictions; analyze the meaning of the rvalue for a bivariate data set as a measure of the level to which the two variables are linearly related and the direction of that association; compute residual values; prepare and analyze a residual plot to assess the appropriateness of a linear model.
data? What is an appropriate window for graphing the data on a graphing calculator? Why? What would the equation for the trend line look like in standard form? If we know at least two points on a graph, but do not know where it crosses the yaxis, how can we find what we need to know in order to write an equation for the line?
Unit 8, Unit 9 and Unit 10 = 28 days January 7 – February 14, 2014 Unit 7 and Unit 8 – connects to Agile Mind Topics 12 and 13 Agile Mind Topic
TEKS ELPS CCRS Key Concepts Academic Vocabulary
Guiding/Framing Questions
Assessment Connections
12: Formulating
and solving systems
Readiness standard(s): A.8.B; Supporting standard(s): A.8.A; A.8.C
• C.1a Use prior knowledge and experiences to understand meanings in English. • C.3h Narrate,
•2.C1 Recognize and use algebraic field properties, concepts, procedures, and
TLWBAT identify the two variables needed to solve a word problem and write a system of
system of equations, system of linear equations in two variables,
What are some values for a and s that make the first equation true? What are some
•Guided Assessment •Constructed Response •Multiple Choice MARS TASK
Alignment of Agile Mind Topics to HISD Algebra I Units 2013‐14
Created by Agile Mind
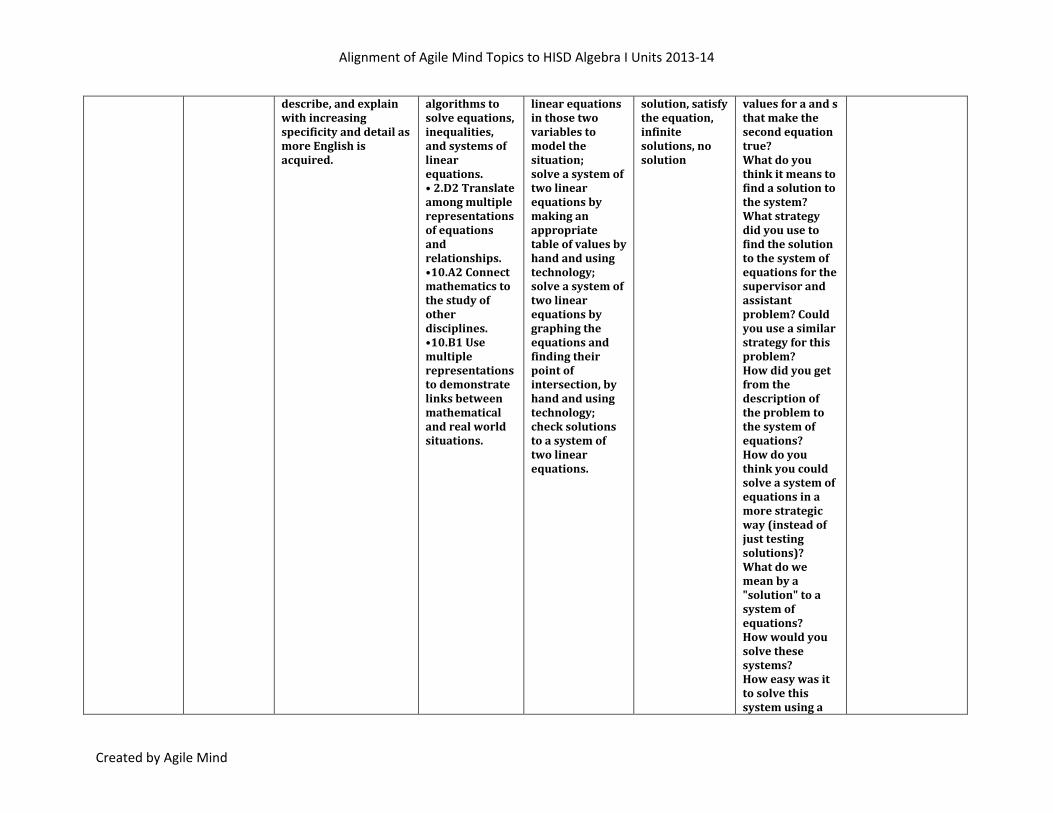
describe, and explain with increasing specificity and detail as more English is acquired.
algorithms to solve equations, inequalities, and systems of linear equations. • 2.D2 Translate among multiple representations of equations and relationships. •10.A2 Connect mathematics to the study of other disciplines. •10.B1 Use multiple representations to demonstrate links between mathematical and real world situations.
linear equations in those two variables to model the situation; solve a system of two linear equations by making an appropriate table of values by hand and using technology; solve a system of two linear equations by graphing the equations and finding their point of intersection, by hand and using technology; check solutions to a system of two linear equations.
solution, satisfy the equation, infinite solutions, no solution
values for a and s that make the second equation true? What do you think it means to find a solution to the system? What strategy did you use to find the solution to the system of equations for the supervisor and assistant problem? Could you use a similar strategy for this problem? How did you get from the description of the problem to the system of equations? How do you think you could solve a system of equations in a more strategic way (instead of just testing solutions)? What do we mean by a "solution" to a system of equations? How would you solve these systems? How easy was it to solve this system using a
Alignment of Agile Mind Topics to HISD Algebra I Units 2013‐14
Created by Agile Mind
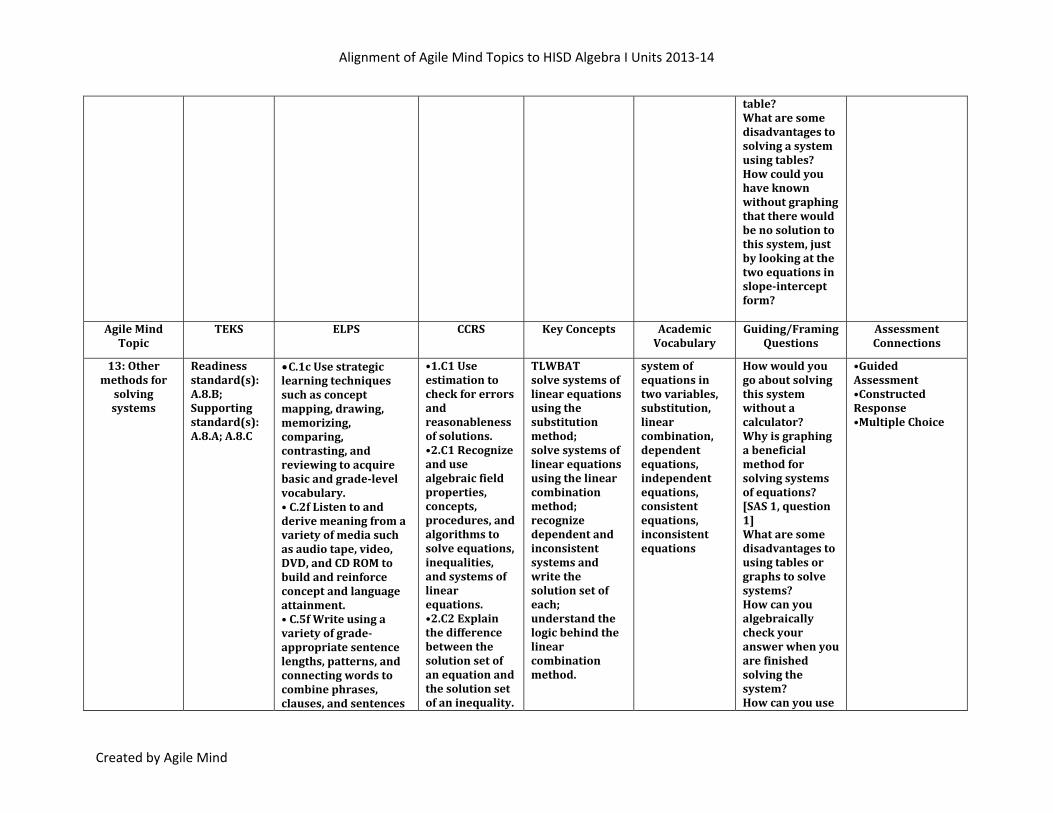
table? What are some disadvantages to solving a system using tables? How could you have known without graphing that there would be no solution to this system, just by looking at the two equations in slopeintercept form?
Agile Mind Topic
TEKS ELPS CCRS Key Concepts Academic Vocabulary
Guiding/Framing Questions
Assessment Connections
13: Other methods for solving systems
Readiness standard(s): A.8.B; Supporting standard(s): A.8.A; A.8.C
C.1c Use strategic learning techniques such as concept mapping, drawing, memorizing, comparing, contrasting, and reviewing to acquire basic and gradelevel vocabulary. • C.2f Listen to and derive meaning from a variety of media such as audio tape, video, DVD, and CD ROM to build and reinforce concept and language attainment. • C.5f Write using a variety of gradeappropriate sentence lengths, patterns, and connecting words to combine phrases, clauses, and sentences
•1.C1 Use estimation to check for errors and reasonableness of solutions. •2.C1 Recognize and use algebraic field properties, concepts, procedures, and algorithms to solve equations, inequalities, and systems of linear equations. •2.C2 Explain the difference between the solution set of an equation and the solution set of an inequality.
TLWBAT solve systems of linear equations using the substitution method; solve systems of linear equations using the linear combination method; recognize dependent and inconsistent systems and write the solution set of each; understand the logic behind the linear combination method.
system of equations in two variables, substitution, linear combination, dependent equations, independent equations, consistent equations, inconsistent equations
How would you go about solving this system without a calculator? Why is graphing a beneficial method for solving systems of equations? [SAS 1, question 1] What are some disadvantages to using tables or graphs to solve systems? How can you algebraically check your answer when you are finished solving the system? How can you use
•Guided Assessment •Constructed Response •Multiple Choice

Alignment of Agile Mind Topics to HISD Algebra I Units 2013‐14
Created by Agile Mind
in increasingly accurate ways as more English is acquired. • C.5g Narrate, describe, and explain with increasing specificity and detail to fulfill content area writing needs as more English is acquired.
•10.B1 Use multiple representations to demonstrate links between mathematical and realworld situations.
graphs or tables to check your answer when you find the solution algebraically? Which of these systems might be good candidates for solving by substitution, and why? What will happen to the yterms when you simplify this new equation? What is the only variable that is left in the simplified form of this new equation? Suppose you wanted to use linear combination to eliminate the xterms. What could you do to both equations that might do this? In choosing numbers to multiply by when solving a system by linear combination, is it easier to get two coefficients the same, or opposites of each other? Why?

Alignment of Agile Mind Topics to HISD Algebra I Units 2013‐14
Created by Agile Mind
Unit 9 – connects to Agile Mind Topic 16 Agile Mind Topic
TEKS ELPS CCRS Key Concepts Academic Vocabulary
Guiding/Framing Questions
Assessment Connections
16: Operations on
polynomials
Readiness standard(s): A.4.A; Supporting standard(s): A.4.B
•C.1a Use prior knowledge and experiences to understand meanings in English. •C.5b Write using newly acquired basic vocabulary and contentbased gradelevel vocabulary.
•1.B1 Perform computations with real and complex numbers. •2.B1 Recognize and use algebraic field properties, concepts, procedures, and algorithms to combine, transform, and evaluate expressions (e.g., polynomials, radicals, rational expressions).
TLWBAT classify polynomials by type and degree; multiply monomials, binomials, and trinomials using a variety of methods, including (but not limited to) algebra tiles and the distributive property; add and subtract polynomials, simplifying using a variety of methods, including (but not limited to) algebra tiles and algebraically combining like terms; factor monomials, binomials, and trinomials using a variety of methods, including (but not limited to) algebra tiles and algebraic
monomial, terms of a polynomial, binomial, trinomial, polynomial, degree of a polynomial, distributive property of multiplication over addition, like terms, perfect square trinomial, difference of two squares, rational expression, factoring a polynomial
What is the degree of a monomial that consists of only a real number? Why? Where do you see each "mini" product in the tile model? In the box method? How does the strategy that uses the distributive property connect to the tile model and the box method? How are the xtiles in the tile model and the xterm in the trinomial related? What are some things to watch for during the solution process to prevent errors?
•Guided Assessment •Constructed Response •Multiple Choice
Alignment of Agile Mind Topics to HISD Algebra I Units 2013‐14
Created by Agile Mind
manipulation; simplify simple rational expressions; add, subtract, multiply, and divide rational expressions.
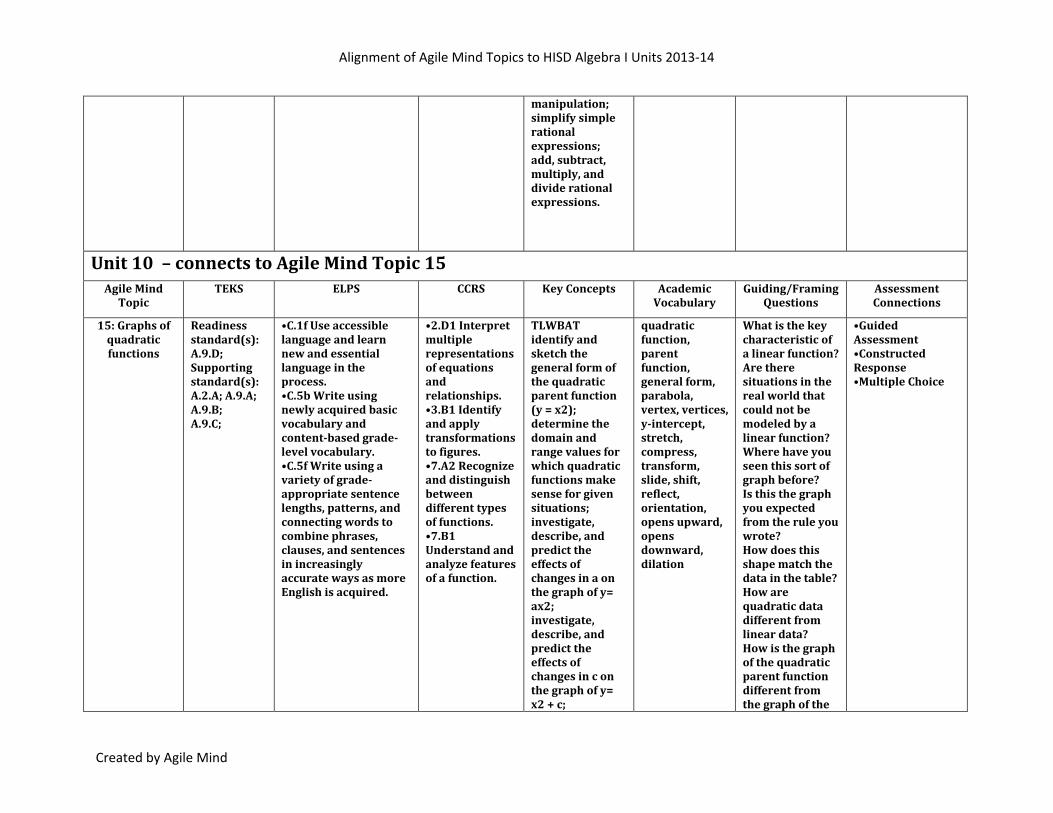
Unit 10 – connects to Agile Mind Topic 15 Agile Mind Topic
TEKS ELPS CCRS Key Concepts Academic Vocabulary
Guiding/Framing Questions
Assessment Connections
15: Graphs of quadratic functions
Readiness standard(s): A.9.D; Supporting standard(s): A.2.A; A.9.A; A.9.B; A.9.C;
•C.1f Use accessible language and learn new and essential language in the process. •C.5b Write using newly acquired basic vocabulary and contentbased gradelevel vocabulary. •C.5f Write using a variety of gradeappropriate sentence lengths, patterns, and connecting words to combine phrases, clauses, and sentences in increasingly accurate ways as more English is acquired.
•2.D1 Interpret multiple representations of equations and relationships. •3.B1 Identify and apply transformations to figures. •7.A2 Recognize and distinguish between different types of functions. •7.B1 Understand and analyze features of a function.
TLWBAT identify and sketch the general form of the quadratic parent function (y = x2); determine the domain and range values for which quadratic functions make sense for given situations; investigate, describe, and predict the effects of changes in a on the graph of y= ax2; investigate, describe, and predict the effects of changes in c on the graph of y= x2 + c;
quadratic function, parent function, general form, parabola, vertex, vertices, yintercept, stretch, compress, transform, slide, shift, reflect, orientation, opens upward, opens downward, dilation
What is the key characteristic of a linear function? Are there situations in the real world that could not be modeled by a linear function? Where have you seen this sort of graph before? Is this the graph you expected from the rule you wrote? How does this shape match the data in the table? How are quadratic data different from linear data? How is the graph of the quadratic parent function different from the graph of the
•Guided Assessment •Constructed Response •Multiple Choice
Alignment of Agile Mind Topics to HISD Algebra I Units 2013‐14
Created by Agile Mind
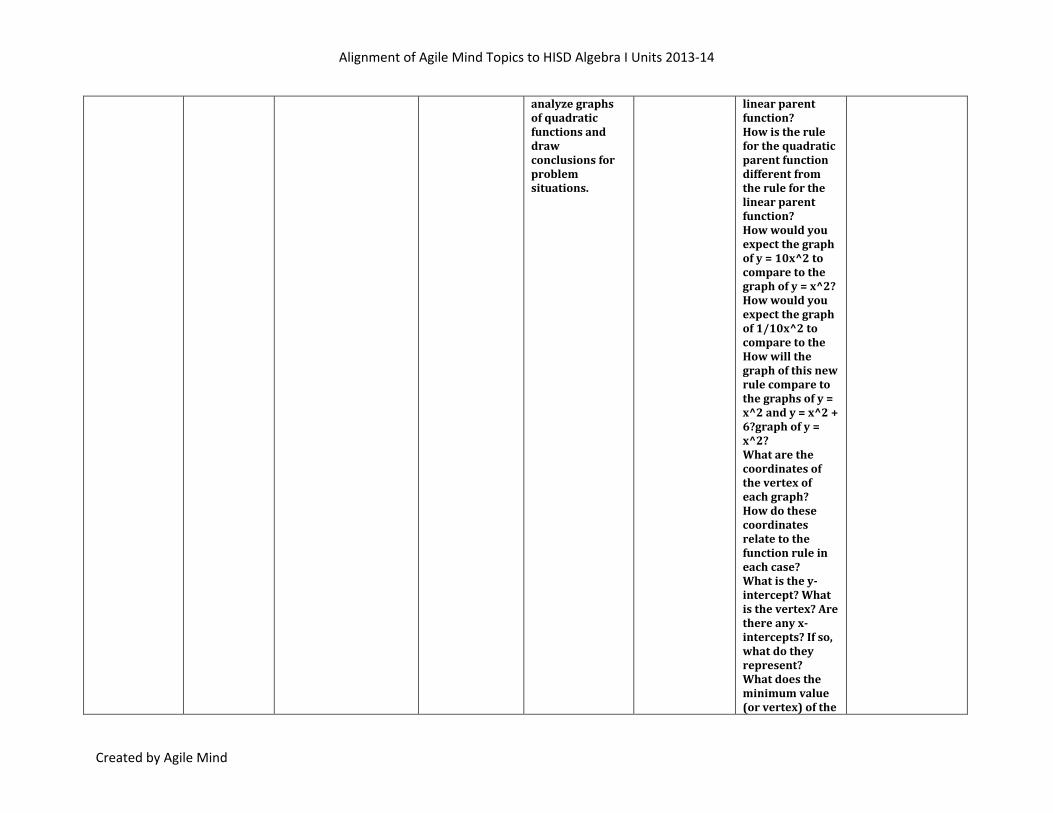
analyze graphs of quadratic functions and draw conclusions for problem situations.
linear parent function? How is the rule for the quadratic parent function different from the rule for the linear parent function? How would you expect the graph of y = 10x^2 to compare to the graph of y = x^2? How would you expect the graph of 1/10x^2 to compare to the How will the graph of this new rule compare to the graphs of y = x^2 and y = x^2 + 6?graph of y = x^2? What are the coordinates of the vertex of each graph? How do these coordinates relate to the function rule in each case? What is the yintercept? What is the vertex? Are there any xintercepts? If so, what do they represent? What does the minimum value (or vertex) of the
Alignment of Agile Mind Topics to HISD Algebra I Units 2013‐14
Created by Agile Mind
function represent in this situation? What is the domain and range for each of these problem situations? For each of these function rules?
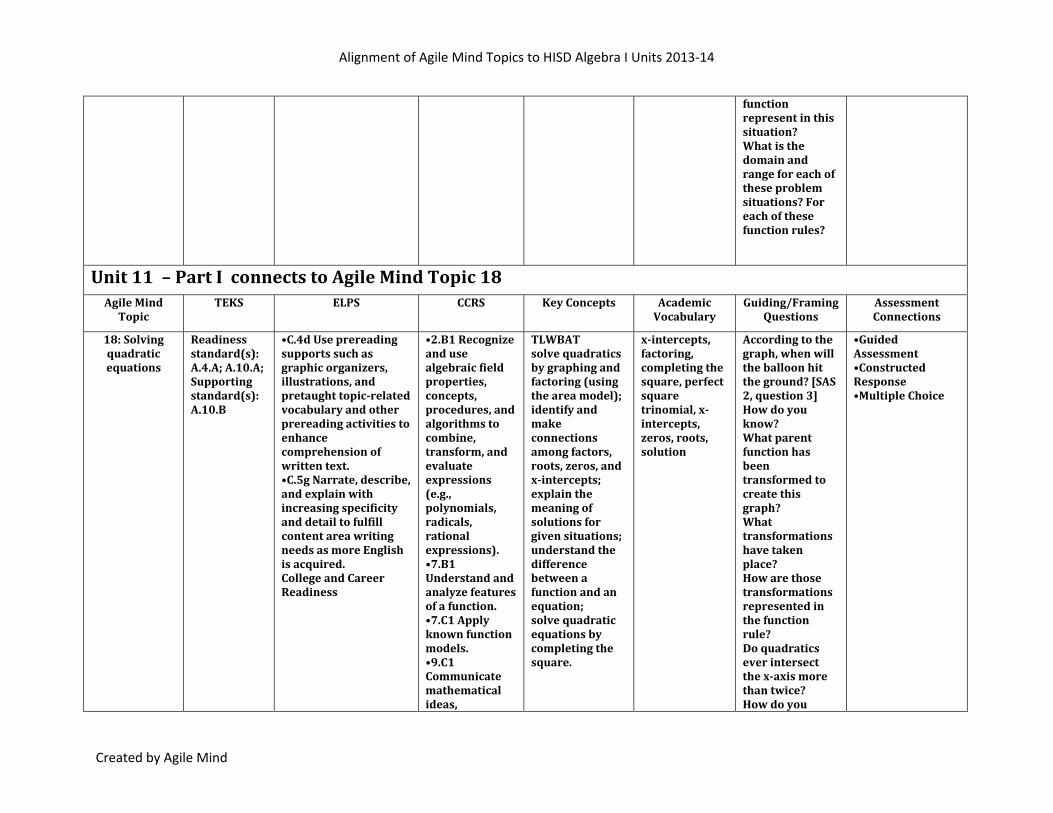
Unit 11 – Part I connects to Agile Mind Topic 18 Agile Mind Topic
TEKS ELPS CCRS Key Concepts Academic Vocabulary
Guiding/Framing Questions
Assessment Connections
18: Solving quadratic equations
Readiness standard(s): A.4.A; A.10.A; Supporting standard(s): A.10.B
•C.4d Use prereading supports such as graphic organizers, illustrations, and pretaught topicrelated vocabulary and other prereading activities to enhance comprehension of written text. •C.5g Narrate, describe, and explain with increasing specificity and detail to fulfill content area writing needs as more English is acquired. College and Career Readiness
•2.B1 Recognize and use algebraic field properties, concepts, procedures, and algorithms to combine, transform, and evaluate expressions (e.g., polynomials, radicals, rational expressions). •7.B1 Understand and analyze features of a function. •7.C1 Apply known function models. •9.C1 Communicate mathematical ideas,
TLWBAT solve quadratics by graphing and factoring (using the area model); identify and make connections among factors, roots, zeros, and xintercepts; explain the meaning of solutions for given situations; understand the difference between a function and an equation; solve quadratic equations by completing the square.
xintercepts, factoring, completing the square, perfect square trinomial, xintercepts, zeros, roots, solution
According to the graph, when will the balloon hit the ground? [SAS 2, question 3] How do you know? What parent function has been transformed to create this graph? What transformations have taken place? How are those transformations represented in the function rule? Do quadratics ever intersect the xaxis more than twice? How do you
•Guided Assessment •Constructed Response •Multiple Choice
Alignment of Agile Mind Topics to HISD Algebra I Units 2013‐14
Created by Agile Mind
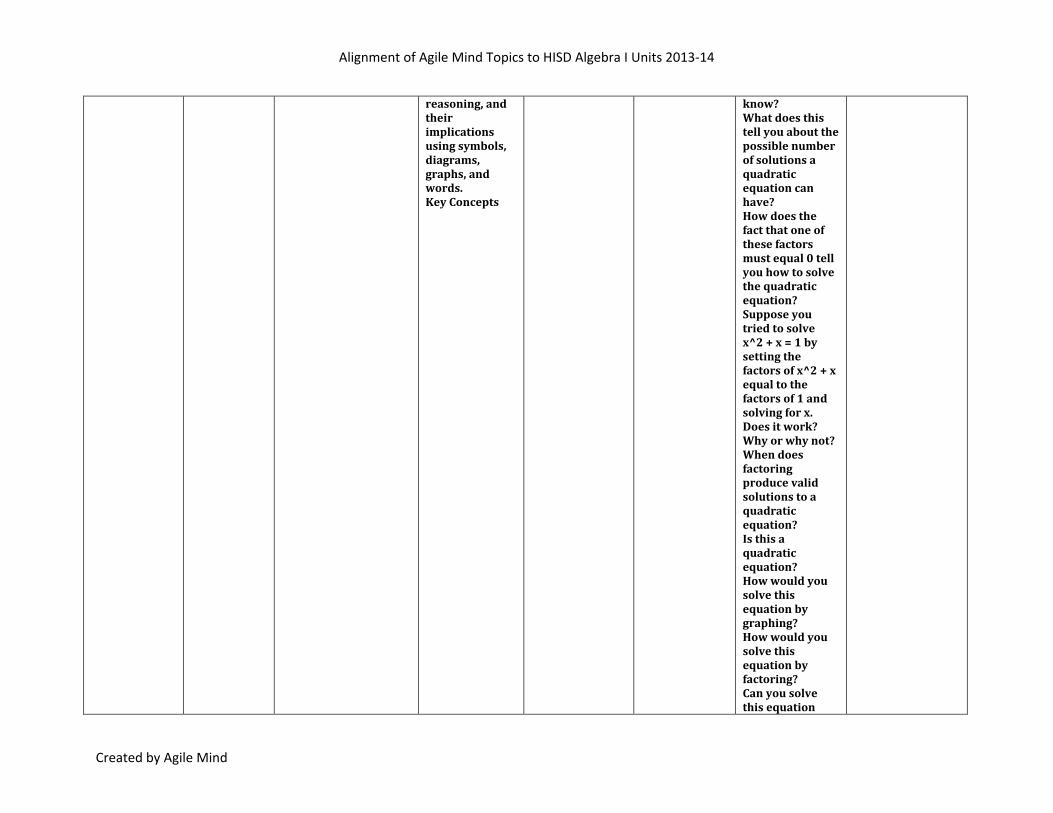
reasoning, and their implications using symbols, diagrams, graphs, and words. Key Concepts
know? What does this tell you about the possible number of solutions a quadratic equation can have? How does the fact that one of these factors must equal 0 tell you how to solve the quadratic equation? Suppose you tried to solve x^2 + x = 1 by setting the factors of x^2 + x equal to the factors of 1 and solving for x. Does it work? Why or why not? When does factoring produce valid solutions to a quadratic equation? Is this a quadratic equation? How would you solve this equation by graphing? How would you solve this equation by factoring? Can you solve this equation
Alignment of Agile Mind Topics to HISD Algebra I Units 2013‐14
Created by Agile Mind
without graphing or factoring? How?
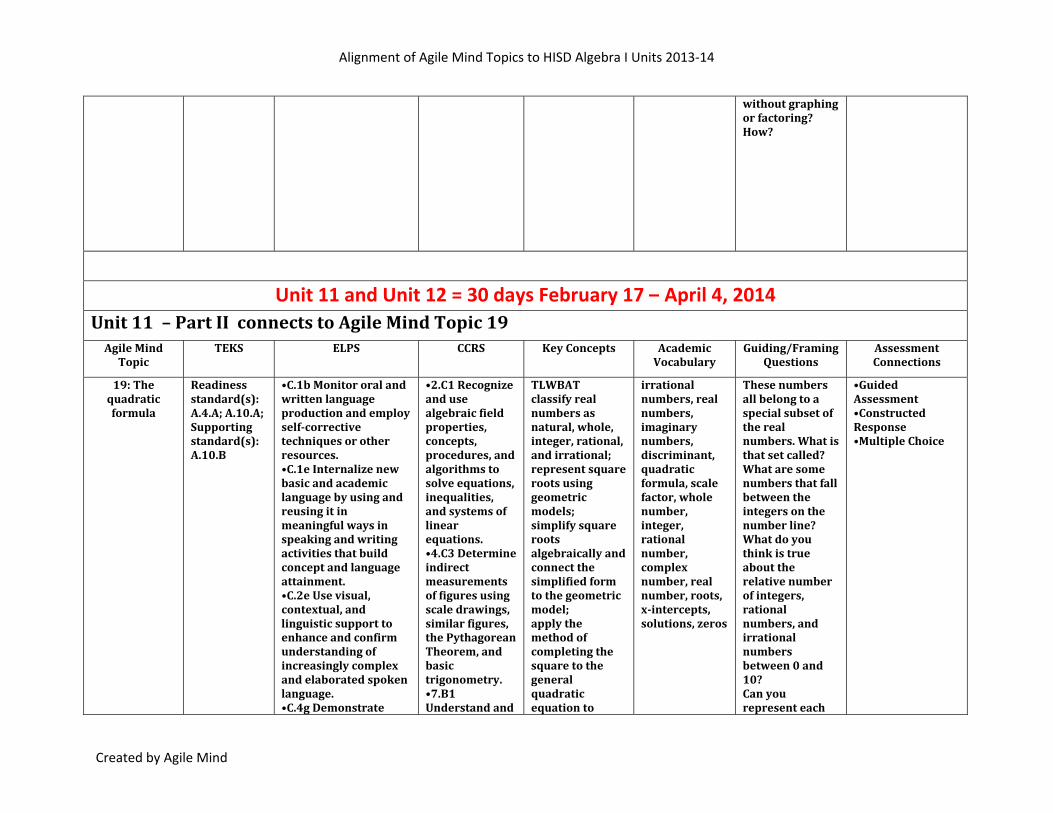
Unit 11 and Unit 12 = 30 days February 17 – April 4, 2014 Unit 11 – Part II connects to Agile Mind Topic 19 Agile Mind Topic
TEKS ELPS CCRS Key Concepts Academic Vocabulary
Guiding/Framing Questions
Assessment Connections
19: The quadratic formula
Readiness standard(s): A.4.A; A.10.A; Supporting standard(s): A.10.B
•C.1b Monitor oral and written language production and employ selfcorrective techniques or other resources. •C.1e Internalize new basic and academic language by using and reusing it in meaningful ways in speaking and writing activities that build concept and language attainment. •C.2e Use visual, contextual, and linguistic support to enhance and confirm understanding of increasingly complex and elaborated spoken language. •C.4g Demonstrate
•2.C1 Recognize and use algebraic field properties, concepts, procedures, and algorithms to solve equations, inequalities, and systems of linear equations. •4.C3 Determine indirect measurements of figures using scale drawings, similar figures, the Pythagorean Theorem, and basic trigonometry. •7.B1 Understand and
TLWBAT classify real numbers as natural, whole, integer, rational, and irrational; represent square roots using geometric models; simplify square roots algebraically and connect the simplified form to the geometric model; apply the method of completing the square to the general quadratic equation to
irrational numbers, real numbers, imaginary numbers, discriminant, quadratic formula, scale factor, whole number, integer, rational number, complex number, real number, roots, xintercepts, solutions, zeros
These numbers all belong to a special subset of the real numbers. What is that set called? What are some numbers that fall between the integers on the number line? What do you think is true about the relative number of integers, rational numbers, and irrational numbers between 0 and 10? Can you represent each
•Guided Assessment •Constructed Response •Multiple Choice
Alignment of Agile Mind Topics to HISD Algebra I Units 2013‐14
Created by Agile Mind
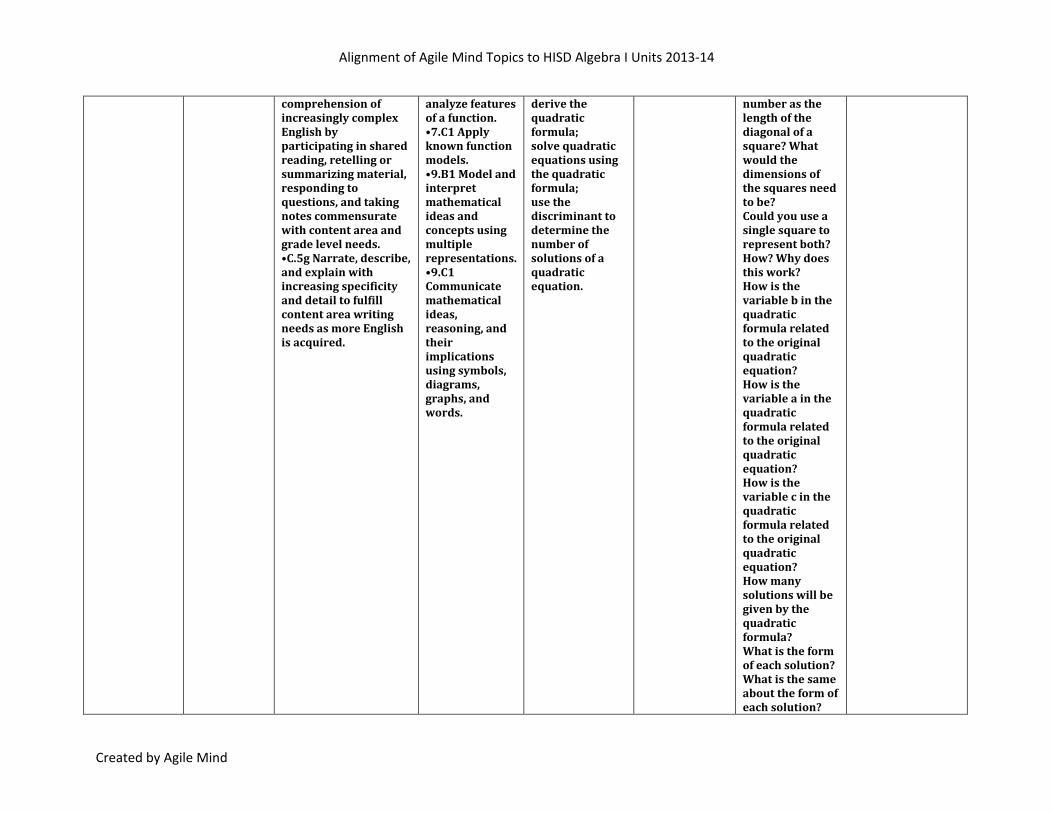
comprehension of increasingly complex English by participating in shared reading, retelling or summarizing material, responding to questions, and taking notes commensurate with content area and grade level needs. •C.5g Narrate, describe, and explain with increasing specificity and detail to fulfill content area writing needs as more English is acquired.
analyze features of a function. •7.C1 Apply known function models. •9.B1 Model and interpret mathematical ideas and concepts using multiple representations. •9.C1 Communicate mathematical ideas, reasoning, and their implications using symbols, diagrams, graphs, and words.
derive the quadratic formula; solve quadratic equations using the quadratic formula; use the discriminant to determine the number of solutions of a quadratic equation.
number as the length of the diagonal of a square? What would the dimensions of the squares need to be? Could you use a single square to represent both? How? Why does this work? How is the variable b in the quadratic formula related to the original quadratic equation? How is the variable a in the quadratic formula related to the original quadratic equation? How is the variable c in the quadratic formula related to the original quadratic equation? How many solutions will be given by the quadratic formula? What is the form of each solution? What is the same about the form of each solution?

Alignment of Agile Mind Topics to HISD Algebra I Units 2013‐14
Created by Agile Mind
What is different?
Unit 12 – connects to Agile Mind Topics 21 and 23 Agile Mind Topic
TEKS ELPS CCRS Key Concepts Academic Vocabulary
Guiding/Framing Questions
Assessment Connections
21: Exponential functions and equations
Supporting standard(s): A.11.A; A.11.C
•C.3j Respond orally to information presented in a wide variety of print, electronic, audio, and visual media to build and reinforce concept and language attainment. •C.5e Employ increasingly complex grammatical structures in content area writing commensurate with gradelevel expectations, such as: using correct verbs, tenses, and pronouns/antecedents; using possessive case (apostrophe’s) correctly; and using negatives and contractions correctly.
•2.D1 Interpret multiple representations of equations and relationships. •7.B1 Understand and analyze features of a function. •7.C2 Develop a function to model a situation. •8.C1 Formulate a solution to a real world situation based on the solution to a mathematical problem. •8.C2 Use a function to model a real world situation. •9.C2 Create and use representations to organize, record, and communicate mathematical ideas. •10.A2 Connect mathematics to
TLWBAT recognize exponential patterns and represent generalizations algebraically; analyze data and represent situations involving exponential growth and decay using concrete models, tables, graphs, and algebraic methods.
exponential function, constant multiplier, stretches, compresses, indeterminate, exponential growth, exponential decay, Sierpinski triangle, halflife, carbon dating, theoretical probability, linear function, yintercept, constant rate of change, changing rate of change, common difference, common multiplier
Which type of growth is faster over time? Why? Why is the graph discrete? What is the domain of the function that models this population? What is the range? How do the growth rates of the fruit flies and fire ants compare? What does this tell you about the type of function that models each population? Consider the graph of the fire ant population. During which time period is the graph growing slowly? When is it growing faster? How would the graph of the population of the fruit flies change if there were
•Guided Assessment •Constructed Response •Multiple Choice

Alignment of Agile Mind Topics to HISD Algebra I Units 2013‐14
Created by Agile Mind
the study of other disciplines.
only 10 fruit flies at the beginning of the experiment? [SAS 2, question 8a] How would the graph of the population of the fire ants change if there were only 10 fire ants at the beginning of the experiment? [SAS2, question 8b]
Agile Mind Topic
TEKS ELPS CCRS Key Concepts Academic Vocabulary
Guiding/Framing Questions
Assessment Connections
23: Modeling with
inverse variation
Supporting standard(s): A.11.B
•C.3j Respond orally to information presented in a wide variety of print, electronic, audio, and visual media to build and reinforce concept and language attainment. •C.5e Employ increasingly complex grammatical structures in content area writing commensurate with gradelevel expectations, such as: using correct verbs, tenses, and pronouns/antecedents; using possessive case (apostrophe’s) correctly; and using negatives and contractions correctly.
•2.D1 Interpret multiple representations of equations and relationships. •7.B1 Understand and analyze features of a function. •7.C2 Develop a function to model a situation. •8.C1 Formulate a solution to a real world situation based on the solution to a mathematical problem. •8.C2 Use a function to
TLWBAT recognize inverse variation from patterns in data; graph inverse variations from data and recognize graphs of inverse variations; represent situations involving inverse variation symbolically.
inverse, inverse variation, constant of variation, horizontal asymptote, vertical asymptote
Is the relationship between revenue and number of candy bars sold an example of direction variation? How do you see this in the function rule? In the graph? What is the value of k in this situation? If you double the number of candy bars sold, what will happen to the revenue earned? If Van invites 2 friends, how many ice cream
•Guided Assessment •Constructed Response •Multiple Choice

Alignment of Agile Mind Topics to HISD Algebra I Units 2013‐14
Created by Agile Mind
model a real world situation. •9.C2 Create and use representations to organize, record, and communicate mathematical ideas. •10.A2 Connect mathematics to the study of other disciplines.
bars will Van and his friends get to eat? If Van invites 3 friends, how many ice cream bars will Van and his friends get to eat? As Van invites more friends, what happens to the number of ice cream bars each person will get? What happens "graphically" when you divide a number by smaller and smaller numbers? What happens "graphically" when you divide a number by larger and larger numbers? How does this graph compare to the graph of the original situation, when only the bus rental cost had to be considered? [SAS 3, question 8] Is this new situation an example of inverse variation? Why or why not?
Alignment of Agile Mind Topics to HISD Algebra I Units 2013‐14
Created by Agile Mind
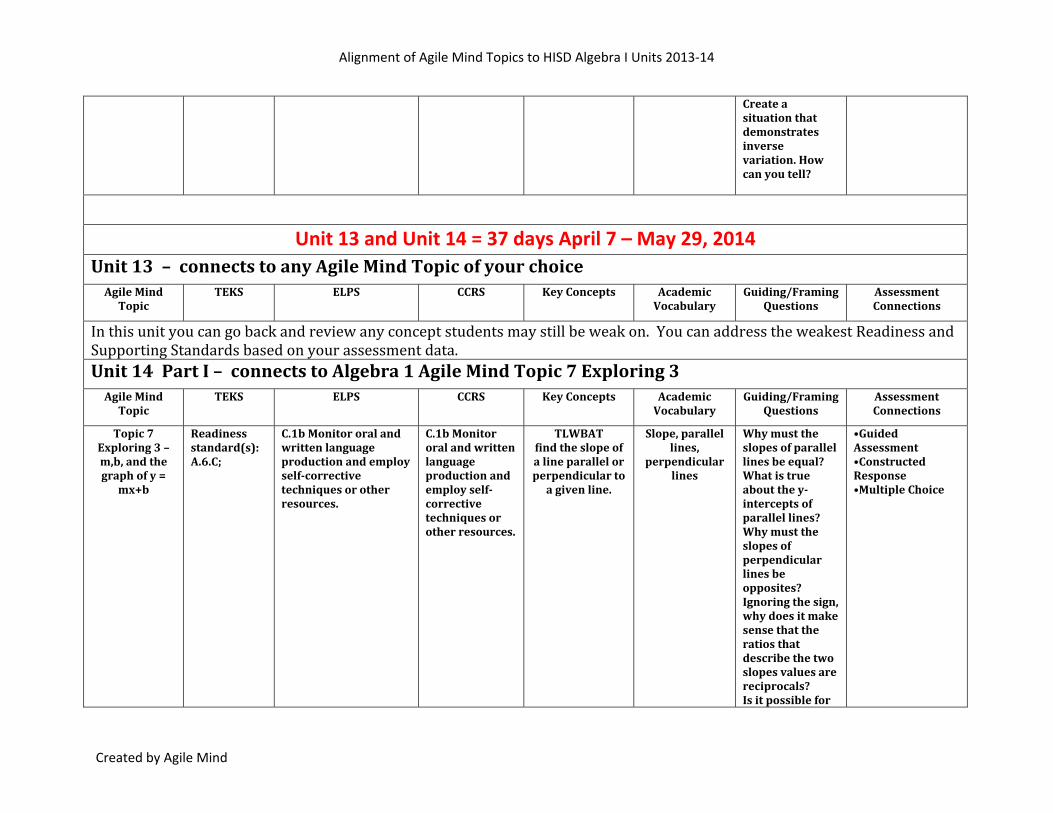
Create a situation that demonstrates inverse variation. How can you tell?
Unit 13 and Unit 14 = 37 days April 7 – May 29, 2014 Unit 13 – connects to any Agile Mind Topic of your choice Agile Mind Topic
TEKS ELPS CCRS Key Concepts Academic Vocabulary
Guiding/Framing Questions
Assessment Connections
In this unit you can go back and review any concept students may still be weak on. You can address the weakest Readiness and Supporting Standards based on your assessment data. Unit 14 Part I – connects to Algebra 1 Agile Mind Topic 7 Exploring 3 Agile Mind Topic
TEKS ELPS CCRS Key Concepts Academic Vocabulary
Guiding/Framing Questions
Assessment Connections
Topic 7 Exploring 3 – m,b, and the graph of y =
mx+b
Readiness standard(s): A.6.C;
C.1b Monitor oral and written language production and employ selfcorrective techniques or other resources.
C.1b Monitor oral and written language production and employ selfcorrective techniques or other resources.
TLWBAT find the slope of a line parallel or perpendicular to a given line.
Slope, parallel lines,
perpendicular lines
Why must the slopes of parallel lines be equal? What is true about the yintercepts of parallel lines? Why must the slopes of perpendicular lines be opposites? Ignoring the sign, why does it make sense that the ratios that describe the two slopes values are reciprocals? Is it possible for
•Guided Assessment •Constructed Response •Multiple Choice

Alignment of Agile Mind Topics to HISD Algebra I Units 2013‐14
Created by Agile Mind
perpendicular lines to have the same yintercept? [SAS 4, question 8]