![Emergence of Trade Unionism[1]](https://static.fdocuments.us/doc/165x107/5695d0651a28ab9b029248a2/emergence-of-trade-unionism1.jpg)
UNIONISM AND PRODUCTIVITY IN WEST ... - Bill Boal's web...
28
UNIONISM AND PRODUCTIVITY IN WEST VIRGINIA COAL MINING: A REPLICATION STUDY William M. Boal* Drake University July 2016 ABSTRACT: Boal’s (1990) article “Unionism and Productivity in West Virginia Coal Mining” studied the effect of the United Mine Workers on coal mines in the early 1920s. Instead of simply inserting a binary variable for unionism, that article allowed unionism to alter all the parameters of the production function. It was shown that unionism lowered productivity at small coal mines, a result described as “economies of scale in labor relations.” The 1990 article seemed credible because it measured inputs and outputs in physical terms and exploited a panel design. However, the standard errors were rather large, probably because the sample size was modest (332 observations). This paper replicates the 1990 article with a much larger panel of West Virginia coal mines (5960 observations). The earlier findings do not hold up. Overall, unionism lowered productivity by an average of 8 percent but there is no evidence of a particular negative effect at small mines. JEL CODES: J5, L7, N3, N5. KEYWORDS: Unionism, productivity, coal industry, UMWA. RUNNING HEAD: “Unionism and Productivity Replication” AKNOWLEDGEMENTS: The author thanks Raymond Hubbard and John Pencavel for encouraging this project. DISCLOSURE STATEMENT: The author has no conflicts of interest to declare. This research did not receive outside funding. * Address: College of Business and Public Administration, Drake University, 2507 University Avenue, Des Moines, Iowa, 50311 United States. Telephone: 515-271-3129. Email: [email protected] .
Transcript of UNIONISM AND PRODUCTIVITY IN WEST ... - Bill Boal's web...

UNIONISM AND PRODUCTIVITY IN WEST VIRGINIA COAL MINING:
A REPLICATION STUDY
William M. Boal*
Drake University
July 2016
ABSTRACT: Boal’s (1990) article “Unionism and Productivity in West Virginia Coal
Mining” studied the effect of the United Mine Workers on coal mines in the early 1920s.
Instead of simply inserting a binary variable for unionism, that article allowed unionism to
alter all the parameters of the production function. It was shown that unionism lowered
productivity at small coal mines, a result described as “economies of scale in labor
relations.” The 1990 article seemed credible because it measured inputs and outputs in
physical terms and exploited a panel design. However, the standard errors were rather
large, probably because the sample size was modest (332 observations). This paper
replicates the 1990 article with a much larger panel of West Virginia coal mines (5960
observations). The earlier findings do not hold up. Overall, unionism lowered productivity
by an average of 8 percent but there is no evidence of a particular negative effect at small
mines.
JEL CODES: J5, L7, N3, N5.
KEYWORDS: Unionism, productivity, coal industry, UMWA.
RUNNING HEAD: “Unionism and Productivity Replication”
AKNOWLEDGEMENTS: The author thanks Raymond Hubbard and John Pencavel for encouraging this
project.
DISCLOSURE STATEMENT: The author has no conflicts of interest to declare. This research did not
receive outside funding.
* Address: College of Business and Public Administration, Drake University, 2507 University
Avenue, Des Moines, Iowa, 50311 United States. Telephone: 515-271-3129. Email:

1
1. Introduction
Many studies beginning with Pencavel (1977) and Brown and Medoff (1978) have
attempted to measure the effects of unionism on productivity by estimating production functions
of the form
Q = f(L, K, U),
where Q denotes output, L denotes labor input, K denotes capital and other inputs, and U
denotes unionism (Doucouliagos and Laroche 2003). One such article by Boal (1990)
investigated U.S. coal mining in the early 1920s. It showed that the effect of unionism “cannot
be reduced to a simple intercept shift” (p. 401), but that unionism lowered productivity at small
coal mines, an effect ascribed to “economies of scale in labor relations” (p. 403). The estimates
seemed credible because inputs and outputs were measured in physical terms, so they avoided
confounding union effects on prices and wages with union effects on production technology, and
the unit of observation was the establishment (mine), recommended features of any such study
(Doucouliagos and Laroche 2003, pp. 671-672). Moreover, the estimates exploited a
“difference-in-differences” panel design in which all mines changed union status though at
different points in time. However, the standard errors were rather large, perhaps because the
sample size was modest, so the statistical significance of some of the results was borderline.
This paper replicates Boal’s (1990) article in hopes of more precise estimates. The same
Cobb-Douglas and translog production functions are re-estimated on the original data, with
minor improvements to the specification and the estimation method, and the earlier results of a
negative union effect at small mines hold up. Then the same production functions are estimated
on a much larger panel of coal mines from 1899 to 1925. In the large panel, the earlier results do

2
not hold up—there is no longer evidence of a negative union effect on productivity at small
mines.
The paper is organized as follows. The next section briefly reviews the history of
unionism in West Virginia coal mining, showing why it is conducive to econometric analysis of
unionism. The third section replicates Boal’s (1990) estimates using his small panel. The fourth
section replicates the estimates using a much larger panel. The fifth section concludes.
2. Unionism in West Virginia coal mining
West Virginia experienced waves of unionism in the early twentieth century, as shown in
figure 1. Various coal fields were unionized in succession (Boal 1994). The United Mine
Workers of America (UMWA) first gained a toehold in the Northern Panhandle field near
Wheeling in 1902. The union won most of the Kanawha field near Charleston in 1903. After a
long and bitter strike in 1912-1913, the union won the rest of the Kanawha field and the New
River field, south of Charleston. In 1919, the union won the Fairmont field in northern West
Virginia. During the years immediately following the First World War, the union enjoyed its
maximum strength. Coal fields in northern and central West Virginia, producing about 50
percent of total tonnage, were all unionized. However, nonunion fields in the extreme southern
part of the state were not.
In the 1920s, the union suffered a series of setbacks (see figure 1). In 1922, the union
lost the New River field and most of the Kanawha field. In 1924, it lost the remainder of the
Kanawha field and the Fairmont field. By 1927, no mines in West Virginia were operating under
union contract and the state remained nonunion until the early 1930s. There were probably many
reasons for the union’s rapid decline, but two stand out. First, UMWA President John L. Lewis,

3
under pressure from members in states where the UMWA was stronger, refused to allow West
Virginia miners to concede a reduction in wages, despite falling coal prices and nonunion coal
wages (Mooney 1967, pp. 127-128; Dubofsky and Van Tine 1977, pp. 134-147). Second, the
legal position of the union was severely weakened by the U.S. Supreme Court’s 1917 Hitchman
decision, which allowed coal operators to seek broad injunctions against union organizing (Lunt
1979, pp. 37-59).
The rapid change in the UMWA’s fortunes in West Virginia in the early twentieth
century has attracted much historical research (e.g., Corbin 1981), but here as in Boal (1990) it is
exploited for econometric purposes. It is easy to find mines in West Virginia that changed union
status during this period, often more than once. Moreover, mines did not change union status
simultaneously, as sometimes occurred in other states. So it is possible to measure the effect of
the union while controlling for geological and other differences across mines (with mine effects)
as well as technical change, government regulations, and other time-varying shocks (with year
effects).
3. Replication of estimates with original small panel
Boal (1990) estimated the effect of unionism on productivity using a small panel of West
Virginia coal mines in the early 1920s, exploiting the union’s rapid decline in this period to
estimate the effect of deunionization. This section replicates those results using the same data
but a more current estimation method and a cleaner specification of the production function.

4
3.1 Data
Boal’s (1990) panel followed 83 mines over four years (1921, 1923, 1924, and 1925) all
of which changed from union to nonunion status. Fifty-five of the mines in the panel, mostly in
the New River and Kanawha fields, operated on a union basis only for the first year of the
sample. The remaining 28 mines, mostly in the Kanawha and Fairmont fields, operated on a
union basis until the last year of the sample. There were no missing values, so the panel was
balanced with 332 total observations.
Data on coal output and inputs were taken from the Annual Report of the West Virginia
Department of Mines. Coal output was measured in tons. Five inputs were also measured in
physical terms: miners (workers at the coal face), other workers (including machine operators,
locomotive drivers, etc.), mining machines (used to undercut the coal before blasting),
locomotives, and horses and mules. Days of operation were also taken from the Annual Report.
Information on unionism was taken from many sources to construct a binary variable for
unionism (see Boal 1990 appendix). This variable equals one when a mine operated under a
formal contract with the United Mine Workers, and equals zero when a mine operated without
such a contract. Descriptive statistics of the panel are shown in table 1. Note that 42 percent of
the observations were unionized.
[Table 1 about here]
3.2 Replicating the estimates
Table 2 replicates the Cobb-Douglas production function estimates in Boal (1990). As in
Boal’s (1990) original specification, each input is multiplied by days of operation before taking
logs, so the inputs are “miner-days,” “other-worker-days,” “machine-days,” etc. Because zeros
were occasionally observed for each input, one was added to “input-days” before taking logs, as

5
in Boal (1990). Days of operation and its square are also included separately. The estimation
method here is ordinary least squares, with fixed effects for mines and years, and robust standard
errors clustered at the mine level. Boal (1990) actually used a different estimation method due to
MaCurdy (1982) that is less popular today. He first-differenced the data and then applied
seemingly-unrelated regressions to model serial correlation. Nevertheless, his estimates were
quite similar to those reported in table 2.
[Table 2 about here]
Column (i) shows a production function with a simple union binary variable—a
specification used by many studies of unionism and productivity. The sum of the input
coefficients is about 0.686 (slightly larger than the 0.62 estimated by Boal 19990, p. 398), with a
standard error of 0.076, indicating decreasing returns to scale. The estimated coefficient of
unionism is small, positive, and smaller than its standard error. There is little evidence here of an
effect of unionism on mine productivity on average.
Boal’s (1990) article focused on the possibility that unionism might change many of the
coefficients of the production function, not just the intercept. Column (ii) accordingly adds
interactions of all of the input variables with unionism, giving the specification actually used by
Boal. The union variable is now large, negative and statistically significant, but the total effect
of unionism on productivity depends on the interactions as well. None of the union interactions
is individually significant at conventional levels, but a joint test of the null hypothesis that all
five are zero gives a p-value of 0.0044 (similar to Boal 1990, p. 398). The sum of the
interactions is 0.094 (slightly smaller than the 0.12 estimated by Boal 1990, p. 398), with a
standard error of 0.031, indicating that the effect of unionism on productivity was positively
related to mine size. Indeed, using this same Cobb-Douglas specification Boal (1990) found a

6
negative effect of unionism at very small mines and a positive effect at very large mines,
attributing this result to “economies of scale in labor relations” (p. 394). However, that
interpretation is somewhat ambiguous: a “large” mine in the specification of column (ii) has
large values of “input-days,” but this could mean either many inputs (such as workers) or many
days of operation. I eliminate this ambiguity below by tinkering with the specification, in two
steps. First I allow unionism to interact with days of operation, and then I separate input levels
from days of operation.
3.3 A Cleaner Specification
Boal’s (1990) specification allowed interactions of unionism with input-days, but not
with days of operation itself nor with its square, for some unknown reason. Column (iii) of table
2 relaxes this restriction to allow these two interactions. It turns out that the coefficients of these
two interactions are strongly statistically significant. The union coefficient now becomes
enormous, negative and significant, but again the total effect of unionism on productivity
depends on the interactions as well. Again, none of the union interactions with input-days is
individually significant at conventional levels, but the sum of those interactions is 0.161, with a
standard error of 0.051, confirming that the union effect on productivity is still positively
correlated with “mine size” in the sense of large values for “input-days.” Thus, allowing
unionism to interact with days of operation, while strongly justified by statistical tests, makes
little difference to the key conclusion.
To disentangle union effects related to mine size from union effects related to days of
operation, I change the specification to separate input levels from days of operation. Table 3

7
reports estimates where inputs are not multiplied by days of operation before taking logs.1
Column (i) shows estimates of a Cobb-Douglas production function with a simple union binary
variable. As in table 2 column (i), the estimated coefficient of unionism is small, positive, and
smaller than its standard error.
[Table 3 about here]
Column (ii) adds interactions of unionism with the input variables (not multiplied by days
of operation) and with days of operation and its square. The sum of the interactions with the
inputs is 0.143, with a standard error of 0.055, indicating again that the effect of unionism on
productivity was positively related to mine size, even with days of operation held constant. To
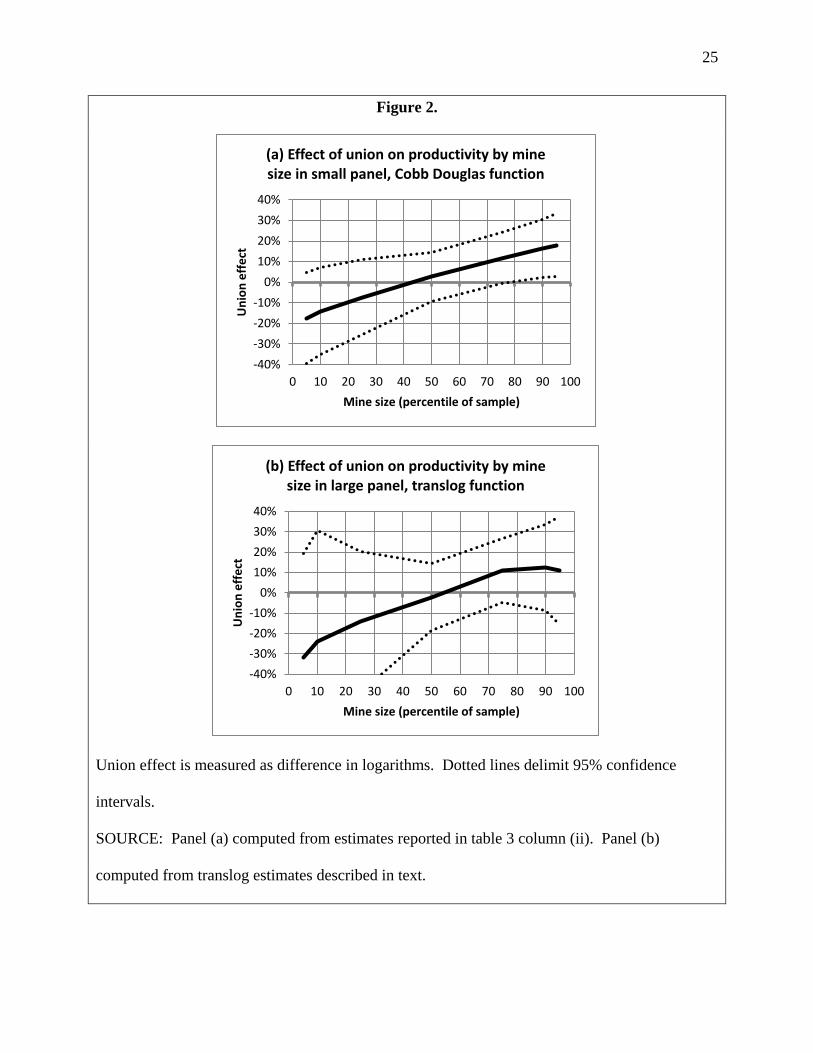
illustrate this result, following Boal (1990, table 4, p. 399), I computed the effect of unionism at
different percentiles of the inputs, while holding days of operation constant at the sample median
value. The results are plotted in figure 2, panel (a). With all inputs at their fifth percentiles (that
is, very small mines) the union effect is negative 17 percent, but with all inputs at their ninety-
fifth percentiles (that is, very big mines) the union effect is positive 18 percent.
[Figure 2 about here]
Boal (1990) also estimated a so-called “translog” production function, a more flexible
functional form which includes squares and interactions of the log-input variables, and again
1 In theory, this modification should affect the estimated coefficient of log(days) but not the estimated
input coefficients because log (input-days) = log(input) + log(days). In practice, however, this
equation does not hold exactly here because one was added to each “input-days” before taking logs
in table 2, and one was added to each “input” before taking logs in table 3. This was done, here and
in Boal (1990), because the minimum value of most of the inputs was zero, as seen in table 1. Since
log (input-days + 1) does not exactly equal log(input + 1) + log(days), the estimates of the input
coefficients in columns (i) and (iii) of table 2 do not exactly equal the estimates in columns (i) and
(ii) of table 3.

8
allowed all “input-days” regressors to interact with unionism. I estimated a similar translog
function, with input variables not multiplied by days. In other words, my translog function was
similar to table 3 column (ii) but with additional 20 second-order terms. The translog coefficient
estimates are not reported here because they would take up too much space and because they are
difficult to interpret individually. However, the additional coefficients are jointly significant, as
in Boal (1990, table 3, p. 399).2 Again following Boal (1990), I computed the effect of unionism
at different percentiles of the inputs, while holding days of operation constant at the sample
median. The translog results are plotted in figure 2, panel (b). With all inputs at their fifth
percentiles (very small mines) the union effect is negative 31 percent, but with all inputs at their
ninety-fifth percentiles (very big mines) the union effect is positive 10 percent.
Figure 2, as a whole, closely resembles figure 1 in Boal (1990, p. 400). The effect of
unionism on productivity is negative for small mines, positive for large mines, and close to zero
for mines near the median. For the Cobb-Douglas specification, the results are nearly
symmetric: the negative effect at small mines is nearly equal but opposite in sign to the positive
effect at large mines. For the translog specification, the negative effect at small mines is greater
in magnitude than the positive effect at large mines. Here in figure 2, however, the union effects
in the translog specification are never significant at five percent, in contrast to Boal (1990, table
4, p. 399). This might be because Boal (1990) used a feasible generalized least-squares
estimation method, which can be more efficient, or because he used a less robust method for
computing standard errors.
2 A joint test of the second-order terms that were not interacted with unionism gave F(15,82) = 2.87,
p = 0.001. A joint test of the second-order terms that were interacted with unionism gave F(15,82)
= 2.37, p = 0.007. A joint test of all of the above terms gave F(30,82) = 8.47, p < 0.001.
9
In summary, re-estimation of production functions from Boal (1990) with the same panel
data, but a different estimation method and a cleaner specification, gives results similar to the
earlier article. On average, unionism raised productivity by about 3 percent (according to the
specification with the single binary union variable) but this estimate is not statistically
significant. The coefficient estimates of the union interactions show that the union productivity
effect is positively related to mine size, but the standard errors are somewhat large (see figure 2).
So there is an indication that the union productivity effect was positively related to mine size but
the evidence is not overwhelming. Definite conclusions are frustrated by imprecision of the
estimates. In fact, very few of the coefficient estimates in table 2 or in columns (i) and (ii) of
table 3 are statistically significant individually. Perhaps a larger panel might yield more definite
conclusions.
4. Replication of estimates with a new large panel
This section reports production function estimates from a new panel, almost 18 times
larger than Boal’s (1990) panel, intended to increase the precision of the estimates. More mines
were added, including some that did not change union status in the sample period. More years
were also added, taking advantage of the UMWA’s waves of expansion in 1903, 1914, and 1919,
as well as its decline in the early 1920s (see figure 1).
4.1 Data
The Department of Mines reported that the total number of coal mines in West Virginia
expanded from 215 in 1897 to 1702 in 1923, before falling to 866 in 1930, a potentially huge
trove of data. Unfortunately, not all of these years and mines could be used. The number of

10
years was constrained by the availability of output and input data from the Department’s Annual
Report. Mine-level data on the five inputs used in Boal’s (1990) earlier article were not
published before 1899 or after 1925. The number of mines was constrained by the availability of
information on the union. By compiling scraps of information from many sources, time series of
union status were constructed for roughly one-quarter of the coal mines operating in West
Virginia during this period (see figure 3). (See Appendix A for details.)
[Figure 3 about here]
Unlike the small panel analyzed in the previous section, this large panel is not balanced.
Missing values occur for three reasons. First, occasionally a datum was omitted from the Annual
Report. Second, often a mine could not be confidently matched across successive Annual
Reports, most likely because the mine did not operate in all periods or because the name of the
mine changed due to a change in ownership. Third, very often a mine’s union status could not be
ascertained for part of its history. As is well known, errors in longitudinal data can cause
attenuation bias in estimates (Freeman 1984; Lewis 1986, pp. 60-94) so assignment of union
status erred on the side of caution. Observations were dropped if union status could not be
determined with certainty or if union status changed in the middle of the year.
In total, this large panel covers 523 mines and 27 years, but missing values reduce the
total size to 5960 observations.3 Descriptive statistics given in table 4 show that these mines
were slightly smaller than the mines in the small panel used above. They used fewer machines
and locomotives, and more horses and mules, as might be expected because the large panel
stretches further back in time. Overall, 34 percent of the observations were unionized.
3 Despite missing values, this sample is quite large compared to others in this literature. It is larger
than all but two samples in the 77 studies analyzed by Doucouliagost and Laroche (2003, table 1,
pp. 660-662).

11
[Table 4 about here]
In panel data, when fixed effects are used to control for unobserved differences across
units, the effect of unionism is identified by units changing union status. In this large panel, 227
mines changed union status, many of them more than once: there are 147 transitions from
nonunion to union status, and 177 transitions from union to nonunion status.4 This large panel
also includes 107 mines that were always observed as union and 189 mines that were always
observed as nonunion. Mines not changing union status are still useful because they help
estimate the production function parameters.
4.2 Estimates
Table 3 columns (iii) and (iv) show estimates of a Cobb-Douglas production function
specification almost identical to that in columns (i) and (ii), but now estimated on this large
panel. Columns (iii) and (iv) include one new variable not used in Boal (1990) or in columns (i)
and (ii). Because this large panel stretches over a longer period, the first observation of each
mine in many cases represents a new mine in initial development. New mines had lower
productivity because narrow entries and haulage ways (rather than wide rooms) were being
driven to open the mine.5 At the same time, new mines usually began operation as nonunion.
To control for any spurious correlation of initial productivity and initial union status, a binary
variable is included indicating the first observation of a mine. Its coefficient estimate is always
negative and statistically significant.
4 Transitions were often mediated by missing observations, for reasons given above. 5 Piece rates were correspondingly higher for miners working entries or haulage ways than for miners
working rooms (Fisher and Bezanson 1932, p. 37).

12
Compare column (iii) in table 3 with column (i), the specifications with a simple binary
variable for unionism. In column (iii), all estimated input coefficients have much smaller
standard errors and are now statistically different from zero at the one percent level—in this
respect, the large panel delivers greater precision, as hoped. Some other differences are
apparent. The sum of the five input coefficients in column (iii) is now 1.031 (with standard error
0.027) so production is now characterized by approximately constant returns to scale.
Productivity is lower by about 32 percent for the first observation of each mine, presumably
reflecting initial development of a new mine. The coefficient of unionism is now about negative
0.081 and is about four times its standard error, indicating that unionism appears to lower
productivity by an average of 8 percent.6
Compare column (iv) in table 3 with column (ii), the specifications where all regressors
are interacted with unionism. Again, all estimated input coefficients now have much smaller
standard errors. The coefficients of the input interactions are mostly small and individually
statistically insignificant, but a joint test of the null hypothesis that all seven are zero gives a p-
value of less than 0.001.
Is there any evidence of a union productivity effect related to mine size in column (iv)?
The sum of the union-input interactions now is negative 0.076 with a standard error of 0.030,
indicating that, if anything, the effect of unionism on productivity was negatively related to mine
size. I again computed the effect of unionism at different percentiles of the inputs, while holding
days of operation constant at the sample median value. The results are plotted in figure 4, panel
6 There is some evidence the union effect varied over time. When I interacted the union variable with
the year fixed effects, the resulting coefficients were slightly positive or close to zero through 1913,
after which they became increasingly negative.

13
(a). The effect of unionism is estimated more precisely here than with the small panel (compare
figure 2), but the union effect is closer to zero and slightly negatively related to mine size.
[Figure 4 about here]
I also estimated a translog function on the large panel, with all regressors interacted with
unionism. To save space, the translog coefficient estimates are not reported here, but the
additional coefficients are jointly significant.7 Again I computed the effect of unionism at
different percentiles of the inputs, while holding days of operation constant at the sample
median. The results are plotted in figure 4, panel (b). That figure shows some evidence of a
positive union effect on productivity at small mines—exactly the opposite of Boal’s (1990, table
4, p. 399) conclusion—but the effect is not statistically significant. The union effect at the
twenty-fifth percentile and above is almost exactly zero, and fairly precisely estimated. The two
panels of figure 4 resemble each other in their slight downward slope, but they bear no
resemblance to figure 2 nor to Boal’s figure 1 (1990, p. 400). Boal’s (1990) conjecture of
“economies of scale in labor relations” certainly does not hold up in this large panel.
[Figure 5 about here]
In summary, re-estimation of production functions on a large panel has attained its goal
of increased precision. Input coefficients and point predictions are both more precise. However,
the conclusions from the small sample are now reversed. In the large sample, unionism lowered
productivity by an average of 8 percent (according to the specification with the single binary
union variable), but there is little evidence of a union productivity effect related to mine size. If
anything, the union effect seems negatively related to mine size. 7 A joint test of the second-order terms that were not interacted with unionism gave F(15,522) =
14.25, p < 0.001. A joint test of the second-order terms that were interacted with unionism gave
F(15,522) = 1.50, p = 0.100. A joint test of all of the above terms gave F(30,522) = 8.89, p < 0.001.

14
5. Conclusions
In this study, I replicate Boal’s (1990) estimates of the effect of unionism on productivity
using his same panel of West Virginia coal mines in the early 1920s, and then re-estimate the
same production functions in a large panel covering many more mines and running from 1899
through 1925. Both panels measure output in physical terms, focus on a single industry at a low
level of aggregation, and feature many establishments (mines) changing union status but not all
simultaneously, so they would seem to promise credible estimates.
Re-estimation of Boal’s (1990) production functions using his original panel data set,
with minor improvements to the specification and estimation method, yields quite similar
conclusions. A negative effect of unionism on productivity at small mines is found again, along
with a possible positive effect at large mines, though neither effect is statistically significant.
Estimation of the same production functions using the large panel produces more precise
estimates, as hoped, but quite different conclusions. The estimated effect of unionism on
productivity is actually positive at small mines. If anything, the union effect is negatively related
to mine size. There is no evidence in the large panel of “economies of scale in labor relations.”
In view of the large standard errors for the small-panel estimates, perhaps Boal’s (1990) results
were driven by sampling variation.

15
References
Boal, William M. 1994. "Estimates of Unionism in West Virginia Coal, 1900-1935." Labor
History, 35(3), 429-41.
____. 1990. "Unionism and Productivity in West Virginia Coal Mining." Industrial and Labor
Relations Review, 43(4), 390-405.
Brown, Charles and James Medoff. 1978. "Trade Unions in the Production Process." Journal of
Political Economy, 86(3), 355-78.
Corbin, David Alan. 1981. Life, Work, and Rebellion in the Coal Fields: The Southern West
Virginia Miners, 1880-1922. Urbana: University of Illinois Press.
Doucouliagos, Christos and Patrice Laroche. 2003. "What Do Unions Do to Productivity? A
Meta-Analysis." Industrial Relations, 42(4), 650-91.
Dubofsky, Melvyn and Warren Van Tine. 1977. John L. Lewis: A Biography. New York:
Quadrangle/The New York Times Book Co.
Fisher, Waldo E. and Anne Bezanson. 1932. Wage Rates and Working Time in the Bituminous
Coal Industry, 1912-1922. Philadelphia: University of Pennsylvania Press.
Freeman, Richard B. 1984. "Longitudinal Analyses of the Effects of Trade Unions." Journal of
Labor Economics, 2(1), 1-26.
Lewis, H. Gregg. 1986. Union Relative Wage Effects: A Survey. Chicago: University of Chicago
Press.
Lunt, Richard D. 1979. Law and Order Vs. The Miners: West Virginia, 1907-1933. Hamden, CT:
Archon Books.
MaCurdy, Thomas E. 1982. "The Use of Time Series Processes to Model the Error Structure of
Earnings in a Longitudinal Data Analysis." Journal of Econometrics, 18(1), 838-114.
Mooney, Fred. 1967. Struggle in the Coal Fields: The Autobiography of Fred Mooney.
Morgantown: West Virginia University Press.
Pencavel, John H. 1977. "The Distribution and Efficiency Effects of Trade Unions in Britain."
British Journal of Industrial Relations, 15(2), 137-56.
West Virginia Department of Mines. "Annual Report," Charleston: Tribune Printing Company,
various issues.

16
Appendix A: Data sources for large panel
The large panel data set was assembled to measure the influence of the United Mine
Workers on various aspects of West Virginia coal mining in the early twentieth century. The
union status of as many West Virginia mines for as many years as possible was determined by
collecting references to mines in various sources: union and operator documents, periodicals,
Congressional hearings, books, etc. For this study, a mine was defined as unionized in a
particular year if sources indicated that it was covered by a signed contract with the UMWA.
Mines operating under informal agreements, contracts with company unions, or contracts with
the Fuel Administration during the First World War were counted as nonunion. Thus the
measure of unionism is coverage, not membership.
In any given year, the union status could be determined for only about one-quarter of
West Virginia mines. Sometimes the union status of a particular mine could be determined for
some years and not others. Observations were dropped from the analysis if union status could
not be determined with certainty or if union status changed in the middle of the year.
For those mines whose union status could be identified, other data were then collected
from the Annual Report of the West Virginia Department of Mines. Coal output, miners, other
workers, mining machines, locomotives, horses and mules, and days of operation are given by
the Annual Report at the mine level from 1899 through 1925. The data are reported for fiscal
years ending June 30 through 1924, and for calendar years in 1925. Coal output is reported by
the Annual Report in long tons (2240 lbs.) through 1923 and in net tons (2000 lbs.) thereafter, so
I converted the earlier years to net tons.
Construction of a long panel was hindered by the fact that the Annual Report used no
permanent identifiers for mines in this period. Sometimes a mine could not be confidently
matched across successive Annual Reports, most likely because the mine did not operate in all

17
periods but perhaps because its name changed. The data set, sources for union status, and a list
of mine names are available by request.

18
Table 1. Descriptive statistics of small panel of West Virginia coal mines
Variable Mean Std Dev Min Median Max Coal output (net tons) 135196.7 116997.3 1191 102548.8 614476 Miners 85.8 63.4 0 70.0 500 Other workers 81.7 65.3 4 63.0 365 Total workers 167.5 122.9 10 138.5 622 Mining machines 6.4 5.3 0 5.0 39 Mine locomotives 7.2 6.3 0 5.0 40 Horses and mules 9.4 11.1 0 6.0 58 Days of operation 173.7 66.6 4 176.5 311 Unionism 0.419 0.494 0 0.0 1
SOURCE: Unionism—author's tabulations. Other variables—West Virginia Department of
Mines, Annual Report, various issues.
Number of mine x year observations = 332. Data are balanced: 83 mines over 4 years: 1920,
1923, 1924, 1925. All mines changed union status exactly once, from union to nonunion.

19
Table 2. Estimates of production function with original specification
(i) (ii) (iii) Log (miners × days of operation) 0.2723 *** 0.2003 * 0.2981 *** (0.0746) (0.0802) (0.0623)
Log (other workers × days) 0.3850 *** 0.4150 *** 0.3244 *** (0.0850) (0.0896) (0.0775)
Log (mining machines × days) 0.0086 0.0515 0.0304 (0.0215) (0.0508) (0.0498)
Log (mine locomotives × days) 0.0207 0.0222 0.0200 (0.0160) (0.0197) (0.0190)
Log (horses and mules × days) -0.0009 -0.0012 0.0000 (0.0072) (0.0071) (0.0066)
Log (days of operation) -0.1889 0.0266 -0.6717 (0.5292) (0.4463) (0.3477)
Log (days of operation), squared 0.0348 0.0103 0.0898 ** (0.0545) (0.0458) (0.0345)
Mine unionized (binary variable) 0.0383 -0.9346 *** -7.8356 *** (0.0582) (0.2512) (1.2663)
Interactions with unionism:
U × log (miners days of operation) 0.1550 0.1518 (0.1007) (0.0907)
U × log (other workers × days) -0.0178 0.0607 (0.1045) (0.0965)
U × log (mining machines × days) -0.0387 -0.0341 (0.0464) (0.0444)
U × log (mine locomotives × days) -0.0033 -0.0111 (0.0290) (0.0234)
U × log (horses and mules × days) -0.0016 -0.0063 (0.0091) (0.0093)

20
U × log (days of operation) 2.9422 *** (0.5302)
U × log (days of operation),
-0.3367 *** squared (0.0601)
Small panel with 83 mines and 332 observations. Mine and year effects included. Cluster-
robust standard errors in parentheses. * indicates estimate is significantly different from zero at
5%. ** indicates estimate is significantly different from zero at 1%. *** indicates estimate is
significantly different from zero at 0.1%.

21
Table 3. Estimates of production function, inputs not multiplied by days
(i) (ii) (iii) (iv) Panel data set Small Small Large Large Number of mines 83 83 523 523 Number of observations 332 332 5960 5960 Log (miners) 0.3176 *** 0.3292 *** 0.4844 *** 0.4820 *** (0.0746) (0.0634) (0.0354) (0.0421)
Log (other workers) 0.3548 *** 0.3267 *** 0.3364 *** 0.3350 *** (0.0847) (0.0756) (0.0294) (0.0343)
Log (mining machines) 0.0308 0.0390 0.0552 *** 0.0598 *** (0.0446) (0.0660) (0.0151) (0.0162)
Log (mine locomotives) 0.0953 0.0559 0.1244 ** 0.1398 ** (0.0645) (0.0574) (0.0172) (0.0195)
Log (horses and mules) 0.0379 0.01726 0.0309 ** 0.0388 ** (0.0251) (0.0230) (0.0113) (0.0122)
Log (days of operation) 0.6402 0.2333 1.7129 *** 1.9511 *** (0.4649) (0.2730) (0.1959) (0.4815)
Log (days of operation), 0.0194 0.0645 * -0.1013 *** -0.1309 ** squared (0.0495) (0.0303) (0.0204) (0.0485)
First observation of each -0.3163 *** -0.3213 *** mine (binary variable) (0.0274) (0.0281)
Mine unionized (binary 0.0280 -7.1043 *** -0.0809 *** 1.0274 variable) (0.0583) (1.2788) (0.0204) (1.2746)
Interactions with unionism:
U × log (miners) 0.1291 0.0052 (0.0958) (0.0440)
U × log (other workers) 0.0547 0.0096 (0.0992) (0.0419)
U × log (mining -0.0397 -0.0237 machines) (0.0535) (0.0269)

22
U × log (mine 0.0061 -0.0478 locomotives) (0.0623) (0.0248)
U × log (horses and -0.0075 -0.0189 mules) (0.0307) (0.0172)
U × log (days of 2.8267 *** -0.5921 operation) (0.5366) (0.5150)
U × log (days of -0.3062 *** 0.0755 operation), squared (0.0605) (0.0520)
Mine and year effects included. Cluster-robust standard errors in parentheses. * indicates
estimate is significantly different from zero at 5%. ** indicates estimate is significantly different
from zero at 1%. *** indicates estimate is significantly different from zero at 0.1%.

23
Table 4. Descriptive statistics of large panel of West Virginia coal mines
Variable Mean Std Dev Min Median Max Coal output (net tons) 135850.5 119296.1 324.8 101615.9 1383285 Miners 72.9 56.9 0 60.0 912 Other workers 72.3 59.7 0 54.0 543 Total workers 145.2 107.8 1 116.0 1340 Mining machines 4.4 4.6 0 4.0 78 Mine locomotives 3.7 4.0 0 2.0 40 Horses and mules 11.5 11.6 0 8.0 99 Days of operation 202.0 64.5 4 210.0 365 Unionism 0.336 0.472 0 0.0 1
SOURCE: Unionism—author's tabulations. Other variables—West Virginia Department of
Mines, Annual Report, various issues.
Number of mine x year observations = 5960. Data are unbalanced: 523 mines over 27 years:
1899-1925.

24
Figure 1.
SOURCE: Boal (1994).
0%
10%
20%
30%
40%
50%
60%
1900
1901
1902
1903
1904
1905
1906
1907
1908
1909
1910
1911
1912
1913
1914
1915
1916
1917
1918
1919
1920
1921
1922
1923
1924
1925
1926
1927
Percent of West Virginia tonnage mined under union contract
25
Figure 2.
Union effect is measured as difference in logarithms. Dotted lines delimit 95% confidence
intervals.
SOURCE: Panel (a) computed from estimates reported in table 3 column (ii). Panel (b)
computed from translog estimates described in text.
-40%-30%-20%-10%
0%10%20%30%40%
0 10 20 30 40 50 60 70 80 90 100
Uni
on e
ffec
t
Mine size (percentile of sample)
(a) Effect of union on productivity by mine size in small panel, Cobb Douglas function
-40%-30%-20%-10%
0%10%20%30%40%
0 10 20 30 40 50 60 70 80 90 100
Uni
on e
ffec
t
Mine size (percentile of sample)
(b) Effect of union on productivity by mine size in large panel, translog function

26
Figure 3.
SOURCE: Union and nonunion observations: author’s tabulations. Total observations: West
Virginia Department of Mines, Annual Report.
0200400600800
10001200140016001800
1899
1900
1901
1902
1903
1904
1905
1906
1907
1908
1909
1910
1911
1912
1913
1914
1915
1916
1917
1918
1919
1920
1921
1922
1923
1924
1925
Mines in large panel of West Virginia coal, by year and union status
Union observations Nonunion observations Not in sample

27
Figure 4.
Union effect is measured as difference in logarithms. Dotted lines delimit 95% confidence
intervals.
SOURCE: Panel (a) computed from estimates reported in table 3 column (iv). Panel (b)
computed from translog estimates described in text.
-40%-30%-20%-10%
0%10%20%30%40%
0 10 20 30 40 50 60 70 80 90 100
Uni
on e
ffec
t
Mine size (percentile of sample)
(a) Effect of union on productivity by mine size in large panel, Cobb-Douglas function
-40%-30%-20%-10%
0%10%20%30%40%
0 10 20 30 40 50 60 70 80 90 100
Uni
on e
ffec
t
Mine size (percentile of sample)
(b) Effect of union on productivity by mine size in large panel, translog function