Unified Software Project Management Using Rational ... Software Project Management Using Rational...
44
Unified Software Project Management Using Rational ProjectConsole to Collect Microsoft Project Metrics By: Paul R. Wyrick Rational Software White paper TP 179, 02/02
Transcript of Unified Software Project Management Using Rational ... Software Project Management Using Rational...
Unified Software Project Management Using Rational ProjectConsole to Collect Microsoft Project Metrics
By: Paul R. Wyrick
Rational Software White paper TP 179, 02/02
Table of Contents
Introduction.............................................................................................................................................................................. 1
Traditional Metrics using Microsoft Project ........................................................................................................................... 1 Project Summary Report ....................................................................................................................................................... 2 Task Entry Report ................................................................................................................................................................. 3 Quantitative Risk Analysis Report ........................................................................................................................................ 4 Cost Variance Report ............................................................................................................................................................ 5 Schedule Variance Report ..................................................................................................................................................... 6 Work Hours Variance Report................................................................................................................................................ 7 Task Schedule Report............................................................................................................................................................ 8 Task Summary Report........................................................................................................................................................... 9 Task Tracking Report.......................................................................................................................................................... 10 Resource Sheet .................................................................................................................................................................... 11 Resource Allocation Report ................................................................................................................................................ 12 Earned Value Report ........................................................................................................................................................... 13
Incorporating MS Project Metrics Reporting into Rational ProjectConsole ....................................................................... 14 Current Limitations of MS Project Metrics Reporting with ProjectConsole ....................................................................... 14 Creating Microsoft Project Web Reports in ProjectConsole............................................................................................... 15 Creating Microsoft Project Metrics Charts & Graphs in ProjectConsole............................................................................ 16
Sample MS Project Metrics using ProjectConsole................................................................................................................ 17 ProjectConsole Web Reports .............................................................................................................................................. 18
Task Entry Web Report ................................................................................................................................................... 18 Cost Variance Web Report .............................................................................................................................................. 19 Schedule Variance Web Report....................................................................................................................................... 20 Late Tasks Web Report.................................................................................................................................................... 21 Milestone Tasks Web Report ........................................................................................................................................... 22 Late Milestone Tasks Web Report ................................................................................................................................... 22 Work Hours Variance Web Report.................................................................................................................................. 23 Task Summary Web Report ............................................................................................................................................. 24 Task Tracking Web Report .............................................................................................................................................. 25 Task Assignment Web Report .......................................................................................................................................... 26 Earned Value Web Report............................................................................................................................................... 27
Microsoft Project Trend Reports......................................................................................................................................... 28 Actual vs. Budgeted Costs Trend Analysis Report .......................................................................................................... 28 Actual vs. Planned Duration Trend Analysis Report ...................................................................................................... 29 Actual vs. Planned Work Hours Trend Analysis Report ................................................................................................. 30 Actual Cost of Work Performed vs. Budgeted Cost of Work Performed Trend Analysis Report .................................... 31 Budgeted Cost of Work Planned vs. Budgeted Cost of Work Scheduled Trend Analysis Report .................................... 32 Earned Value vs. Budgeted Cost Trend Analysis Report ................................................................................................ 33 Completed Milestones by Collection Date Trend Analysis Report ................................................................................. 34 Completed Milestones by Baseline Finish Date Trend Analysis Report ......................................................................... 35 Completed Milestone Tasks Trend Analysis Report ........................................................................................................ 36 Number of Tasks vs. Completed Tasks Trend Analysis Report ....................................................................................... 37 Late Tasks Trend Analysis Report................................................................................................................................... 38 Late Milestone Tasks Trend Analysis Report .................................................................................................................. 39
Summary................................................................................................................................................................................. 40
References .............................................................................................................................................................................. 41

Unified Software Project Management Using Rational ProjectConsole to Collect Microsoft Project Metrics
1
Introduction
This document has been written for Rational ProjectConsole end-users to help them incorporate Microsoft Project data into a data collection and then be able to automatically generate ongoing up-to-date project progress metrics reports, charts and graphs. Stakeholders want easy accessibility to project progress information and are interested in reviewing metrics that indicate that the rate of newly identified work is declining as the end of the project approaches. Based on where a project stands at any given point in time, there are different data points to see the status of the project. This paper provides a sampling of key project metrics reports, charts and graphs that can be derived from a MS Project plan.
Key Project Stakeholders include Upper Level Management, Department Managers, Project Managers, Product Managers, Development Managers, Technical Managers, and Project Team Members. All of these types of stakeholders want an easy and efficient way to gather and disseminate project team status and metrics information. Key Project Stakeholders are interested in going to a centralized location to view current project status metrics. Project Team Members want an efficient way to report current status to their managers and a centralized location where they can be kept up-to-date on current project status and where they can access current project artifacts.
The project tracking metrics shown in this paper are not meant to be comprehensive, but are meant to serve as an example of the types of metrics that can be generated using MS Project data with Rational ProjectConsole. As you become more comfortable with Rational ProjectConsole, you can expand upon this set of metrics. Our experience shows that you typically are much better off starting small and then expanding, rather than trying to adopt a large number of metrics from the beginning.
There are more possible measurable objects and attributes that come from MS Project than can be covered in this paper. Furthermore, each organization has distinct and different needs with regard to project progress tracking data. This white paper begins by presenting some basic project reporting metrics that are typically generated using Microsoft Project to monitor the ongoing progress of a project. Then, the process is explained on how to create an MS Project data collection using Rational ProjectConsole in order to generate a set of similar, but automatically updated, set of MS Project progress reports, graphs and charts. Finally, some sample metrics reports, charts and graphs are presented based on an MS Project data collection using ProjectConsole.
Traditional Metrics using Microsoft Project
This section describes and shows traditional types of metrics reports that are used to measure project progress using MS Project. Most Microsoft Project reports are printed in a table view format. The only exception to the table view is the printing of Gant and PERT/Network Diagram reports that reflect the project data seen in the more common table format reports. Traditional MS Project Metrics Reports include the Task Entry Report, the Task Cost Report, the Task Schedule Report, the Task Summary Report, the Task Tracking Report, the Task Schedule Variance Report, the Task Work Report, the Earned Value Report, the Project Summary Report, and a Quantitative Risk Analysis Report.
Unified Software Project Management Using Rational ProjectConsole to Collect Microsoft Project Metrics
2
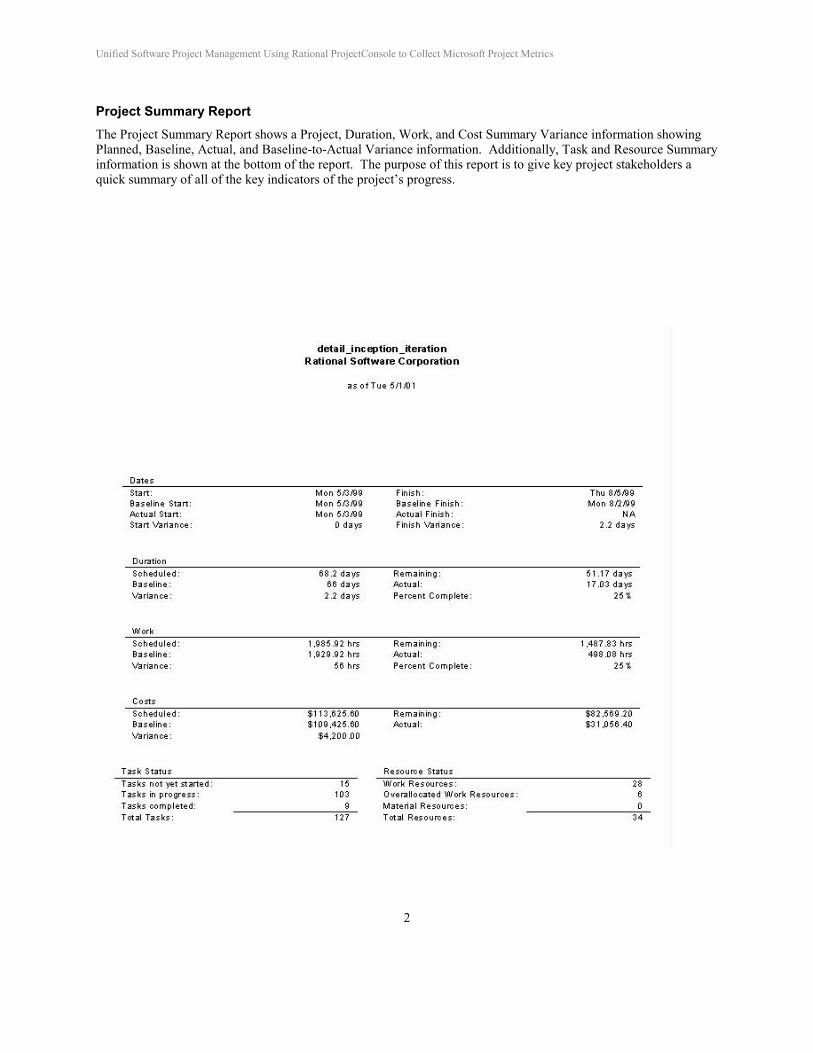
Project Summary Report The Project Summary Report shows a Project, Duration, Work, and Cost Summary Variance information showing Planned, Baseline, Actual, and Baseline-to-Actual Variance information. Additionally, Task and Resource Summary information is shown at the bottom of the report. The purpose of this report is to give key project stakeholders a quick summary of all of the key indicators of the project’s progress.
Unified Software Project Management Using Rational ProjectConsole to Collect Microsoft Project Metrics
3
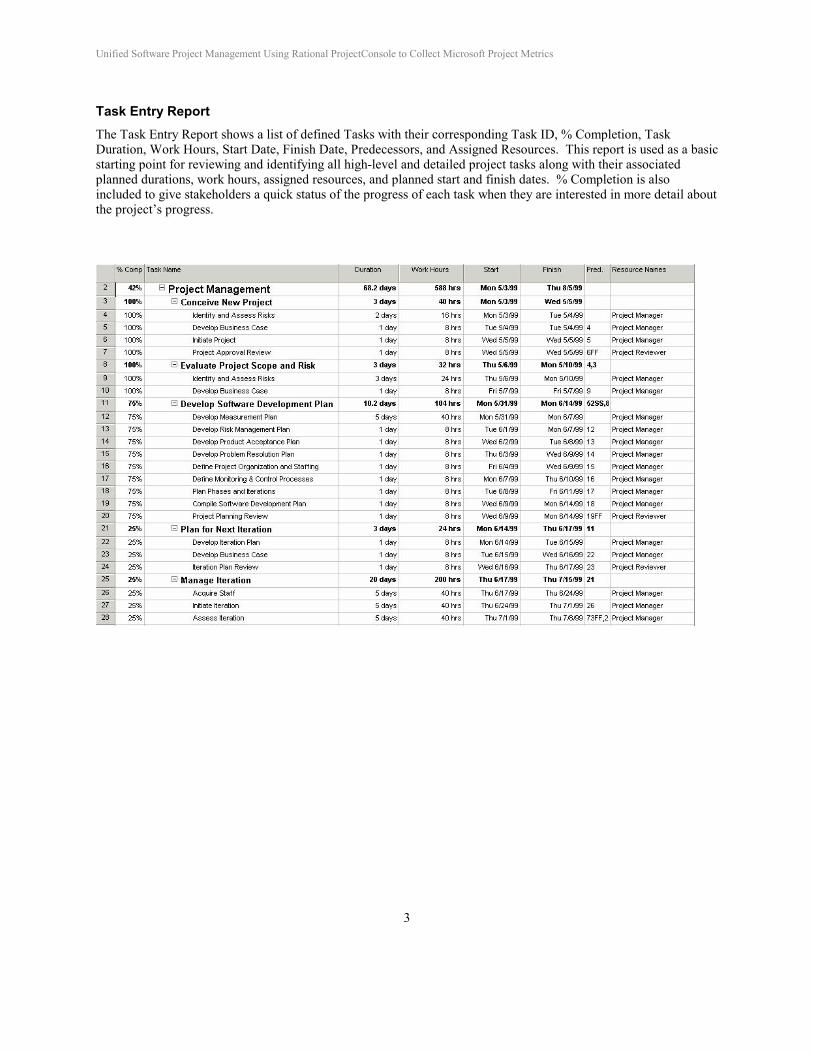
Task Entry Report The Task Entry Report shows a list of defined Tasks with their corresponding Task ID, % Completion, Task Duration, Work Hours, Start Date, Finish Date, Predecessors, and Assigned Resources. This report is used as a basic starting point for reviewing and identifying all high-level and detailed project tasks along with their associated planned durations, work hours, assigned resources, and planned start and finish dates. % Completion is also included to give stakeholders a quick status of the progress of each task when they are interested in more detail about the project’s progress.
Unified Software Project Management Using Rational ProjectConsole to Collect Microsoft Project Metrics
4
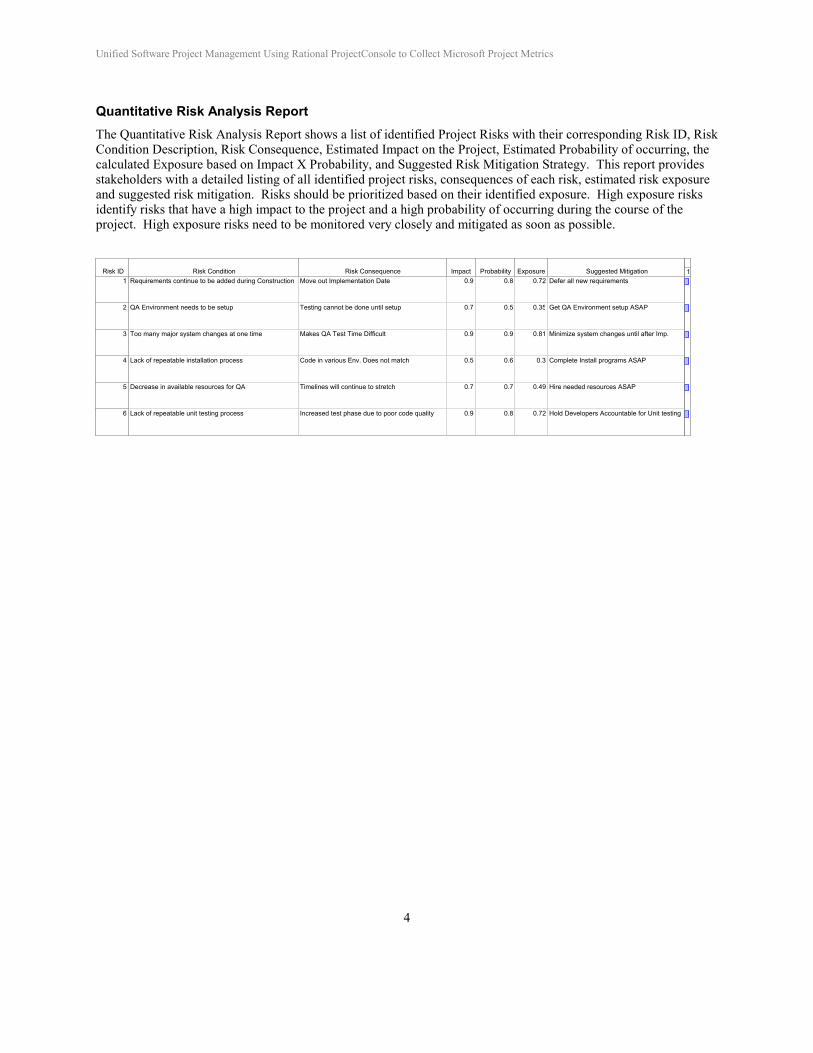
Quantitative Risk Analysis Report The Quantitative Risk Analysis Report shows a list of identified Project Risks with their corresponding Risk ID, Risk Condition Description, Risk Consequence, Estimated Impact on the Project, Estimated Probability of occurring, the calculated Exposure based on Impact X Probability, and Suggested Risk Mitigation Strategy. This report provides stakeholders with a detailed listing of all identified project risks, consequences of each risk, estimated risk exposure and suggested risk mitigation. Risks should be prioritized based on their identified exposure. High exposure risks identify risks that have a high impact to the project and a high probability of occurring during the course of the project. High exposure risks need to be monitored very closely and mitigated as soon as possible.
Risk ID Risk Condition Risk Consequence Impact Probability Exposure Suggested Mitigation1 Requirements continue to be added during Construction Move out Implementation Date 0.9 0.8 0.72 Defer all new requirements
2 QA Environment needs to be setup Testing cannot be done until setup 0.7 0.5 0.35 Get QA Environment setup ASAP
3 Too many major system changes at one time Makes QA Test Time Difficult 0.9 0.9 0.81 Minimize system changes until after Imp.
4 Lack of repeatable installation process Code in various Env. Does not match 0.5 0.6 0.3 Complete Install programs ASAP
5 Decrease in available resources for QA Timelines will continue to stretch 0.7 0.7 0.49 Hire needed resources ASAP
6 Lack of repeatable unit testing process Increased test phase due to poor code quality 0.9 0.8 0.72 Hold Developers Accountable for Unit testing
19
Unified Software Project Management Using Rational ProjectConsole to Collect Microsoft Project Metrics
5
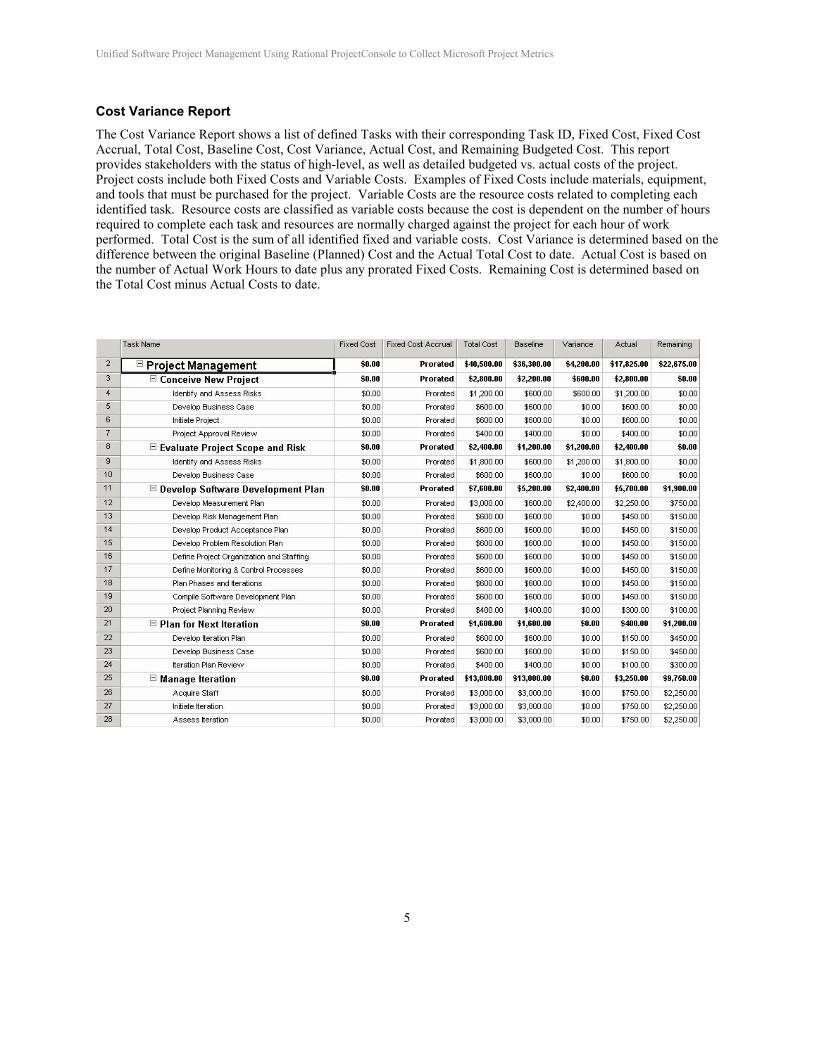
Cost Variance Report The Cost Variance Report shows a list of defined Tasks with their corresponding Task ID, Fixed Cost, Fixed Cost Accrual, Total Cost, Baseline Cost, Cost Variance, Actual Cost, and Remaining Budgeted Cost. This report provides stakeholders with the status of high-level, as well as detailed budgeted vs. actual costs of the project. Project costs include both Fixed Costs and Variable Costs. Examples of Fixed Costs include materials, equipment, and tools that must be purchased for the project. Variable Costs are the resource costs related to completing each identified task. Resource costs are classified as variable costs because the cost is dependent on the number of hours required to complete each task and resources are normally charged against the project for each hour of work performed. Total Cost is the sum of all identified fixed and variable costs. Cost Variance is determined based on the difference between the original Baseline (Planned) Cost and the Actual Total Cost to date. Actual Cost is based on the number of Actual Work Hours to date plus any prorated Fixed Costs. Remaining Cost is determined based on the Total Cost minus Actual Costs to date.
Unified Software Project Management Using Rational ProjectConsole to Collect Microsoft Project Metrics
6
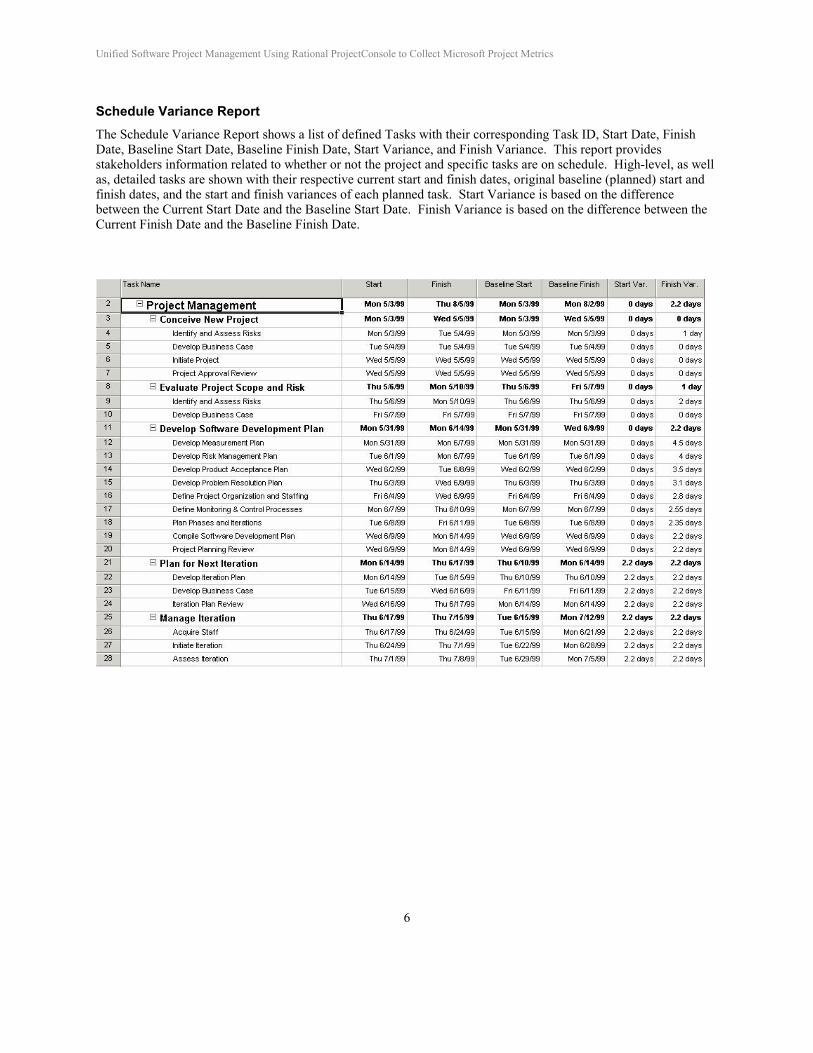
Schedule Variance Report The Schedule Variance Report shows a list of defined Tasks with their corresponding Task ID, Start Date, Finish Date, Baseline Start Date, Baseline Finish Date, Start Variance, and Finish Variance. This report provides stakeholders information related to whether or not the project and specific tasks are on schedule. High-level, as well as, detailed tasks are shown with their respective current start and finish dates, original baseline (planned) start and finish dates, and the start and finish variances of each planned task. Start Variance is based on the difference between the Current Start Date and the Baseline Start Date. Finish Variance is based on the difference between the Current Finish Date and the Baseline Finish Date.
Unified Software Project Management Using Rational ProjectConsole to Collect Microsoft Project Metrics
7
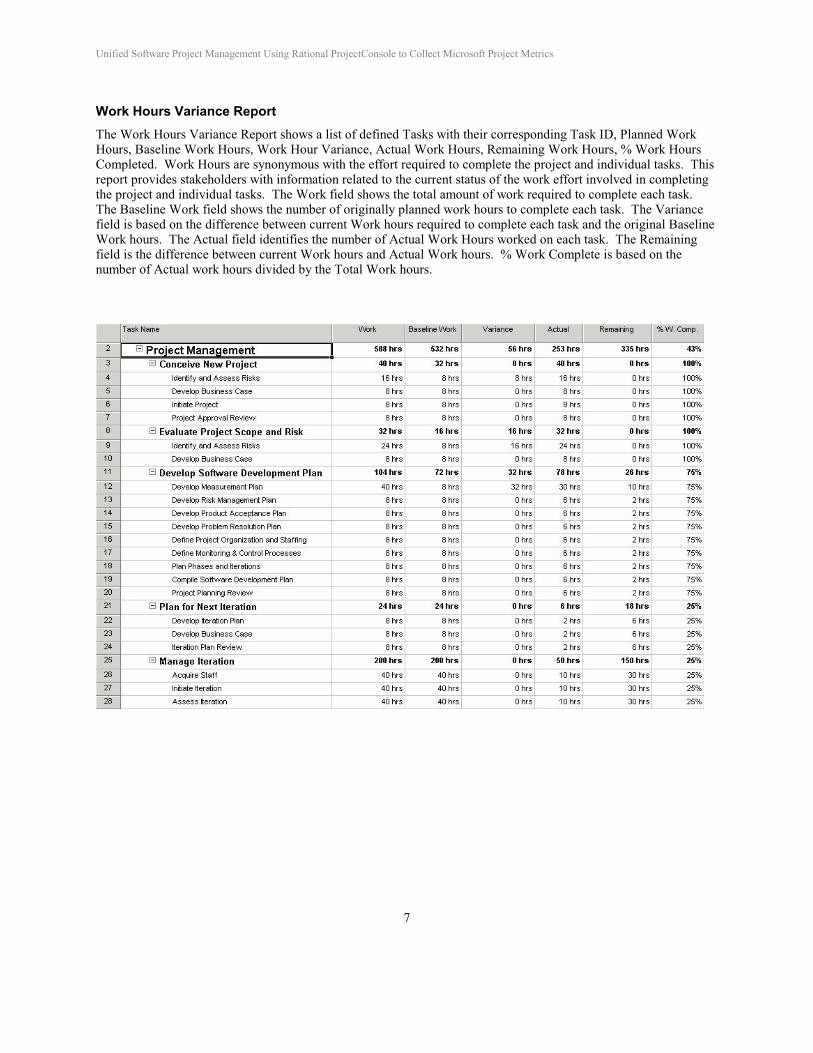
Work Hours Variance Report The Work Hours Variance Report shows a list of defined Tasks with their corresponding Task ID, Planned Work Hours, Baseline Work Hours, Work Hour Variance, Actual Work Hours, Remaining Work Hours, % Work Hours Completed. Work Hours are synonymous with the effort required to complete the project and individual tasks. This report provides stakeholders with information related to the current status of the work effort involved in completing the project and individual tasks. The Work field shows the total amount of work required to complete each task. The Baseline Work field shows the number of originally planned work hours to complete each task. The Variance field is based on the difference between current Work hours required to complete each task and the original Baseline Work hours. The Actual field identifies the number of Actual Work Hours worked on each task. The Remaining field is the difference between current Work hours and Actual Work hours. % Work Complete is based on the number of Actual work hours divided by the Total Work hours.
Unified Software Project Management Using Rational ProjectConsole to Collect Microsoft Project Metrics
8
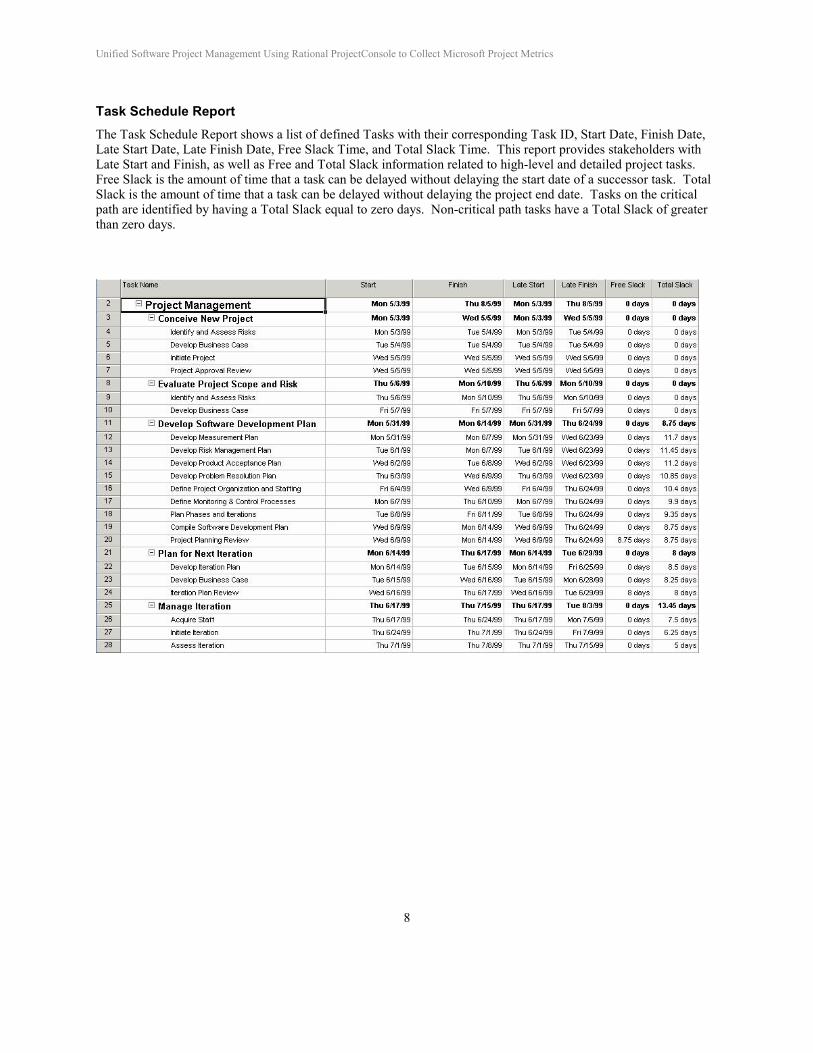
Task Schedule Report The Task Schedule Report shows a list of defined Tasks with their corresponding Task ID, Start Date, Finish Date, Late Start Date, Late Finish Date, Free Slack Time, and Total Slack Time. This report provides stakeholders with Late Start and Finish, as well as Free and Total Slack information related to high-level and detailed project tasks. Free Slack is the amount of time that a task can be delayed without delaying the start date of a successor task. Total Slack is the amount of time that a task can be delayed without delaying the project end date. Tasks on the critical path are identified by having a Total Slack equal to zero days. Non-critical path tasks have a Total Slack of greater than zero days.
Unified Software Project Management Using Rational ProjectConsole to Collect Microsoft Project Metrics
9
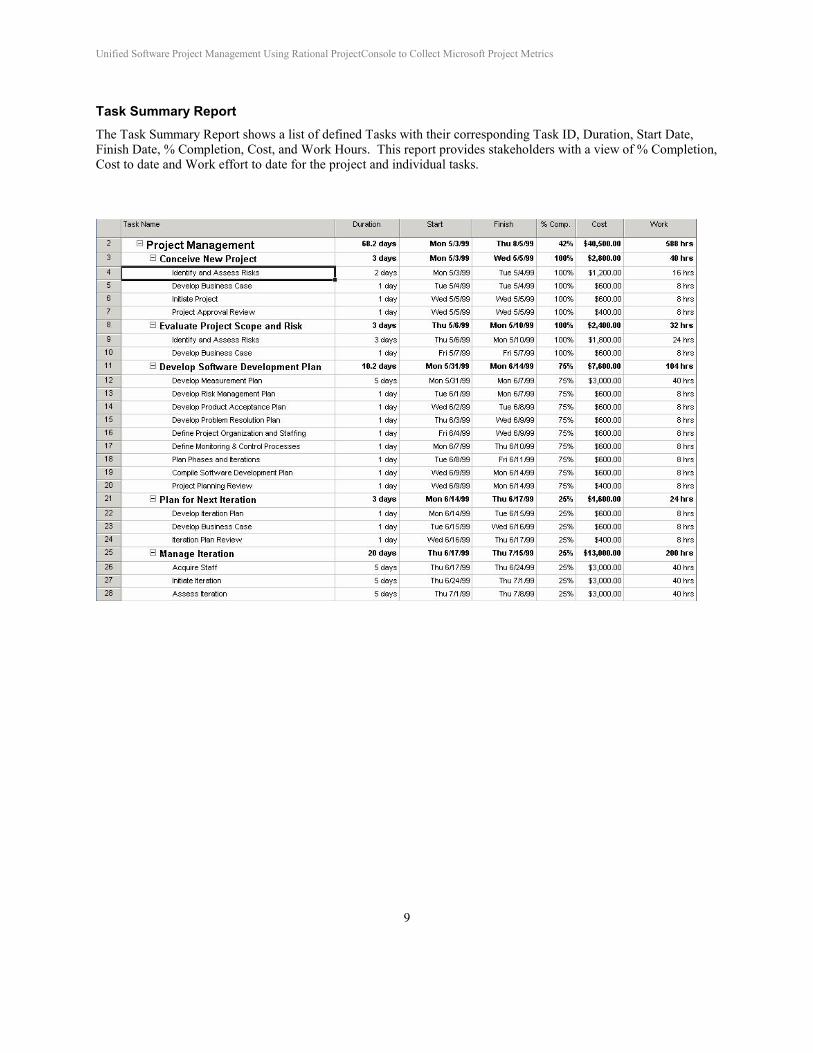
Task Summary Report The Task Summary Report shows a list of defined Tasks with their corresponding Task ID, Duration, Start Date, Finish Date, % Completion, Cost, and Work Hours. This report provides stakeholders with a view of % Completion, Cost to date and Work effort to date for the project and individual tasks.
Unified Software Project Management Using Rational ProjectConsole to Collect Microsoft Project Metrics
10
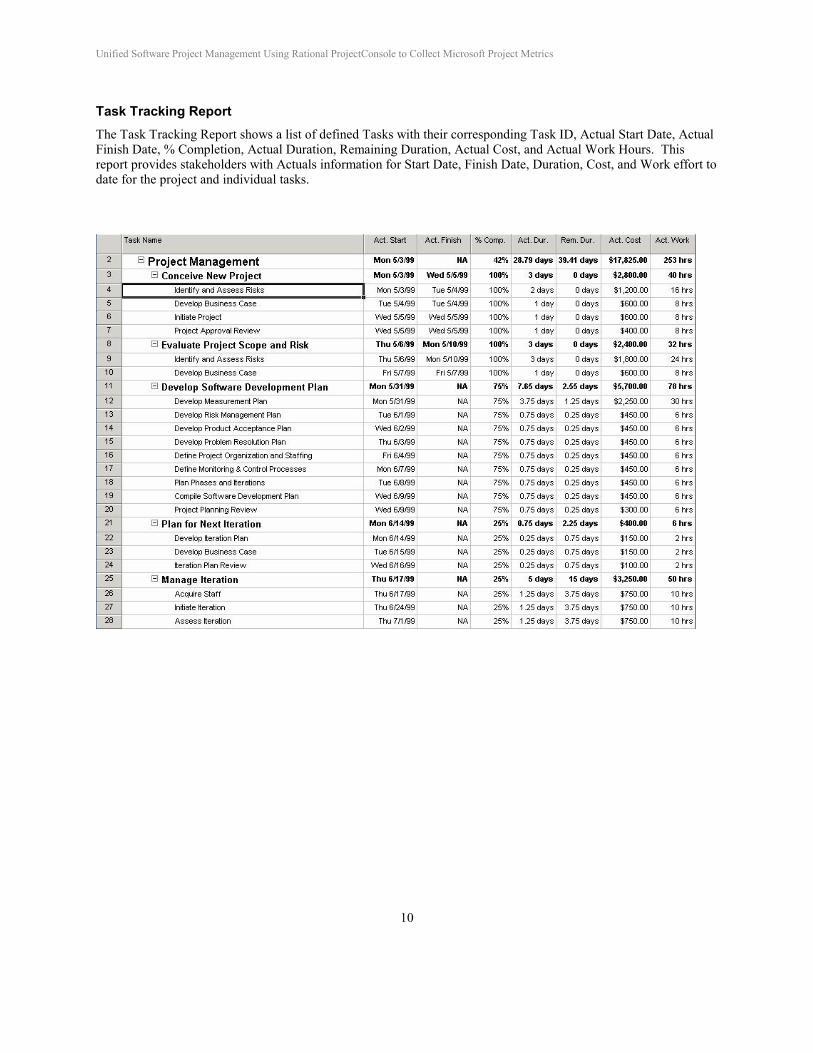
Task Tracking Report The Task Tracking Report shows a list of defined Tasks with their corresponding Task ID, Actual Start Date, Actual Finish Date, % Completion, Actual Duration, Remaining Duration, Actual Cost, and Actual Work Hours. This report provides stakeholders with Actuals information for Start Date, Finish Date, Duration, Cost, and Work effort to date for the project and individual tasks.
Unified Software Project Management Using Rational ProjectConsole to Collect Microsoft Project Metrics
11
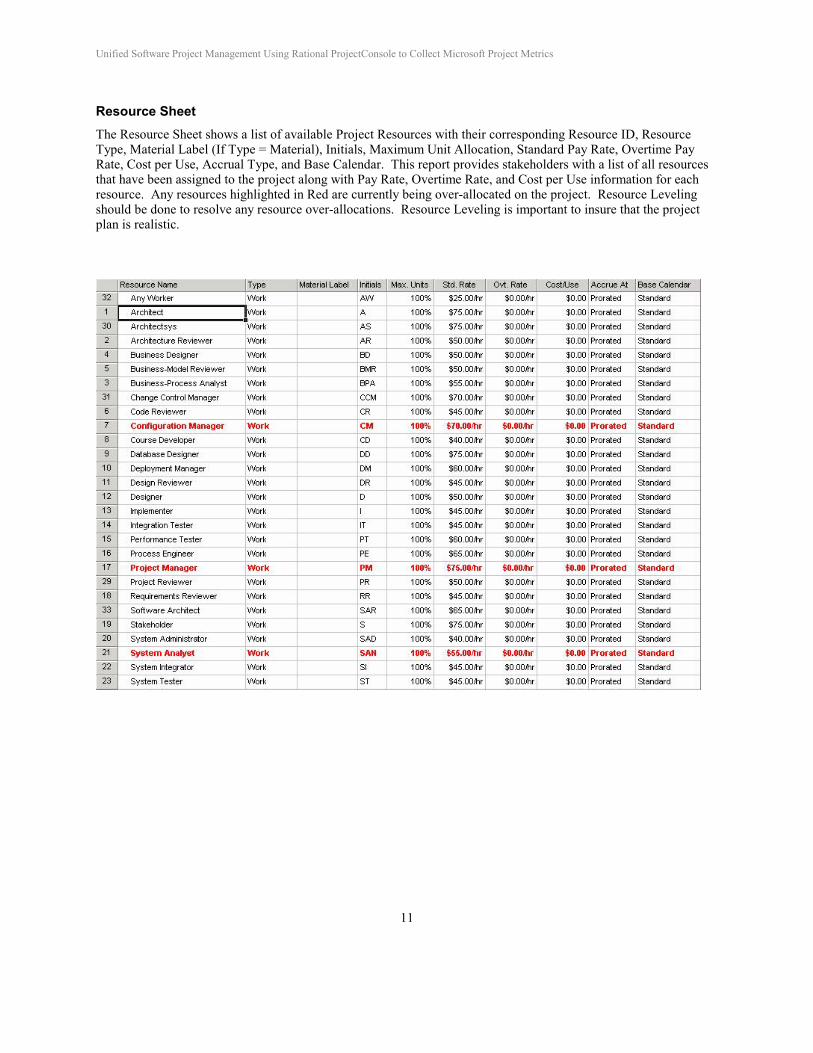
Resource Sheet The Resource Sheet shows a list of available Project Resources with their corresponding Resource ID, Resource Type, Material Label (If Type = Material), Initials, Maximum Unit Allocation, Standard Pay Rate, Overtime Pay Rate, Cost per Use, Accrual Type, and Base Calendar. This report provides stakeholders with a list of all resources that have been assigned to the project along with Pay Rate, Overtime Rate, and Cost per Use information for each resource. Any resources highlighted in Red are currently being over-allocated on the project. Resource Leveling should be done to resolve any resource over-allocations. Resource Leveling is important to insure that the project plan is realistic.
Unified Software Project Management Using Rational ProjectConsole to Collect Microsoft Project Metrics
12
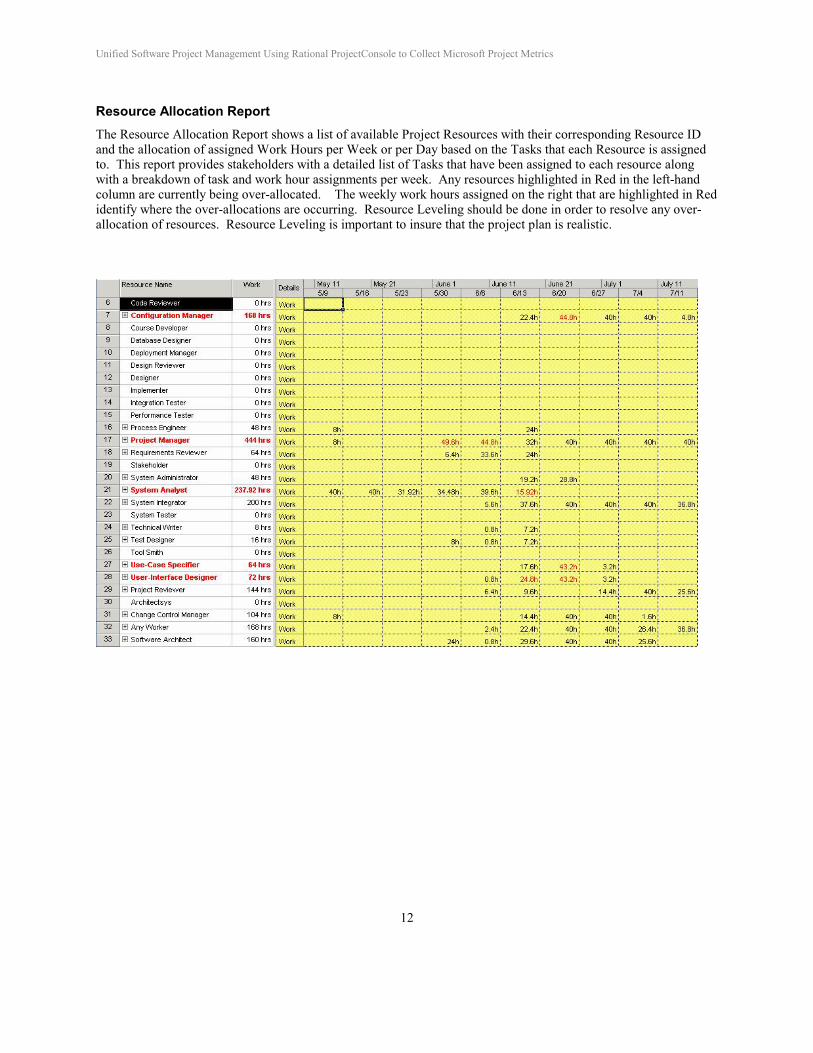
Resource Allocation Report The Resource Allocation Report shows a list of available Project Resources with their corresponding Resource ID and the allocation of assigned Work Hours per Week or per Day based on the Tasks that each Resource is assigned to. This report provides stakeholders with a detailed list of Tasks that have been assigned to each resource along with a breakdown of task and work hour assignments per week. Any resources highlighted in Red in the left-hand column are currently being over-allocated. The weekly work hours assigned on the right that are highlighted in Red identify where the over-allocations are occurring. Resource Leveling should be done in order to resolve any over-allocation of resources. Resource Leveling is important to insure that the project plan is realistic.
Unified Software Project Management Using Rational ProjectConsole to Collect Microsoft Project Metrics
13
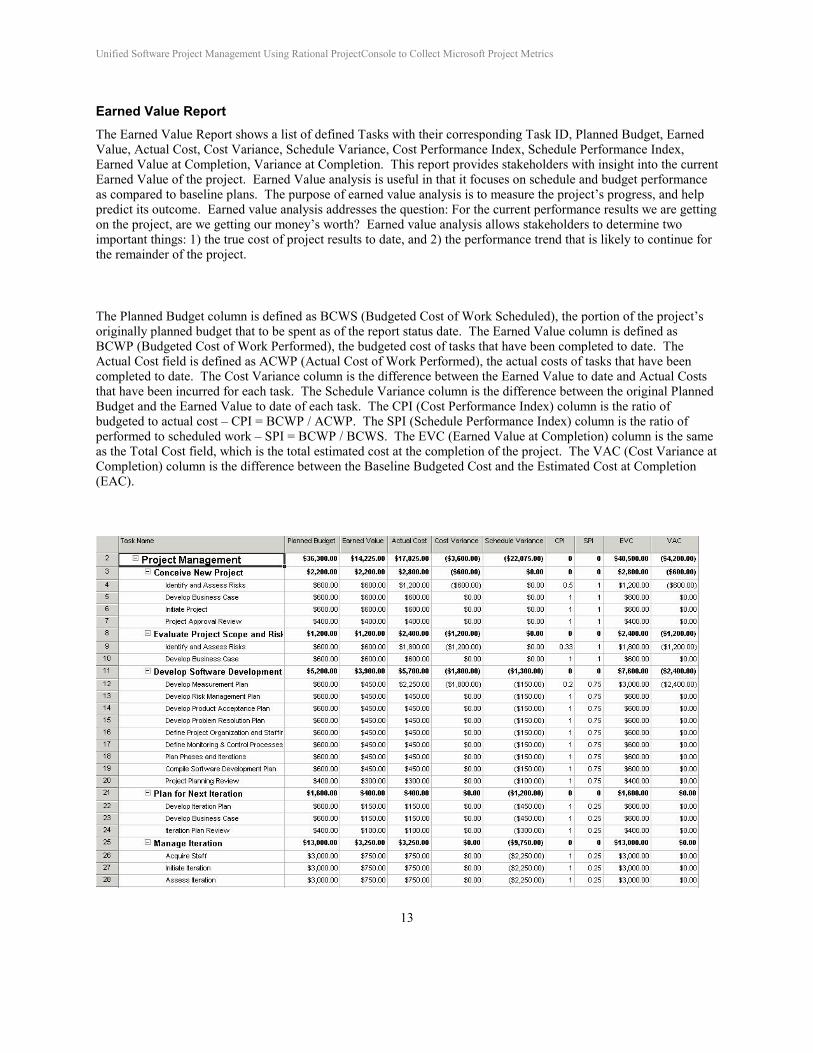
Earned Value Report The Earned Value Report shows a list of defined Tasks with their corresponding Task ID, Planned Budget, Earned Value, Actual Cost, Cost Variance, Schedule Variance, Cost Performance Index, Schedule Performance Index, Earned Value at Completion, Variance at Completion. This report provides stakeholders with insight into the current Earned Value of the project. Earned Value analysis is useful in that it focuses on schedule and budget performance as compared to baseline plans. The purpose of earned value analysis is to measure the project’s progress, and help predict its outcome. Earned value analysis addresses the question: For the current performance results we are getting on the project, are we getting our money’s worth? Earned value analysis allows stakeholders to determine two important things: 1) the true cost of project results to date, and 2) the performance trend that is likely to continue for the remainder of the project.
The Planned Budget column is defined as BCWS (Budgeted Cost of Work Scheduled), the portion of the project’s originally planned budget that to be spent as of the report status date. The Earned Value column is defined as BCWP (Budgeted Cost of Work Performed), the budgeted cost of tasks that have been completed to date. The Actual Cost field is defined as ACWP (Actual Cost of Work Performed), the actual costs of tasks that have been completed to date. The Cost Variance column is the difference between the Earned Value to date and Actual Costs that have been incurred for each task. The Schedule Variance column is the difference between the original Planned Budget and the Earned Value to date of each task. The CPI (Cost Performance Index) column is the ratio of budgeted to actual cost – CPI = BCWP / ACWP. The SPI (Schedule Performance Index) column is the ratio of performed to scheduled work – SPI = BCWP / BCWS. The EVC (Earned Value at Completion) column is the same as the Total Cost field, which is the total estimated cost at the completion of the project. The VAC (Cost Variance at Completion) column is the difference between the Baseline Budgeted Cost and the Estimated Cost at Completion (EAC).
Unified Software Project Management Using Rational ProjectConsole to Collect Microsoft Project Metrics
14
Incorporating MS Project Metrics Reporting into Rational ProjectConsole
This section describes the process for importing current MS Project data into a ProjectConsole Data Collection and then describe types of MS Project Metrics Charts, Graphs, and Indicators that can be automatically generated and published to a ProjectConsole website.
Current Limitations of MS Project Metrics Reporting with ProjectConsole Our experience with the initial version of ProjectConsole shows that there are some limitations that currently must be worked around in order to obtain the desired results. Over time, all of these limitations will be corrected in subsequent releases of the product.
Microsoft Project contains several custom Date (Date1 .. Date10), Number (Number1 .. Number10), and Cost (Cost1 .. Cost10) fields. Currently, these custom fields are not contained with the Microsoft Project RSE Adapter, and therefore, reports, graphs, and charts cannot be created in ProjectConsole that include these fields. If custom fields are not being used in Microsoft Project, then this would not be an issue.
Unified Software Project Management Using Rational ProjectConsole to Collect Microsoft Project Metrics
15
Creating Microsoft Project Web Reports in ProjectConsole To create Microsoft Project Web Reports using ProjectConsole, the following steps must be performed:
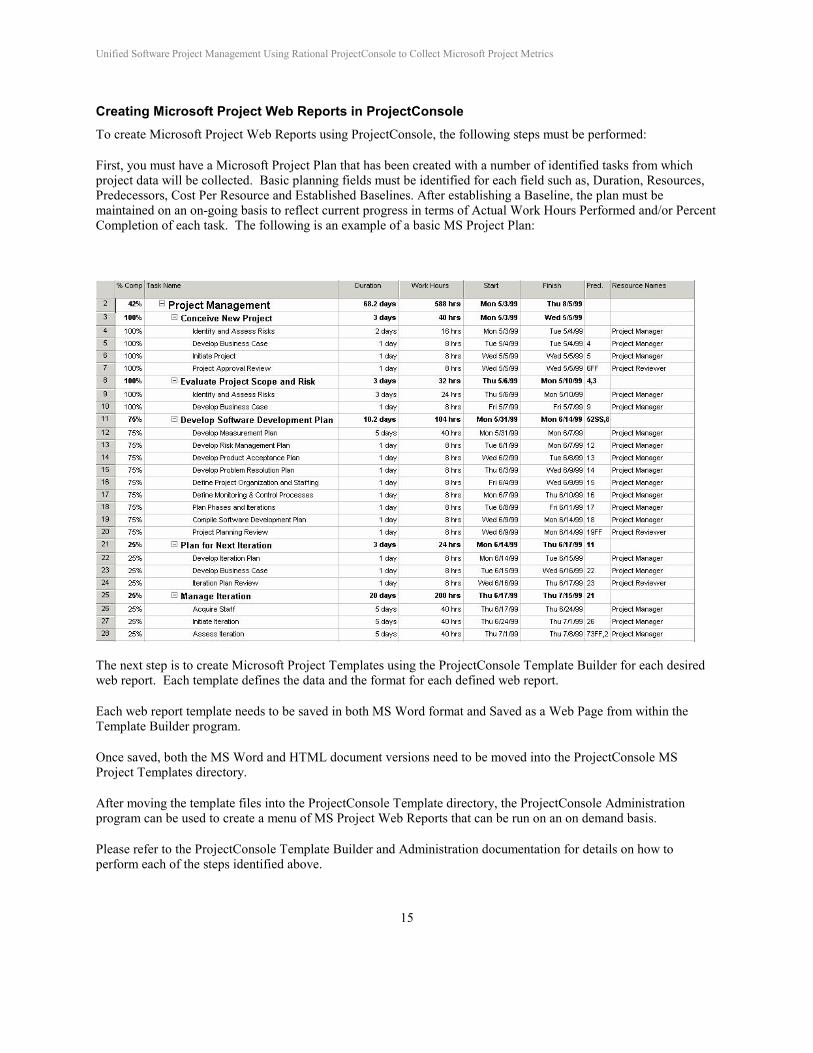
First, you must have a Microsoft Project Plan that has been created with a number of identified tasks from which project data will be collected. Basic planning fields must be identified for each field such as, Duration, Resources, Predecessors, Cost Per Resource and Established Baselines. After establishing a Baseline, the plan must be maintained on an on-going basis to reflect current progress in terms of Actual Work Hours Performed and/or Percent Completion of each task. The following is an example of a basic MS Project Plan:
The next step is to create Microsoft Project Templates using the ProjectConsole Template Builder for each desired web report. Each template defines the data and the format for each defined web report.
Each web report template needs to be saved in both MS Word format and Saved as a Web Page from within the Template Builder program.
Once saved, both the MS Word and HTML document versions need to be moved into the ProjectConsole MS Project Templates directory.
After moving the template files into the ProjectConsole Template directory, the ProjectConsole Administration program can be used to create a menu of MS Project Web Reports that can be run on an on demand basis.
Please refer to the ProjectConsole Template Builder and Administration documentation for details on how to perform each of the steps identified above.
Unified Software Project Management Using Rational ProjectConsole to Collect Microsoft Project Metrics
16
Creating Microsoft Project Metrics Charts & Graphs in ProjectConsole To create metrics charts and graphs based on Microsoft Project data, a data collection must first be generated. To run a Microsoft Project data collection with ProjectConsole the following steps must be performed:
First, you must have a Microsoft Project Plan that has been created with a number of identified tasks from which project data will be collected. Basic planning fields must be identified for each task such as, Duration, Resources, Predecessors, Cost Per Resource and Established Baselines. After establishing a Baseline, the plan must be maintained on an on-going basis to reflect current progress in terms of Actual Work Hours Performed and/or Percent Completion of each task.
Next, use ProjectConsole Dashboard Designer to create a Microsoft Project Source Template defining all of the desired Microsoft Project fields to be collected.
Define the desired Dimension and Measure tables in which data is to be collected.
Define the data mappings from the created Dimension and Measure tables to the Source Template fields.
Create a Scheduled Collection Task.
Run the Scheduled Collection Task.
Don’t forget to run the post collection data conversion script.
After an MSP Data Collection has been created, the ProjectConsole Dashboard can be used to create the desired Charts and Graphs based on the data that has been collected from the Microsoft Project plan.
Please refer to the ProjectConsole Dashboard Designer, Dashboard, and Administration documentation for details on how to perform each of the steps identified above.
Unified Software Project Management Using Rational ProjectConsole to Collect Microsoft Project Metrics
17
Sample MS Project Metrics using ProjectConsole
This section describes and shows a wide range of sample MS Project trend analysis metrics reports that can be generated using ProjectConsole.
ProjectConsole can be used to produce either current Microsoft Project Web Based Reports, which represent the status of the project at any point in time, or Graphical Trend Analysis and Distribution Charts that show the progress of selected project metrics over a period of time.
To produce the desired web based reports, templates are created using the ProjectConsole Template Builder. To produce the desired graphs and charts a data collection source template must be created using the Dashboard Designer component of ProjectConsole.
The difference between these two types of templates is that the ProjectConsole Template Builder creates templates to read data from the Microsoft Project file and produce a formatted report. Whereas, the Dashboard Designer Source Template creates a template to read data from a Microsoft Project file and puts the data into a data collection database from which the ProjectConsole Dashboard can use to generate Charts and Graphs based on the collected data.
Examples of current Web Based Reports representing any given point in time include Task Entry Reports, Work Hours Variance Reports, Task Summary Reports, Task Tracking Reports, Task Assignment by Resource Reports, Cost Variance Reports, Earned Value Reports, Late Tasks Reports, Schedule Variance Reports, Late Milestone Tasks Reports, and Milestone Tasks Reports.
Examples of Graphical Trend Analysis and Distribution Charts representing the progress of the project over time include trends of Actual Work Hours vs. Planned Work Hours, Actual Cost vs. Budgeted Cost, % Completion over Time, Actual Duration vs. Planned Duration, Earned Value vs. Budgeted Cost, Actual Cost of Work Performed vs. Budgeted Cost of Work Performed, and Budgeted Cost of Work Performed vs. Budgeted Cost of Work Scheduled.
Unified Software Project Management Using Rational ProjectConsole to Collect Microsoft Project Metrics
18
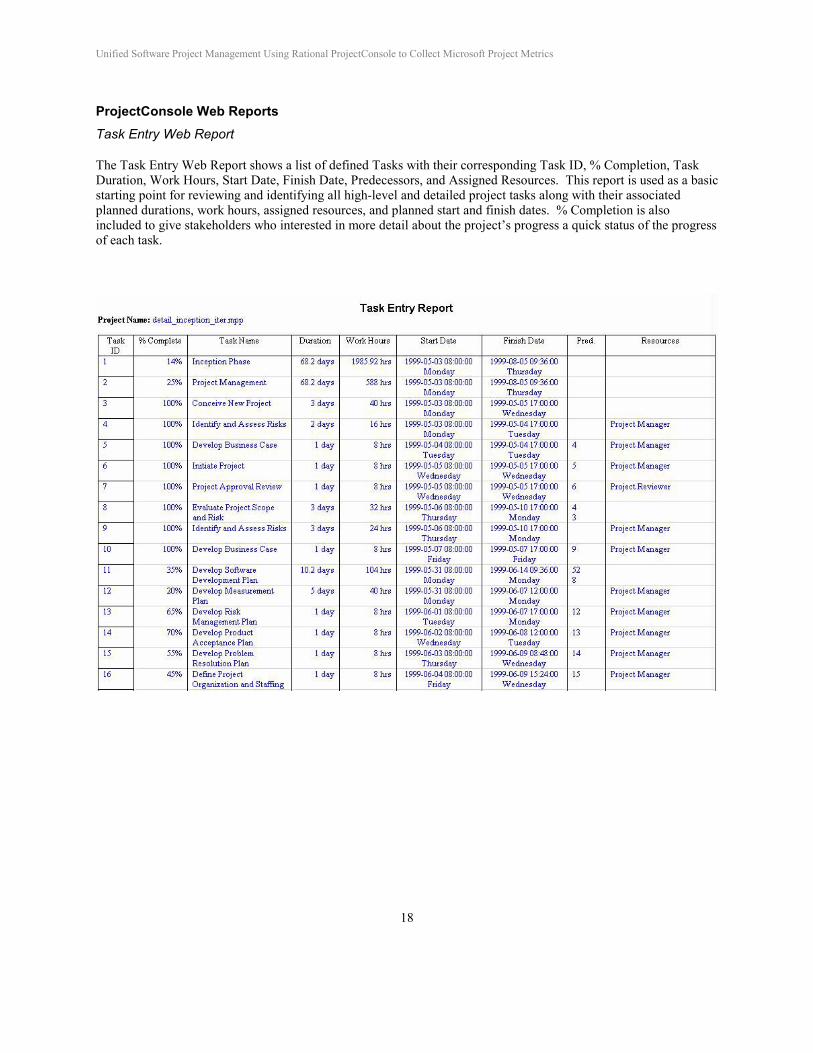
ProjectConsole Web Reports Task Entry Web Report
The Task Entry Web Report shows a list of defined Tasks with their corresponding Task ID, % Completion, Task Duration, Work Hours, Start Date, Finish Date, Predecessors, and Assigned Resources. This report is used as a basic starting point for reviewing and identifying all high-level and detailed project tasks along with their associated planned durations, work hours, assigned resources, and planned start and finish dates. % Completion is also included to give stakeholders who interested in more detail about the project’s progress a quick status of the progress of each task.
Unified Software Project Management Using Rational ProjectConsole to Collect Microsoft Project Metrics
19
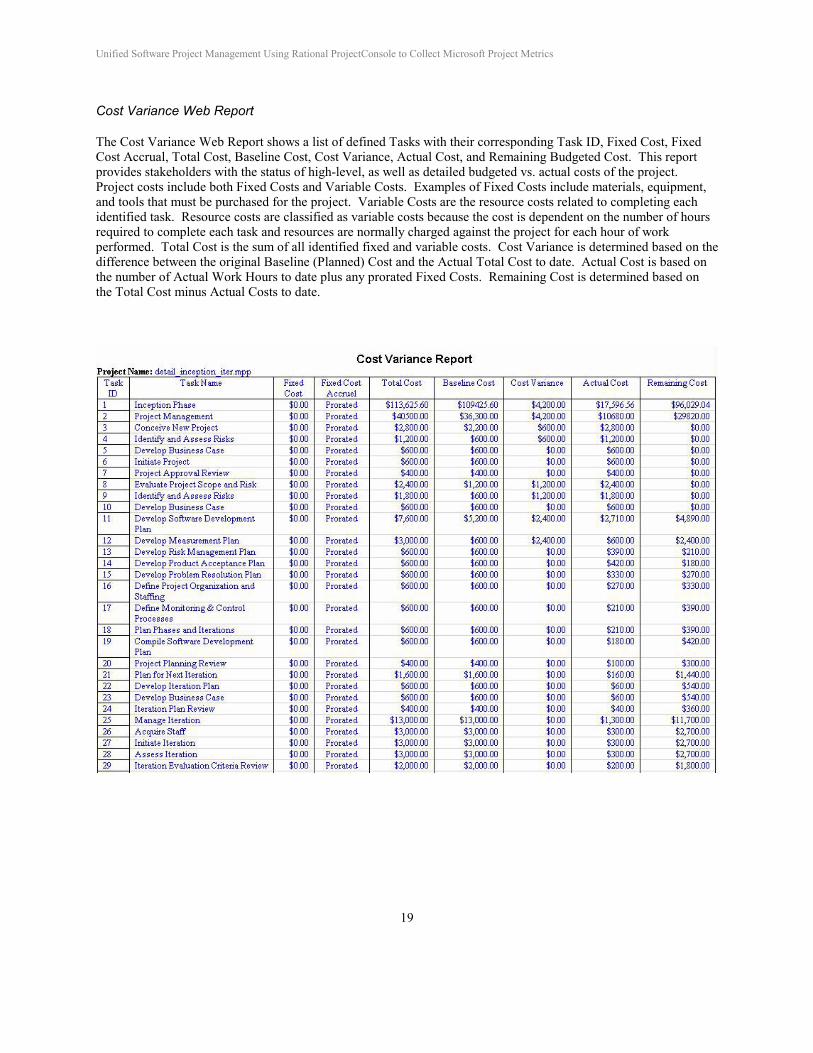
Cost Variance Web Report
The Cost Variance Web Report shows a list of defined Tasks with their corresponding Task ID, Fixed Cost, Fixed Cost Accrual, Total Cost, Baseline Cost, Cost Variance, Actual Cost, and Remaining Budgeted Cost. This report provides stakeholders with the status of high-level, as well as detailed budgeted vs. actual costs of the project. Project costs include both Fixed Costs and Variable Costs. Examples of Fixed Costs include materials, equipment, and tools that must be purchased for the project. Variable Costs are the resource costs related to completing each identified task. Resource costs are classified as variable costs because the cost is dependent on the number of hours required to complete each task and resources are normally charged against the project for each hour of work performed. Total Cost is the sum of all identified fixed and variable costs. Cost Variance is determined based on the difference between the original Baseline (Planned) Cost and the Actual Total Cost to date. Actual Cost is based on the number of Actual Work Hours to date plus any prorated Fixed Costs. Remaining Cost is determined based on the Total Cost minus Actual Costs to date.
Unified Software Project Management Using Rational ProjectConsole to Collect Microsoft Project Metrics
20
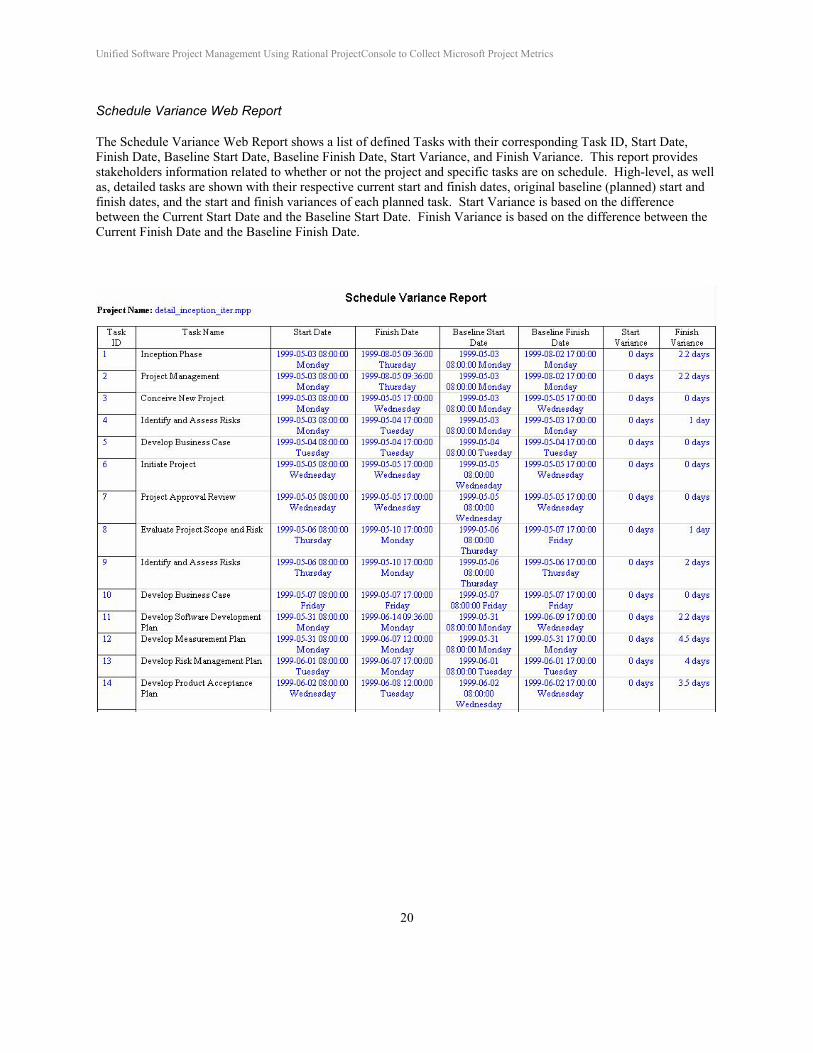
Schedule Variance Web Report
The Schedule Variance Web Report shows a list of defined Tasks with their corresponding Task ID, Start Date, Finish Date, Baseline Start Date, Baseline Finish Date, Start Variance, and Finish Variance. This report provides stakeholders information related to whether or not the project and specific tasks are on schedule. High-level, as well as, detailed tasks are shown with their respective current start and finish dates, original baseline (planned) start and finish dates, and the start and finish variances of each planned task. Start Variance is based on the difference between the Current Start Date and the Baseline Start Date. Finish Variance is based on the difference between the Current Finish Date and the Baseline Finish Date.
Unified Software Project Management Using Rational ProjectConsole to Collect Microsoft Project Metrics
21
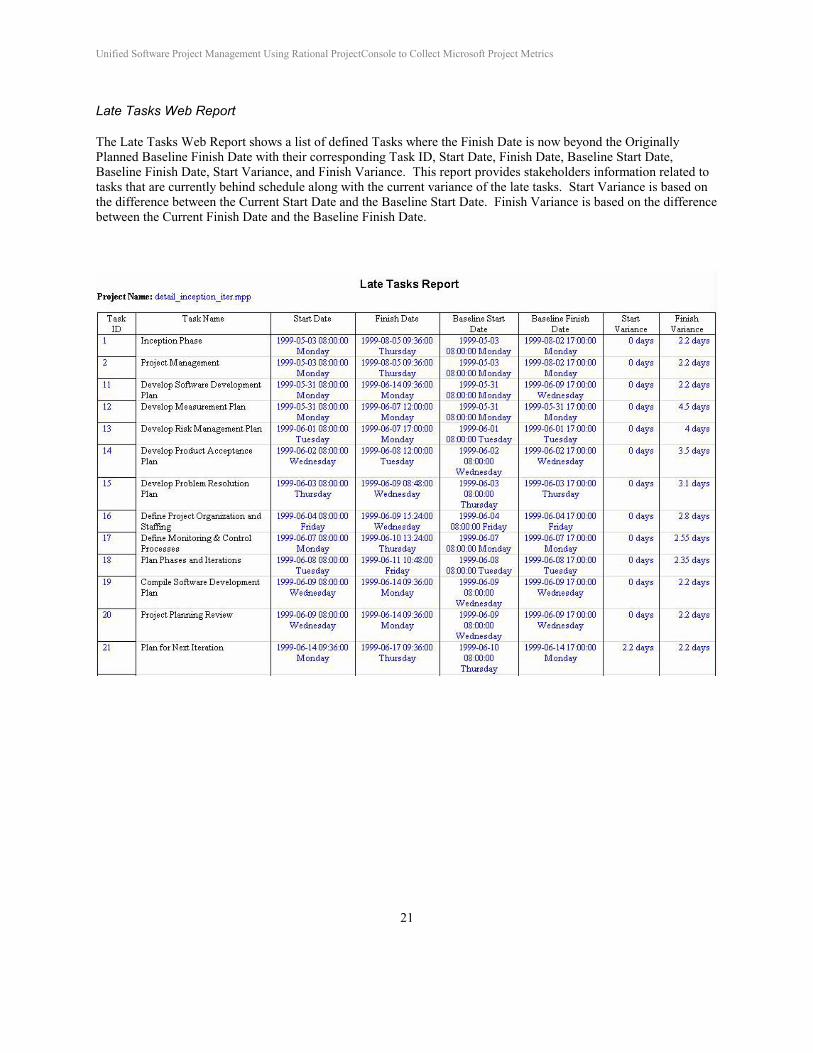
Late Tasks Web Report
The Late Tasks Web Report shows a list of defined Tasks where the Finish Date is now beyond the Originally Planned Baseline Finish Date with their corresponding Task ID, Start Date, Finish Date, Baseline Start Date, Baseline Finish Date, Start Variance, and Finish Variance. This report provides stakeholders information related to tasks that are currently behind schedule along with the current variance of the late tasks. Start Variance is based on the difference between the Current Start Date and the Baseline Start Date. Finish Variance is based on the difference between the Current Finish Date and the Baseline Finish Date.
Unified Software Project Management Using Rational ProjectConsole to Collect Microsoft Project Metrics
22
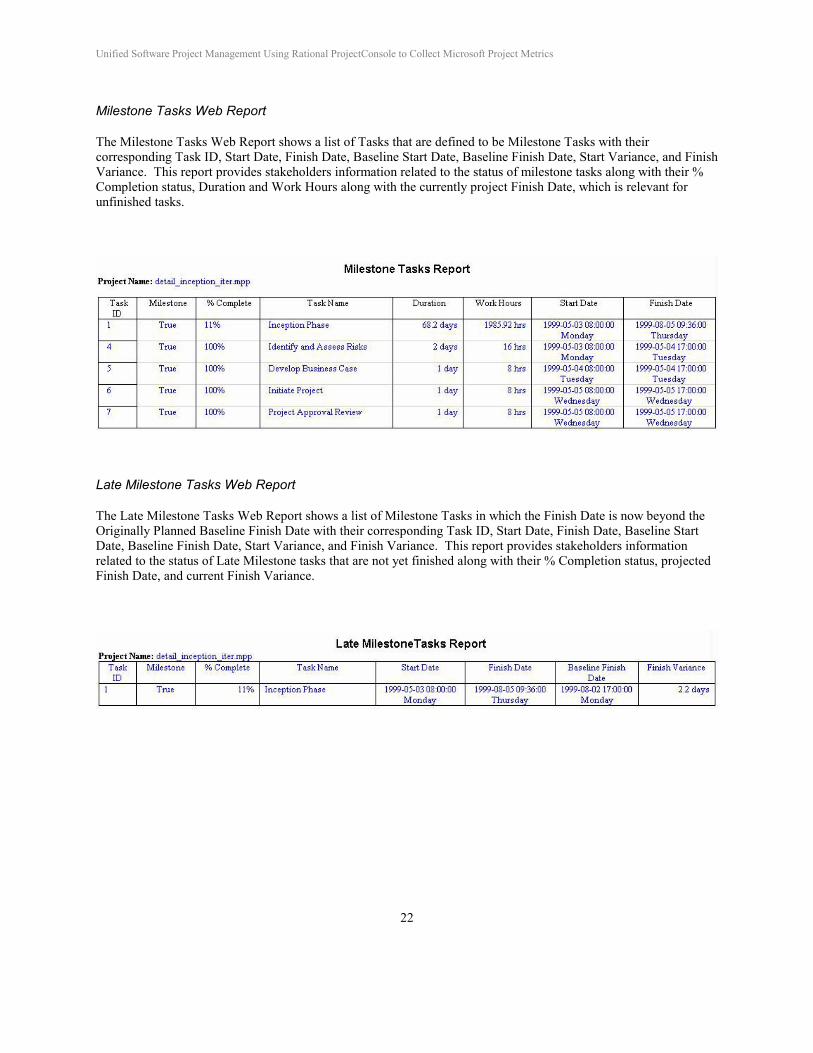
Milestone Tasks Web Report
The Milestone Tasks Web Report shows a list of Tasks that are defined to be Milestone Tasks with their corresponding Task ID, Start Date, Finish Date, Baseline Start Date, Baseline Finish Date, Start Variance, and Finish Variance. This report provides stakeholders information related to the status of milestone tasks along with their % Completion status, Duration and Work Hours along with the currently project Finish Date, which is relevant for unfinished tasks.
Late Milestone Tasks Web Report
The Late Milestone Tasks Web Report shows a list of Milestone Tasks in which the Finish Date is now beyond the Originally Planned Baseline Finish Date with their corresponding Task ID, Start Date, Finish Date, Baseline Start Date, Baseline Finish Date, Start Variance, and Finish Variance. This report provides stakeholders information related to the status of Late Milestone tasks that are not yet finished along with their % Completion status, projected Finish Date, and current Finish Variance.
Unified Software Project Management Using Rational ProjectConsole to Collect Microsoft Project Metrics
23
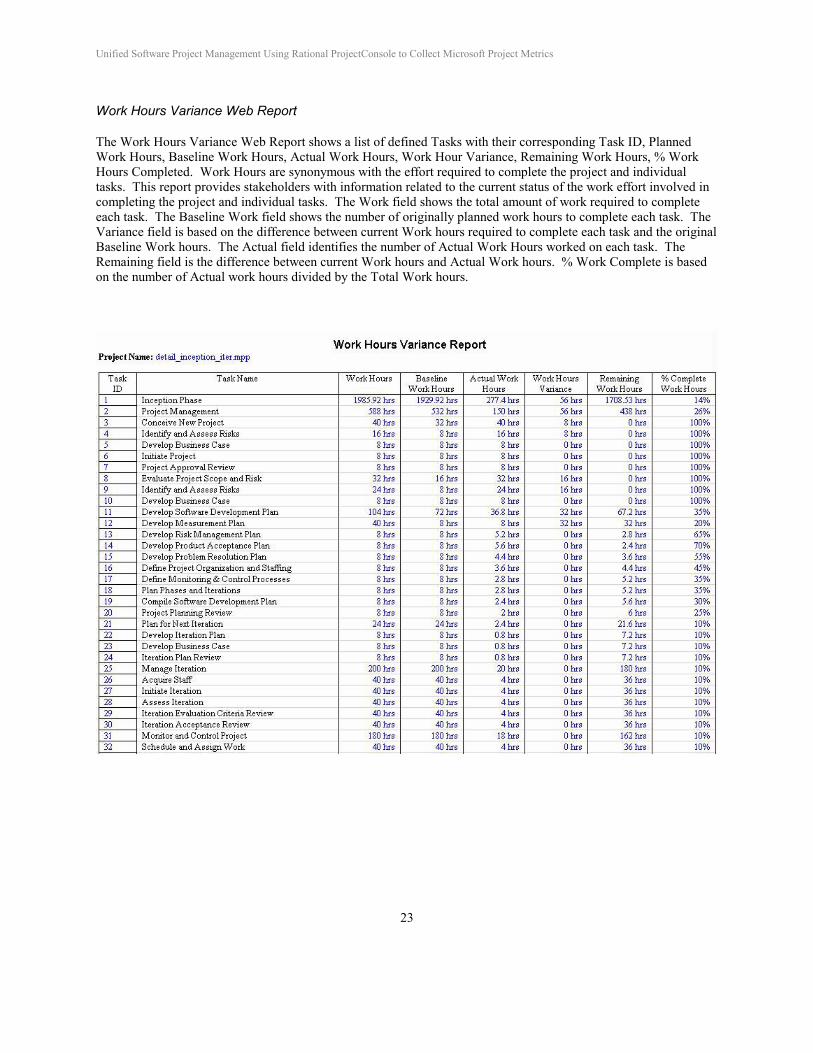
Work Hours Variance Web Report
The Work Hours Variance Web Report shows a list of defined Tasks with their corresponding Task ID, Planned Work Hours, Baseline Work Hours, Actual Work Hours, Work Hour Variance, Remaining Work Hours, % Work Hours Completed. Work Hours are synonymous with the effort required to complete the project and individual tasks. This report provides stakeholders with information related to the current status of the work effort involved in completing the project and individual tasks. The Work field shows the total amount of work required to complete each task. The Baseline Work field shows the number of originally planned work hours to complete each task. The Variance field is based on the difference between current Work hours required to complete each task and the original Baseline Work hours. The Actual field identifies the number of Actual Work Hours worked on each task. The Remaining field is the difference between current Work hours and Actual Work hours. % Work Complete is based on the number of Actual work hours divided by the Total Work hours.
Unified Software Project Management Using Rational ProjectConsole to Collect Microsoft Project Metrics
24
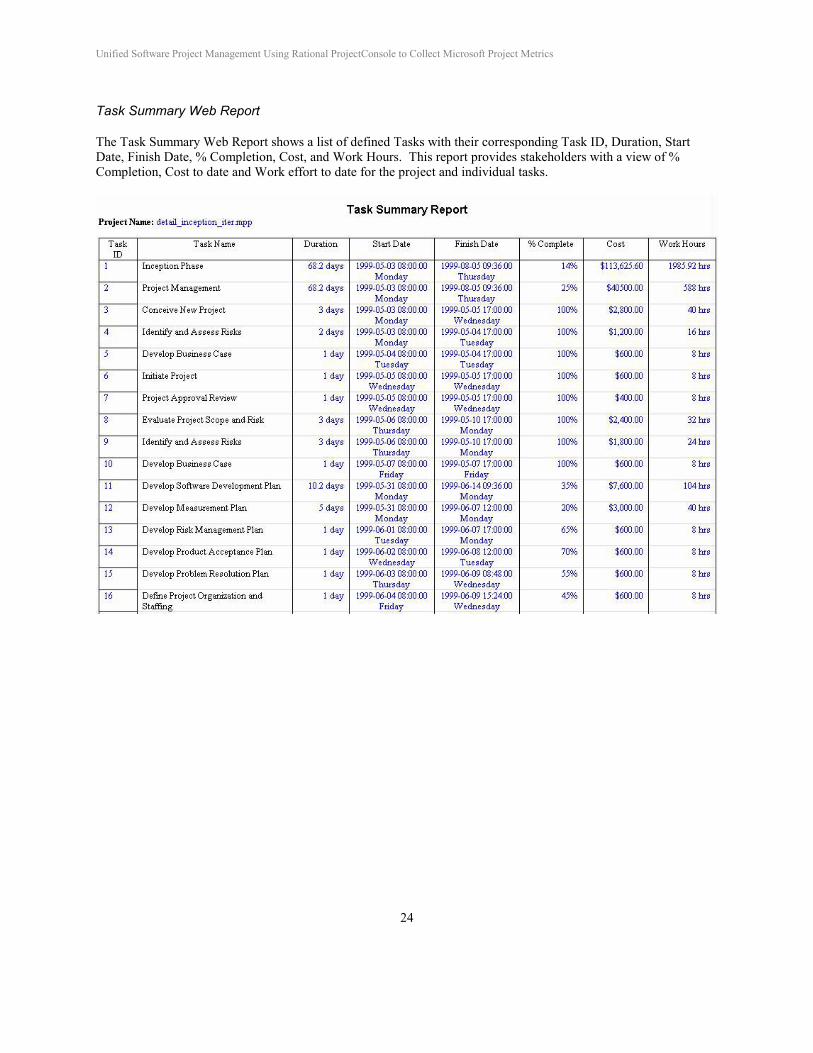
Task Summary Web Report
The Task Summary Web Report shows a list of defined Tasks with their corresponding Task ID, Duration, Start Date, Finish Date, % Completion, Cost, and Work Hours. This report provides stakeholders with a view of % Completion, Cost to date and Work effort to date for the project and individual tasks.
Unified Software Project Management Using Rational ProjectConsole to Collect Microsoft Project Metrics
25
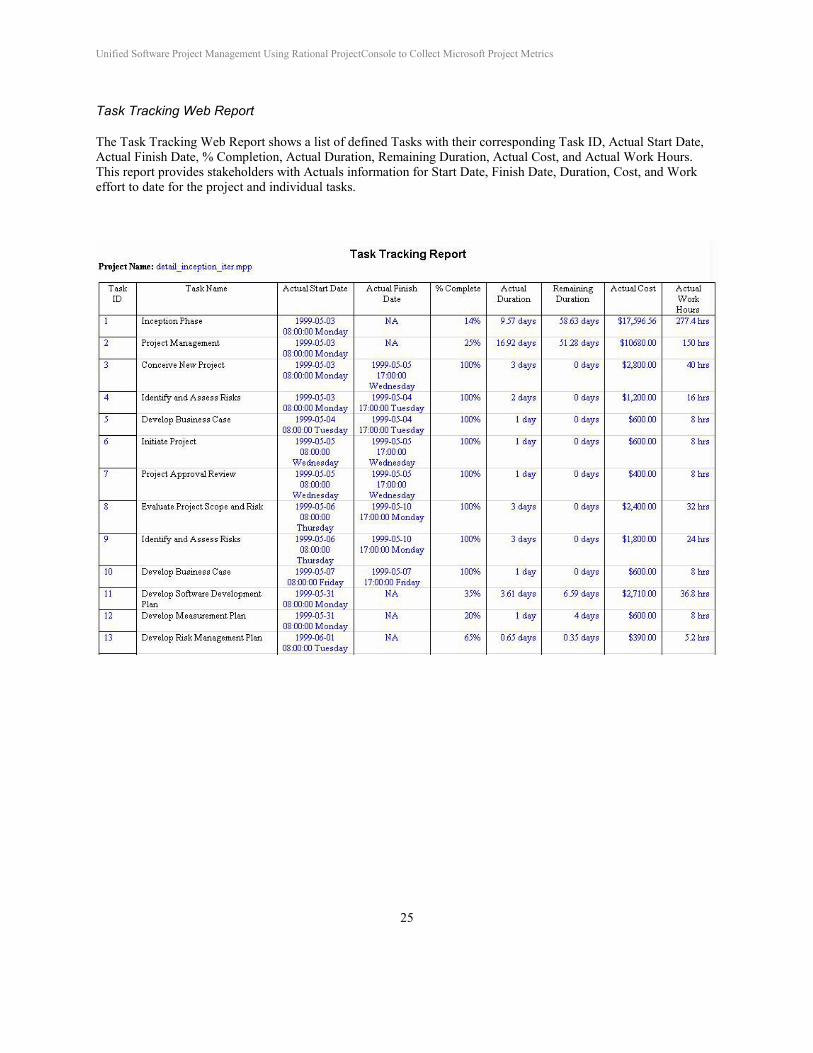
Task Tracking Web Report
The Task Tracking Web Report shows a list of defined Tasks with their corresponding Task ID, Actual Start Date, Actual Finish Date, % Completion, Actual Duration, Remaining Duration, Actual Cost, and Actual Work Hours. This report provides stakeholders with Actuals information for Start Date, Finish Date, Duration, Cost, and Work effort to date for the project and individual tasks.
Unified Software Project Management Using Rational ProjectConsole to Collect Microsoft Project Metrics
26
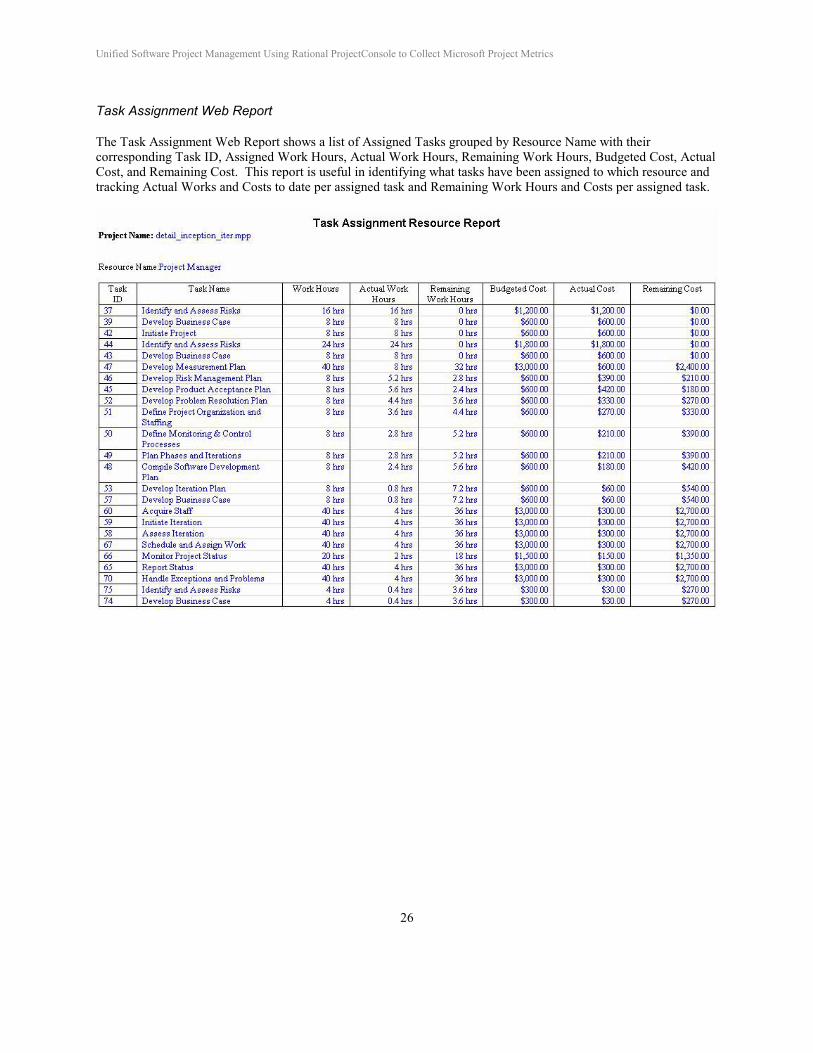
Task Assignment Web Report
The Task Assignment Web Report shows a list of Assigned Tasks grouped by Resource Name with their corresponding Task ID, Assigned Work Hours, Actual Work Hours, Remaining Work Hours, Budgeted Cost, Actual Cost, and Remaining Cost. This report is useful in identifying what tasks have been assigned to which resource and tracking Actual Works and Costs to date per assigned task and Remaining Work Hours and Costs per assigned task.
Unified Software Project Management Using Rational ProjectConsole to Collect Microsoft Project Metrics
27
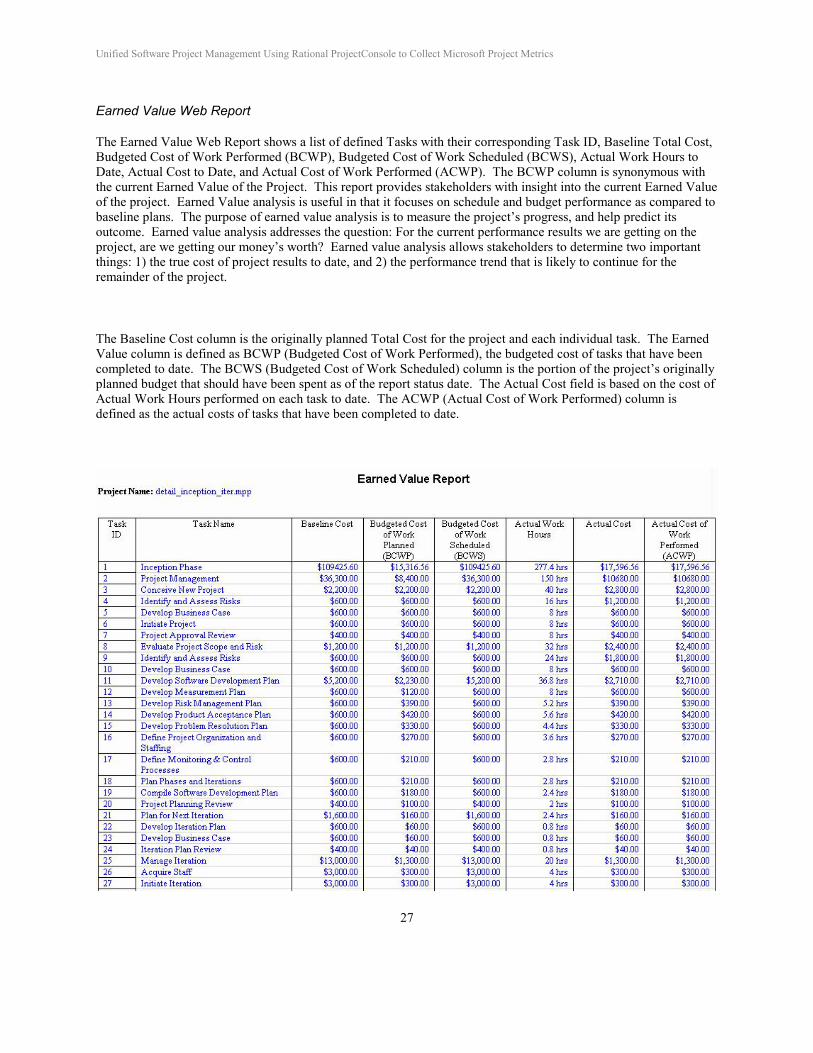
Earned Value Web Report
The Earned Value Web Report shows a list of defined Tasks with their corresponding Task ID, Baseline Total Cost, Budgeted Cost of Work Performed (BCWP), Budgeted Cost of Work Scheduled (BCWS), Actual Work Hours to Date, Actual Cost to Date, and Actual Cost of Work Performed (ACWP). The BCWP column is synonymous with the current Earned Value of the Project. This report provides stakeholders with insight into the current Earned Value of the project. Earned Value analysis is useful in that it focuses on schedule and budget performance as compared to baseline plans. The purpose of earned value analysis is to measure the project’s progress, and help predict its outcome. Earned value analysis addresses the question: For the current performance results we are getting on the project, are we getting our money’s worth? Earned value analysis allows stakeholders to determine two important things: 1) the true cost of project results to date, and 2) the performance trend that is likely to continue for the remainder of the project.
The Baseline Cost column is the originally planned Total Cost for the project and each individual task. The Earned Value column is defined as BCWP (Budgeted Cost of Work Performed), the budgeted cost of tasks that have been completed to date. The BCWS (Budgeted Cost of Work Scheduled) column is the portion of the project’s originally planned budget that should have been spent as of the report status date. The Actual Cost field is based on the cost of Actual Work Hours performed on each task to date. The ACWP (Actual Cost of Work Performed) column is defined as the actual costs of tasks that have been completed to date.
Unified Software Project Management Using Rational ProjectConsole to Collect Microsoft Project Metrics
28
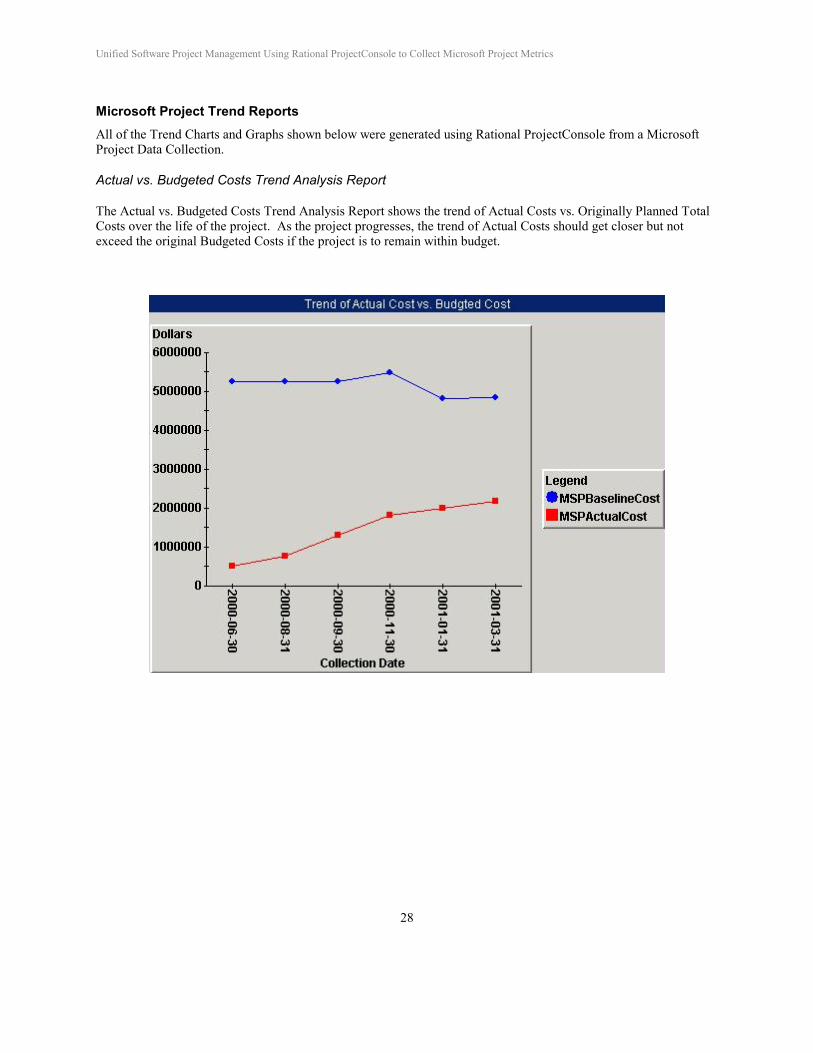
Microsoft Project Trend Reports All of the Trend Charts and Graphs shown below were generated using Rational ProjectConsole from a Microsoft Project Data Collection.
Actual vs. Budgeted Costs Trend Analysis Report
The Actual vs. Budgeted Costs Trend Analysis Report shows the trend of Actual Costs vs. Originally Planned Total Costs over the life of the project. As the project progresses, the trend of Actual Costs should get closer but not exceed the original Budgeted Costs if the project is to remain within budget.
Unified Software Project Management Using Rational ProjectConsole to Collect Microsoft Project Metrics
29
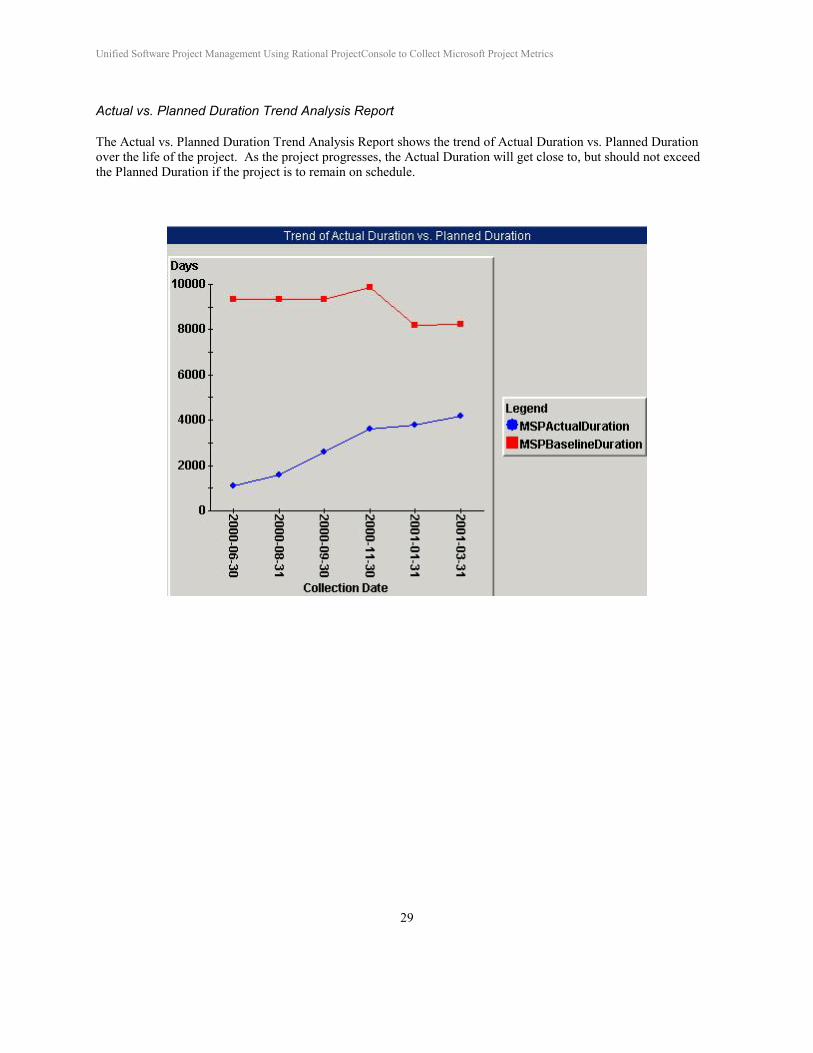
Actual vs. Planned Duration Trend Analysis Report
The Actual vs. Planned Duration Trend Analysis Report shows the trend of Actual Duration vs. Planned Duration over the life of the project. As the project progresses, the Actual Duration will get close to, but should not exceed the Planned Duration if the project is to remain on schedule.
Unified Software Project Management Using Rational ProjectConsole to Collect Microsoft Project Metrics
30
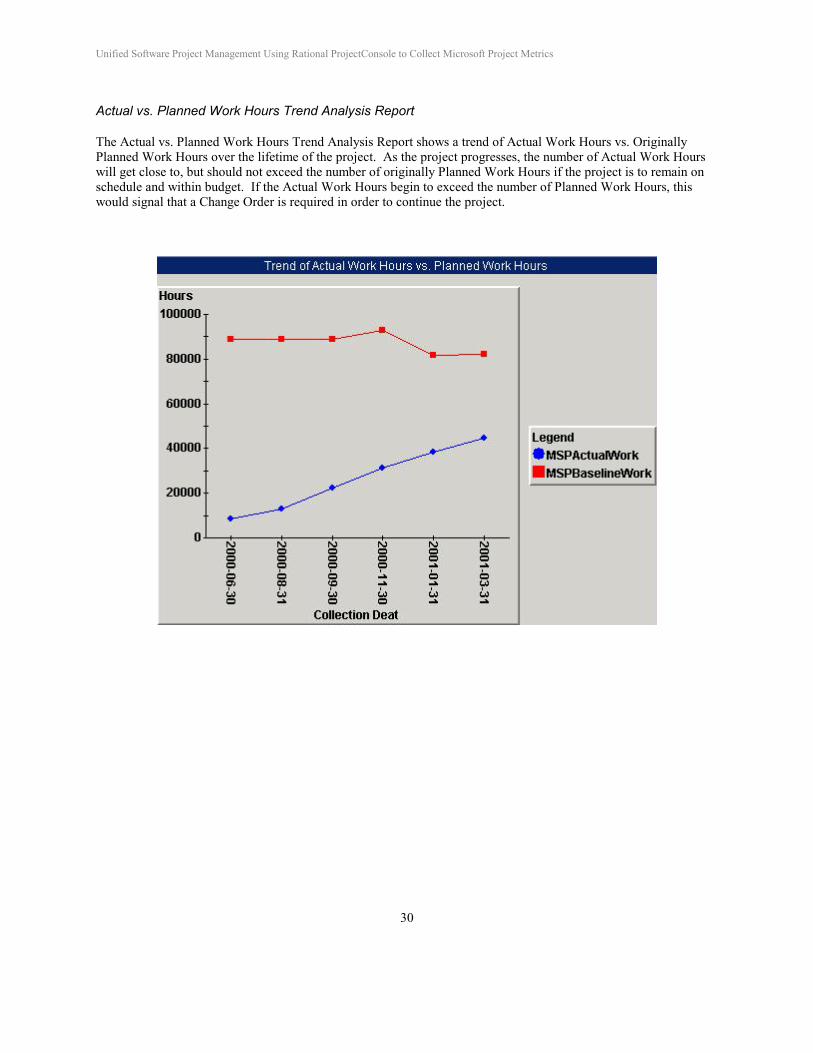
Actual vs. Planned Work Hours Trend Analysis Report
The Actual vs. Planned Work Hours Trend Analysis Report shows a trend of Actual Work Hours vs. Originally Planned Work Hours over the lifetime of the project. As the project progresses, the number of Actual Work Hours will get close to, but should not exceed the number of originally Planned Work Hours if the project is to remain on schedule and within budget. If the Actual Work Hours begin to exceed the number of Planned Work Hours, this would signal that a Change Order is required in order to continue the project.
Unified Software Project Management Using Rational ProjectConsole to Collect Microsoft Project Metrics
31
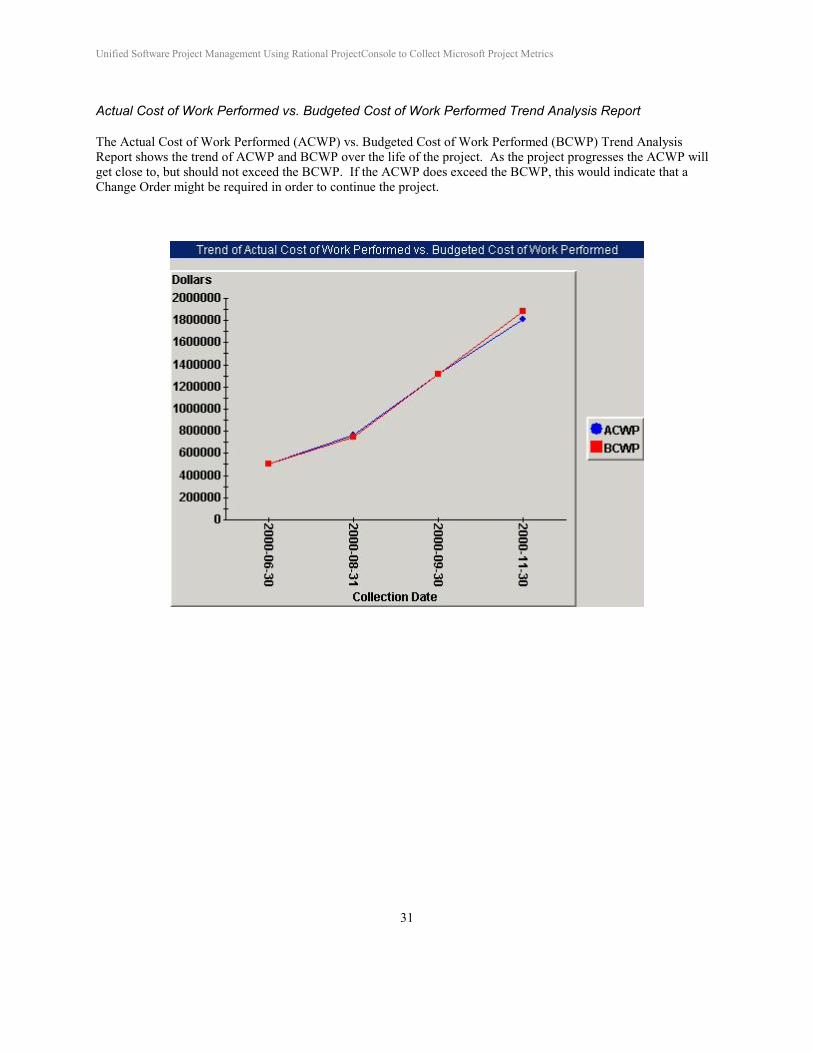
Actual Cost of Work Performed vs. Budgeted Cost of Work Performed Trend Analysis Report
The Actual Cost of Work Performed (ACWP) vs. Budgeted Cost of Work Performed (BCWP) Trend Analysis Report shows the trend of ACWP and BCWP over the life of the project. As the project progresses the ACWP will get close to, but should not exceed the BCWP. If the ACWP does exceed the BCWP, this would indicate that a Change Order might be required in order to continue the project.
Unified Software Project Management Using Rational ProjectConsole to Collect Microsoft Project Metrics
32
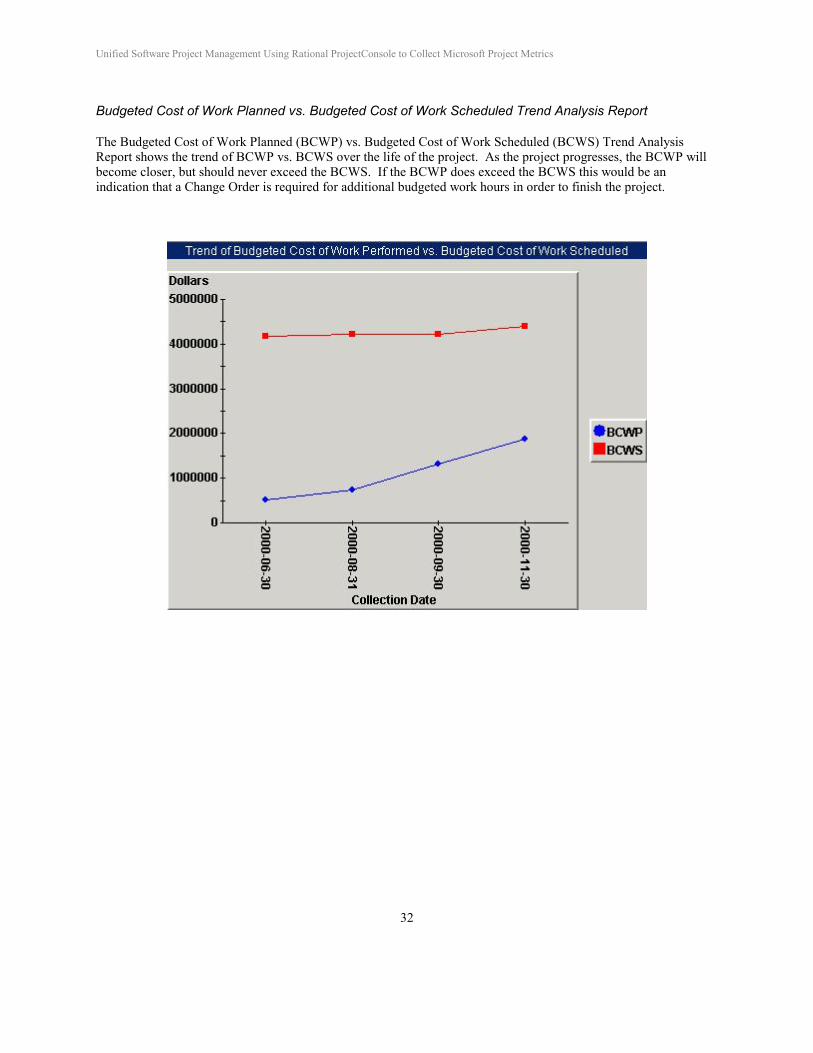
Budgeted Cost of Work Planned vs. Budgeted Cost of Work Scheduled Trend Analysis Report
The Budgeted Cost of Work Planned (BCWP) vs. Budgeted Cost of Work Scheduled (BCWS) Trend Analysis Report shows the trend of BCWP vs. BCWS over the life of the project. As the project progresses, the BCWP will become closer, but should never exceed the BCWS. If the BCWP does exceed the BCWS this would be an indication that a Change Order is required for additional budgeted work hours in order to finish the project.
Unified Software Project Management Using Rational ProjectConsole to Collect Microsoft Project Metrics
33
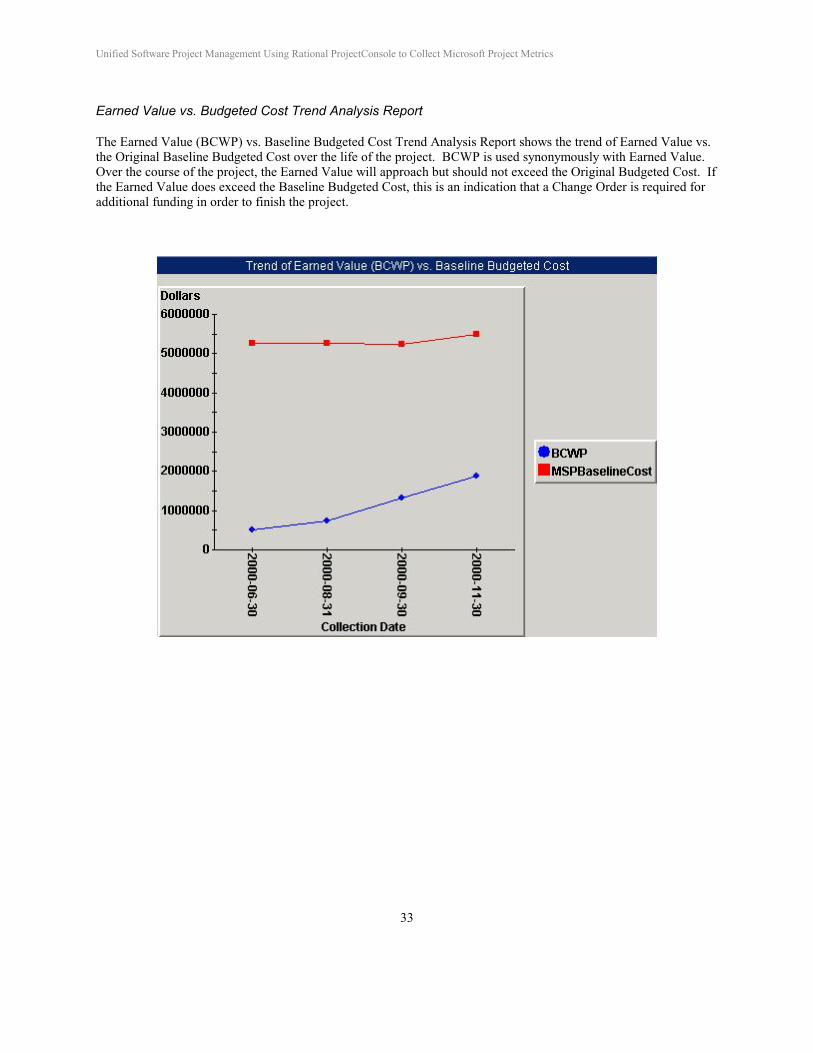
Earned Value vs. Budgeted Cost Trend Analysis Report
The Earned Value (BCWP) vs. Baseline Budgeted Cost Trend Analysis Report shows the trend of Earned Value vs. the Original Baseline Budgeted Cost over the life of the project. BCWP is used synonymously with Earned Value. Over the course of the project, the Earned Value will approach but should not exceed the Original Budgeted Cost. If the Earned Value does exceed the Baseline Budgeted Cost, this is an indication that a Change Order is required for additional funding in order to finish the project.
Unified Software Project Management Using Rational ProjectConsole to Collect Microsoft Project Metrics
34
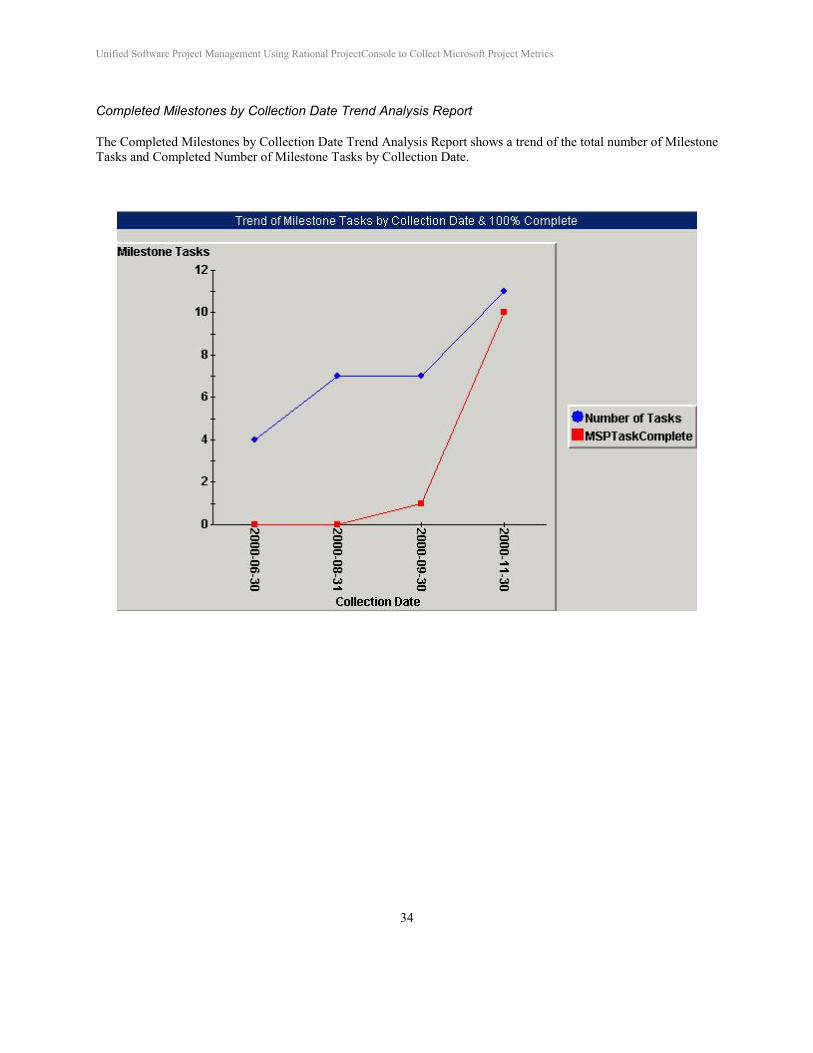
Completed Milestones by Collection Date Trend Analysis Report
The Completed Milestones by Collection Date Trend Analysis Report shows a trend of the total number of Milestone Tasks and Completed Number of Milestone Tasks by Collection Date.
Unified Software Project Management Using Rational ProjectConsole to Collect Microsoft Project Metrics
35
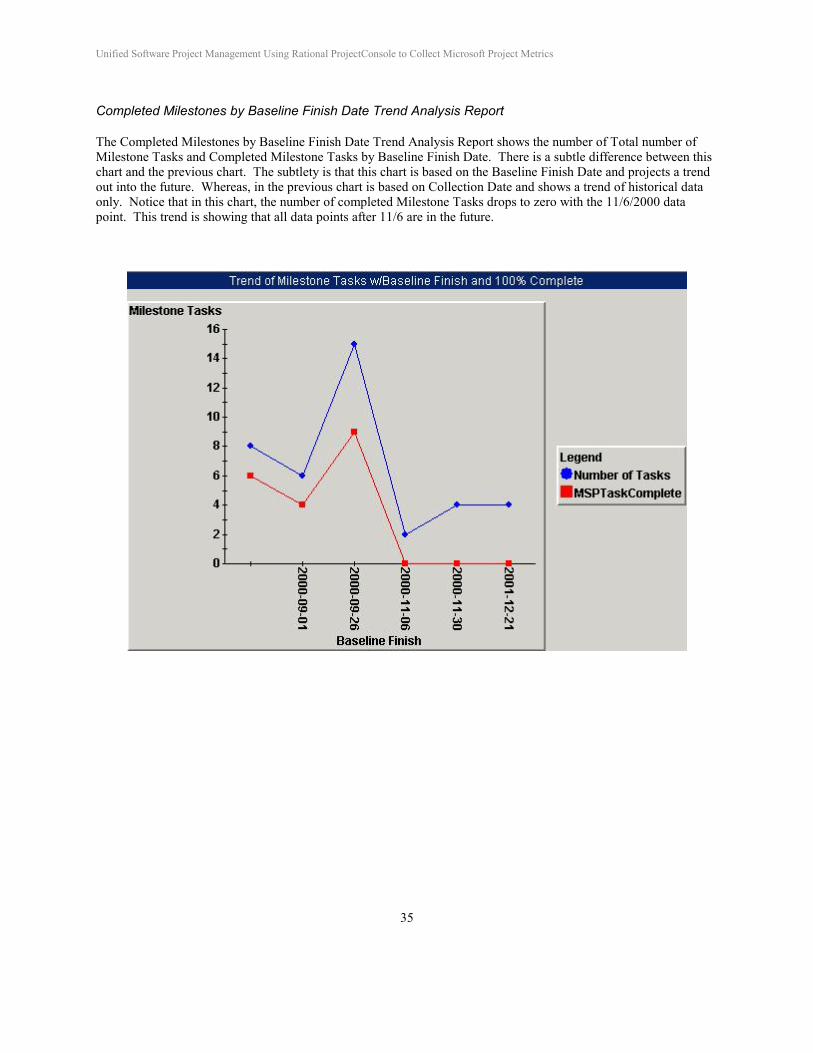
Completed Milestones by Baseline Finish Date Trend Analysis Report
The Completed Milestones by Baseline Finish Date Trend Analysis Report shows the number of Total number of Milestone Tasks and Completed Milestone Tasks by Baseline Finish Date. There is a subtle difference between this chart and the previous chart. The subtlety is that this chart is based on the Baseline Finish Date and projects a trend out into the future. Whereas, in the previous chart is based on Collection Date and shows a trend of historical data only. Notice that in this chart, the number of completed Milestone Tasks drops to zero with the 11/6/2000 data point. This trend is showing that all data points after 11/6 are in the future.
Unified Software Project Management Using Rational ProjectConsole to Collect Microsoft Project Metrics
36
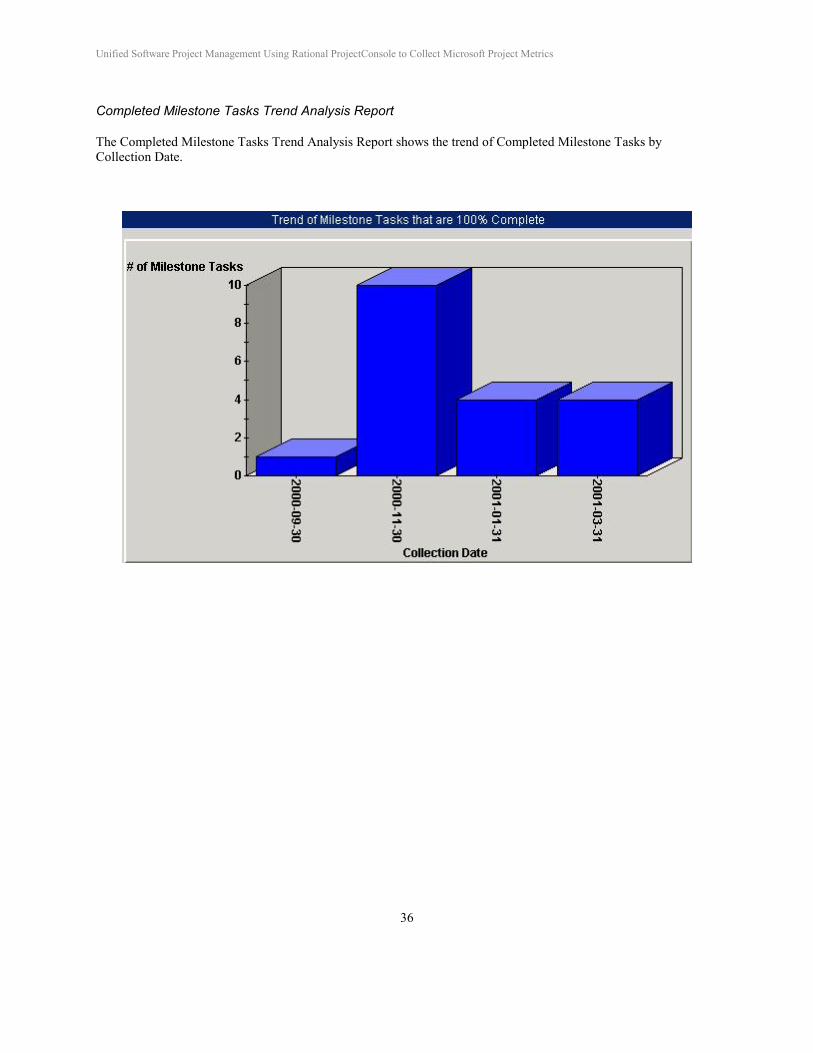
Completed Milestone Tasks Trend Analysis Report
The Completed Milestone Tasks Trend Analysis Report shows the trend of Completed Milestone Tasks by Collection Date.
Unified Software Project Management Using Rational ProjectConsole to Collect Microsoft Project Metrics
37
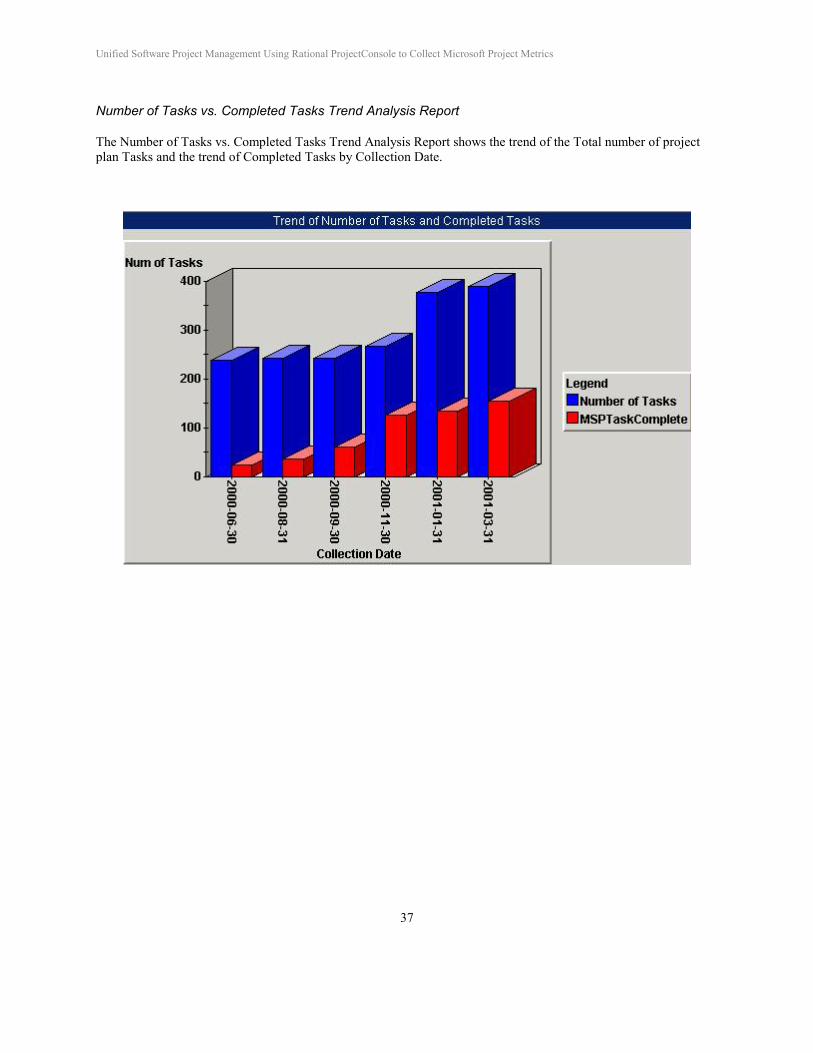
Number of Tasks vs. Completed Tasks Trend Analysis Report
The Number of Tasks vs. Completed Tasks Trend Analysis Report shows the trend of the Total number of project plan Tasks and the trend of Completed Tasks by Collection Date.
Unified Software Project Management Using Rational ProjectConsole to Collect Microsoft Project Metrics
38
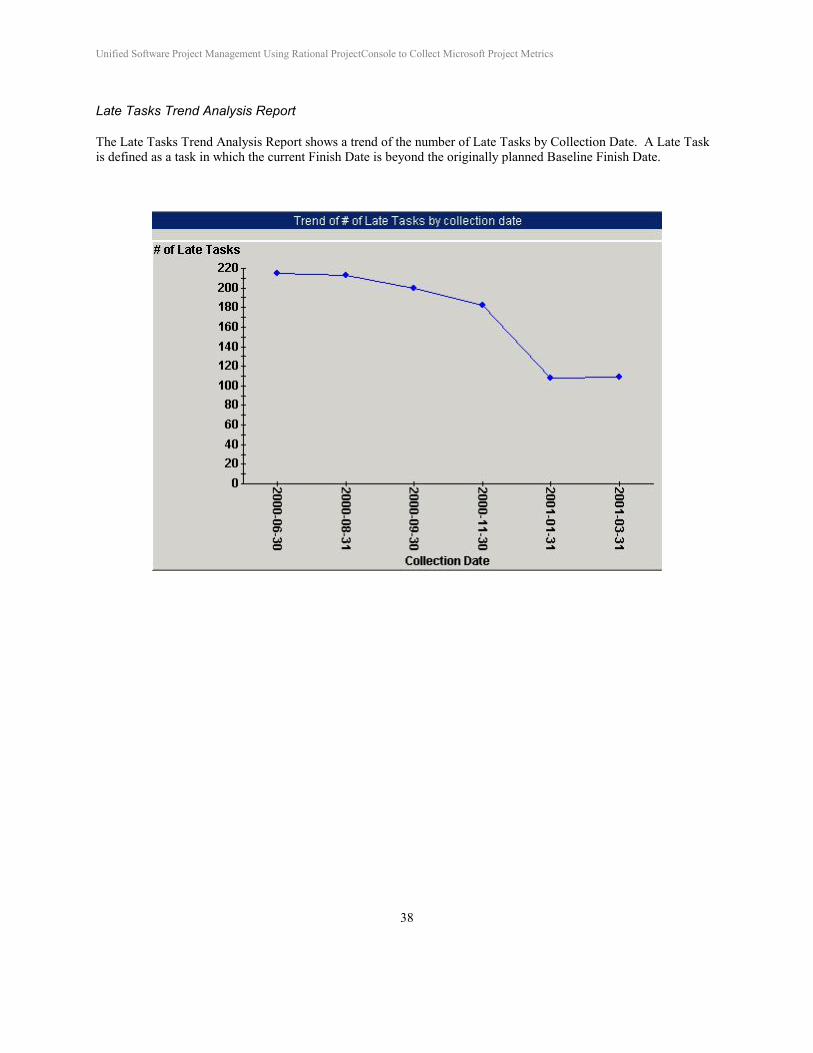
Late Tasks Trend Analysis Report
The Late Tasks Trend Analysis Report shows a trend of the number of Late Tasks by Collection Date. A Late Task is defined as a task in which the current Finish Date is beyond the originally planned Baseline Finish Date.
Unified Software Project Management Using Rational ProjectConsole to Collect Microsoft Project Metrics
39
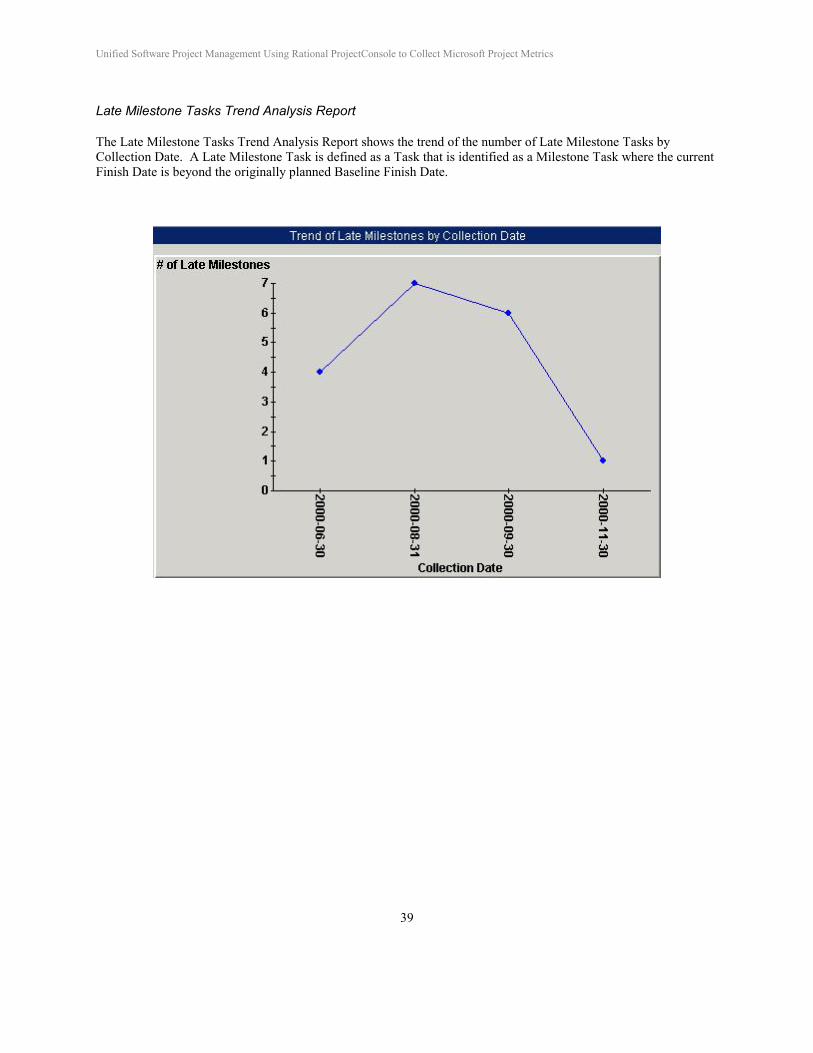
Late Milestone Tasks Trend Analysis Report
The Late Milestone Tasks Trend Analysis Report shows the trend of the number of Late Milestone Tasks by Collection Date. A Late Milestone Task is defined as a Task that is identified as a Milestone Task where the current Finish Date is beyond the originally planned Baseline Finish Date.
Unified Software Project Management Using Rational ProjectConsole to Collect Microsoft Project Metrics
40
Summary
This paper introduces key metrics that can be used to measure the progress of a project using data from an MS Project plan.
Project metrics examples shown within this paper were generated, initially from Microsoft Project, and subsequently using Rational ProjectConsole, which is part of the Rational Suite. Rational ProjectConsole can gather information from any Rational Suite tool, from text files, and from Microsoft Project. Therefore, to achieve the goal of having necessary information visible in ProjectConsole, the information must come from one of those sources.
Rational ProjectConsole enables a software development team to automatically quantify the current project status and assess development trends of their project with up-to-date metrics. On a specified scheduled or on-demand basis, metrics data is collected from the Rational Suites’ development environment, and from selected 3rd party tools, and then stored in the metrics warehouse. The resulting analysis is then visually presented in graphs, charts and gauges to indicate project status at a glance.
By viewing charts and indicators, team members can quickly understand the true status of the progress and quality of their project. ProjectConsole provides all members with the ability to analyze the individual discipline metrics, low-level details, planned-versus-actual metrics, historic data, trend charts or cross discipline metrics to get a better view across the entire project. These capabilities enable the software development team to take prompt corrective actions, realize the cause for late deliverables, set realistic project expectations, forecast future project milestones, and ultimately, put the entire team in a better position to objectively and accurately measure project progress and quality.
Unified Software Project Management Using Rational ProjectConsole to Collect Microsoft Project Metrics
41
References
[1] – Royce, W., Software Project Management A Unified Framework, Addison Wesley, 1998
[2] – Chatfield, C. & Johnson, T., Microsoft Project 2000 Step-by-Step, Microsoft Press, 2000
[3] – Rational ProjectConsole Software and User Documentation version 2001A
[4] – Microsoft Project 2000 Software
Corporate Headquarters 18880 Homestead Road Cupertino, CA 95014 Toll-free: 800-728-1212 Tel: 408-863-9900 Fax: 408-863-4120 E-mail: [email protected] Web: www.rational.com
For International Offices: www.rational.com/worldwide
Rational, the Rational logo, Rational the e-development company and Rational Rose are registered trademarks of Rational Software Corporation in the United States and in other countries. Microsoft, Microsoft Windows, Microsoft Visual Studio, Microsoft Word, Microsoft Project, Visual C++ and Visual Basic are trademarks or registered trademarks of Microsoft Corporation. All other names used for identification purposes only and are trademarks or registered trademarks of their respective companies. ALL RIGHTS RESERVED. Made in the U.S.A.
Copyright 2001 Rational Software Corporation. Subject to change without notice.