Unified School District #497 Lawrence Public Schools Finance/budget/Budget... · Unified School...
33
Unified School District #497 Lawrence Public Schools
Transcript of Unified School District #497 Lawrence Public Schools Finance/budget/Budget... · Unified School...
Unified School District #497 Lawrence Public Schools
i
• Budget General Information (characteristics of district)
• Supplemental Information for Tables in Summary of Expenditures
• KSDE Website Information Available
• Summary of Expenditures (Sumexpen.xlsx)
1
2013-14 Budget General Information USD #: 497
Introduction With a focus on “Learning for All,” Lawrence Public Schools have earned a reputation for excellence. As the city’s second-largest employer, next to the University of Kansas, Lawrence Public Schools serve approx. 11,000 students pre-K through grade 12 with about 1,750 teachers and educational support staff. The Lawrence school district operates 14 elementary schools, four middle schools, two comprehensive high schools and the largest and fastest-growing virtual school in Kansas. The seventh-largest school district in the state, Lawrence USD 497 offers a continuum of high-quality educational services for infants to adults, including Parents as Teachers, an early childhood educational program, adult basic education, GED preparation and testing, and an adult diploma-completion program.
Board Members
Kristie Adair, 4924 Stoneback Pl. Lawrence, KS 66047, 785/840-7989, [email protected] Keith Diaz Moore, 1738 Barker Ave. Lawrence KS 66044, 785/856-1402, [email protected] Rick Ingram, 1510 Crescent Rd Lawrence, KS 66044, 785/864-9819, [email protected] Shannon Kimball, 257 Earhart Cir Lawrence, KS 66049, 785/840-7722, [email protected] Randy Masten, 934 W 21st St. Lawrence, KS 66046, 785/760-5196, [email protected] Adina Morse, 1549 Alvamar Ct. Lawrence, KS 66047, 785/856-0843, [email protected] Vanessa Sanburn, 765 Ash St. Lawrence, KS 66044, 785/274-9509, [email protected]
Key Staff
Superintendent: Rick Doll Associate or Assistant Superintendents: Kyle Hayden, assistant superintendent of business and operations; Angelique Kobler, assistant superintendent of teaching and learning; and Jerri Kemble, assistant superintendent of educational technology programs Business Office Staff: Kathy Johnson, director of finance Other Key Contacts:
Tony Barron, director of facilities and operations Julie Boyle, director of communications David Cunningham, director of human resources and legal services Kevin Harrell, director of student intervention services Rick Henry, director of adult education services Patrick Kelly, director of career and technical education Ron May, director of administrative services Terry McEwen, director of assessment, research and instructional resources Paula Murrish, director of food services and purchasing Chantel Nicolay, director of information and technology services Anna Stubblefield, director of human resources
2
The District’s Accomplishments and Challenges Accomplishments: Keys to the success of the Lawrence Public Schools are its high-quality staff, talented students, involved parents, supportive business/community partnerships and a resource-rich university community, where excellence in education is valued and supported. Some 2012-13 accomplishments, include:
• Successful passage of a $92.5 million school bond issue for facility, technology and career and technical education improvements.
• Enrolled 1,442 new students • Implemented new Individualized Educational Plan (IEP) system to support special education
and gifted education service delivery • Certified under the new Healthy Hunger-Free Kids Act • Pilot-tested a blended learning instructional model and increased technology integration • Implemented a new online applicant/recruitment system • Expanded substitute pool for classified support staff • Implemented districtwide full-day kindergarten program • Implemented high school AVID program to improve graduation rate and enhance college and
career readiness • Lawrence Schools Foundation provided $302,174 in direct educational program support • Lawrence Education Achievement Partners matched every school with at least one business
partner (more than 100 business partners total) • Expanded school garden projects and Farm-to-School program • Continued districtwide equity leadership work to eliminate racial achievement disparities • Three elementary schools earned Governor’s Achievement Awards; two elementary schools
earned Kansas Confidence in Education Task Force Challenge Awards. • Both high schools recognized on the National Advanced Placement Honor Roll and
Newsweek’s “Top High Schools” list • Schools earned 195 Kansas Standard of Excellence awards for state assessments • Staff contributed $37,730 to United Way of Douglas County campaign • Staff honors: KMEA Conductor of the Year; Douglas County & Kansas Health Champion;
Kansas Master Teacher; Kansas Association for Health, Physical Education, Recreation and Dance Administrator of the Year; International Midwest Band and Orchestra clinician; Kansas Association for Career and Technical Education’s Outstanding New Teacher and Kansas Scholastic Press Association’s Outstanding New Journalism Adviser.
• Student honors: 3 Presidential Scholar candidates; 8 National Merit Finalists; National Hispanic Recognition Program Scholar; National Siemens Advanced Placement Award winner; 20 National Merit Commended Scholars; U.S. Senate Youth Program participant; 2 KU Global Scholars; National Boys and Girls Club Youth of the Year; 11 National History Day qualifiers; American Youth Leadership Program participant; United Way Wallace Galluzzi Youth Volunteer of the Year; Family, Career and Community Leaders of America state qualifier; 4 National Forensics League qualifiers; Forensics state champion; girls’ track and field state championship, National Scholastic Press Association finalist; 3 Kansas State Scholastic Chess Association state championship chess teams and student champions
3
Challenges: In addition to the ongoing challenge of maximizing limited resources to achieve district excellence, equity and engagement goals, other challenges include:
• Recruiting, developing and retaining high-quality and effective personnel • Providing a competitive compensation and benefits package for teachers and staff • Raising student achievement, while closing achievement gaps for students of color, students
with disabilities and students from poverty. • Improving high school graduation rates • Providing high-quality and effective professional development, including a systemic plan for
implementing Kansas College and Career Ready Standards, monitoring classroom instructional best practices across all schools and adopting a new teacher evaluation instrument
• Conducting long-range educational and facility planning
4
Supplemental Information for the Following Tables 1. Summary of Total Expenditures by Function (All Funds)
Instruction – Function 1000: Activities dealing directly with the interaction between teachers and students Student Support Services Function 2100: Support services provide administrative, technical and logistical support to facilitate and enhance instruction
Guidance, Attendance, Nursing, Social Workers, Prevention Specialists, School Psychologists, Speech and Language teachers, Audiology, Occupational Therapists, Physical Therapists, other mental health services.
Instructional Support Services Function 2200: Activities associated with assisting instructional staff with the content and process of providing learning experiences for students
Improvement of Instructional Services, TOSAs, Learning Coaches, Curriculum development and implementation, Library Media Services, Instructional related technology, Instructional Staff Training
General Administration Function 2300: Activities associated with the overall general administrative or executive responsibility for the entire school district
Board of Education Services, Superintendent Office
School Site Administration Function 2400: Activities concerned with overall administrative responsibility for a school School principal, assistant principals, school office support services Operations and Maintenance of Plant Function 2600: Activities concerned with keeping the physical plant open, comfortable and safe.
Operation of Buildings, Maintenance of Buildings, Care and Upkeep of Grounds, Care and Upkeep of Equipment, Care and Upkeep of Vehicles, Utilities, Security, Safety
Transportation Services Function 2700: Activities concerned with transporting students to and from school as provide by state and federal law, includes activity trips. Facilities Acquisition and Construction Function 4000– Capital Improvements
Land Acquisition, Land Improvement, Architecture and Engineering, New Building Acquisition and Construction, Site Improvement, Building Improvements, Other Facilities Acquisition and Construction
Note: Capital Improvements from Bond Proceeds are not included in State Budget Documents Other Costs Central Services Function 2500: Activities that support the other administrative and instruction functions of the school district
Fiscal services, Budgeting, Payroll, Purchasing, Warehouse, Printing and Distribution, Public Information Services, Personnel Services, Recruitment and Placement, Staff Health Physicals, Wellness, Administrative Technology, Network Services
Food Services Function 3100: Activities concerned with Food Service Operations of the District.
5
Supplemental Information for the Following Tables -- continued 2. Summary of General Fund Expenditures by Function
See function definitions, in #1 for more detail 3. Summary of Supplemental General Fund Expenditures by Function
See function definitions, in #1 for more detail 4. Summary of General and Supplemental General Fund Expenditures by Function
This graph shows the District’s general and supplemental general fund (operating budgets) together as one
5. Summary of Special Education Fund by Function
See function definitions, in #1 for more detail
6. Instruction Expenditures (1000) Activities dealing directly with the interaction between teachers and students
7. Student and Instructional Support Expenditures (2100 & 2200)
Student Support Services Function 2100: Support services provide administrative, technical and logistical support to facilitate and enhance instruction
Guidance, Attendance, Nursing, Social Workers, Prevention Specialists, School Psychologists, Speech and Language teachers, Audiology, Occupational Therapists, Physical Therapists, other mental health services.
Instructional Support Services Function 2200: Activities associated with assisting instructional staff with the content and process of providing learning experiences for students
Improvement of Instructional Services, TOSAs, Learning Coaches, Curriculum development and implementation, Library Media Services, Instructional related technology, Instructional Staff Training
8. General Administration Expenditures (2300)
Activities associated with the overall general administrative or executive responsibility for the entire school district
Board of Education Services, Superintendent Office 9. School Administration Expenditures (2400)
Activities concerned with overall administrative responsibility for a school School principal, assistant principals, school office support services
10. Operations and Maintenance Expenditures (2600) Activities concerned with keeping the physical plant open, comfortable and safe.
Operation of Buildings, Maintenance of Buildings, Care and Upkeep of Grounds, Care and Upkeep of Equipment, Care and Upkeep of Vehicles, Utilities, Security, Safety
6
Supplemental Information for the Following Tables -- continued 11. Other Costs
(2500 & 2900: Other Supplemental Services) and (3000: Non-Instruction Services) Central Services Function 2500: Activities that support the other administrative and instruction functions of the school district
Fiscal services, Budgeting, Payroll, Purchasing, Warehouse, Printing and Distribution, Public Information Services, Personnel Services, Recruitment and Placement, Staff Health Physicals, Wellness, Administrative Technology, Network Services
Food Services Function 3100: Activities concerned with Food Service Operations of the District.
12. Capital Improvements (4000)
Facilities Acquisition, Construction and Capital Improvements Land Acquisition, Land Improvement, Architecture and Engineering, New Building Acquisition and Construction, Site Improvement, Building Improvements, Other Facilities Acquisition and Construction
Note: Capital Improvements from Bond Proceeds are not included in State Budget Documents
13. Debt Services (5000) Bond and Interest Fund and Special Assessment Fund Payment of principal and interest on General Obligation and Refunding Bond issues Payment of Special Assessment Taxes
14. Miscellaneous Information – Transfers
Transfers are funds transfer within the District budget as required by statute, examples include transfers from the General Operating and Supplemental General Fund to Special Revenue funds like Special Education, At Risk 4 Year Old, At Risk K-12, Bilingual Education, Vocational Education, etc.
15. Miscellaneous Information Unencumbered Cash Balance by Fund 16. Reserve Funds Unencumbered Cash Balance 17. Other Information - FTE 18. Miscellaneous Information Mill Rates by Fund 19. Other Information – Assessed Valuation and Bonded Indebtedness Note: The FTE (full time equivalency) used in this report to calculate the “Amount Per Pupil” is defined as following: Enrollment (FTE) includes the enrollment of the district used for state aid and budget authority, and all other preschool enrollment and kindergarten students attending full time.
7
KSDE Website Information Available K-12 Statistics (Building, District or State Totals) http://svapp15586.ksde.org/k12/k12.aspx
• Attendance / Enrollment Reports • Staff Reports • Graduates / Dropouts Reports • Crime / Violence Reports
School Finance Reports and Publications http://www.ksde.org/Default.aspx?tabid=1870
• Certified Personnel • Enrollment • Dropouts • Graduates • Salary Reports
Kansas Building Report Card http://svapp15586.ksde.org/rcard/
• Attendance Rate • Graduation Rate • Dropout Rate • School Violence • Assessments
o Reading o Mathematics o Writing
• Graduates Passing Adv. Science Courses • Graduates Passing Adv. Math Courses
USD# 497
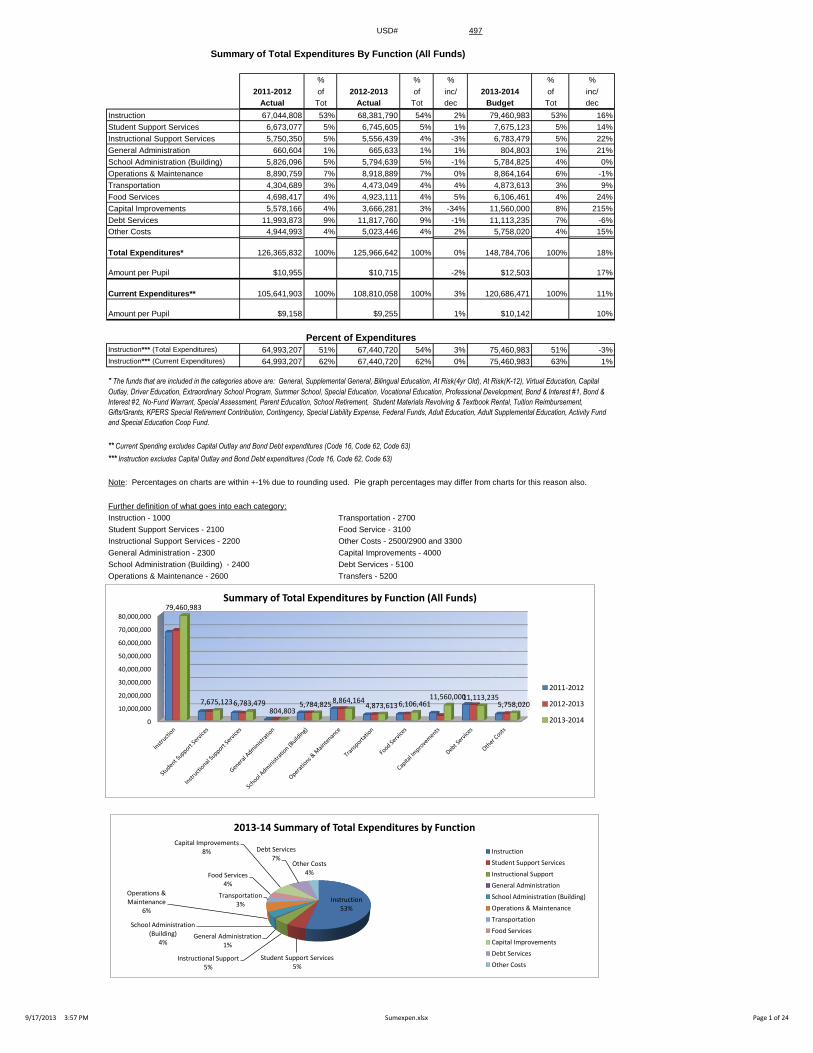
Summary of Total Expenditures By Function (All Funds)
% % % % %
2011-2012 of 2012-2013 of inc/ 2013-2014 of inc/
Actual Tot Actual Tot dec Budget Tot dec
Instruction 67,044,808 53% 68,381,790 54% 2% 79,460,983 53% 16%
Student Support Services 6,673,077 5% 6,745,605 5% 1% 7,675,123 5% 14%
Instructional Support Services 5,750,350 5% 5,556,439 4% -3% 6,783,479 5% 22%
General Administration 660,604 1% 665,633 1% 1% 804,803 1% 21%
School Administration (Building) 5,826,096 5% 5,794,639 5% -1% 5,784,825 4% 0%
Operations & Maintenance 8,890,759 7% 8,918,889 7% 0% 8,864,164 6% -1%
Transportation 4,304,689 3% 4,473,049 4% 4% 4,873,613 3% 9%
Food Services 4,698,417 4% 4,923,111 4% 5% 6,106,461 4% 24%
Capital Improvements 5,578,166 4% 3,666,281 3% -34% 11,560,000 8% 215%
Debt Services 11,993,873 9% 11,817,760 9% -1% 11,113,235 7% -6%
Other Costs 4,944,993 4% 5,023,446 4% 2% 5,758,020 4% 15%
Total Expenditures* 126,365,832 100% 125,966,642 100% 0% 148,784,706 100% 18%
Amount per Pupil $10,955 $10,715 -2% $12,503 17%
Current Expenditures** 105,641,903 100% 108,810,058 100% 3% 120,686,471 100% 11%
Amount per Pupil $9,158 $9,255 1% $10,142 10%
Instruction*** (Total Expenditures) 64,993,207 51% 67,440,720 54% 3% 75,460,983 51% -3%
Instruction*** (Current Expenditures) 64,993,207 62% 67,440,720 62% 0% 75,460,983 63% 1%
Note: Percentages on charts are within +-1% due to rounding used. Pie graph percentages may differ from charts for this reason also.
Further definition of what goes into each category:
Instruction - 1000 Transportation - 2700
Student Support Services - 2100 Food Service - 3100
Instructional Support Services - 2200 Other Costs - 2500/2900 and 3300
General Administration - 2300 Capital Improvements - 4000
School Administration (Building) - 2400 Debt Services - 5100
Operations & Maintenance - 2600 Transfers - 5200
Percent of Expenditures
* The funds that are included in the categories above are: General, Supplemental General, Bilingual Education, At Risk(4yr Old), At Risk(K-12), Virtual Education, Capital
Outlay, Driver Education, Extraordinary School Program, Summer School, Special Education, Vocational Education, Professional Development, Bond & Interest #1, Bond &
Interest #2, No-Fund Warrant, Special Assessment, Parent Education, School Retirement, Student Materials Revolving & Textbook Rental, Tuition Reimbursement,
Gifts/Grants, KPERS Special Retirement Contribution, Contingency, Special Liability Expense, Federal Funds, Adult Education, Adult Supplemental Education, Activity Fund
and Special Education Coop Fund.
*** Instruction excludes Capital Outlay and Bond Debt expenditures (Code 16, Code 62, Code 63)
** Current Spending excludes Capital Outlay and Bond Debt expenditures (Code 16, Code 62, Code 63)
0
10,000,000
20,000,000
30,000,000
40,000,000
50,000,000
60,000,000
70,000,000
80,000,00079,460,983
7,675,123 6,783,479 804,803
5,784,825 8,864,164
4,873,613 6,106,461 11,560,000 11,113,235
5,758,020
Summary of Total Expenditures by Function (All Funds)
2011-2012
2012-2013
2013-2014
Instruction 53%
Student Support Services 5%
Instructional Support 5%
General Administration 1%
School Administration (Building)
4%
Operations & Maintenance
6%
Transportation 3%
Food Services 4%
Capital Improvements 8% Debt Services
7% Other Costs
4%
2013-14 Summary of Total Expenditures by Function
Instruction
Student Support Services
Instructional Support
General Administration
School Administration (Building)
Operations & Maintenance
Transportation
Food Services
Capital Improvements
Debt Services
Other Costs
9/17/2013 3:57 PM Sumexpen.xlsx Page 1 of 24
USD# 497
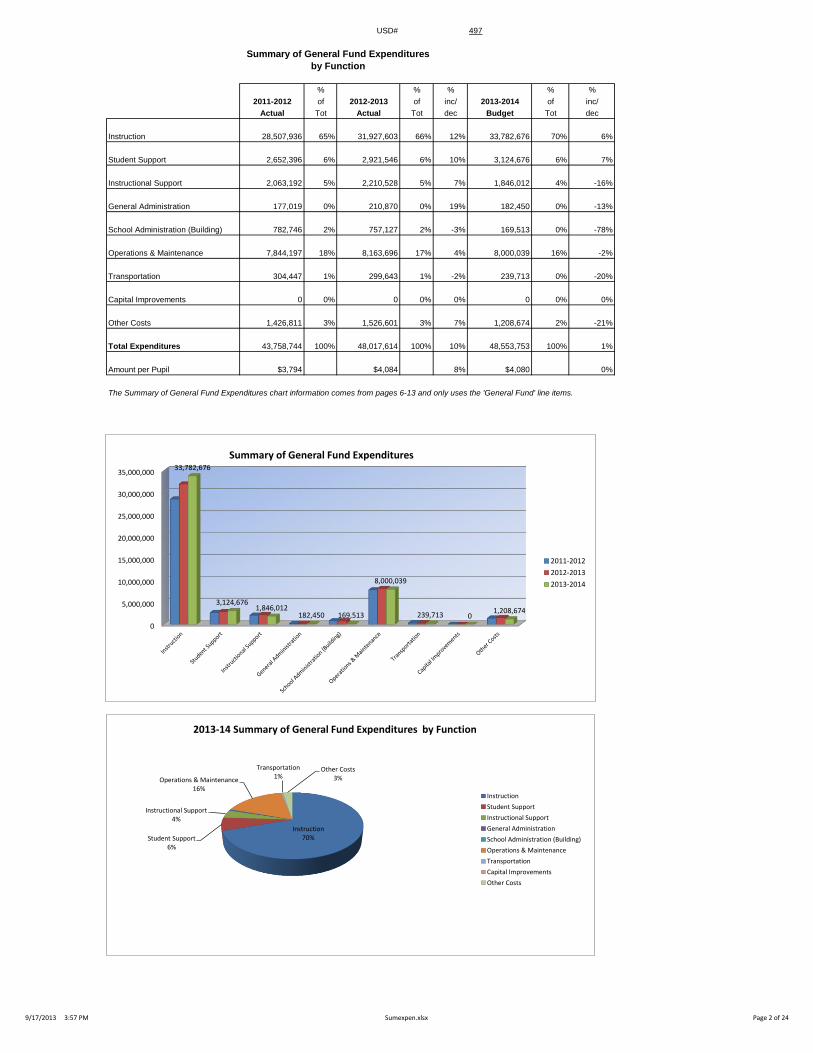
Summary of General Fund Expenditures
by Function
% % % % %
2011-2012 of 2012-2013 of inc/ 2013-2014 of inc/
Actual Tot Actual Tot dec Budget Tot dec
Instruction 28,507,936 65% 31,927,603 66% 12% 33,782,676 70% 6%
Student Support 2,652,396 6% 2,921,546 6% 10% 3,124,676 6% 7%
Instructional Support 2,063,192 5% 2,210,528 5% 7% 1,846,012 4% -16%
General Administration 177,019 0% 210,870 0% 19% 182,450 0% -13%
School Administration (Building) 782,746 2% 757,127 2% -3% 169,513 0% -78%
Operations & Maintenance 7,844,197 18% 8,163,696 17% 4% 8,000,039 16% -2%
Transportation 304,447 1% 299,643 1% -2% 239,713 0% -20%
Capital Improvements 0 0% 0 0% 0% 0 0% 0%
Other Costs 1,426,811 3% 1,526,601 3% 7% 1,208,674 2% -21%
Total Expenditures 43,758,744 100% 48,017,614 100% 10% 48,553,753 100% 1%
Amount per Pupil $3,794 $4,084 8% $4,080 0%
The Summary of General Fund Expenditures chart information comes from pages 6-13 and only uses the 'General Fund' line items.
0
5,000,000
10,000,000
15,000,000
20,000,000
25,000,000
30,000,000
35,000,00033,782,676
3,124,676 1,846,012
182,450 169,513
8,000,039
239,713 0 1,208,674
Summary of General Fund Expenditures
2011-2012
2012-2013
2013-2014
Instruction 70% Student Support
6%
Instructional Support 4%
Operations & Maintenance 16%
Transportation 1%
Other Costs 3%
2013-14 Summary of General Fund Expenditures by Function
Instruction
Student Support
Instructional Support
General Administration
School Administration (Building)
Operations & Maintenance
Transportation
Capital Improvements
Other Costs
9/17/2013 3:57 PM Sumexpen.xlsx Page 2 of 24
USD# 497
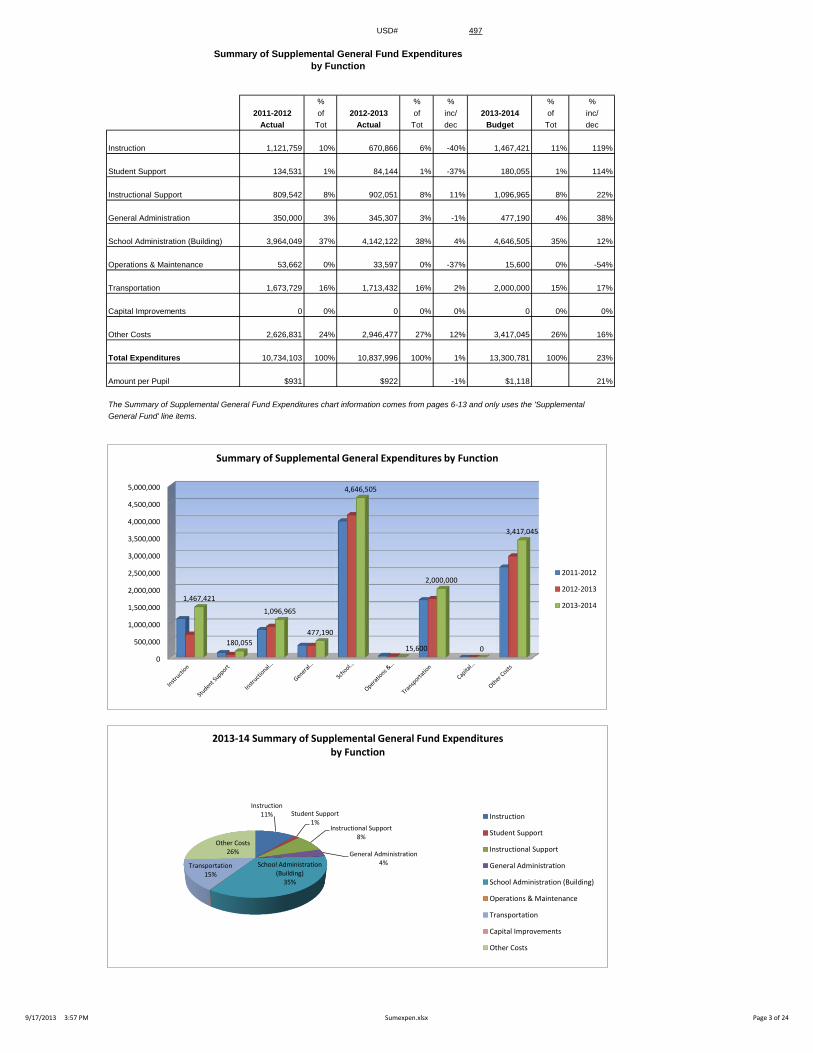
Summary of Supplemental General Fund Expenditures
by Function
% % % % %
2011-2012 of 2012-2013 of inc/ 2013-2014 of inc/
Actual Tot Actual Tot dec Budget Tot dec
Instruction 1,121,759 10% 670,866 6% -40% 1,467,421 11% 119%
Student Support 134,531 1% 84,144 1% -37% 180,055 1% 114%
Instructional Support 809,542 8% 902,051 8% 11% 1,096,965 8% 22%
General Administration 350,000 3% 345,307 3% -1% 477,190 4% 38%
School Administration (Building) 3,964,049 37% 4,142,122 38% 4% 4,646,505 35% 12%
Operations & Maintenance 53,662 0% 33,597 0% -37% 15,600 0% -54%
Transportation 1,673,729 16% 1,713,432 16% 2% 2,000,000 15% 17%
Capital Improvements 0 0% 0 0% 0% 0 0% 0%
Other Costs 2,626,831 24% 2,946,477 27% 12% 3,417,045 26% 16%
Total Expenditures 10,734,103 100% 10,837,996 100% 1% 13,300,781 100% 23%
Amount per Pupil $931 $922 -1% $1,118 21%
The Summary of Supplemental General Fund Expenditures chart information comes from pages 6-13 and only uses the 'Supplemental
General Fund' line items.
0
500,000
1,000,000
1,500,000
2,000,000
2,500,000
3,000,000
3,500,000
4,000,000
4,500,000
5,000,000
1,467,421
180,055
1,096,965
477,190
4,646,505
15,600
2,000,000
0
3,417,045
Summary of Supplemental General Expenditures by Function
2011-2012
2012-2013
2013-2014
Instruction 11% Student Support
1% Instructional Support
8%
General Administration 4% School Administration
(Building) 35%
Transportation 15%
Other Costs 26%
2013-14 Summary of Supplemental General Fund Expenditures by Function
Instruction
Student Support
Instructional Support
General Administration
School Administration (Building)
Operations & Maintenance
Transportation
Capital Improvements
Other Costs
9/17/2013 3:57 PM Sumexpen.xlsx Page 3 of 24
USD# 497
Summary of General and Supplemental General Fund
Expenditures by Function
% % % % %
2011-2012 of 2012-2013 of inc/ 2013-2014 of inc/
Actual Tot Actual Tot dec Budget Tot dec
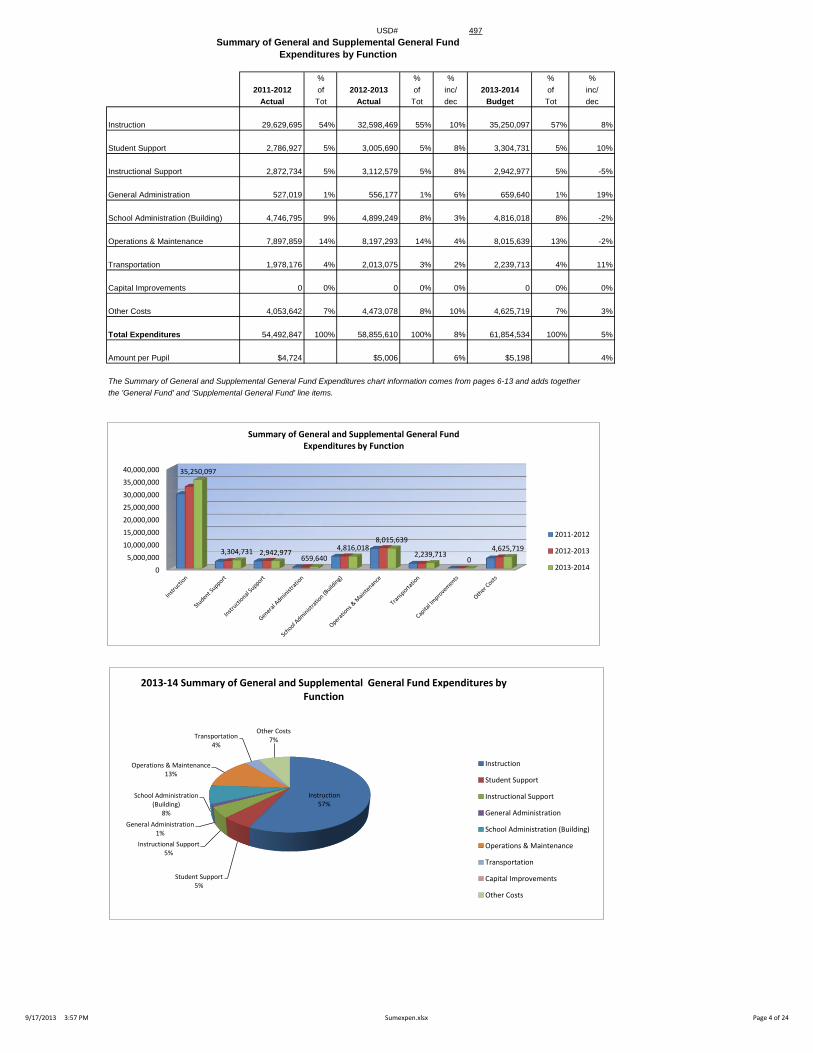
Instruction 29,629,695 54% 32,598,469 55% 10% 35,250,097 57% 8%
Student Support 2,786,927 5% 3,005,690 5% 8% 3,304,731 5% 10%
Instructional Support 2,872,734 5% 3,112,579 5% 8% 2,942,977 5% -5%
General Administration 527,019 1% 556,177 1% 6% 659,640 1% 19%
School Administration (Building) 4,746,795 9% 4,899,249 8% 3% 4,816,018 8% -2%
Operations & Maintenance 7,897,859 14% 8,197,293 14% 4% 8,015,639 13% -2%
Transportation 1,978,176 4% 2,013,075 3% 2% 2,239,713 4% 11%
Capital Improvements 0 0% 0 0% 0% 0 0% 0%
Other Costs 4,053,642 7% 4,473,078 8% 10% 4,625,719 7% 3%
Total Expenditures 54,492,847 100% 58,855,610 100% 8% 61,854,534 100% 5%
Amount per Pupil $4,724 $5,006 6% $5,198 4%
The Summary of General and Supplemental General Fund Expenditures chart information comes from pages 6-13 and adds together
the 'General Fund' and 'Supplemental General Fund' line items.
0
5,000,000
10,000,000
15,000,000
20,000,000
25,000,000
30,000,000
35,000,000
40,000,000 35,250,097
3,304,731 2,942,977 659,640
4,816,018 8,015,639
2,239,713 0
4,625,719
Summary of General and Supplemental General Fund Expenditures by Function
2011-2012
2012-2013
2013-2014
Instruction 57%
Student Support 5%
Instructional Support 5%
General Administration 1%
School Administration (Building)
8%
Operations & Maintenance 13%
Transportation 4%
Other Costs 7%
2013-14 Summary of General and Supplemental General Fund Expenditures by Function
Instruction
Student Support
Instructional Support
General Administration
School Administration (Building)
Operations & Maintenance
Transportation
Capital Improvements
Other Costs
9/17/2013 3:57 PM Sumexpen.xlsx Page 4 of 24

USD# 497
Summary of Special Education Fund
by Function
% % % % %
2011-2012 of 2012-2013 of inc/ 2013-2014 of inc/
Actual Tot Actual Tot dec Budget Tot dec
Instruction 13,548,577 70% 14,188,090 70% 5% 16,289,600 71% 15%
Student Support 2,878,861 15% 2,898,769 14% 1% 3,265,000 14% 13%
Instructional Support 665,761 3% 724,738 4% 9% 882,000 4% 22%
General Administration 0 0% 0 0% 0% 0 0% 0%
School Administration (Building) 0 0% 0 0% 0% 0 0% 0%
Operations & Maintenance 9,276 0% 9,219 0% -1% 19,500 0% 112%
Transportation 2,318,143 12% 2,454,631 12% 6% 2,533,900 11% 3%
Capital Improvements 0 0% 0 0% 0% 0 0% 0%
Other Costs 3,170 0% 3,919 0% 24% 10,000 0% 155%
Total Expenditures 19,423,788 100% 20,279,366 100% 4% 23,000,000 100% 13%
Amount per Pupil $1,684 $1,725 2% $1,933 12%
The Summary of Special Education Fund Expenditures chart information comes from pages 6-13 and only uses the 'Special Education Fund'
line items. (Total expenditures excludes Special Ed Coop Fund because it would include expenditures for all schools participating in the Coop.)
0
2,000,000
4,000,000
6,000,000
8,000,000
10,000,000
12,000,000
14,000,000
16,000,000
18,000,000
13
,54
8,5
77
2,8
78
,86
1
66
5,7
61
0
0 9,2
76
2,3
18
,14
3
0 3,1
70
14
,18
8,0
90
2,8
98
,76
9
72
4,7
38
0
0 9,2
19
2,4
54
,63
1
0 3,9
19
16
,28
9,6
00
3,2
65
,00
0
88
2,0
00
0
0 19
,50
0 2
,53
3,9
00
0 10
,00
0
Summary of Special Education Fund Expenditures by Function
2011-2012
2012-2013
2013-2014
Instruction 71%
Student Support 14%
Instructional Support 4%
Transportation 11%
2013-14 Summary of Special Education Fund by Function
Instruction
Student Support
Instructional Support
General Administration
School Administration (Building)
Operations & Maintenance
Transportation
Capital Improvements
Other Costs
9/17/2013 3:57 PM Sumexpen.xlsx Page 5 of 24
USD# 497
Instruction Expenditures (1000)
% %
2011-2012 2012-2013 inc/ 2013-2014 inc/
Actual Actual dec Budget dec
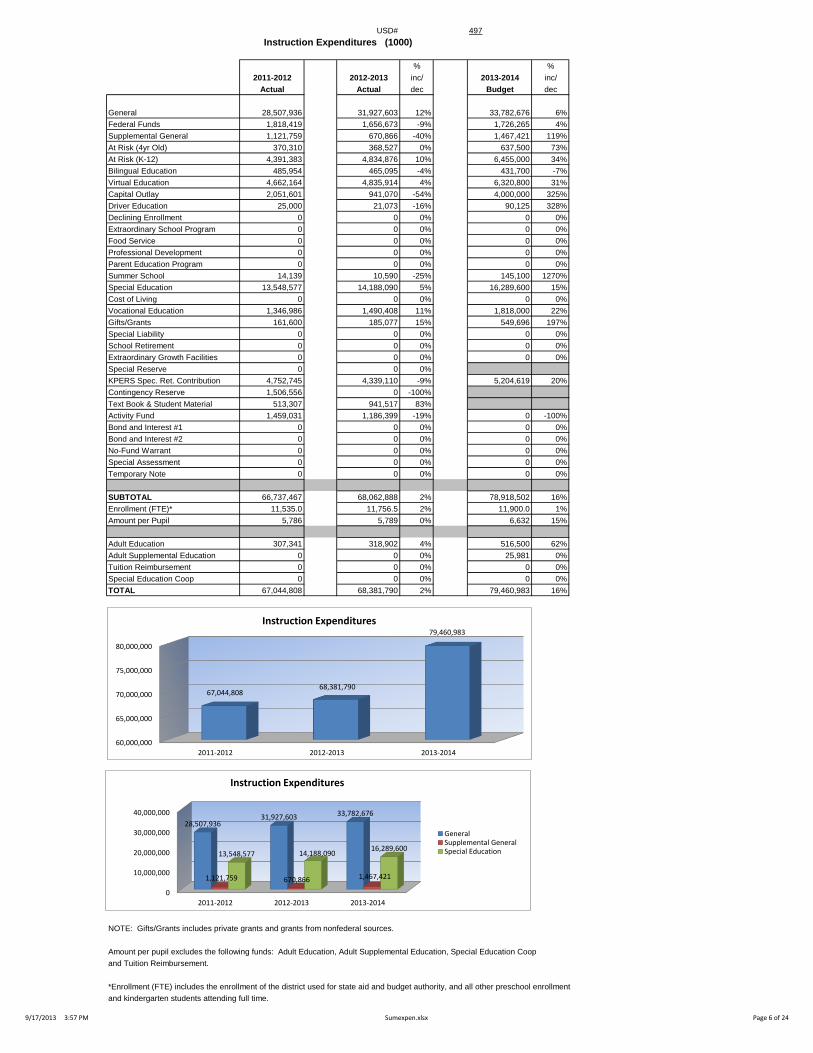
General 28,507,936 31,927,603 12% 33,782,676 6%
Federal Funds 1,818,419 1,656,673 -9% 1,726,265 4%
Supplemental General 1,121,759 670,866 -40% 1,467,421 119%
At Risk (4yr Old) 370,310 368,527 0% 637,500 73%
At Risk (K-12) 4,391,383 4,834,876 10% 6,455,000 34%
Bilingual Education 485,954 465,095 -4% 431,700 -7%
Virtual Education 4,662,164 4,835,914 4% 6,320,800 31%
Capital Outlay 2,051,601 941,070 -54% 4,000,000 325%
Driver Education 25,000 21,073 -16% 90,125 328%
Declining Enrollment 0 0 0% 0 0%
Extraordinary School Program 0 0 0% 0 0%
Food Service 0 0 0% 0 0%
Professional Development 0 0 0% 0 0%
Parent Education Program 0 0 0% 0 0%
Summer School 14,139 10,590 -25% 145,100 1270%
Special Education 13,548,577 14,188,090 5% 16,289,600 15%
Cost of Living 0 0 0% 0 0%
Vocational Education 1,346,986 1,490,408 11% 1,818,000 22%
Gifts/Grants 161,600 185,077 15% 549,696 197%
Special Liability 0 0 0% 0 0%
School Retirement 0 0 0% 0 0%
Extraordinary Growth Facilities 0 0 0% 0 0%
Special Reserve 0 0 0%
KPERS Spec. Ret. Contribution 4,752,745 4,339,110 -9% 5,204,619 20%
Contingency Reserve 1,506,556 0 -100%
Text Book & Student Material 513,307 941,517 83%
Activity Fund 1,459,031 1,186,399 -19% 0 -100%
Bond and Interest #1 0 0 0% 0 0%
Bond and Interest #2 0 0 0% 0 0%
No-Fund Warrant 0 0 0% 0 0%
Special Assessment 0 0 0% 0 0%
Temporary Note 0 0 0% 0 0%
SUBTOTAL 66,737,467 68,062,888 2% 78,918,502 16%
Enrollment (FTE)* 11,535.0 11,756.5 2% 11,900.0 1%
Amount per Pupil 5,786 5,789 0% 6,632 15%
Adult Education 307,341 318,902 4% 516,500 62%
Adult Supplemental Education 0 0 0% 25,981 0%
Tuition Reimbursement 0 0 0% 0 0%
Special Education Coop 0 0 0% 0 0%
TOTAL 67,044,808 68,381,790 2% 79,460,983 16%
NOTE: Gifts/Grants includes private grants and grants from nonfederal sources.
Amount per pupil excludes the following funds: Adult Education, Adult Supplemental Education, Special Education Coop
and Tuition Reimbursement.
*Enrollment (FTE) includes the enrollment of the district used for state aid and budget authority, and all other preschool enrollment
and kindergarten students attending full time.
0
10,000,000
20,000,000
30,000,000
40,000,000
2011-2012 2012-2013 2013-2014
28,507,936 31,927,603 33,782,676
1,121,759 670,866 1,467,421
13,548,577 14,188,090 16,289,600
Instruction Expenditures
GeneralSupplemental GeneralSpecial Education
60,000,000
65,000,000
70,000,000
75,000,000
80,000,000
2011-2012 2012-2013 2013-2014
67,044,808 68,381,790
79,460,983
Instruction Expenditures
9/17/2013 3:57 PM Sumexpen.xlsx Page 6 of 24
USD# 497
Student Support Expenditures (2100)
% %
2011-2012 2012-2013 inc/ 2013-2014 inc/
Actual Actual dec Budget dec
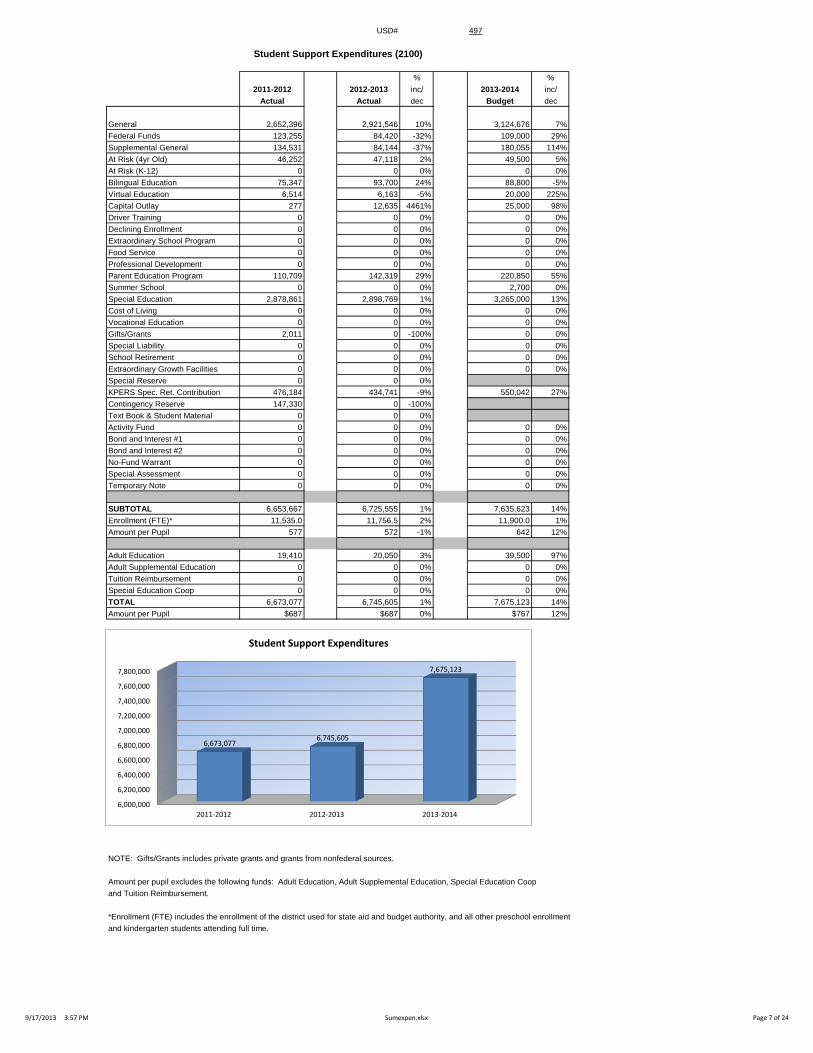
General 2,652,396 2,921,546 10% 3,124,676 7%
Federal Funds 123,255 84,420 -32% 109,000 29%
Supplemental General 134,531 84,144 -37% 180,055 114%
At Risk (4yr Old) 46,252 47,118 2% 49,500 5%
At Risk (K-12) 0 0 0% 0 0%
Bilingual Education 75,347 93,700 24% 88,800 -5%
Virtual Education 6,514 6,163 -5% 20,000 225%
Capital Outlay 277 12,635 4461% 25,000 98%
Driver Training 0 0 0% 0 0%
Declining Enrollment 0 0 0% 0 0%
Extraordinary School Program 0 0 0% 0 0%
Food Service 0 0 0% 0 0%
Professional Development 0 0 0% 0 0%
Parent Education Program 110,709 142,319 29% 220,850 55%
Summer School 0 0 0% 2,700 0%
Special Education 2,878,861 2,898,769 1% 3,265,000 13%
Cost of Living 0 0 0% 0 0%
Vocational Education 0 0 0% 0 0%
Gifts/Grants 2,011 0 -100% 0 0%
Special Liability 0 0 0% 0 0%
School Retirement 0 0 0% 0 0%
Extraordinary Growth Facilities 0 0 0% 0 0%
Special Reserve 0 0 0%
KPERS Spec. Ret. Contribution 476,184 434,741 -9% 550,042 27%
Contingency Reserve 147,330 0 -100%
Text Book & Student Material 0 0 0%
Activity Fund 0 0 0% 0 0%
Bond and Interest #1 0 0 0% 0 0%
Bond and Interest #2 0 0 0% 0 0%
No-Fund Warrant 0 0 0% 0 0%
Special Assessment 0 0 0% 0 0%
Temporary Note 0 0 0% 0 0%
SUBTOTAL 6,653,667 6,725,555 1% 7,635,623 14%
Enrollment (FTE)* 11,535.0 11,756.5 2% 11,900.0 1%
Amount per Pupil 577 572 -1% 642 12%
Adult Education 19,410 20,050 3% 39,500 97%
Adult Supplemental Education 0 0 0% 0 0%
Tuition Reimbursement 0 0 0% 0 0%
Special Education Coop 0 0 0% 0 0%
TOTAL 6,673,077 6,745,605 1% 7,675,123 14%
Amount per Pupil $687 $687 0% $767 12%
NOTE: Gifts/Grants includes private grants and grants from nonfederal sources.
Amount per pupil excludes the following funds: Adult Education, Adult Supplemental Education, Special Education Coop
and Tuition Reimbursement.
*Enrollment (FTE) includes the enrollment of the district used for state aid and budget authority, and all other preschool enrollment
and kindergarten students attending full time.
6,000,000
6,200,000
6,400,000
6,600,000
6,800,000
7,000,000
7,200,000
7,400,000
7,600,000
7,800,000
2011-2012 2012-2013 2013-2014
6,673,077 6,745,605
7,675,123
Student Support Expenditures
9/17/2013 3:57 PM Sumexpen.xlsx Page 7 of 24
USD# 497
Instructional Support Expenditures (2200)
% %
2011-2012 2012-2013 inc/ 2013-2014 inc/
Actual Actual dec Budget dec
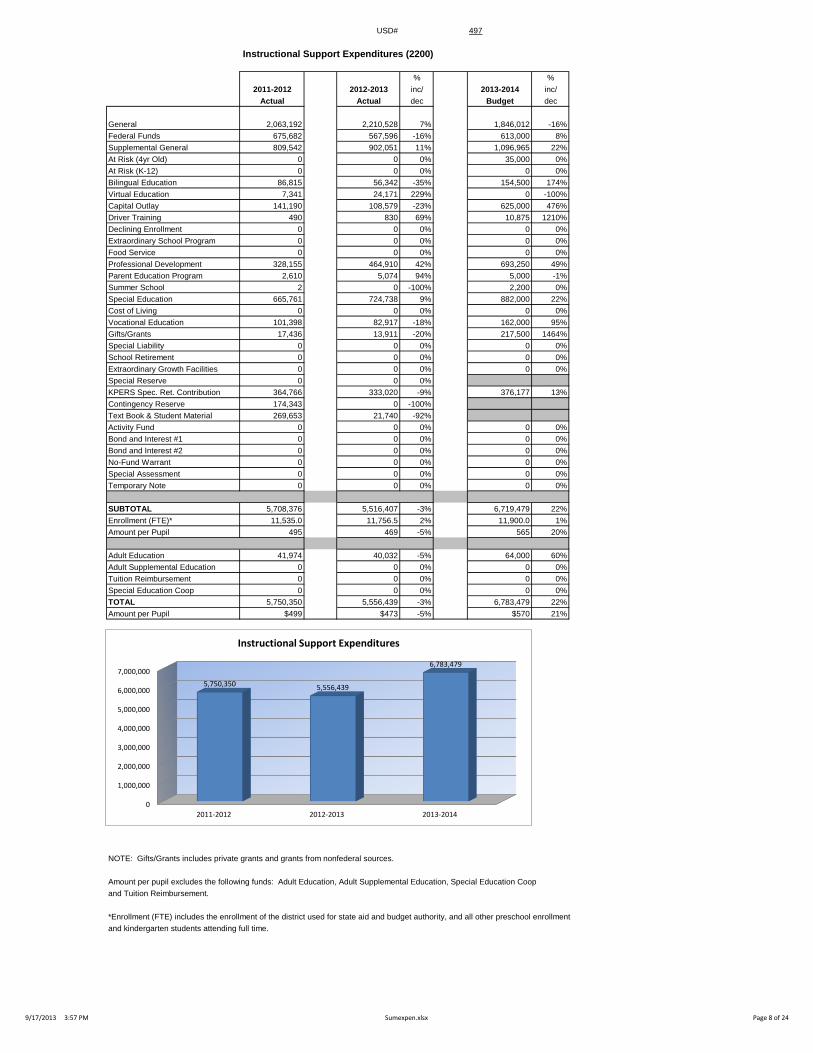
General 2,063,192 2,210,528 7% 1,846,012 -16%
Federal Funds 675,682 567,596 -16% 613,000 8%
Supplemental General 809,542 902,051 11% 1,096,965 22%
At Risk (4yr Old) 0 0 0% 35,000 0%
At Risk (K-12) 0 0 0% 0 0%
Bilingual Education 86,815 56,342 -35% 154,500 174%
Virtual Education 7,341 24,171 229% 0 -100%
Capital Outlay 141,190 108,579 -23% 625,000 476%
Driver Training 490 830 69% 10,875 1210%
Declining Enrollment 0 0 0% 0 0%
Extraordinary School Program 0 0 0% 0 0%
Food Service 0 0 0% 0 0%
Professional Development 328,155 464,910 42% 693,250 49%
Parent Education Program 2,610 5,074 94% 5,000 -1%
Summer School 2 0 -100% 2,200 0%
Special Education 665,761 724,738 9% 882,000 22%
Cost of Living 0 0 0% 0 0%
Vocational Education 101,398 82,917 -18% 162,000 95%
Gifts/Grants 17,436 13,911 -20% 217,500 1464%
Special Liability 0 0 0% 0 0%
School Retirement 0 0 0% 0 0%
Extraordinary Growth Facilities 0 0 0% 0 0%
Special Reserve 0 0 0%
KPERS Spec. Ret. Contribution 364,766 333,020 -9% 376,177 13%
Contingency Reserve 174,343 0 -100%
Text Book & Student Material 269,653 21,740 -92%
Activity Fund 0 0 0% 0 0%
Bond and Interest #1 0 0 0% 0 0%
Bond and Interest #2 0 0 0% 0 0%
No-Fund Warrant 0 0 0% 0 0%
Special Assessment 0 0 0% 0 0%
Temporary Note 0 0 0% 0 0%
SUBTOTAL 5,708,376 5,516,407 -3% 6,719,479 22%
Enrollment (FTE)* 11,535.0 11,756.5 2% 11,900.0 1%
Amount per Pupil 495 469 -5% 565 20%
Adult Education 41,974 40,032 -5% 64,000 60%
Adult Supplemental Education 0 0 0% 0 0%
Tuition Reimbursement 0 0 0% 0 0%
Special Education Coop 0 0 0% 0 0%
TOTAL 5,750,350 5,556,439 -3% 6,783,479 22%
Amount per Pupil $499 $473 -5% $570 21%
NOTE: Gifts/Grants includes private grants and grants from nonfederal sources.
Amount per pupil excludes the following funds: Adult Education, Adult Supplemental Education, Special Education Coop
and Tuition Reimbursement.
*Enrollment (FTE) includes the enrollment of the district used for state aid and budget authority, and all other preschool enrollment
and kindergarten students attending full time.
0
1,000,000
2,000,000
3,000,000
4,000,000
5,000,000
6,000,000
7,000,000
2011-2012 2012-2013 2013-2014
5,750,350 5,556,439
6,783,479
Instructional Support Expenditures
9/17/2013 3:57 PM Sumexpen.xlsx Page 8 of 24

USD# 497
General Administration Expenditures (2300)
% %
2011-2012 2012-2013 inc/ 2013-2014 inc/
Actual Actual dec Budget dec
General 177,019 210,870 19% 182,450 -13%
Federal Funds 89,506 70,887 -21% 79,700 12%
Supplemental General 350,000 345,307 -1% 477,190 38%
At Risk (4yr Old) 0 0 0% 0 0%
At Risk (K-12) 0 0 0% 0 0%
Bilingual Education 0 0 0% 0 0%
Virtual Education 0 0 0% 0 0%
Capital Outlay 0 1,227 0% 25,000 1937%
Driver Training 0 0 0% 0 0%
Declining Enrollment 0 0 0% 0 0%
Extraordinary School Program 0 0 0% 0 0%
Food Service 0 0 0% 0 0%
Professional Development 0 0 0% 0 0%
Parent Education Program 0 0 0% 0 0%
Summer School 0 0 0% 0 0%
Special Education 0 0 0% 0 0%
Cost of Living 0 0 0% 0 0%
Vocational Education 0 0 0% 0 0%
Gifts/Grants 0 0 0% 0 0%
Special Liability Expense 0 0 0% 0 0%
School Retirement 0 0 0% 0 0%
Extraordinary Growth Facilities 0 0 0% 0 0%
Special Reserve 0 0 0%
KPERS Spec. Ret. Contribution 40,902 37,342 -9% 40,463 8%
Contingency Reserve 3,177 0 -100%
Text Book & Student Material 0 0 0%
Activity Fund 0 0 0% 0 0%
Bond and Interest #1 0 0 0% 0 0%
Bond and Interest #2 0 0 0% 0 0%
No-Fund Warrant 0 0 0% 0 0%
Special Assessment 0 0 0% 0 0%
Temporary Note 0 0 0% 0 0%
SUBTOTAL 660,604 665,633 1% 804,803 21%
Enrollment (FTE)* 11,535.0 11,756.5 2% 11,900.0 1%
Amount per Pupil 57 57 -1% 68 19%
Adult Education 0 0 0% 0 0%
Adult Supplemental Education 0 0 0% 0 0%
Tuition Reimbursement 0 0 0% 0 0%
Special Education Coop 0 0 0% 0 0%
TOTAL 660,604 665,633 1% 804,803 21%
NOTE: Gifts/Grants includes private grants and grants from nonfederal sources.
Amount per pupil excludes the following funds: Adult Education, Adult Supplemental Education, Special Education Coop
and Tuition Reimbursement.
*Enrollment (FTE) includes the enrollment of the district used for state aid and budget authority, and all other preschool enrollment
and kindergarten students attending full time.
0
100,000
200,000
300,000
400,000
500,000
600,000
700,000
800,000
900,000
2011-2012 2012-2013 2013-2014
660,604 665,633
804,803
General Administration Expenditures
9/17/2013 3:57 PM Sumexpen.xlsx Page 9 of 24
USD# 497
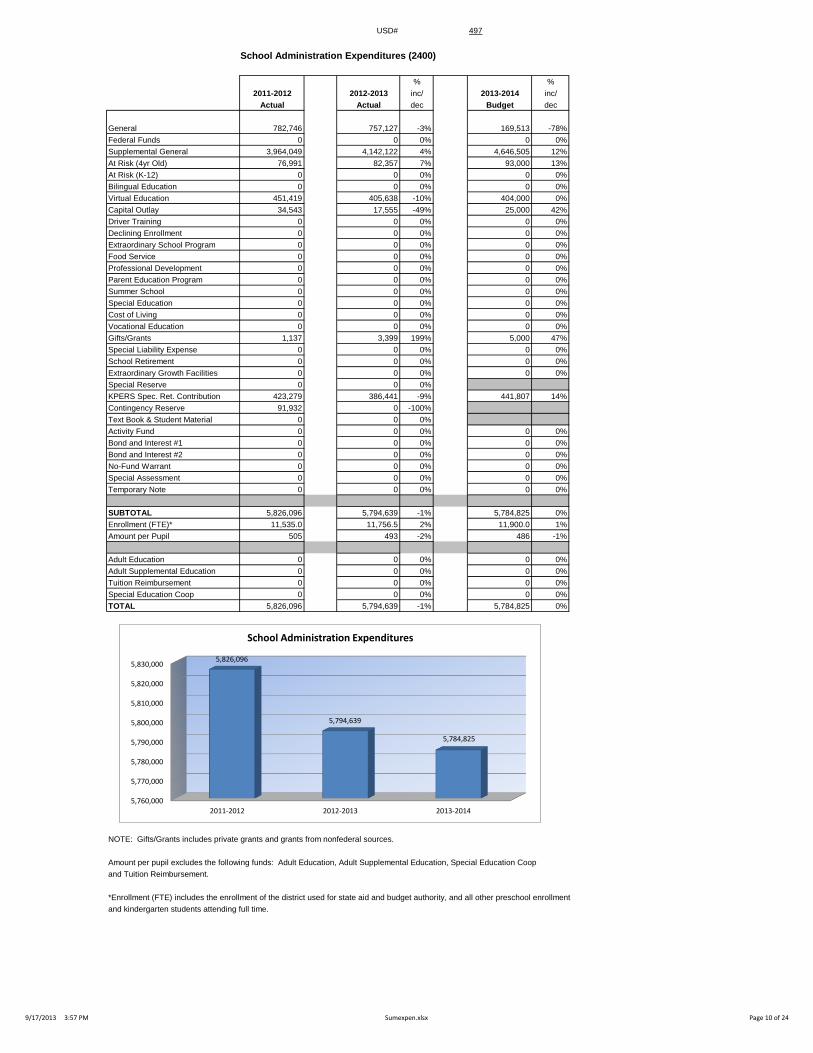
School Administration Expenditures (2400)
% %
2011-2012 2012-2013 inc/ 2013-2014 inc/
Actual Actual dec Budget dec
General 782,746 757,127 -3% 169,513 -78%
Federal Funds 0 0 0% 0 0%
Supplemental General 3,964,049 4,142,122 4% 4,646,505 12%
At Risk (4yr Old) 76,991 82,357 7% 93,000 13%
At Risk (K-12) 0 0 0% 0 0%
Bilingual Education 0 0 0% 0 0%
Virtual Education 451,419 405,638 -10% 404,000 0%
Capital Outlay 34,543 17,555 -49% 25,000 42%
Driver Training 0 0 0% 0 0%
Declining Enrollment 0 0 0% 0 0%
Extraordinary School Program 0 0 0% 0 0%
Food Service 0 0 0% 0 0%
Professional Development 0 0 0% 0 0%
Parent Education Program 0 0 0% 0 0%
Summer School 0 0 0% 0 0%
Special Education 0 0 0% 0 0%
Cost of Living 0 0 0% 0 0%
Vocational Education 0 0 0% 0 0%
Gifts/Grants 1,137 3,399 199% 5,000 47%
Special Liability Expense 0 0 0% 0 0%
School Retirement 0 0 0% 0 0%
Extraordinary Growth Facilities 0 0 0% 0 0%
Special Reserve 0 0 0%
KPERS Spec. Ret. Contribution 423,279 386,441 -9% 441,807 14%
Contingency Reserve 91,932 0 -100%
Text Book & Student Material 0 0 0%
Activity Fund 0 0 0% 0 0%
Bond and Interest #1 0 0 0% 0 0%
Bond and Interest #2 0 0 0% 0 0%
No-Fund Warrant 0 0 0% 0 0%
Special Assessment 0 0 0% 0 0%
Temporary Note 0 0 0% 0 0%
SUBTOTAL 5,826,096 5,794,639 -1% 5,784,825 0%
Enrollment (FTE)* 11,535.0 11,756.5 2% 11,900.0 1%
Amount per Pupil 505 493 -2% 486 -1%
Adult Education 0 0 0% 0 0%
Adult Supplemental Education 0 0 0% 0 0%
Tuition Reimbursement 0 0 0% 0 0%
Special Education Coop 0 0 0% 0 0%
TOTAL 5,826,096 5,794,639 -1% 5,784,825 0%
NOTE: Gifts/Grants includes private grants and grants from nonfederal sources.
Amount per pupil excludes the following funds: Adult Education, Adult Supplemental Education, Special Education Coop
and Tuition Reimbursement.
*Enrollment (FTE) includes the enrollment of the district used for state aid and budget authority, and all other preschool enrollment
and kindergarten students attending full time.
5,760,000
5,770,000
5,780,000
5,790,000
5,800,000
5,810,000
5,820,000
5,830,000
2011-2012 2012-2013 2013-2014
5,826,096
5,794,639
5,784,825
School Administration Expenditures
9/17/2013 3:57 PM Sumexpen.xlsx Page 10 of 24
USD# 497
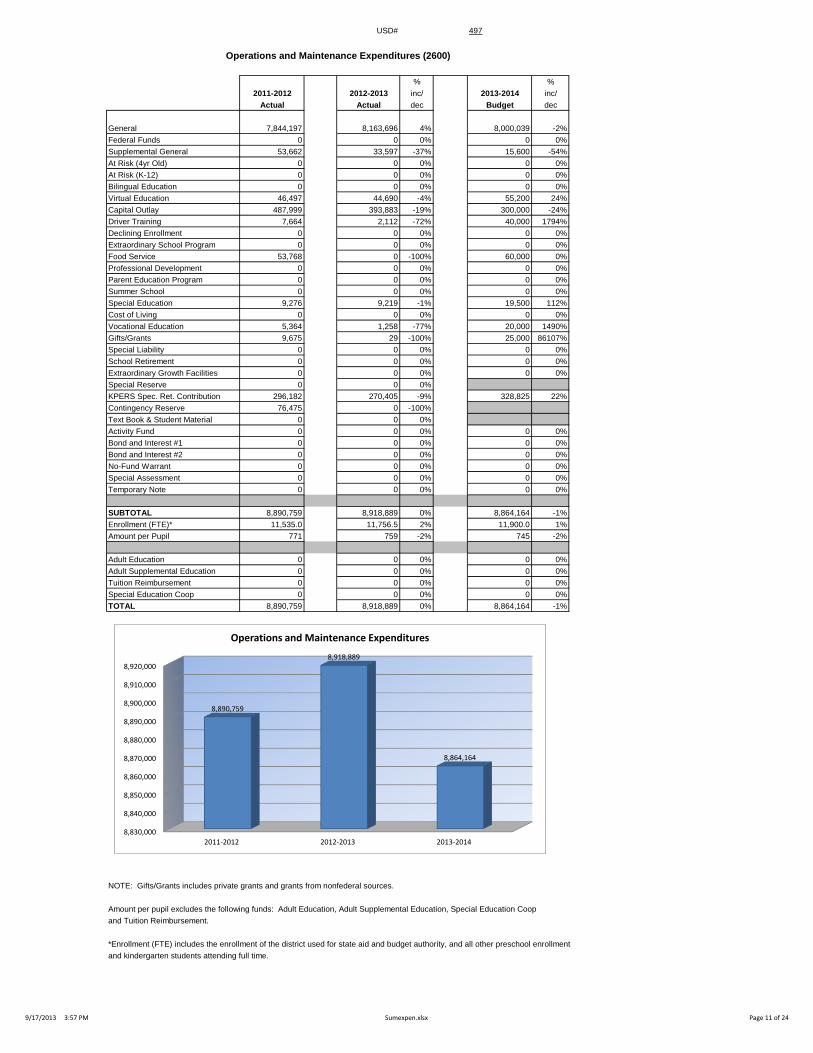
Operations and Maintenance Expenditures (2600)
% %
2011-2012 2012-2013 inc/ 2013-2014 inc/
Actual Actual dec Budget dec
General 7,844,197 8,163,696 4% 8,000,039 -2%
Federal Funds 0 0 0% 0 0%
Supplemental General 53,662 33,597 -37% 15,600 -54%
At Risk (4yr Old) 0 0 0% 0 0%
At Risk (K-12) 0 0 0% 0 0%
Bilingual Education 0 0 0% 0 0%
Virtual Education 46,497 44,690 -4% 55,200 24%
Capital Outlay 487,999 393,883 -19% 300,000 -24%
Driver Training 7,664 2,112 -72% 40,000 1794%
Declining Enrollment 0 0 0% 0 0%
Extraordinary School Program 0 0 0% 0 0%
Food Service 53,768 0 -100% 60,000 0%
Professional Development 0 0 0% 0 0%
Parent Education Program 0 0 0% 0 0%
Summer School 0 0 0% 0 0%
Special Education 9,276 9,219 -1% 19,500 112%
Cost of Living 0 0 0% 0 0%
Vocational Education 5,364 1,258 -77% 20,000 1490%
Gifts/Grants 9,675 29 -100% 25,000 86107%
Special Liability 0 0 0% 0 0%
School Retirement 0 0 0% 0 0%
Extraordinary Growth Facilities 0 0 0% 0 0%
Special Reserve 0 0 0%
KPERS Spec. Ret. Contribution 296,182 270,405 -9% 328,825 22%
Contingency Reserve 76,475 0 -100%
Text Book & Student Material 0 0 0%
Activity Fund 0 0 0% 0 0%
Bond and Interest #1 0 0 0% 0 0%
Bond and Interest #2 0 0 0% 0 0%
No-Fund Warrant 0 0 0% 0 0%
Special Assessment 0 0 0% 0 0%
Temporary Note 0 0 0% 0 0%
SUBTOTAL 8,890,759 8,918,889 0% 8,864,164 -1%
Enrollment (FTE)* 11,535.0 11,756.5 2% 11,900.0 1%
Amount per Pupil 771 759 -2% 745 -2%
Adult Education 0 0 0% 0 0%
Adult Supplemental Education 0 0 0% 0 0%
Tuition Reimbursement 0 0 0% 0 0%
Special Education Coop 0 0 0% 0 0%
TOTAL 8,890,759 8,918,889 0% 8,864,164 -1%
NOTE: Gifts/Grants includes private grants and grants from nonfederal sources.
Amount per pupil excludes the following funds: Adult Education, Adult Supplemental Education, Special Education Coop
and Tuition Reimbursement.
*Enrollment (FTE) includes the enrollment of the district used for state aid and budget authority, and all other preschool enrollment
and kindergarten students attending full time.
8,830,000
8,840,000
8,850,000
8,860,000
8,870,000
8,880,000
8,890,000
8,900,000
8,910,000
8,920,000
2011-2012 2012-2013 2013-2014
8,890,759
8,918,889
8,864,164
Operations and Maintenance Expenditures
9/17/2013 3:57 PM Sumexpen.xlsx Page 11 of 24
USD# 497
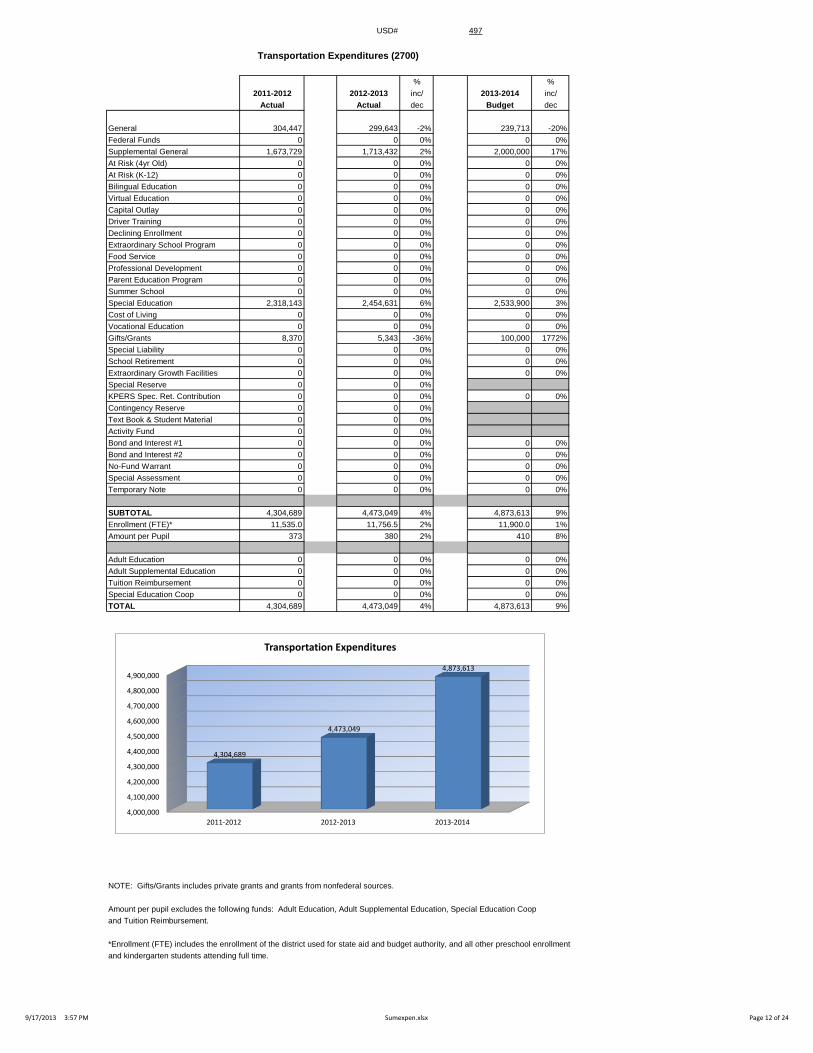
Transportation Expenditures (2700)
% %
2011-2012 2012-2013 inc/ 2013-2014 inc/
Actual Actual dec Budget dec
General 304,447 299,643 -2% 239,713 -20%
Federal Funds 0 0 0% 0 0%
Supplemental General 1,673,729 1,713,432 2% 2,000,000 17%
At Risk (4yr Old) 0 0 0% 0 0%
At Risk (K-12) 0 0 0% 0 0%
Bilingual Education 0 0 0% 0 0%
Virtual Education 0 0 0% 0 0%
Capital Outlay 0 0 0% 0 0%
Driver Training 0 0 0% 0 0%
Declining Enrollment 0 0 0% 0 0%
Extraordinary School Program 0 0 0% 0 0%
Food Service 0 0 0% 0 0%
Professional Development 0 0 0% 0 0%
Parent Education Program 0 0 0% 0 0%
Summer School 0 0 0% 0 0%
Special Education 2,318,143 2,454,631 6% 2,533,900 3%
Cost of Living 0 0 0% 0 0%
Vocational Education 0 0 0% 0 0%
Gifts/Grants 8,370 5,343 -36% 100,000 1772%
Special Liability 0 0 0% 0 0%
School Retirement 0 0 0% 0 0%
Extraordinary Growth Facilities 0 0 0% 0 0%
Special Reserve 0 0 0%
KPERS Spec. Ret. Contribution 0 0 0% 0 0%
Contingency Reserve 0 0 0%
Text Book & Student Material 0 0 0%
Activity Fund 0 0 0%
Bond and Interest #1 0 0 0% 0 0%
Bond and Interest #2 0 0 0% 0 0%
No-Fund Warrant 0 0 0% 0 0%
Special Assessment 0 0 0% 0 0%
Temporary Note 0 0 0% 0 0%
SUBTOTAL 4,304,689 4,473,049 4% 4,873,613 9%
Enrollment (FTE)* 11,535.0 11,756.5 2% 11,900.0 1%
Amount per Pupil 373 380 2% 410 8%
Adult Education 0 0 0% 0 0%
Adult Supplemental Education 0 0 0% 0 0%
Tuition Reimbursement 0 0 0% 0 0%
Special Education Coop 0 0 0% 0 0%
TOTAL 4,304,689 4,473,049 4% 4,873,613 9%
NOTE: Gifts/Grants includes private grants and grants from nonfederal sources.
Amount per pupil excludes the following funds: Adult Education, Adult Supplemental Education, Special Education Coop
and Tuition Reimbursement.
*Enrollment (FTE) includes the enrollment of the district used for state aid and budget authority, and all other preschool enrollment
and kindergarten students attending full time.
4,000,000
4,100,000
4,200,000
4,300,000
4,400,000
4,500,000
4,600,000
4,700,000
4,800,000
4,900,000
2011-2012 2012-2013 2013-2014
4,304,689
4,473,049
4,873,613
Transportation Expenditures
9/17/2013 3:57 PM Sumexpen.xlsx Page 12 of 24
USD# 497
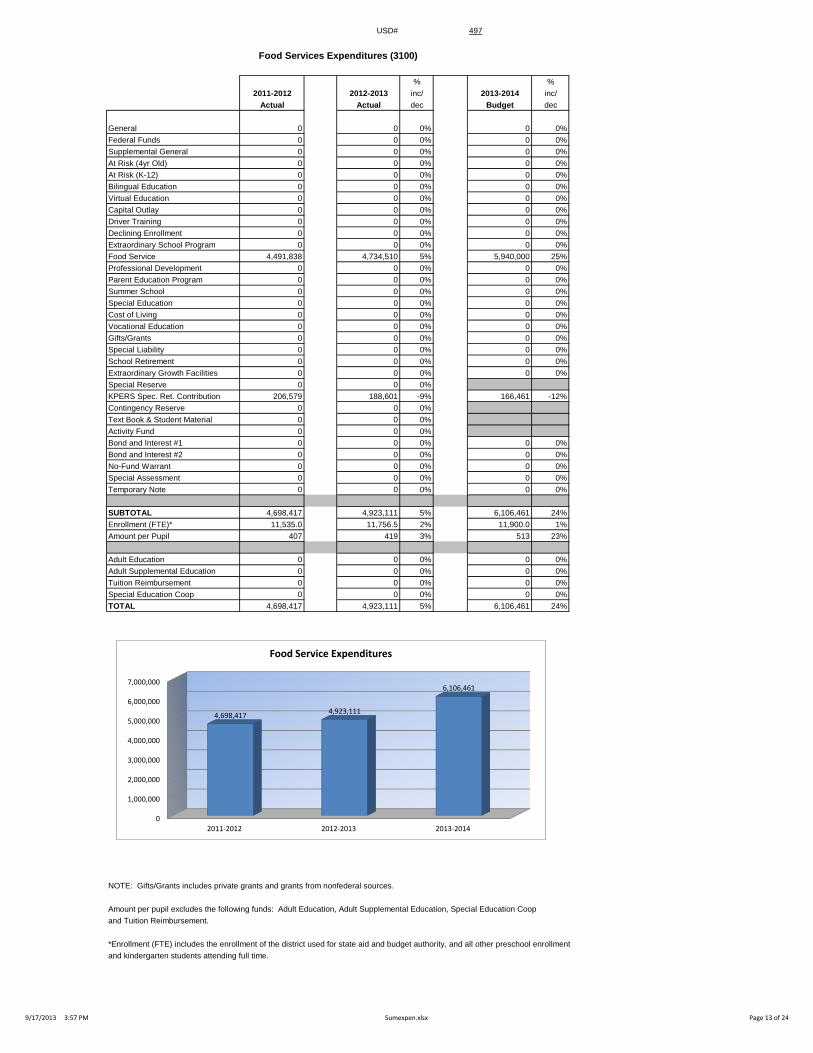
Food Services Expenditures (3100)
% %
2011-2012 2012-2013 inc/ 2013-2014 inc/
Actual Actual dec Budget dec
General 0 0 0% 0 0%
Federal Funds 0 0 0% 0 0%
Supplemental General 0 0 0% 0 0%
At Risk (4yr Old) 0 0 0% 0 0%
At Risk (K-12) 0 0 0% 0 0%
Bilingual Education 0 0 0% 0 0%
Virtual Education 0 0 0% 0 0%
Capital Outlay 0 0 0% 0 0%
Driver Training 0 0 0% 0 0%
Declining Enrollment 0 0 0% 0 0%
Extraordinary School Program 0 0 0% 0 0%
Food Service 4,491,838 4,734,510 5% 5,940,000 25%
Professional Development 0 0 0% 0 0%
Parent Education Program 0 0 0% 0 0%
Summer School 0 0 0% 0 0%
Special Education 0 0 0% 0 0%
Cost of Living 0 0 0% 0 0%
Vocational Education 0 0 0% 0 0%
Gifts/Grants 0 0 0% 0 0%
Special Liability 0 0 0% 0 0%
School Retirement 0 0 0% 0 0%
Extraordinary Growth Facilities 0 0 0% 0 0%
Special Reserve 0 0 0%
KPERS Spec. Ret. Contribution 206,579 188,601 -9% 166,461 -12%
Contingency Reserve 0 0 0%
Text Book & Student Material 0 0 0%
Activity Fund 0 0 0%
Bond and Interest #1 0 0 0% 0 0%
Bond and Interest #2 0 0 0% 0 0%
No-Fund Warrant 0 0 0% 0 0%
Special Assessment 0 0 0% 0 0%
Temporary Note 0 0 0% 0 0%
SUBTOTAL 4,698,417 4,923,111 5% 6,106,461 24%
Enrollment (FTE)* 11,535.0 11,756.5 2% 11,900.0 1%
Amount per Pupil 407 419 3% 513 23%
Adult Education 0 0 0% 0 0%
Adult Supplemental Education 0 0 0% 0 0%
Tuition Reimbursement 0 0 0% 0 0%
Special Education Coop 0 0 0% 0 0%
TOTAL 4,698,417 4,923,111 5% 6,106,461 24%
NOTE: Gifts/Grants includes private grants and grants from nonfederal sources.
Amount per pupil excludes the following funds: Adult Education, Adult Supplemental Education, Special Education Coop
and Tuition Reimbursement.
*Enrollment (FTE) includes the enrollment of the district used for state aid and budget authority, and all other preschool enrollment
and kindergarten students attending full time.
0
1,000,000
2,000,000
3,000,000
4,000,000
5,000,000
6,000,000
7,000,000
2011-2012 2012-2013 2013-2014
4,698,417 4,923,111
6,106,461
Food Service Expenditures
9/17/2013 3:57 PM Sumexpen.xlsx Page 13 of 24
USD# 497
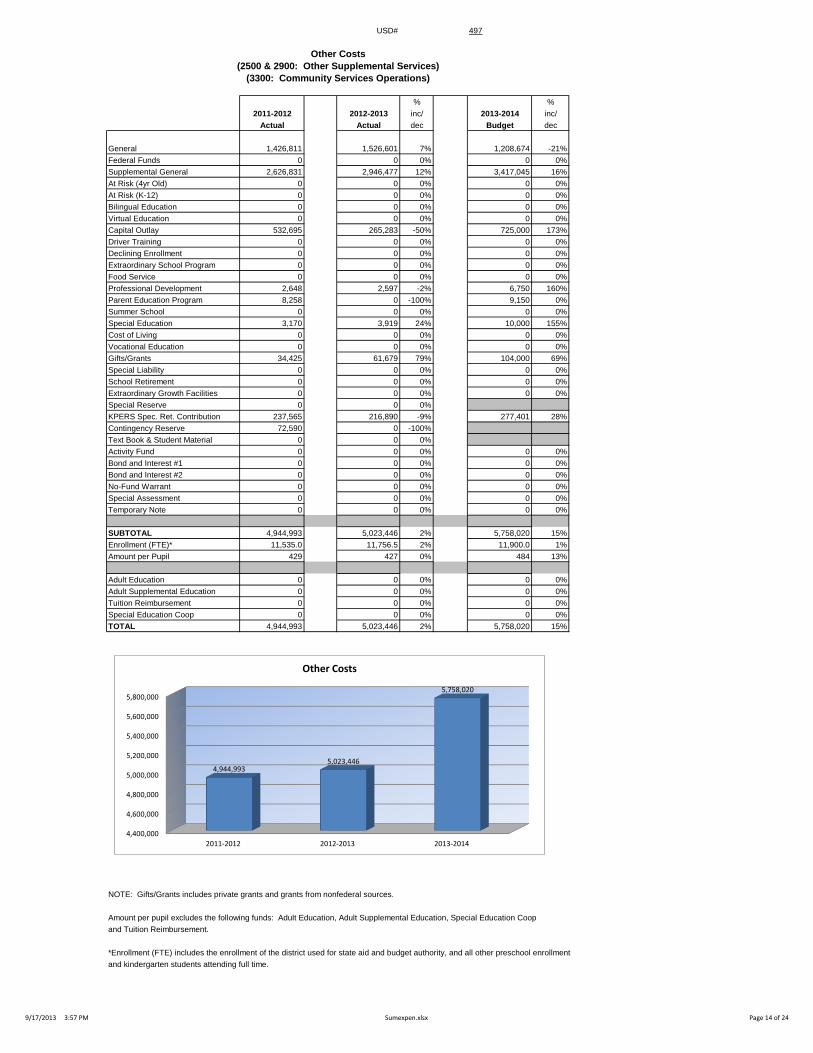
Other Costs
(2500 & 2900: Other Supplemental Services)
(3300: Community Services Operations)
% %
2011-2012 2012-2013 inc/ 2013-2014 inc/
Actual Actual dec Budget dec
General 1,426,811 1,526,601 7% 1,208,674 -21%
Federal Funds 0 0 0% 0 0%
Supplemental General 2,626,831 2,946,477 12% 3,417,045 16%
At Risk (4yr Old) 0 0 0% 0 0%
At Risk (K-12) 0 0 0% 0 0%
Bilingual Education 0 0 0% 0 0%
Virtual Education 0 0 0% 0 0%
Capital Outlay 532,695 265,283 -50% 725,000 173%
Driver Training 0 0 0% 0 0%
Declining Enrollment 0 0 0% 0 0%
Extraordinary School Program 0 0 0% 0 0%
Food Service 0 0 0% 0 0%
Professional Development 2,648 2,597 -2% 6,750 160%
Parent Education Program 8,258 0 -100% 9,150 0%
Summer School 0 0 0% 0 0%
Special Education 3,170 3,919 24% 10,000 155%
Cost of Living 0 0 0% 0 0%
Vocational Education 0 0 0% 0 0%
Gifts/Grants 34,425 61,679 79% 104,000 69%
Special Liability 0 0 0% 0 0%
School Retirement 0 0 0% 0 0%
Extraordinary Growth Facilities 0 0 0% 0 0%
Special Reserve 0 0 0%
KPERS Spec. Ret. Contribution 237,565 216,890 -9% 277,401 28%
Contingency Reserve 72,590 0 -100%
Text Book & Student Material 0 0 0%
Activity Fund 0 0 0% 0 0%
Bond and Interest #1 0 0 0% 0 0%
Bond and Interest #2 0 0 0% 0 0%
No-Fund Warrant 0 0 0% 0 0%
Special Assessment 0 0 0% 0 0%
Temporary Note 0 0 0% 0 0%
SUBTOTAL 4,944,993 5,023,446 2% 5,758,020 15%
Enrollment (FTE)* 11,535.0 11,756.5 2% 11,900.0 1%
Amount per Pupil 429 427 0% 484 13%
Adult Education 0 0 0% 0 0%
Adult Supplemental Education 0 0 0% 0 0%
Tuition Reimbursement 0 0 0% 0 0%
Special Education Coop 0 0 0% 0 0%
TOTAL 4,944,993 5,023,446 2% 5,758,020 15%
NOTE: Gifts/Grants includes private grants and grants from nonfederal sources.
Amount per pupil excludes the following funds: Adult Education, Adult Supplemental Education, Special Education Coop
and Tuition Reimbursement.
*Enrollment (FTE) includes the enrollment of the district used for state aid and budget authority, and all other preschool enrollment
and kindergarten students attending full time.
4,400,000
4,600,000
4,800,000
5,000,000
5,200,000
5,400,000
5,600,000
5,800,000
2011-2012 2012-2013 2013-2014
4,944,993 5,023,446
5,758,020
Other Costs
9/17/2013 3:57 PM Sumexpen.xlsx Page 14 of 24
USD# 497
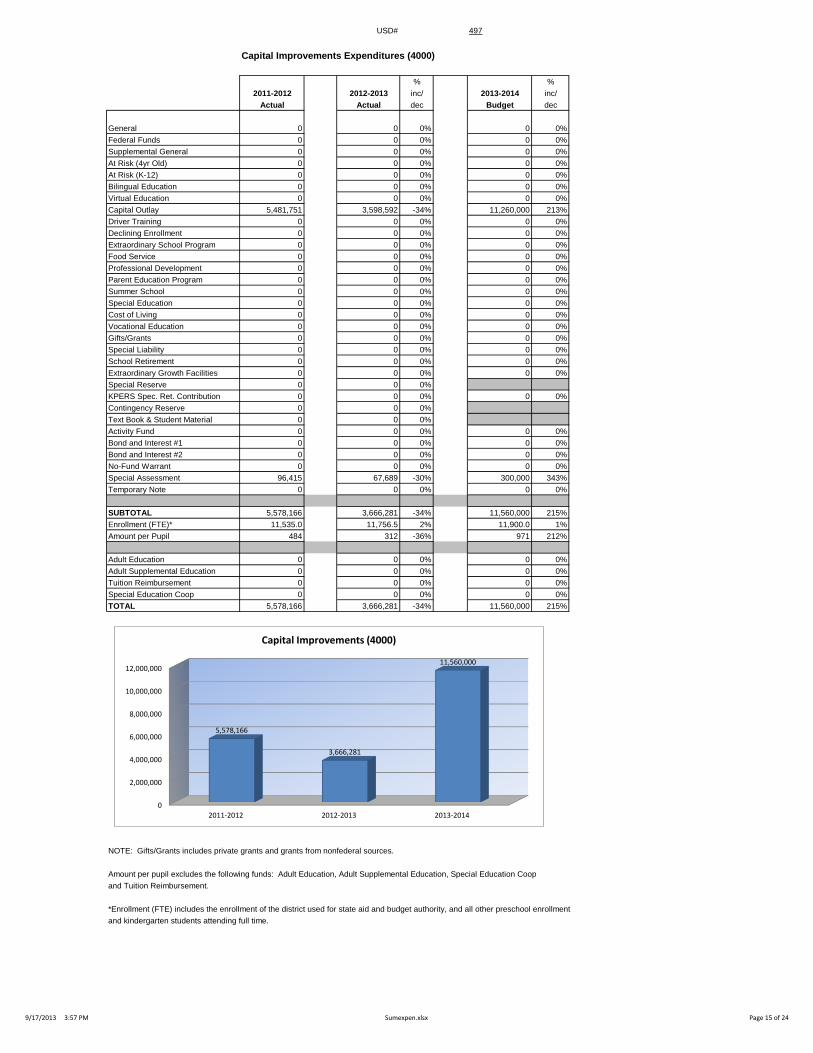
Capital Improvements Expenditures (4000)
% %
2011-2012 2012-2013 inc/ 2013-2014 inc/
Actual Actual dec Budget dec
General 0 0 0% 0 0%
Federal Funds 0 0 0% 0 0%
Supplemental General 0 0 0% 0 0%
At Risk (4yr Old) 0 0 0% 0 0%
At Risk (K-12) 0 0 0% 0 0%
Bilingual Education 0 0 0% 0 0%
Virtual Education 0 0 0% 0 0%
Capital Outlay 5,481,751 3,598,592 -34% 11,260,000 213%
Driver Training 0 0 0% 0 0%
Declining Enrollment 0 0 0% 0 0%
Extraordinary School Program 0 0 0% 0 0%
Food Service 0 0 0% 0 0%
Professional Development 0 0 0% 0 0%
Parent Education Program 0 0 0% 0 0%
Summer School 0 0 0% 0 0%
Special Education 0 0 0% 0 0%
Cost of Living 0 0 0% 0 0%
Vocational Education 0 0 0% 0 0%
Gifts/Grants 0 0 0% 0 0%
Special Liability 0 0 0% 0 0%
School Retirement 0 0 0% 0 0%
Extraordinary Growth Facilities 0 0 0% 0 0%
Special Reserve 0 0 0%
KPERS Spec. Ret. Contribution 0 0 0% 0 0%
Contingency Reserve 0 0 0%
Text Book & Student Material 0 0 0%
Activity Fund 0 0 0% 0 0%
Bond and Interest #1 0 0 0% 0 0%
Bond and Interest #2 0 0 0% 0 0%
No-Fund Warrant 0 0 0% 0 0%
Special Assessment 96,415 67,689 -30% 300,000 343%
Temporary Note 0 0 0% 0 0%
SUBTOTAL 5,578,166 3,666,281 -34% 11,560,000 215%
Enrollment (FTE)* 11,535.0 11,756.5 2% 11,900.0 1%
Amount per Pupil 484 312 -36% 971 212%
Adult Education 0 0 0% 0 0%
Adult Supplemental Education 0 0 0% 0 0%
Tuition Reimbursement 0 0 0% 0 0%
Special Education Coop 0 0 0% 0 0%
TOTAL 5,578,166 3,666,281 -34% 11,560,000 215%
NOTE: Gifts/Grants includes private grants and grants from nonfederal sources.
Amount per pupil excludes the following funds: Adult Education, Adult Supplemental Education, Special Education Coop
and Tuition Reimbursement.
*Enrollment (FTE) includes the enrollment of the district used for state aid and budget authority, and all other preschool enrollment
and kindergarten students attending full time.
0
2,000,000
4,000,000
6,000,000
8,000,000
10,000,000
12,000,000
2011-2012 2012-2013 2013-2014
5,578,166
3,666,281
11,560,000
Capital Improvements (4000)
9/17/2013 3:57 PM Sumexpen.xlsx Page 15 of 24
USD# 497
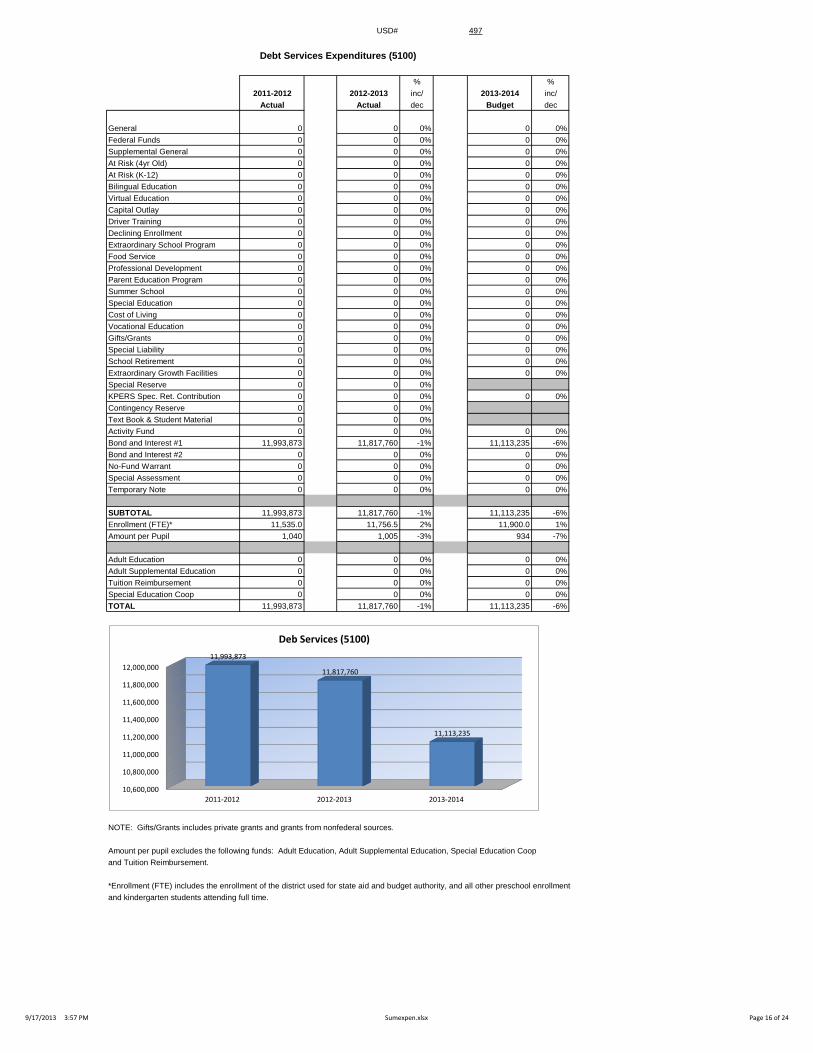
Debt Services Expenditures (5100)
% %
2011-2012 2012-2013 inc/ 2013-2014 inc/
Actual Actual dec Budget dec
General 0 0 0% 0 0%
Federal Funds 0 0 0% 0 0%
Supplemental General 0 0 0% 0 0%
At Risk (4yr Old) 0 0 0% 0 0%
At Risk (K-12) 0 0 0% 0 0%
Bilingual Education 0 0 0% 0 0%
Virtual Education 0 0 0% 0 0%
Capital Outlay 0 0 0% 0 0%
Driver Training 0 0 0% 0 0%
Declining Enrollment 0 0 0% 0 0%
Extraordinary School Program 0 0 0% 0 0%
Food Service 0 0 0% 0 0%
Professional Development 0 0 0% 0 0%
Parent Education Program 0 0 0% 0 0%
Summer School 0 0 0% 0 0%
Special Education 0 0 0% 0 0%
Cost of Living 0 0 0% 0 0%
Vocational Education 0 0 0% 0 0%
Gifts/Grants 0 0 0% 0 0%
Special Liability 0 0 0% 0 0%
School Retirement 0 0 0% 0 0%
Extraordinary Growth Facilities 0 0 0% 0 0%
Special Reserve 0 0 0%
KPERS Spec. Ret. Contribution 0 0 0% 0 0%
Contingency Reserve 0 0 0%
Text Book & Student Material 0 0 0%
Activity Fund 0 0 0% 0 0%
Bond and Interest #1 11,993,873 11,817,760 -1% 11,113,235 -6%
Bond and Interest #2 0 0 0% 0 0%
No-Fund Warrant 0 0 0% 0 0%
Special Assessment 0 0 0% 0 0%
Temporary Note 0 0 0% 0 0%
SUBTOTAL 11,993,873 11,817,760 -1% 11,113,235 -6%
Enrollment (FTE)* 11,535.0 11,756.5 2% 11,900.0 1%
Amount per Pupil 1,040 1,005 -3% 934 -7%
Adult Education 0 0 0% 0 0%
Adult Supplemental Education 0 0 0% 0 0%
Tuition Reimbursement 0 0 0% 0 0%
Special Education Coop 0 0 0% 0 0%
TOTAL 11,993,873 11,817,760 -1% 11,113,235 -6%
NOTE: Gifts/Grants includes private grants and grants from nonfederal sources.
Amount per pupil excludes the following funds: Adult Education, Adult Supplemental Education, Special Education Coop
and Tuition Reimbursement.
*Enrollment (FTE) includes the enrollment of the district used for state aid and budget authority, and all other preschool enrollment
and kindergarten students attending full time.
10,600,000
10,800,000
11,000,000
11,200,000
11,400,000
11,600,000
11,800,000
12,000,000
2011-2012 2012-2013 2013-2014
11,993,873
11,817,760
11,113,235
Deb Services (5100)
9/17/2013 3:57 PM Sumexpen.xlsx Page 16 of 24
USD# 497
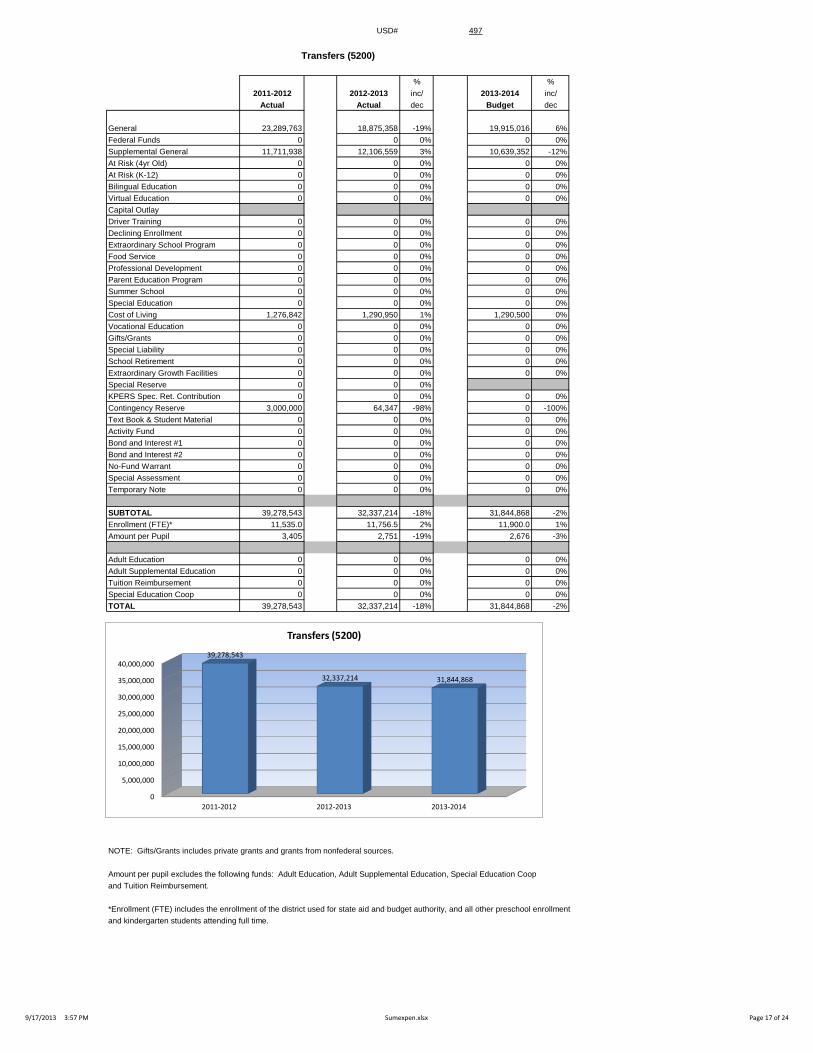
Transfers (5200)
% %
2011-2012 2012-2013 inc/ 2013-2014 inc/
Actual Actual dec Budget dec
General 23,289,763 18,875,358 -19% 19,915,016 6%
Federal Funds 0 0 0% 0 0%
Supplemental General 11,711,938 12,106,559 3% 10,639,352 -12%
At Risk (4yr Old) 0 0 0% 0 0%
At Risk (K-12) 0 0 0% 0 0%
Bilingual Education 0 0 0% 0 0%
Virtual Education 0 0 0% 0 0%
Capital Outlay
Driver Training 0 0 0% 0 0%
Declining Enrollment 0 0 0% 0 0%
Extraordinary School Program 0 0 0% 0 0%
Food Service 0 0 0% 0 0%
Professional Development 0 0 0% 0 0%
Parent Education Program 0 0 0% 0 0%
Summer School 0 0 0% 0 0%
Special Education 0 0 0% 0 0%
Cost of Living 1,276,842 1,290,950 1% 1,290,500 0%
Vocational Education 0 0 0% 0 0%
Gifts/Grants 0 0 0% 0 0%
Special Liability 0 0 0% 0 0%
School Retirement 0 0 0% 0 0%
Extraordinary Growth Facilities 0 0 0% 0 0%
Special Reserve 0 0 0%
KPERS Spec. Ret. Contribution 0 0 0% 0 0%
Contingency Reserve 3,000,000 64,347 -98% 0 -100%
Text Book & Student Material 0 0 0% 0 0%
Activity Fund 0 0 0% 0 0%
Bond and Interest #1 0 0 0% 0 0%
Bond and Interest #2 0 0 0% 0 0%
No-Fund Warrant 0 0 0% 0 0%
Special Assessment 0 0 0% 0 0%
Temporary Note 0 0 0% 0 0%
SUBTOTAL 39,278,543 32,337,214 -18% 31,844,868 -2%
Enrollment (FTE)* 11,535.0 11,756.5 2% 11,900.0 1%
Amount per Pupil 3,405 2,751 -19% 2,676 -3%
Adult Education 0 0 0% 0 0%
Adult Supplemental Education 0 0 0% 0 0%
Tuition Reimbursement 0 0 0% 0 0%
Special Education Coop 0 0 0% 0 0%
TOTAL 39,278,543 32,337,214 -18% 31,844,868 -2%
NOTE: Gifts/Grants includes private grants and grants from nonfederal sources.
Amount per pupil excludes the following funds: Adult Education, Adult Supplemental Education, Special Education Coop
and Tuition Reimbursement.
*Enrollment (FTE) includes the enrollment of the district used for state aid and budget authority, and all other preschool enrollment
and kindergarten students attending full time.
0
5,000,000
10,000,000
15,000,000
20,000,000
25,000,000
30,000,000
35,000,000
40,000,000
2011-2012 2012-2013 2013-2014
39,278,543
32,337,214 31,844,868
Transfers (5200)
9/17/2013 3:57 PM Sumexpen.xlsx Page 17 of 24
USD# 497
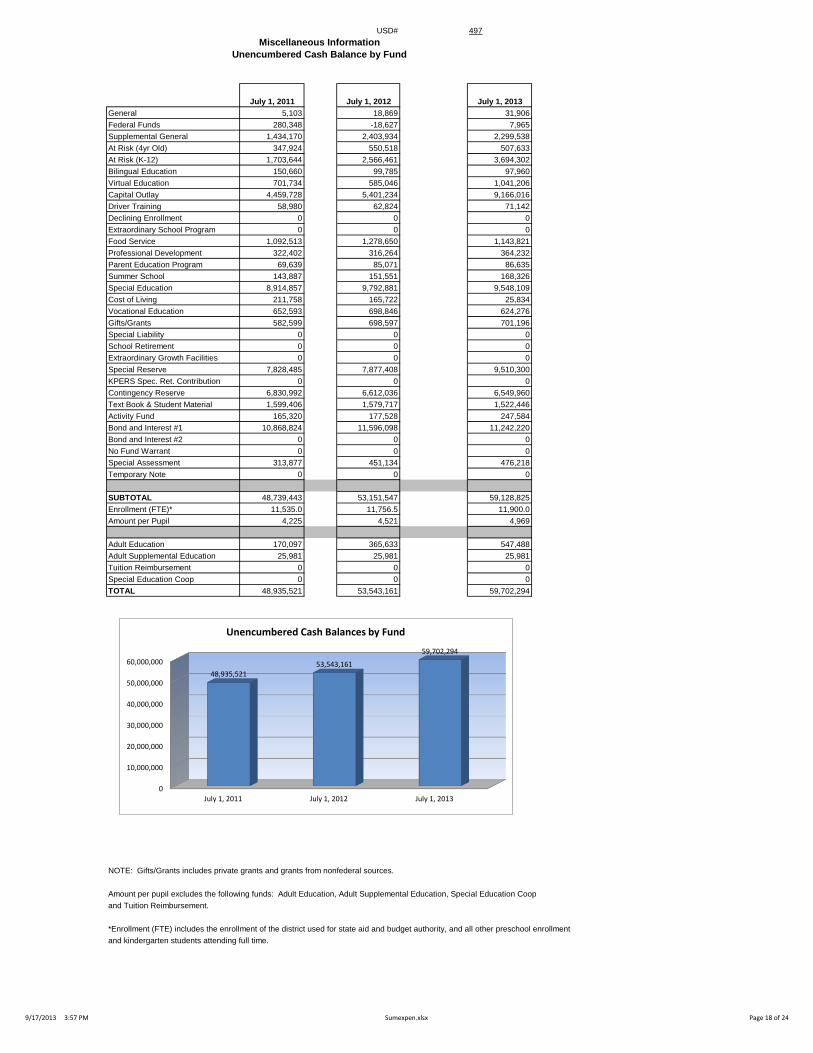
Miscellaneous Information
Unencumbered Cash Balance by Fund
July 1, 2011 July 1, 2012 July 1, 2013
General 5,103 18,869 31,906
Federal Funds 280,348 -18,627 7,965
Supplemental General 1,434,170 2,403,934 2,299,538
At Risk (4yr Old) 347,924 550,518 507,633
At Risk (K-12) 1,703,644 2,566,461 3,694,302
Bilingual Education 150,660 99,785 97,960
Virtual Education 701,734 585,046 1,041,206
Capital Outlay 4,459,728 5,401,234 9,166,016
Driver Training 58,980 62,824 71,142
Declining Enrollment 0 0 0
Extraordinary School Program 0 0 0
Food Service 1,092,513 1,278,650 1,143,821
Professional Development 322,402 316,264 364,232
Parent Education Program 69,639 85,071 86,635
Summer School 143,887 151,551 168,326
Special Education 8,914,857 9,792,881 9,548,109
Cost of Living 211,758 165,722 25,834
Vocational Education 652,593 698,846 624,276
Gifts/Grants 582,599 698,597 701,196
Special Liability 0 0 0
School Retirement 0 0 0
Extraordinary Growth Facilities 0 0 0
Special Reserve 7,828,485 7,877,408 9,510,300
KPERS Spec. Ret. Contribution 0 0 0
Contingency Reserve 6,830,992 6,612,036 6,549,960
Text Book & Student Material 1,599,406 1,579,717 1,522,446
Activity Fund 165,320 177,528 247,584
Bond and Interest #1 10,868,824 11,596,098 11,242,220
Bond and Interest #2 0 0 0
No Fund Warrant 0 0 0
Special Assessment 313,877 451,134 476,218
Temporary Note 0 0 0
SUBTOTAL 48,739,443 53,151,547 59,128,825
Enrollment (FTE)* 11,535.0 11,756.5 11,900.0
Amount per Pupil 4,225 4,521 4,969
Adult Education 170,097 365,633 547,488
Adult Supplemental Education 25,981 25,981 25,981
Tuition Reimbursement 0 0 0
Special Education Coop 0 0 0
TOTAL 48,935,521 53,543,161 59,702,294
NOTE: Gifts/Grants includes private grants and grants from nonfederal sources.
Amount per pupil excludes the following funds: Adult Education, Adult Supplemental Education, Special Education Coop
and Tuition Reimbursement.
*Enrollment (FTE) includes the enrollment of the district used for state aid and budget authority, and all other preschool enrollment
and kindergarten students attending full time.
0
10,000,000
20,000,000
30,000,000
40,000,000
50,000,000
60,000,000
July 1, 2011 July 1, 2012 July 1, 2013
48,935,521 53,543,161
59,702,294
Unencumbered Cash Balances by Fund
9/17/2013 3:57 PM Sumexpen.xlsx Page 18 of 24
USD# 497
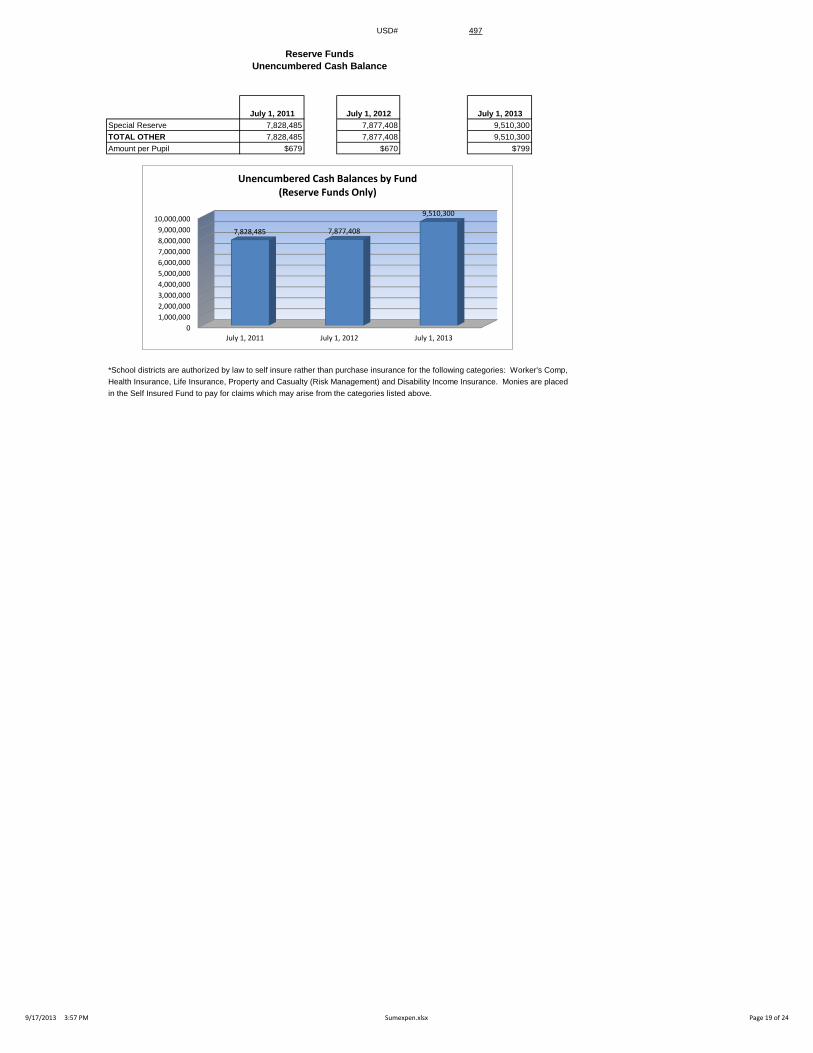
Reserve Funds
Unencumbered Cash Balance
July 1, 2011 July 1, 2012 July 1, 2013
Special Reserve 7,828,485 7,877,408 9,510,300
TOTAL OTHER 7,828,485 7,877,408 9,510,300
Amount per Pupil $679 $670 $799
*School districts are authorized by law to self insure rather than purchase insurance for the following categories: Worker's Comp,
Health Insurance, Life Insurance, Property and Casualty (Risk Management) and Disability Income Insurance. Monies are placed
in the Self Insured Fund to pay for claims which may arise from the categories listed above.
0
1,000,000
2,000,000
3,000,000
4,000,000
5,000,000
6,000,000
7,000,000
8,000,000
9,000,000
10,000,000
July 1, 2011 July 1, 2012 July 1, 2013
7,828,485 7,877,408
9,510,300
Unencumbered Cash Balances by Fund (Reserve Funds Only)
9/17/2013 3:57 PM Sumexpen.xlsx Page 19 of 24
USD# 497
2009-2010 2010-2011 % 2011-2012 % 2012-2013 % 2013-2014 %
Actual Actual inc/ Actual inc/ Actual inc/ Budget inc/
dec dec dec dec
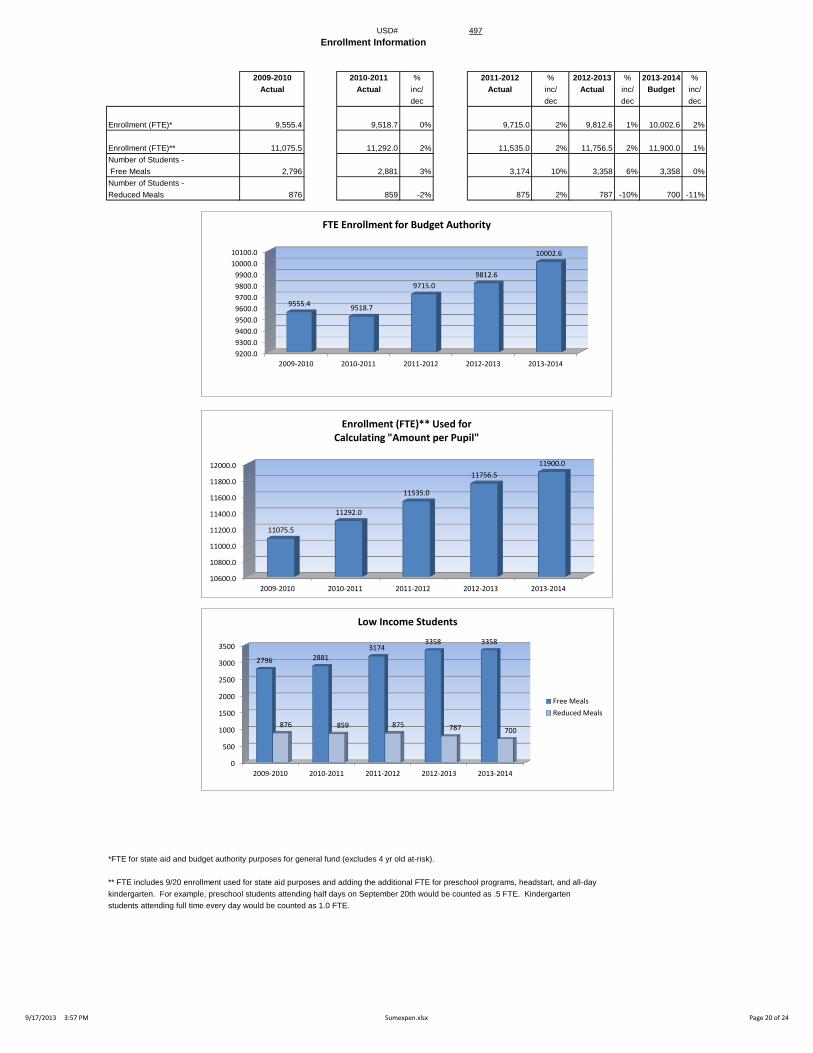
Enrollment (FTE)* 9,555.4 9,518.7 0% 9,715.0 2% 9,812.6 1% 10,002.6 2%
Enrollment (FTE)** 11,075.5 11,292.0 2% 11,535.0 2% 11,756.5 2% 11,900.0 1%
Number of Students -
Free Meals 2,796 2,881 3% 3,174 10% 3,358 6% 3,358 0%
Number of Students -
Reduced Meals 876 859 -2% 875 2% 787 -10% 700 -11%
*FTE for state aid and budget authority purposes for general fund (excludes 4 yr old at-risk).
** FTE includes 9/20 enrollment used for state aid purposes and adding the additional FTE for preschool programs, headstart, and all-day
kindergarten. For example, preschool students attending half days on September 20th would be counted as .5 FTE. Kindergarten
students attending full time every day would be counted as 1.0 FTE.
Enrollment Information
10600.0
10800.0
11000.0
11200.0
11400.0
11600.0
11800.0
12000.0
2009-2010 2010-2011 2011-2012 2012-2013 2013-2014
11075.5
11292.0
11535.0
11756.5
11900.0
Enrollment (FTE)** Used for Calculating "Amount per Pupil"
0
500
1000
1500
2000
2500
3000
3500
2009-2010 2010-2011 2011-2012 2012-2013 2013-2014
2796 2881 3174
3358 3358
876 859 875 787 700
Low Income Students
Free Meals
Reduced Meals
9200.0
9300.0
9400.0
9500.0
9600.0
9700.0
9800.0
9900.0
10000.0
10100.0
2009-2010 2010-2011 2011-2012 2012-2013 2013-2014
9555.4 9518.7
9715.0
9812.6
10002.6
FTE Enrollment for Budget Authority
9/17/2013 3:57 PM Sumexpen.xlsx Page 20 of 24
USD# 497
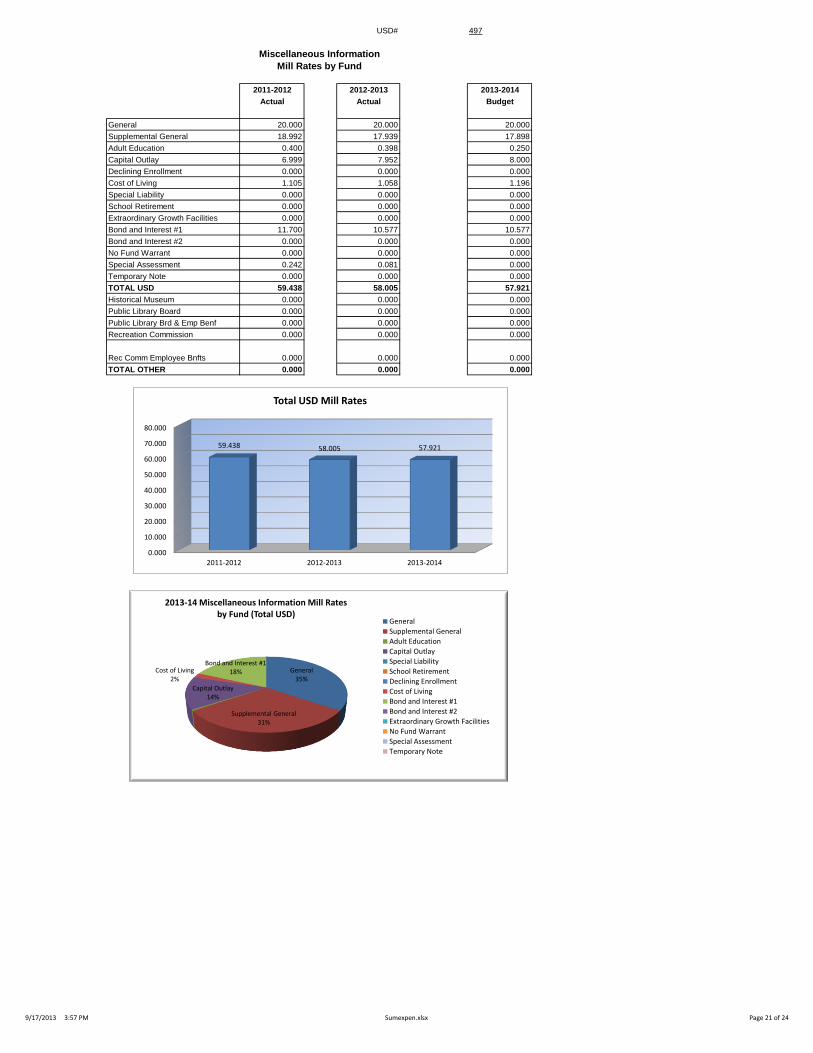
Miscellaneous Information
Mill Rates by Fund
2011-2012 2012-2013 2013-2014
Actual Actual Budget
General 20.000 20.000 20.000
Supplemental General 18.992 17.939 17.898
Adult Education 0.400 0.398 0.250
Capital Outlay 6.999 7.952 8.000
Declining Enrollment 0.000 0.000 0.000
Cost of Living 1.105 1.058 1.196
Special Liability 0.000 0.000 0.000
School Retirement 0.000 0.000 0.000
Extraordinary Growth Facilities 0.000 0.000 0.000
Bond and Interest #1 11.700 10.577 10.577
Bond and Interest #2 0.000 0.000 0.000
No Fund Warrant 0.000 0.000 0.000
Special Assessment 0.242 0.081 0.000
Temporary Note 0.000 0.000 0.000
TOTAL USD 59.438 58.005 57.921
Historical Museum 0.000 0.000 0.000
Public Library Board 0.000 0.000 0.000
Public Library Brd & Emp Benf 0.000 0.000 0.000
Recreation Commission 0.000 0.000 0.000
Rec Comm Employee Bnfts 0.000 0.000 0.000
TOTAL OTHER 0.000 0.000 0.000
0.000
10.000
20.000
30.000
40.000
50.000
60.000
70.000
80.000
2011-2012 2012-2013 2013-2014
59.438 58.005 57.921
Total USD Mill Rates
General 35%
Supplemental General 31%
Capital Outlay 14%
Cost of Living 2%
Bond and Interest #1 18%
2013-14 Miscellaneous Information Mill Rates by Fund (Total USD)
General
Supplemental General
Adult Education
Capital Outlay
Special Liability
School Retirement
Declining Enrollment
Cost of Living
Bond and Interest #1
Bond and Interest #2
Extraordinary Growth Facilities
No Fund Warrant
Special Assessment
Temporary Note
9/17/2013 3:57 PM Sumexpen.xlsx Page 21 of 24
USD# 497
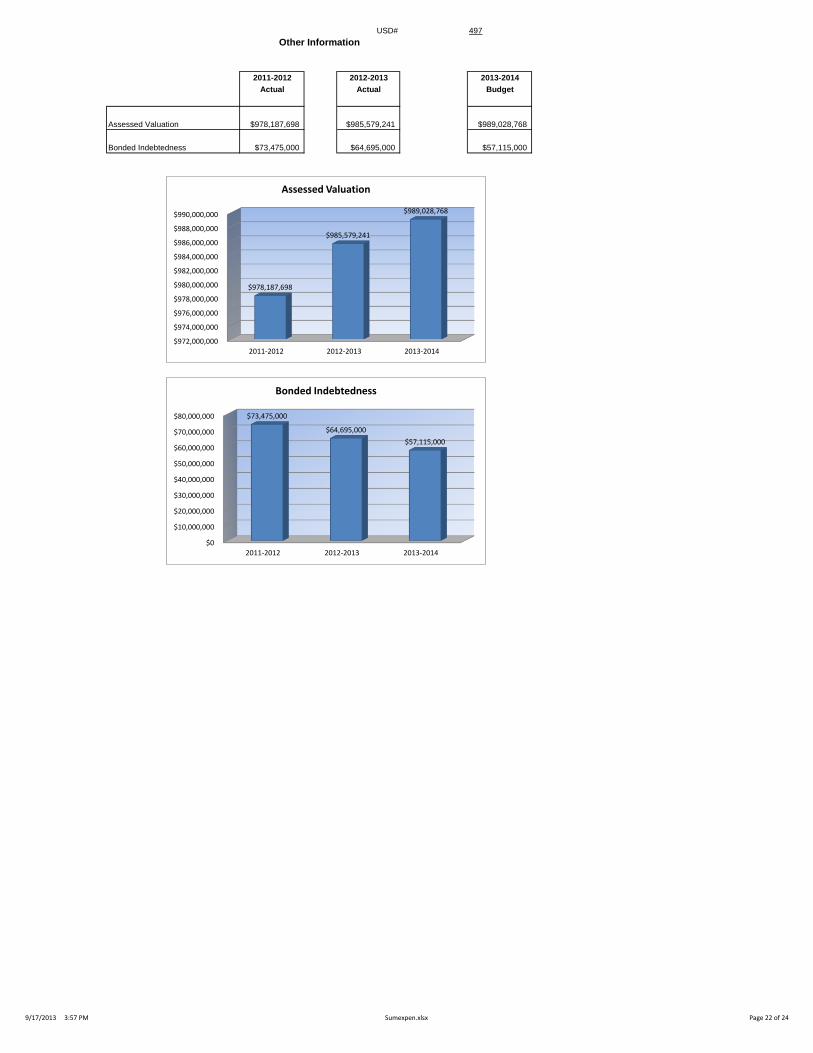
Other Information
2011-2012 2012-2013 2013-2014
Actual Actual Budget
Assessed Valuation $978,187,698 $985,579,241 $989,028,768
Bonded Indebtedness $73,475,000 $64,695,000 $57,115,000
$972,000,000
$974,000,000
$976,000,000
$978,000,000
$980,000,000
$982,000,000
$984,000,000
$986,000,000
$988,000,000
$990,000,000
2011-2012 2012-2013 2013-2014
$978,187,698
$985,579,241
$989,028,768
Assessed Valuation
$0
$10,000,000
$20,000,000
$30,000,000
$40,000,000
$50,000,000
$60,000,000
$70,000,000
$80,000,000
2011-2012 2012-2013 2013-2014
$73,475,000
$64,695,000
$57,115,000
Bonded Indebtedness
9/17/2013 3:57 PM Sumexpen.xlsx Page 22 of 24
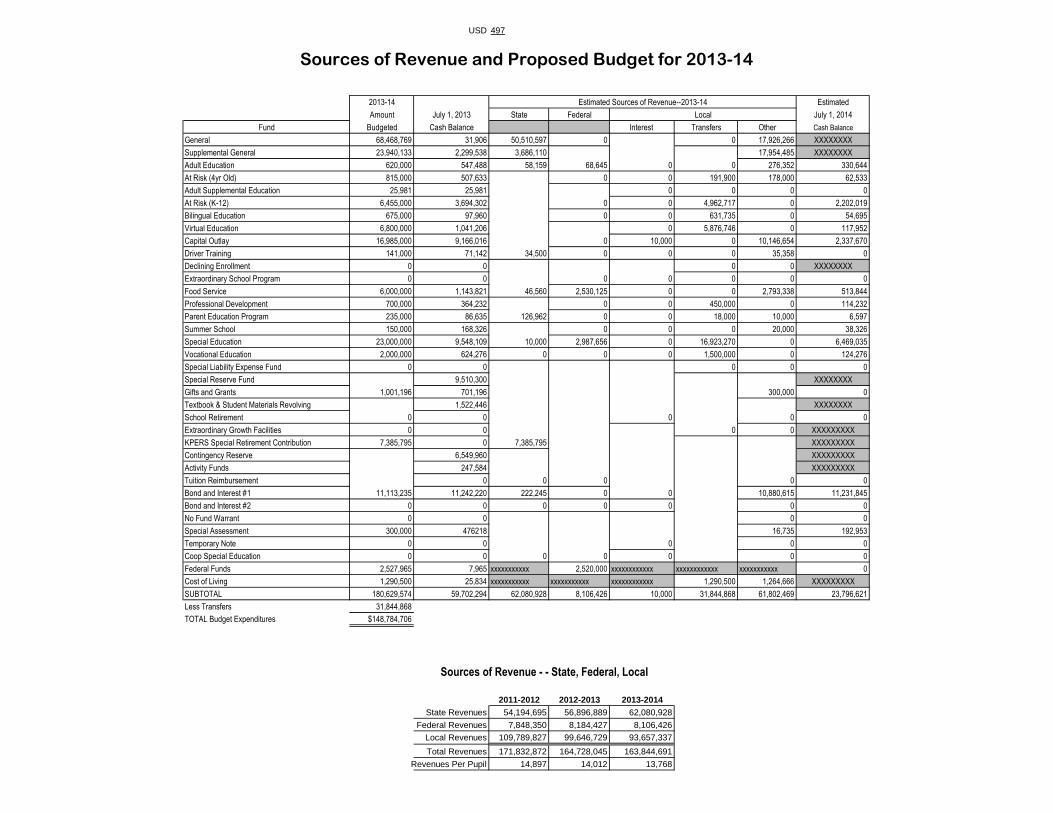
USD 497
2013-14 Estimated Sources of Revenue--2013-14 Estimated
Amount July 1, 2013 State Federal Local July 1, 2014
Fund Budgeted Cash Balance Interest Transfers Other Cash Balance
General 68,468,769 31,906 50,510,597 0 0 17,926,266 XXXXXXXX
Supplemental General 23,940,133 2,299,538 3,686,110 17,954,485 XXXXXXXX
Adult Education 620,000 547,488 58,159 68,645 0 0 276,352 330,644
At Risk (4yr Old) 815,000 507,633 0 0 191,900 178,000 62,533
Adult Supplemental Education 25,981 25,981 0 0 0 0
At Risk (K-12) 6,455,000 3,694,302 0 0 4,962,717 0 2,202,019
Bilingual Education 675,000 97,960 0 0 631,735 0 54,695
Virtual Education 6,800,000 1,041,206 0 5,876,746 0 117,952
Capital Outlay 16,985,000 9,166,016 0 10,000 0 10,146,654 2,337,670
Driver Training 141,000 71,142 34,500 0 0 0 35,358 0
Declining Enrollment 0 0 0 0 XXXXXXXX
Extraordinary School Program 0 0 0 0 0 0 0
Food Service 6,000,000 1,143,821 46,560 2,530,125 0 0 2,793,338 513,844
Professional Development 700,000 364,232 0 0 450,000 0 114,232
Parent Education Program 235,000 86,635 126,962 0 0 18,000 10,000 6,597
Summer School 150,000 168,326 0 0 0 20,000 38,326
Special Education 23,000,000 9,548,109 10,000 2,987,656 0 16,923,270 0 6,469,035
Vocational Education 2,000,000 624,276 0 0 0 1,500,000 0 124,276
Special Liability Expense Fund 0 0 0 0 0
Special Reserve Fund 9,510,300 XXXXXXXX
Gifts and Grants 1,001,196 701,196 300,000 0
Textbook & Student Materials Revolving 1,522,446 XXXXXXXX
School Retirement 0 0 0 0 0
Extraordinary Growth Facilities 0 0 0 0 XXXXXXXXX
KPERS Special Retirement Contribution 7,385,795 0 7,385,795 XXXXXXXXX
Contingency Reserve 6,549,960 XXXXXXXXX
Activity Funds 247,584 XXXXXXXXX
Tuition Reimbursement 0 0 0 0 0
Bond and Interest #1 11,113,235 11,242,220 222,245 0 0 10,880,615 11,231,845
Bond and Interest #2 0 0 0 0 0 0 0
No Fund Warrant 0 0 0 0
Special Assessment 300,000 476218 16,735 192,953
Temporary Note 0 0 0 0 0
Coop Special Education 0 0 0 0 0 0 0
Federal Funds 2,527,965 7,965 xxxxxxxxxxx 2,520,000 xxxxxxxxxxxx xxxxxxxxxxxx xxxxxxxxxxx 0
Cost of Living 1,290,500 25,834 xxxxxxxxxxx xxxxxxxxxxx xxxxxxxxxxxx 1,290,500 1,264,666 XXXXXXXXX
SUBTOTAL 180,629,574 59,702,294 62,080,928 8,106,426 10,000 31,844,868 61,802,469 23,796,621
Less Transfers 31,844,868
TOTAL Budget Expenditures $148,784,706
2011-2012 2012-2013 2013-2014
State Revenues 54,194,695 56,896,889 62,080,928
Federal Revenues 7,848,350 8,184,427 8,106,426
Local Revenues 109,789,827 99,646,729 93,657,337
Total Revenues 171,832,872 164,728,045 163,844,691
Revenues Per Pupil 14,897 14,012 13,768
Sources of Revenue and Proposed Budget for 2013-14
Sources of Revenue - - State, Federal, Local

Intentionally left blank