UNIFIED GOVERNMENT OF WYANDOTTE COUNTY/KANSAS CITY, KANSAS
171
● U N I F I E D G O V E R N M E N T ● W y a n d o t t e C o u n t y ● K a n s a s C i t y , K a n s a s UNIFIED GOVERNMENT OF WYANDOTTE COUNTY/KANSAS CITY, KANSAS “Wyandotte County Strong Communites, Friendly People, & Exciting Entertainment!!!” COMPREHENSIVE ANNUAL FINANCIAL REPORT For the fiscal year ended December 31, 2010
Transcript of UNIFIED GOVERNMENT OF WYANDOTTE COUNTY/KANSAS CITY, KANSAS
● U
NIF
IED GOVERNMENT ●
Wyandotte County ● Kansas
City, K
ansa
s
UNIFIED GOVERNMENT OFWYANDOTTE COUNTY/KANSAS CITY, KANSAS
“Wyandotte CountyStrong Communites, Friendly People,
& Exciting Entertainment!!!”
COMPREHENSIVE ANNUAL FINANCIAL REPORTFor the fiscal year ended December 31, 2010
UNIFIED GOVERNMENT OF WYANDOTTE COUNTY/KANSAS CITY, KANSAS
COMPREHENSIVE ANNUAL FINANCIAL REPORT For the year ended DECEMBER 31, 2010
REASONABLE ACCOMMODATIONS WILL BE MADE TO QUALIFIED INDIVIDUALS WITH DISABILITIES ON AN AS NEEDED BASIS, PROVIDED ADEQUATE NOTICE IS GIVEN.
Prepared by:
Finance Department of the Unified Government of Wyandotte County/Kansas City, Kansas

UNIFIED GOVERNMENT OF WYANDOTTE COUNTY/KANSAS CITY, KANSAS COMPREHENSIVE ANNUAL FINANCIAL REPORT For the year ended DECEMBER 31, 2010
TABLE OF CONTENTS Page
INTRODUCTION Transmittal Letter ----------------------------------------------------------------------------------------------------------- i
Executive Staff ------------------------------------------------------------------------------------------------------------ xvii
Organizational Chart --------------------------------------------------------------------------------------------------- xviii
Certificate of Achievement for Excellence in Financial Reporting ------------------------------------------- xix
FINANCIAL SECTION
Independent Auditors’ Report ------------------------------------------------------------------------------------------- 2
Management’s Discussion and Analysis ----------------------------------------------------------------------------- 4
Basic Financial Statements
Government-wide Financial Statements: Statement of Net Assets ------------------------------------------------------------------------------------ 13 Statement of Activities --------------------------------------------------------------------------------------- 14
Fund Financial Statements: Balance Sheet – Governmental Funds ----------------------------------------------------------------- 15 Reconciliation of the Balance Sheet – Governmental Funds To the Statement of Net Assets ---------------------------------------------------------------------- 16 Statement of Revenues, Expenditures and Changes in Fund Balances – Governmental Funds -------------------------------------------------------------------- 17 Reconciliation of the Statement of Revenues, Expenditures and Changes to Fund Balances – Governmental Funds to the Statement of Activities --------------------- 18 Statement of Revenues, Expenditures and Changes in Fund Balances Budget and Actual – Budgetary Basis (Non-GAAP) – General Fund ---------------------- 19 Statement of Net Assets – Proprietary Funds --------------------------------------------------------- 20 Statement of Revenues, Expenses and Changes in Fund Net Assets - Proprietary Funds ---------------------------------------------------------------------------------------- 21 Statement of Cash Flows - Proprietary Funds -------------------------------------------------------- 22 Statement of Fiduciary Net Assets ----------------------------------------------------------------------- 24
Notes to the Financial Statements -------------------------------------------------------------------------- 25 Required Supplementary Information -------------------------------------------------------------------------------- 65
Combining Statements and Schedules:
Governmental Funds --------------------------------------------------------------------------------------------- 67 Combining Balance Sheet – NonMajor Governmental Funds ------------------------------------ 72 Combining Statement of Revenues, Expenditures and Changes in Fund Balance – NonMajor Governmental Funds --------------------------------------------- 78 Schedule of Budgetary Accounts - Budget and Actual – Budgetary Basis (Non-GAAP)
General Fund --------------------------------------------------------------------------------------- 84
UNIFIED GOVERNMENT OF WYANDOTTE COUNTY/KANSAS CITY, KANSAS COMPREHENSIVE ANNUAL FINANCIAL REPORT For the year ended DECEMBER 31, 2010
FINANCIAL SECTION (continued) Governmental Funds (continued):
Budgetary Schedules (continued): Special Revenue Funds: Court Trustee ---------------------------------------------------------------------------------- 88 Elections ---------------------------------------------------------------------------------------- 89
Health Department --------------------------------------------------------------------------- 90 Jail Commissary ------------------------------------------------------------------------------ 91 Library ------------------------------------------------------------------------------------------- 92 Mental Health ---------------------------------------------------------------------------------- 93 Mental Retardation --------------------------------------------------------------------------- 94 Register of Deeds Technology Fund ---------------------------------------------------- 95 Special Sales Tax ---------------------------------------------------------------------------- 96 Service Program for the Elderly ----------------------------------------------------------- 97 Special 911 Tax ------------------------------------------------------------------------------- 98 Special Alcohol and Drug Programs ----------------------------------------------------- 99 Special Parks and Recreation ----------------------------------------------------------- 100 Special Street and Highway ------------------------------------------------------------- 101 Tourism and Convention Promotion --------------------------------------------------- 102 Debt Service Funds: City --------------------------------------------------------------------------------------------- 103 County ----------------------------------------------------------------------------------------- 104
Capital Project Fund: County Initiative to Fund Infrastructure ----------------------------------------------- 105
Enterprise Funds ------------------------------------------------------------------------------------------------ 107 Combining Balance Sheet – NonMajor Enterprise Funds ---------------------------------------- 108 Combining Statement of Revenues, Expenses and Changes in Fund Net Assets – NonMajor Enterprise Funds -------------------------------------------- 109 Combining Statement of Cash Flows – NonMajor Enterprise Funds -------------------------- 110 Schedule of Budgetary Accounts - Budget and Actual – Budgetary Basis (Non-GAAP)
Sewer System ------------------------------------------------------------------------------------ 112 Emergency Medical Service ------------------------------------------------------------------ 113 Public Levee -------------------------------------------------------------------------------------- 114
Stormwater Utility Enterprise----------------------------------------------------------------- 115 Sunflower Hills Golf Course ------------------------------------------------------------------- 116
Internal Service Funds ---------------------------------------------------------------------------------------- 117 Combining Balance Sheet -------------------------------------------------------------------------------- 118 Combining Statement of Revenues, Expenses and Changes in Net Assets ---------------- 119
Combining Statement of Cash Flows----------------------------------------------------------------- 120
Agency Funds ---------------------------------------------------------------------------------------------------- 121 Combining Statement of Changes in Assets and Liabilities – All Agency Funds ----------- 122

UNIFIED GOVERNMENT OF WYANDOTTE COUNTY/KANSAS CITY, KANSAS COMPREHENSIVE ANNUAL FINANCIAL REPORT For the year ended DECEMBER 31, 2010
STATISTICAL SECTION -------------------------------------------------------------------------------------------------- 125
Financial Trends ------------------------------------------------------------------------------------------------------- 126 Net Assets by Component – Last Seven Fiscal Years -------------------------------------------- 126 Changes in Fund Balances of Governmental Funds - Last Ten Fiscal Years -------------- 127 Changes in Net Assets - Last Seven Fiscal Years ------------------------------------------------ 128 Fund Balances of Governmental Funds - Last Ten Fiscal Years ------------------------------ 130
Revenue Capacity ----------------------------------------------------------------------------------------------------- 132 Assessed and Estimated Actual Values of Taxable Tangible Property-Last Ten Years - 132 Direct and Overlapping Governments-Last Ten Fiscal Years ----------------------------------- 134 Principal Property Tax Payers-Current Year and Nine Years Ago ----------------------------- 135 General Property Tax Levies and Collections-Last Ten Fiscal Years ------------------------- 136
Debt Capacity ----------------------------------------------------------------------------------------------------------- 137 Ratios of Outstanding Debt by Type-Last Ten Fiscal Years ------------------------------------- 137 Ratios of General Bonded Debt Outstanding-Last Ten Fiscal Years -------------------------- 138 Legal Debt Margin Information-Last Ten Fiscal Years -------------------------------------------- 139 Pledged-Revenue Coverage-Last Ten Fiscal Years ---------------------------------------------- 140
Demographic and Economic Information --------------------------------------------------------------------- 141 Demographic and Economic Statistics-Last Ten Fiscal Years ---------------------------------- 141 Principal Employers-Current Year and Nines Years Ago ---------------------------------------- 142
Operating Information ----------------------------------------------------------------------------------------------- 143 Full-time Equivalent County Government Employees by Function- Last Ten Years ------ 143 Operating Indicators by Function-Last Ten Fiscal Years ----------------------------------------- 144 Capital Asset Statistics by Function-Last Ten Fiscal Years ------------------------------------- 145
i
July 6, 2011 To the Honorable Mayor, the Unified Board of Commissioners and Citizens of the Unified Government of Wyandotte County/Kansas City, Kansas: The Office of the Chief Financial Officer and the Office of the County Administrator are pleased to submit to you the Unified Government’s 2010 Comprehensive Annual Financial Report (CAFR). Management has prepared and is responsible for the financial statements and for the integrity and consistency of other information in the Comprehensive Annual Financial Report. The financial statements, which necessarily include amounts based on management estimates and judgments, have been prepared in conformity with Generally Accepted Accounting Principles (GAAP). Management is responsible for the accuracy, completeness, and fairness of the presented data, including all disclosures. The data, as presented, is accurate in all material aspects. It is presented in a manner designed to fairly set forth the financial position and results of the operation of the Unified Government as measured by the financial activity of its various fund types. It also includes all disclosures necessary to enable the reader to gain an understanding of the Unified Government’s financial affairs. The Unified Government maintains a system of internal controls designed to provide reasonable assurance that: assets are safeguarded; transactions are executed in accordance with the Unified Government's authorization requirements and policies; and transactions are properly recorded to allow preparation of financial statements that fairly present financial position and results of operations in conformity with generally accepted accounting principles. Internal accounting controls are augmented by written policies covering standards of personal and business conduct and organizational structure providing for division of responsibility and authority. The effectiveness of and compliance with established control systems is monitored through a continuous program of internal controls. In recognition of cost-benefit relationships and inherent limitations, some features of the control system are designed to detect rather than prevent errors, irregularities and departures from approved policies and practices. Management believes the system of controls has prevented or detected on a timely basis any occurrences that could be material to the financial statements and that timely corrective actions have been initiated when appropriate. The Unified Board of Commissioners has engaged the firm of Allen, Gibbs & Houlik, L.C., independent auditors, to render an opinion on the financial statements. To the best of our knowledge, the independent auditors were provided access to all information and records necessary to render their opinion. The independent audit of the financial statements of the Unified Government is part of a broader, federally mandated “Single Audit” designed to meet the special needs of federal grantor agencies. The
County Administrator’s Office Unified Government of Wyandotte County/
Kansas City, Kansas Dennis Hays, County Administrator
701 North Seventh Street Kansas City, Kansas 66101 (913) 573-5660 • FAX (913) 573-5006
ii
standards governing Single Audit engagements require the independent auditor to report not only on the fair presentation of the financial statements, but also on the audited government‘s internal controls and compliance with legal requirements, with special emphasis on internal controls and legal requirements involving the administration of federal awards. These reports are available in the Unified Government’s separately issued Single Audit Report. The CAFR follows the organization, form and content of the revised principles prescribed by the Governmental Accounting Standards Board (GASB), State of Kansas, Unified Government policy, and the Government Finance Officers Association. There are two groups who are primarily responsible for determining current governmental accounting and reporting practices. They are the American Institute of Certified Public Accountants (AICPA), and GASB. The Unified Government of Wyandotte County/Kansas City, Kansas has adopted these reporting guidelines as its policy and complies with them. GAAP require that management provide a narrative introduction, overview, and analysis to accompany the basic financial statements in the form of Management’s Discussion and Analysis (MD&A). This letter of transmittal is designed to complement MD&A and should be read in conjunction with it. The Unified Government’s MD&A can be found immediately following the report of the independent auditors. General Information The Unified Government of Wyandotte County/Kansas City, Kansas was created October 1, 1997, based on a citizen vote to consolidate the operations of the City of Kansas City, Kansas and Wyandotte County, Kansas. Wyandotte County is located at the confluence of the Kansas and Missouri Rivers and at the crossroads of two transcontinental interstate highways. Two large railroad-switching yards are located in the Unified Government, which is also the base for several truck freight companies. The Unified Government is also the home to the Kansas Speedway Corporation, owners and operators of the 1.5 mile super speedway, which opened in the spring of 2001. The super speedway is located in the northwest corner of the junction of I-435 and I-70. Government Structure The Unified Government is the government for both Wyandotte County and the City of Kansas City, Kansas. The governing body of the Unified Government consists of a ten-member Commission and a Mayor/Chief Executive Officer. Eight Commission positions are elected within geographic districts. Two Commission positions cover half of the County; each with candidates selected in the primary election within their district and in the general election on a countywide vote. The Mayor runs countywide in the primary and the general elections. In addition, the Mayor appoints the County Administrator with approval of the Commission. The Commission annually adopts a balanced budget and establishes the amount of taxes to be levied for the support of Unified Government programs. The County Administrator has the responsibility of administering these programs in accordance with policies and the annual budget adopted by the Commission. Economic Condition and Outlook The Unified Government is the government for both Wyandotte County and the City of Kansas City, KS. Wyandotte County accounts for a large number of manufacturing, transportation and distribution, including rail, and health care jobs in the metropolitan area. Many of these jobs are high paying and contribute to the positive statistics regarding gross payroll and gross sales. Development remains an important priority for the Unified Government.
iii
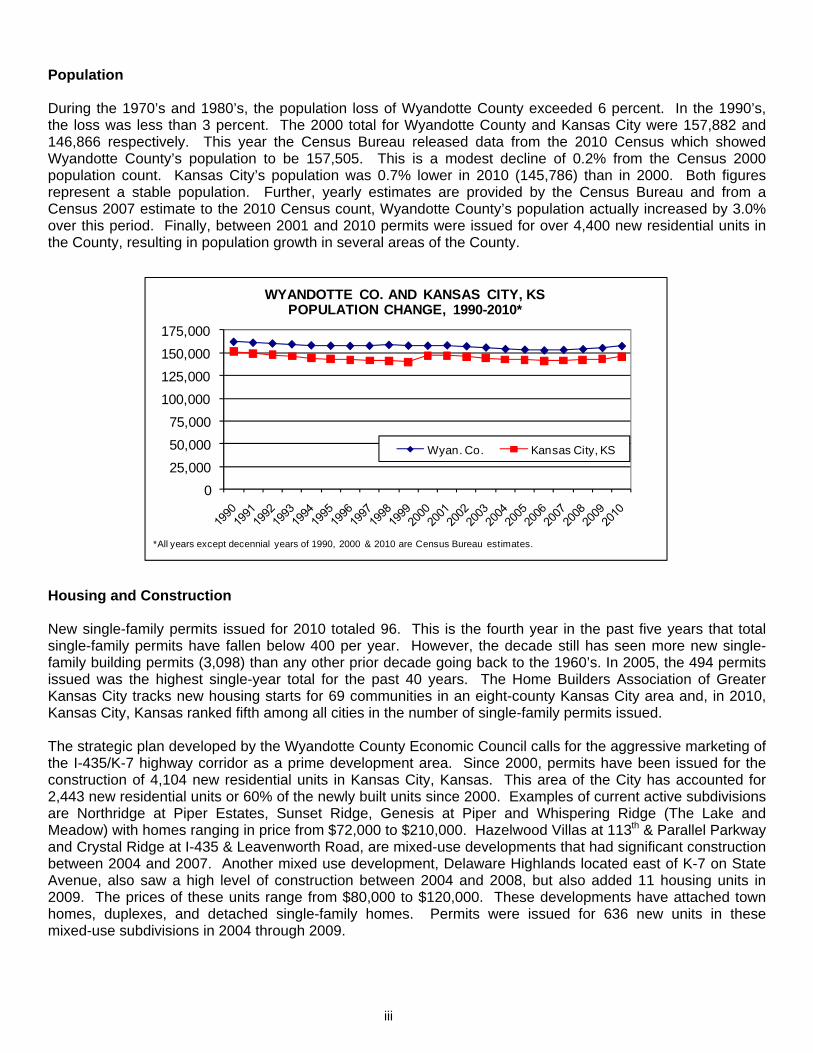
025,00050,00075,000
100,000125,000150,000175,000
Wyan. Co. Kansas City, KS
WYANDOTTE CO. AND KANSAS CITY, KSPOPULATION CHANGE, 1990-2010*
*All years except decennial years of 1990, 2000 & 2010 are Census Bureau estimates.
Population During the 1970’s and 1980’s, the population loss of Wyandotte County exceeded 6 percent. In the 1990’s, the loss was less than 3 percent. The 2000 total for Wyandotte County and Kansas City were 157,882 and 146,866 respectively. This year the Census Bureau released data from the 2010 Census which showed Wyandotte County’s population to be 157,505. This is a modest decline of 0.2% from the Census 2000 population count. Kansas City’s population was 0.7% lower in 2010 (145,786) than in 2000. Both figures represent a stable population. Further, yearly estimates are provided by the Census Bureau and from a Census 2007 estimate to the 2010 Census count, Wyandotte County’s population actually increased by 3.0% over this period. Finally, between 2001 and 2010 permits were issued for over 4,400 new residential units in the County, resulting in population growth in several areas of the County.
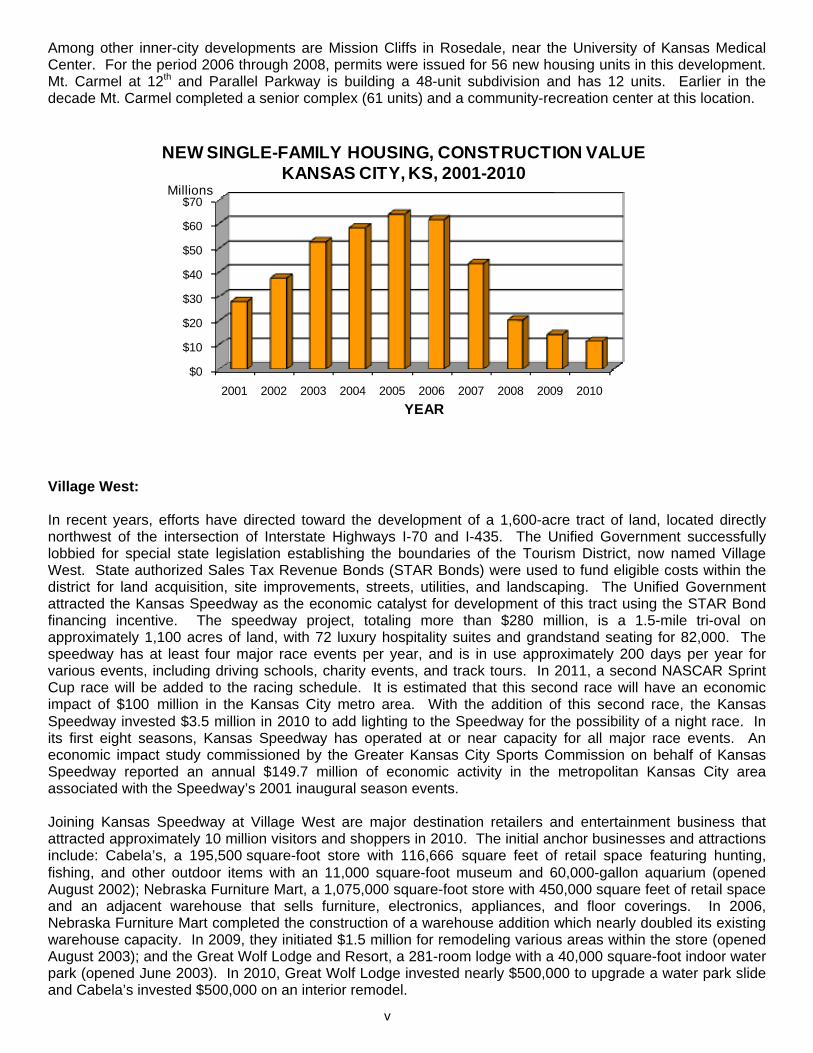
Housing and Construction New single-family permits issued for 2010 totaled 96. This is the fourth year in the past five years that total single-family permits have fallen below 400 per year. However, the decade still has seen more new single-family building permits (3,098) than any other prior decade going back to the 1960’s. In 2005, the 494 permits issued was the highest single-year total for the past 40 years. The Home Builders Association of Greater Kansas City tracks new housing starts for 69 communities in an eight-county Kansas City area and, in 2010, Kansas City, Kansas ranked fifth among all cities in the number of single-family permits issued. The strategic plan developed by the Wyandotte County Economic Council calls for the aggressive marketing of the I-435/K-7 highway corridor as a prime development area. Since 2000, permits have been issued for the construction of 4,104 new residential units in Kansas City, Kansas. This area of the City has accounted for 2,443 new residential units or 60% of the newly built units since 2000. Examples of current active subdivisions are Northridge at Piper Estates, Sunset Ridge, Genesis at Piper and Whispering Ridge (The Lake and Meadow) with homes ranging in price from $72,000 to $210,000. Hazelwood Villas at 113th & Parallel Parkway and Crystal Ridge at I-435 & Leavenworth Road, are mixed-use developments that had significant construction between 2004 and 2007. Another mixed use development, Delaware Highlands located east of K-7 on State Avenue, also saw a high level of construction between 2004 and 2008, but also added 11 housing units in 2009. The prices of these units range from $80,000 to $120,000. These developments have attached town homes, duplexes, and detached single-family homes. Permits were issued for 636 new units in these mixed-use subdivisions in 2004 through 2009.
iv
A new senior housing project called Pemberton Senior Village is located just south of Parallel Parkway on 82nd St. This $64.5 million housing project will have a total of 80 units, nearly all of them duplexes. A community center will also be built. Through March 2011, a total of 34 permits have been issued for a total of 59 units. The City of Kansas City, Kansas currently has 2,000 buildable lots in 60 subdivisions. The city is poised to continue its positive housing construction trend once the local and national economies begin to improve. Several other developments of interest are located generally north of State Avenue and east of I-635. Peregrine Falcon Estates had its first five homes for sale in 2008. The 30-home first phase will have homes ranging in value from $200,000 to $240,000. Located on 50 acres in the northeast portion of the city, Peregrine Falcon Estates is part of a TIF district that will eventually include 150 new single-family homes, 21 townhomes and 40 renovated homes. Also located in far northeast Kansas City, Kansas, Fairfax Bluff Apartments began renting refurbished units in 2008. A total of 254 units in 47 buildings make up the Fairfax Bluffs Apartment complex. These buildings were initially constructed during the 1940’s to house workers building bombers in the Fairfax Industrial Business District. Finally, the former Northeast Junior High School near 4th and Troup was converted to a 40-unit senior apartment complex in 2007. The conversion represents a $6 million investment and is heading into its second phase. Community Housing Wyandotte County (CHWC) is a non-profit, community development corporation, whose mission is to stabilize, revitalize, and reinvest in Wyandotte County through improved housing and other related developments. CHWC focuses its programs in the urban core neighborhoods of Kansas City, Kansas/Wyandotte County. CHWC was created through the merger of Catholic Housing of Wyandotte County and Neighborhood Housing Services of Kansas City, Kansas. Jointly, these agencies have built and sold over 150 new single-family homes in the urban core of Kansas City, Kansas, and rehabbed over 50 existing homes in the neighborhoods of Prescott, St. Peters/Waterway, St. Joseph/St. Benedict, Bethany, Chelsea, Riverview, and Strawberry Hill. 65 homes have been constructed or rehabbed in the St. Peter’s/Waterway Neighborhood, which is the largest redevelopment project to-date. In addition, CHWC has provided more than $2,000,000 in grants, minor home repair loans, and mortgages to low- and moderate-income households in our community, allowing them to make much needed improvements to their homes. Thus far in 2011, CHWC has completed construction and full occupancy of 20 new single-family homes in the Bethany Neighborhood (the first new construction in the neighborhood in more than 85 years). These homes are part of a program called “House-to-Home Bethany”, which is a 15-year lease to purchase program for families. At the end of the 15 years, the family will take full ownership of the house. In partnership with the Unified Government of Wyandotte County, CHWC is combating foreclosures in our neighborhoods through the utilization of the Neighborhood Stabilization Program, administered through the Community Development Department. CHWC has renovated and sold 10 foreclosed homes back to new families, and currently are working to rehab and sell an additional 14 foreclosures. It is CHWC’s goal to ensure that these vacant and foreclosed homes do not negatively impact the community and the neighborhoods we serve. Another project that CHWC hopes to complete pre-construction activities on in 2011 is titled the “Cottages at Bethany.” This entails plans to build 22 single-family cottages for 55 and older households looking for maintenance-free living in the Bethany neighborhood. The intent is to have this project completed in 2012. In 2010 alone, CHWC invested over $3.1 million dollars into the urban core neighborhoods of Kansas City, Kansas through revitalization efforts. CHWC assisted over 30 families achieve homeownership and through construction efforts created and/or sustained the equivalent of 23 full-time construction-related jobs. Finally, CHWC has been officially named a HUD Approved Counseling Agency. While CHWC has long provided homebuyer education services, it has always been a goal to be recognized and recommended by the Department of Housing and Urban Development as a place that families and individuals can come to seek the support they need when making the decision to purchase a home.
v
$0
$10
$20
$30
$40
$50
$60
$70
2001 2002 2003 2004 2005 2006 2007 2008 2009 2010YEAR
Millions
NEW SINGLE-FAMILY HOUSING, CONSTRUCTION VALUEKANSAS CITY, KS, 2001-2010
Among other inner-city developments are Mission Cliffs in Rosedale, near the University of Kansas Medical Center. For the period 2006 through 2008, permits were issued for 56 new housing units in this development. Mt. Carmel at 12th and Parallel Parkway is building a 48-unit subdivision and has 12 units. Earlier in the decade Mt. Carmel completed a senior complex (61 units) and a community-recreation center at this location.
Village West: In recent years, efforts have directed toward the development of a 1,600-acre tract of land, located directly northwest of the intersection of Interstate Highways I-70 and I-435. The Unified Government successfully lobbied for special state legislation establishing the boundaries of the Tourism District, now named Village West. State authorized Sales Tax Revenue Bonds (STAR Bonds) were used to fund eligible costs within the district for land acquisition, site improvements, streets, utilities, and landscaping. The Unified Government attracted the Kansas Speedway as the economic catalyst for development of this tract using the STAR Bond financing incentive. The speedway project, totaling more than $280 million, is a 1.5-mile tri-oval on approximately 1,100 acres of land, with 72 luxury hospitality suites and grandstand seating for 82,000. The speedway has at least four major race events per year, and is in use approximately 200 days per year for various events, including driving schools, charity events, and track tours. In 2011, a second NASCAR Sprint Cup race will be added to the racing schedule. It is estimated that this second race will have an economic impact of $100 million in the Kansas City metro area. With the addition of this second race, the Kansas Speedway invested $3.5 million in 2010 to add lighting to the Speedway for the possibility of a night race. In its first eight seasons, Kansas Speedway has operated at or near capacity for all major race events. An economic impact study commissioned by the Greater Kansas City Sports Commission on behalf of Kansas Speedway reported an annual $149.7 million of economic activity in the metropolitan Kansas City area associated with the Speedway’s 2001 inaugural season events. Joining Kansas Speedway at Village West are major destination retailers and entertainment business that attracted approximately 10 million visitors and shoppers in 2010. The initial anchor businesses and attractions include: Cabela’s, a 195,500 square-foot store with 116,666 square feet of retail space featuring hunting, fishing, and other outdoor items with an 11,000 square-foot museum and 60,000-gallon aquarium (opened August 2002); Nebraska Furniture Mart, a 1,075,000 square-foot store with 450,000 square feet of retail space and an adjacent warehouse that sells furniture, electronics, appliances, and floor coverings. In 2006, Nebraska Furniture Mart completed the construction of a warehouse addition which nearly doubled its existing warehouse capacity. In 2009, they initiated $1.5 million for remodeling various areas within the store (opened August 2003); and the Great Wolf Lodge and Resort, a 281-room lodge with a 40,000 square-foot indoor water park (opened June 2003). In 2010, Great Wolf Lodge invested nearly $500,000 to upgrade a water park slide and Cabela’s invested $500,000 on an interior remodel.

vi
In addition to the Great Wolf Lodge, four other hotels have opened in Village West, including a Hampton Inn (opened in 2003 with 76 rooms), the Chateau Avalon (opened in 2004 with 62 rooms), a Holiday Inn Express (opened in 2005 with 96 rooms) and Country Inn (opened in 2008 with 117 rooms). A permit for an 86-room Best Western has been issued with construction beginning in 2010. This hotel will be located close to the Kansas Speedway. The Legends at Village West is a more than $230 million shopping center housing nearly 855,000 square feet of retail, dining, and entertainment. In March 2010 the Legends repositioned itself as a destination for upscale outlet shopping. Since then, the Legends has reported a 9 percent increase in revenue and 5 percent increase in traffic. The Legends 14 Theatre complex (87,000 square feet) with state-of-the-art seating and sound systems is the largest of the tenants. In 2011 all 14 screens were upgraded with digital projection and seven of the auditoriums are now available for 3D presentation. Dave and Buster’s, with nearly 50,000 square feet, is a large restaurant/arcade. In 2006, the grand opening of the Legends Center occurred. Currently, over 100 businesses are open with many of the stores and restaurants new to the Kansas City area, creating a unique destination. Backfire BBQ opened in December 2009 and offers attractions that feature dining, entertainment and retail. Backfire BBQ is a partnership between the creators of the T-Rex restaurant located at the Legends and Orange County Chopper Inc. Also opening in 2009 were Five Guys Burgers and Fries and Vanity Fair Outlet. Several stores opened at the Legends in 2010, including Christopher & Banks, LOFT Outlet, Sephoria and the Treasure Chest. Thus far in 2011 three new retailers have announced they will be opening at the Legends - Chico’s, Soma Intimates and Saks Fifth Avenue Off 5th. In April 2006, approximately 235,000 square feet of the original STAR Bond area that provided the financial mechanism to create the Kansas Speedway and the Village West tourism district was removed. This tract of land, which the Unified Government successfully petitioned to be removed, is located in the original northwest corner of the tourism district. Currently, five businesses are operating in the area and local sales taxes generated are being retained by the local entities. These businesses include two large department store retailers, JC Penney and Target (both opened in 2006) as well a Taco Bueno (opened 2007), Payless Shoesource, Panda Express restaurant, a National Tire and Battery and a 117-room Country Inn and Suite (all of which opened in 2008).

vii
Village West and the Legends truly is a unique retail experience. The Unified Government has been awarded the International Economic Development Council (IEDC) 2009 Excellence in Economic Development award in the Public-Private Partnership Category for the Village West Project. IEDC is the largest and most respected professional economic development organization with members worldwide. As of December 2010, 101 businesses, including 29 restaurants, were open in Village West, employing nearly 5,700 persons. These businesses generated over $550 million in retail sales with local and state sales tax, use and transient guest tax collections of over $48 million. The 2010 real and personal property taxes levied for this development area was just over $11 million. Design and construction of two major new developments within the Village West were underway in 2010. The Unified Government, Zimmer Real Estate Services, Inc. and the Kansas Unified Development, LLC entered into a Multi-Sport Stadium Venture Agreement (“Stadium Agreement”) for the construction of an 18,000-seat multi-sport stadium complex that will be the permanent home to the Sporting Kansas City, a Major League Soccer team. Under the Stadium Agreement, the Unified Government has issued STAR Bonds that result in $147,000,000 of net funding for the Stadium Project. The STAR Bonds are payable from State and local sales and transient guest taxes. Construction has commenced for the Stadium Project and the stadium is anticipated to be open in June 2011. In addition to the stadium, a tournament style soccer field complex will be constructed nearby and three recreational soccer fields will be constructed in Kansas City, Kansas. The Unified Government, Zimmer Real Estate Services, Inc. and Cerner Corporation entered into Land Transfer and Specific Venture Agreement in which Cerner Corporation proposes to construct approximately 600,000 square feet of Class A office buildings to accommodate 4,000 Cerner employees. Cerner Corporation is an international supplier of healthcare technology. Construction of the first office building is to begin no later than December 1, 2011 with the entire office complex to be completed by December 1, 2016. The Stadium Project, Class A office buildings and ancillary improvements are expected to cost in excess of $400 million. CommunityAmerica Ballpark is the home of the Kansas City T-Bones, a member of independent baseball’s Northern League. Since the T-Bones moved to Kansas City, Kansas and built their ballpark in 2003, they have proven to be one of the most popular independent teams in the country, averaging 6,000 fans per game. The T-Bones also host area high school and college games and tournaments, as well as Kansas City Kansas Community College games. CommunityAmerica Ballpark has also seen performances by Bob Dylan, Willie Nelson, Def Leppard, Bryan Adams, and various other entertainment acts. The T-Bones have also designed a cash element for their charity outreach: the T-Bones Uncommitted Recreation Fund (TURF). This fund, while administered by the Greater Kansas City Community Foundation, is solely created and funded by the T-Bones. TURF deposits have to date registered in excess of $500,000. TURF’s purpose is to fund capital improvements for Wyandotte County’s Parks & Recreation Department. The fund is specifically not directed toward the department’s annual operating budget, but instead is designed to create a long-lasting, accessible infrastructure for children’s recreation and sports activities. Recent TURF projects included playground and playing field renovations at: Heathwood Park, Pierson Park, Eisenhower Park and Regan Park, which annually hosts the metro-wide Special Olympics softball tournament. Entering their ninth season, the T-Bones have garnered numerous awards, including Northern League Organization of the Year honors in 2004 and 2007, and Kansas City Kansas Chamber of Commerce Small Business of the Year in 2006. The T-Bones also brought championship baseball back to Kansas City with a Northern League Championship in 2008. In 2009, CommunityAmerica Ballpark was named Playing Surface of the Year for both the Northern League and Major League Soccer. The T-Bones welcomed their two-millionth fan into Wyandotte County in the 2010 season. Major Initiatives In 2005, plans for Schlitterbahn Vacation Village were approved by the Kansas Secretary of Commerce to allow for up to $225 million in STAR Bond financing. This represents a second STAR Bond approval and is separate from the STAR Bonds issued for the Kansas Speedway and Village West Project. The total cost of the Schlitterbahn development will be nearly $750 million. Plans for the development include a riverwalk, water-park resort, marine park, lodging, and retail amenities. The site is located on 370 acres east of I-435 between State Avenue and Parallel Parkway and will complement the Village West development. A 24-acre

viii
first phase of the water park opened in July 2009. For the 2011 season, plans were unveiled for a multi-million dollar expansion that will include six new attractions. Construction began in early 2011 on one of these new slides. Company representatives were encouraged by the 2010 season which exceeded expectations. In 2010, the water park drew visitors from all 50 states, as well as the District of Columbia, the Virgin Islands, Puerto Rico, Canada and Mexico. The first phase includes 16 attractions with 24 slides and created 350 seasonal staff positions. Once the STAR Bonds are retired, these developments will become a major source of the new sales and guest tax revenues for local and state governments. In 2007, Wyandotte County voters approved a measure to legalize gambling. In December 2009, the Kansas Lottery Gaming Facilities Review Board approved the construction of a casino in Wyandotte County. Kansas Entertainment, the casino developer, began construction of phase one of the project in the summer of 2010. This project is valued at $386 million and is being built on Turn 2 of the Kansas Speedway. The first phase of the project will include 2,300 slot machines, 86 table games, restaurants and bars. The proposal also includes a second Sprint Cup NASCAR race in 2011 and construction of a Grand-Am sports car road course at Kansas Speedway. The casino project is expected to create 1,500 construction jobs and 1,100 new casino jobs. In the second phase of the project, a 300-room hotel with convention space will be built, along with an entertainment district featuring more restaurants and nightclubs, expanded gaming floor, and a spa. It is anticipated that the casino will be opened by spring 2012.
Adjacent to Kansas University Medical Center a $39 million mixed-use economic development project, 39th & Rainbow, will begin construction this spring. During the first week of April 2011, the existing Sun Inn Hotel was demolished to make way for this project. Plans for this development include approximately 10,000 square feet of first-floor retail space and, on the second through fourth floors, an 83-room Holiday Inn Express & Suites. This area is attractive for new retail development due to the area’s dense resident population and the proximity to the KU Medical Center and Hospital. This area draws more than 10,000 persons daily. Downtown Several major investments have occurred in the downtown area during the past seven years. The Unified Government, through a public/private partnership with KCK Investors, LLC, owns a 49.5% interest in KCK Hotel Group, LLC. This group constructed a Hilton Garden Inn and refurbished the Jack Reardon Convention Center in the urban core. The Hilton Garden Inn Hotel has 147 rooms, a full service restaurant and lounge and adjoins the Jack Reardon Convention Center providing a first-class hotel and convention center to downtown Kansas City, Kansas. In 2011, the hotel and convention center, managed by the Raphael Hotel Group completed its tenth year of operation. Built with and adjoining the hotel is a new 100,000 square-foot headquarters facility for the Board of Public Utilities (BPU). A 485-space parking garage funded in part by a $1.5 million grant from the Economic Development Administration completes this development. In 2003, the Environmental Protection Agency completed the construction of a new lab facility at a cost exceeding $16 million in the downtown area. This lab is adjacent to the EPA Regional Office, a $55 million complex for 600 employees. The EPA has announced plans to move out of Kansas City, Kansas effective April 2012. The current owner of the EPA building in the City has filed a formal protest with the U.S. General Services Administration in an attempt to stop the move. The Mayor of the City has also filed a request with the White House to review the recommendation by the U.S. General Services Administration that gave permission for the EPA to move its offices. The Gateway Office complex located between 4th & 5th Streets south of State Avenue has been transformed into the Children’s Campus of Kansas City. The Children’s Campus serves as a national model in early childhood services focusing on pre-kindergarten children. The 3-story, 72,000 square-foot building valued at $13 million, opened in the summer of 2010. The Children’s Campus houses early childhood education services, family support services, and health, oral health, and mental health services for young children and their families. A $12 million office building housing Kansas Social and Rehabilitation Services employees was completed in 2008. This building is adjacent to the Children’s Campus.
ix
Industrial Park Developments The Unified Government currently has four major industrial parks: Fairfax Industrial Business District, Central Industrial Business District, Armourdale Industrial Business District, and the Santa Fe Industrial Business Park. These four industrial areas represent 80% of the industrial development in the Unified Government. The Unified Government has several other industrial park developments in the Hart Business Park located at 55th and K-32, Woodend Industrial Park along the I-435 Corridor, the Muncie Industrial Park located at 62nd and K-32 and the I-635 Industrial Park at I-635 and Metropolitan. Edwardsville has also developed an industrial/warehouse area near I-435 and the Kansas River. In the Fairfax Industrial Business District, the General Motors Fairfax Plant completed a $116 million expansion in order to produce a line of Saturn automobiles. In 2007, General Motors began building a redesigned Chevrolet Malibu. This change to the Fairfax plant was a $190 million investment. In 2008, General Motors built a $2.5 million addition to one of its buildings. In 2009, General Motors began production of the Buick LaCrosse. This move added 375 jobs at the Fairfax plant. A third shift was added in January 2010, creating approximately 900 jobs. It was announced in April 2010 that General Motors will invest $136 million in its Kansas City plant to rebuild its next-generation Chevrolet Malibu and a hybrid version of the Buick LaCrosse. Kellogg’s Snack Division, also located in the Fairfax Industrial District, underwent a $33 million expansion in 2007 to manufacture three new product lines. Also in 2007, Owens Corning has placed in service an $8.8 million J-3 Insulation production line. Exide Technologies, which manufactures lead-acid batteries, plans to spend $7 million to expand operations at its Fairfax plant. Advanced Building Composites, which develops economical, light-weight, high-strength composite building materials, began operations in early 2010. The Armourdale Industrial Business District has several major on-going developments. In 2006, Proctor & Gamble began a $70 million expansion for both a new product line and packaging line. Prime Investments built a $5 million industrial/warehouse building and the PQ Corporation constructed a $1.8 million conversion of a warehouse facility in 2007. Further, in 2011 PQ was issued a building permit valued at $6 million for a new chemical manufacturing facility. In 2009, mattress-maker Sealy Corporation signed a 10-year lease for a new 123,000 square-foot plant in Armourdale and will move its operations from the Fairfax Industrial Business District. In 2010, it was announced that Zeolyst International, manufacturer of zeolite powders used in a variety of industrial applications, will make a $83 million capital investment to its Kansas City, Kansas location, including a 43,000 square-foot addition. The company also plans to add 33 positions. The project is expected to be completed in late 2012 or early 2013.
x
In the Santa Fe Industrial Business Park, Display Studios opened a $4.4 million manufacturing facility in 2007. Burlington Northern Santa Fe Railroad built a $1.5 million commercial building in 2008. Also in 2008, just outside the Santa Fe Industrial Business Park, Swartz Road Warehouse built a $1.4 million addition. In 2009, two more businesses announced there were moving to the Santa Fe Industrial Business Park. A Sara Lee meat-slicing plant will occupy an existing 187,000 square-foot building and bring 250 jobs to the area. This plant became fully operational in 2011. GMJ, a parent company for six transportation related businesses, will occupy a previously vacant 120,000 square-foot building. The Ranpark Corporation expanded into the Central Industrial Business District. Ranpark manufactures paper packaging materials and spent approximately $1 million on the plant in 2007. In 2009, Package Development Corp. spent $1 million to purchase and equip a building that will be used to create packaging for food industry customers. Weyerhaeuser constructed a new $6.2 million lumber product distribution center near I-435 and K-32 in 2003. Griffin Wheel finished a $13 million expansion of its rail car wheel manufacturing facility in the K-32 Muncie area in 2005. In 2007, Griffin Wheel constructed a $1.25 million building addition. Plastic Packaging, located just off Holliday Drive and 65th Street, undertook a $1.2 million building expansion in 2006. Recent developments in other areas include: Kansas City Steaks spent $4 to 5 million on additional equipment and added 30 to 40 employees at its location in Armourdale; locally owned Liberty Fruit Company in 2010 expanded its operations in the Argentine neighborhood in Kansas City, Kansas by increasing its warehouse capacity 50% ($1.3 million building addition) and hiring 25 additional employees; Frito Lay spent $2 million on a distribution center in the Melrose Business Park, near I-635 and Metropolitan; Midland Pharmaceuticals recently expanded its facility through a $4.6 million investment in the Rosedale/Shawnee Heights area of Wyandotte County; and Fastenal and Quill opened new distribution facilities in the Edwardsville I-435 industrial area at an aggregate investment of $14.4 million. In the Cambridge Business Park, located just west of Kansas City, Missouri and north of I-35, Rite Maid Paper built a $5 million office/warehouse facility in 2007. Further, in 2010, Western Blue, a printing company, announced plans to relocate to this area from Kansas City, Missouri. Western Blue will move into a 20,000 square-foot industrial building which will improve the company’s visibility and access. Another move into the Cambridge Business Park includes McAnany Van Cleave & Phillips PA, a prominent Kansas City, Kansas law firm. They moved into a 26,500 square-foot office space in early 2011. Office and Service The downtown area, with approximately 6,000 employees, has the largest concentration of office workers. In addition to the downtown area, there are active office parks in Cambridge Terrace, Meadowlark Lane, Woodlands West and assorted office and medical facilities in different locations throughout the community. The Unified Government owns and operates the 111-acre Public Levee facility in the Fairfax Industrial Business District. At the close of 2009, the Public Levee has 569,000 square feet of warehouse and office space. 72% of the warehouse and 48% of the office space is under lease, with warehouse space accounting for over 91% of total Levee space. In addition, a large grain elevator facility, with 253,000 square feet and a five story cold storage facility containing 164,000 square feet, remains leased. .
xi
Several offices and service buildings have been constructed directly north of Village West, near 110th and Parallel Parkway. The cost of development associated with these office facilities is in excess of $5 million. The firms locating in this area include: Heartland Primary Care, a medical group; Security National Bank; Mid America Bank and Trust; and a general office building. In 2008, construction began on a new $2.5 million Discover Vision Center office building in this general area. This building opened in 2009 and provides essential vision related services to Wyandotte County residents. Woodlands West, directly east of I-435 and Leavenworth Road, has also experienced recent development. Two office buildings have opened since 2004. In 2007, two new hotels opened in the I-435 corridor: Comfort Suites (84 rooms) located at I-435 & Leavenworth Rd. and Candlewood Inn (98 rooms) at 110th & Parallel. In 2008, Byrd’s Dance and Gymnastics studio opened. Adjacent to Byrd’s a newly constructed Masonic lodge opened in 2009. The combined value of these projects is over $2 million. Retail In addition to the Village West development, several other developments have seen growth in recent years. The State Avenue midtown area has had several developments. Earlier in the decade Walgreens built a new pharmacy/discount store at 78th and State Avenue. Lowes constructed an $8.1 million 125,000 square-foot home improvement store at 72nd and State Avenue. In 2007, a Walgreens located at 28th and State Avenue opened. In 2009, a new Taco Bell restaurant opened at 73rd and State Avenue. The Save-A-Lot grocery store chain has remodeled a grocery store that has been closed for several years located at 81st and State Ave. The store was remodeled in 2010 is currently open. Also in the midtown area at 54th and Leavenworth Road, a grocery store was remodeled and opened in November 2008 at a cost of nearly $1 million. This redevelopment brought a much needed quality grocery store to this part of town. A Church’s Chicken opened in 2010 at 82nd and Parallel Parkway. In the southeast portion of the city the Shawnee Plaza shopping area is undergoing redevelopment. In 2011 permits were issued for a Sunfresh Market grocery store remodel and a façade renovation for the other retail stores. Parking lot resurfacing is also occurring. The value of these projects totaled $1.2 million. Other new retail stores for 2010 in various parts of the city include: a new CVS Pharmacy ($1.5 million) located in the southwest corner of the city; a new Dollar General store located at 60th and Leavenworth Road; and a new Casey’s General Store ($1.0 million) located at 130th and State Ave. All of these stores began construction in 2010. Piper Plaza has completed its second phase with the development of a neighborhood strip center. Piper Plaza is located near Village West at 110th and Parallel Parkway, but has more of a neighborhood focus, with tenants such as a dry cleaner, UPS delivery store, bar and grill and dental office. Its development costs are in excess of $3 million. Not far from Piper Plaza, several banks have opened with a combined value of $4.3 million. These include Security Bank (2005), Country Club Bank (2005), and First State Bank and Trust (2007). In late 2006, the Unified Government Commission approved a $190 million project called Plaza at the Speedway, a tax increment project located on the north side of Parallel Parkway across from the Legends shopping area. This development will provide 775,000 square feet of retail shopping and is expected to create over 2,100 jobs. The shopping area is anchored by a Best Buy that opened in the spring of 2009 and a Wal-mart Supercenter that opened in October 2009. A Taco Bell opened in April 2010 and an Olive Garden restaurant opened in May 2010. Other openings are as follows: Kohl’s retail store - September 2010; Chick-Fil-A restaurant - October 2010; and Red Lobster - March 2011. A building permit was issued in April 2011 for a Jack In the Box restaurant. Finally, just on the other side of Interstate I-435 from Village West, a new Toyota dealership is under construction and is valued at $6 million.

xii
Recreation A new YMCA facility, completed in 2006 at a cost of approximately $4 million, was built adjacent to the Providence Medical Center. Mt. Carmel Development built a community center, with a cost similar to the YMCA, in the eastern area of Wyandotte County near 12th and Parallel Parkway and opened in 2006. In November 2006, Heart of America Volleyball Association completed a conversion of an existing building to offices and a volleyball recreation facility which has five tournament courts. This building will serve as a practice facility and will also host local and regional volleyball tournaments. In 2010, the Wyandotte County Fair Board spent $800,000 on grading for a new site for the Wyandotte County Fair to be located in the vicinity of 137th and Polfer road in the northwest portion of Wyandotte County. Internal Accounting Controls Financial Control: The Unified Government of Wyandotte County/Kansas City, Kansas, has adopted a comprehensive system of internal controls designed to reasonably safeguard Unified Government assets, check the accuracy and reliability of its accounting data, promote operational efficiency, and encourage adherence to prescribed managerial policies within the Unified Government. Basic management responsibilities emphasize that the accounting system must have a strong relationship with all other management control systems. The Unified Government's internal accounting controls reasonably safeguard assets and provide reasonable assurance of proper recording of all financial transactions. As part of the continuing effort to improve fiscal stewardship and financial accountability, the Unified Government utilizes a fully computerized financial accounting management information system, the Cayenta Financials System (CFS). The system is an integrated, online municipal government financial management system, comprised of many subsystems. Modifications and enhancements are continually being made to this system in order to keep abreast of rapidly changing accounting techniques and principles. CFS is based on the single transaction concept of processing, in which all relevant files and reports are updated from a single input of information. Look-up tables are used to tailor all accounting and classification treatments and are changed by file maintenance initiated by the Financial System Administrator. Budgetary Control: The Unified Government maintains budgetary controls, which have the objective of ensuring compliance with legal provisions embodied in the annual appropriated budget approved by the Unified Board of Commissioners. Activities of the General Fund, Special Revenue Funds, Debt Service Fund, and Proprietary Funds are included in the annual appropriated budget. The Unified Government has the following levels of budgetary control: • The legal level of control is established at the fund level by State statutes, which also permits the transfer
of budgeted amounts from one object or purpose to another within the same fund.
• The Unified Government further controls spending by requiring that no expenditures be committed that would exceed the amount appropriated for the spending category (e.g., Personnel Services, Contractual Services) without the department first obtaining approval.
• As allowed by State statute, the governing body can increase the fund level expenditures by amending the budget. An amendment may only be made for previously unbudgeted increases in revenue other than ad valorem taxes. To do this, a notice of public hearing to amend the budget must be published in the local newspaper. At least ten days after the publication, the hearing may be held and the governing body may amend the budget at that time.
The Unified Government's annual budget is prepared in conformance with and certified as required by Kansas State Statutes. The Unified Government Administrator and the Unified Board of Commissioners evaluate budget proposals of the various Unified Government departments to determine funding for operating, capital and public service programs. After giving due consideration to the input received from citizens, the Unified Board of Commissioners adopts the budget. Thus, the adopted budget is a document which places before the people of the Unified Government a clear and precise picture of the cost of public services which are to be
xiii
provided. The budget process is automated and appropriately controlled through an online accounting system to assure effective fiscal management and accountability. Property Tax Levies and Collections In accordance with applicable state statutes, property taxes levied during the current year are revenues to be used to finance the budget of the ensuing year. Taxes are assessed on a calendar year basis and are levied and become a lien on the property on November 1 of each year. The County Treasurer is the tax collection agent for all taxing entities within the County. Property owners have the option of paying one-half of the full amounts of the taxes levied on or before December 20 during the year levied with the balance to be paid on or before May 10 of the ensuing year. State statutes prohibit the County Treasurer from distributing taxes collected in the year levied prior to January 1 of the ensuing year. Consequently, for revenue recognition purposes, the taxes levied during the current year are not due and receivable until the ensuing year. At December 31, such taxes are a lien on the property and are recorded as taxes receivable, net of anticipated delinquencies, with a corresponding amount recorded as unearned revenue. It is not practicable to apportion delinquent taxes held by the County Treasurer at the end of the year and the amounts thereof are not material in relationship to the financial statements taken as a whole. The November 2010 certified assessed valuation for Wyandotte County was $1.1 billion. Real property value accounted for 84% of this overall figure. The overall total was 4% below the prior year total. Residential and commercial property valuations continue to be impacted by the nation’s 2008 economic recession; however the total 4% decline in property valuation in 2010 was significantly less than the prior-year loss of 10.9%. Personal property valuation is still affected by the 2006 legislation that exempts new machinery and equipment purchases from the tax roll. Personal property assessed value declined by $13.3 million or 11% from 2009 to 2010. The Unified Government 2010 tax levy for the 2011 budget is $79.3 million. In 2009, the Unified Government levied $78.8 million in property taxes for budget year 2010. Current property tax revenue collections in 2010 were $70.6 million. In comparison, in 2009 the current tax collections were $77 million, derived from a 2008 tax levy of $86.6 million. The collection rate for current property taxes increased from 89% in 2009 to 90% in 2010. This improvement can be attributed to the settlement of several commercial property valuation appeals in the prior year. Special and Extraordinary Items Three special items occurred in 2010, impacting the financials. First all employees, with the exception of public safety personnel were subject to 12 mandatory furlough days. This action resulted in salary reductions of $2.2 million on an annual basis. The General Fund represented 72% or $1.6 million of the savings. Offsetting this savings was an early retirement incentive program that 76 individuals committed to. Accrued pay and benefits for these individuals totaled $2.7 million, with a General Fund expense of $2.5 million. Voters approved a 3/8th cent dedicated sales tax in April 2010. The tax began July 1st of 2010 and the government received four months of tax distributions in 2010 totaling $1,880,559. A special revenue fund was established for the receipt of these tax payments and for budgeted expenditures from the fund. Cash Management All idle cash is invested during the year in certificates of deposit, US Treasury Notes, the Kansas Municipal Investment Pool, U.S. Government agencies, bank trust department municipal pools, temporary notes or no fund warrants, repurchase agreements and overnight investments in the Unified Government’s primary depositories. At December 31, 2010 the carrying amount of such investments was $201,801,531. The Unified Government earned interest income in the amount of $1,156,385 during the year ended December 31, 2010. The Unified Government pools its operating funds in order to maximize interest revenue. As provided by State law (K.S.A. 9-1402), the Unified Government’s depositories pledge securities with market value at least equal
xiv
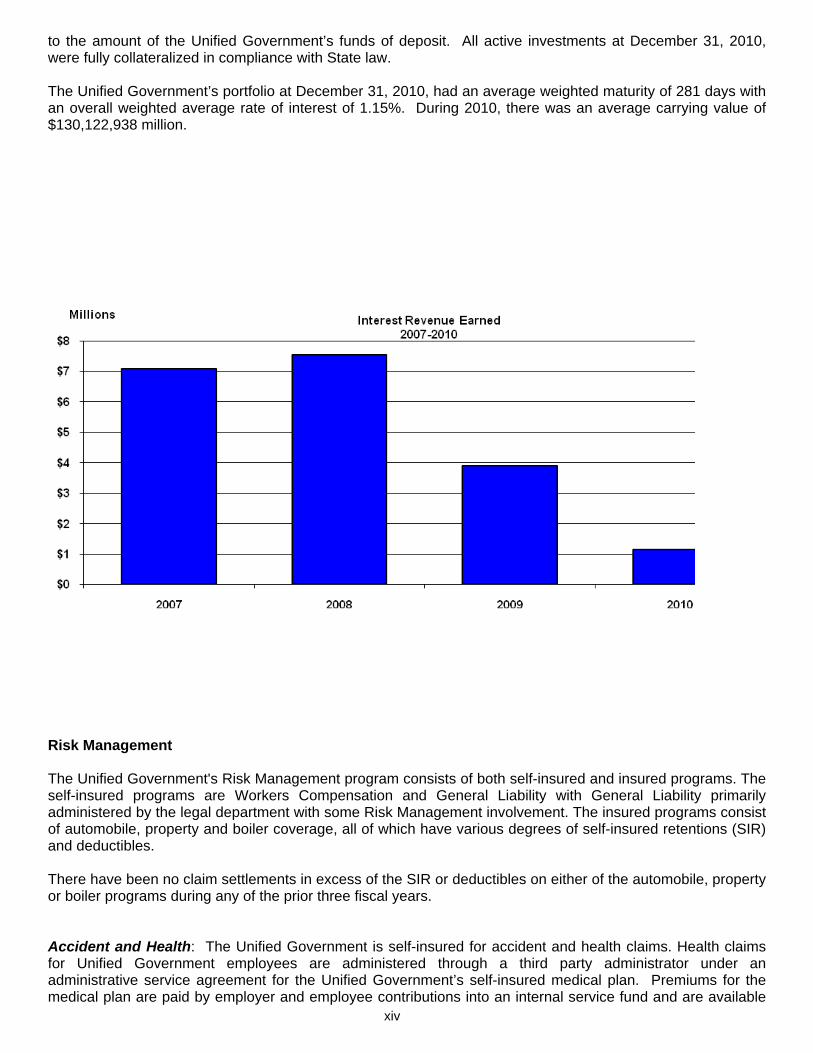
to the amount of the Unified Government’s funds of deposit. All active investments at December 31, 2010, were fully collateralized in compliance with State law. The Unified Government’s portfolio at December 31, 2010, had an average weighted maturity of 281 days with an overall weighted average rate of interest of 1.15%. During 2010, there was an average carrying value of $130,122,938 million.
Risk Management The Unified Government's Risk Management program consists of both self-insured and insured programs. The self-insured programs are Workers Compensation and General Liability with General Liability primarily administered by the legal department with some Risk Management involvement. The insured programs consist of automobile, property and boiler coverage, all of which have various degrees of self-insured retentions (SIR) and deductibles. There have been no claim settlements in excess of the SIR or deductibles on either of the automobile, property or boiler programs during any of the prior three fiscal years. Accident and Health: The Unified Government is self-insured for accident and health claims. Health claims for Unified Government employees are administered through a third party administrator under an administrative service agreement for the Unified Government’s self-insured medical plan. Premiums for the medical plan are paid by employer and employee contributions into an internal service fund and are available
xv
to pay health claims and administrative costs of the plan. An excess insurance policy covers individual claims paid in excess of $250,000 per person, per year for all non-job related injuries and for job-related claims paid for members of the Kansas City, Kansas Fire Department. The Board of Public Utilities (BPU) is essentially 100% self-insured for health care claims and is responsible for the first $500,000 of general liability and automobile insurance claims. In addition, any general liability or automobile claims greater than $35,000,000 are the responsibility of BPU. Workers’ Compensation: The Unified Government is self-insured for workers' compensation. An excess coverage insurance policy covers individual claims in excess of $750,000. Effective January 1, 2000, the former county’s workers’ compensation program was consolidated with the former city’s program, which is self-insured. The BPU is self-insured to the first $350,000 per employee/per occurrence for workers' compensation. Claims exceeding $350,000 and up to $35,000,000 per employee/per occurrence are fully insured. General Liability: The Unified Government is also self-insured for liability claims with no premium paid to any insuring firm. All liability claims are reviewed, challenged if appropriate, and processed for payment at the agreed amount by the Legal Department. Kansas statutes limit the liability in tort cases to $500,000. Conduit Debt In order to encourage economic and industrial development, the Unified Government issues tax exempt industrial revenue bonds to assist local companies in financing the construction or renovation of industrial facilities on Unified Government land or acquisition of equipment. The proceeds of the bonds issued are deposited with local financial institutions, which act as trustees. As of December 31, 2010, a total of $547.7 million in industrial revenue bonds had been issued for various capital investment initiatives and remain outstanding. This amount includes in excess of $295.9 million of current issues for the Kansas City, KS General Motors’ automobile assembly plant. Independent Audit The basic financial statements for 2010 were examined by Allen, Gibbs, & Houlik, L.C., and their opinion has been included in this report. They have provided the Unified Government with an unqualified opinion. Additionally, the Unified Government is required to undergo an annual single audit in conformity with the provisions of the Single Audit Act of 1996 and U.S. Office of Management and Budget Circular A-133, entitled Audits of States, Local Governments and Non-Profit Organizations. Information related to this single audit, including the Schedule of Expenditures of Federal Awards, findings and questioned costs, and auditor's reports on the internal control structure and compliance with applicable laws and regulations are included in a separate report issued annually by the Unified Government. Certificate of Achievement for Excellence in Financial Reporting The Government Finance Officers Association (GFOA) of the United States and Canada awarded a Certificate of Achievement for Excellence in Financial Reporting to the Unified Government for its Comprehensive Annual Financial Report for the fiscal year ended December 31, 2009. This is the ninth consecutive year that the government has achieved this prestigious award. In order to be awarded a Certificate of Achievement, the government must publish an easily readable and efficiently organized report, which conforms to applicable program standards, generally accepted accounting principles, and applicable legal requirements. A Certificate of Achievement is valid for a period of one year only. The Unified Government believes that our current Comprehensive Annual Financial Report continues to meet the Certificate of Achievement Program’s requirements and we are submitting the 2010 Comprehensive Annual Financial Report to GFOA to determine its eligibility for another certificate.
xvii
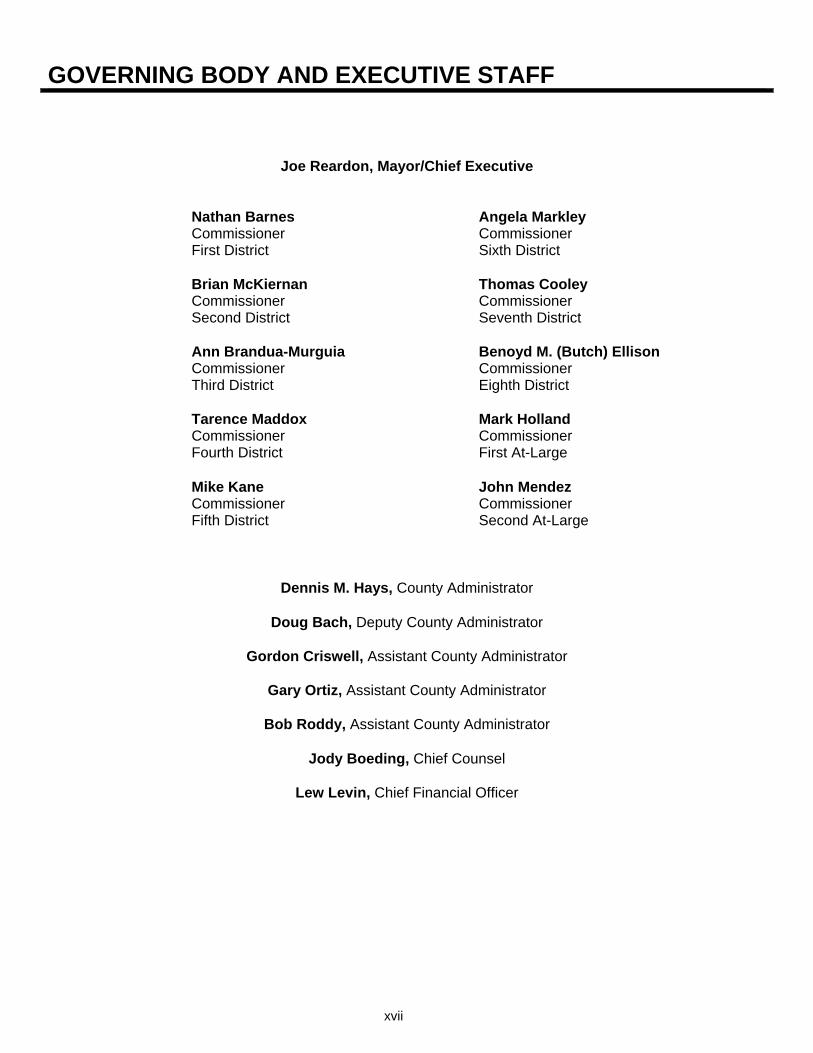
GOVERNING BODY AND EXECUTIVE STAFF
Joe Reardon, Mayor/Chief Executive
Nathan Barnes Angela Markley Commissioner Commissioner First District Sixth District
Brian McKiernan Thomas Cooley Commissioner Commissioner Second District Seventh District
Ann Brandua-Murguia Benoyd M. (Butch) Ellison Commissioner Commissioner Third District Eighth District Tarence Maddox Mark Holland Commissioner Commissioner Fourth District First At-Large Mike Kane John Mendez Commissioner Commissioner Fifth District Second At-Large
Dennis M. Hays, County Administrator
Doug Bach, Deputy County Administrator
Gordon Criswell, Assistant County Administrator
Gary Ortiz, Assistant County Administrator
Bob Roddy, Assistant County Administrator
Jody Boeding, Chief Counsel
Lew Levin, Chief Financial Officer

xviii

xix
UNIFIED GOVERNMENT OF WYANDOTTE COUNTY/KANSAS CITY, KANSAS COMPREHENSIVE ANNUAL FINANCIAL REPORT For the year ended DECEMBER 31, 2010
FINANCIAL SECTION
The Financial Section is the Unified Government’s audit report. It includes the opinion of the Independent Auditors, Management’s Discussion and Analysis (MD&A), the Basic Financial Statements and Combining Statements and Schedules. The Basic Financial Statements reflect all financial activity of the Unified Government combined into nine (9) schedules. Notes to the Financial Statements are adjunctive to the Basic Financial Statements, serving to explain the numbers and to highlight required disclosures. The Combining Statements and Schedules reflect greater detail of the Unified Government’s financial activities. Also included are schedules showing the extent of each fund’s compliance to state budget laws.
1
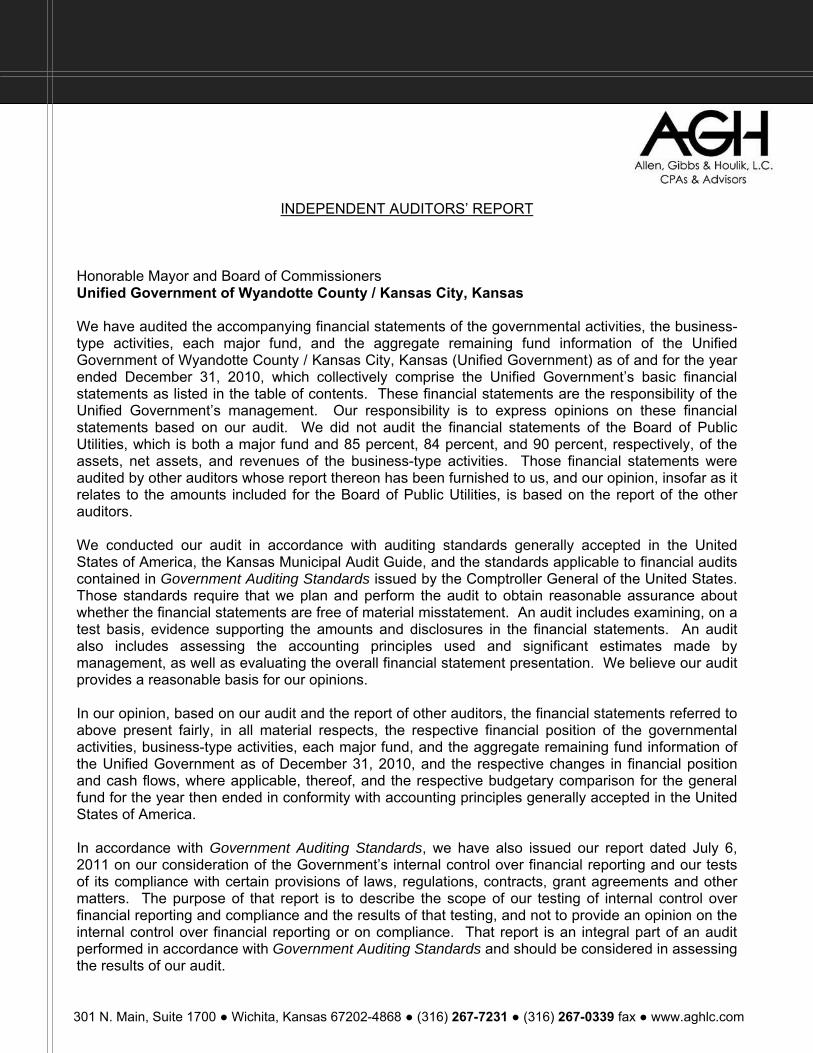
301 N. Main, Suite 1700 ● Wichita, Kansas 67202-4868 ● (316) 267-7231 ● (316) 267-0339 fax ● www.aghlc.com
INDEPENDENT AUDITORS’ REPORT Honorable Mayor and Board of Commissioners Unified Government of Wyandotte County / Kansas City, Kansas We have audited the accompanying financial statements of the governmental activities, the business-type activities, each major fund, and the aggregate remaining fund information of the Unified Government of Wyandotte County / Kansas City, Kansas (Unified Government) as of and for the year ended December 31, 2010, which collectively comprise the Unified Government’s basic financial statements as listed in the table of contents. These financial statements are the responsibility of the Unified Government’s management. Our responsibility is to express opinions on these financial statements based on our audit. We did not audit the financial statements of the Board of Public Utilities, which is both a major fund and 85 percent, 84 percent, and 90 percent, respectively, of the assets, net assets, and revenues of the business-type activities. Those financial statements were audited by other auditors whose report thereon has been furnished to us, and our opinion, insofar as it relates to the amounts included for the Board of Public Utilities, is based on the report of the other auditors. We conducted our audit in accordance with auditing standards generally accepted in the United States of America, the Kansas Municipal Audit Guide, and the standards applicable to financial audits contained in Government Auditing Standards issued by the Comptroller General of the United States. Those standards require that we plan and perform the audit to obtain reasonable assurance about whether the financial statements are free of material misstatement. An audit includes examining, on a test basis, evidence supporting the amounts and disclosures in the financial statements. An audit also includes assessing the accounting principles used and significant estimates made by management, as well as evaluating the overall financial statement presentation. We believe our audit provides a reasonable basis for our opinions. In our opinion, based on our audit and the report of other auditors, the financial statements referred to above present fairly, in all material respects, the respective financial position of the governmental activities, business-type activities, each major fund, and the aggregate remaining fund information of the Unified Government as of December 31, 2010, and the respective changes in financial position and cash flows, where applicable, thereof, and the respective budgetary comparison for the general fund for the year then ended in conformity with accounting principles generally accepted in the United States of America. In accordance with Government Auditing Standards, we have also issued our report dated July 6, 2011 on our consideration of the Government’s internal control over financial reporting and our tests of its compliance with certain provisions of laws, regulations, contracts, grant agreements and other matters. The purpose of that report is to describe the scope of our testing of internal control over financial reporting and compliance and the results of that testing, and not to provide an opinion on the internal control over financial reporting or on compliance. That report is an integral part of an audit performed in accordance with Government Auditing Standards and should be considered in assessing the results of our audit.
The management’s discussion and analysis and required supplementary information as listed in the table of contents are not a required part of the basic financial statements but are supplementary information required by accounting principles generally accepted in the United States of America. We and the other auditors have applied certain limited procedures, which consisted principally of inquiries of management regarding the methods of measurement and presentation of the required supplementary information. However, we did not audit the information and express no opinion on it. Our audit was conducted for the purpose of forming opinions on the financial statements that collectively comprise the Unified Government’s basic financial statements. The introductory section, combining and individual nonmajor fund financial statements and schedules, and statistical section listed in the table of contents are presented for purposes of additional analysis and are not a required part of the basic financial statements. The combining and individual nonmajor fund financial statements and schedules have been subjected to the auditing procedures applied in the audit of the basic financial statements and, in our opinion, are fairly stated in all material respects in relation to the basic financial statements taken as a whole. The information in the introductory and statistical sections has not been subjected to the procedures applied by us and the other auditors in the audit of the basic financial statements, and accordingly, we express no opinion on such information.
Allen, Gibbs & Houlik, L.C.
CERTIFIED PUBLIC ACCOUNTANTS July 6, 2011 Wichita, Kansas
4
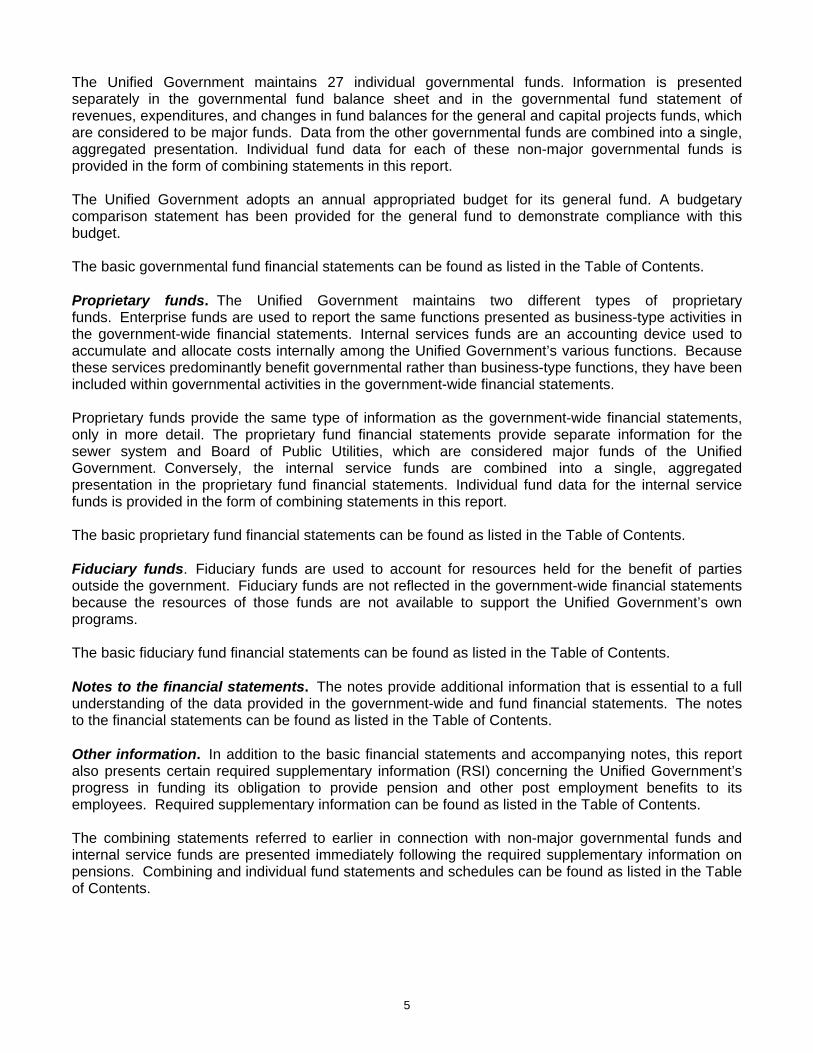
Management’s Discussion and Analysis This discussion and analysis are intended to serve as an introduction to the Unified Government’s basic financial statements. The Unified Government’s basic financial statements comprise three components: 1) government-wide financial statements; 2) fund financial statements; and 3) notes to the financial statements. This report also contains other supplementary information in addition to the basic financial statements themselves. Overview of the Financial Statements Government-wide financial statements. The government-wide financial statements are designed to provide readers with a broad overview of the Unified Government’s finances, in a manner similar to a private-sector business. The statement of net assets presents information on all of the Unified Government’s assets and liabilities, with the difference between the two reported as net assets. Over time, increases or decreases in net assets may serve as a useful indicator of whether the financial position of the Unified Government is improving or deteriorating. The statement of activities presents information showing how the government’s assets changed during the most recent fiscal year. All changes in net assets are reported as soon as the underlying event giving rise to the change occurs, regardless of the timing of related cash flows. Thus, revenues and expenses are reported in this statement for some items that will only result in cash flows in future fiscal periods (e.g., uncollected taxes and earned but unused vacation leave). Both of the government-wide financial statements distinguish functions of the Unified Government that are principally supported by taxes and intergovernmental revenues (governmental activities) from other functions that are included to recover all or a significant portion of their costs through user fees and charges (business-type activities). The governmental activities of the Unified Government include general government, health and welfare, public safety, public works, parks and recreation, and planning and development services. The business-type activities of the Unified Government include electric and water systems, sewer system, EMS, public levee, storm water and Sunflower Hills Golf Course. The government-wide financial statements can be found as listed in the Table of Contents. Fund financial statements. A fund is a grouping of related accounts that is used to maintain control over resources that have been segregated for specific activities or objectives. The Unified Government, like other state and local governments, uses fund accounting to ensure and demonstrate compliance with finance-related legal requirements. All of the funds of the Unified Government can be divided into three categories: governmental funds, proprietary funds, and fiduciary funds. Governmental funds. Governmental funds are used to account for essentially the same functions reported as governmental activities in the government-wide financial statements. However, unlike the government-wide financial statements, governmental fund financial statements focus on near-term inflows of spendable resources, as well as on balances of spendable resources available at the end of the fiscal year. Such information may be useful in evaluating a government’s near-term financing requirements. Because the focus of governmental funds is narrower than that of the government-wide financial statements, it is useful to compare the information presented for governmental funds with similar information presented for governmental activities in the government-wide financial statements. By doing so, readers may better understand the long-term impact of the government’s near-term financing decisions. Both the governmental fund balance sheet and the governmental fund statement of revenues, expenditures, and changes in fund balances provide a reconciliation to facilitate this comparison between governmental funds and governmental activities.
5
The Unified Government maintains 27 individual governmental funds. Information is presented separately in the governmental fund balance sheet and in the governmental fund statement of revenues, expenditures, and changes in fund balances for the general and capital projects funds, which are considered to be major funds. Data from the other governmental funds are combined into a single, aggregated presentation. Individual fund data for each of these non-major governmental funds is provided in the form of combining statements in this report. The Unified Government adopts an annual appropriated budget for its general fund. A budgetary comparison statement has been provided for the general fund to demonstrate compliance with this budget. The basic governmental fund financial statements can be found as listed in the Table of Contents. Proprietary funds. The Unified Government maintains two different types of proprietary funds. Enterprise funds are used to report the same functions presented as business-type activities in the government-wide financial statements. Internal services funds are an accounting device used to accumulate and allocate costs internally among the Unified Government’s various functions. Because these services predominantly benefit governmental rather than business-type functions, they have been included within governmental activities in the government-wide financial statements. Proprietary funds provide the same type of information as the government-wide financial statements, only in more detail. The proprietary fund financial statements provide separate information for the sewer system and Board of Public Utilities, which are considered major funds of the Unified Government. Conversely, the internal service funds are combined into a single, aggregated presentation in the proprietary fund financial statements. Individual fund data for the internal service funds is provided in the form of combining statements in this report. The basic proprietary fund financial statements can be found as listed in the Table of Contents. Fiduciary funds. Fiduciary funds are used to account for resources held for the benefit of parties outside the government. Fiduciary funds are not reflected in the government-wide financial statements because the resources of those funds are not available to support the Unified Government’s own programs. The basic fiduciary fund financial statements can be found as listed in the Table of Contents. Notes to the financial statements. The notes provide additional information that is essential to a full understanding of the data provided in the government-wide and fund financial statements. The notes to the financial statements can be found as listed in the Table of Contents. Other information. In addition to the basic financial statements and accompanying notes, this report also presents certain required supplementary information (RSI) concerning the Unified Government’s progress in funding its obligation to provide pension and other post employment benefits to its employees. Required supplementary information can be found as listed in the Table of Contents. The combining statements referred to earlier in connection with non-major governmental funds and internal service funds are presented immediately following the required supplementary information on pensions. Combining and individual fund statements and schedules can be found as listed in the Table of Contents.

6
Government-wide Financial Analysis Net assets may serve over time as a useful indicator of a government’s financial position. The Unified Government’s assets exceeded liabilities by $667,242,842 at the close of the most recent fiscal year. By far, the largest portion of the Unified Government’s net assets (102%) reflects its investment in capital assets (e.g., land, buildings, machinery and equipment, and infrastructure) less any related debt used to acquire those assets that is still outstanding. The Unified Government uses these capital assets to provide services to citizens; consequently, these assets are not available for future spending. Although the Unified Government’s investment in its capital assets is reported net of related debt, it should be noted that the resources needed to repay this debt must be provided from other sources, since the capital assets themselves cannot be used to liquidate these liabilities.
2010 2009 2010 2009 2010 2009
Current and other assets 223,800,039$ 179,817,783$ 182,563,773$ 166,907,744$ 406,363,812$ 346,725,527$ Capital assets 553,410,375 540,973,287 810,159,598 814,037,100 1,363,569,973 1,355,010,387 Total assets 777,210,414 720,791,070 992,723,371 980,944,844 1,769,933,785 1,701,735,914
Long-term liabilities outstanding 430,581,203 325,299,095 431,070,843 447,181,874 861,652,046 772,480,969 Other liabilities 176,611,986 213,326,400 64,426,911 51,817,944 241,038,897 265,144,344 Total liabilities 607,193,189 538,625,495 495,497,754 498,999,818 1,102,690,943 1,037,625,313
Net assetsInvested in capital assets, net of 255,635,959 221,299,106 420,099,070 425,007,799 675,735,029 646,306,905 related debtRestricted 15,109,099 16,963,758 53,623,425 57,809,722 68,732,524 74,773,480 Unrestricted (100,727,833) (56,097,289) 23,503,122 (872,495) (77,224,711) (56,969,784)
Total net assets 170,017,225$ 182,165,575$ 497,225,617$ 481,945,026$ 667,242,842$ 664,110,601$
Unified Government of Wyandotte County/Kansas City, KansasStatement of Net Assets
December 31, 2010
Activities Activities TotalGovernmental Business-type
An additional portion of the Unified Government’s net assets ($68,732,524) represents resources that are subject to external restrictions on how they may be used. The remaining balance of unrestricted net assets is a deficit of ($77,224,711). Governmental Activities. Total revenues of governmental activities were $13,552,223 above prior-year revenue levels. Property tax and other tax revenue increased by $ 5,945,765. Current ad-valorem, and sales tax (which includes the UG’s portion of the Star Bond sales tax revenues) were revenue categories with increases of $15,364,240. Investment earnings decreased by $803,688 and miscellaneous revenues decreased by $556,291. The function with the most significant increase in expense is Planning and Development. The majority of the increase is due to capital outlay for the Wizards project of approximately $22 million. However $10,959,260 was generated from the sale of property for a Multi sport stadium and office project within the Village West Redevelopment area. General Government decreased by approximately $1.8 million.
7
Business-type activities. Total revenues of business-type activities were $30,125,975 more than the prior year. The increase was primarily due to higher revenues across the board in both electric and water due to increased usage. Operating expenses decreased $19,613,500. The decrease came primarily from the operations of the Board of Public Utilities and sewer operations. The BPU‘s total operating expenses for 2010 and 2009 were approximately $221.5 million and $236.1 million, respectively.
2010 2009 2010 2009 2010 2009Revenues:Program revenues: Charges for services $27,023,305 $22,949,818 $265,164,097 $235,257,442 $292,187,402 $258,207,260 Operating grants and contributions 38,671,684 32,915,557 0 0 38,671,684 32,915,557 Capital grants and contributions 2,096,587 2,959,794 867,050 209,965 2,963,637 3,169,759General revenues: Property taxes 86,298,207 95,137,607 0 0 86,298,207 95,137,607 Other taxes 91,900,577 77,115,382 3,738,538 3,584,996 95,639,115 80,700,378 Unrestricted investment earnings 3,580,620 4,384,308 467,604 619,140 4,048,224 5,003,448 Miscellaneous 6,678,702 7,234,993 680,696 1,120,467 7,359,398 8,355,460 Total revenues 256,249,682 242,697,459 270,917,985 240,792,010 527,167,667 483,489,469
Expenses: General government 27,087,733 28,883,020 0 0 27,087,733 28,883,020 Health and welfare 14,729,903 14,496,775 0 0 14,729,903 14,496,775 Public safety 128,169,717 135,838,855 0 0 128,169,717 135,838,855 Public works 49,439,819 58,231,382 0 0 49,439,819 58,231,382 Parks and recreation 6,476,736 9,409,508 0 0 6,476,736 9,409,508 Planning and development services 41,321,126 23,102,672 0 0 41,321,126 23,102,672 Interest on long-term debt 17,491,196 15,629,555 0 0 17,491,196 15,629,555 Electric and water systems 0 0 221,565,124 236,173,513 221,565,124 236,173,513 Public levee 0 0 1,413,301 1,504,174 1,413,301 1,504,174 Storm Water 0 0 1,480,508 661,304 1,480,508 661,304 EMS 0 0 7,367,253 6,944,949 7,367,253 6,944,949 Sewer system 0 0 17,772,564 23,788,544 17,772,564 23,788,544 Sunflower Hills golf course 0 0 679,706 819,472 679,706 819,472 Total expenses 284,716,230 285,591,767 250,278,456 269,891,956 534,994,686 555,483,723
Net assets before transfers (28,466,548) (42,894,308) 20,639,529 (29,099,946) (7,827,019) (71,994,254)Special Item 10,959,260 10,959,260Transfers 5,358,938 1,550,805 (5,358,938) (1,550,805) 0 0
Changes in net assets (12,148,350) (41,343,503) 15,280,591 (30,650,751) 3,132,241 (71,994,254)Net Assets - Beginning of year 182,165,575 228,019,907 481,945,026 512,595,777 664,110,601 740,615,684Prior period adjustment (4,510,829) 0 (4,510,829)
Net assets – End of year $170,017,225 $182,165,575 $497,225,617 $481,945,026 $667,242,842 $664,110,601
Total
Unified Government of Wyandotte County/Kansas City, KansasChanges in Net Assets
Year Ended December 31, 20010
Governmental Business-type Activities Activities

8
Financial Analysis of the Government’s Funds The Unified Government uses fund accounting to ensure and demonstrate compliance with finance-related legal requirements. Governmental funds. The focus of the Unified Government’s governmental funds is to provide information on near-term inflows, outflows, and balances of spendable resources. Such information is useful in assessing the Unified Government’s financing requirements. In particular, unrestricted fund balance may serve as a useful measure of a government’s net resources available for spending at the end of the fiscal year. As of the end of the current fiscal year, the Unified Government’s governmental funds reported combined ending fund balance of $53,145,981 an increase of $89,766,577 in comparison with the prior year. Among the undesignated fund balances of $34,111,400 is the capital projects fund balance of $5,264,667The fund balance includes $18,667,215 which is reserved for encumbrances, indicating that it is not available for new spending because it has already been committed to liquidate contracts and purchase orders of the prior period. Another $359,402 is reserved for an alcohol diversion program. The general fund is the chief operating fund of the Unified Government. At the end of the current fiscal year, unreserved fund balance of the general fund was $9,899,484 while total fund balance decreased to $11,649,360 a decrease of $4,479,218 from prior year. As a measure of the general fund’s liquidity, it may be useful to compare both unreserved fund balance and total fund balance to total fund expenditures. Unreserved fund balance represents 5.8 percent of total general fund expenditures, while total fund balance represents 6.8 percent of that same amount. Key factors related to the trends of the general fund are as follows. The combined general fund mill levy rate decreased from 51.153 mills in 2008 (budget year 2009) to 51.114 mills in 2009. This change represented a decrease of 0.1%. The mill rate increase was limited, although assessed valuation declined 11% from the prior year. This action was a policy decision by the governing body. General Fund current year property taxes declined $5.1 million; however the delinquent rate for current-year tax collections improved from 12% in 2009 to 10% in 2010. To compensate for this property tax revenue loss in 2010 and to limit the use of reserves, various cost control and revenue enhancement policies were implemented. The payment-in-lieu-of-tax rate or PILOT for the publically-owned Board of Public Utilities was increased 9.9% to 12.8%, generating $6 million in additional revenues. This increase was enacted with the expectation of a reduction back to 9.9% over a three year period. The passage of a 3/8th cent Kansas City, Kansas dedicated sales tax for public safety and neighborhood infrastructure also impacted revenue. This tax began July 1st of 2010 and four months of revenues ($1.8 million) were disbursed by the State in 2010. The dedicated sales tax was used in 2010 to offset General Fund expenses. One other fee increases in 2010 impacted general fund revenues. A mid-year trash fee increase of $2/month resulted in a $500,000 revenue increase in 2010. Cost-control measures in 2010 included: wage freezes, among all employee groups, 12-furlough days for non-public safety personnel and the second phase of an early retirement program with 76 employees retiring under this program in 2010. These various personnel measures reduced personnel spending in excess of $5 million in 2010. Further two stimulus grants allowed for the hiring of 25 firefighters and 12 police officers in 2010.
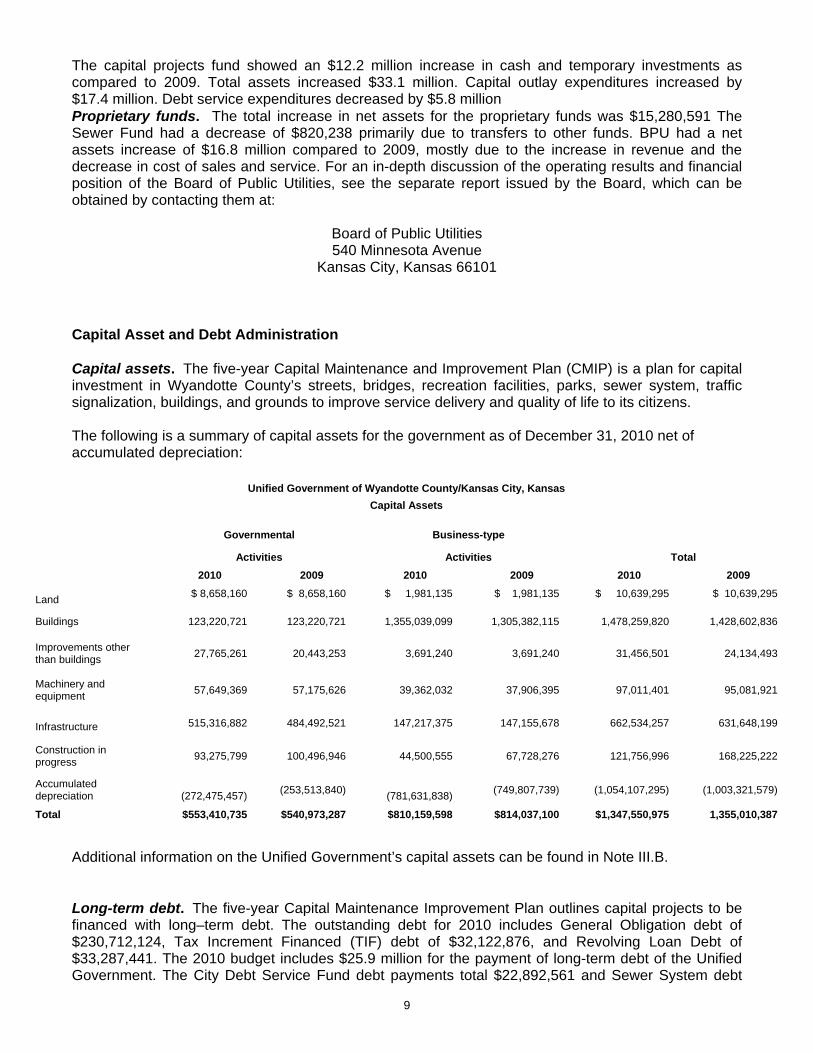
9
The capital projects fund showed an $12.2 million increase in cash and temporary investments as compared to 2009. Total assets increased $33.1 million. Capital outlay expenditures increased by $17.4 million. Debt service expenditures decreased by $5.8 million Proprietary funds. The total increase in net assets for the proprietary funds was $15,280,591 The Sewer Fund had a decrease of $820,238 primarily due to transfers to other funds. BPU had a net assets increase of $16.8 million compared to 2009, mostly due to the increase in revenue and the decrease in cost of sales and service. For an in-depth discussion of the operating results and financial position of the Board of Public Utilities, see the separate report issued by the Board, which can be obtained by contacting them at:
Board of Public Utilities 540 Minnesota Avenue
Kansas City, Kansas 66101
Capital Asset and Debt Administration Capital assets. The five-year Capital Maintenance and Improvement Plan (CMIP) is a plan for capital investment in Wyandotte County’s streets, bridges, recreation facilities, parks, sewer system, traffic signalization, buildings, and grounds to improve service delivery and quality of life to its citizens. The following is a summary of capital assets for the government as of December 31, 2010 net of accumulated depreciation:
Unified Government of Wyandotte County/Kansas City, Kansas Capital Assets
Governmental Business-type
Activities Activities Total 2010 2009 2010 2009 2010 2009
Land
$ 8,658,160 $ 8,658,160 $ 1,981,135 $ 1,981,135 $ 10,639,295 $ 10,639,295
Buildings
123,220,721
123,220,721 1,355,039,099 1,305,382,115
1,478,259,820 1,428,602,836
Improvements other than buildings
27,765,261 20,443,253
3,691,240 3,691,240 31,456,501 24,134,493
Machinery and equipment
57,649,369 57,175,626
39,362,032 37,906,395 97,011,401 95,081,921
Infrastructure
515,316,882 484,492,521 147,217,375 147,155,678 662,534,257 631,648,199
Construction in progress
93,275,799
100,496,946
44,500,555 67,728,276 121,756,996 168,225,222
Accumulated depreciation
(272,475,457) (253,513,840)
(781,631,838) (749,807,739) (1,054,107,295) (1,003,321,579)
Total $553,410,735 $540,973,287 $810,159,598 $814,037,100 $1,347,550,975 1,355,010,387
Additional information on the Unified Government’s capital assets can be found in Note III.B. Long-term debt. The five-year Capital Maintenance Improvement Plan outlines capital projects to be financed with long–term debt. The outstanding debt for 2010 includes General Obligation debt of $230,712,124, Tax Increment Financed (TIF) debt of $32,122,876, and Revolving Loan Debt of $33,287,441. The 2010 budget includes $25.9 million for the payment of long-term debt of the Unified Government. The City Debt Service Fund debt payments total $22,892,561 and Sewer System debt

10
payments total $1,609,983. The monies for the debt budget are funded primarily from the individual City and County Debt Service Funds. Other sources include user fee and lease income from the Sewer System Debt Fund.
Unified Government of Wyandotte County/Kansas City, Kansas Outstanding Debt
Governmental Business-type Activities Activities Total 2010 2009 2010 2009 2010 2009 General obligation bonds $190,977,490 $126,653,486 $39,734,634 $22,384,448 $230,712,124 $149,037,934
Tax Increment Financed GO Bonds 32,122,876 12,027,066 0 0 32,122,876 12,027,066
Board of Public Utility revenue bonds 0 0 355,430,000 363,881,515 355,430,000 363,881,515 Revolving loans 0 0 33,287,441 35,364,455 33,287,441 35,364,455 Accreted interest on bonds 3,207,867 1,684,792 0 5,412,231 3,207,867 7,097,023
Certificates of participation 0 8,100,000 0 0 0 8,100,000
Capital lease 14,859,322 14,920,099 2,160,098 1,792,490 17,019,420 16,647,589
Section 108 loan 3,314,000 3,584,000 0 0 3,314,000 3,584,000
Sales tax obligation bonds* 85,317,108 54,352,319 0 0 85,317,108 54,352,319
Transportation district bonds 20,009,000 20,580,000 0 0 20,009,000 20,580,000
Total $349,807,663 $241,901,762 $430,612,173 $428,770,139 $780,419,836 $670,671,901
*See note III.F. Kansas State Statutes limit the amount of general obligation bonds a governmental entity may issue to 30 percent of the equalized assessed valuation. The limitation for debt, as of 12/31/10, for the Unified Government is $364,789,315 and the legal debt margin is $171,773,121. As of 12/31/10 the Unified Government had a rating of Aa3 from Moody’s Investor Service and AA from Standard and Poor’s on all debt assumed from both the former City of Kansas City, Kansas and Wyandotte County. During 2010, both Moody’s and Standard and Poor’s reaffirmed their favorable rating of the Unified Government debt with stable outlooks. In February of 2011, Moody’s maintained the Aa3 rating, but revised the outlook to negative. Standard and Poor’s has maintained the AA, stable rating for the Unified Government in February of 2011. Additional information on the Unified Government’s long-term debt can be found in note III.F.

11
General Fund Budgetary Highlights The General Fund is the largest fund of the Unified Government, and it accounted for 79% percent of all taxes collected, and 70% of all property tax revenues received. The General Fund’s major revenue sources in 2010 were property taxes (30%), sales taxes (18%) and franchise taxes (21%). Actual revenue collections for the general fund totaled $166.2 million, compared to the 2010 budgeted figure of $166.9 million. The General Fund’s original budgeted expenses were $170,204,727. The final amended budget was $170,394,522, virtually unchanged from the original budget. Actual expenditures of $168,739,290 were 99.0 percent of budget. Significant variances between the amended budget and actual expenses were due to unexpended reserves, increased costs to transport prisoners and inmate medical costs, retirement incentive expense, vacancy savings and delays in completing capital projects.
Original Amended Increase/ Expenditures Budget Budget (Decrease) Actual Difference General government $22,506,719 $ 22,567,196 $ 60,477 $20,433,857 $( 2,133,339)Public works 24,431,346 23,879,732 (551,614) 21,702,241 (2,177,491)Public safety 95,135,446 96,408,416 1,272,970 101,340,794 4,932,378 Judicial 8,715,515 8,696,698 (18,817) 7,869,952 (826,746)Planning and development 13,500,935 13,261,780 (239,155) 11,523,062 (1,738,718)Parks and recreation 6,456,921 6,383,808 (73,113) 5,869,384 (514,424)Other (542,155) (803,108) (260,953) 0 803,108 Total Expenditures $170,204,727 $170,394,522 $ 189,795 $ 168,739,290 $ (1,655,232) Additional Information Additional Operating Data regarding the Unified Government may be found in the Official Statement date 1//20/2011 printed in connection with the Unified Government’s General Obligation Bonds, Series 2011-A. The official statement can be found on the Municipal Securities Rulemaking Board’s EMMA website, www.emma.msrb.org and the Unified Government will provide a copy of such official statement to any person upon request. Requests for Information This financial report is designed to provide a general overview of the Unified Government’s finances for those with interest in the government’s finances. Questions concerning any of the information provided in this report or requests for additional financial information should be addressed to the Chief Financial Officer, Unified Government of Wyandotte County/Kansas City, Kansas, 701 North 7th. Street, Kansas City, Kansas 66101.

12
This page left intentionally blank

UNIFIED GOVERNMENT OF WYANDOTTE COUNTY/KANSAS CITY, KANSAS
STATEMENT OF NET ASSETS
December 31, 2010
Governmental Business-typeActivities Activities Totals
ASSETSCash and temporary investments 72,511,438$ 8,906,307$ 81,417,745$ Restricted cash and investments 50,563,218 26,392,547 76,955,765 Investments - 17,553,784 17,553,784 Receivables (net of uncollectible amounts)
Taxes 85,287,479 626,561 85,914,040 Accounts 4,103,318 35,855,908 39,959,226 Notes 10,975,621 - 10,975,621 Interest 1,205,915 - 1,205,915 Due from other governments 481,506 108,565 590,071 Special assessments 894,245 213,155 1,107,400
Internal balances (6,956,371) 6,956,371 - Inventories - 32,335,848 32,335,848 Prepayments and other current assets - 1,191,398 1,191,398 Other assets 4,502,889 10,887,317 15,390,206 Restricted cash and investments - 41,536,012 41,536,012 Investment in joint venture 230,421 - 230,421 Capital assets:
Land and construction in progress 101,933,959 46,481,690 148,415,649 Other capital assets, net of depreciation 451,476,776 763,677,908 1,215,154,684
Total Assets 777,210,414 992,723,371 1,769,933,785
LIABILITIESAccounts and contracts payable 7,085,533 17,839,159 24,924,692 Accrued wages and expense 4,088,218 7,321,371 11,409,589 Accrued interest payable 5,541,679 7,075,613 12,617,292 Due to others 2,401,777 3,536,345 5,938,122 Due to other governments 21,899 - 21,899 Claims incurred but not reported 6,310,000 - 6,310,000 Temporary notes payable 52,195,500 - 52,195,500 Regulatory and other liabilities - 1,986,811 1,986,811 Unearned revenue 76,210,429 31,434 76,241,863 Net pension obligation - 5,881,819 5,881,819 Long-term liabilities:
Due within one year 22,756,951 20,754,359 43,511,310 Due in more than one year 430,581,203 431,070,843 861,652,046
Total Liabilities 607,193,189 495,497,754 1,102,690,943
NET ASSETSInvested in capital assets, net of related debt 255,635,959 420,099,070 675,735,029 Restricted for:
Debt service 7,767,027 50,980,822 58,747,849 Revenue bond reserves - 2,642,603 2,642,603 Capital projects 672,709 - 672,709 Federal/State assistance 1,957,720 - 1,957,720 Community services 4,711,643 - 4,711,643
Unrestricted (deficit) (100,727,833) 23,503,122 (77,224,711) Total net assets 170,017,225$ 497,225,617$ 667,242,842$
The notes to the financial statements are an integral part of this statement.
13

UN
IFIE
D G
OVE
RN
MEN
T O
F W
YAN
DO
TTE
CO
UN
TY/K
ANSA
S C
ITY,
KAN
SAS
STA
TEM
ENT
OF
AC
TIVI
TIES
For t
he Y
ear E
nded
Dec
embe
r 31,
201
0
Net
(Exp
ense
) Rev
enue
and
Cha
nges
in N
et A
sset
s
Expe
nses
Cha
rges
for
Serv
ices
Ope
ratin
g G
rant
s an
d C
ontr
ibut
ions
Cap
ital G
rant
s an
d C
ontr
ibut
ions
Gov
ernm
enta
l A
ctiv
ities
Bus
ines
s-ty
pe
Act
iviti
esTo
tal
Func
tions
/Pro
gram
sPr
imar
y go
vern
men
t:G
over
nmen
tal A
ctiv
ities
:G
ener
al g
over
nmen
t27
,087
,733
$
4,
623,
345
$
886,
779
$
-$
(2
1,57
7,60
9)$
(21,
577,
609)
$
H
ealth
and
wel
fare
14,7
29,9
03
162,
850
8,
087,
027
-
(6,4
80,0
26)
(6,4
80,0
26)
Pub
lic s
afet
y12
8,16
9,71
7
9,84
0,75
7
6,
135,
125
-
(112
,193
,835
)
(112
,193
,835
)
Pub
lic w
orks
49,4
39,8
19
8,02
8,25
0
7,
696,
076
1,
446,
928
(3
2,26
8,56
5)
(32,
268,
565)
P
arks
and
recr
eatio
n6,
476,
736
1,16
6,75
6
2,
700,
000
-
(2,6
09,9
80)
(2,6
09,9
80)
Pla
nnin
g an
d de
velo
pmen
t41
,321
,126
3,
201,
347
12,8
26,3
05
64
9,65
9
(2
4,64
3,81
5)
(24,
643,
815)
In
tere
st o
n lo
ng-te
rm d
ebt
17,4
91,1
96
-
340,
372
-
(1
7,15
0,82
4)
(17,
150,
824)
To
tal g
over
nmen
tal a
ctiv
ities
284,
716,
230
27
,023
,305
38
,671
,684
2,09
6,58
7
(216
,924
,654
)
(216
,924
,654
)
Bus
ines
s-ty
pe a
ctiv
ities
:E
lect
ric a
nd W
ater
sys
tem
s22
1,56
5,12
4
237,
159,
626
-
30
0,88
8
15
,895
,390
15,8
95,3
90
S
ewer
Sys
tem
17,7
72,5
64
19,8
55,9
39
-
566,
162
2,
649,
537
2,64
9,53
7
E
MS
7,36
7,25
3
4,
414,
666
-
-
(2,9
52,5
87)
(2,9
52,5
87)
Pub
licLe
vee
141
330
185
089
6(5
6240
5)(5
6240
5)
Prog
ram
Rev
enue
sPr
imar
y G
over
nmen
t
14
Pub
lic L
evee
1,41
3,30
1
850,
896
-
-
(562
,405
)
(5
62,4
05)
Sto
rmw
ater
1,48
0,50
8
2,
213,
075
-
-
73
2,56
7
732,
567
S
unflo
wer
Hill
s G
olf C
ours
e67
9,70
6
669,
895
-
-
(9,8
11)
(9,8
11)
Tota
l bus
ines
s-ty
pe a
ctiv
ities
250,
278,
456
26
5,16
4,09
7
-
867,
050
-
15,7
52,6
91
15
,752
,691
Tota
l prim
ary
gove
rnm
ent
534,
994,
686
$
29
2,18
7,40
2$
38,6
71,6
84$
2,
963,
637
$
(2
16,9
24,6
54)
$
15
,752
,691
$
(201
,171
,963
)$
Gen
eral
reve
nues
:Ta
xes: Pro
perty
taxe
s, g
ener
al p
urpo
se86
,298
,207
-
86,2
98,2
07
S
ales
taxe
s52
,252
,785
3,73
8,53
8
55
,991
,323
Fran
chis
e ta
xes
35,8
54,1
99
-
35
,854
,199
Oth
er ta
xes
3,11
4,72
4
-
3,
114,
724
Tran
sien
t gue
st ta
x67
8,86
9
-
678,
869
U
nres
trict
ed in
vest
men
t ear
ning
s3,
580,
620
467,
604
4,
048,
224
Mis
cella
neou
s6,
678,
702
680,
696
7,
359,
398
Spe
cial
item
10,9
59,2
60
-
10
,959
,260
Tran
sfer
s5,
358,
938
(5,3
58,9
38)
-
Tota
l gen
eral
reve
nues
and
tran
sfer
s20
4,77
6,30
4
(472
,100
)
204,
304,
204
C
hang
e in
net
ass
ets
(12,
148,
350)
15
,280
,591
3,13
2,24
1
N
et a
sset
s - b
egin
ning
182,
165,
575
48
1,94
5,02
6
664,
110,
601
N
et a
sset
s - e
ndin
g17
0,01
7,22
5$
497,
225,
617
$
66
7,24
2,84
2$
The
note
s to
the
finan
cial
sta
tem
ents
are
an
inte
gral
par
t of t
his
stat
emen
t.
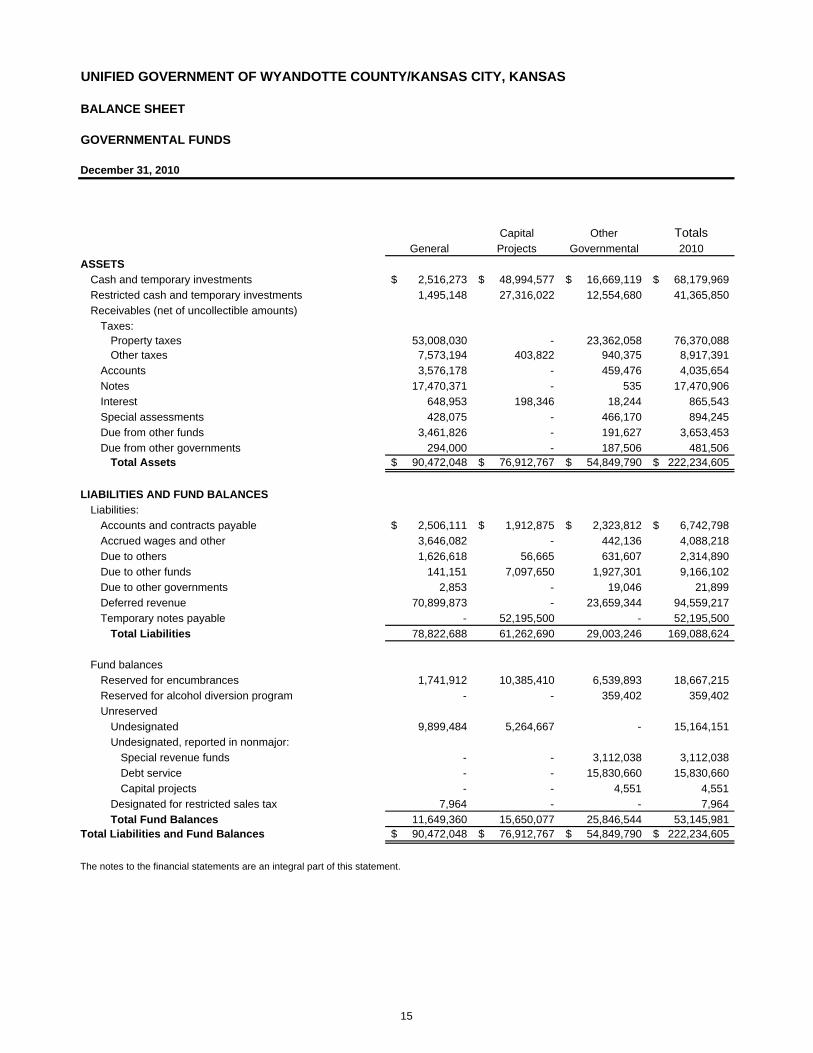
UNIFIED GOVERNMENT OF WYANDOTTE COUNTY/KANSAS CITY, KANSAS
BALANCE SHEET
GOVERNMENTAL FUNDS
December 31, 2010
Capital Other TotalsGeneral Projects Governmental 2010
ASSETSCash and temporary investments 2,516,273$ 48,994,577$ 16,669,119$ 68,179,969$ Restricted cash and temporary investments 1,495,148 27,316,022 12,554,680 41,365,850 Receivables (net of uncollectible amounts)
Taxes:Property taxes 53,008,030 - 23,362,058 76,370,088 Other taxes 7,573,194 403,822 940,375 8,917,391
Accounts 3,576,178 - 459,476 4,035,654 Notes 17,470,371 - 535 17,470,906 Interest 648,953 198,346 18,244 865,543 Special assessments 428,075 - 466,170 894,245 Due from other funds 3,461,826 - 191,627 3,653,453 Due from other governments 294,000 - 187,506 481,506
Total Assets 90,472,048$ 76,912,767$ 54,849,790$ 222,234,605$
LIABILITIES AND FUND BALANCESLiabilities:
Accounts and contracts payable 2,506,111$ 1,912,875$ 2,323,812$ 6,742,798$ Accrued wages and other 3,646,082 - 442,136 4,088,218 Due to others 1,626,618 56,665 631,607 2,314,890 Due to other funds 141,151 7,097,650 1,927,301 9,166,102 Due to other governments 2,853 - 19,046 21,899 Deferred revenue 70,899,873 - 23,659,344 94,559,217 Temporary notes payable - 52,195,500 - 52,195,500
Total Liabilities 78,822,688 61,262,690 29,003,246 169,088,624
Fund balancesReserved for encumbrances 1,741,912 10,385,410 6,539,893 18,667,215 Reserved for alcohol diversion program - - 359,402 359,402 Unreserved
Undesignated 9,899,484 5,264,667 - 15,164,151 Undesignated, reported in nonmajor:
Special revenue funds - - 3,112,038 3,112,038 Debt service - - 15,830,660 15,830,660 Capital projects - - 4,551 4,551
Designated for restricted sales tax 7,964 - - 7,964 Total Fund Balances 11,649,360 15,650,077 25,846,544 53,145,981
Total Liabilities and Fund Balances 90,472,048$ 76,912,767$ 54,849,790$ 222,234,605$
The notes to the financial statements are an integral part of this statement.
15
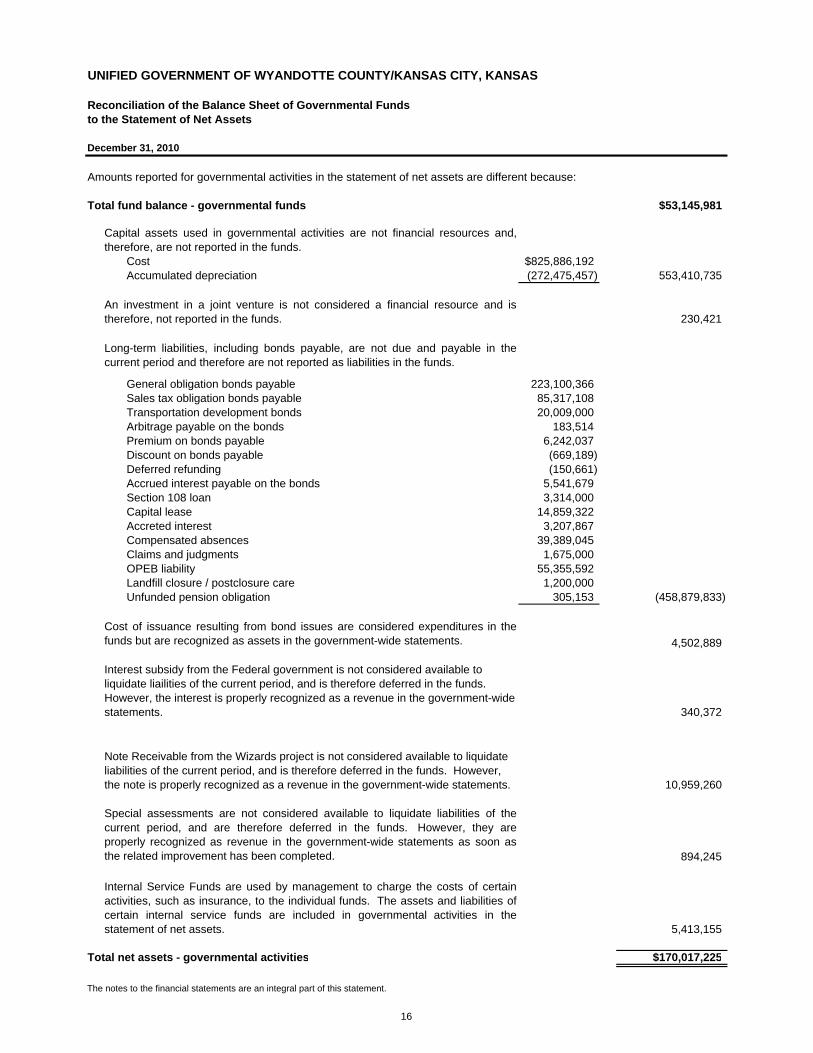
UNIFIED GOVERNMENT OF WYANDOTTE COUNTY/KANSAS CITY, KANSAS
Reconciliation of the Balance Sheet of Governmental Fundsto the Statement of Net Assets
December 31, 2010
Amounts reported for governmental activities in the statement of net assets are different because:
Total fund balance - governmental funds $53,145,981
Cost $825,886,192Accumulated depreciation (272,475,457) 553,410,735
230,421
General obligation bonds payable 223,100,366Sales tax obligation bonds payable 85,317,108Transportation development bonds 20,009,000Arbitrage payable on the bonds 183,514Premium on bonds payable 6,242,037Discount on bonds payable (669,189)Deferred refunding (150,661)Accrued interest payable on the bonds 5,541,679Section 108 loan 3,314,000Capital lease 14,859,322Accreted interest 3,207,867Compensated absences 39,389,045Claims and judgments 1,675,000OPEB liability 55,355,592Landfill closure / postclosure care 1,200,000Unfunded pension obligation 305,153 (458,879,833)
4,502,889
340,372
10,959,260
894,245
5,413,155
Total net assets - governmental activities $170,017,225
The notes to the financial statements are an integral part of this statement.
Special assessments are not considered available to liquidate liabilities of thecurrent period, and are therefore deferred in the funds. However, they areproperly recognized as revenue in the government-wide statements as soon asthe related improvement has been completed.
Internal Service Funds are used by management to charge the costs of certainactivities, such as insurance, to the individual funds. The assets and liabilities ofcertain internal service funds are included in governmental activities in thestatement of net assets.
Capital assets used in governmental activities are not financial resources and,therefore, are not reported in the funds.
An investment in a joint venture is not considered a financial resource and istherefore, not reported in the funds.
Long-term liabilities, including bonds payable, are not due and payable in thecurrent period and therefore are not reported as liabilities in the funds.
Cost of issuance resulting from bond issues are considered expenditures in thefunds but are recognized as assets in the government-wide statements.
Interest subsidy from the Federal government is not considered available to liquidate liailities of the current period, and is therefore deferred in the funds. However, the interest is properly recognized as a revenue in the government-wide statements.
Note Receivable from the Wizards project is not considered available to liquidate liabilities of the current period, and is therefore deferred in the funds. However, the note is properly recognized as a revenue in the government-wide statements.
16

UNIFIED GOVERNMENT OF WYANDOTTE COUNTY/KANSAS CITY, KANSAS
STATEMENT OF REVENUES, EXPENDITURES ANDCHANGES IN FUND BALANCES
GOVERNMENTAL FUNDSFor the Year Ended December 31, 2010
Capital Other TotalsGeneral Projects Governmental 2010
REVENUESTaxes 127,637,863$ 3,387,465$ 48,624,964$ 179,650,292$ Intergovernmental 6,265,956 5,377 28,881,382 35,152,715 Licenses, permits and fees 2,281,850 - 79,655 2,361,505 Charges for services 13,431,857 - 1,642,468 15,074,325 Fines, forfeitures and penalties 6,059,891 - 1,404,993 7,464,884 Interest income 1,982,247 419,232 295,882 2,697,361 Miscellaneous 4,671,875 2,118,912 2,598,957 9,389,744 TOTAL REVENUES 162,331,539 5,930,986 83,528,301 251,790,826
EXPENDITURESCurrent:
General government 19,944,795 - 3,612,378 23,557,173 Public works 19,950,801 6,253,584 8,060,569 34,264,954 Public safety 100,502,749 - 4,078,524 104,581,273 Judicial 7,789,421 - 2,951,364 10,740,785 Health and welfare 1,434,431 - 12,670,231 14,104,662 Planning and development 10,585,665 - 7,881,761 18,467,426 Parks and recreation 5,868,895 - 191,300 6,060,195
Capital outlays 2,909,129 52,708,630 5,640,910 61,258,669 Debt service
Principal 1,087,535 6,999,894 28,546,610 36,634,039 Interest 289,688 1,355,641 10,639,224 12,284,553 Other - 324,313 656,056 980,369
TOTAL EXPENDITURES 170,363,109 67,642,062 84,928,927 322,934,098
OTHER FINANCING SOURCES (USES)Transfers in 3,272,874 11,455,285 9,704,373 24,432,532 Transfers out (1,051,152) (8,597,462) (1,644,195) (11,292,809) Issuance of bonds - 140,635,339 - 140,635,339 Issuance of refunding bonds - 24,325 8,150,675 8,175,000 Premium from issuance of bonds - 4,216,368 - 4,216,368 Discount from issuance of bonds - (177,896) - (177,896) Proceeds from sale of capital assets 714,789 - - 714,789 Issuance of capital lease 578,956 1,732,570 - 2,311,526 Payments on refunded bonds - - (8,105,000) (8,105,000) TOTAL OTHER FINANCING SOURCES (USES) 3,515,467 149,288,529 8,105,853 160,909,849
NET CHANGE IN FUND BALANCE (4,516,103) 87,577,453 6,705,227 89,766,577
FUND BALANCES (DEFICITS)Beginning of year 16,165,463 (71,927,376) 19,141,317 (36,620,596) End of year 11,649,360$ 15,650,077$ 25,846,544$ 53,145,981$
The notes to the financial statements are an integral part of this statement.
17
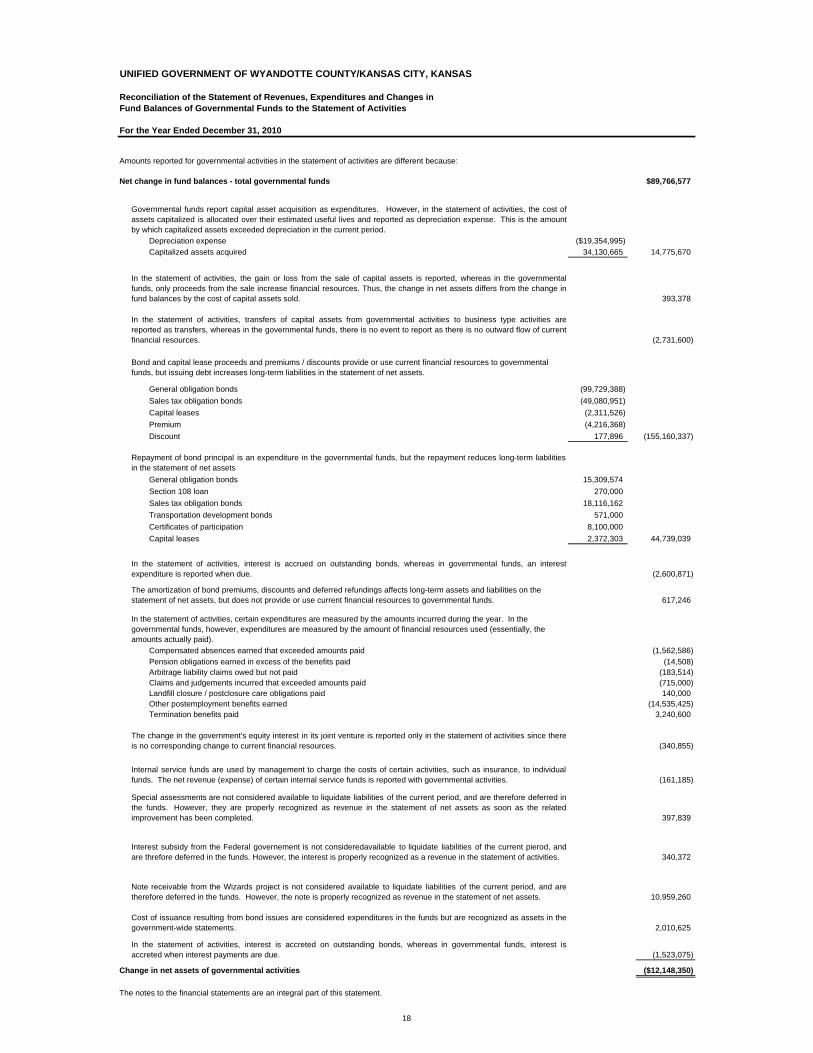
UNIFIED GOVERNMENT OF WYANDOTTE COUNTY/KANSAS CITY, KANSAS
Reconciliation of the Statement of Revenues, Expenditures and Changes in Fund Balances of Governmental Funds to the Statement of Activities
For the Year Ended December 31, 2010
Amounts reported for governmental activities in the statement of activities are different because:
Net change in fund balances - total governmental funds $89,766,577
Depreciation expense ($19,354,995)Capitalized assets acquired 34,130,665 14,775,670
393,378
(2,731,600)
General obligation bonds (99,729,388)Sales tax obligation bonds (49,080,951)Capital leases (2,311,526)Premium (4,216,368)Discount 177,896 (155,160,337)
General obligation bonds 15,309,574Section 108 loan 270,000Sales tax obligation bonds 18,116,162Transportation development bonds 571,000Certificates of participation 8,100,000Capital leases 2,372,303 44,739,039
(2,600,871)
617,246
Compensated absences earned that exceeded amounts paid (1,562,586)Pension obligations earned in excess of the benefits paid (14,508)Arbitrage liability claims owed but not paid (183,514)Claims and judgements incurred that exceeded amounts paid (715,000)Landfill closure / postclosure care obligations paid 140,000Other postemployment benefits earned (14,535,425)Termination benefits paid 3,240,600
(340,855)
(161,185)
397,839
340,372
10,959,260
2,010,625
(1,523,075)
Change in net assets of governmental activities ($12,148,350)
The notes to the financial statements are an integral part of this statement.
In the statement of activities, interest is accrued on outstanding bonds, whereas in governmental funds, an interestexpenditure is reported when due.
Governmental funds report capital asset acquisition as expenditures. However, in the statement of activities, the cost ofassets capitalized is allocated over their estimated useful lives and reported as depreciation expense. This is the amountby which capitalized assets exceeded depreciation in the current period.
In the statement of activities, the gain or loss from the sale of capital assets is reported, whereas in the governmentalfunds, only proceeds from the sale increase financial resources. Thus, the change in net assets differs from the change infund balances by the cost of capital assets sold.
In the statement of activities, transfers of capital assets from governmental activities to business type activities arereported as transfers, whereas in the governmental funds, there is no event to report as there is no outward flow of currentfinancial resources.
Bond and capital lease proceeds and premiums / discounts provide or use current financial resources to governmental funds, but issuing debt increases long-term liabilities in the statement of net assets.
Repayment of bond principal is an expenditure in the governmental funds, but the repayment reduces long-term liabilitiesin the statement of net assets
Note receivable from the Wizards project is not considered available to liquidate liabilities of the current period, and aretherefore deferred in the funds. However, the note is properly recognized as revenue in the statement of net assets.
Cost of issuance resulting from bond issues are considered expenditures in the funds but are recognized as assets in thegovernment-wide statements.
In the statement of activities, interest is accreted on outstanding bonds, whereas in governmental funds, interest isaccreted when interest payments are due.
The amortization of bond premiums, discounts and deferred refundings affects long-term assets and liabilities on the statement of net assets, but does not provide or use current financial resources to governmental funds.
In the statement of activities, certain expenditures are measured by the amounts incurred during the year. In the governmental funds, however, expenditures are measured by the amount of financial resources used (essentially, the amounts actually paid).
The change in the government's equity interest in its joint venture is reported only in the statement of activities since thereis no corresponding change to current financial resources.
Internal service funds are used by management to charge the costs of certain activities, such as insurance, to individualfunds. The net revenue (expense) of certain internal service funds is reported with governmental activities.
Special assessments are not considered available to liquidate liabilities of the current period, and are therefore deferred inthe funds. However, they are properly recognized as revenue in the statement of net assets as soon as the relatedimprovement has been completed.
Interest subsidy from the Federal governement is not consideredavailable to liquidate liabilities of the current pierod, andare threfore deferred in the funds. However, the interest is properly recognized as a revenue in the statement of activities.
18

UNIFIED GOVERNMENT OF WYANDOTTE COUNTY/KANSAS CITY, KANSAS
STATEMENT OF REVENUES, EXPENDITURES AND CHANGES IN FUND BALANCESBUDGET AND ACTUAL - BUDGETARY BASIS (NON-GAAP)
GENERAL FUNDFor the Year Ended December 31, 2010
Variance withFinal Budget -
Final Actual PositiveOriginal Amended Amounts (Negative)
REVENUES Taxes 133,032,780$ 126,686,860$ 127,157,931$ 471,071$ Intergovernmental revenue 5,994,400 7,123,810 6,265,956 (857,854) Charges for services 12,989,700 13,742,600 13,330,018 (412,582) Fines, forfeitures and penalties 6,024,000 6,032,100 6,059,891 27,791 Interest income 2,601,500 1,883,700 2,200,322 316,622 Licenses, permits and fees 2,240,000 2,151,400 2,281,850 130,450 Miscellaneous revenue 2,607,297 5,560,838 4,742,042 (818,796)
TOTAL REVENUES 165,489,677 163,181,308 162,038,010 (1,143,298)
EXPENDITURES AND ENCUMBRANCES General government 22,506,720 22,567,196 20,433,857 2,133,339 Public works 24,431,346 23,879,732 21,702,241 2,177,491 Public safety 95,135,446 96,408,416 101,340,794 (4,932,378) Judicial 8,715,515 8,696,698 7,869,952 826,746 Planning and development 13,500,935 13,261,780 11,523,062 1,738,718 Parks and recreation 6,456,921 6,383,808 5,869,384 514,424 Other (542,155) (803,108) - (803,108)
TOTAL EXPENDITURES AND ENCUMBRANCES 170,204,728 170,394,522 168,739,290 1,655,232
OTHER FINANCING SOURCES (USES)Transfers In 2,856,000 3,272,874 3,408,302 135,428 Transfers out - - (52,181) (52,181) Proceeds from sale of assets 1,000,000 418,404 714,789 296,385 TOTAL OTHER FINANCING SOURCES (USES) 3,856,000 3,691,278 4,070,910 379,632
NET CHANGE IN FUND BALANCE (859,051) (3,521,936) (2,630,370) 891,566
UNENCUMBERED FUND BALANCE Beginnning of year 4,514,806 4,514,806 4,514,806 -
End of year 3,655,755$ 992,870$ 1,884,436$ 891,566$
The notes to the financial statements are an integral part of this statement.
Budgeted Amounts
19
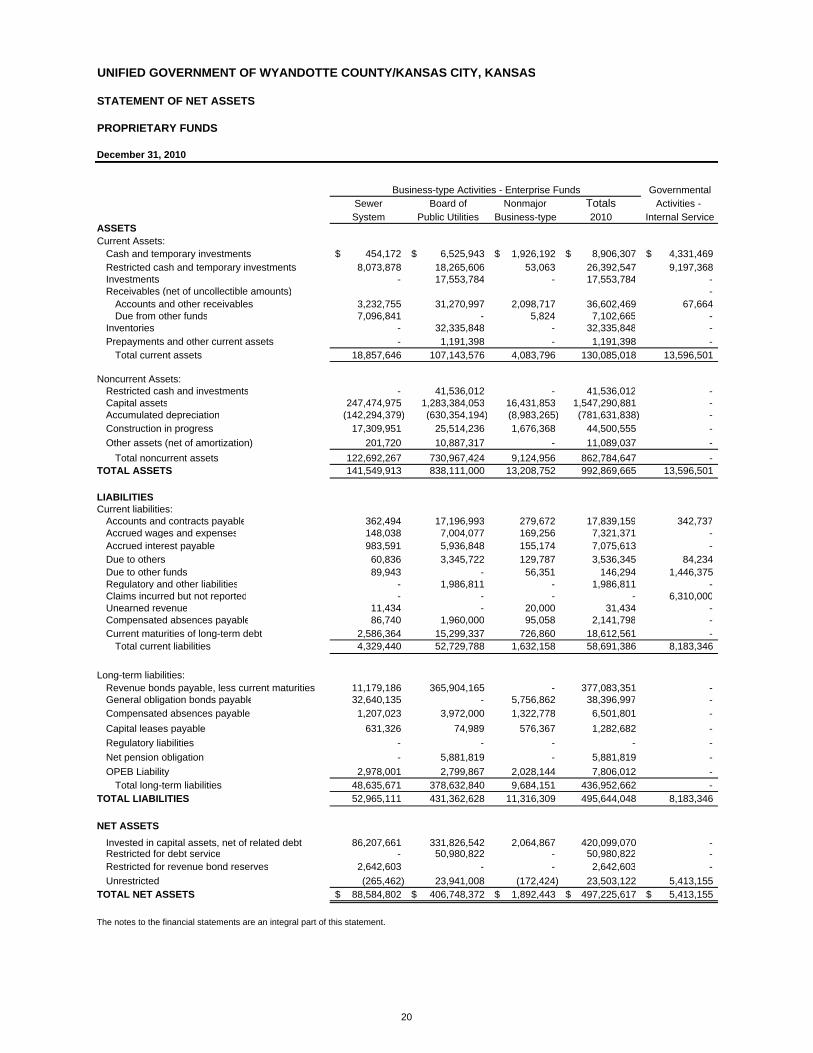
UNIFIED GOVERNMENT OF WYANDOTTE COUNTY/KANSAS CITY, KANSAS
STATEMENT OF NET ASSETS
PROPRIETARY FUNDS
December 31, 2010
Business-type Activities - Enterprise Funds GovernmentalSewer Board of Nonmajor Totals Activities - System Public Utilities Business-type 2010 Internal Service
ASSETSCurrent Assets:
Cash and temporary investments 454,172$ 6,525,943$ 1,926,192$ 8,906,307$ 4,331,469$ Restricted cash and temporary investments 8,073,878 18,265,606 53,063 26,392,547 9,197,368 Investments - 17,553,784 - 17,553,784 - Receivables (net of uncollectible amounts) -
Accounts and other receivables 3,232,755 31,270,997 2,098,717 36,602,469 67,664 Due from other funds 7,096,841 - 5,824 7,102,665 -
Inventories - 32,335,848 - 32,335,848 - Prepayments and other current assets - 1,191,398 - 1,191,398 -
Total current assets 18,857,646 107,143,576 4,083,796 130,085,018 13,596,501
Noncurrent Assets:Restricted cash and investments - 41,536,012 - 41,536,012 - Capital assets 247,474,975 1,283,384,053 16,431,853 1,547,290,881 - Accumulated depreciation (142,294,379) (630,354,194) (8,983,265) (781,631,838) - Construction in progress 17,309,951 25,514,236 1,676,368 44,500,555 - Other assets (net of amortization) 201,720 10,887,317 - 11,089,037 -
Total noncurrent assets 122,692,267 730,967,424 9,124,956 862,784,647 - TOTAL ASSETS 141,549,913 838,111,000 13,208,752 992,869,665 13,596,501
LIABILITIESCurrent liabilities:
Accounts and contracts payable 362,494 17,196,993 279,672 17,839,159 342,737 Accrued wages and expenses 148,038 7,004,077 169,256 7,321,371 - Accrued interest payable 983,591 5,936,848 155,174 7,075,613 - Due to others 60,836 3,345,722 129,787 3,536,345 84,234 Due to other funds 89,943 - 56,351 146,294 1,446,375 Regulatory and other liabilities - 1,986,811 - 1,986,811 - Claims incurred but not reported - - - - 6,310,000 Unearned revenue 11,434 - 20,000 31,434 - Compensated absences payable 86,740 1,960,000 95,058 2,141,798 - Current maturities of long-term debt 2,586,364 15,299,337 726,860 18,612,561 -
Total current liabilities 4,329,440 52,729,788 1,632,158 58,691,386 8,183,346
Long-term liabilities:Revenue bonds payable, less current maturities 11,179,186 365,904,165 - 377,083,351 - General obligation bonds payable 32,640,135 - 5,756,862 38,396,997 - Compensated absences payable 1,207,023 3,972,000 1,322,778 6,501,801 - Capital leases payable 631,326 74,989 576,367 1,282,682 - Regulatory liabilities - - - - - Net pension obligation - 5,881,819 - 5,881,819 - OPEB Liability 2,978,001 2,799,867 2,028,144 7,806,012 -
Total long-term liabilities 48,635,671 378,632,840 9,684,151 436,952,662 - TOTAL LIABILITIES 52,965,111 431,362,628 11,316,309 495,644,048 8,183,346
NET ASSETSInvested in capital assets, net of related debt 86,207,661 331,826,542 2,064,867 420,099,070 - Restricted for debt service - 50,980,822 - 50,980,822 - Restricted for revenue bond reserves 2,642,603 - - 2,642,603 - Unrestricted (265,462) 23,941,008 (172,424) 23,503,122 5,413,155
TOTAL NET ASSETS 88,584,802$ 406,748,372$ 1,892,443$ 497,225,617$ 5,413,155$
The notes to the financial statements are an integral part of this statement.
20
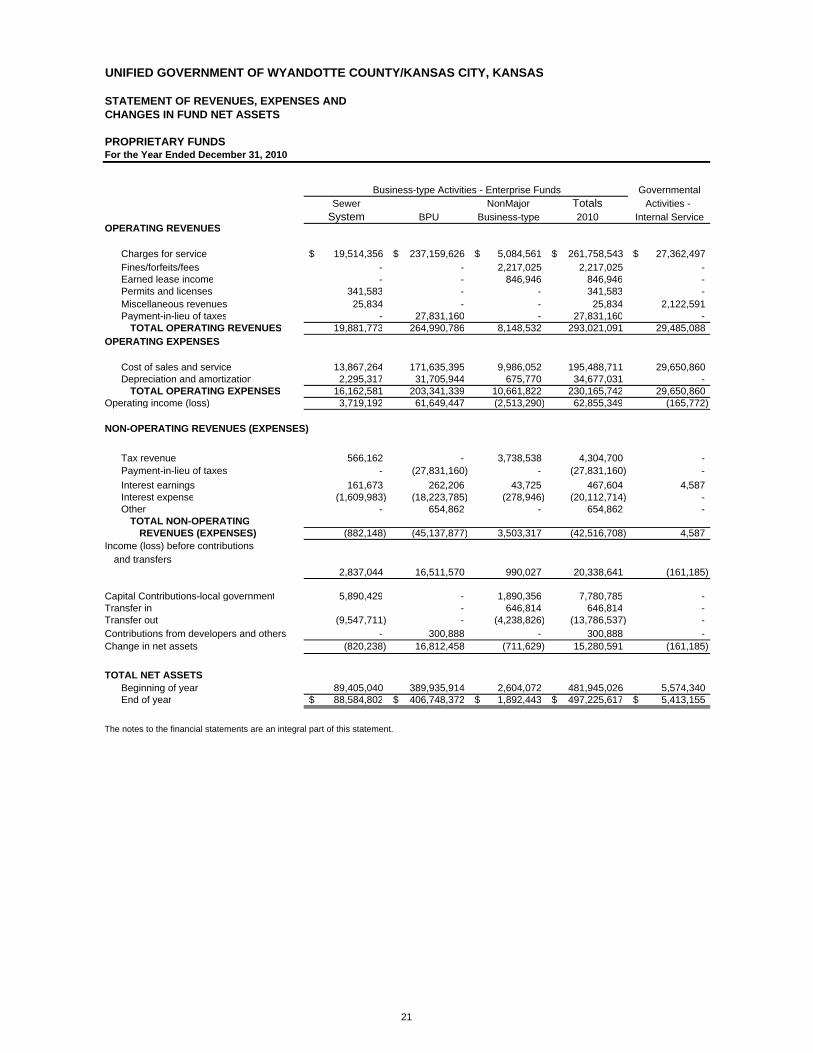
UNIFIED GOVERNMENT OF WYANDOTTE COUNTY/KANSAS CITY, KANSAS
STATEMENT OF REVENUES, EXPENSES AND CHANGES IN FUND NET ASSETS
PROPRIETARY FUNDSFor the Year Ended December 31, 2010
Business-type Activities - Enterprise Funds GovernmentalSewer NonMajor Totals Activities -
System BPU Business-type 2010 Internal ServiceOPERATING REVENUES
Charges for service 19,514,356$ 237,159,626$ 5,084,561$ 261,758,543$ 27,362,497$ Fines/forfeits/fees - - 2,217,025 2,217,025 - Earned lease income - - 846,946 846,946 - Permits and licenses 341,583 - - 341,583 - Miscellaneous revenues 25,834 - - 25,834 2,122,591 Payment-in-lieu of taxes - 27,831,160 - 27,831,160 -
TOTAL OPERATING REVENUES 19,881,773 264,990,786 8,148,532 293,021,091 29,485,088 OPERATING EXPENSES
Cost of sales and service 13,867,264 171,635,395 9,986,052 195,488,711 29,650,860 Depreciation and amortization 2,295,317 31,705,944 675,770 34,677,031 -
TOTAL OPERATING EXPENSES 16,162,581 203,341,339 10,661,822 230,165,742 29,650,860 Operating income (loss) 3,719,192 61,649,447 (2,513,290) 62,855,349 (165,772)
NON-OPERATING REVENUES (EXPENSES)
Tax revenue 566,162 - 3,738,538 4,304,700 - Payment-in-lieu of taxes - (27,831,160) - (27,831,160) - Interest earnings 161,673 262,206 43,725 467,604 4,587 Interest expense (1,609,983) (18,223,785) (278,946) (20,112,714) - Other - 654,862 - 654,862 -
TOTAL NON-OPERATINGREVENUES (EXPENSES) (882,148) (45,137,877) 3,503,317 (42,516,708) 4,587
Income (loss) before contributionsand transfers
2,837,044 16,511,570 990,027 20,338,641 (161,185)
Capital Contributions-local government 5,890,429 - 1,890,356 7,780,785 - Transfer in - 646,814 646,814 - Transfer out (9,547,711) - (4,238,826) (13,786,537) - Contributions from developers and others - 300,888 - 300,888 - Change in net assets (820,238) 16,812,458 (711,629) 15,280,591 (161,185)
TOTAL NET ASSETSBeginning of year 89,405,040 389,935,914 2,604,072 481,945,026 5,574,340 End of year 88,584,802$ 406,748,372$ 1,892,443$ 497,225,617$ 5,413,155$
The notes to the financial statements are an integral part of this statement.
21
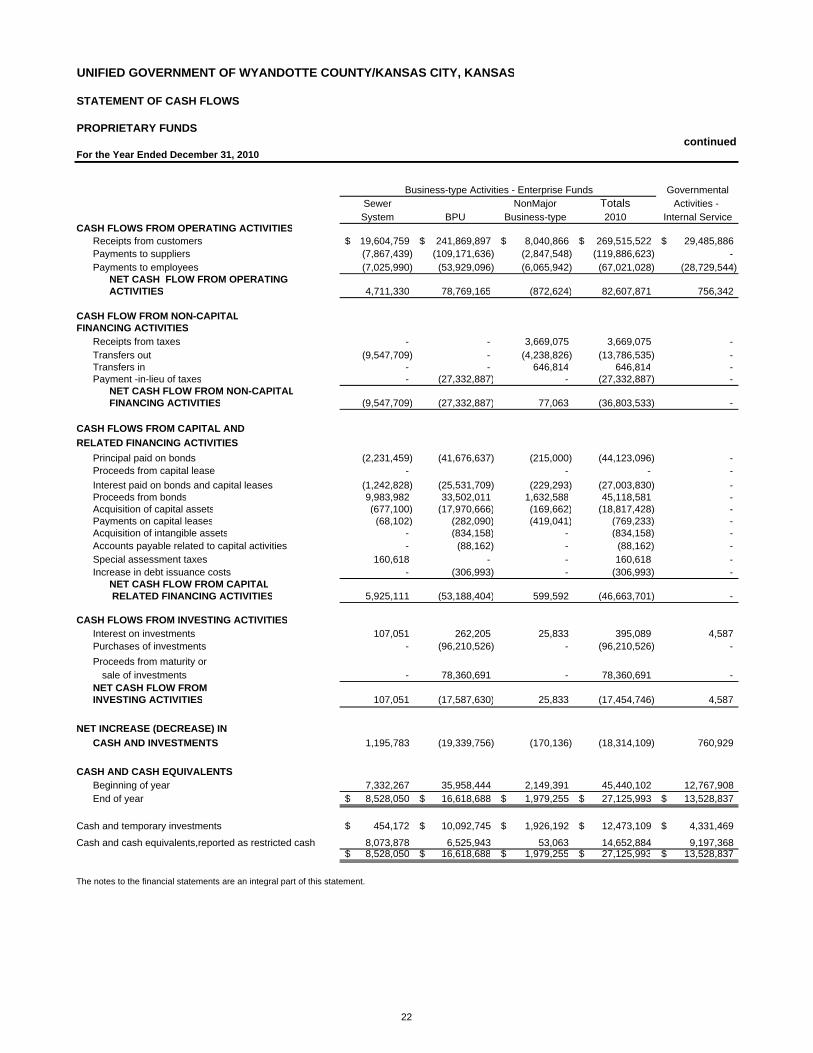
UNIFIED GOVERNMENT OF WYANDOTTE COUNTY/KANSAS CITY, KANSAS
STATEMENT OF CASH FLOWS
PROPRIETARY FUNDScontinued
For the Year Ended December 31, 2010
Business-type Activities - Enterprise Funds GovernmentalSewer NonMajor Totals Activities - System BPU Business-type 2010 Internal Service
CASH FLOWS FROM OPERATING ACTIVITIESReceipts from customers 19,604,759$ 241,869,897$ 8,040,866$ 269,515,522$ 29,485,886$ Payments to suppliers (7,867,439) (109,171,636) (2,847,548) (119,886,623) - Payments to employees (7,025,990) (53,929,096) (6,065,942) (67,021,028) (28,729,544)
NET CASH FLOW FROM OPERATING ACTIVITIES 4,711,330 78,769,165 (872,624) 82,607,871 756,342
CASH FLOW FROM NON-CAPITALFINANCING ACTIVITIES
Receipts from taxes - - 3,669,075 3,669,075 - Transfers out (9,547,709) - (4,238,826) (13,786,535) - Transfers in - - 646,814 646,814 - Payment -in-lieu of taxes - (27,332,887) - (27,332,887) -
NET CASH FLOW FROM NON-CAPITALFINANCING ACTIVITIES (9,547,709) (27,332,887) 77,063 (36,803,533) -
CASH FLOWS FROM CAPITAL AND RELATED FINANCING ACTIVITIES
Principal paid on bonds (2,231,459) (41,676,637) (215,000) (44,123,096) - Proceeds from capital lease - - - - Interest paid on bonds and capital leases (1,242,828) (25,531,709) (229,293) (27,003,830) - Proceeds from bonds 9,983,982 33,502,011 1,632,588 45,118,581 - Acquisition of capital assets (677,100) (17,970,666) (169,662) (18,817,428) - Payments on capital leases (68,102) (282,090) (419,041) (769,233) - Acquisition of intangible assets - (834,158) - (834,158) - Accounts payable related to capital activities - (88,162) - (88,162) - Special assessment taxes 160,618 - - 160,618 - Increase in debt issuance costs - (306,993) - (306,993) -
NET CASH FLOW FROM CAPITAL RELATED FINANCING ACTIVITIES 5,925,111 (53,188,404) 599,592 (46,663,701) -
CASH FLOWS FROM INVESTING ACTIVITIESInterest on investments 107,051 262,205 25,833 395,089 4,587 Purchases of investments - (96,210,526) - (96,210,526) - Proceeds from maturity or
sale of investments - 78,360,691 - 78,360,691 - NET CASH FLOW FROM INVESTING ACTIVITIES 107,051 (17,587,630) 25,833 (17,454,746) 4,587
NET INCREASE (DECREASE) IN CASH AND INVESTMENTS 1,195,783 (19,339,756) (170,136) (18,314,109) 760,929
CASH AND CASH EQUIVALENTSBeginning of year 7,332,267 35,958,444 2,149,391 45,440,102 12,767,908 End of year 8,528,050$ 16,618,688$ 1,979,255$ 27,125,993$ 13,528,837$
Cash and temporary investments 454,172$ 10,092,745$ 1,926,192$ 12,473,109$ 4,331,469$
Cash and cash equivalents,reported as restricted cash 8,073,878 6,525,943 53,063 14,652,884 9,197,368 8,528,050$ 16,618,688$ 1,979,255$ 27,125,993$ 13,528,837$
The notes to the financial statements are an integral part of this statement.
22
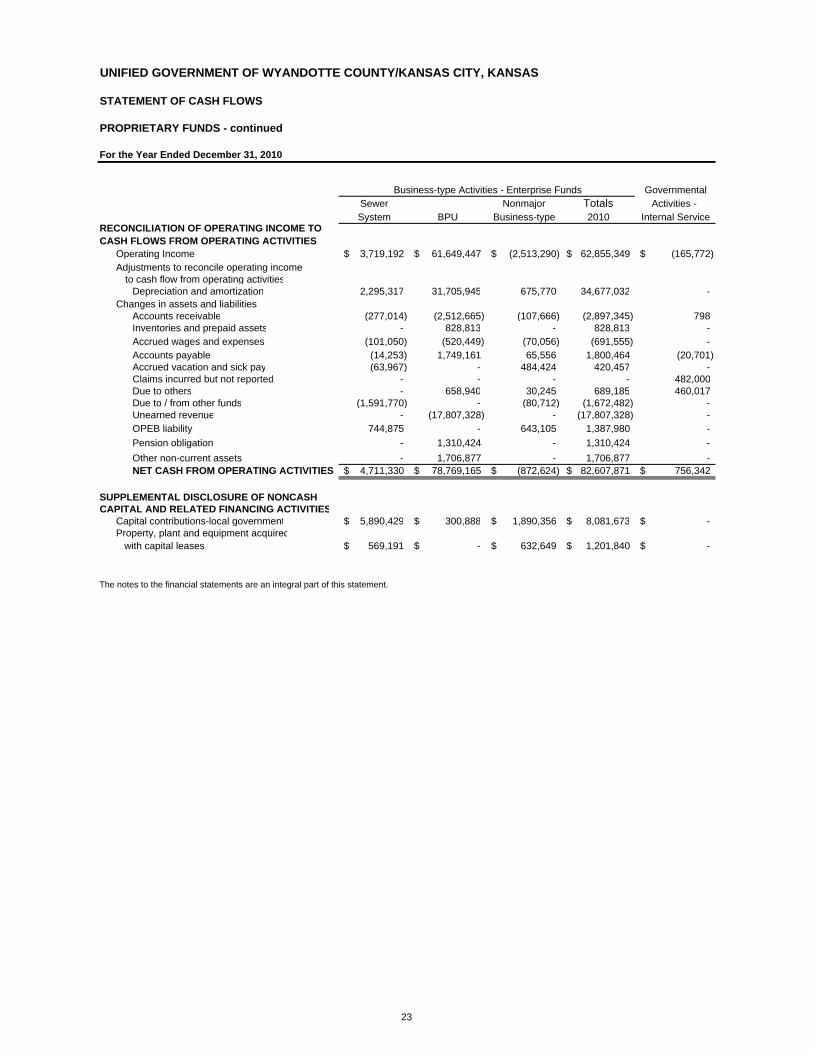
UNIFIED GOVERNMENT OF WYANDOTTE COUNTY/KANSAS CITY, KANSAS
STATEMENT OF CASH FLOWS
PROPRIETARY FUNDS - continued
For the Year Ended December 31, 2010
Business-type Activities - Enterprise Funds GovernmentalSewer Nonmajor Totals Activities - System BPU Business-type 2010 Internal Service
RECONCILIATION OF OPERATING INCOME TO CASH FLOWS FROM OPERATING ACTIVITIES
Operating Income 3,719,192$ 61,649,447$ (2,513,290)$ 62,855,349$ (165,772)$ Adjustments to reconcile operating income
to cash flow from operating activitiesDepreciation and amortization 2,295,317 31,705,945 675,770 34,677,032 -
Changes in assets and liabilitiesAccounts receivable (277,014) (2,512,665) (107,666) (2,897,345) 798 Inventories and prepaid assets - 828,813 - 828,813 - Accrued wages and expenses (101,050) (520,449) (70,056) (691,555) - Accounts payable (14,253) 1,749,161 65,556 1,800,464 (20,701) Accrued vacation and sick pay (63,967) - 484,424 420,457 - Claims incurred but not reported - - - - 482,000 Due to others - 658,940 30,245 689,185 460,017 Due to / from other funds (1,591,770) - (80,712) (1,672,482) - Unearned revenue - (17,807,328) - (17,807,328) - OPEB liability 744,875 - 643,105 1,387,980 - Pension obligation - 1,310,424 - 1,310,424 - Other non-current assets - 1,706,877 - 1,706,877 - NET CASH FROM OPERATING ACTIVITIES 4,711,330$ 78,769,165$ (872,624)$ 82,607,871$ 756,342$
SUPPLEMENTAL DISCLOSURE OF NONCASHCAPITAL AND RELATED FINANCING ACTIVITIES
Capital contributions-local government 5,890,429$ 300,888$ 1,890,356$ 8,081,673$ -$ Property, plant and equipment acquired with capital leases 569,191$ -$ 632,649$ 1,201,840$ -$
The notes to the financial statements are an integral part of this statement.
23
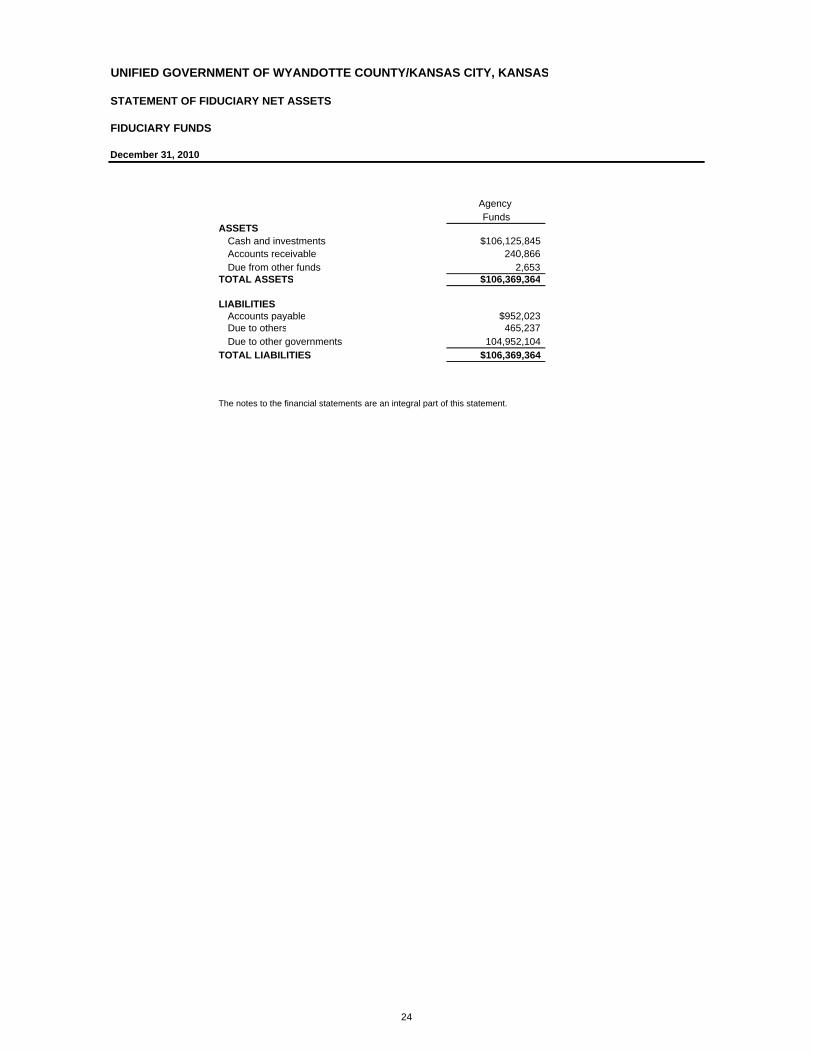
UNIFIED GOVERNMENT OF WYANDOTTE COUNTY/KANSAS CITY, KANSAS
STATEMENT OF FIDUCIARY NET ASSETS
FIDUCIARY FUNDS
December 31, 2010
Agency Funds
ASSETSCash and investments $106,125,845Accounts receivable 240,866Due from other funds 2,653
TOTAL ASSETS $106,369,364
LIABILITIES Accounts payable $952,023Due to others 465,237Due to other governments 104,952,104
TOTAL LIABILITIES $106,369,364
The notes to the financial statements are an integral part of this statement.
24
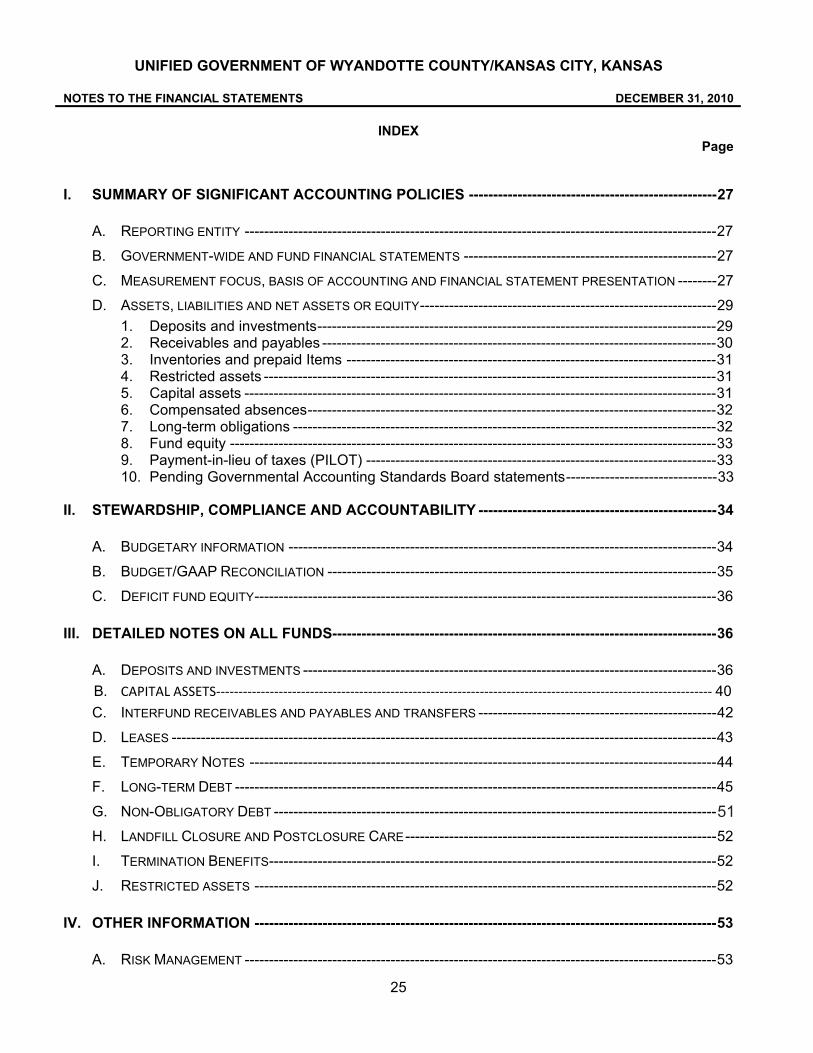
UNIFIED GOVERNMENT OF WYANDOTTE COUNTY/KANSAS CITY, KANSAS
NOTES TO THE FINANCIAL STATEMENTS DECEMBER 31, 2010
INDEX Page
25
I. SUMMARY OF SIGNIFICANT ACCOUNTING POLICIES --------------------------------------------------- 27
A. REPORTING ENTITY ------------------------------------------------------------------------------------------------- 27
B. GOVERNMENT-WIDE AND FUND FINANCIAL STATEMENTS ---------------------------------------------------- 27
C. MEASUREMENT FOCUS, BASIS OF ACCOUNTING AND FINANCIAL STATEMENT PRESENTATION -------- 27
D. ASSETS, LIABILITIES AND NET ASSETS OR EQUITY ------------------------------------------------------------- 29 1. Deposits and investments ---------------------------------------------------------------------------------- 29 2. Receivables and payables --------------------------------------------------------------------------------- 30 3. Inventories and prepaid Items ---------------------------------------------------------------------------- 31 4. Restricted assets --------------------------------------------------------------------------------------------- 31 5. Capital assets ------------------------------------------------------------------------------------------------- 31 6. Compensated absences ------------------------------------------------------------------------------------ 32 7. Long-term obligations --------------------------------------------------------------------------------------- 32 8. Fund equity ---------------------------------------------------------------------------------------------------- 33 9. Payment-in-lieu of taxes (PILOT) ------------------------------------------------------------------------ 33 10. Pending Governmental Accounting Standards Board statements ------------------------------- 33
II. STEWARDSHIP, COMPLIANCE AND ACCOUNTABILITY ------------------------------------------------- 34
A. BUDGETARY INFORMATION ---------------------------------------------------------------------------------------- 34
B. BUDGET/GAAP RECONCILIATION -------------------------------------------------------------------------------- 35
C. DEFICIT FUND EQUITY----------------------------------------------------------------------------------------------- 36
III. DETAILED NOTES ON ALL FUNDS ------------------------------------------------------------------------------- 36
A. DEPOSITS AND INVESTMENTS ------------------------------------------------------------------------------------- 36B. CAPITAL ASSETS‐‐‐‐‐‐‐‐‐‐‐‐‐‐‐‐‐‐‐‐‐‐‐‐‐‐‐‐‐‐‐‐‐‐‐‐‐‐‐‐‐‐‐‐‐‐‐‐‐‐‐‐‐‐‐‐‐‐‐‐‐‐‐‐‐‐‐‐‐‐‐‐‐‐‐‐‐‐‐‐‐‐‐‐‐‐‐‐‐‐‐‐‐‐‐‐‐‐‐‐‐‐‐‐‐‐‐‐‐‐‐ 40 C. INTERFUND RECEIVABLES AND PAYABLES AND TRANSFERS ------------------------------------------------- 42
D. LEASES ---------------------------------------------------------------------------------------------------------------- 43
E. TEMPORARY NOTES ------------------------------------------------------------------------------------------------ 44
F. LONG-TERM DEBT --------------------------------------------------------------------------------------------------- 45
G. NON-OBLIGATORY DEBT ------------------------------------------------------------------------------------------- 52
H. LANDFILL CLOSURE AND POSTCLOSURE CARE ---------------------------------------------------------------- 52
I. TERMINATION BENEFITS-------------------------------------------------------------------------------------------- 52
J. RESTRICTED ASSETS ----------------------------------------------------------------------------------------------- 52
IV. OTHER INFORMATION ----------------------------------------------------------------------------------------------- 53
A. RISK MANAGEMENT ------------------------------------------------------------------------------------------------- 53
51
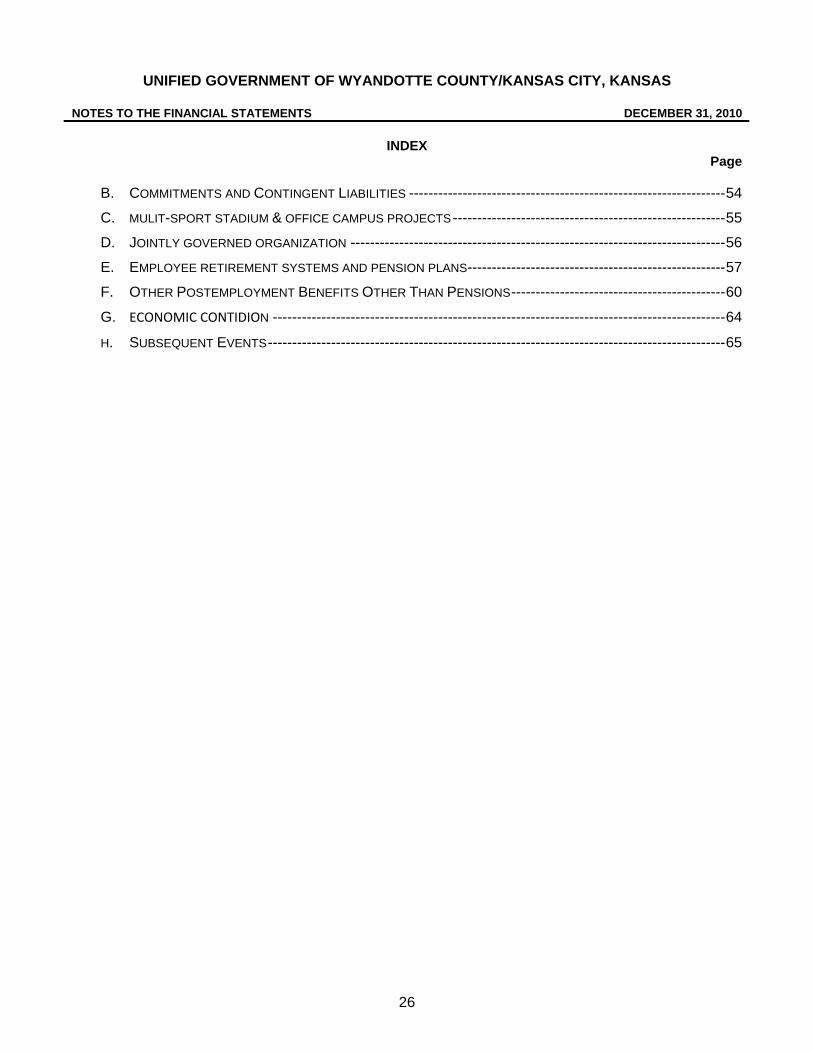
UNIFIED GOVERNMENT OF WYANDOTTE COUNTY/KANSAS CITY, KANSAS NOTES TO THE FINANCIAL STATEMENTS DECEMBER 31, 2010
INDEX Page
26
B. COMMITMENTS AND CONTINGENT LIABILITIES ----------------------------------------------------------------- 54
C. MULIT-SPORT STADIUM & OFFICE CAMPUS PROJECTS -------------------------------------------------------- 55
D. JOINTLY GOVERNED ORGANIZATION ----------------------------------------------------------------------------- 56
E. EMPLOYEE RETIREMENT SYSTEMS AND PENSION PLANS ----------------------------------------------------- 57
F. OTHER POSTEMPLOYMENT BENEFITS OTHER THAN PENSIONS -------------------------------------------- 60
G. ECONOMIC CONTIDION --------------------------------------------------------------------------------------------- 64
H. SUBSEQUENT EVENTS ---------------------------------------------------------------------------------------------- 65
27
I. SUMMARY OF SIGNIFICANT ACCOUNTING POLICIES
A. Reporting entity
The Unified Government of Wyandotte County/Kansas City, Kansas (the Unified Government) is organized under the laws of the State of Kansas and is governed by an elected eleven-member board. The Unified Government was created October 1, 1997, based on a citizen vote to consolidate the operations of the City of Kansas City, Kansas and Wyandotte County. As of December 31, 2009, there were no component units for which the Unified Government is considered to be financially accountable. Under Charter Ordinance of the Unified Government of Wyandotte County, Kansas City, Kansas (the Unified Government), pursuant to the Unified Government’s constitutional home rule, the BPU is an administrative agency of the Unified Government and, as such, is a part of the Unified Government’s primary government. However, the BPU’s operational and administrative control is under a six-member elected board of directors (the Board).
B. Government-wide and fund financial statements
The government-wide financial statements (i.e., the statement of net assets and the statement of activities) report information on all of the nonfiduciary activities of the primary government. For the most part, the effect of interfund activity has been removed from these statements. Governmental activities, which normally are supported by taxes and intergovernmental revenues, are reported separately from business-type activities, which rely to a significant extent on fees and charges for support. Likewise, the primary government is reported separately from certain legally separate component units for which the primary government is financially accountable. The statement of activities demonstrates the degree to which the direct expenses of a given function or segment are offset by program revenues. Direct expenses are those that are clearly identifiable with a specific function or segment. Program revenues include: charges to customers or applicants who purchase, use or directly benefit from goods, services, or privileges provided by a given function or segment; and grants and contributions that are restricted to meeting the operational or capital requirements of a particular function or segment. Taxes and other items not properly included among program revenues are reported instead as general revenues. Separate financial statements are provided for governmental funds, proprietary funds, and fiduciary funds, even though the latter are excluded from the government-wide financial statements. Major individual governmental funds and major individual enterprise funds are reported as separate columns in the fund financial statements.
C. Measurement focus, basis of accounting and financial statement presentation
The government-wide financial statements are reported using the economic resources measurement focus and the accrual basis of accounting, as are the proprietary funds and fiduciary funds financial statements, except for agency funds, which have no measurement focus. Revenues are recorded when earned and expenses are recorded when a liability is incurred, regardless of the timing of related cash flows. Property taxes are recognized as revenues in the year for which they are levied. Grants and similar items are recognized as revenue as soon as all eligibility requirements imposed by the provider have been met. Governmental fund financial statements are reported using the current financial resources measurement focus and the modified accrual basis of accounting. Revenues are recognized as soon as they are both measurable and available. Revenues are considered to be available when they are collectible within the current period or soon enough therafter to pay liabilities of the current period. For this purpose, the government considers revenues to be available if they are collected within 60 days of
28
the end of the current fiscal period. Expenditures generally are recorded when a liability is incurred, as under accrual accounting. However, debt service expenditures, as well as expenditures related to compensated absences and claims and judgments, are recorded only when payment is due. Franchise taxes, licenses, and interest associated with the current fiscal period are all considered to be susceptible to accrual and thus have been recognized as revenue of the current fiscal period. Only the portion of special assessments receivable due within the current fiscal period is considered to be susceptible to accrual as revenue of the current period. All other revenue items are considered to be measurable and available only when cash is received by the government. Expenditure-driven grants are recognized as revenue when the qualifying expenditures have been incurred and all other grant requirements have been met. Unrestricted aid is reported as revenue in the fiscal year during which the entitlement is received. The Unified Government reports the following major governmental funds: The General Fund is the Unified Government's primary operating fund. It accounts for all financial resources of the general government, except those required to be accounted for in another fund. The Capital Projects Fund accounts for the acquisition of capital assets or construction of major capital projects not being financed by proprietary funds. The Unified Government reports the following major proprietary funds: The Sewer System Fund provides financing for water pollution control and is responsible for day-to-day and future operations, routing system maintenance and payment on revenue bonds. The Board of Public Utilities (BPU) is an administrative agency of the Unified Government. The BPU operates and maintains the water and electric utilities owned by the Unified Government. Additionally, the Unified Government reports the following fund types: The Internal Service Funds account for workers’ compensation reserves, health insurance reserves, and cafeteria plan reserves that provide services to other departments on a cost-reimbursement basis. The Agency Funds are custodial in nature and do not present results of operations or have a measurement focus. Agency funds are accounted for using the accrual basis of accounting. These funds are used to report resources held by the Unified Government in a custodial capacity for tax collection and related disbursements to other governments, as well as amounts held in a fiduciary capacity for remittance to individuals, private organizations, or other organizations. Private-sector standards of accounting and financial reporting issued prior to December 1, 1989 are followed in both the government-wide and proprietary fund financial statements to the extent that those standards do not conflict with or contradict guidance of the Governmental Accounting Standards Board. Governments also have the option of following subsequent private-sector guidance for their business-type activities and enterprise funds, subject to this same limitation. The Unified Government, including the BPU, has not elected to follow subsequent private – sector guidance. As a general rule, the effect of interfund activity has been eliminated from the government-wide financial statements. Exceptions to this general rule are payment-in-lieu of taxes and other charges between the government’s enterprise funds and various other functions of the government. Elimination of these charges would distort the direct costs and program revenues reported for the various functions concerned.

29
Amounts reported as program revenues include: charges to customers or applicants for goods, services, or privileges provided; operating grants and contributions; and capital grants and contributions, including special assessments. Internally dedicated resources are reported as general revenues rather than as program revenues. Likewise, general revenues include all taxes. Proprietary funds distinguish operating revenues and expenses from non-operating items. Operating revenues and expenses generally result from providing services and producing and delivering goods in connection with a proprietary fund’s principal ongoing operations. Operating expenses for enterprise funds and internal service funds include the cost of sales and services administrative expenses, and depreciation on capital assets. All revenues and expenses not meeting this definition are reported as non-operating revenues and expenses. Estimates. The preparation of financial statements in conformity with accounting principles generally accepted in the United States of America require management to make estimates and assumptions that affect the reported amounts of certain assets, liabilities, revenues, expenditures, expenses and other disclosures. Accordingly, actual results could differ from those estimates.
D. Assets, liabilities and net assets or equity
1. Deposits and investments
The Unified Government maintains a cash and investment pool that is available for use by all funds except the BPU. The pool has the general characteristics of demand deposit accounts, in that each fund may deposit additional cash at any time and also, effectively, may withdraw cash at any time without prior notice or penalty. The pooled cash is invested to the extent available in authorized investments. Each fund’s portion of the pool is displayed on their balance sheet as "Cash and temporary investments." The balance sheet also includes two other accounts for restricted cash and investments of the Unified Government. Restricted cash consists of assets held by trustees and various reserves required by revenue bond ordinances. For purposes of the statements of cash flows, the Unified Government considers all highly liquid investments with an original maturity of three months or less to be cash equivalents. State statutes authorize the Unified Government to invest in temporary notes of the Unified Government, time deposits, United States Treasury notes, repurchase agreements, a municipal investment pool established through the trust department of commercial banks which have offices in Wyandotte County, and the Kansas Municipal Investment Pool. This pool is not an SEC registered pool. The Pooled Money Investment Board (PMIB) provides the regulatory oversight for this pool. The reported value of the pool is the same as the fair value of the pool shares. Investments are stated at amortized cost which approximates fair value. In addition to the preceding investments, state statutes authorize the Unified Government to invest proceeds of bonds and temporary notes in direct U.S. government and agency obligations, time deposits with banks located in Wyandotte County, FNMA, FHLB and FHLMC obligations, repurchase agreements, investment agreements with financial institutions including broker/dealers whose obligations are rated in one of the three highest rating categories by either Moody’s or Standard and Poor’s, mutual funds whose portfolio consists entirely of obligations of the U.S. government, agencies, FNMA, FHLB or FHLMC, and bonds issued by any municipality of the State of Kansas. The Unified Government maintains compensating balances with its depository bank to offset charges for check clearing and other services. Interest income of the investment pool is allocated based on weekly fund balances to the debt service, capital projects and enterprise funds with the balance allocated to the general fund.

30
Kansas statutes authorize the BPU, with certain restrictions, to invest in open accounts, time deposits, certificates of deposit, and U.S. Treasury notes. All deposits with banks are collateralized at 102% of market value as required by BPU’s Cash and Investment Policy and State Statute, less insured amounts.
2. Receivables and payables
Activity between funds that are representative of lending/borrowing arrangements outstanding at the end of the fiscal year are referred to as either “due to/from other funds” (i.e., the current portion of interfund loans) or “advances to/from other funds” (i.e., the non-current portion of interfund loans). All other outstanding balances between funds are reported as “due to/from other funds.” Any residual balances outstanding between the governmental activities and business-types activities are reported in the government-wide financial statements as “internal balances.” Property tax receivable. In accordance with State statutes, property taxes levied during the current year are revenue sources to be used to finance the budget of the ensuing year. Taxes are assessed on a calendar year basis and are levied and become a lien on the property on November 1 of each year. The Unified Government Treasurer is the tax collection agent for all taxing entities within the Unified Government. Property owners have the option of paying one-half or the full amount of the taxes levied on or before December 20 during the year levied, with the balance to be paid on or before May 10 of the ensuing year. State statutes prohibit the Unified Government Treasurer from distributing taxes collected in the year levied prior to January 1 of the ensuing year. Consequently, for revenue recognition purposes, the taxes levied during the current year are not due and receivable until the ensuing year. At December 31, such taxes are a lien on the property and are recorded as taxes receivable, net of anticipated delinquencies, with a corresponding amount recorded as deferred revenue. The property tax receivable allowance is equal to 8.09% percent of outstanding property taxes at December 31, 2010. Sales tax receivable. The Unified Government has a 2.63% local sales tax collected by the State and remitted to the Unified Government monthly. One-quarter of one percent is pledged for EMS operations, three-eights of one percent is pledged for public safety and public works projects, and the remainder is pledged for operations. The accrued sales tax receivable represents the sales tax collected by merchants at year-end. Special assessments receivable. As required by State statutes, projects financed in part by special assessments are financed through the issuance of general obligation bonds which are secured by the full faith and credit of the Unified Government and are retired from the Unified Government bond and interest fund. Further, State statutes permit levying additional general ad valorem property taxes in the Unified Government bond and interest fund to finance delinquent special assessments receivable. Consequently, special assessments receivable are accounted for within the Unified Government bond and interest fund. Special assessment taxes are levied over a ten or fifteen year period, and the annual installments are due and payable with annual ad valorem property taxes. The Unified Government may foreclose liens against property benefited by special assessments when delinquent assessments are two years in arrears. At December 31, the special assessment taxes levied are a lien on the property and are recorded as special assessments receivable in the bond and interest fund with a corresponding amount recorded as deferred revenue. BPU accounts receivable and revenue. The BPU utilizes cycle billing and accrues the amount of revenues for sales unbilled at the end of each reporting period. An estimate is made for the provision for uncollectible accounts based on an analysis of the aging of accounts receivable and historical write-offs, net of recoveries. Additional amounts may be included based upon the credit risks of significant parties. Allowances totaled $2,852,695 in fiscal year 2010.
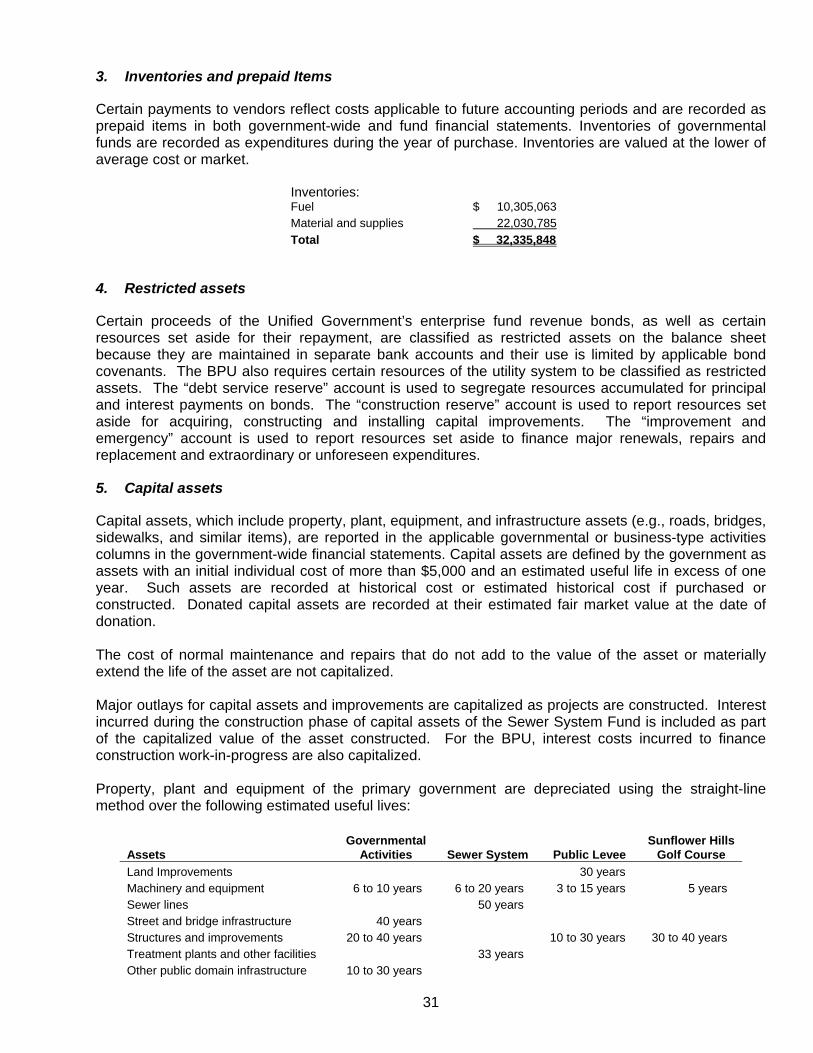
31
3. Inventories and prepaid Items
Certain payments to vendors reflect costs applicable to future accounting periods and are recorded as prepaid items in both government-wide and fund financial statements. Inventories of governmental funds are recorded as expenditures during the year of purchase. Inventories are valued at the lower of average cost or market.
Inventories: Fuel $ 10,305,063 Material and supplies 22,030,785 Total $ 32,335,848
4. Restricted assets
Certain proceeds of the Unified Government’s enterprise fund revenue bonds, as well as certain resources set aside for their repayment, are classified as restricted assets on the balance sheet because they are maintained in separate bank accounts and their use is limited by applicable bond covenants. The BPU also requires certain resources of the utility system to be classified as restricted assets. The “debt service reserve” account is used to segregate resources accumulated for principal and interest payments on bonds. The “construction reserve” account is used to report resources set aside for acquiring, constructing and installing capital improvements. The “improvement and emergency” account is used to report resources set aside to finance major renewals, repairs and replacement and extraordinary or unforeseen expenditures.
5. Capital assets
Capital assets, which include property, plant, equipment, and infrastructure assets (e.g., roads, bridges, sidewalks, and similar items), are reported in the applicable governmental or business-type activities columns in the government-wide financial statements. Capital assets are defined by the government as assets with an initial individual cost of more than $5,000 and an estimated useful life in excess of one year. Such assets are recorded at historical cost or estimated historical cost if purchased or constructed. Donated capital assets are recorded at their estimated fair market value at the date of donation. The cost of normal maintenance and repairs that do not add to the value of the asset or materially extend the life of the asset are not capitalized. Major outlays for capital assets and improvements are capitalized as projects are constructed. Interest incurred during the construction phase of capital assets of the Sewer System Fund is included as part of the capitalized value of the asset constructed. For the BPU, interest costs incurred to finance construction work-in-progress are also capitalized. Property, plant and equipment of the primary government are depreciated using the straight-line method over the following estimated useful lives:
Assets Governmental
Activities Sewer System Public Levee Sunflower Hills
Golf Course Land Improvements 30 years Machinery and equipment 6 to 10 years 6 to 20 years 3 to 15 years 5 years Sewer lines 50 years Street and bridge infrastructure 40 years Structures and improvements 20 to 40 years 10 to 30 years 30 to 40 years Treatment plants and other facilities 33 years Other public domain infrastructure 10 to 30 years

32
Depreciation for the BPU is computed on a straight-line basis using the following composite rates: Production plant 1.67% to 4.00% Transmission and distribution 1.67% to 6.67% General plant 2.27% to 10.0% Capital assets are reviewed for impairment whenever events or changes in circumstances indicate that the service utility of an asset has declined significantly and unexpectedly.
6. Compensated absences
Unified Government of Wyandotte County/Kansas City, Kansas employees. The number of vacation days awarded to a permanent, full-time employee is dependent upon the individual employee's number of continuous years of service. The number of days of annual vacation range from 11 to 28 days for full-time regular employees, 15 to 30 days for command officers of the police and fire departments, and 240 to 288 hours for fire officers on 24-hour shifts. Selected part-time employees accrue one-half the number of hours accrued by full-time regular employees. Employees are not eligible to use the earned time until one year of continuous service is completed. If certain conditions are satisfied and if appropriate approval is received, an employee may carry over to the following year earned and unused vacation time. Permanent, full-time employees also earn and accumulate sick leave time at the rate of 10 hours for each minimum month of service. Selected part-time employees accrue sick leave time at the rate of one-half the full-time rate (5 hours) for each minimum month of service. Unused sick leave may be carried over indefinitely. Payment of unused sick leave will be made upon separation of employment based on a prorated formula. Based on attendance, employees may exchange up to five unused sick days per year for current payment, depending upon the availability of funds. In governmental fund financial statements, a liability is accrued when it has matured, for example, as a result of employee resignations and retirements. Proprietary fund types accrue vacation and sick pay as earned. The liabilities are based on current salary costs and the vested portion of accumulated benefits. BPU employees. Under the terms of the BPU’s personnel policy, employees are granted vacation and sick leave in varying amounts. In the event of termination, an employee is paid for accumulated vacation days. Employees may carry over a maximum of 80 hours of vacation hours for bargaining unit employees and 120 hours for non-bargaining unit employees. Sick leave can be accrued up to 1,760 hours. Employees who resign with at least fifteen years of service are paid for 75 percent of accumulated sick leave. All employees are paid for accumulated sick leave upon retirement or death. The BPU accrues vacation and sick pay as earned. The liabilities are based on current salary costs and the vested portion of accumulated benefits.
7. Long-term obligations
In the government-wide financial statements, and proprietary fund types in the fund financial statements, long-term obligations are reported as liabilities in the applicable governmental activities, business-type activities, or proprietary fund type statement of net assets. Bond premiums and discounts, as well as issuance costs, are deferred and amortized over the life of the bonds using the effective interest method. Bonds payable are reported net of the applicable bond premium or discount. In the fund financial statements, governmental fund types recognize bond premiums and discounts, as well as bond issuance costs, during the current period. The face amount of debt issued is reported as
33
other financing sources while discounts on debt issuances are reported as other financing uses. Issuance costs, whether or not withheld from the actual debt proceeds received, are reported as debt service expenditures.
8. Fund equity
In the fund financial statements, governmental funds report reservations of fund balance for amounts that are not available for appropriation or are legally restricted by outside parties for use for a specific purpose. Designations of fund balance represent tentative management plans that are subject to change. Reservations of fund balance. The fund balances of the governmental fund types include the following reservations, which represent amounts that are not appropriable or are legally segregated for a specific purpose: • Reserved for encumbrances - used to segregate a portion of fund balance legally restricted for
the future payment of outstanding encumbrances. • Reserved for alcohol diversion - used to segregate a portion of fund balance legally restricted for
special alcohol programs. Designations of fund balance. The fund balances of the governmental fund types include the following designations, which represents tentative management plans that are subject to change: • Designated for restricted sales taxes - used to segregate a portion of fund balance for local sales
tax pledged for capital improvements.
9. Payment-in-lieu of taxes (PILOT)
The BPU is exempt from federal and state income taxes and local property taxes because it is an administrative agency of the Unified Government. However, the BPU is required by a Charter Ordinance to pay a percentage of gross operating revenues to the Unified Government. The Charter Ordinance established a range of 5.0 to 15.0%. Currently, the payment-in-lieu of taxes is established at 12.8%, which amounted to approximately $27,831,160 during 2010. The PILOT is collected by the BPU through incorporation in the rates as a supplemental rate rider. Effective January 1, 2011, the PILOT will decrease to 11.9% of gross revenues. In addition to these payments, the BPU also contributes free services to the Unified Government, such as street lighting, fire hydrant services, traffic signals, and collection of sewer and trash charges. These service contributions approximated $13,676,122 or 5.2% of the BPU’s total revenue for 2010.
10. Pending Governmental Accounting Standards Board statements
GASB Statement No. 54, “Fund Balance Reporting and Governmental Fund Type Definitions,” was issued in February 2009. This statement establishes fund balance classifications that comprise a hierarchy based primarily on the extent to which a government is bound to observe constraints imposed upon the use of the resources reported in governmental funds. The objective is to enhance the usefulness of fund balance information by providing clearer fund balance classifications that can be more consistently applied and by clarifying the existing governmental fund type definitions. The provisions of this statement are effective for the Unified Government’s year ending December 31, 2011. GASB Statement No. 59, Financial Instruments Omnibus, was issued in June 2010. This statement is intended to update and improve existing standards regarding financial reporting of certain financial instruments and external investment pools. The provisions of this statement are effective for the Unified Government’s fiscal year ending December 31, 2011.
34
GASB Statement No. 60, Accounting and Financial Reporting fro Service Comcession Arrangements, was issued in November 2010. This statement is intended to improve financial reporting by addressing issues related to service concession arrangements, which are a type of public-private partnership. GASB 60 applies to those arrangements in which specific criteria determining whether a transferor (a government) has control over the facility are met. The provision of this statement are effective for the Unified Government’s year ending December 31, 2012. GASB Statement No. 61, The Financial Reporting Entity: Omnibus, was issued in November 2010. This Statement modifies certain requirements for inclusion of component units in the County’s financial statements when the component unit was included based on the fiscal dependency requirement. The new statement clarifies the manner in which a government’s management determines a component unit should be included, even if the financial accountability criterion is not met. This Statement also amends the criteria for reporting component units as if they were part of the primary government (that is, blending) when the component unit is blended based on the “substantively in the same governing body” criterion. New criteria also are added to require blending of component units whose total debt outstanding is expected to be repaid entirely or almost entirely with resources of the primary government. The provisions of this statement are effective for financial statements for the County’s fiscal year ending December 31, 2013.
II. STEWARDSHIP, COMPLIANCE AND ACCOUNTABILITY
A. Budgetary information
State statutes require that an annual operating budget be legally adopted for the general fund, special revenue funds, debt service funds and enterprise funds, (unless the fund is specifically exempted by statute). Kansas statutes provide for the following sequence and timetable of the legal annual operating budget: • Preparation of the budget for the succeeding calendar year on or before August 1st.
• Publication in local newspaper of the proposed budget and notice of public hearing on the budget on or before August 5th.
• Public hearing on or before August 15th, but at least ten days after publication of notice of hearing.
• Adoption of the final budget on or before August 25th. The Unified Government has the following levels of budget control: • The legal level of control is established at the fund level by State statutes, which also permits the
transfer of budgeted amounts from one object or purpose to another within the same fund.
• The Unified Government further controls spending by requiring that no expenditures be committed that would exceed the amount appropriated for the spending category (e.g., Personnel Services, Contractual Services) without the department first obtaining approval.
• As allowed by State statute, the governing body can increase the fund level expenditures by amending the budget. An amendment may only be made for previously unbudgeted increases in revenue other than ad valorem taxes. To do this, a notice of public hearing to amend the budget must be published in the local newspaper. At least ten days after the publication, the hearing may be held and the governing body may amend the budget at that time.
Budget comparison statements are presented for each budgeted fund showing the actual receipts and expenditures compared to budgeted receipts and expenditures. Transfers to close funds can exceed the amount budgeted for that object code. The Unified Government of Wyandotte County/Kansas City,

35
Kansas budget amounts presented in the statements that compare actual expenditures to the budget are the amended amounts. All legal operating budgets are prepared using the modified cash basis of accounting, modified further by the encumbrance method of accounting. Revenues are recognized when cash is received. Expenditures include disbursements, accounts payable and encumbrances. Encumbrances are commitments for future payments and are supported by a document evidencing the commitment, such as a purchase order or contract. All unencumbered appropriations (legal budget expenditure authority) lapse at year-end, except for capital project funds appropriations that are carried forward until such time as the project is completed or terminated. Encumbered appropriations are not reappropriated in the ensuing year's budget but are carried forward until liquidated or canceled. Accordingly, the data presented in the budgetary comparison statements differ from the data presented in the financial statements prepared in accordance with accounting principles generally accepted in the United States of America. A legal operating budget is not required for the following Unified Government funds: Capital Projects Internal Service Special Revenue: AR&RA Special Revenue: Community Development Special Revenue: Enhanced Enterprise Loans Special Revenue: Parks Special Revenue: Special Grants Special Revenue: Special Law Enforcement Special Revenue: Solid Waste Fund Debt Service: Economic Development Agency Funds Controls over spending in the above non-budgeted funds, which are not subject to the legal budget requirements, are maintained by the review and internal appropriation process established by management.
B. Budget/GAAP Reconciliation
As described in Note II.A. above, the actual data presented in the budgetary comparison statements differ from the data reported in accordance with GAAP. The following schedule presents the reconciliation between the different bases of reporting for the general fund:
Revenue and other sources: General Fund GAAP basis revenues $166,898,158 Revenue adjustments (942,704) Cancellation of prior year encumbrances 205,647 Budgetary basis revenue $166,161,101
Expenditures and other uses: GAAP basis expenditures $171,414,261 Expenditure adjustments (3,310,160) Change in reserve for encumbrances 481,834 Cancellation of prior year encumbrances 205,536 Budgetary basis expenditures $168,791,471
36
C. Deficit fund equity
At December 31, 2010, the Workers’ Compensation fund had a deficit of $6,151,478 which will be recovered from future internal charges to the Unified Government’s other funds. The Community Development fund and AR&RA fund had deficit fund balances of $790,989 and $1,078,015 respectively, which will be recovered from future intergovernmental revenues. The EMS fund had deficit fund balances of $791,348 respectively, which will be recovered from future charges for services.
III. DETAILED NOTES ON ALL FUNDS
A. Deposits and investments
The Unified Government (excluding the BPU) has adopted a formal Cash Management and Investment Policy. Primary objectives of investment activities are, in order of priority, safety, diversification, liquidity, maturity, and return on investment. The standard of care to be used by investment officials shall be the “prudent person standard” and shall be applied in the context of managing an overall portfolio. This rule states “Investments shall be made with judgment and care, under circumstances then prevailing, which persons of prudence, discretion and intelligence would exercise in the management of their own affairs, not for speculation, but for investment, considering the probable safety of their capital as well as the probable income to be derived.” The BPU maintains a cash and investment program to pay for operating and capital requirements as well as for debt service requirements. The investment program is comprised of deposits, repurchase agreements, certificates of deposit, and U.S. Treasury securities. Other investments using U.S. Agency and money market fund securities for the debt service program are managed by the bond trustee. Nearly all maturities of securities were less than one year. At December 31, 2010, the bank balance and certificates of deposit were $250,737, which was covered by federal depository insurance and collateral held in safekeeping in the BPU’s name. The BPU has an investment policy that regulates investments in securities that have objectives of safety of principal, liquidity with all investments in U.S. dollars, and investment returns optimized within the constraints of safety and liquidity. Eligible securities are specific to Kansas State Statutes and the BPU’s bond indenture agreements. All securities owned by BPU are in conformance with the investment policy. Custodial Credit Risk. Custodial credit risk is the risk that in the event of a bank failure or failure of the investment counter-party, the Unified Government’s deposits may not be returned to it, or it will not be able to recover the value of its investments or collateral securities that are in the possession of an outside party. The Unified Government requires that deposits be fully collateralized at all times. Acceptable collateral for deposits follows the provisions of state law. Peak period collateral agreements are not permitted under the Unified Government’s policy. As of December 31, 2010, the market value of assets pledged to the Unified Government as collateral exceeded amounts on deposit. The Unified Government requires all security purchases be settled on a delivery versus payment basis with an independent third-party custodian designated by the Unified Government. As of December 31, 2010, the Unified Government had $26,038,850 of investments in U.S. government agency securities which were held by the investment’s counterparty. The BPU believes it has no custodial risk. All deposits with banks are collateralized at 102% of market value, as required by the BPU’s cash and investment policy and Kansas state statute, less insured amounts. All securities are registered in the name of the BPU and held by a third-party safekeeping agent. Investments in money market mutal funds are not exposed to custodial risk because their existence is not evidenced by securities that exist in physical or book entry form.

37
Interest Rate Risk. Interest rate risk is the risk that the market rate value of securities in the portfolio will fall due to changes in general interest rates. Through its investment policy, the Unified Government manages this risk by structuring investments so that securities mature to meet cash flows of the general operating fund, and by investing general operating funds primarily in shorter-term securities. Additionally, the investment policy limits investments to a maximum stated maturity of four years. The BPU minimizes the risk of market value changes by structuring the investment portfolio so that fixed income securities mature to meet cash requirements for debt service and other disbursement requirements for ongoing operations and by keeping maturities short. Credit Risk. Credit risk is the risk that the issuer or other counterparty to an investment will not fulfill its obligations. Kansas law limits the types of investments that can be made. The Unified Government’s investment policy does not impose any additional limitations. In accordance with the investment policy, credit risk is minimized by limiting investments to the safest types of securities, by pre-qualifying financial institutions, broker/dealers, intermediaries, and advisors with whom the Unified Government will do business, and by diversifying the investment portfolio so that potential loss on individual securities will be minimal. As of December 31, 2010, the securities underlying repurchase agreements included U.S. agency obligations not explicitly guaranteed by the U.S. government. The securities had ratings of AAA by Moody’s and Standard and Poor’s. Investments in interest-earning investment contracts are not rated. The BPU manages credit risk by requiring all investments, including the use of any external investment pools and money market mutual funds, be AAA rated or better by nationally recognized rating agencies. All securities held by the BPU meet the credit quality objective. Concentration of Credit Risk. The Unified Government investment policy limits the amount of investments that can be placed with a single financial institution to no more than 60% of the total investment portfolio. The following maximum limits, by investment type, are also established:
Investment Type Maximum % of Portfolio Certificates of deposit 100% U.S. Treasury bills or notes 100% U.S. Government agency obligations 50% Kansas Municipal Investment Pool 50% Repurchase agreements 25% Bank trust department municipal pools 25% Temporary notes or no-fund warrants 10%

38
At December 31, 2010, the Unified Government (excluding the BPU) had the following investments:
Investment Maturities (in Years) Fair Value Less Than 1 1-5
Repurchase agreements $123,443,681 $123,443,681 $ - U.S. government agencies 26,038,850 - 26,038,850 Certificates of deposit 52,690,000 52,500,000 190,000 Subtotal general operating
portfolio
202,172,531
175,943,681
26,228,850
Assets held by trustee: U.S. Treasuries 28,999,622 28,999,622 - U.S. government agencies 800,800 - 800,800 Interest-earning investment
contracts
4,872,700
-
4,872,700
Total Investments $236,845,653
$204,943,303 $ 31,902,350
The BPU has a concentration of credit risk where it holds more than 5% of its investment portfolio in any one security issuer other than U.S. Treasury securities and in investment pools. The following U.S. Agency securities held in safekeeping by the BPU’s bond trustees are in excess of 5% of total investments:
Issuer Rating Amount % of total portfolio FNMA AAA $37,482,985 47.81% FHLB AAA 6,643,021 8.47%
The fair market values, as determined by market prices, of the BPU’s investments at December 31, 2010 are as follows:
Investment maturities
Fair Value Less Than 6
months 6-12 months Greater than 12
months Cash and CD’s $ 250,737 $ 250,737 $ - $ - U.S. Treasury 11,051,690 9,620,929 - 1,430,761 Repo 44,126,005 38,657,868 5,468,137 - US Agency 19,053,784 19,053,784 - - Money market funds 3,924,055 3,924,055 - - Total Investments $ 78,406,271 $ 71,507,373 $ 5,468,137 $ 1,430,761

39
A reconciliation of cash and investments is as follows:
Unified Government BPU TOTAL Cash on hand $ 11,510 $ - $ 11,510
Carrying amount of deposits
(1,419,897) 250,737 (1,169,160)
Cash with others 4,270,540 - 4,270,540 Investments 202,172,531 78,155,534 280,328,065 Investments, assets held by trustee
34,673,122
-
34,673,122
Total $239,707,806 $78,406,271 $318,114,077
Unified Government BPU TOTAL Cash and temporary investments
$181,017,647 $ 6,525,943 $187,543,590
Restricted cash and investments
58,690,159 54,326,544 113,016,703
Investments - 17,553,784 17,553,784 Total $239,707,806 $78,406,271 $318,114,077
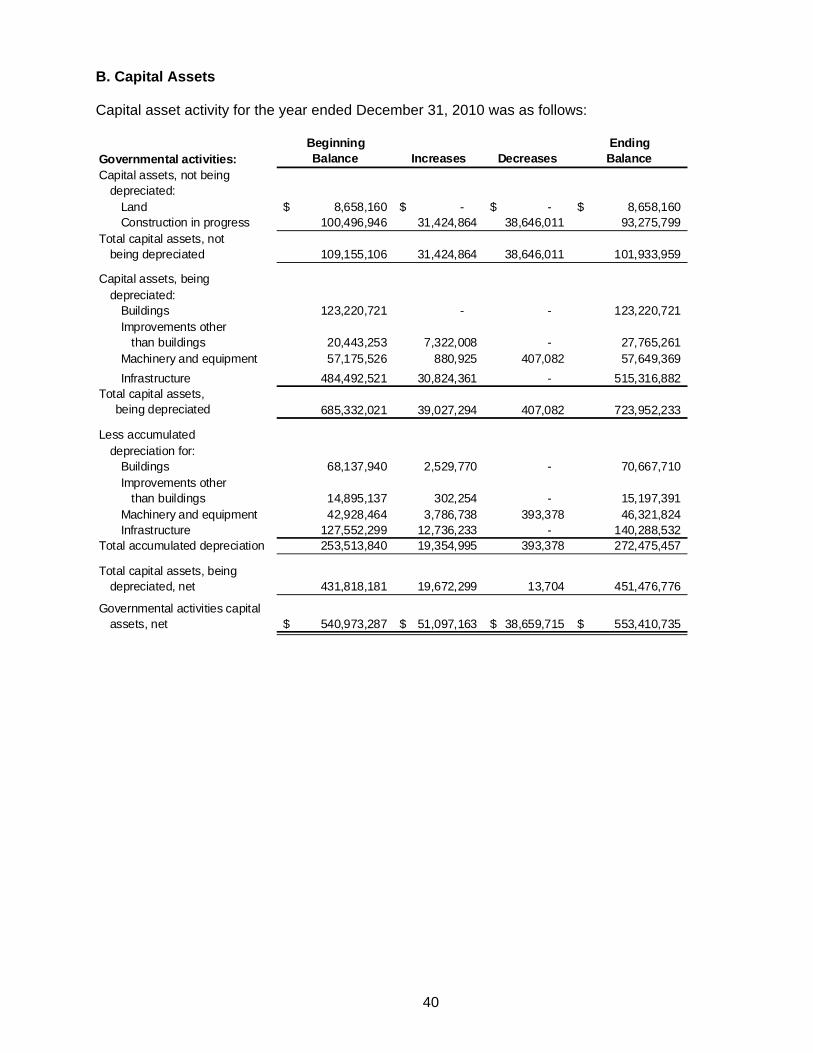
40
B. Capital Assets Capital asset activity for the year ended December 31, 2010 was as follows:
Beginning EndingGovernmental activities: Balance Increases Decreases BalanceCapital assets, not being
depreciated:Land 8,658,160$ -$ -$ 8,658,160$ Construction in progress 100,496,946 31,424,864 38,646,011 93,275,799
Total capital assets, notbeing depreciated 109,155,106 31,424,864 38,646,011 101,933,959
Capital assets, being depreciated:
Buildings 123,220,721 - - 123,220,721 Improvements other
than buildings 20,443,253 7,322,008 - 27,765,261 Machinery and equipment 57,175,526 880,925 407,082 57,649,369 Infrastructure 484,492,521 30,824,361 - 515,316,882
Total capital assets, being depreciated 685,332,021 39,027,294 407,082 723,952,233
Less accumulateddepreciation for:
Buildings 68,137,940 2,529,770 - 70,667,710 Improvements other
than buildings 14,895,137 302,254 - 15,197,391 Machinery and equipment 42,928,464 3,786,738 393,378 46,321,824 Infrastructure 127,552,299 12,736,233 - 140,288,532
Total accumulated depreciation 253,513,840 19,354,995 393,378 272,475,457
Total capital assets, beingdepreciated, net 431,818,181 19,672,299 13,704 451,476,776
Governmental activities capitalassets, net 540,973,287$ 51,097,163$ 38,659,715$ 553,410,735$
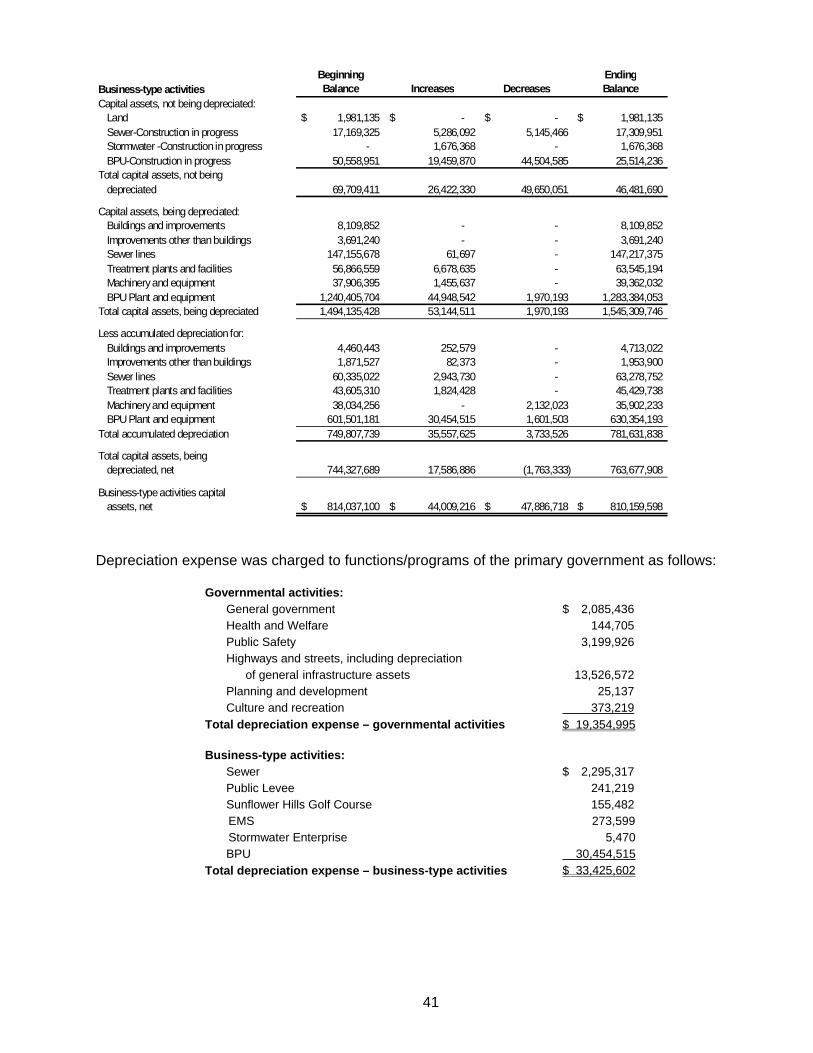
41
Beginning EndingBusiness-type activities Balance Increases Decreases BalanceCapital assets, not being depreciated:
Land 1,981,135$ -$ -$ 1,981,135$ Sewer-Construction in progress 17,169,325 5,286,092 5,145,466 17,309,951 Stormwater -Construction in progress - 1,676,368 - 1,676,368 BPU-Construction in progress 50,558,951 19,459,870 44,504,585 25,514,236
Total capital assets, not beingdepreciated 69,709,411 26,422,330 49,650,051 46,481,690
Capital assets, being depreciated:Buildings and improvements 8,109,852 - - 8,109,852 Improvements other than buildings 3,691,240 - - 3,691,240 Sewer lines 147,155,678 61,697 - 147,217,375 Treatment plants and facilities 56,866,559 6,678,635 - 63,545,194 Machinery and equipment 37,906,395 1,455,637 - 39,362,032 BPU Plant and equipment 1,240,405,704 44,948,542 1,970,193 1,283,384,053
Total capital assets, being depreciated 1,494,135,428 53,144,511 1,970,193 1,545,309,746
Less accumulated depreciation for:Buildings and improvements 4,460,443 252,579 - 4,713,022 Improvements other than buildings 1,871,527 82,373 - 1,953,900 Sewer lines 60,335,022 2,943,730 - 63,278,752 Treatment plants and facilities 43,605,310 1,824,428 - 45,429,738 Machinery and equipment 38,034,256 - 2,132,023 35,902,233 BPU Plant and equipment 601,501,181 30,454,515 1,601,503 630,354,193
Total accumulated depreciation 749,807,739 35,557,625 3,733,526 781,631,838
Total capital assets, beingdepreciated, net 744,327,689 17,586,886 (1,763,333) 763,677,908
Business-type activities capitalassets, net 814,037,100$ 44,009,216$ 47,886,718$ 810,159,598$
Depreciation expense was charged to functions/programs of the primary government as follows:
Governmental activities: General government $ 2,085,436 Health and Welfare 144,705 Public Safety 3,199,926 Highways and streets, including depreciation of general infrastructure assets 13,526,572 Planning and development 25,137 Culture and recreation 373,219 Total depreciation expense – governmental activities $ 19,354,995 Business-type activities: Sewer $ 2,295,317 Public Levee 241,219 Sunflower Hills Golf Course 155,482 EMS 273,599 Stormwater Enterprise 5,470 BPU 30,454,515 Total depreciation expense – business-type activities $ 33,425,602

42
C. Interfund receivables and payables and transfers
The composition of interfund balances as of December 31, 2010, is as follows: Interfund balances result from the time lag between the dates that (1) interfund goods and services are provided or reimbursable expenditures occur, (2) transactions are recorded in the accounting system, and (3) payments between funds are made. The interfund payables due from certain nonmajor governmental funds include amounts owed to the General Fund for the reimbursement of certain indirect costs. The composition of interfund transfers for the year ended December 31, 2010, is as follows:
Transfers are used to (1) move revenues from the fund that statute or budget requires to collect them to the fund that statute or budget requires to expend them, (2) move receipts restricted to debt services from the funds collecting the receipts to the debt service fund as debt service payments become due, and (3) use unrestricted revenues collected in the general fund to finance various programs accounted for in other funds in accordance with budgetary authorizations.
Interfund receivables and payables: Interfund Interfund Receivables Payables
General $ 3,461,826 $ 141,151 Capital projects - 7,097,650 Nonmajor governmental funds 191,627 1,927,301 Sewer enterprise fund 7,096,841 89,943 Nonmajor enterprise funds 5,824 56,351 Internal service funds - 1,446,375 Fiduciary funds 2,653 -
Total $ 10,758,771 $ 10,758,771
Transfers In:
Transfers Out:
General Capital Projects
Nonmajor Governmental
Nonmajor Enterprise Total
General $ - $ 51,818 $ 850,495 $ 148,839 $ 1,051,152
Capital projects - - 8,597,462 - 8,597,462
Nonmajor governmental 666,874 174,696 304,650 497,975 1,644,195
Sewer - 9,596,183 (48,472) - 9,547,711
Nonmajor enterprise fund 2,606,000 1,632,588 238 - 4,238,826
$3,272,874 $11,455,285 $ 9,704,373 $ 646,814 $25,079,346
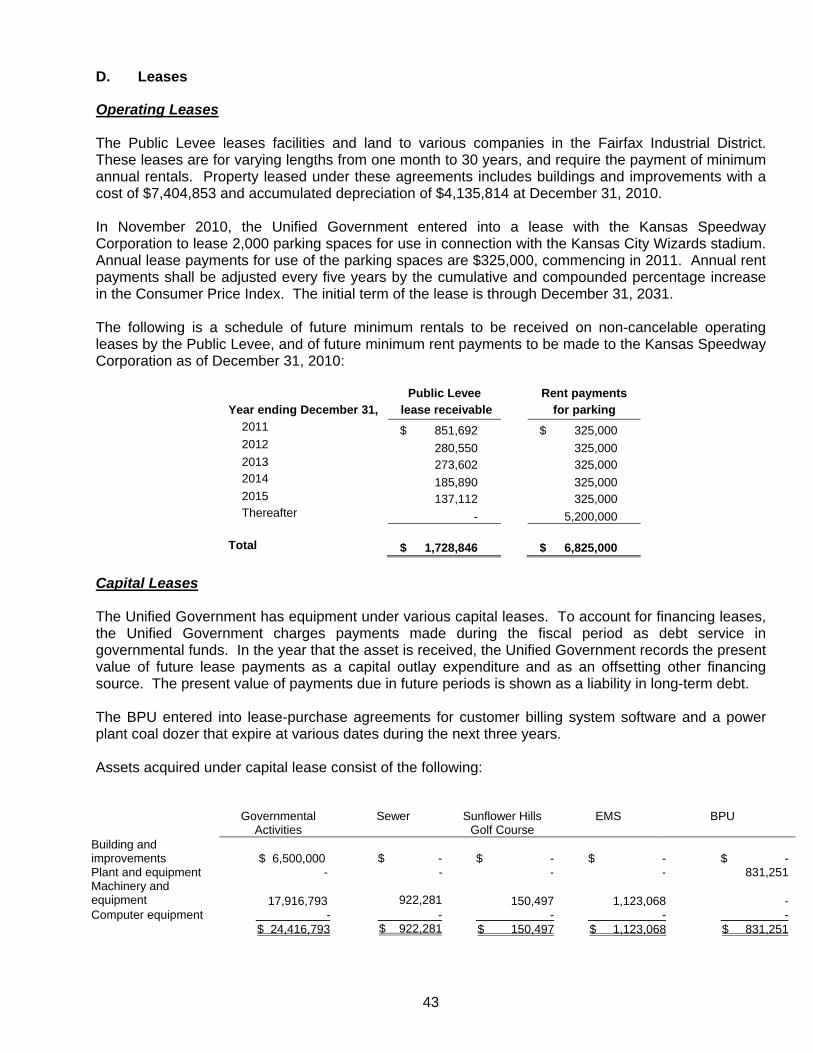
43
D. Leases
Operating Leases The Public Levee leases facilities and land to various companies in the Fairfax Industrial District. These leases are for varying lengths from one month to 30 years, and require the payment of minimum annual rentals. Property leased under these agreements includes buildings and improvements with a cost of $7,404,853 and accumulated depreciation of $4,135,814 at December 31, 2010. In November 2010, the Unified Government entered into a lease with the Kansas Speedway Corporation to lease 2,000 parking spaces for use in connection with the Kansas City Wizards stadium. Annual lease payments for use of the parking spaces are $325,000, commencing in 2011. Annual rent payments shall be adjusted every five years by the cumulative and compounded percentage increase in the Consumer Price Index. The initial term of the lease is through December 31, 2031. The following is a schedule of future minimum rentals to be received on non-cancelable operating leases by the Public Levee, and of future minimum rent payments to be made to the Kansas Speedway Corporation as of December 31, 2010:
Public Levee Rent payments Year ending December 31, lease receivable for parking 2011 $ 851,692 $ 325,000 2012 280,550 325,000 2013 273,602 325,000 2014 185,890 325,000 2015 137,112 325,000 Thereafter - 5,200,000 Total $ 1,728,846 $ 6,825,000
Capital Leases The Unified Government has equipment under various capital leases. To account for financing leases, the Unified Government charges payments made during the fiscal period as debt service in governmental funds. In the year that the asset is received, the Unified Government records the present value of future lease payments as a capital outlay expenditure and as an offsetting other financing source. The present value of payments due in future periods is shown as a liability in long-term debt. The BPU entered into lease-purchase agreements for customer billing system software and a power plant coal dozer that expire at various dates during the next three years. Assets acquired under capital lease consist of the following:
Governmental Activities
Sewer Sunflower Hills Golf Course
EMS BPU
Building and improvements $ 6,500,000
$ - $ - $ - $ -
Plant and equipment - - - - 831,251 Machinery and equipment 17,916,793
922,281 150,497 1,123,068 -
Computer equipment - - - - - $ 24,416,793 $ 922,281 $ 150,497 $ 1,123,068 $ 831,251

44
Amortization of leased assets is included with depreciation expense on the Statement of Activities. The future minimum lease obligation and the net present value of these minimum lease payments as of December 31, 2010, were as follows:
E. Temporary Notes
Kansas law permits the issuance of temporary notes to finance certain capital improvement projects which will be refinanced with general obligation bonds. Prior to the issuance of the temporary notes, the governing body must take the necessary legal steps to authorize the issuance of general obligation bonds. Temporary notes issued may not exceed the aggregate amount of bonds authorized, are interest bearing, and have a maturity date not later than four years from the date of issuance. At December 31, 2010, the Unified Government had $52,195,000 outstanding in temporary notes. All temporary notes at December 31, 2010, have a maturity of no later than December 1, 2013 and have interest rates ranging from 0.65% to 2.97%. Temporary note activity for the year ended December 31, 2010 was as follows:
Outstanding Jan. 1, 2010 Issued Redeemed
Outstanding Dec, 31, 2010
$ 114,057,799 $ 50,755,000 $ (112,617,799) $ 52,195,000
Governmental
Activities Business-type
Activities
Year ended December 31, Sewer Sunflower Hills Golf Course
EMS BPU
2011 $ 3,384,346 $ 196,849 $ 32,053 $ 397,873 $ 302,804 2012 2,090,825 196,849 32,053 344,859 75,701 2013 1,653,959 196,849 32,053 135,239 - 2014 963,039 146,529 32,053 - - 2015 660,504 121,222 32,053 - 2016-2020 970,281 - - - - 2021-2025 6,161,189 - - - -Total minimum lease payments 15,884,143 858,298 160,265 877,971 378,505 Less: Amount representing interest (1,024,821) (48,654) (9,768) (45,967) (10,552)Present value of minimum lease payments $ 14,859,322 $ 809,644 $ 150,497 $ 832,004 $ 367,953

45
F. Long-term Debt
Summary of Long-Term Debt. The following is a summary of changes in long-term debt of the Unified Government for the year ended December 31, 2010:
Governmental activities: OutstandingJan 1, 2010 Additions Deletions
Outstanding Dec 31, 2010
Due Within 1 year
General Obligation: General obligation bonds $126,653,486 $ 79,261,793 $ 14,937,789 $190,977,490 $ 10,651,240
Tax Increment Financed GO Bonds 12,027,066 20,467,595 371,785 32,122,876 593,058
Unamortized premium 2,904,341 4,216,368 878,672 6,242,037 - Unamortized discount (518,974) (177,896) (27,681) (669,189) -Deferred refunding (225,308) (159,098) (233,745) (150,661) -Accreted interest on bonds 1,684,792 1,731,948 208,873 3,207,867 108,955Compensated absences 37,826,462 6,069,428 4,506,845 39,389,045 2,640,815Capital leases 14,920,099 2,311,526 2,372,303 14,859,322 3,042,341Claims and judgments 960,000 715,000 - 1,675,000 1,675,000Unfunded pension obligation 290,645 52,874 38,366 305,153 -OPEB Liability 40,820,167 14,535,425 - 55,355,592 -Arbitrage Liability - 183,514 - 183,514 183,514Landfill closure/post-closure 1,340,000 - 140,000 1,200,000 450,000 Total-General obligation 238,682,776 129,208,477 23,193,207 344,698,046 19,344,923 Limited Obligation: Certificates of participation 8,100,000 - 8,100,000 - -Section 108 Loan 3,584,000 - 270,000 3,314,000 289,000Transportation Development Bonds 20,580,000 - 571,000 20,009,000 2,415,000Sales tax obligation bonds 54,352,319 49,080,951 18,116,162 85,317,108 708,028 Total-Limited obligation 86,616,319 49,080,951 27,057,162 108,640,108 3,412,028Total $325,299,095 $178,289,428 $50,250,369 $453,338,154 $ 22,756,951 Business-type activities:
OutstandingDec 31, 2010 Additions Deletions
OutstandingDec 31, 2010
Due Within 1 year
General Obligation bonds $ 22,384,448 $ 18,325,611 $ 975,425 $ 39,734,634 $ 1,337,638Capital leases 1,077,448 1,201,840 487,142 1,792,146 584,452Sewer state revolving loan 13,653,555 387,800 1,471,035 12,570,320 1,391,134Compensated absences 2,291,142 737,167 316,710 2,711,599 181,798OPEB liability 3,618,165 1,387,980 - 5,006,145 - Subtotal 43,024,758 22,040,398 3,250,312 61,814,844 3,495,022 BPU revenue bonds 363,881,515 32,190,000 40,641,515 355,430,000 13,935,000Capital leases 650,042 - 282,090 367,952 292,964Interest accreted 5,412,231 - 5,412,231 - -Unamortized discount and loss on refunding (963,521) - (642,827) (320,694) -Unamortized premium 4,571,779 916,780 404,448 5,084,111 -State revolving loan 21,710,900 41,343 1,035,122 20,717,121 1,071,373Compensated absences 6,610,000 1,282,000 1,960,000 5,932,000 1,960,000
OPEB liability 2,284,170 3,486,959 3,232,258 2,538,871 - Subtotal 404,157,116 37,917,082 52,324,837 389,749,361 17,259,337Total $447,181,874 $ 59,957,480 $ 55,575,149 $451,564,205 $ 20,754,359
For the governmental activities, compensated absences, claims and judgments, the unfunded pension obligation, and the OPEB liability are generally liquidated by the general fund. Landfill closure and post closure care costs are expected to be liquidated by the Solid Waste Fund.
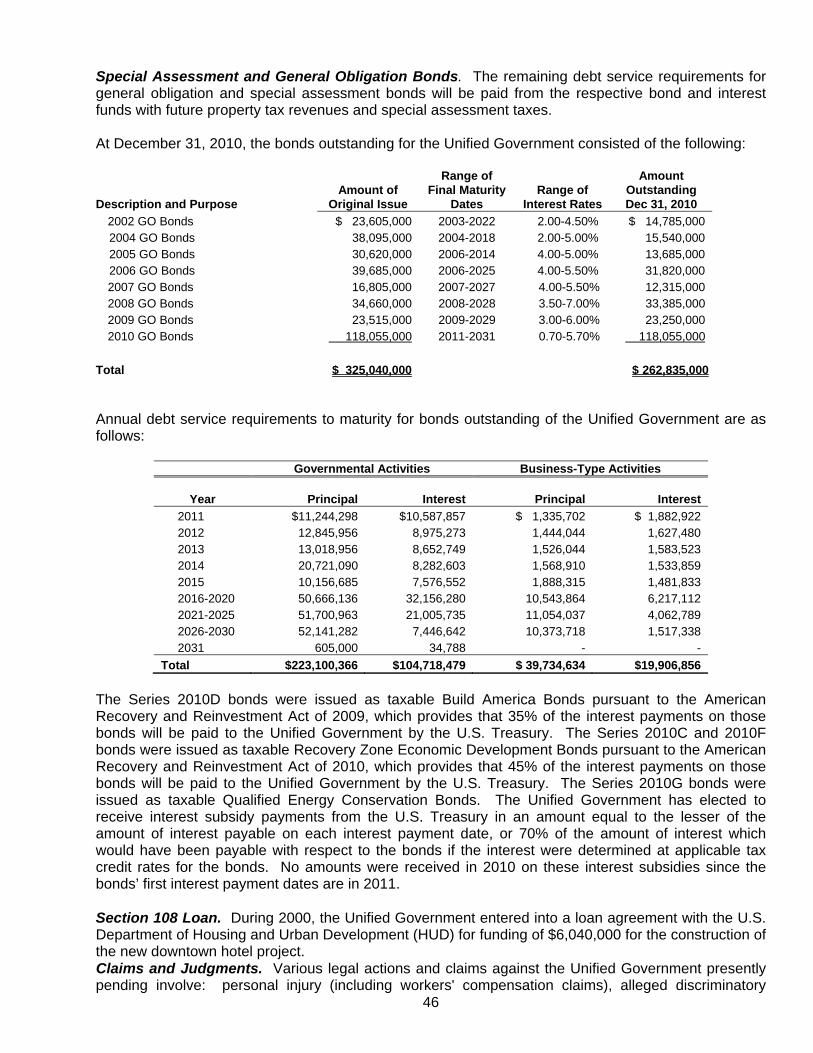
46
Special Assessment and General Obligation Bonds. The remaining debt service requirements for general obligation and special assessment bonds will be paid from the respective bond and interest funds with future property tax revenues and special assessment taxes. At December 31, 2010, the bonds outstanding for the Unified Government consisted of the following:
Description and Purpose Amount of
Original Issue
Range of Final Maturity
Dates Range of
Interest Rates
Amount Outstanding Dec 31, 2010
2002 GO Bonds $ 23,605,000 2003-2022 2.00-4.50% $ 14,785,000 2004 GO Bonds 38,095,000 2004-2018 2.00-5.00% 15,540,000 2005 GO Bonds 30,620,000 2006-2014 4.00-5.00% 13,685,000 2006 GO Bonds 39,685,000 2006-2025 4.00-5.50% 31,820,000 2007 GO Bonds 16,805,000 2007-2027 4.00-5.50% 12,315,000 2008 GO Bonds 34,660,000 2008-2028 3.50-7.00% 33,385,000 2009 GO Bonds 23,515,000 2009-2029 3.00-6.00% 23,250,000 2010 GO Bonds 118,055,000 2011-2031 0.70-5.70% 118,055,000 Total $ 325,040,000 $ 262,835,000 Annual debt service requirements to maturity for bonds outstanding of the Unified Government are as follows:
Governmental Activities Business-Type Activities
Year Principal Interest Principal Interest 2011 $11,244,298 $10,587,857 $ 1,335,702 $ 1,882,922 2012 12,845,956 8,975,273 1,444,044 1,627,480 2013 13,018,956 8,652,749 1,526,044 1,583,523 2014 20,721,090 8,282,603 1,568,910 1,533,859 2015 10,156,685 7,576,552 1,888,315 1,481,833 2016-2020 50,666,136 32,156,280 10,543,864 6,217,112 2021-2025 51,700,963 21,005,735 11,054,037 4,062,789 2026-2030 52,141,282 7,446,642 10,373,718 1,517,338 2031 605,000 34,788 - - Total $223,100,366 $104,718,479 $ 39,734,634 $19,906,856
The Series 2010D bonds were issued as taxable Build America Bonds pursuant to the American Recovery and Reinvestment Act of 2009, which provides that 35% of the interest payments on those bonds will be paid to the Unified Government by the U.S. Treasury. The Series 2010C and 2010F bonds were issued as taxable Recovery Zone Economic Development Bonds pursuant to the American Recovery and Reinvestment Act of 2010, which provides that 45% of the interest payments on those bonds will be paid to the Unified Government by the U.S. Treasury. The Series 2010G bonds were issued as taxable Qualified Energy Conservation Bonds. The Unified Government has elected to receive interest subsidy payments from the U.S. Treasury in an amount equal to the lesser of the amount of interest payable on each interest payment date, or 70% of the amount of interest which would have been payable with respect to the bonds if the interest were determined at applicable tax credit rates for the bonds. No amounts were received in 2010 on these interest subsidies since the bonds’ first interest payment dates are in 2011. Section 108 Loan. During 2000, the Unified Government entered into a loan agreement with the U.S. Department of Housing and Urban Development (HUD) for funding of $6,040,000 for the construction of the new downtown hotel project. Claims and Judgments. Various legal actions and claims against the Unified Government presently pending involve: personal injury (including workers' compensation claims), alleged discriminatory
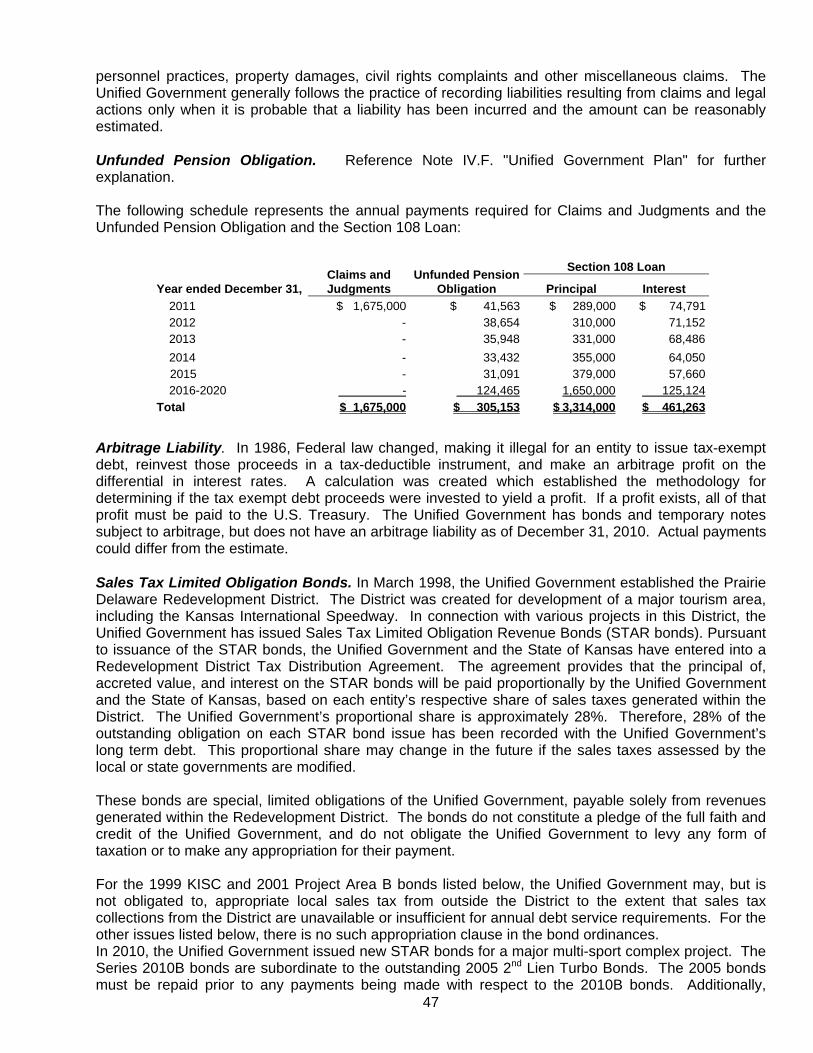
47
personnel practices, property damages, civil rights complaints and other miscellaneous claims. The Unified Government generally follows the practice of recording liabilities resulting from claims and legal actions only when it is probable that a liability has been incurred and the amount can be reasonably estimated. Unfunded Pension Obligation. Reference Note IV.F. "Unified Government Plan" for further explanation. The following schedule represents the annual payments required for Claims and Judgments and the Unfunded Pension Obligation and the Section 108 Loan:
Arbitrage Liability. In 1986, Federal law changed, making it illegal for an entity to issue tax-exempt debt, reinvest those proceeds in a tax-deductible instrument, and make an arbitrage profit on the differential in interest rates. A calculation was created which established the methodology for determining if the tax exempt debt proceeds were invested to yield a profit. If a profit exists, all of that profit must be paid to the U.S. Treasury. The Unified Government has bonds and temporary notes subject to arbitrage, but does not have an arbitrage liability as of December 31, 2010. Actual payments could differ from the estimate. Sales Tax Limited Obligation Bonds. In March 1998, the Unified Government established the Prairie Delaware Redevelopment District. The District was created for development of a major tourism area, including the Kansas International Speedway. In connection with various projects in this District, the Unified Government has issued Sales Tax Limited Obligation Revenue Bonds (STAR bonds). Pursuant to issuance of the STAR bonds, the Unified Government and the State of Kansas have entered into a Redevelopment District Tax Distribution Agreement. The agreement provides that the principal of, accreted value, and interest on the STAR bonds will be paid proportionally by the Unified Government and the State of Kansas, based on each entity’s respective share of sales taxes generated within the District. The Unified Government’s proportional share is approximately 28%. Therefore, 28% of the outstanding obligation on each STAR bond issue has been recorded with the Unified Government’s long term debt. This proportional share may change in the future if the sales taxes assessed by the local or state governments are modified. These bonds are special, limited obligations of the Unified Government, payable solely from revenues generated within the Redevelopment District. The bonds do not constitute a pledge of the full faith and credit of the Unified Government, and do not obligate the Unified Government to levy any form of taxation or to make any appropriation for their payment. For the 1999 KISC and 2001 Project Area B bonds listed below, the Unified Government may, but is not obligated to, appropriate local sales tax from outside the District to the extent that sales tax collections from the District are unavailable or insufficient for annual debt service requirements. For the other issues listed below, there is no such appropriation clause in the bond ordinances. In 2010, the Unified Government issued new STAR bonds for a major multi-sport complex project. The Series 2010B bonds are subordinate to the outstanding 2005 2nd Lien Turbo Bonds. The 2005 bonds must be repaid prior to any payments being made with respect to the 2010B bonds. Additionally,
Year ended December 31,
Claims and Judgments
Unfunded Pension Obligation
Section 108 Loan
Principal Interest 2011 $ 1,675,000 $ 41,563 $ 289,000 $ 74,791 2012 - 38,654 310,000 71,152 2013 - 35,948 331,000 68,486 2014 - 33,432 355,000 64,050 2015 - 31,091 379,000 57,660 2016-2020 - 124,465 1,650,000 125,124Total $ 1,675,000 $ 305,153 $ 3,314,000 $ 461,263

48
pledged tax revenues for the 2010B bonds include only such state sales tax revenues collected by the State of Kansas and distributed on or before January 31, 2021. The amount of general state tax revenues that can be applied to the payment of the 2010B bonds is capped at $144,500,000. After applying $144,500,000 of payments to the 2010B bonds, the accreted value of any remaining 2010B bonds can be paid solely from the Unified Government’s local sales and transient guest taxes located within the District.
Description and Purpose
Amount of Original Issue*
Range of Final Maturity
Dates
Range of Interest Rates
Amount Outstanding Dec 31, 2010
1999 KISC bonds $ 6,804,116 2007-2027 4.20-5.25% $ 6,242,451 2001 Project Area B bonds 8,026,200 2007-2020 4.00-5.10% 5,450,200 2004 Refunding 1,528,800 2007-2020 3.25-5.54% 1,290,800 2005 2nd Lien Turbo Bonds 48,727,000 2014-2020 4.75-5.00% 30,252,600 2010B Bonds 42,081,057 2021 6.07% 42,081,057Total $ 107,167,173 $ 85,317,108
* Amount includes only the estimated 28% of the total bond issue which will be repaid through local sales taxes generated
within the redevelopment district. Annual debt service requirements to maturity for these bonds are as follows:
Year ended December 31, Principal Interest 2011 $ 708,028 $ 2,166,721 2012 747,349 2,147,587 2013 790,749 2,131,260 2014 839,109 2,110,048 2015 888,047 2,091,904 2016-2020 35,608,973 7,920,033 2021-2025 44,315,631 41,277,097 2026-2028 1,419,222 1,667,978 Total $ 85,317,108 $ 61,512,628
The 2005 and 2010B bonds have “Turbo Redemption” provisions. Pledged tax revenues received in excess of amounts required for mandatory debt service payments or for various reserve account requirements will be used to redeem the bonds early. It is therefore expected that payment in full of principal on these bond series will be made earlier than their respective maturity dates.

49
Transportation Development District Sales Tax Revenue Bonds. The Unified Government has created two transportation development districts under K.S.A. 12-14,140 through 12-17,149. Under statute, creation of such districts allows the Government to impose a transportation development district sales tax, not to exceed 1%, with the revenues received therefrom pledged to pay bonds issued for projects within the established districts. Bonds issued under these statutes are special, limited obligations of the Unified Government, payable solely from revenues generated within the transportation development districts. The bonds do not constitute a pledge of the full faith and credit of the Unified Government, and do not obligate the Unified Government to levy any form of taxation or to make any appropriation for their payment. For the Legnds bonds, in October 2010, $273,028 was transferred from the debt service reserve fund to the debt service fund, to supplement for the shortfall in the debt service fund for the October 1, 2010 debt service payment.
Description and Purpose
Amount of Original Issue
Range of Final Maturity
Dates
Range of Interest Rates
Amount Outstanding Dec 31, 2008
2007 The Legends $ 17,520,000 2007-2028 4.60-4.875% $ 15,915,000 2007 NFM/Cabela’s 2,415,000 2007-2027 5.0% 1,775,000 2008 Prescott Plaza 2,000,000 2008-2011 5.5% 1,940,000 2009 Happy Foods 400,000 2009-2014 6.5% 379,000 Total $ 22,335,000 $ 20,009,000
Annual debt service requirements to maturity for these bonds are as follows:
Year ended December 31, Principal Interest 2011 $ 2,415,000 $ 957,673 2012 520,000 861,939 2013 575,000 837,469 2014 964,000 797,529 2015 675,000 755,831 2016-2020 4,370,000 3,236,615 2021-2025 6,415,000 1,978,825 2026-2028 4,075,000 389,269 Total $ 20,009,000 $ 9,815,150
Pledged Revenues. The Unified Government has pledged specific revenue streams to secure the repayment of certain outstanding debt issues. The corresponding debt issues are for projects described previously for Sales Tax Limited Obligation (STAR) Bonds and Transportation Development District (TDD) Sales Tax Revenue Bonds, as well as general obligation bonds issued to finance infrastructure and capital improvements in tax increment financing (TIF) districts. The following table lists those revenues and the corresponding debt issues, the amount and term of the pledge remaining, the current fiscal year principal and interest on the debt, the amount of pledged revenue recognized during the current fiscal year, and the approximate percentage of the revenue stream that has been committed:

50
Issue(s)
Type revenue pledged
Amount of pledge
Term of commitment
Percent
of revenue pledged
Principal & Interest for
2010
Pledged revenues
recognized in 2010
STAR bonds
Sales and transient guest tax
$146,829,736
Through 2027
100% $13,839,663 $13,529,636
TDD bonds
Transportation development district sales tax
29,824,149 Through 2028
100% 1,587,321 1,653,312
TIF GO bonds
Incremental increase in property tax
49,542,627 Through 2030
100% 1,497,660 1,482,871
Proprietary Fund Revenue Bonds. At December 31, 2010, the various proprietary funds had the following bonds outstanding:
Description and Purpose
Amount of Original Issue
Range of Final Maturity
Dates
Range of Interest Rates
Amount Outstanding Dec 31, 2010
Sewer System State Revolving Loan $ 13,816,268 2018 3.39-3.44% $ 12,570,320 Subtotal 13,816,268 12,570,320 BPU revenue bonds: 1998 Series 81,375,000 2028 4.00-5.25% 21,820,000 2001 Series 17,170,000 2021 4.00-5.95% 11,895,000 2004B Series 115,535,000 2032 3.00-5.00% 109,790,000 2004 Refunding 126,005,000 2023 5.60-5.65% 123,390,000 2009A Series 57,575,000 2034 4.73-5.30% 56,345,000 2010 Refunding 32,190,000 2028 4.40-4.72% 32,190,000 Subtotal 429,850,000 355,430,000 Total $ 443,666,268 $ 368,000,320
The revenue bond ordinances of the BPU require, among other things, that special reserves and accounts be established and maintained. Additionally, the ordinances require the BPU to establish rates and collect charges sufficient to pay the operating, maintenance and debt service costs of the utilities and to provide net operating income, before depreciation and payment in lieu of taxes, of at least 120% of the maximum annual debt service due on the outstanding bonds of the BPU. All of the BPU's utility plant facilities are pledged under the terms of the ordinances. The BPU was in compliance with the above requirements as of December 31, 2010. The Unified Government has entered into four agreements with the State of Kansas, Department of Health and Environment. These agreements resulted in the State loaning money to the Unified Government’s Water Pollution Control Division for the purpose of capital expenditures to improve the sewer system. Advances are made at the time for paying costs related to the approved loan. The State and Unified Government agreed on an amortization schedule for the entire amount of the loans. If the final loan amount is less than the approved total, an amended amortization schedule will be developed. The following chart represents the adopted amortization schedule and is not reflective of the amount actually borrowed and outstanding to date. The BPU also has a loan with the Kansas Department of Health and Environment for the purpose of capital improvements to be repaid over 20 years ending 2027.
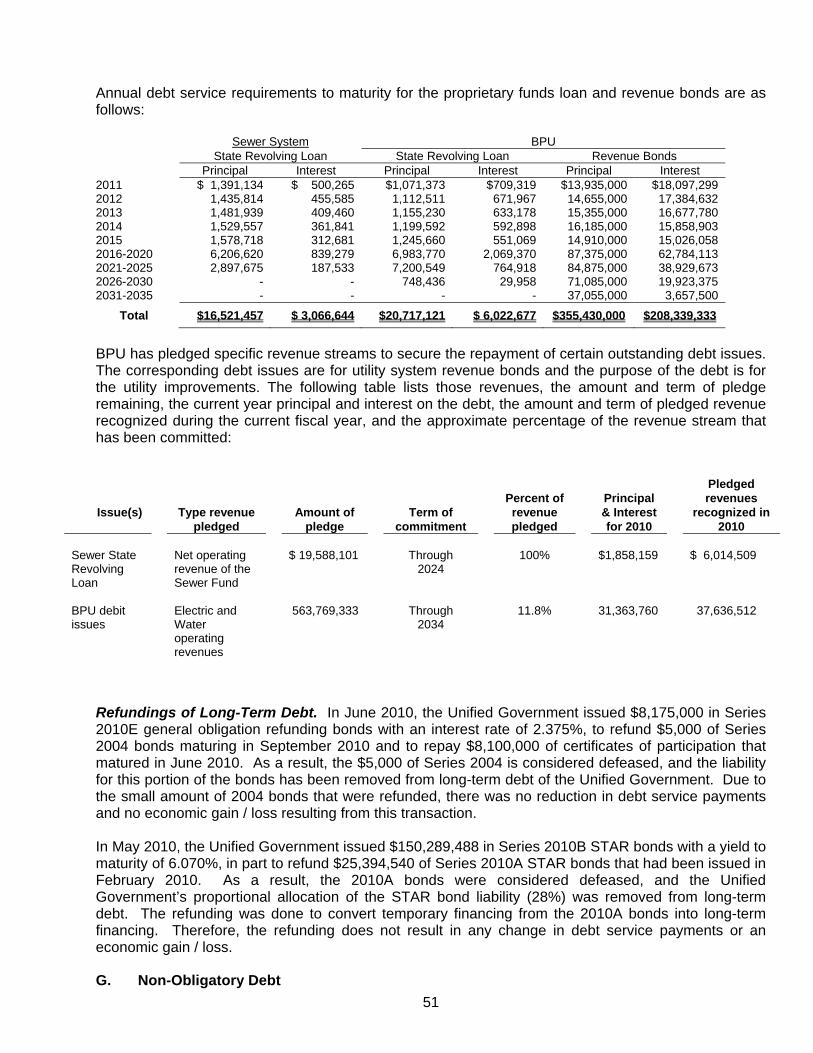
51
Annual debt service requirements to maturity for the proprietary funds loan and revenue bonds are as follows: Sewer System BPU State Revolving Loan State Revolving Loan Revenue Bonds
Principal Interest Principal Interest Principal Interest 2011 $ 1,391,134 $ 500,265 $1,071,373 $709,319 $13,935,000 $18,097,299 2012 1,435,814 455,585 1,112,511 671,967 14,655,000 17,384,632 2013 1,481,939 409,460 1,155,230 633,178 15,355,000 16,677,780 2014 1,529,557 361,841 1,199,592 592,898 16,185,000 15,858,903 2015 1,578,718 312,681 1,245,660 551,069 14,910,000 15,026,058 2016-2020 6,206,620 839,279 6,983,770 2,069,370 87,375,000 62,784,113 2021-2025 2,897,675 187,533 7,200,549 764,918 84,875,000 38,929,673 2026-2030 - - 748,436 29,958 71,085,000 19,923,375 2031-2035 - - - - 37,055,000 3,657,500
Total $16,521,457 $ 3,066,644 $20,717,121 $ 6,022,677 $355,430,000 $208,339,333
BPU has pledged specific revenue streams to secure the repayment of certain outstanding debt issues. The corresponding debt issues are for utility system revenue bonds and the purpose of the debt is for the utility improvements. The following table lists those revenues, the amount and term of pledge remaining, the current year principal and interest on the debt, the amount and term of pledged revenue recognized during the current fiscal year, and the approximate percentage of the revenue stream that has been committed:
Issue(s)
Type revenue pledged
Amount of pledge
Term of commitment
Percent of revenue pledged
Principal & Interest for 2010
Pledged revenues
recognized in 2010
Sewer State Revolving Loan
Net operating revenue of the Sewer Fund
$ 19,588,101 Through 2024
100% $1,858,159 $ 6,014,509
BPU debit issues
Electric and Water operating revenues
563,769,333 Through 2034
11.8% 31,363,760 37,636,512
Refundings of Long-Term Debt. In June 2010, the Unified Government issued $8,175,000 in Series 2010E general obligation refunding bonds with an interest rate of 2.375%, to refund $5,000 of Series 2004 bonds maturing in September 2010 and to repay $8,100,000 of certificates of participation that matured in June 2010. As a result, the $5,000 of Series 2004 is considered defeased, and the liability for this portion of the bonds has been removed from long-term debt of the Unified Government. Due to the small amount of 2004 bonds that were refunded, there was no reduction in debt service payments and no economic gain / loss resulting from this transaction. In May 2010, the Unified Government issued $150,289,488 in Series 2010B STAR bonds with a yield to maturity of 6.070%, in part to refund $25,394,540 of Series 2010A STAR bonds that had been issued in February 2010. As a result, the 2010A bonds were considered defeased, and the Unified Government’s proportional allocation of the STAR bond liability (28%) was removed from long-term debt. The refunding was done to convert temporary financing from the 2010A bonds into long-term financing. Therefore, the refunding does not result in any change in debt service payments or an economic gain / loss.
G. Non-Obligatory Debt

52
Conduit Debt. The Unified Government has issued revenue bonds not directly obligated by the Unified Government which are generally used to finance construction or renovation of facilities on government land or the acquisition of equipment. The bonds are paid solely from revenues generated from entities for whom the bonds are issued. The total amount at December 31, 2010 was $605,312,999 for the Industrial Revenue Bonds, $219,386,848 for Sales Tax Special Obligation Revenue Bonds, $528,776,057 for the Single Family and Collateralized Mortgage Revenue Bonds, and $21,360,000 for Multifamily Housing Revenue Bonds. These bonds do not constitute an indebtedness or pledge of the faith and credit of the Unified Government, and accordingly have not been reported in the accompanying financial statements.
H. Landfill Closure and Postclosure Care
In 2004, the Kansas Department of Health and Environment (KDHE) issued an administrative “Order to Comply” to the Unified Government alleging the need for investigations into the alleged release of hazardous substances found to exist at the John Garland Park Landfill, which was operated from 1972-1974 by a third party and has been closed since then. The Unified Government conducted, with KDHE approval, certain investigations and conducted or prepared work plans for conducting in the future, certain remedial activities. In March 2008, the Unified Government and KDHE entered into a Consent Agreement requiring certain landfill closure activities, including annual landfill cap maintenance, periodic groundwater monitoring through the year 2025, and conversion of an existing passive landfill gas extraction system to an active gas extraction system. The Unified Government has recorded a liability of $1,200,000 as the estimated cost for the new gas extraction system and monitoring activities through 2025. The cost estimates are subject to change due to inflation, deflation, technology, laws and regulations. The Solid Waste Fund will provide the primary source of funding for these costs.
I. Termination Benefits
During 2009, the Unified Government adopted a retirement incentive program to reduce its workforce. This was done as a cost saving measure in response to the decline in the economy. Eligible employees were given (1) additional accumulated sick leave ranging from 5 to 25 days depending on the date of retirement and whether such time was already accumulated in their sick leave bank, and (2) the option to participate in medical insurance until age 65 with the Unified Government paying 50-100% of the premium depending on the type of coverage selected. Employees could also elect a one-time cash bonus payment ranging from $500 to $7,500 for waiver of the health premium. The cost of the benefits paid in 2010 was $3,730,480.
J. Restricted assets
The balances of the restricted asset accounts are as follows:
General fund: master leases Capital projects fund: STAR bonds Capital projects fund: GO proceeds Nonmajor governmental funds: STAR/TDD bonds Customer deposits-BPU
$ 1,314,365 19,023,164 8,267,120
12,397,859 3,345,723
Revenue Bonds: State Revolving Loan 2,642,603 BPU revenue bonds: Debt service account Improvement and emergency account Contruction funds
14,919,883 1,500,000 34,560,938
Total restricted assets $97,971,655

53
IV. OTHER INFORMATION
A. Risk Management
The Unified Government's insurance coverage consists of both self-insurance and policies maintained with various carriers. Exposure to various risks associated primarily with weather related incidents such as wind, hail and storm damage is covered by property insurance. There have been no settlements in excess of insurance coverage during any of the prior three fiscal years. There has been no significant change in insurance coverage from the previous fiscal year. Accident and Health. The Unified Government is both self-insured and fully insured for accident and health claims. Claims for Unified Government employees (except for BPU employees) are administered through a third party administrator for the Unified Government’s self-insured plan. Premiums are paid by employer and employee contributions into an internal service fund and are available to pay claims and costs of an administrative service agreement. An excess insurance policy covers individual claims in excess of $190,000. Incurred but not reported claims of $1,598,000 have been accrued as a liability. In 2010, $23,844,642 was paid for claims and administrative costs. The outstanding claims liability is calculated from historical data and future expectations. This includes an estimated liability for known claims as well as an estimated liability for claims incurred but not reported. The BPU is self-insured on essentially up to 100% of their health claims. Workers' Compensation. The Unified Government is self-insured for workers' compensation. Premiums are paid from the general fund into an internal service fund and available to pay claims, claim reserves and administrative costs of the program. During 2010, a total of $1,651,616 was paid in benefits and administrative costs from the fund. An excess coverage insurance policy covers individual claims in excess of $750,000. Incurred but not reported claims of $4,712,000 have been accrued as a liability. The Unified Government attorney makes significant estimates in determining amounts of unsettled claims under the self-insurance program. The outstanding claims liability is calculated from historical data and future expectations. This includes an estimated liability for known claims as well as an estimated liability for claims incurred but not reported. The BPU is self-insured to the first $350,000 per employee / per occurrence for workers' compensation. Claims exceeding $350,000 and up to $35,000,000 per employee / per occurrence are fully insured. General Liability. The Unified Government is also self-insured for liability claims with no premium paid to any insuring firm. All liability claims are reviewed, challenged if appropriate, and processed for payment at the agreed amount by the Legal Department. Kansas statutes limit the liability in tort cases to $500,000. The following is a summary of the changes in the unpaid claims liability:
Workers’ Compensation
Health Insurance
General Liability
BPU
December 31, 2008 Liability Balances
$ 5,590,000 $ 2,001,000 $ 960,000 $ 2,005,478
Claims and changes in estimates 426,180 26,425,207 371,225 11,602,768
Claim payments (2,004,180) (26,610,207) (371,225) (11,214,246) December 31, 2009 Liability Balances
$ 4,012,000 $ 1,816,000 $ 960,000 $ 2,394,000
Claims and changes in estimates 2,351,616 23,626,642 1,296,894 9,954,275
Claim payments (1,651,616) (23,844,642) (581,894) (9,488,275)
December 31, 2010 Liability Balances
$ 4,712,000 $ 1,598,000 $ 1,675,000 $ 2,860,000
54
B. Commitments and Contingent Liabilities
Litigation. The Unified Government is a defendant in various legal actions pending or in process for tax appeals, property damage and miscellaneous claims. The ultimate liability that might result from the final resolution of the above matters is not presently determinable. Management and the Unified Government's counsel are of the opinion that the final outcome of the cases will not have an adverse material effect on the Unified Government's financial statements. The United States, on behalf of the United States Environmental Protection Agency, contends that it has a cause of action pursuant to the Clean Water Act, 33 U.S.C. §§ 1251, et seq., against the Unified Government for violations regarding the Unified Government’s combined and sanitary sewer systems and municipal separate storm sewer system. Remediation of these combined systems is required, and penalties may be assessed. The Unified Government is currently in negotiations with the federal government to make appropriate modifications to its sanitary sewer and storm sewer systems, and has been replacing sections of those systems on an annual basis for a number of years. Such activities will continue until all systems are modified as required. While future costs are not readily estimable at this point in time, costs are expected to be in the multi-million dollar range. Once the terms are agreed upon with the federal government, user rates will be adjusted to pay for the cost or improvements over a multi-year period. Under Kansas statutes, should the courts sustain any of the litigation against the Unified Government, the Government may issue no-fund warrants to cover any resulting over-expenditures not anticipated in the current year budget. The Unified Government is then required to levy sufficient ad valorem property taxes in the first levying period following issuance to retire such warrants. This tax levy is without limitation. In March 2008, a grand jury commenced in Wyandotte County, Kansas as a result of a citizen initiative. The citizen initiative alleges BPU and certain of its managers have misspent public funds among other matters. The grand jury’s term expired on September 5, 2008. Management and the Board cooperated with the grand jury. Two indictments were returned on October 3, 2008.
Subsequent to the issuance of the indictments, motions seeking dismissal of the case were made by the defense and granted by the Court. One defendant has subsequently died and an appeal of the dismissal remains pending. No liability is expected to accrue to the BPU. Health Insurance Contributions. During 2009 and 2010, the Unified Government suspended making certain employer contributions to the Self-Insured Health Care Fund from the County General Fund. For the years ended December 31, 2010 and 2009, the cumulative amount of employer contributions that were not budgeted or paid totaled approximately $2.8 million. As of December 31, 2010, the governing body and management have not made a formal commitment to fund these payments in future years, and there is no requirement that these amounts must be paid to the Self-Insured Health Care Fund. However, the amount is monitored and reviewed on an annual basis, and considered when preparing the County General Fund’s budget. Redevelopment District Projects. In connection with the Prairie Delaware Redevelopment District projects (see Note III.F.), $14,000,000 from the Cabelas bonds was used for construction of a movie theatre, which is owned by the Unified Government. The Unified Government has a lease agreement with Cabela’s to lease the real property related to the theatre. Under the agreement, “Special Basic Rent” of $6,500,000 is to be paid by the Unified Government, commencing in November 2002 at an interest rate of 7.266% over a 20 year period. Funding for the payments will come solely from amounts received by the Unified Government under a rate agreement entered into with the BPU on qualifying projects developed within the District. During 2010, there were no such revenues generated under the BPU rate agreements, and so the Unified Government did not make any payments to Cabelas under the lease agreement. Future payments are
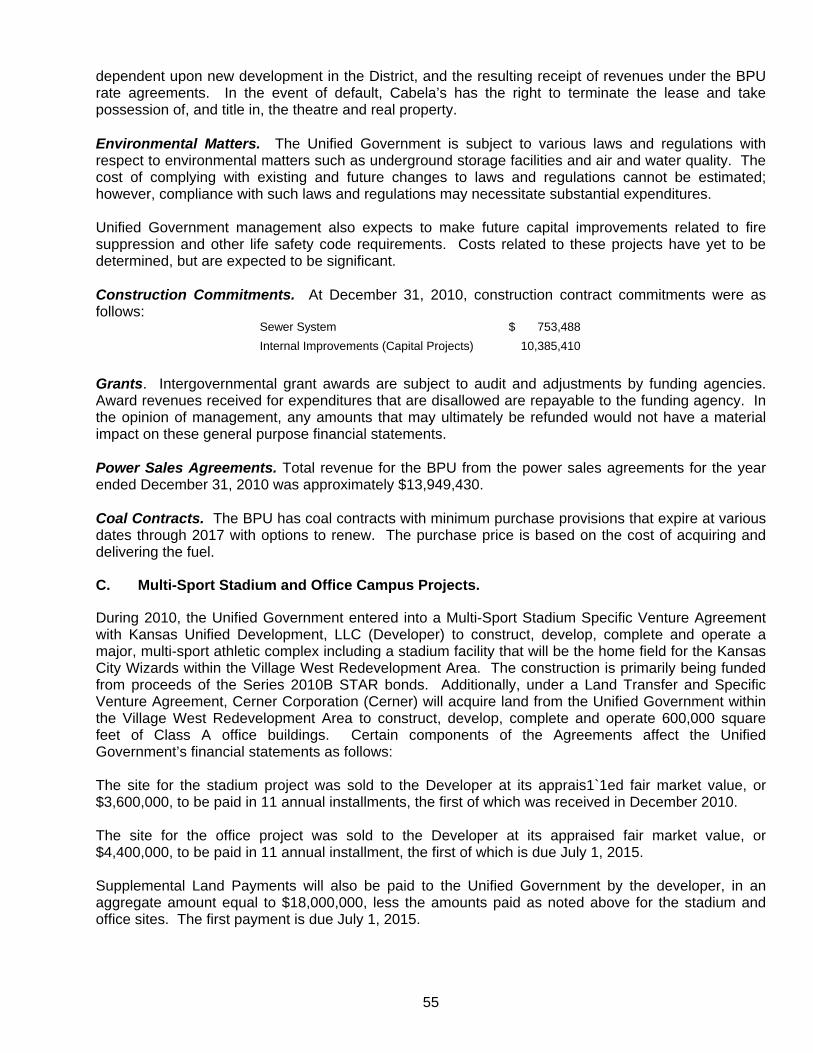
55
dependent upon new development in the District, and the resulting receipt of revenues under the BPU rate agreements. In the event of default, Cabela’s has the right to terminate the lease and take possession of, and title in, the theatre and real property. Environmental Matters. The Unified Government is subject to various laws and regulations with respect to environmental matters such as underground storage facilities and air and water quality. The cost of complying with existing and future changes to laws and regulations cannot be estimated; however, compliance with such laws and regulations may necessitate substantial expenditures. Unified Government management also expects to make future capital improvements related to fire suppression and other life safety code requirements. Costs related to these projects have yet to be determined, but are expected to be significant. Construction Commitments. At December 31, 2010, construction contract commitments were as follows:
Sewer System $ 753,488 Internal Improvements (Capital Projects) 10,385,410
Grants. Intergovernmental grant awards are subject to audit and adjustments by funding agencies. Award revenues received for expenditures that are disallowed are repayable to the funding agency. In the opinion of management, any amounts that may ultimately be refunded would not have a material impact on these general purpose financial statements. Power Sales Agreements. Total revenue for the BPU from the power sales agreements for the year ended December 31, 2010 was approximately $13,949,430. Coal Contracts. The BPU has coal contracts with minimum purchase provisions that expire at various dates through 2017 with options to renew. The purchase price is based on the cost of acquiring and delivering the fuel.
C. Multi-Sport Stadium and Office Campus Projects.
During 2010, the Unified Government entered into a Multi-Sport Stadium Specific Venture Agreement with Kansas Unified Development, LLC (Developer) to construct, develop, complete and operate a major, multi-sport athletic complex including a stadium facility that will be the home field for the Kansas City Wizards within the Village West Redevelopment Area. The construction is primarily being funded from proceeds of the Series 2010B STAR bonds. Additionally, under a Land Transfer and Specific Venture Agreement, Cerner Corporation (Cerner) will acquire land from the Unified Government within the Village West Redevelopment Area to construct, develop, complete and operate 600,000 square feet of Class A office buildings. Certain components of the Agreements affect the Unified Government’s financial statements as follows: The site for the stadium project was sold to the Developer at its apprais1`1ed fair market value, or $3,600,000, to be paid in 11 annual installments, the first of which was received in December 2010. The site for the office project was sold to the Developer at its appraised fair market value, or $4,400,000, to be paid in 11 annual installment, the first of which is due July 1, 2015. Supplemental Land Payments will also be paid to the Unified Government by the developer, in an aggregate amount equal to $18,000,000, less the amounts paid as noted above for the stadium and office sites. The first payment is due July 1, 2015.
56
As of December 31, 2010, a note receivable for $17,454,545 has been recorded for all of the above payments, net of a discount of $6,495,285. Revenue related to these land sales is recorded as a Special Item on the Statement of Activities. The agreement with Cerner imposes obligations on Cerner regarding construction of the office project and the creation of jobs. In the event that certain of the payroll and job creation obligations of the agreement are not met, the Developer has an obligation to pay the Unified Government an “Office Payment Obligation” as defined in the Multi-Sport Stadium Specific Venture Agreement. This obligation totals $30,410,610 (payable in 10 equal installments from 2017 to 2026). This amount has not been recorded as a receivable in the Unified Government’s financial statements as of December 31, 2010, as it is not yet determinable whether Cerner will meet the payroll and job creation obligations. Payments owed to the Unified Government by the Developer as outlined above are guaranteed by the entity that owns the Kansas City Wizards, as well as five individual guarantors who have control voting rights to a majority of the outstanding stock of the Developer and the entity that owns the Kansas City Wizards.
D. Jointly governed organization
KCK Hotel Group, L.L.C. – The Unified Government is one of three parties who have invested in the KCK Hotel Group, L.L.C. (KCK Hotel), which is responsible for the development, ownership and operation of a downtown hotel, civic center and related facilities including an office building, garage and adjoining common areas. The Unified Government contributed $5,000,000, mostly from an Empowerment Zone Grant from the Federal government, to obtain a 49.95% membership interest in KCK Hotel. The Unified Government also provided a $6,040,000 loan to KCK Hotel, financed by a Section 108 loan from the U.S. Department of Housing and Urban Development. The loan agreement with KCK Hotel was entered into in February 2001, and calls for a repayment schedule based on a 25-year amortization, with a balloon payment at the end of 20 years. The agreement provides credits of $200,000 per year for 10 years. Beginning in 2003 and continuing through 2012, the Unified Government is also providing debt service credits for 85% of the real estate taxes paid by the hotel. Both credits effectively reduce the amount of the loan that the Unified Government can expect to be repaid. Therefore due to this, and past operating performance of the hotel, at December 31, 2008 the loan receivable from KCK Hotel was written down to $0 reflect the estimated loan payments to be collected over the term of the loan. The other two members in KCK Hotel contributed funding in accordance with the memorandum of understanding, and one also acts as the manager of KCK Hotel. Gross receipts from hotel operations are used first for payment of operating expenses, then to fund an equipment reserve, and finally for debt service requirements on the loan with the Unified Government. KCK Hotel members receive distributions on their ownership interests only after all other payment requirements have been met. In May 2004, the members of KCK Hotel entered into a new funding agreement to provide additional infusions of funds to the hotel. The Unified Government has paid debt service payments for the KCK Hotel’s Home Rule Bonds since December 2004. Similar additional advances may be required in future years. In 2009, the remaining balance of the Home Rule Bonds was refinanced with temporary notes issued by the Unified Government, which are included in the balance of temporary notes on the governmental funds balance sheet. Because KCK Hotel is a separate legal entity controlled by its three members, it is considered a joint venture under accounting principles generally accepted in the United States of America. The Unified Government’s $230,421 investment in this joint venture is recorded as a “net investment in joint venture”. Separately issued financial statements for the joint venture are available from the Unified Government at 701 North 7th Street, Kansas City, KS 66101
57
E. Employee retirement systems and pension plans
There are five contributory defined benefit retirement plans covering substantially all of its employees. The Unified Government was required to make contributions to four of the plans for the year ended December 31, 2010. KPERS and KP&F. Plan description. The Unified Government participates in the Kansas Public Employees Retirement System (KPERS) and the Kansas Police and Firemen's Retirement System (KP&F). Both are part of a cost-sharing multiple-employer defined benefit pension plan as provided by K.S.A. 74-4901, et.seq. KPERS and KP&F provide retirement benefits, life insurance, disability income benefits, and death benefits. Kansas law establishes and amends benefit provisions. KPERS and KP&F issue a publicly available financial report that includes financial statements and required supplementary information. Those reports may be obtained by writing to KPERS (611 S. Kansas Avenue, Suite 100; Topeka, KS 66603-3803) or by calling 1-800-275-5737. Funding Policy. K.S.A. 74-4919 law establishes the KPERS member-employee contribution rates. Effective July 1, 2009 KPERS has two benefit structures and funding depends on whether the employee is a Tier 1 or Tier 2 member. Tier 1 members are active and contributing members hired before July 1, 2009. Tier 2 members were first employed in a covered position on or after July 1, 2009. The KPERS member-employee contribution rates are 4% of covered salary for Tier 1 members and 6% of covered salary for Tier 2 members. K.S.A. 74-4975 establishes KP&F member-employee contribution rate at 7% of covered salary. The employer collects and remits member-employee contributions according to the provisions of section 414(h) of the Internal Revenue Code. State law provides that the employer contribution rates be determined annually based on the results of an annual actuarial valuation. KPERS and KP&F are funded on an actuarial reserve basis. State law sets a limitation on annual increases in the employer contribution rates. The KPERS employer rate established by statute for 2010 was 7.14%. The Unified Government's contributions to KPERS for the years ending December 31, 2010, 2009, and 2008 were $4,088,923, $3,730,995, and $3,591,442 respectively, equal to the statutory required contributions for each year. The KP&F uniform participating employer rate established for fiscal years beginning in 2010 is 12.86% for Sheriff’s department personnel and 15.09% for Police and Fire department personnel. Employers participating in KP&F also make contributions to amortize the liability for past service costs, if any, which is determined separately for each participating employer. The Unified Government's contributions to KP&F for the years ending December 31, 2010, 2009, and 2008, were $8,861,752, $8,708,397, and $8,373,447, respectively, equal to the statutory required contributions for each year. BPU Plan. Plan Description. The Employees’ Retirement Pension Plan (the Plan) of the BPU is a single employer, contributory defined benefit pension plan. The Plan issues a publicly available financial report that includes financial statements and required supplementary information. This report may be obtained from the Board of the Pension Trustees of the Employees’ Retirement Pension Plan (Board). The Plan is governed by State Statutes which in essence provide for the establishment of a Board of Pension Trustees and provides authorization for the Plan to take control and custody of all assets, property, and funds presently held, controlled, and in the possession of the Plan’s Board of Pension Trustees. The BPU does not act in a fiduciary or trustee capacity for the Plan and, as such, the Plan’s financial activities are not reported in the BPU combined financial statements. The BPU’s total payroll for the year ended December 31, 2010 was approximately $49,254,000 of which approximately $48,886,000 was payroll of Plan participants. BPU employees who retire at or after age 55 are entitled to an annual retirement benefit, payable monthly for life, in an amount equal to 2.2% of their average salary multiplied by the years of credited service through December 31, 2003, and 1.8% of their average salary multiplied by the years of credited service after December 31, 2003. On January 1 of each year after retirement, the monthly benefit is increased by 3%, prorated for the number of months in the first retirement year. The Plan also provides death benefits. The benefit provisions and all other requirements are established by State Statutes.
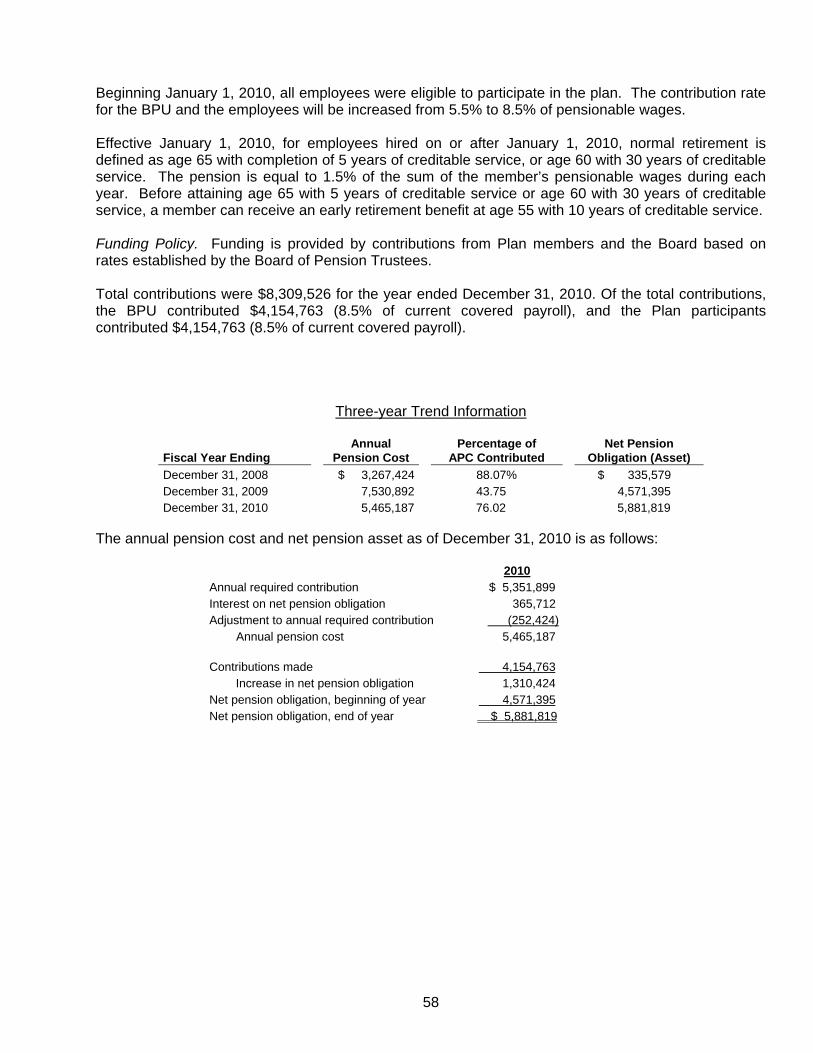
58
Beginning January 1, 2010, all employees were eligible to participate in the plan. The contribution rate for the BPU and the employees will be increased from 5.5% to 8.5% of pensionable wages. Effective January 1, 2010, for employees hired on or after January 1, 2010, normal retirement is defined as age 65 with completion of 5 years of creditable service, or age 60 with 30 years of creditable service. The pension is equal to 1.5% of the sum of the member’s pensionable wages during each year. Before attaining age 65 with 5 years of creditable service or age 60 with 30 years of creditable service, a member can receive an early retirement benefit at age 55 with 10 years of creditable service. Funding Policy. Funding is provided by contributions from Plan members and the Board based on rates established by the Board of Pension Trustees. Total contributions were $8,309,526 for the year ended December 31, 2010. Of the total contributions, the BPU contributed $4,154,763 (8.5% of current covered payroll), and the Plan participants contributed $4,154,763 (8.5% of current covered payroll).
Three-year Trend Information
Fiscal Year Ending Annual
Pension Cost Percentage of
APC Contributed Net Pension
Obligation (Asset) December 31, 2008 $ 3,267,424 88.07% $ 335,579 December 31, 2009 7,530,892 43.75 4,571,395 December 31, 2010 5,465,187 76.02 5,881,819
The annual pension cost and net pension asset as of December 31, 2010 is as follows:
2010 Annual required contribution $ 5,351,899 Interest on net pension obligation 365,712 Adjustment to annual required contribution (252,424) Annual pension cost 5,465,187 Contributions made 4,154,763 Increase in net pension obligation 1,310,424 Net pension obligation, beginning of year 4,571,395 Net pension obligation, end of year $ 5,881,819

59
The information presented in the required supplemental information was determined as part of the actuarial valuations as of the dates indicated. Additional information as of the latest actuarial valuation follows:
Valuation date January 1, 2010 Actuarial cost method Entry age Amortization method Level percent closed Remaining amortization period 30 years Asset valuation method Average adjusted asset method Actuarial assumptions: Investment rate of return Inflation rate assumption
8.00% 3.25%
Projected salary increase based on age: Age Salary Scale 25 6.5% 70 4.5%
Funding Status and Funding Progress
The funding progress schedule as of January 1, 2010, 2009, and 2008 is as follows (dollars are in millions):
Actuarial Unfunded UAAL as a Actuarial accrued (overfunded) percentage
Actuarial valuation value of liability Funded AAL Covered of covered date, January 1 assets (AAL) ratio (UAAL) payroll payroll 2008 $ 444.0 $ 405.1 109.6% $(38.9) 47.4 (82.1)% 2009 410.9 432.8 94.9 21.9 50.1 43.7 2010 427.6 448.6 95.3 21.0 49.4 42.5
Actuarial Methods and Assumptions
An asset smoothing method is used in the actuarial valuation process. Gains/losses on the market value of assets are recognized equally over an eight year period. Gains and losses are calculated based on the excess/ (shortfall) of the actual market value of assets compared to the expected value of assets, had the actuarial assumed rate been met exactly.
The plan is funded through equal BPU Board and member contributions for future service benefits.
The balance of the actuarial present value of service retirement pensions, plus death benefits and termination benefits to the level of employee contributions, plus an allowance for expenses is funded through future BPU Board and member contributions related to annual compensation. The actuarial contribution rate for these benefits is funded by the entry age method.
In addition to depending upon the actuarial method used, actuarial cost estimates depend to an important degree on the assumptions made relative to various occurrences, such as rate of expected investment earnings by the fund, rates of mortality among active and retired employees and rates of termination from employment.
The schedule of funding progress, presented as required supplmentary information following the notes to the financial statements, presents multiyear trend information about whether the actuarial value of plan assets is increasing or decreasing over time relative to the actuarial accrued liabilties for benefits.
60
Unified Government Plan. In 1962, certain individuals elected not to participate in KPERS. Currently, there are 2 remaining retirees or their spouses receiving benefits under the prior plan maintained by the Unified Government. There are no employees contributing to the plan. The most recent actuarial study was prepared in 1998 and estimated total payments for 2011 through 2030 to be approximately $305,153. The Unified Government has made no provision to fund these payments but includes an estimate of the annual expense in the general fund budget. Payments made to plan retirees for the year ended December 31, 2010 were $38,366. This future payable is included with long-term debt.
F. Other Postemployment Benefits Other Than Pensions
1. UG Plan. Plan Description. The Unified Government sponsors a single-employer defined benefit healthcare plan that offers lifetime benefits to retirees and their dependents including medical, dental and vision. Retiree health care coverage to age 65 is mandated under Kansas Statute 12-5040. The UG also offers coverage past age 65 that is secondary to Medicare. Retired employees who do not meet the following employer paid retiree coverage criteria may elect to continue coverage at the retired employee’s own expense. Employees must qualify for “unreduced” retirement under either KPERS or KP&F. Also, coverage due to disability retirement is available for qualifying individuals at any age who meet the requirements of KPERS or KP&F. A retiree may not enroll in medical coverage after once declining coverage. Dental and vision coverage are available each open enrollment whether or not a prior declination has occurred. Additionally, employees that elected to retire under an early retirement offer receive direct subsidies off of the normal retiree premium rate to age 65. This direct subsidy ended for anyone not electing retirement by January 31, 2010. Employees not receiving a subsidy are required to pay blended premium rates to maintain coverage. The Plan does not issue separate financial statements. Funding Policy GASB Statement 45 does not require the funding of the OPEB liability. Medical and dental benefits are self-funded with a stop-loss for medical. The funding policy of the UG is to pay claims, administrative costs and stop-loss premiums as they are due through an internal service fund. This arrangement does not qualify as an “OPEB Plan” under GASB 45 requirements and thus cannot be treated as holding assets for GASB reporting. Unless an early retirement direct subsidy applies, participants must contribute full blended premiums to maintain coverage. The full premium amounts (on a monthly basis) that applied for 2010 ranged from $325 to $441, depending on retiree age and marital status. Retirees who meet stipulated age and service criteria receive a subsidy off the full premiums. The subsidy applies to retiree medical coverage to age 65. It does not apply to dental or vision, nor does it apply to dependent coverage except when a qualifying retiree elects the 50%-family paid option. Other subsidy levels include the 75%-single paid and 100%-single paid options. The subsidy is not available to employees terminating due to disability retirement. The subsidy for pre-65 medical coverage ended for those eligible employees not electing retirement by January 31, 2010. Annual OPEB Cost and Net OPEB Obligation The Unified Government’s annual OPEB cost (expense) is calculated based on the annual required contribution of the employer (ARC), an amount actuarially determined in accordance with the parameters of GASB Statement 45. The ARC represents a level of funding that, if paid on an ongoing basis, is projected to cover normal cost each year and amortize any unfunded actuarial liabilities over a
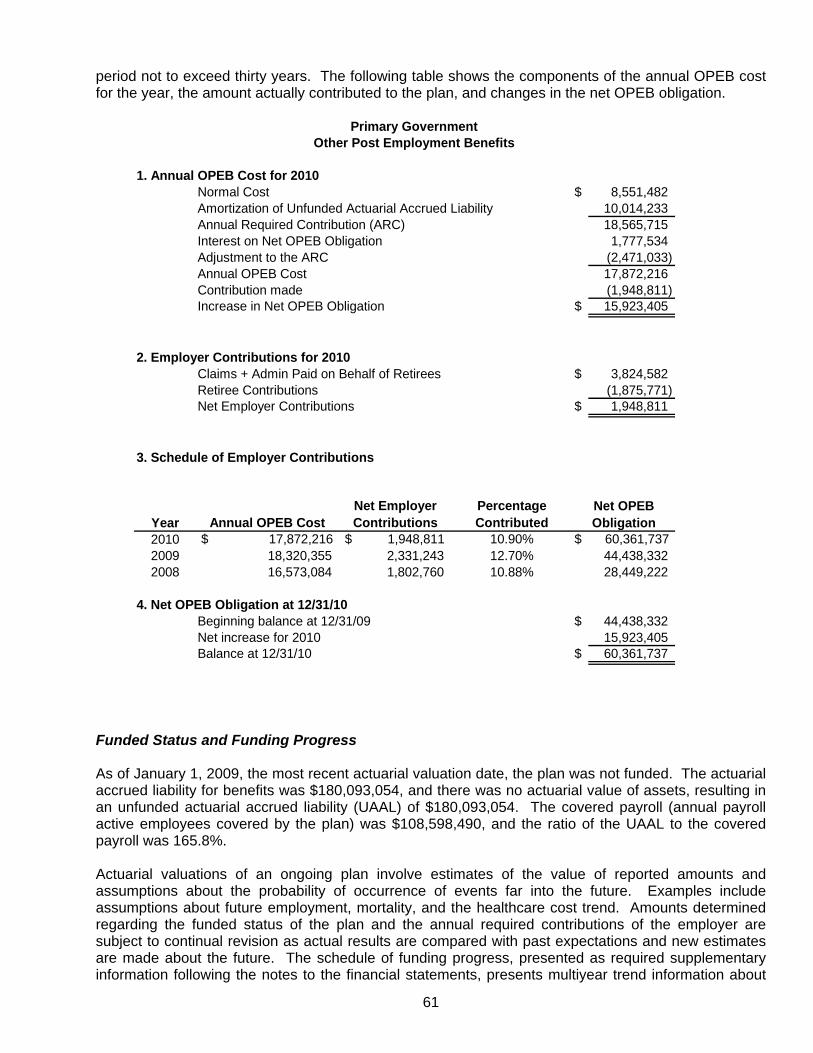
61
period not to exceed thirty years. The following table shows the components of the annual OPEB cost for the year, the amount actually contributed to the plan, and changes in the net OPEB obligation.
1. Annual OPEB Cost for 2010Normal Cost $ 8,551,482Amortization of Unfunded Actuarial Accrued Liability 10,014,233Annual Required Contribution (ARC) 18,565,715Interest on Net OPEB Obligation 1,777,534Adjustment to the ARC (2,471,033)Annual OPEB Cost 17,872,216Contribution made (1,948,811)Increase in Net OPEB Obligation $ 15,923,405
2. Employer Contributions for 2010Claims + Admin Paid on Behalf of Retirees $ 3,824,582Retiree Contributions (1,875,771)Net Employer Contributions $ 1,948,811
3. Schedule of Employer Contributions
Year Annual OPEB CostNet Employer Contributions
Percentage Contributed
2010 $ 17,872,216 $ 1,948,811 10.90% $ 60,361,737 2009 18,320,355 2,331,243 12.70%2008 16,573,084 1,802,760 10.88%
4. Net OPEB Obligation at 12/31/10Beginning balance at 12/31/09 $ 44,438,332Net increase for 2010 15,923,405Balance at 12/31/10 $ 60,361,737
28,449,222
Primary GovernmentOther Post Employment Benefits
Net OPEB Obligation
44,438,332
Funded Status and Funding Progress As of January 1, 2009, the most recent actuarial valuation date, the plan was not funded. The actuarial accrued liability for benefits was $180,093,054, and there was no actuarial value of assets, resulting in an unfunded actuarial accrued liability (UAAL) of $180,093,054. The covered payroll (annual payroll active employees covered by the plan) was $108,598,490, and the ratio of the UAAL to the covered payroll was 165.8%. Actuarial valuations of an ongoing plan involve estimates of the value of reported amounts and assumptions about the probability of occurrence of events far into the future. Examples include assumptions about future employment, mortality, and the healthcare cost trend. Amounts determined regarding the funded status of the plan and the annual required contributions of the employer are subject to continual revision as actual results are compared with past expectations and new estimates are made about the future. The schedule of funding progress, presented as required supplementary information following the notes to the financial statements, presents multiyear trend information about
62
whether the actuarial value of plan assets is increasing or decreasing over time relative to the actuarial accrued liabilities for benefits. Actuarial Methods and Assumptions Projections of benefits for financial reporting purposes are based on the substantive plan (the plan as understood by the employer and the plan members) and include the types of benefits provided at the time of each valuation and the historical pattern of sharing of benefit costs between the employer and plan members to that point. The actuarial methods and assumptions include techniques that are designed to reduce the effects of short-term volatility in actuarial accrued liabilities and the actuarial value of assets, consistent with the long-term perspective of the calculations. In the January 1, 2009 actuarial valuation, the projected unit credit actuarial cost method was used. The actuarial assumptions included a 4.0% investment rate of return, which is a blended rate of the expected long-term investment returns on the employer’s own investments, calculated based on the funded level of the plan at the valuation date. Other assumptions included an annual healthcare cost trend rate of 10.0% initially, reduced by decrements to an ultimate rate of 5.5% after ten years. The UAAL is being amortized in level dollar amounts on an open basis over thirty years. The remaining amortization period at December 31, 2010 was 26 years. The following are the major assumption changes in the January 1, 2009 actuarial valuation since the last valuation date: a) the healthcare trend rate noted above was previously 9% initially, reduced by decrements to an ultimate rate of 6.0% after seven years, b) partipants electing coverage due to disability retirement are assumed to cost 1.5 times greater than non-disabled retirees, c) the turnover rates and retirement age assumptions were updated to reflect the latest statistics from KPERS and KP&F pension valuations, and d) the assumed portion of future retirees with a covered spouse was lowered from 50% to 40%. 2. BPU Plan. Plan Description. The BPU provides certain postemployment health care and life insurance benefits to eligible retirees and their dependents in accordance with provisions established by the BPU’s Board. The plan is a single-employer defined benefit healthcare plan administered by the BPU. The plan does not issue separate financial statements. Employees are given a 90-day window to retire with medical coverage at ages 55 and above with 7 consecutive years of service. The retiree plan is a comprehensive major medical plan with a $100 deductible per individual or $200 per family. For individuals, the plan pays 80% of the next $12,500 of allowable charges and 100% thereafter for the remainder of that calander year. For families, the plan pays 80% of the next $25,000 of allowable charges and 100% thereafter for the remainder of that calendar year. The plan has a lifetime maximum of $750,000. Benefits cease at the first of the month that the retired employee attains age 65 or death. Spouse benefits end at the first of the month that the retired employee attains age 65, the end of the month of the retiree’s death, or the spouse’s date of death. Retirees are not required to contribute toward the cost of the postretirement benefits. There were 470 participants eligible to receive benefits under this plan as of December 31, 2010. Funding Policy The contribution requirements of plan members and the BPU are established and can be amended by the BPU’s Board. Contributions are made to the plan based on a pay-as-you-go basis. For the year ended December 31, 2010, the BPU paid $3,232,258 for retirees. Annual OPEB Cost and Net OPEB Obligation The BPU’s annual OPEB expense is calculated based on the annual required contribution of the employer (ARC), an amount actuarially determined in accordance with the parameters of GASB
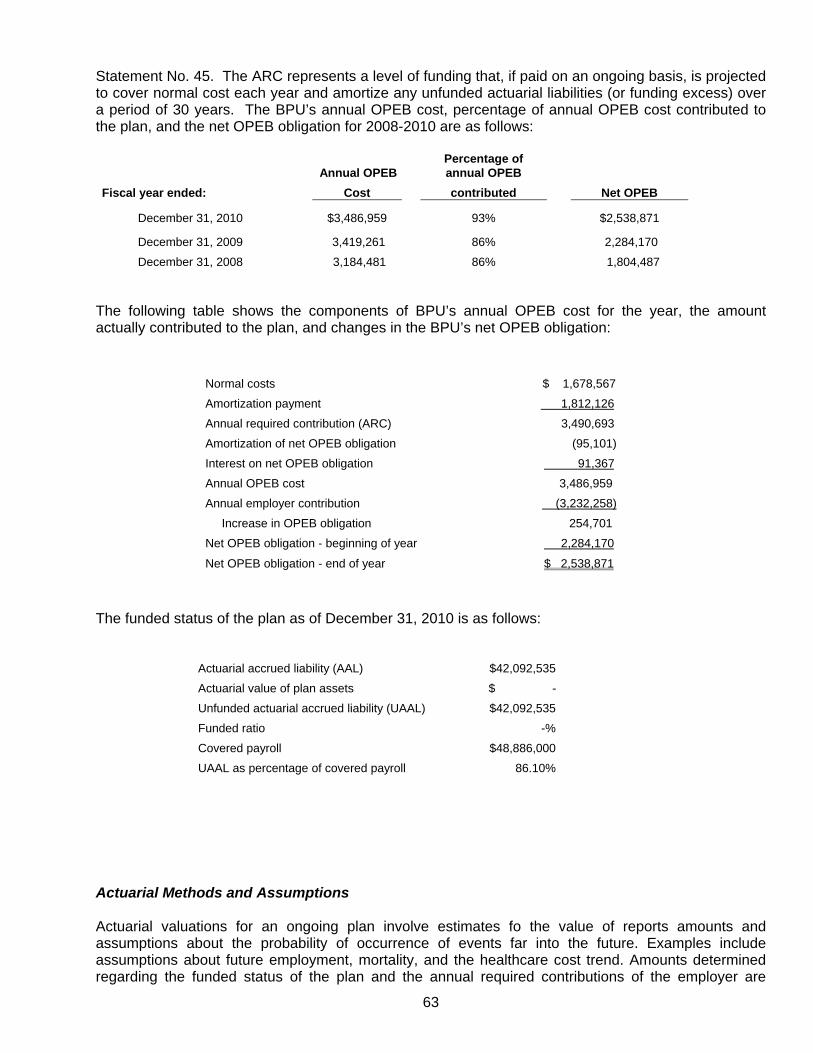
63
Statement No. 45. The ARC represents a level of funding that, if paid on an ongoing basis, is projected to cover normal cost each year and amortize any unfunded actuarial liabilities (or funding excess) over a period of 30 years. The BPU’s annual OPEB cost, percentage of annual OPEB cost contributed to the plan, and the net OPEB obligation for 2008-2010 are as follows:
Annual OPEB Percentage of annual OPEB
Fiscal year ended: Cost contributed Net OPEB
December 31, 2010 $3,486,959 93% $2,538,871
December 31, 2009 3,419,261 86% 2,284,170 December 31, 2008 3,184,481 86% 1,804,487
The following table shows the components of BPU’s annual OPEB cost for the year, the amount actually contributed to the plan, and changes in the BPU’s net OPEB obligation:
Normal costs $ 1,678,567
Amortization payment 1,812,126
Annual required contribution (ARC) 3,490,693
Amortization of net OPEB obligation (95,101)
Interest on net OPEB obligation 91,367
Annual OPEB cost 3,486,959
Annual employer contribution (3,232,258)
Increase in OPEB obligation 254,701
Net OPEB obligation - beginning of year 2,284,170
Net OPEB obligation - end of year $ 2,538,871
The funded status of the plan as of December 31, 2010 is as follows:
Actuarial accrued liability (AAL) $42,092,535 Actuarial value of plan assets $ - Unfunded actuarial accrued liability (UAAL) $42,092,535 Funded ratio -% Covered payroll $48,886,000 UAAL as percentage of covered payroll 86.10%
Actuarial Methods and Assumptions Actuarial valuations for an ongoing plan involve estimates fo the value of reports amounts and assumptions about the probability of occurrence of events far into the future. Examples include assumptions about future employment, mortality, and the healthcare cost trend. Amounts determined regarding the funded status of the plan and the annual required contributions of the employer are
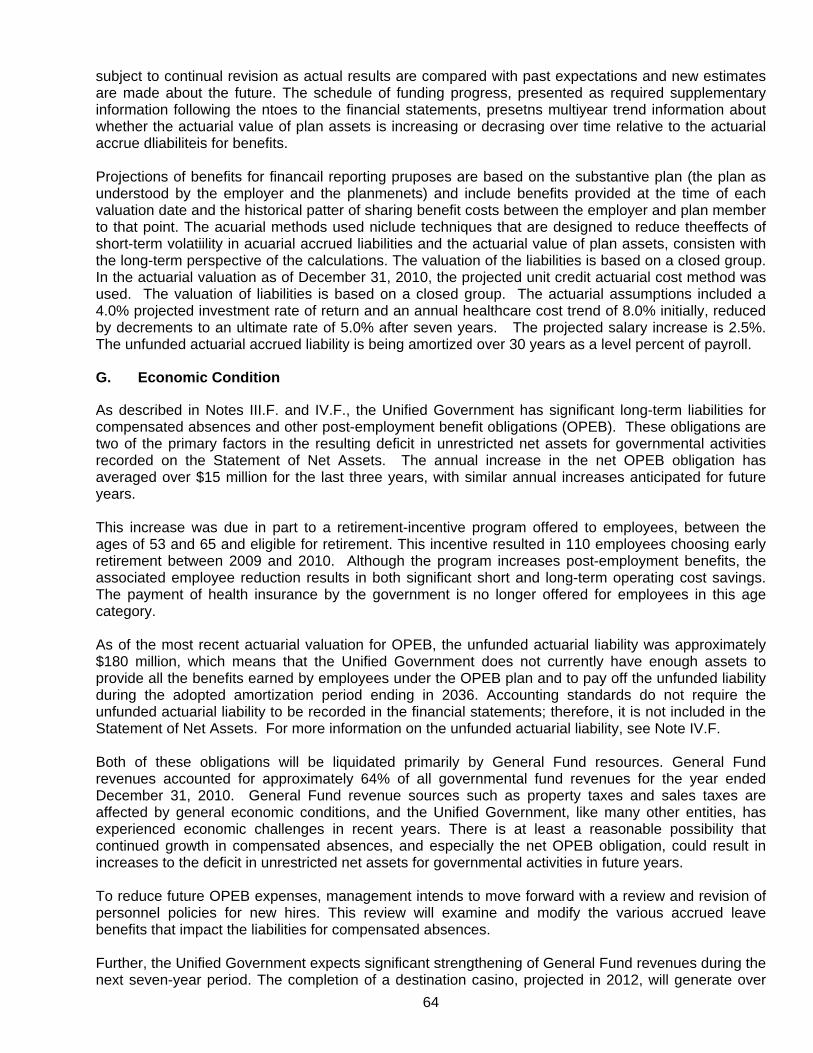
64
subject to continual revision as actual results are compared with past expectations and new estimates are made about the future. The schedule of funding progress, presented as required supplementary information following the ntoes to the financial statements, presetns multiyear trend information about whether the actuarial value of plan assets is increasing or decrasing over time relative to the actuarial accrue dliabiliteis for benefits. Projections of benefits for financail reporting pruposes are based on the substantive plan (the plan as understood by the employer and the planmenets) and include benefits provided at the time of each valuation date and the historical patter of sharing benefit costs between the employer and plan member to that point. The acuarial methods used niclude techniques that are designed to reduce theeffects of short-term volatiility in acuarial accrued liabilities and the actuarial value of plan assets, consisten with the long-term perspective of the calculations. The valuation of the liabilities is based on a closed group. In the actuarial valuation as of December 31, 2010, the projected unit credit actuarial cost method was used. The valuation of liabilities is based on a closed group. The actuarial assumptions included a 4.0% projected investment rate of return and an annual healthcare cost trend of 8.0% initially, reduced by decrements to an ultimate rate of 5.0% after seven years. The projected salary increase is 2.5%. The unfunded actuarial accrued liability is being amortized over 30 years as a level percent of payroll.
G. Economic Condition
As described in Notes III.F. and IV.F., the Unified Government has significant long-term liabilities for compensated absences and other post-employment benefit obligations (OPEB). These obligations are two of the primary factors in the resulting deficit in unrestricted net assets for governmental activities recorded on the Statement of Net Assets. The annual increase in the net OPEB obligation has averaged over $15 million for the last three years, with similar annual increases anticipated for future years. This increase was due in part to a retirement-incentive program offered to employees, between the ages of 53 and 65 and eligible for retirement. This incentive resulted in 110 employees choosing early retirement between 2009 and 2010. Although the program increases post-employment benefits, the associated employee reduction results in both significant short and long-term operating cost savings. The payment of health insurance by the government is no longer offered for employees in this age category. As of the most recent actuarial valuation for OPEB, the unfunded actuarial liability was approximately $180 million, which means that the Unified Government does not currently have enough assets to provide all the benefits earned by employees under the OPEB plan and to pay off the unfunded liability during the adopted amortization period ending in 2036. Accounting standards do not require the unfunded actuarial liability to be recorded in the financial statements; therefore, it is not included in the Statement of Net Assets. For more information on the unfunded actuarial liability, see Note IV.F. Both of these obligations will be liquidated primarily by General Fund resources. General Fund revenues accounted for approximately 64% of all governmental fund revenues for the year ended December 31, 2010. General Fund revenue sources such as property taxes and sales taxes are affected by general economic conditions, and the Unified Government, like many other entities, has experienced economic challenges in recent years. There is at least a reasonable possibility that continued growth in compensated absences, and especially the net OPEB obligation, could result in increases to the deficit in unrestricted net assets for governmental activities in future years. To reduce future OPEB expenses, management intends to move forward with a review and revision of personnel policies for new hires. This review will examine and modify the various accrued leave benefits that impact the liabilities for compensated absences. Further, the Unified Government expects significant strengthening of General Fund revenues during the next seven-year period. The completion of a destination casino, projected in 2012, will generate over

65
$7 million dollars in various tax revenues on an annual basis. The expected retirement of STAR bonds, currently projected in 2017, will increase local sales tax revenues by approximately $12-$15 million annually.
H. Subsequent Events
In February of 2011, the Unified Government issued $18,500,000 in general obligation improvement bonds (Series 2011-A); $645,000 in tax-exempt general obligation improvement bonds (Series 2011-B, County capital projects); and $2,570,000 taxable general obligation improvement bonds. Series 2010 A, a 20-year issue, had yields ranging from 0.8% to 4.85% with an overall rate of 4.3%. Series 2010-B was a 5-year issue with yields ranging from 1% to 2.5%, with an overall interest rate of 2.2%. Series C is a 15-year issue with yields ranging from 1.1% to 5.5%, and having an overall interest rate of 4.7%. Also in February of 2011, the government issued $40,470,000 of tax–exempt temporary notes (Series 2011-I) with a maturity of March 1, 2012 at an interest rate of 0.4%. The final February 2011 financing was a taxable series of temporary notes (Series 2011-II), with a March 1st 2012 maturity, for $3,020,000 with a yield of 1%. In May of 2011 two additional temporary note financings were concluded. Series 2011-III is a 2-year taxable financing for $4,315,000 with a true interest cost 1.1%. Series 2011-IV is a short-term financing for $360,000 that matures on March 1st of 2012 at an interest rate of 0.4%. Two final financings for the Unified Government were completed in May of this year. The first was a 5-year lease for $1,240,000 for theater equipment upgrades at a fixed rate of 4.5%. The second is a 4-year refinance of the Prescott TDD for $1,930,000 with a fixed 4% interest rate. In May 2011, the Unified Government issued $90 million in utility system improvement and refunding revenue bonds (Series 2011-A) for the Board of Public Utilities, with yields ranging 0.9% to 5.2% over a 25-year period. The final true interest cost for this issue was 4.6%. This financing includes $82 million for environmental upgrades and the installation of advanced meter reading and infrastructure for both electric and water utilities. The financing also included $8 million in refunding of 1998 Utility System improvement bonds. In May 2011, the BPU plans to issue approximately $82 million of bonds to finance improvements primarily for environmental upgrades to existing power generation stations and installations of automated meter reading (AMR) and Advanced Metering Infrastructure (AMI) for both electric and water utilities. This debt is estimated to have an average copuon interest rate of 5.09% and is expected to be repayable through 2036. Also, BPU expects to issue approximately $8 million of bonds to refund maturities of the outstanding 1998 Utility System Improvement revenue bonds.
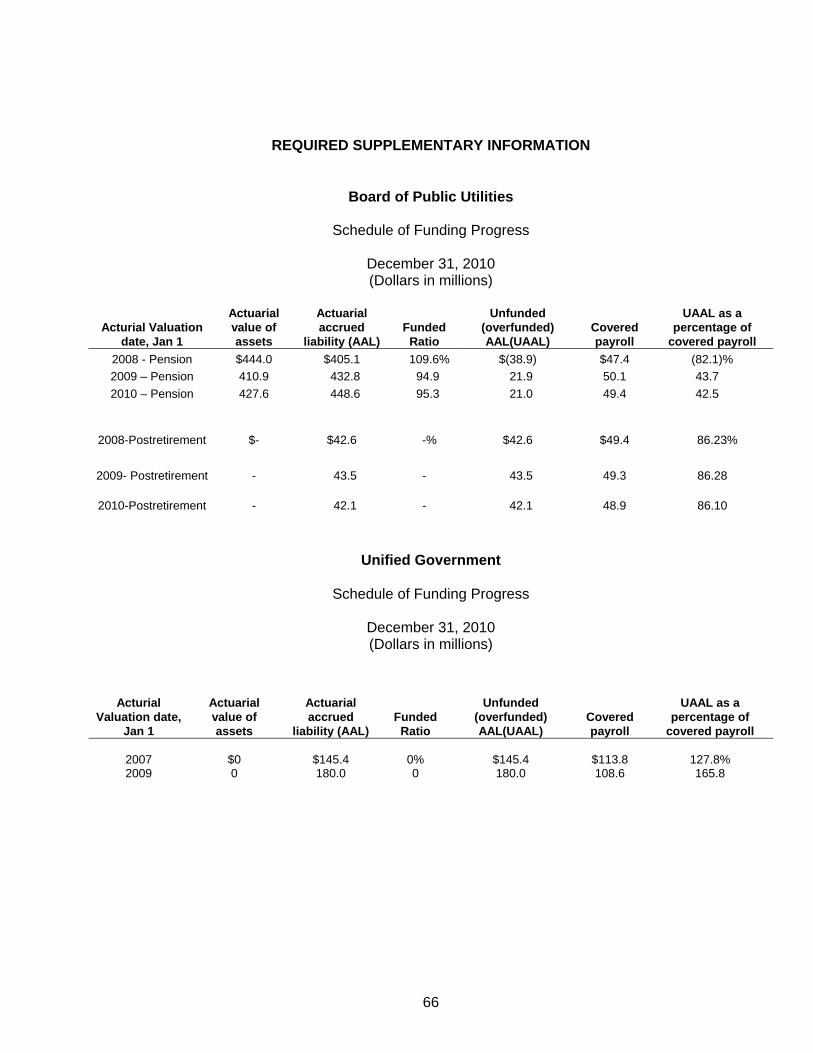
66
REQUIRED SUPPLEMENTARY INFORMATION
Board of Public Utilities
Schedule of Funding Progress
December 31, 2010 (Dollars in millions)
Acturial Valuation date, Jan 1
Actuarial value of assets
Actuarial accrued
liability (AAL) Funded
Ratio
Unfunded (overfunded) AAL(UAAL)
Covered payroll
UAAL as a percentage of
covered payroll 2008 - Pension $444.0 $405.1 109.6% $(38.9) $47.4 (82.1)% 2009 – Pension 410.9 432.8 94.9 21.9 50.1 43.7 2010 – Pension 427.6 448.6 95.3 21.0 49.4 42.5
2008-Postretirement
$-
$42.6
-%
$42.6
$49.4
86.23%
2009- Postretirement - 43.5 - 43.5 49.3 86.28
2010-Postretirement - 42.1 - 42.1 48.9 86.10
Unified Government
Schedule of Funding Progress
December 31, 2010 (Dollars in millions)
Acturial Valuation date,
Jan 1
Actuarial value of assets
Actuarial accrued
liability (AAL) Funded
Ratio
Unfunded (overfunded) AAL(UAAL)
Covered payroll
UAAL as a percentage of
covered payroll
2007
$0
$145.4
0%
$145.4
$113.8
127.8% 2009 0 180.0 0 180.0 108.6 165.8
UNIFIED GOVERNMENT OF WYANDOTTE COUNTY/KANSAS CITY, KANSAS COMPREHENSIVE ANNUAL FINANCIAL REPORT For the year ended DECEMBER 31, 2010
67
GOVERNMENTAL FUNDS
The General Fund is the principal operating fund containing all activity not required to be reported in a separate fund. This fund accounts for revenues and expenses that were formally City and County operations. Revenues are received from taxes, fees, intergovernmental revenue, rents and other sources. Expenses support general operations including court programs, public safety, public works, facilities maintenance, economic development and administrative functions. Financing for the purchase of capital equipment and projects not debt financed are also included. The Capital Projects Fund is funded almost entirely by the issuance of debt and only incidentally from reimbursements and transfers in from other funds. Expenses are tracked by projects which usually are construction/reconstruction but also include settlement of claims which are financed by debt. Statements for these major governmental funds are included in the Basic Financial Statements found in the Financial Section of this document. A comparative budgetary schedule of the General Fund is presented here. As a legal operating budget for the Capital Projects Fund is not required, a budgetary schedule is not included in this document.
NONMAJOR GOVERNMENTAL FUNDS
Special Revenue Funds: The primary source of revenue of these funds is governmental allocations or special taxes. The Appraisal Fund provides support of activities related to evaluating and assigning market valuation to all property within Wyandotte County in accordance with Kansas State Statutes. The American Recovery & Reinvestment Act Fund, commonly referred to as the “Stimulus Act” is a Federal government initiative to stimulate the United States economy through grants from across the spectrum of Federal government agencies. Public Safety, Public Works, Transportation and Community Development are the largest areas of funding to the Unified Government, but grant opportunities span virtually every area of Unified Government business. The Arts Grants Fund expends funding for arts programs and projects that promote appreciation, participation and education provided by the Kaw Valley Arts and Humanities, Inc. and the Children’s Museum. The Auto License Fund operates the Motor Vehicle Department responsible for collection of registration fees, sales taxes, personal property taxes and other fees associated with registration of vehicles as per regulations of the Kansas Department of Revenue. A legal operating budget for this fund is not required; therefore, a budgetary schedule is not included in this document. The Community Development Fund is the Unified Government’s entitlement grant from the U.S. Department of Housing and Urban Development (HUD). Federal regulation requires this fund be used to support services and activities to the benefit of “low and moderate” income households or areas of the city and county requiring special attention. The Court Trustee Fund supports the Court Trustee Office in providing services to children by establishing or enforcing court orders. All generated revenue is used to pay for child support enforcement activities.
UNIFIED GOVERNMENT OF WYANDOTTE COUNTY/KANSAS CITY, KANSAS COMPREHENSIVE ANNUAL FINANCIAL REPORT For the year ended DECEMBER 31, 2010
68
NONMAJOR GOVERNMENTAL FUNDS (continued)
Special Revenue Funds (continued): The Elections Fund, established to account for the administration of community-wide elections in Wyandotte County. The Enhanced Enterprise Loans Fund combines an Economic Development Initiative grant with Section 108 loans to enable commercial investment in a designated zone of the City. A legal operating budget for this fund is not required; therefore, a budgetary schedule is not included in this document. The Extension Council Fund supports administration in providing researched-based information concerning community development, agriculture and economics developed by Kansas State University and reporting problem areas related to these programs back to the University. The Fair Building Fund provides for construction and maintenance of fair association buildings. The Health Department Fund provides funding to support the County Health Department operations and capital expenditures for county health purposes. The Historical Museum Fund accounts for the operations of the Wyandotte County Historical Society and Museum. The Jail Commissary Fund was established to record the sales to inmates of clothing, food and personal products. The Library Fund collects library taxes to support the services of the Kansas City, Kansas Public Library. The Mental Health Fund disburses funds for a variety of community mental health services provided by contracted, nonprofit corporations. The Mental Retardation Fund provides funds to support mental health or mental retardation services. The Parks Fund provides funding for operations, maintenance and recreational activities within county parks. The Register of Deeds Technology Fund, created in 2002 by state statute, is used to account for revenues and expenses received from specified fees charged by the Register of Deeds. Moneys are required to be used “to acquire equipment and technological services for the storing, recording, archiving, retrieving, maintaining and handling of data recorded or stored in the office.” The Special Sales Tax Fund was established on July 1, 2010 to pay for Public Safety Services and Neighborhood Infrastructure. The Public Safety services are provided by the Kansas City, Kansas Police & Fire Departments. The source of revenue is a 10-year 3/8th cent sales tax, which was passed by Kansas City, Kansas voters on April 13, 2010.
UNIFIED GOVERNMENT OF WYANDOTTE COUNTY/KANSAS CITY, KANSAS COMPREHENSIVE ANNUAL FINANCIAL REPORT For the year ended DECEMBER 31, 2010
69
NONMAJOR GOVERNMENTAL FUNDS (continued)
Special Revenue Funds (continued): The Service Program for the Elderly Fund provides services for those citizens age 60 and over such as: senior centers, transportation, education, and health-related concerns. The Soil Conservation Fund establishes moneys to support the activities of the Board of Supervisors of the Conservation District, a self-governed state sub-division administered by a five-member board of elected supervisors. The Solid Waste Fund is used to accumulate resources for future landfill costs. A legal operating budget for this fund is not required; therefore, a budgetary schedule is not included in this document. The Special 911 Tax Fund provides for the purchase of 9-1-1 emergency related equipment and telephone services. Revenues are comprised of monthly service fees collected by the local telephone company and remitted to the Unified Government. The Special Alcohol Programs Fund includes two separate fund programs:
The Special Alcohol Program Grant Program receives its funding from a portion of the Government’s liquor tax moneys. Expenditures are restricted to providing services and/or programs for alcohol abuse prevention, treatment or education. The Alcohol Diversion Program is funded through collection of fines from persons found in violation of driving under the influence of alcohol, K.S.A. 8-1567. Again, expenditures are used to fund community services targeting alcohol related programs.
The Special Grants Fund accounts for grant revenues and related expenditures in the areas of Law Enforcement, Supportive Housing, Aging, Health, Community Correction, District Court, District Attorney, and other grants. A legal operating budget for this fund is not required; therefore, a budgetary schedule is not included in this document. The Special Law Enforcement Fund obtains revenues from drug related court forfeitures and confiscated property. Expenditures are restricted to drug enforcement related programs. The Special Parks and Recreation Fund supports designated park improvement projects. Revenues for this fund are generated from a portion of liquor sales receipts within the Unified Government. The Special Street and Highway Fund finances road improvement, development and maintenance. Revenues are generated primarily from motor fuel taxes collected by the State. The Tourism and Convention Promotion Fund receives its revenue from transient guest taxes levied on hotel and motel lodging within the city. These moneys are apportioned to the Chamber of Commerce, maintenance and repair of the Reardon Civic Center, and a hotel reserve fund for future hotel development.
UNIFIED GOVERNMENT OF WYANDOTTE COUNTY/KANSAS CITY, KANSAS COMPREHENSIVE ANNUAL FINANCIAL REPORT For the year ended DECEMBER 31, 2010
70
Debt Service Funds: The Debt Service Fund, also known as the Bond and Interest Fund, is responsible for servicing the annual principal and interest payments on outstanding debt issued by the Unified Government. These bonds fund major capital improvement and maintenance projects. The primary source of revenue for this fund is from Ad Valorem Property Taxes. Segregation is maintained between debt supported by the boundaries of the City and debt supported by the County-at-large. The Economic Development Sales Tax Fund was established to record debt service payments and revenues related to completed STAR bond and TDD financed projects. Capital Project Fund: The County Initiative to Fund Infrastructure fund finances infrastructure projects that benefit all of the cities in the county.

71
This page intentionally left blank
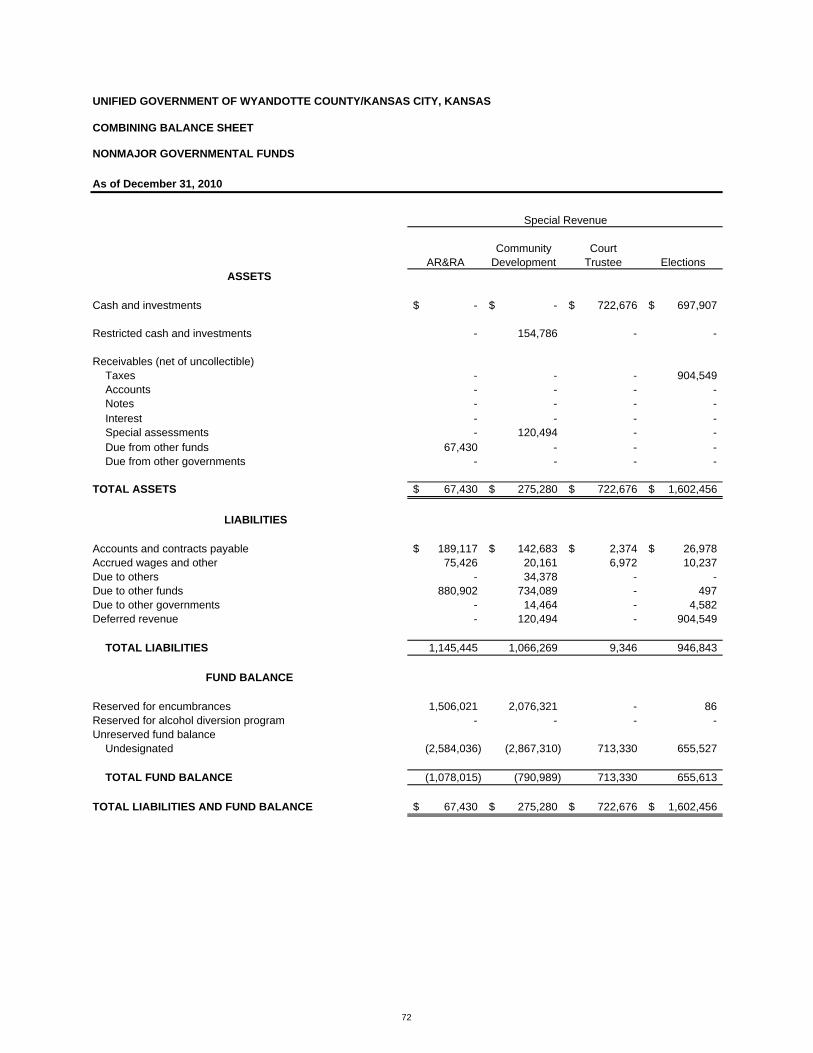
UNIFIED GOVERNMENT OF WYANDOTTE COUNTY/KANSAS CITY, KANSAS
COMBINING BALANCE SHEET
NONMAJOR GOVERNMENTAL FUNDS
As of December 31, 2010
Community CourtAR&RA Development Trustee Elections
ASSETS
Cash and investments -$ -$ 722,676$ 697,907$
Restricted cash and investments - 154,786 - -
Receivables (net of uncollectible)Taxes - - - 904,549 Accounts - - - - Notes - - - - Interest - - - - Special assessments - 120,494 - - Due from other funds 67,430 - - - Due from other governments - - - -
TOTAL ASSETS 67,430$ 275,280$ 722,676$ 1,602,456$
LIABILITIES
Accounts and contracts payable 189,117$ 142,683$ 2,374$ 26,978$ Accrued wages and other 75,426 20,161 6,972 10,237 Due to others - 34,378 - - Due to other funds 880,902 734,089 - 497 Due to other governments - 14,464 - 4,582 Deferred revenue - 120,494 - 904,549
TOTAL LIABILITIES 1,145,445 1,066,269 9,346 946,843
FUND BALANCE
Reserved for encumbrances 1,506,021 2,076,321 - 86 Reserved for alcohol diversion program - - - - Unreserved fund balance
Undesignated (2,584,036) (2,867,310) 713,330 655,527
TOTAL FUND BALANCE (1,078,015) (790,989) 713,330 655,613
TOTAL LIABILITIES AND FUND BALANCE 67,430$ 275,280$ 722,676$ 1,602,456$
Special Revenue
72
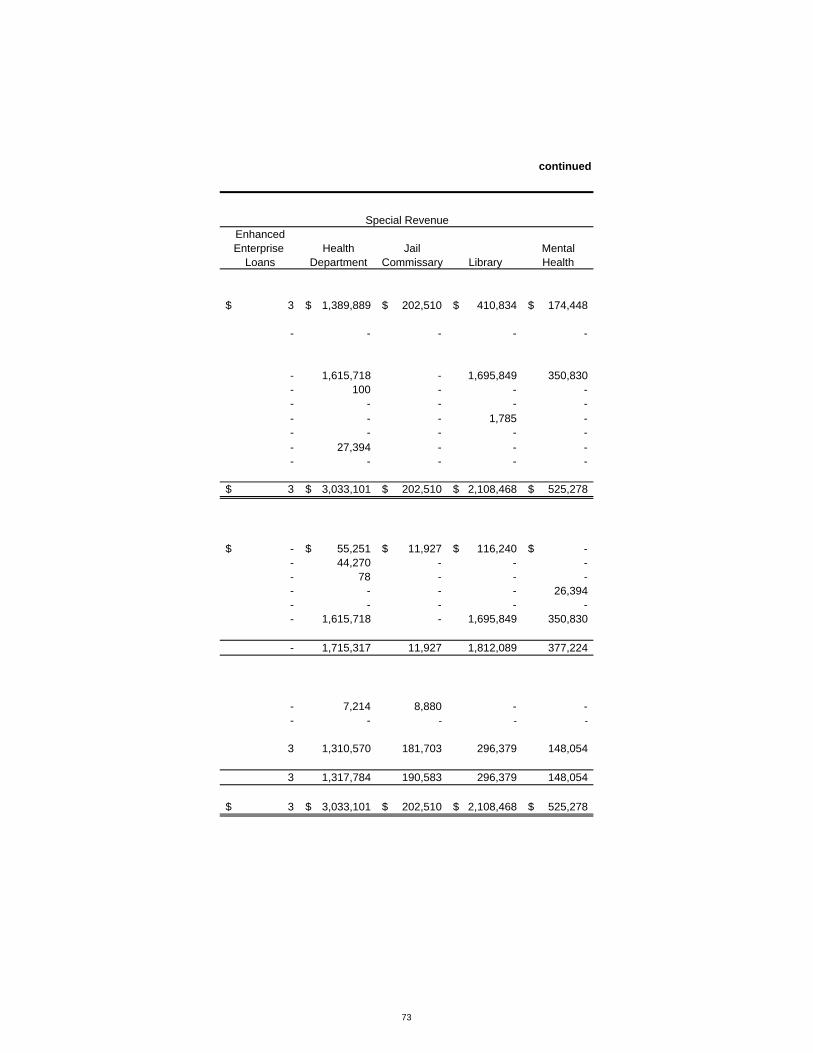
continued
EnhancedEnterprise Health Jail Mental
Loans Department Commissary Library Health
3$ 1,389,889$ 202,510$ 410,834$ 174,448$
- - - - -
- 1,615,718 - 1,695,849 350,830 - 100 - - - - - - - - - - - 1,785 - - - - - - - 27,394 - - - - - - - -
3$ 3,033,101$ 202,510$ 2,108,468$ 525,278$
-$ 55,251$ 11,927$ 116,240$ -$ - 44,270 - - - - 78 - - - - - - - 26,394 - - - - - - 1,615,718 - 1,695,849 350,830
- 1,715,317 11,927 1,812,089 377,224
- 7,214 8,880 - - - - - - -
3 1,310,570 181,703 296,379 148,054
3 1,317,784 190,583 296,379 148,054
3$ 3,033,101$ 202,510$ 2,108,468$ 525,278$
Special Revenue
73

UNIFIED GOVERNMENT OF WYANDOTTE COUNTY/KANSAS CITY, KANSAS
COMBINING BALANCE SHEET
NONMAJOR GOVERNMENTAL FUNDS - continued
As of December 31, 2010
SpecialMental Register of Sales Tax
Retardation Parks Deeds Tech 2010ASSETS
Cash and investments 403,441$ 32,321$ 123,152$ 456,351$
Restricted cash and investments - - - -
Receivables (net of uncollectible)Taxes 331,809 1,547,032 - 940,375 Accounts - 1,975 - - Notes - - 535 - Interest - - - - Special assessments - - - - Due from other funds - - - - Due from other governments - - - -
TOTAL ASSETS 735,250$ 1,581,328$ 123,687$ 1,396,726$
LIABILITIES
Accounts and contracts payable 2,440$ -$ -$ 6,550$ Accrued wages and other 4,303 1,326 - - Due to others - 32,270 - - Due to other funds 263 - - 60,000 Due to other governments - - - - Deferred revenue 331,809 1,547,032 - -
TOTAL LIABILITIES 338,815 1,580,628 - 66,550
FUND BALANCE
Reserved for encumbrances - - 1,869 100,000 Reserved for alcohol diversion program - - - - Unreserved fund balance
Undesignated 396,435 700 121,818 1,230,176
TOTAL FUND BALANCE 396,435 700 123,687 1,330,176
TOTAL LIABILITIES AND FUND BALANCE 735,250$ 1,581,328$ 123,687$ 1,396,726$
Special Revenue
74
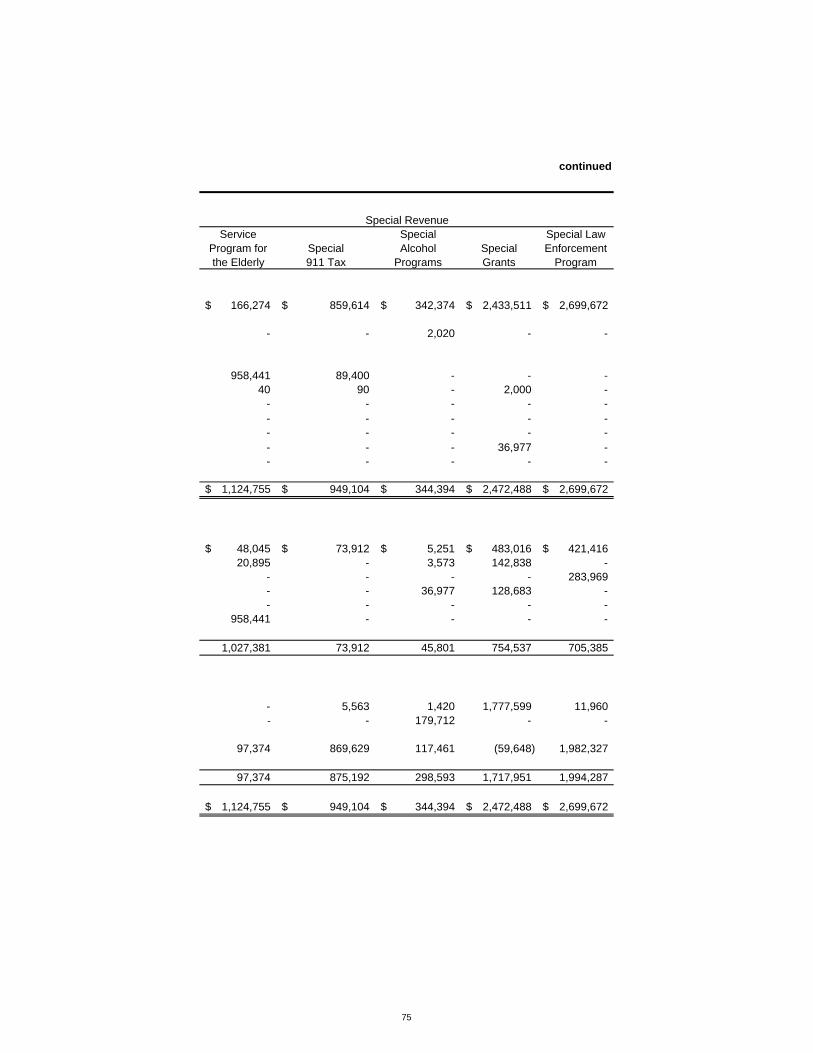
continued
Service Special Special LawProgram for Special Alcohol Special Enforcementthe Elderly 911 Tax Programs Grants Program
166,274$ 859,614$ 342,374$ 2,433,511$ 2,699,672$
- - 2,020 - -
958,441 89,400 - - - 40 90 - 2,000 -
- - - - - - - - - - - - - - - - - - 36,977 - - - - - -
1,124,755$ 949,104$ 344,394$ 2,472,488$ 2,699,672$
48,045$ 73,912$ 5,251$ 483,016$ 421,416$ 20,895 - 3,573 142,838 -
- - - - 283,969 - - 36,977 128,683 - - - - - -
958,441 - - - -
1,027,381 73,912 45,801 754,537 705,385
- 5,563 1,420 1,777,599 11,960 - - 179,712 - -
97,374 869,629 117,461 (59,648) 1,982,327
97,374 875,192 298,593 1,717,951 1,994,287
1,124,755$ 949,104$ 344,394$ 2,472,488$ 2,699,672$
Special Revenue
75

UNIFIED GOVERNMENT OF WYANDOTTE COUNTY/KANSAS CITY, KANSAS
COMBINING BALANCE SHEET
NONMAJOR GOVERNMENTAL FUNDS - continued
As of December 31, 2010
Special Special Tourism andParks and Street and Convention SolidRecreation Highway Program Waste Total
ASSETS
Cash and investments 408,820$ 818,551$ 6,054$ 922,416$ 13,270,818
Restricted cash and investments - - - - 156,806
Receivables (net of uncollectible)Taxes - - - - 8,434,003 Accounts - - - 150,935 155,140 Notes - - - - 535 Interest - - - 4,007 5,792 Special assessments - - - - 120,494 Due from other funds - 59,826 - - 191,627 Due from other governments - - 187,506 - 187,506
TOTAL ASSETS 408,820$ 878,377$ 193,560$ 1,077,358$ 22,522,721$
LIABILITIES
Accounts and contracts payable 22,546$ 118,556$ -$ 597,510$ 2,323,812 Accrued wages and other 3,644 108,491 - - 442,136 Due to others - - - - 350,695 Due to other funds - - - - 1,867,805 Due to other governments - - - - 19,046 Deferred revenue - - - - 7,524,722
TOTAL LIABILITIES 26,190 227,047 - 597,510 12,528,216
FUND BALANCE
Reserved for encumbrances 209,487 336,354 - 480,291 6,523,065 Reserved for alcohol diversion program - - 179,690 - 359,402 Unreserved fund balance
Undesignated 173,143 314,976 13,870 (443) 3,112,038
TOTAL FUND BALANCE 382,630 651,330 193,560 479,848 9,994,505
TOTAL LIABILITIES AND FUND BALANCE 408,820$ 878,377$ 193,560$ 1,077,358$ 22,522,721$
Special Revenue
76
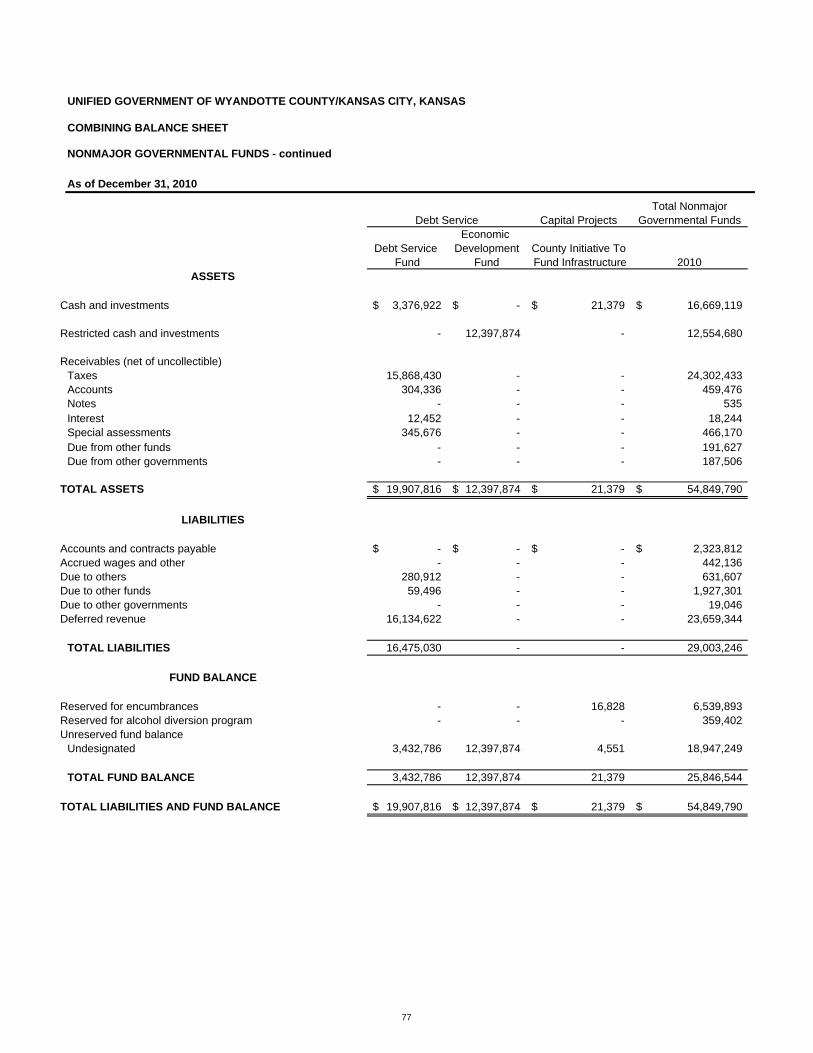
UNIFIED GOVERNMENT OF WYANDOTTE COUNTY/KANSAS CITY, KANSAS
COMBINING BALANCE SHEET
NONMAJOR GOVERNMENTAL FUNDS - continued
As of December 31, 2010
Total NonmajorCapital Projects Governmental Funds
Economic Debt Service Development County Initiative To
Fund Fund Fund Infrastructure 2010ASSETS
Cash and investments 3,376,922$ -$ 21,379$ 16,669,119$
Restricted cash and investments - 12,397,874 - 12,554,680
Receivables (net of uncollectible)Taxes 15,868,430 - - 24,302,433 Accounts 304,336 - - 459,476 Notes - - - 535 Interest 12,452 - - 18,244 Special assessments 345,676 - - 466,170 Due from other funds - - - 191,627 Due from other governments - - - 187,506
TOTAL ASSETS 19,907,816$ 12,397,874$ 21,379$ 54,849,790$
LIABILITIES
Accounts and contracts payable -$ -$ -$ 2,323,812$ Accrued wages and other - - - 442,136 Due to others 280,912 - - 631,607 Due to other funds 59,496 - - 1,927,301 Due to other governments - - - 19,046 Deferred revenue 16,134,622 - - 23,659,344
TOTAL LIABILITIES 16,475,030 - - 29,003,246
FUND BALANCE
Reserved for encumbrances - - 16,828 6,539,893 Reserved for alcohol diversion program - - - 359,402 Unreserved fund balance
Undesignated 3,432,786 12,397,874 4,551 18,947,249
TOTAL FUND BALANCE 3,432,786 12,397,874 21,379 25,846,544
TOTAL LIABILITIES AND FUND BALANCE 19,907,816$ 12,397,874$ 21,379$ 54,849,790$
Debt Service
77
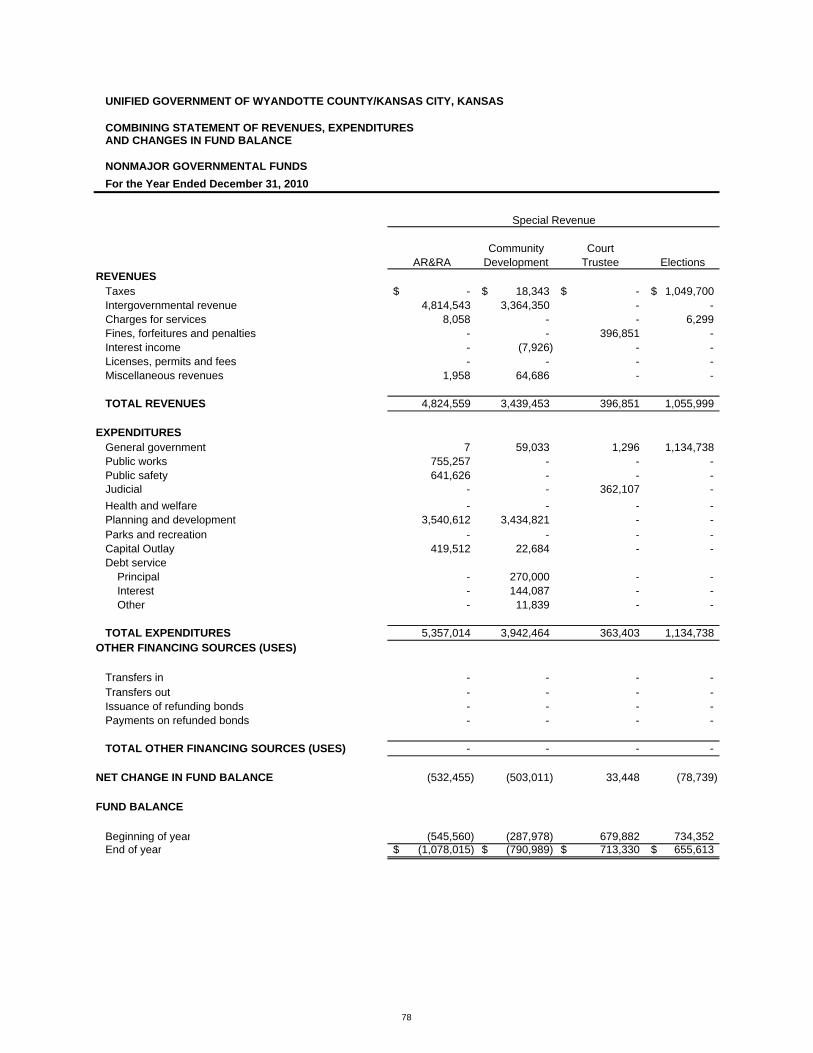
UNIFIED GOVERNMENT OF WYANDOTTE COUNTY/KANSAS CITY, KANSAS
COMBINING STATEMENT OF REVENUES, EXPENDITURESAND CHANGES IN FUND BALANCE
NONMAJOR GOVERNMENTAL FUNDSFor the Year Ended December 31, 2010
Community CourtAR&RA Development Trustee Elections
REVENUES Taxes -$ 18,343$ -$ 1,049,700$ Intergovernmental revenue 4,814,543 3,364,350 - - Charges for services 8,058 - - 6,299 Fines, forfeitures and penalties - - 396,851 - Interest income - (7,926) - - Licenses, permits and fees - - - - Miscellaneous revenues 1,958 64,686 - -
TOTAL REVENUES 4,824,559 3,439,453 396,851 1,055,999
EXPENDITURESGeneral government 7 59,033 1,296 1,134,738 Public works 755,257 - - - Public safety 641,626 - - - Judicial - - 362,107 - Health and welfare - - - - Planning and development 3,540,612 3,434,821 - - Parks and recreation - - - - Capital Outlay 419,512 22,684 - - Debt service
Principal - 270,000 - - Interest - 144,087 - - Other - 11,839 - -
TOTAL EXPENDITURES 5,357,014 3,942,464 363,403 1,134,738 OTHER FINANCING SOURCES (USES)
Transfers in - - - - Transfers out - - - - Issuance of refunding bonds - - - - Payments on refunded bonds - - - - TOTAL OTHER FINANCING SOURCES (USES) - - - -
NET CHANGE IN FUND BALANCE (532,455) (503,011) 33,448 (78,739)
FUND BALANCE
Beginning of year (545,560) (287,978) 679,882 734,352 End of year (1,078,015)$ (790,989)$ 713,330$ 655,613$
Special Revenue
78
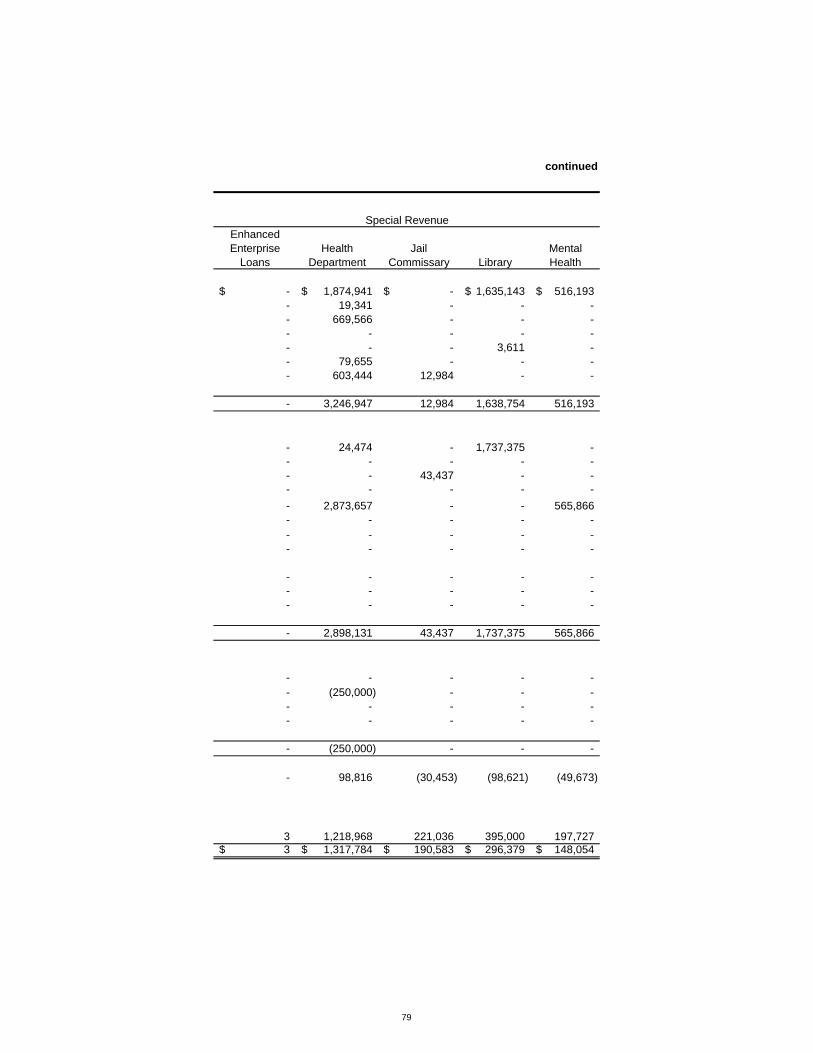
continued
EnhancedEnterprise Health Jail Mental
Loans Department Commissary Library Health
-$ 1,874,941$ -$ 1,635,143$ 516,193$ - 19,341 - - - - 669,566 - - - - - - - - - - - 3,611 - - 79,655 - - - - 603,444 12,984 - -
- 3,246,947 12,984 1,638,754 516,193
- 24,474 - 1,737,375 - - - - - - - - 43,437 - - - - - - - - 2,873,657 - - 565,866 - - - - - - - - - - - - - - -
- - - - - - - - - - - - - - -
- 2,898,131 43,437 1,737,375 565,866
- - - - - - (250,000) - - - - - - - - - - - - -
- (250,000) - - -
- 98,816 (30,453) (98,621) (49,673)
3 1,218,968 221,036 395,000 197,727 3$ 1,317,784$ 190,583$ 296,379$ 148,054$
Special Revenue
79
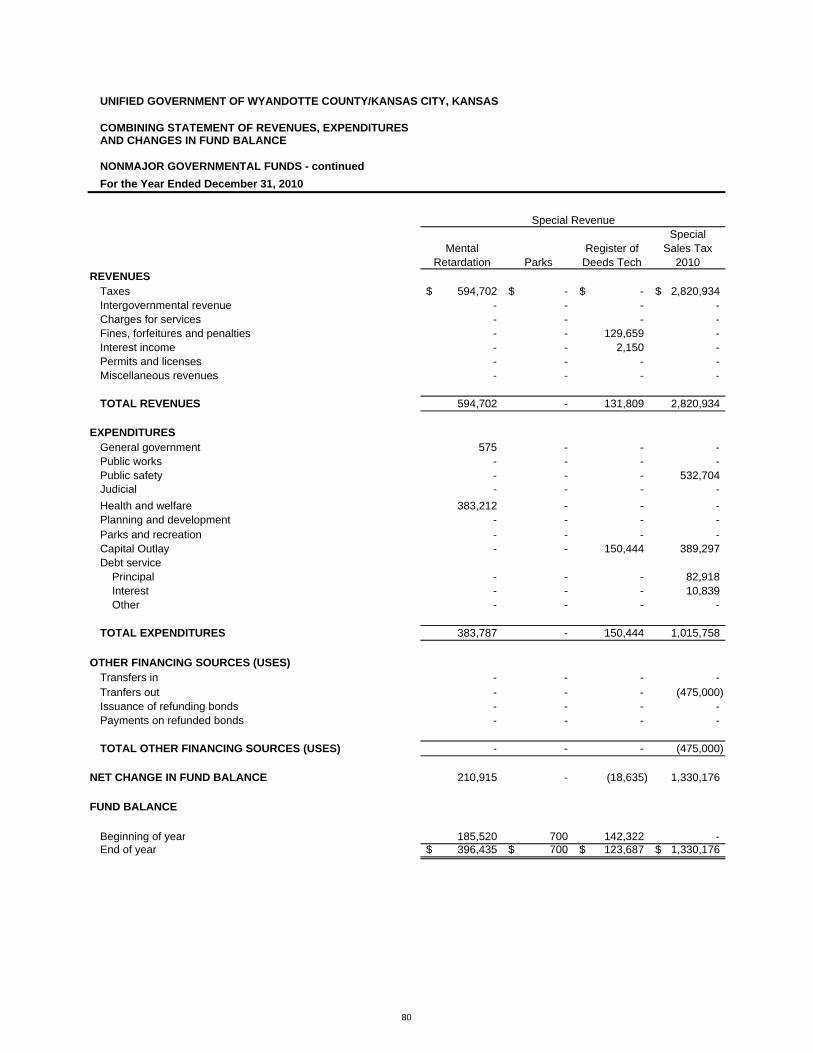
UNIFIED GOVERNMENT OF WYANDOTTE COUNTY/KANSAS CITY, KANSAS
COMBINING STATEMENT OF REVENUES, EXPENDITURESAND CHANGES IN FUND BALANCE
NONMAJOR GOVERNMENTAL FUNDS - continuedFor the Year Ended December 31, 2010
SpecialMental Register of Sales Tax
Retardation Parks Deeds Tech 2010REVENUES
Taxes 594,702$ -$ -$ 2,820,934$ Intergovernmental revenue - - - - Charges for services - - - - Fines, forfeitures and penalties - - 129,659 - Interest income - - 2,150 - Permits and licenses - - - - Miscellaneous revenues - - - -
TOTAL REVENUES 594,702 - 131,809 2,820,934
EXPENDITURESGeneral government 575 - - - Public works - - - - Public safety - - - 532,704 Judicial - - - - Health and welfare 383,212 - - - Planning and development - - - - Parks and recreation - - - - Capital Outlay - - 150,444 389,297 Debt service
Principal - - - 82,918 Interest - - - 10,839 Other - - - -
TOTAL EXPENDITURES 383,787 - 150,444 1,015,758
OTHER FINANCING SOURCES (USES)Transfers in - - - - Tranfers out - - - (475,000) Issuance of refunding bonds - - - - Payments on refunded bonds - - - - TOTAL OTHER FINANCING SOURCES (USES) - - - (475,000)
NET CHANGE IN FUND BALANCE 210,915 - (18,635) 1,330,176
FUND BALANCE
Beginning of year 185,520 700 142,322 - End of year 396,435$ 700$ 123,687$ 1,330,176$
Special Revenue
80
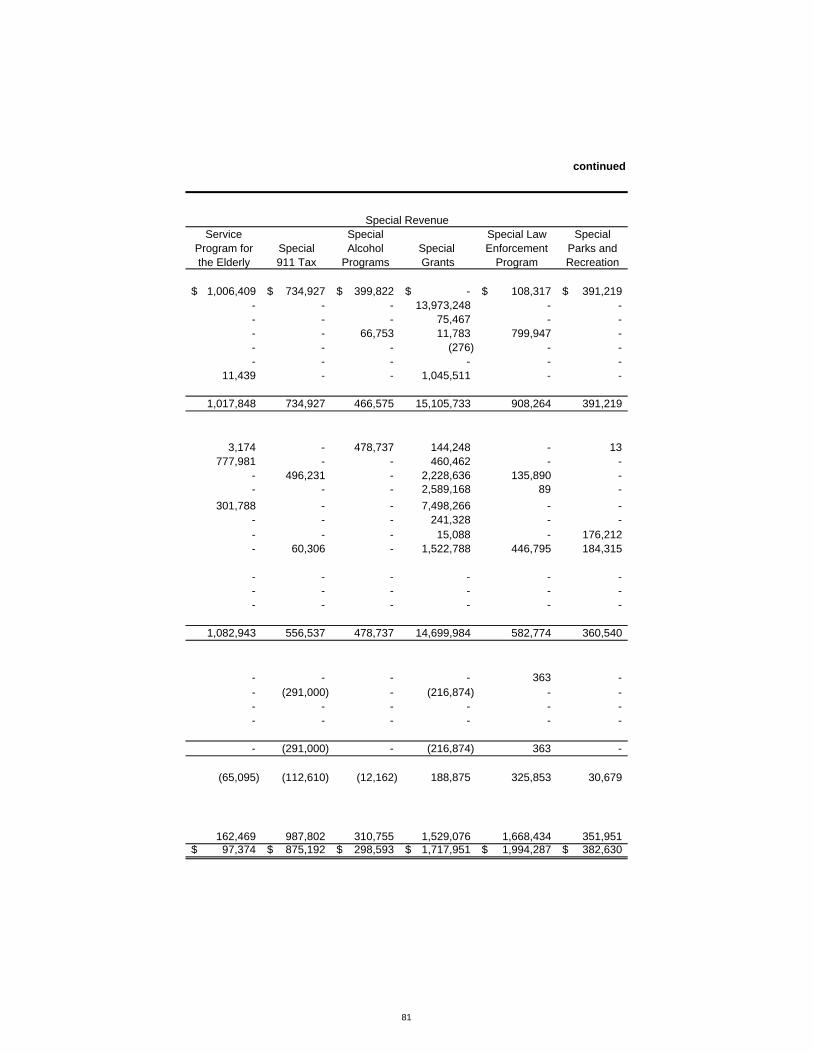
continued
Service Special Special Law SpecialProgram for Special Alcohol Special Enforcement Parks andthe Elderly 911 Tax Programs Grants Program Recreation
1,006,409$ 734,927$ 399,822$ -$ 108,317$ 391,219$ - - - 13,973,248 - - - - - 75,467 - - - - 66,753 11,783 799,947 - - - - (276) - - - - - - - -
11,439 - - 1,045,511 - -
1,017,848 734,927 466,575 15,105,733 908,264 391,219
3,174 - 478,737 144,248 - 13 777,981 - - 460,462 - -
- 496,231 - 2,228,636 135,890 - - - - 2,589,168 89 -
301,788 - - 7,498,266 - - - - - 241,328 - - - - - 15,088 - 176,212 - 60,306 - 1,522,788 446,795 184,315
- - - - - - - - - - - - - - - - - -
1,082,943 556,537 478,737 14,699,984 582,774 360,540
- - - - 363 - - (291,000) - (216,874) - - - - - - - - - - - - - -
- (291,000) - (216,874) 363 -
(65,095) (112,610) (12,162) 188,875 325,853 30,679
162,469 987,802 310,755 1,529,076 1,668,434 351,951 97,374$ 875,192$ 298,593$ 1,717,951$ 1,994,287$ 382,630$
Special Revenue
81
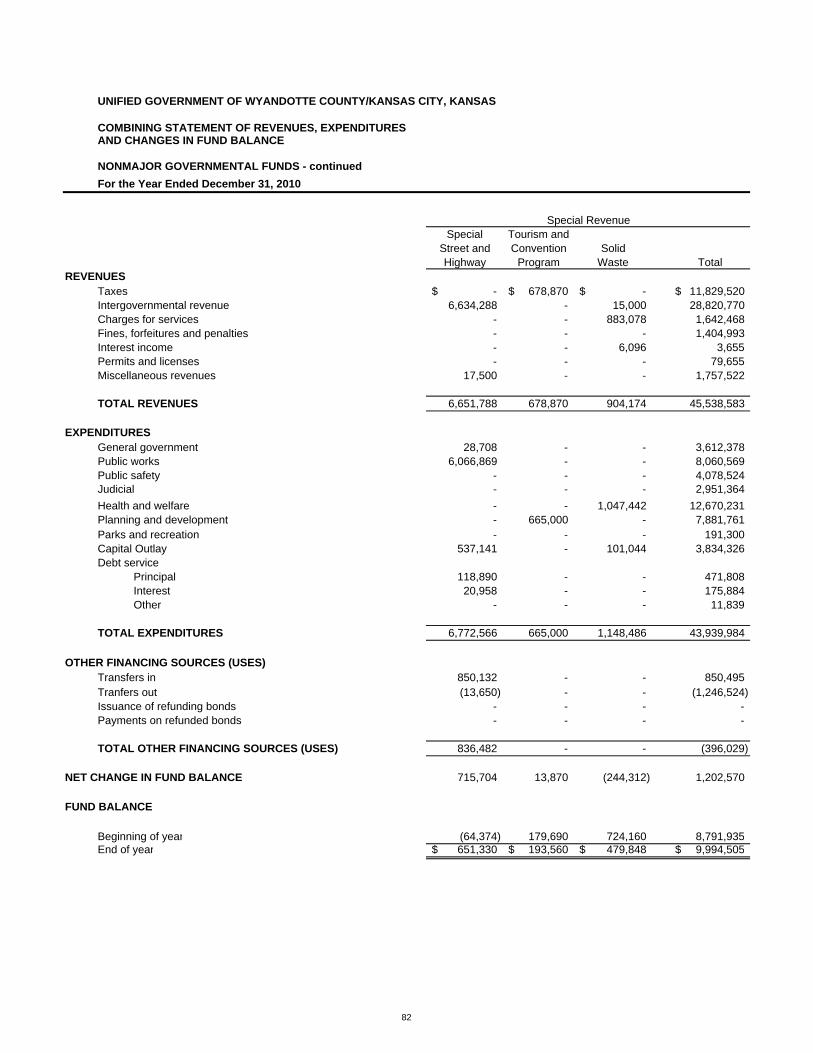
UNIFIED GOVERNMENT OF WYANDOTTE COUNTY/KANSAS CITY, KANSAS
COMBINING STATEMENT OF REVENUES, EXPENDITURESAND CHANGES IN FUND BALANCE
NONMAJOR GOVERNMENTAL FUNDS - continuedFor the Year Ended December 31, 2010
Special Tourism andStreet and Convention SolidHighway Program Waste Total
REVENUES Taxes -$ 678,870$ -$ 11,829,520$ Intergovernmental revenue 6,634,288 - 15,000 28,820,770 Charges for services - - 883,078 1,642,468 Fines, forfeitures and penalties - - - 1,404,993 Interest income - - 6,096 3,655 Permits and licenses - - - 79,655 Miscellaneous revenues 17,500 - - 1,757,522
TOTAL REVENUES 6,651,788 678,870 904,174 45,538,583
EXPENDITURES General government 28,708 - - 3,612,378 Public works 6,066,869 - - 8,060,569 Public safety - - - 4,078,524 Judicial - - - 2,951,364 Health and welfare - - 1,047,442 12,670,231 Planning and development - 665,000 - 7,881,761 Parks and recreation - - - 191,300 Capital Outlay 537,141 - 101,044 3,834,326 Debt service
Principal 118,890 - - 471,808 Interest 20,958 - - 175,884 Other - - - 11,839
TOTAL EXPENDITURES 6,772,566 665,000 1,148,486 43,939,984
OTHER FINANCING SOURCES (USES)Transfers in 850,132 - - 850,495 Tranfers out (13,650) - - (1,246,524) Issuance of refunding bonds - - - - Payments on refunded bonds - - - - TOTAL OTHER FINANCING SOURCES (USES) 836,482 - - (396,029)
NET CHANGE IN FUND BALANCE 715,704 13,870 (244,312) 1,202,570
FUND BALANCE
Beginning of year (64,374) 179,690 724,160 8,791,935 End of year 651,330$ 193,560$ 479,848$ 9,994,505$
Special Revenue
82
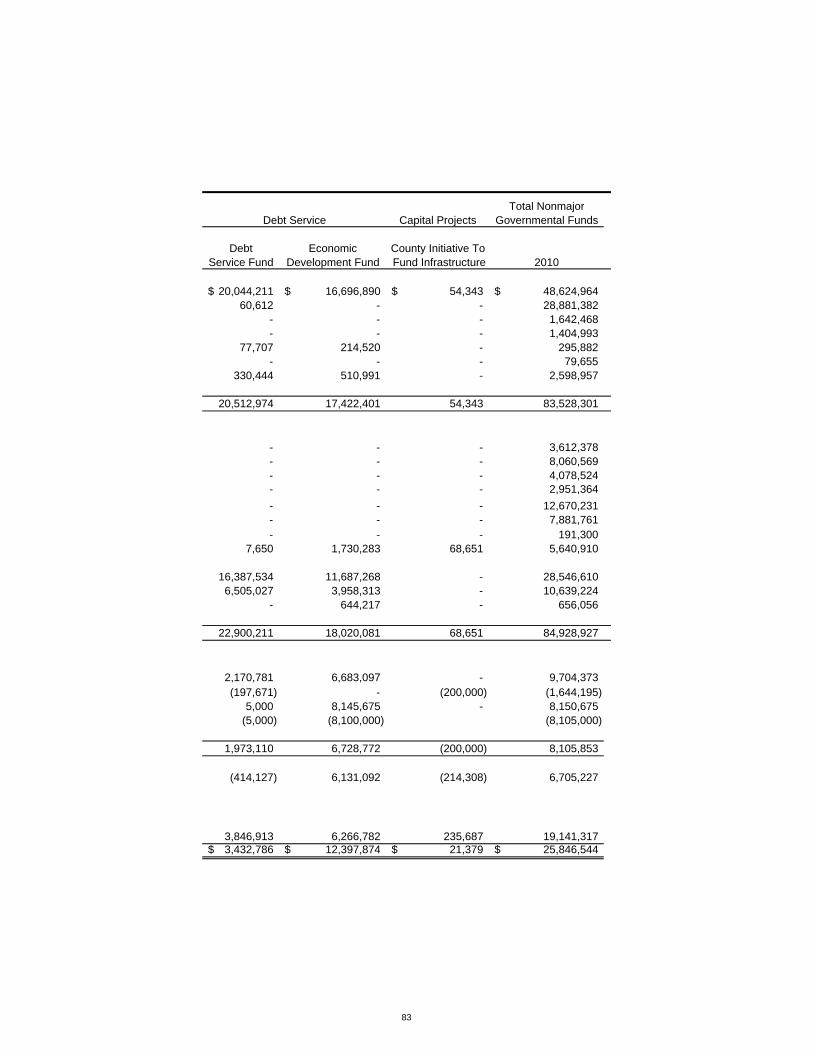
Total NonmajorCapital Projects Governmental Funds
Debt Economic County Initiative ToService Fund Development Fund Fund Infrastructure 2010
20,044,211$ 16,696,890$ 54,343$ 48,624,964$ 60,612 - - 28,881,382
- - - 1,642,468 - - - 1,404,993
77,707 214,520 - 295,882 - - - 79,655
330,444 510,991 - 2,598,957
20,512,974 17,422,401 54,343 83,528,301
- - - 3,612,378 - - - 8,060,569 - - - 4,078,524 - - - 2,951,364 - - - 12,670,231 - - - 7,881,761 - - - 191,300
7,650 1,730,283 68,651 5,640,910
16,387,534 11,687,268 - 28,546,610 6,505,027 3,958,313 - 10,639,224
- 644,217 - 656,056
22,900,211 18,020,081 68,651 84,928,927
2,170,781 6,683,097 - 9,704,373 (197,671) - (200,000) (1,644,195)
5,000 8,145,675 - 8,150,675 (5,000) (8,100,000) (8,105,000)
1,973,110 6,728,772 (200,000) 8,105,853
(414,127) 6,131,092 (214,308) 6,705,227
3,846,913 6,266,782 235,687 19,141,317 3,432,786$ 12,397,874$ 21,379$ 25,846,544$
Debt Service
83
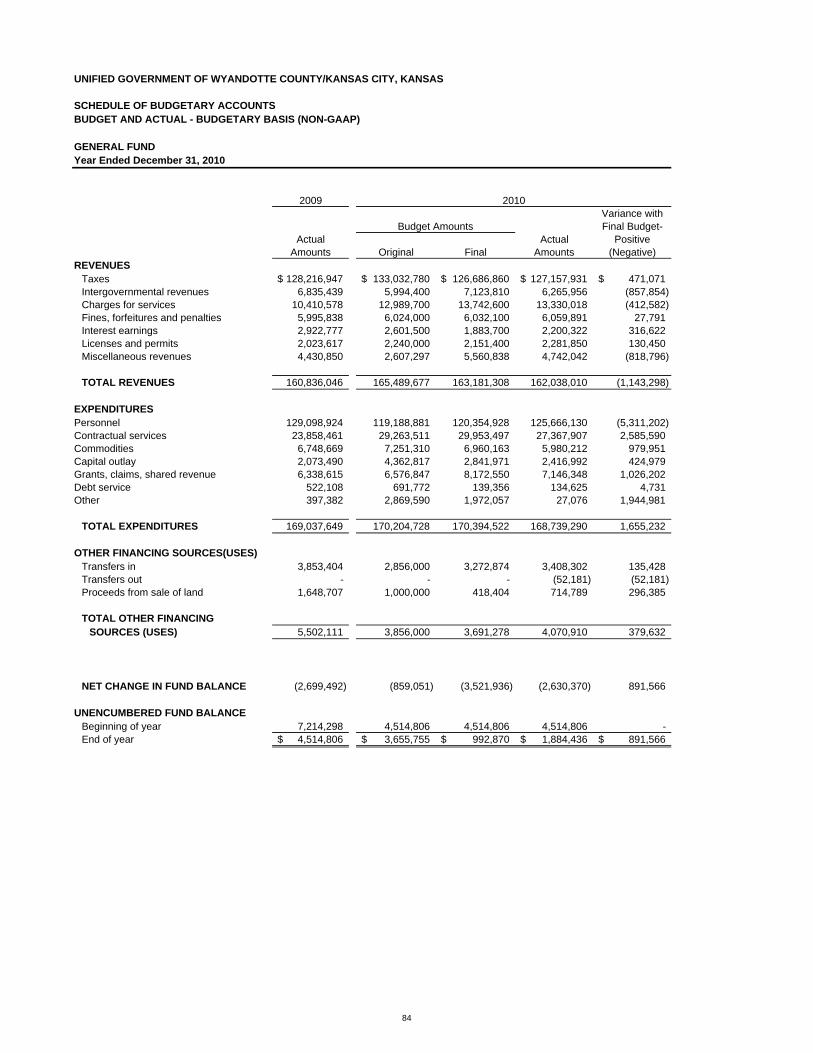
UNIFIED GOVERNMENT OF WYANDOTTE COUNTY/KANSAS CITY, KANSAS
SCHEDULE OF BUDGETARY ACCOUNTSBUDGET AND ACTUAL - BUDGETARY BASIS (NON-GAAP)
GENERAL FUNDYear Ended December 31, 2010
2009 2010Variance with
Budget Amounts Final Budget-Actual Actual Positive
Amounts Original Final Amounts (Negative)REVENUES
Taxes 128,216,947$ 133,032,780$ 126,686,860$ 127,157,931$ 471,071$ Intergovernmental revenues 6,835,439 5,994,400 7,123,810 6,265,956 (857,854) Charges for services 10,410,578 12,989,700 13,742,600 13,330,018 (412,582) Fines, forfeitures and penalties 5,995,838 6,024,000 6,032,100 6,059,891 27,791 Interest earnings 2,922,777 2,601,500 1,883,700 2,200,322 316,622 Licenses and permits 2,023,617 2,240,000 2,151,400 2,281,850 130,450 Miscellaneous revenues 4,430,850 2,607,297 5,560,838 4,742,042 (818,796)
TOTAL REVENUES 160,836,046 165,489,677 163,181,308 162,038,010 (1,143,298)
EXPENDITURESPersonnel 129,098,924 119,188,881 120,354,928 125,666,130 (5,311,202) Contractual services 23,858,461 29,263,511 29,953,497 27,367,907 2,585,590 Commodities 6,748,669 7,251,310 6,960,163 5,980,212 979,951 Capital outlay 2,073,490 4,362,817 2,841,971 2,416,992 424,979 Grants, claims, shared revenue 6,338,615 6,576,847 8,172,550 7,146,348 1,026,202 Debt service 522,108 691,772 139,356 134,625 4,731 Other 397,382 2,869,590 1,972,057 27,076 1,944,981
TOTAL EXPENDITURES 169,037,649 170,204,728 170,394,522 168,739,290 1,655,232
OTHER FINANCING SOURCES(USES)Transfers in 3,853,404 2,856,000 3,272,874 3,408,302 135,428 Transfers out - - - (52,181) (52,181) Proceeds from sale of land 1,648,707 1,000,000 418,404 714,789 296,385
TOTAL OTHER FINANCING SOURCES (USES) 5,502,111 3,856,000 3,691,278 4,070,910 379,632
NET CHANGE IN FUND BALANCE (2,699,492) (859,051) (3,521,936) (2,630,370) 891,566
UNENCUMBERED FUND BALANCEBeginning of year 7,214,298 4,514,806 4,514,806 4,514,806 - End of year 4,514,806$ 3,655,755$ 992,870$ 1,884,436$ 891,566$
84
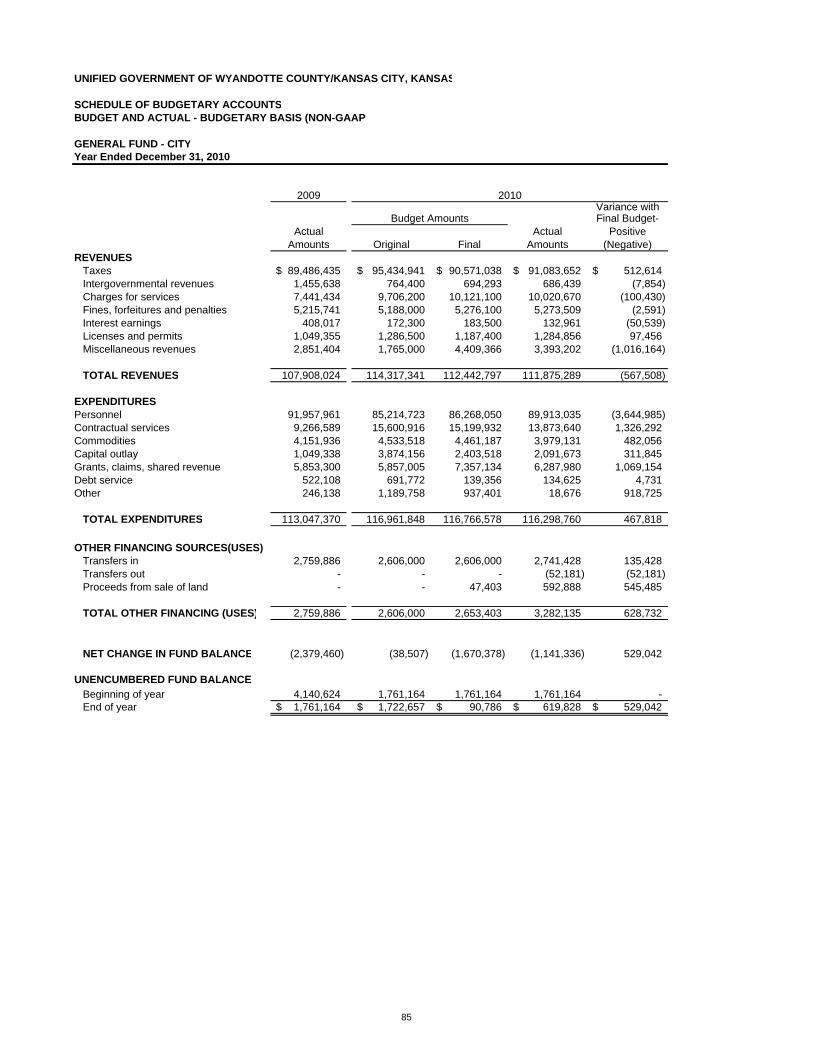
UNIFIED GOVERNMENT OF WYANDOTTE COUNTY/KANSAS CITY, KANSAS
SCHEDULE OF BUDGETARY ACCOUNTSBUDGET AND ACTUAL - BUDGETARY BASIS (NON-GAAP
GENERAL FUND - CITYYear Ended December 31, 2010
2009 2010Variance with
Budget Amounts Final Budget-Actual Actual Positive
Amounts Original Final Amounts (Negative)REVENUES
Taxes 89,486,435$ 95,434,941$ 90,571,038$ 91,083,652$ 512,614$ Intergovernmental revenues 1,455,638 764,400 694,293 686,439 (7,854) Charges for services 7,441,434 9,706,200 10,121,100 10,020,670 (100,430) Fines, forfeitures and penalties 5,215,741 5,188,000 5,276,100 5,273,509 (2,591) Interest earnings 408,017 172,300 183,500 132,961 (50,539) Licenses and permits 1,049,355 1,286,500 1,187,400 1,284,856 97,456 Miscellaneous revenues 2,851,404 1,765,000 4,409,366 3,393,202 (1,016,164)
TOTAL REVENUES 107,908,024 114,317,341 112,442,797 111,875,289 (567,508)
EXPENDITURES Personnel 91,957,961 85,214,723 86,268,050 89,913,035 (3,644,985) Contractual services 9,266,589 15,600,916 15,199,932 13,873,640 1,326,292 Commodities 4,151,936 4,533,518 4,461,187 3,979,131 482,056 Capital outlay 1,049,338 3,874,156 2,403,518 2,091,673 311,845 Grants, claims, shared revenue 5,853,300 5,857,005 7,357,134 6,287,980 1,069,154 Debt service 522,108 691,772 139,356 134,625 4,731 Other 246,138 1,189,758 937,401 18,676 918,725
TOTAL EXPENDITURES 113,047,370 116,961,848 116,766,578 116,298,760 467,818
OTHER FINANCING SOURCES(USES) Transfers in 2,759,886 2,606,000 2,606,000 2,741,428 135,428 Transfers out - - - (52,181) (52,181) Proceeds from sale of land - - 47,403 592,888 545,485
TOTAL OTHER FINANCING (USES) 2,759,886 2,606,000 2,653,403 3,282,135 628,732
NET CHANGE IN FUND BALANCE (2,379,460) (38,507) (1,670,378) (1,141,336) 529,042
UNENCUMBERED FUND BALANCEBeginning of year 4,140,624 1,761,164 1,761,164 1,761,164 - End of year 1,761,164$ 1,722,657$ 90,786$ 619,828$ 529,042$
85

UNIFIED GOVERNMENT OF WYANDOTTE COUNTY/KANSAS CITY, KANSAS
SCHEDULE OF BUDGETARY ACCOUNTSBUDGET AND ACTUAL - BUDGETARY BASIS (NON-GAAP
GENERAL FUND - COUNTYYear Ended December 31, 2010
2009 2010Variance with
Budget Amounts Final Budget-Actual Actual Positive
Amounts Original Final Amounts (Negative)REVENUES
Taxes 35,818,649$ 35,891,804$ 34,484,505$ 34,456,190$ (28,315)$ Intergovernmental revenues 2,329,084 2,030,000 3,229,517 2,879,517 (350,000) Charges for services 2,403,737 2,577,000 2,922,000 2,826,007 (95,993) Fines, forfeitures and penalties 780,097 836,000 756,000 786,382 30,382 Interest earnings 2,514,760 2,429,200 1,700,200 2,067,361 367,161 Licenses and permits 974,262 953,500 964,000 996,994 32,994 Miscellaneous revenues 1,570,772 841,297 1,123,472 1,348,764 225,292
TOTAL REVENUES 46,391,361 45,558,801 45,179,694 45,361,215 181,521
EXPENDITURESPersonnel 32,783,529 29,724,493 29,771,924 31,628,069 (1,856,145) Contractual services 13,739,220 12,383,397 13,719,930 12,577,001 1,142,929 Commodities 1,888,816 1,985,181 1,707,802 1,300,973 406,829 Capital outlay 584,005 488,661 408,053 324,351 83,702 Grants, claims, shared revenue 485,315 716,957 807,419 851,372 (43,953) Other 151,244 1,475,607 852,546 8,400 844,146
TOTAL EXPENDITURES 49,632,129 46,774,296 47,267,674 46,690,166 577,508
OTHER FINANCING SOURCES(USES)Transfers in 913,576 250,000 666,874 666,874 - Proceeds of sale of land 1,648,707 1,000,000 371,001 121,901 (249,100)
TOTAL OTHER FINANCING (USES) 2,562,283 1,250,000 1,037,875 788,775 (249,100)
NET CHANGE IN FUND BALANCE (678,485) 34,505 (1,050,105) (540,176) 509,929
UNENCUMBERED FUND BALANCEBeginning of year 1,941,371 1,262,886 1,262,886 1,262,886 - End of year 1,262,886$ 1,297,391$ 212,781$ 722,710$ 509,929$
86
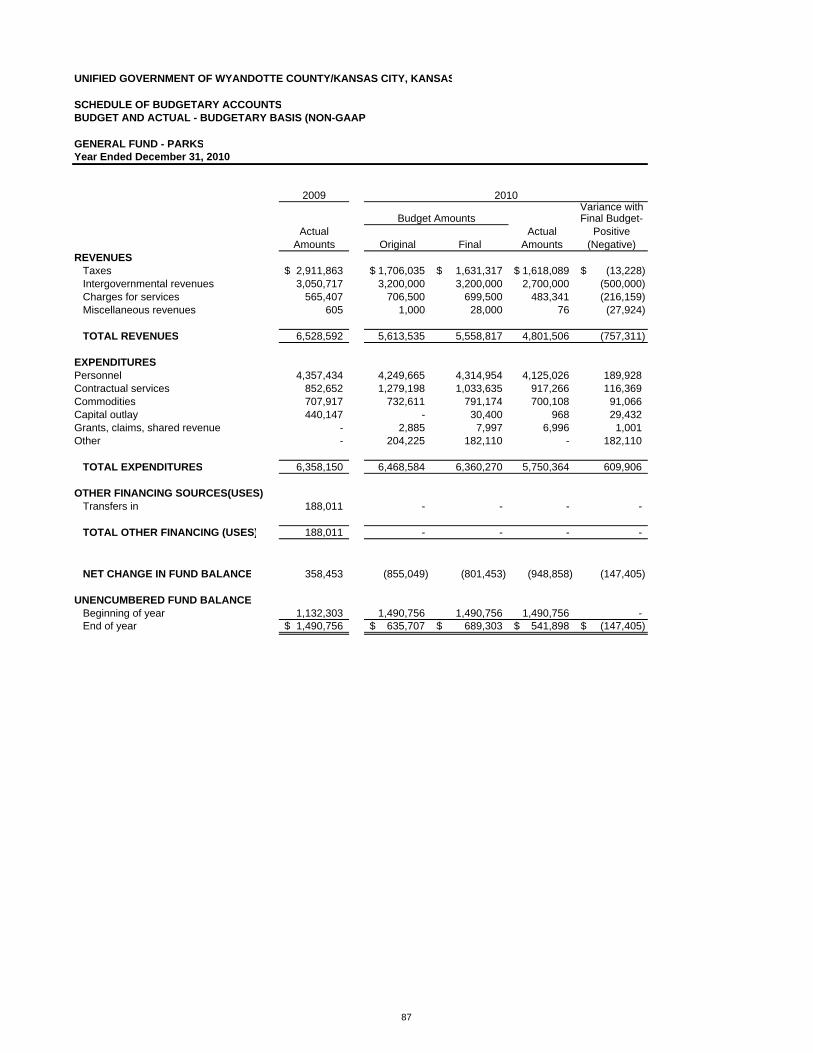
UNIFIED GOVERNMENT OF WYANDOTTE COUNTY/KANSAS CITY, KANSAS
SCHEDULE OF BUDGETARY ACCOUNTSBUDGET AND ACTUAL - BUDGETARY BASIS (NON-GAAP
GENERAL FUND - PARKSYear Ended December 31, 2010
2009 2010Variance with
Budget Amounts Final Budget-Actual Actual Positive
Amounts Original Final Amounts (Negative)REVENUES
Taxes 2,911,863$ 1,706,035$ 1,631,317$ 1,618,089$ (13,228)$ Intergovernmental revenues 3,050,717 3,200,000 3,200,000 2,700,000 (500,000) Charges for services 565,407 706,500 699,500 483,341 (216,159) Miscellaneous revenues 605 1,000 28,000 76 (27,924)
TOTAL REVENUES 6,528,592 5,613,535 5,558,817 4,801,506 (757,311)
EXPENDITURESPersonnel 4,357,434 4,249,665 4,314,954 4,125,026 189,928 Contractual services 852,652 1,279,198 1,033,635 917,266 116,369 Commodities 707,917 732,611 791,174 700,108 91,066 Capital outlay 440,147 - 30,400 968 29,432 Grants, claims, shared revenue - 2,885 7,997 6,996 1,001 Other - 204,225 182,110 - 182,110
TOTAL EXPENDITURES 6,358,150 6,468,584 6,360,270 5,750,364 609,906
OTHER FINANCING SOURCES(USES)Transfers in 188,011 - - - -
TOTAL OTHER FINANCING (USES) 188,011 - - - -
NET CHANGE IN FUND BALANCE 358,453 (855,049) (801,453) (948,858) (147,405)
UNENCUMBERED FUND BALANCEBeginning of year 1,132,303 1,490,756 1,490,756 1,490,756 - End of year 1,490,756$ 635,707$ 689,303$ 541,898$ (147,405)$
87
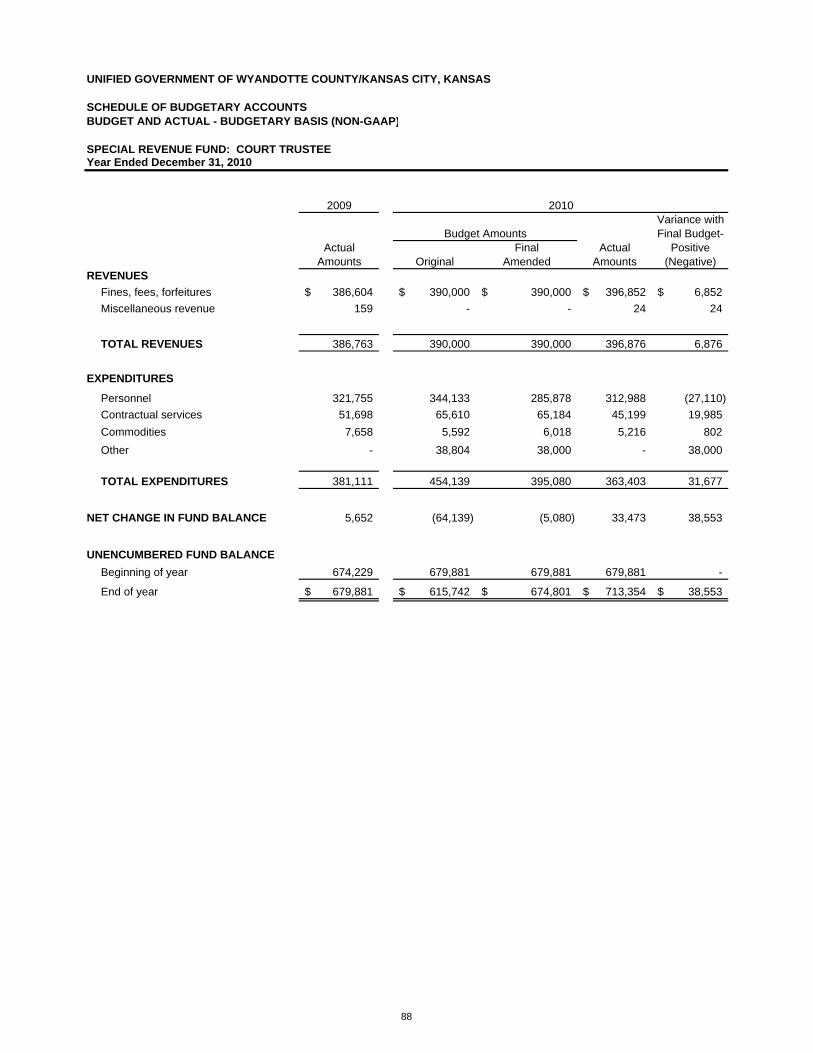
UNIFIED GOVERNMENT OF WYANDOTTE COUNTY/KANSAS CITY, KANSAS
SCHEDULE OF BUDGETARY ACCOUNTSBUDGET AND ACTUAL - BUDGETARY BASIS (NON-GAAP)
SPECIAL REVENUE FUND: COURT TRUSTEEYear Ended December 31, 2010
2009 2010Variance with
Budget Amounts Final Budget-Actual Final Actual Positive
Amounts Original Amended Amounts (Negative)REVENUES
Fines, fees, forfeitures 386,604$ 390,000$ 390,000$ 396,852$ 6,852$ Miscellaneous revenue 159 - - 24 24
TOTAL REVENUES 386,763 390,000 390,000 396,876 6,876
EXPENDITURES
Personnel 321,755 344,133 285,878 312,988 (27,110) Contractual services 51,698 65,610 65,184 45,199 19,985 Commodities 7,658 5,592 6,018 5,216 802 Other - 38,804 38,000 - 38,000
TOTAL EXPENDITURES 381,111 454,139 395,080 363,403 31,677
NET CHANGE IN FUND BALANCE 5,652 (64,139) (5,080) 33,473 38,553
UNENCUMBERED FUND BALANCEBeginning of year 674,229 679,881 679,881 679,881 -
End of year 679,881$ 615,742$ 674,801$ 713,354$ 38,553$
88

UNIFIED GOVERNMENT OF WYANDOTTE COUNTY/KANSAS CITY, KANSAS
SCHEDULE OF BUDGETARY ACCOUNTSBUDGET AND ACTUAL - BUDGETARY BASIS (NON-GAAP)
SPECIAL REVENUE FUND: ELECTIONSYear Ended December 31, 2010
2009 2010Variance with
Budget Amounts Final Budget-Actual Final Actual Positive
Amounts Original Amended Amounts (Negative)REVENUES
Tax revenue 1,147,873$ 1,071,409$ 1,049,985$ 1,049,700$ (285)$ Intergovernmental revenue 19,999 - - - -
Charges for services 7,498 10,000 10,000 6,298 (3,702) Miscellaneous revenue 254 - - 468 468
TOTAL REVENUES 1,175,624 1,081,409 1,059,985 1,056,466 (3,519)
EXPENDITURESPersonnel 588,387 754,060 754,494 591,903 162,591 Contractual services 277,990 463,000 476,000 349,835 126,165 Commodities 50,303 182,000 165,000 93,467 71,533 Grants, claims, shared revenue - - 100,000 100,000 - Capital outlay - 10,000 10,000 - 10,000 Other - 30,000 150,000 - 150,000
TOTAL EXPENDITURES 916,680 1,439,060 1,655,494 1,135,205 520,289
NET CHANGE IN FUND BALANCE 258,944 (357,651) (595,509) (78,739) 516,770
UNENCUMBERED FUND BALANCEBeginning of year 475,446 734,390 734,390 734,390 - End of year 734,390$ 376,739$ 138,881$ 655,651$ 516,770$
89

UNIFIED GOVERNMENT OF WYANDOTTE COUNTY/KANSAS CITY, KANSAS
SCHEDULE OF BUDGETARY ACCOUNTSBUDGET AND ACTUAL - BUDGETARY BASIS (NON-GAAP)
SPECIAL REVENUE FUND: HEALTH DEPARTMENTYear Ended December 31, 2010
2009 2010Variance with
Budget Amounts Final Budget-Actual Final Actual Positive
Amounts Original Amended Amounts (Negative)REVENUES
Tax revenue 2,032,257$ 1,912,712$ 1,875,266$ 1,874,941$ (325)$ Intergovernmental revenue 63,712 23,000 30,000 19,341 (10,659)
Charges for services 635,349 569,935 668,410 669,566 1,156 Licenses and permits 66,545 71,000 81,000 79,656 (1,344) Miscellaneous revenue 469,963 375,000 383,000 603,440 220,440
TOTAL REVENUES 3,267,826 2,951,647 3,037,676 3,246,944 209,268
EXPENDITURESPersonnel 2,473,157 2,536,936 2,431,111 2,312,090 119,021 Contractual services 209,074 419,147 426,881 195,619 231,262 Commodities 145,297 215,418 257,818 194,776 63,042 Grants, claims, shared revenue - - 200,000 200,000 - Other - 85,500 - - -
TOTAL EXPENDITURES 2,827,528 3,257,001 3,315,810 2,902,485 413,325
OTHER FINANCING SOURCES (USES)
Transfers out (250,000) (250,000) (250,000) (250,000) -
TOTAL OTHER FINANCINGSOURCES (USES) (250,000) (250,000) (250,000) (250,000) -
NET CHANGE IN FUND BALANCE 190,298 (555,354) (528,134) 94,459 622,593
UNENCUMBERED FUND BALANCEBeginning of year 1,025,806 1,216,104 1,216,104 1,216,104 - End of year 1,216,104$ 660,750$ 687,970$ 1,310,563$ 622,593$
90

UNIFIED GOVERNMENT OF WYANDOTTE COUNTY/KANSAS CITY, KANSAS
SCHEDULE OF BUDGETARY ACCOUNTSBUDGET AND ACTUAL - BUDGETARY BASIS (NON-GAAP)
SPECIAL REVENUE FUND: JAIL COMMISSARYYear Ended December 31, 2010
2009Variance with
Budget Amounts Final Budget-Actual Final Actual Positive
Amounts Original Amended Amounts (Negative)REVENUES
Miscellaneous revenue 11,992$ 30,000$ 30,000$ 12,984$ (17,016)$
TOTAL REVENUES 11,992 30,000 30,000 12,984 (17,016)
EXPENDITURESCommodities 26,815 60,000 60,000 52,317 7,683
TOTAL EXPENDITURES 26,815 60,000 60,000 52,317 7,683
NET CHANGE IN FUND BALANCE (14,823) (30,000) (30,000) (39,333) (9,333)
UNENCUMBERED FUND BALANCEBeginning of year 235,861 221,038 221,038 221,038 -
End of year 221,038$ 191,038$ 191,038$ 181,705$ (9,333)$
2010
91
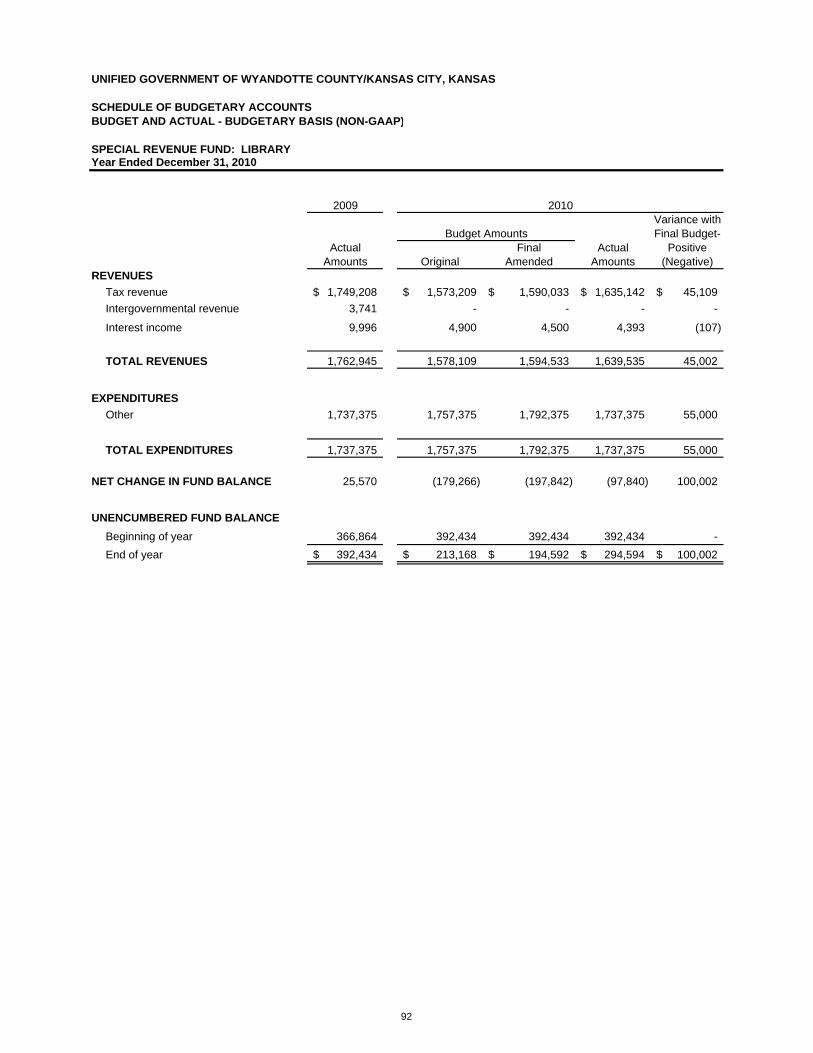
UNIFIED GOVERNMENT OF WYANDOTTE COUNTY/KANSAS CITY, KANSAS
SCHEDULE OF BUDGETARY ACCOUNTSBUDGET AND ACTUAL - BUDGETARY BASIS (NON-GAAP)
SPECIAL REVENUE FUND: LIBRARYYear Ended December 31, 2010
2009 2010Variance with
Budget Amounts Final Budget-Actual Final Actual Positive
Amounts Original Amended Amounts (Negative)REVENUES
Tax revenue 1,749,208$ 1,573,209$ 1,590,033$ 1,635,142$ 45,109$ Intergovernmental revenue 3,741 - - - -
Interest income 9,996 4,900 4,500 4,393 (107)
TOTAL REVENUES 1,762,945 1,578,109 1,594,533 1,639,535 45,002
EXPENDITURESOther 1,737,375 1,757,375 1,792,375 1,737,375 55,000
TOTAL EXPENDITURES 1,737,375 1,757,375 1,792,375 1,737,375 55,000
NET CHANGE IN FUND BALANCE 25,570 (179,266) (197,842) (97,840) 100,002
UNENCUMBERED FUND BALANCEBeginning of year 366,864 392,434 392,434 392,434 - End of year 392,434$ 213,168$ 194,592$ 294,594$ 100,002$
92
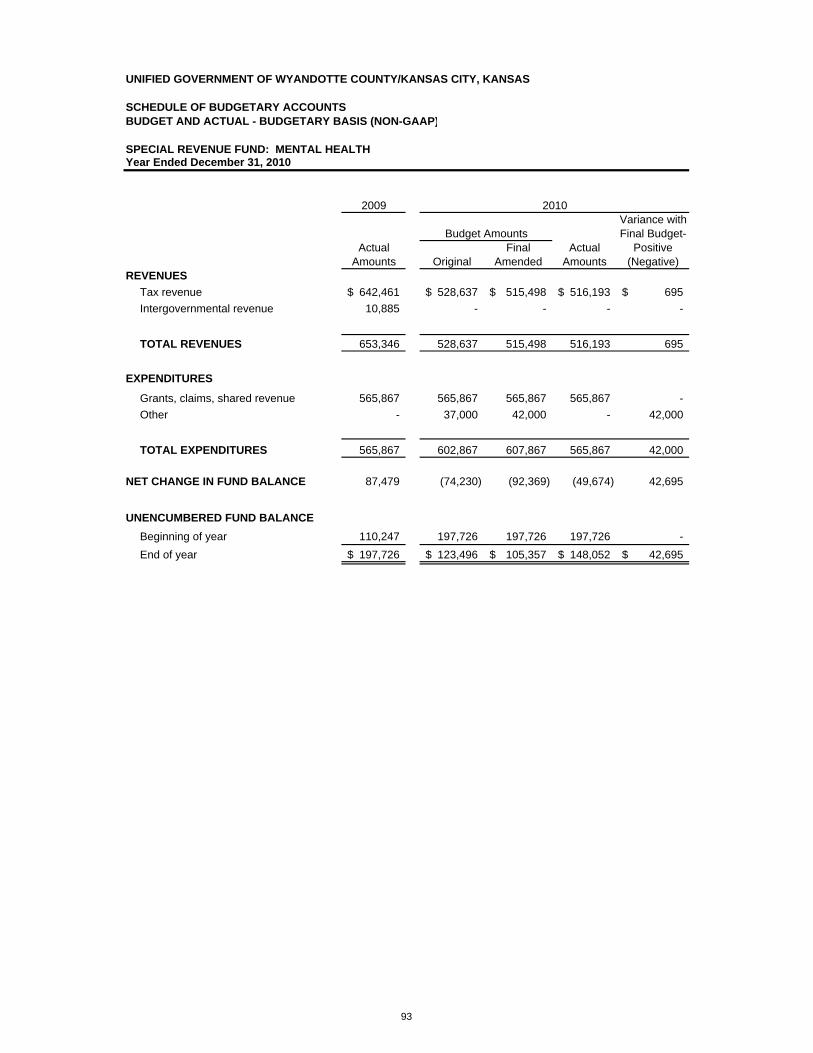
UNIFIED GOVERNMENT OF WYANDOTTE COUNTY/KANSAS CITY, KANSAS
SCHEDULE OF BUDGETARY ACCOUNTSBUDGET AND ACTUAL - BUDGETARY BASIS (NON-GAAP)
SPECIAL REVENUE FUND: MENTAL HEALTHYear Ended December 31, 2010
2009 2010Variance with
Budget Amounts Final Budget-Actual Final Actual Positive
Amounts Original Amended Amounts (Negative)REVENUES
Tax revenue 642,461$ 528,637$ 515,498$ 516,193$ 695$ Intergovernmental revenue 10,885 - - - -
TOTAL REVENUES 653,346 528,637 515,498 516,193 695
EXPENDITURES
Grants, claims, shared revenue 565,867 565,867 565,867 565,867 - Other - 37,000 42,000 - 42,000
TOTAL EXPENDITURES 565,867 602,867 607,867 565,867 42,000
NET CHANGE IN FUND BALANCE 87,479 (74,230) (92,369) (49,674) 42,695
UNENCUMBERED FUND BALANCEBeginning of year 110,247 197,726 197,726 197,726 - End of year 197,726$ 123,496$ 105,357$ 148,052$ 42,695$
93
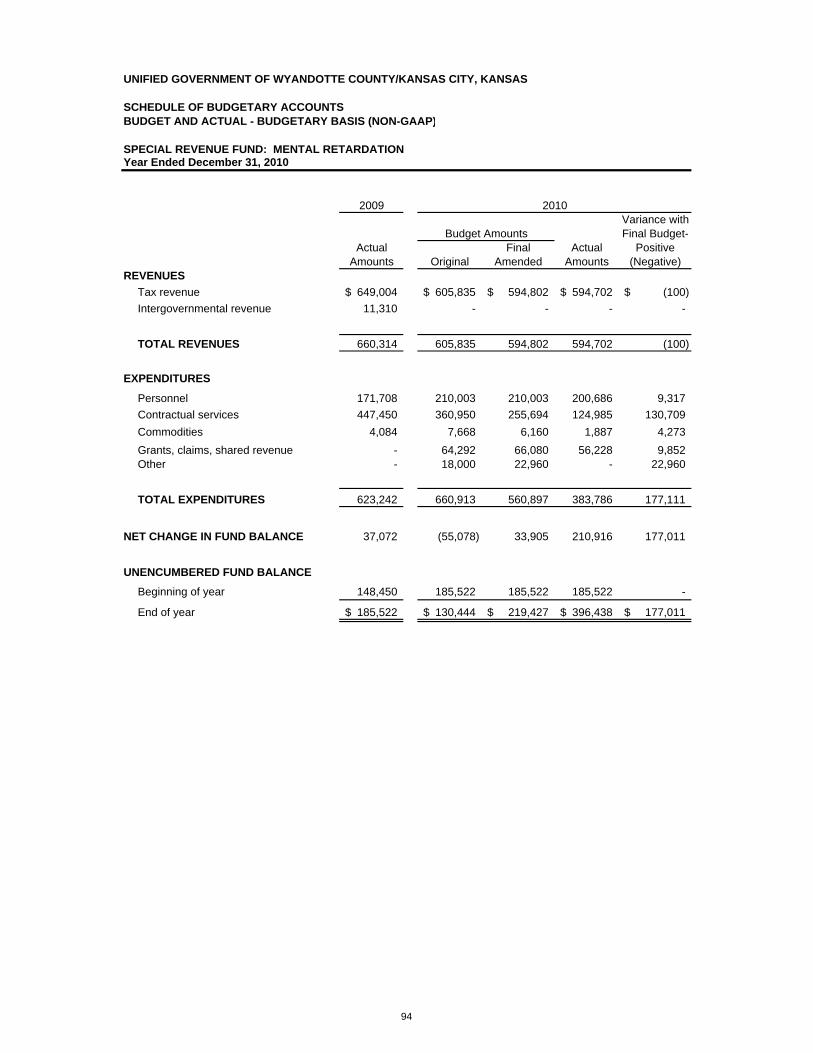
UNIFIED GOVERNMENT OF WYANDOTTE COUNTY/KANSAS CITY, KANSAS
SCHEDULE OF BUDGETARY ACCOUNTSBUDGET AND ACTUAL - BUDGETARY BASIS (NON-GAAP)
SPECIAL REVENUE FUND: MENTAL RETARDATIONYear Ended December 31, 2010
2009 2010Variance with
Budget Amounts Final Budget-Actual Final Actual Positive
Amounts Original Amended Amounts (Negative)REVENUES
Tax revenue 649,004$ 605,835$ 594,802$ 594,702$ (100)$ Intergovernmental revenue 11,310 - - - -
TOTAL REVENUES 660,314 605,835 594,802 594,702 (100)
EXPENDITURES
Personnel 171,708 210,003 210,003 200,686 9,317 Contractual services 447,450 360,950 255,694 124,985 130,709 Commodities 4,084 7,668 6,160 1,887 4,273 Grants, claims, shared revenue - 64,292 66,080 56,228 9,852 Other - 18,000 22,960 - 22,960
TOTAL EXPENDITURES 623,242 660,913 560,897 383,786 177,111
NET CHANGE IN FUND BALANCE 37,072 (55,078) 33,905 210,916 177,011
UNENCUMBERED FUND BALANCE
Beginning of year 148,450 185,522 185,522 185,522 -
End of year 185,522$ 130,444$ 219,427$ 396,438$ 177,011$
94

UNIFIED GOVERNMENT OF WYANDOTTE COUNTY/KANSAS CITY, KANSAS
SCHEDULE OF BUDGETARY ACCOUNTSBUDGET AND ACTUAL - BUDGETARY BASIS (NON-GAAP)
SPECIAL REVENUE FUND: REGISTER OF DEEDS TECHNOLOGY FUND
Year Ended December 31, 2010
2009 2010Variance with
Budget Amounts Final Budget-Actual Final Actual Positive
Amounts Original Amended Amounts (Negative)REVENUES
Fines/fees/forfeitures 163,751$ 175,000$ 130,000$ 129,658$ (342)$ Interest income 4,812 3,000 1,000 1,615 615 Miscellaneous revenue 9,183 - - - -
TOTAL REVENUES 177,746 178,000 131,000 131,273 273
EXPENDITURESCapital outlay 187,334 175,000 175,000 103,574 71,426
TOTAL EXPENDITURES 187,334 175,000 175,000 103,574 71,426
NET CHANGE IN FUND BALANCE (9,588) 3,000 (44,000) 27,699 71,699
UNENCUMBERED FUND BALANCEBeginning of year 103,175 93,587 93,587 93,587 - End of year 93,587$ 96,587$ 49,587$ 121,286$ 71,699$
95
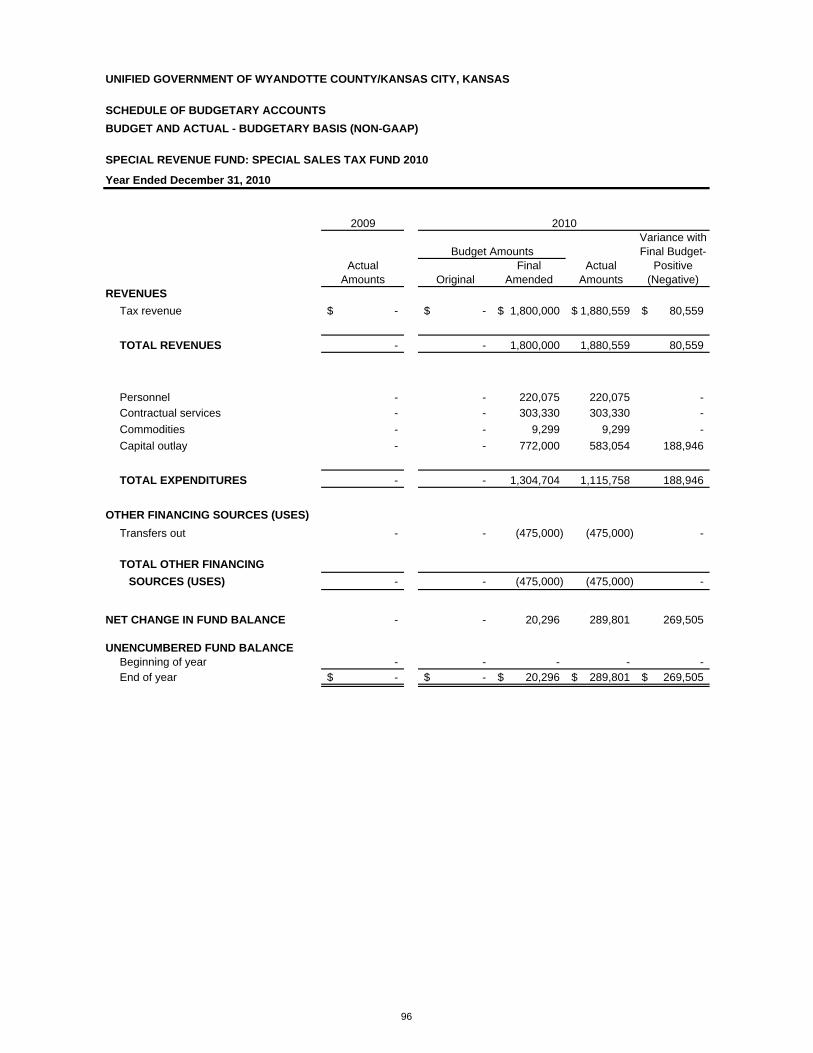
UNIFIED GOVERNMENT OF WYANDOTTE COUNTY/KANSAS CITY, KANSAS
SCHEDULE OF BUDGETARY ACCOUNTSBUDGET AND ACTUAL - BUDGETARY BASIS (NON-GAAP)
SPECIAL REVENUE FUND: SPECIAL SALES TAX FUND 2010
Year Ended December 31, 2010
2009 2010Variance with
Budget Amounts Final Budget-Actual Final Actual Positive
Amounts Original Amended Amounts (Negative)REVENUES
Tax revenue -$ -$ 1,800,000$ 1,880,559$ 80,559$
TOTAL REVENUES - - 1,800,000 1,880,559 80,559
Personnel - - 220,075 220,075 - Contractual services - - 303,330 303,330 - Commodities - - 9,299 9,299 - Capital outlay - - 772,000 583,054 188,946
TOTAL EXPENDITURES - - 1,304,704 1,115,758 188,946
OTHER FINANCING SOURCES (USES)Transfers out - - (475,000) (475,000) -
TOTAL OTHER FINANCING SOURCES (USES) - - (475,000) (475,000) -
NET CHANGE IN FUND BALANCE - - 20,296 289,801 269,505
UNENCUMBERED FUND BALANCEBeginning of year - - - - - End of year -$ -$ 20,296$ 289,801$ 269,505$
96
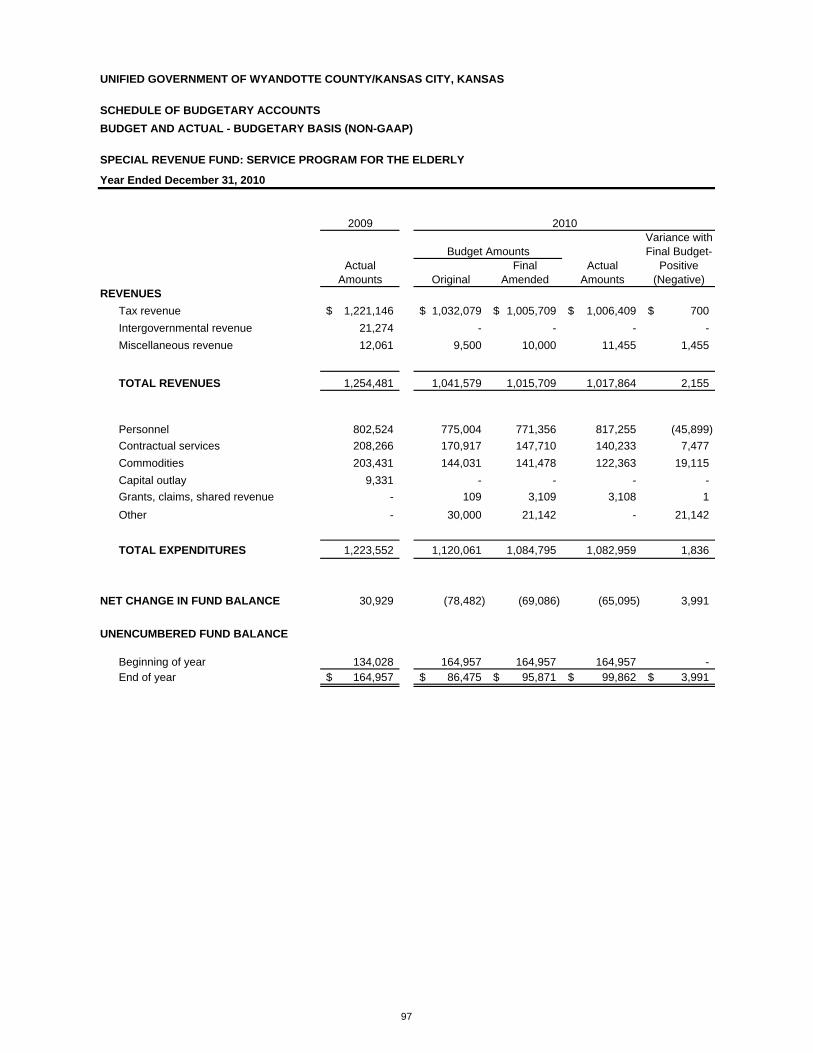
UNIFIED GOVERNMENT OF WYANDOTTE COUNTY/KANSAS CITY, KANSAS
SCHEDULE OF BUDGETARY ACCOUNTSBUDGET AND ACTUAL - BUDGETARY BASIS (NON-GAAP)
SPECIAL REVENUE FUND: SERVICE PROGRAM FOR THE ELDERLY
Year Ended December 31, 2010
2009 2010Variance with
Budget Amounts Final Budget-Actual Final Actual Positive
Amounts Original Amended Amounts (Negative)REVENUES
Tax revenue 1,221,146$ 1,032,079$ 1,005,709$ 1,006,409$ 700$ Intergovernmental revenue 21,274 - - - - Miscellaneous revenue 12,061 9,500 10,000 11,455 1,455
TOTAL REVENUES 1,254,481 1,041,579 1,015,709 1,017,864 2,155
Personnel 802,524 775,004 771,356 817,255 (45,899) Contractual services 208,266 170,917 147,710 140,233 7,477 Commodities 203,431 144,031 141,478 122,363 19,115 Capital outlay 9,331 - - - - Grants, claims, shared revenue - 109 3,109 3,108 1 Other - 30,000 21,142 - 21,142
TOTAL EXPENDITURES 1,223,552 1,120,061 1,084,795 1,082,959 1,836
NET CHANGE IN FUND BALANCE 30,929 (78,482) (69,086) (65,095) 3,991
UNENCUMBERED FUND BALANCE
Beginning of year 134,028 164,957 164,957 164,957 - End of year 164,957$ 86,475$ 95,871$ 99,862$ 3,991$
97
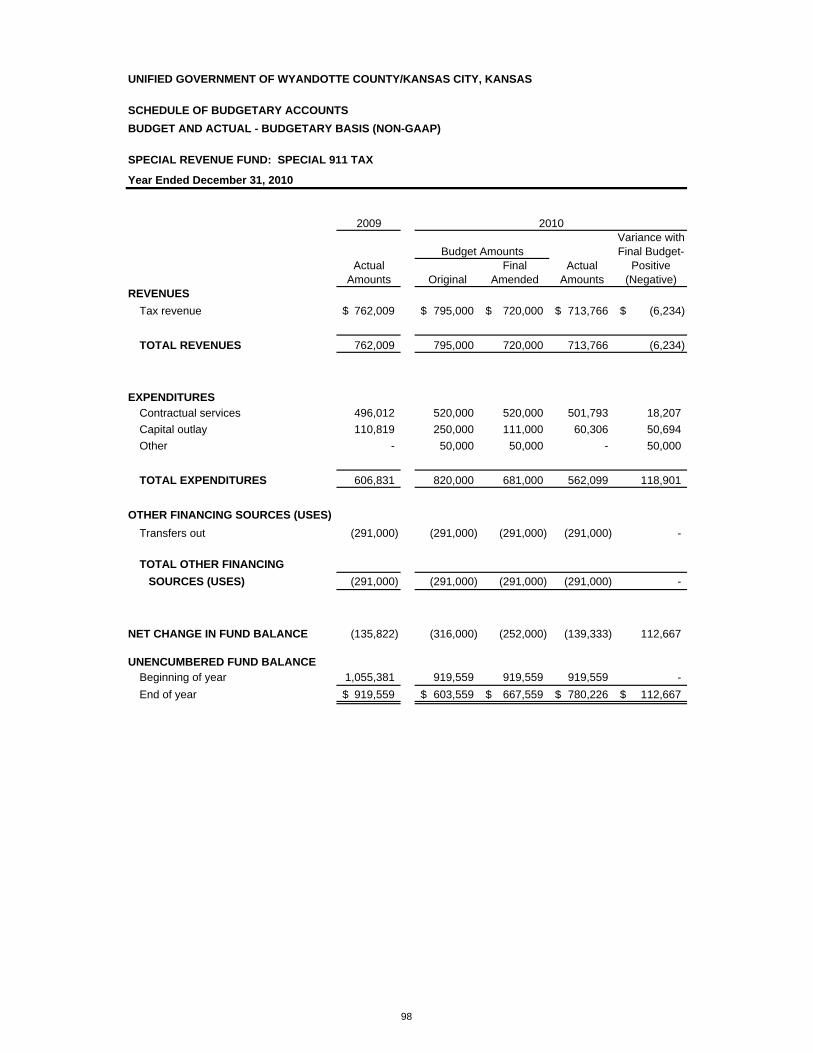
UNIFIED GOVERNMENT OF WYANDOTTE COUNTY/KANSAS CITY, KANSAS
SCHEDULE OF BUDGETARY ACCOUNTSBUDGET AND ACTUAL - BUDGETARY BASIS (NON-GAAP)
SPECIAL REVENUE FUND: SPECIAL 911 TAX
Year Ended December 31, 2010
2009 2010Variance with
Budget Amounts Final Budget-Actual Final Actual Positive
Amounts Original Amended Amounts (Negative)REVENUES
Tax revenue 762,009$ 795,000$ 720,000$ 713,766$ (6,234)$
TOTAL REVENUES 762,009 795,000 720,000 713,766 (6,234)
EXPENDITURESContractual services 496,012 520,000 520,000 501,793 18,207 Capital outlay 110,819 250,000 111,000 60,306 50,694 Other - 50,000 50,000 - 50,000
TOTAL EXPENDITURES 606,831 820,000 681,000 562,099 118,901
OTHER FINANCING SOURCES (USES)Transfers out (291,000) (291,000) (291,000) (291,000) -
TOTAL OTHER FINANCING SOURCES (USES) (291,000) (291,000) (291,000) (291,000) -
NET CHANGE IN FUND BALANCE (135,822) (316,000) (252,000) (139,333) 112,667
UNENCUMBERED FUND BALANCEBeginning of year 1,055,381 919,559 919,559 919,559 - End of year 919,559$ 603,559$ 667,559$ 780,226$ 112,667$
98

UNIFIED GOVERNMENT OF WYANDOTTE COUNTY/KANSAS CITY, KANSAS
SCHEDULE OF BUDGETARY ACCOUNTSBUDGET AND ACTUAL - BUDGETARY BASIS (NON-GAAP)
SPECIAL REVENUE FUND: SPECIAL ALCOHOL AND DRUG PROGRAMS
Year Ended December 31, 2010
2009 2010Variance with
Budget Amounts Final Budget-Actual Final Actual Positive
Amounts Original Amended Amounts (Negative)REVENUES
Tax revenue 420,573$ 492,000$ 415,000$ 399,822$ (15,178)$ Fines, forfeitures and penalties 61,420 65,000 65,000 66,755 1,755
TOTAL REVENUES 481,993 557,000 480,000 466,577 (13,423)
Personnel 55,504 119,098 92,216 77,651 14,565 Contractual services 115,510 248,402 138,390 137,976 414 Commodoties 1,775 2,500 9,344 7,359 1,985 Grants, claims, shared revenue 400,000 300,000 291,857 252,750 39,107 TOTAL EXPENDITURES 572,789 670,000 531,807 475,736 56,071
NET CHANGE IN FUND BALANCE (90,796) (113,000) (51,807) (9,159) 42,648
UNENCUMBERED FUND BALANCEBeginning of year 397,129 306,333 306,333 306,333 - End of year 306,333$ 193,333$ 254,526$ 297,174$ 42,648$
99
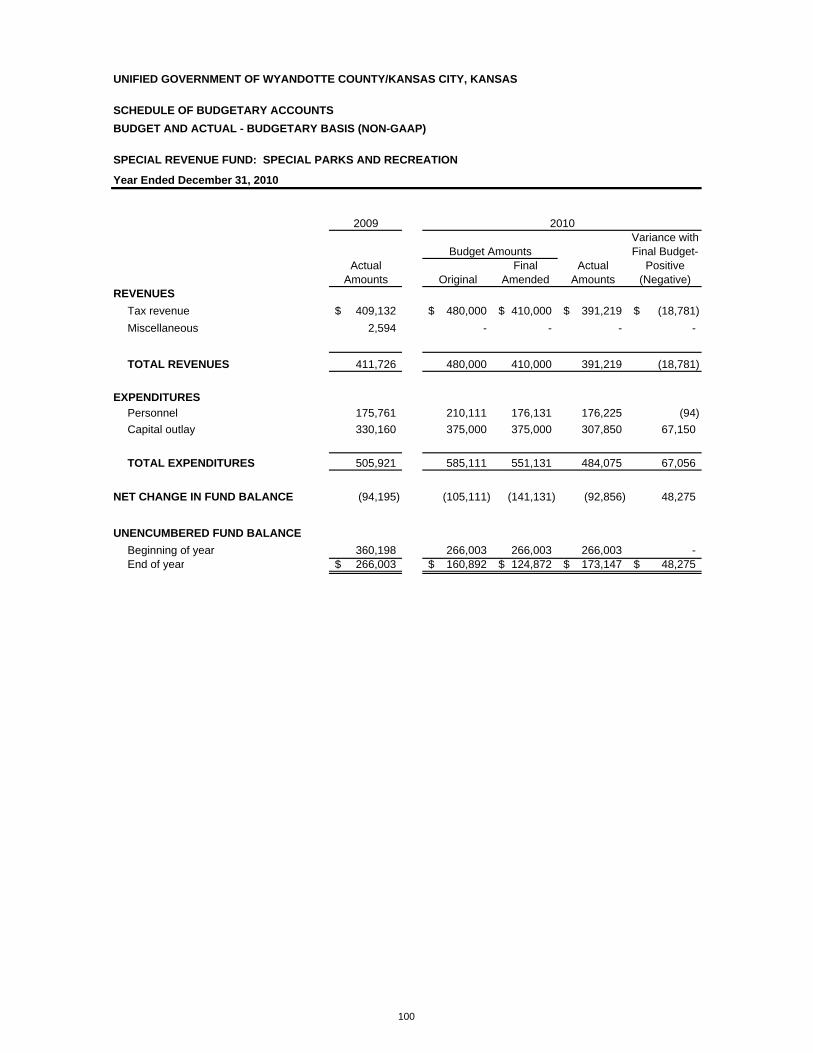
UNIFIED GOVERNMENT OF WYANDOTTE COUNTY/KANSAS CITY, KANSAS
SCHEDULE OF BUDGETARY ACCOUNTSBUDGET AND ACTUAL - BUDGETARY BASIS (NON-GAAP)
SPECIAL REVENUE FUND: SPECIAL PARKS AND RECREATION
Year Ended December 31, 2010
2009 2010Variance with
Budget Amounts Final Budget-Actual Final Actual Positive
Amounts Original Amended Amounts (Negative)REVENUES
Tax revenue 409,132$ 480,000$ 410,000$ 391,219$ (18,781)$ Miscellaneous 2,594 - - - -
TOTAL REVENUES 411,726 480,000 410,000 391,219 (18,781)
EXPENDITURESPersonnel 175,761 210,111 176,131 176,225 (94) Capital outlay 330,160 375,000 375,000 307,850 67,150
TOTAL EXPENDITURES 505,921 585,111 551,131 484,075 67,056
NET CHANGE IN FUND BALANCE (94,195) (105,111) (141,131) (92,856) 48,275
UNENCUMBERED FUND BALANCEBeginning of year 360,198 266,003 266,003 266,003 - End of year 266,003$ 160,892$ 124,872$ 173,147$ 48,275$
100
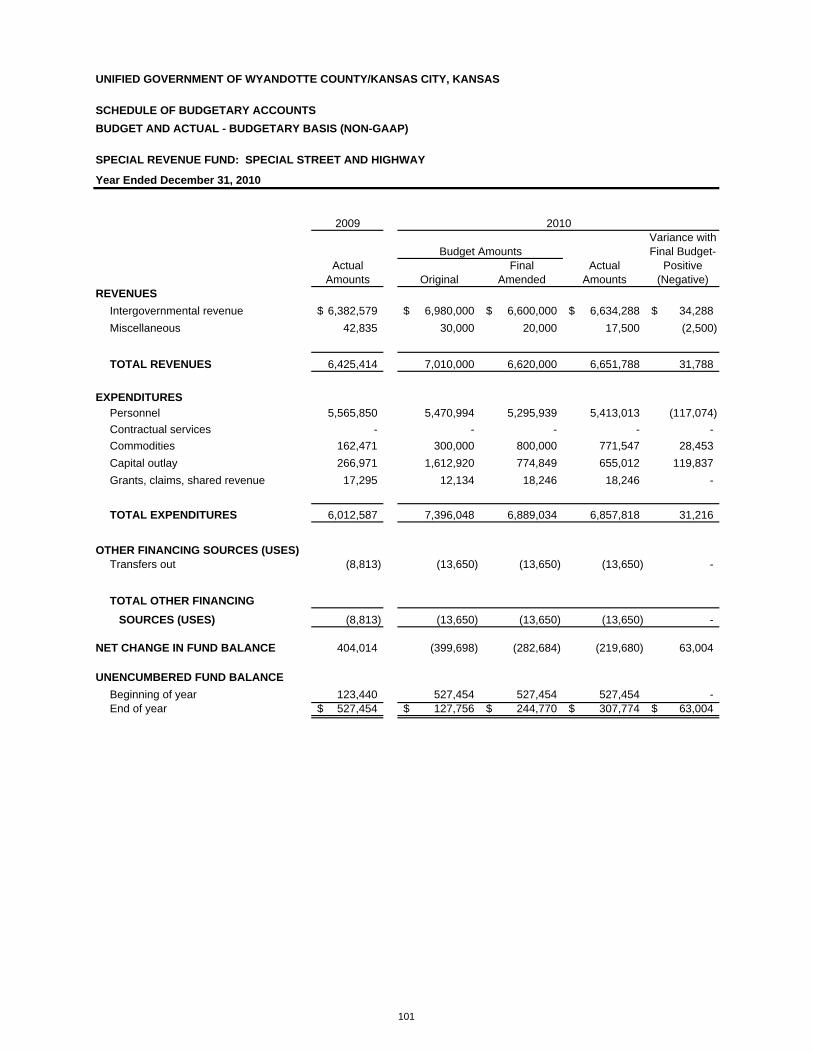
UNIFIED GOVERNMENT OF WYANDOTTE COUNTY/KANSAS CITY, KANSAS
SCHEDULE OF BUDGETARY ACCOUNTSBUDGET AND ACTUAL - BUDGETARY BASIS (NON-GAAP)
SPECIAL REVENUE FUND: SPECIAL STREET AND HIGHWAY
Year Ended December 31, 2010
2009 2010Variance with
Budget Amounts Final Budget-Actual Final Actual Positive
Amounts Original Amended Amounts (Negative)REVENUES
Intergovernmental revenue 6,382,579$ 6,980,000$ 6,600,000$ 6,634,288$ 34,288$ Miscellaneous 42,835 30,000 20,000 17,500 (2,500)
TOTAL REVENUES 6,425,414 7,010,000 6,620,000 6,651,788 31,788
EXPENDITURESPersonnel 5,565,850 5,470,994 5,295,939 5,413,013 (117,074) Contractual services - - - - - Commodities 162,471 300,000 800,000 771,547 28,453 Capital outlay 266,971 1,612,920 774,849 655,012 119,837 Grants, claims, shared revenue 17,295 12,134 18,246 18,246 -
TOTAL EXPENDITURES 6,012,587 7,396,048 6,889,034 6,857,818 31,216
OTHER FINANCING SOURCES (USES)Transfers out (8,813) (13,650) (13,650) (13,650) -
TOTAL OTHER FINANCING SOURCES (USES) (8,813) (13,650) (13,650) (13,650) -
NET CHANGE IN FUND BALANCE 404,014 (399,698) (282,684) (219,680) 63,004
UNENCUMBERED FUND BALANCEBeginning of year 123,440 527,454 527,454 527,454 - End of year 527,454$ 127,756$ 244,770$ 307,774$ 63,004$
101
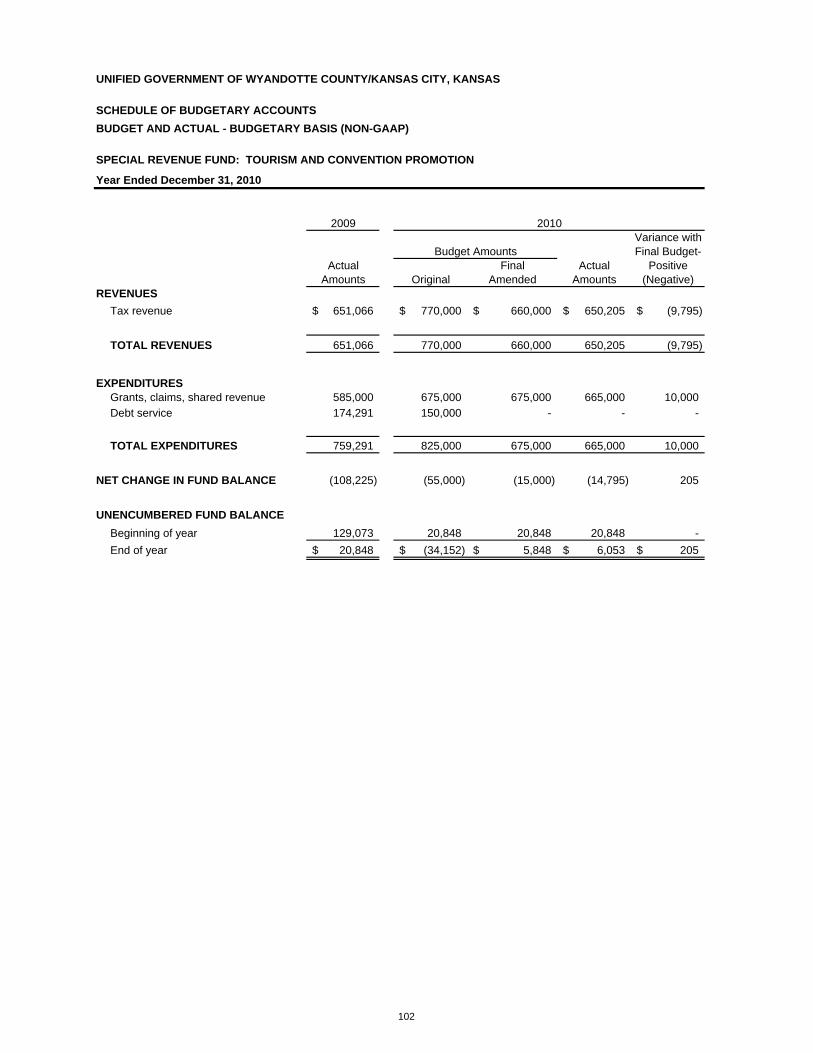
UNIFIED GOVERNMENT OF WYANDOTTE COUNTY/KANSAS CITY, KANSAS
SCHEDULE OF BUDGETARY ACCOUNTSBUDGET AND ACTUAL - BUDGETARY BASIS (NON-GAAP)
SPECIAL REVENUE FUND: TOURISM AND CONVENTION PROMOTION
Year Ended December 31, 2010
2009 2010Variance with
Budget Amounts Final Budget-Actual Final Actual Positive
Amounts Original Amended Amounts (Negative)REVENUES
Tax revenue 651,066$ 770,000$ 660,000$ 650,205$ (9,795)$
TOTAL REVENUES 651,066 770,000 660,000 650,205 (9,795)
EXPENDITURESGrants, claims, shared revenue 585,000 675,000 675,000 665,000 10,000 Debt service 174,291 150,000 - - -
TOTAL EXPENDITURES 759,291 825,000 675,000 665,000 10,000
NET CHANGE IN FUND BALANCE (108,225) (55,000) (15,000) (14,795) 205
UNENCUMBERED FUND BALANCEBeginning of year 129,073 20,848 20,848 20,848 - End of year 20,848$ (34,152)$ 5,848$ 6,053$ 205$
102

UNIFIED GOVERNMENT OF WYANDOTTE COUNTY/KANSAS CITY, KANSAS
SCHEDULE OF BUDGETARY ACCOUNTS
BUDGET AND ACTUAL - BUDGETARY BASIS (NON-GAAP)
DEBT SERVICE FUND - CITYYear Ended December 31, 2010
2009 2010Variance with
Budget Amounts Final Budget-Actual Final Actual Positive
Amounts Original Amended Amounts (Negative)REVENUES
Taxes 18,773,547$ 18,517,977$ 18,886,410$ 18,762,046$ (124,364)$ Intergovernmental revenue 420,251 70,175 70,175 60,612 (9,563) Interest income 391,445 134,400 176,100 88,842 (87,258) Miscellaneous revenue 10,653 - - 304,336 304,336
TOTAL REVENUES 19,595,896 18,722,552 19,132,685 19,215,836 83,151
EXPENDITURESDebt service 25,552,338 24,176,355 25,354,513 24,083,962 1,270,551
TOTAL EXPENDITURES 25,552,338 24,176,355 25,354,513 24,083,962 1,270,551
OTHER FINANCING SOURCES (USES)Transfers in 3,887,150 2,280,925 4,061,164 4,223,288 162,124 Proceeds from issuance of bonds - - - 5,000 5,000
TOTAL OTHER FINANCINGSOURCES (USES) 3,887,150 2,280,925 4,061,164 4,228,288 167,124
NET CHANGE IN FUND BALANCE (2,069,292) (3,172,878) (2,160,664) (639,838) 1,520,826
UNENCUMBERED FUND BALANCEBeginning of year 5,708,097 3,638,805 3,638,805 3,638,805 - End of year 3,638,805$ 465,927$ 1,478,141$ 2,998,967$ 1,520,826$
103
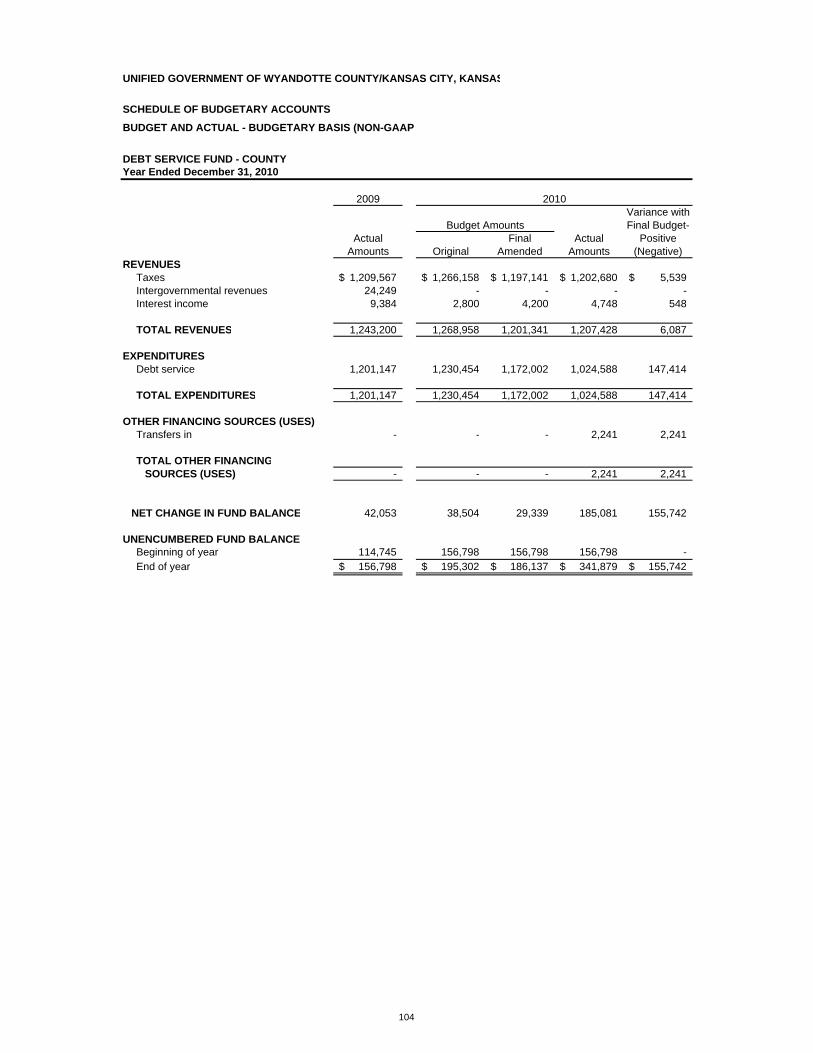
UNIFIED GOVERNMENT OF WYANDOTTE COUNTY/KANSAS CITY, KANSAS
SCHEDULE OF BUDGETARY ACCOUNTS
BUDGET AND ACTUAL - BUDGETARY BASIS (NON-GAAP
DEBT SERVICE FUND - COUNTYYear Ended December 31, 2010
2009 2010Variance with
Budget Amounts Final Budget-Actual Final Actual Positive
Amounts Original Amended Amounts (Negative)REVENUES
Taxes 1,209,567$ 1,266,158$ 1,197,141$ 1,202,680$ 5,539$ Intergovernmental revenues 24,249 - - - - Interest income 9,384 2,800 4,200 4,748 548
TOTAL REVENUES 1,243,200 1,268,958 1,201,341 1,207,428 6,087
EXPENDITURESDebt service 1,201,147 1,230,454 1,172,002 1,024,588 147,414
TOTAL EXPENDITURES 1,201,147 1,230,454 1,172,002 1,024,588 147,414
OTHER FINANCING SOURCES (USES)Transfers in - - - 2,241 2,241
TOTAL OTHER FINANCINGSOURCES (USES) - - - 2,241 2,241
NET CHANGE IN FUND BALANCE 42,053 38,504 29,339 185,081 155,742
UNENCUMBERED FUND BALANCEBeginning of year 114,745 156,798 156,798 156,798 - End of year 156,798$ 195,302$ 186,137$ 341,879$ 155,742$
104
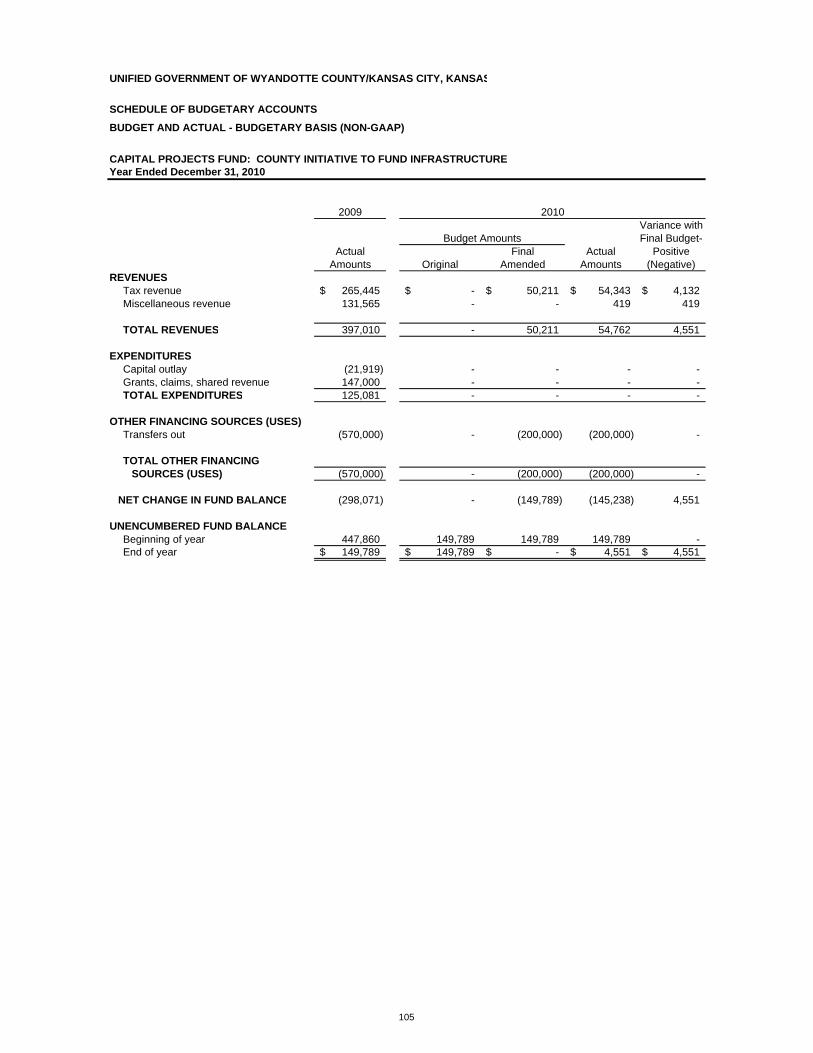
UNIFIED GOVERNMENT OF WYANDOTTE COUNTY/KANSAS CITY, KANSAS
SCHEDULE OF BUDGETARY ACCOUNTS
BUDGET AND ACTUAL - BUDGETARY BASIS (NON-GAAP)
CAPITAL PROJECTS FUND: COUNTY INITIATIVE TO FUND INFRASTRUCTUREYear Ended December 31, 2010
2009 2010Variance with
Budget Amounts Final Budget-Actual Final Actual Positive
Amounts Original Amended Amounts (Negative)REVENUES
Tax revenue 265,445$ -$ 50,211$ 54,343$ 4,132$ Miscellaneous revenue 131,565 - - 419 419
TOTAL REVENUES 397,010 - 50,211 54,762 4,551
EXPENDITURESCapital outlay (21,919) - - - - Grants, claims, shared revenue 147,000 - - - - TOTAL EXPENDITURES 125,081 - - - -
OTHER FINANCING SOURCES (USES)Transfers out (570,000) - (200,000) (200,000) -
TOTAL OTHER FINANCING SOURCES (USES) (570,000) - (200,000) (200,000) -
NET CHANGE IN FUND BALANCE (298,071) - (149,789) (145,238) 4,551
UNENCUMBERED FUND BALANCEBeginning of year 447,860 149,789 149,789 149,789 - End of year 149,789$ 149,789$ -$ 4,551$ 4,551$
105

This page intentionally left blank
106
UNIFIED GOVERNMENT OF WYANDOTTE COUNTY/KANSAS CITY, KANSAS COMPREHENSIVE ANNUAL FINANCIAL REPORT For the year ended DECEMBER 31, 2010
107
ENTERPRISE FUNDS
Revenues from user service fees directly fund the five (5) funds contained in the Enterprise Funds. The Sewer System Enterprise Fund provides financing for Water Pollution Control and is responsible for day-to-day and future operations, routine system maintenance and payment on revenue bonds. The Board of Public Utilities (BPU) is the Unified Government’s Utility System managed, operated, maintained and controlled on a day-to-day basis by the Board of Public Utilities, which is an administrative agency of the Unified Government. The BPU operates the water and electric utilities owned by the Unified Government. Statements for these major enterprise funds are included in the Basic Financial Statements found in the Financial Section of this document. A comparative budgetary schedule of the Sewer System Fund is presented here.
NONMAJOR ENTERPRISE FUNDS
The Emergency Medical Services Fund was established on January 1, 2005 to pay for emergency medical services, including ambulance transport, which are provided by the Kansas City, Kansas Fire Department. Primary sources of revenue are a one-fourth cent public safety sales tax, which was passed by Kansas City, Kansas voters on June 8, 2004 and charges for services. The Public Levee Enterprise Fund expends lease income revenues to pay operation of and improvements to office and warehouse space located in the Fairfax Industrial District. The facility contains approximately 560,000 square fee of industrial and office space on approximately 111 acres. The Stormwater Utility Enterprise Fund receives revenue from the Stormwater Utility fee that is used to fund the operations, maintenance, capital improvements and debt service for the Unified Government’s Municipal Separate Storm Sewer system. The Sunflower Hills Golf Course Fund, established through an interlocal agreement, provides funding for an 18-hole, 192-acre championship golf course and clubhouse facilities. Revenues are generated from greens fees, cart rentals and concessions.
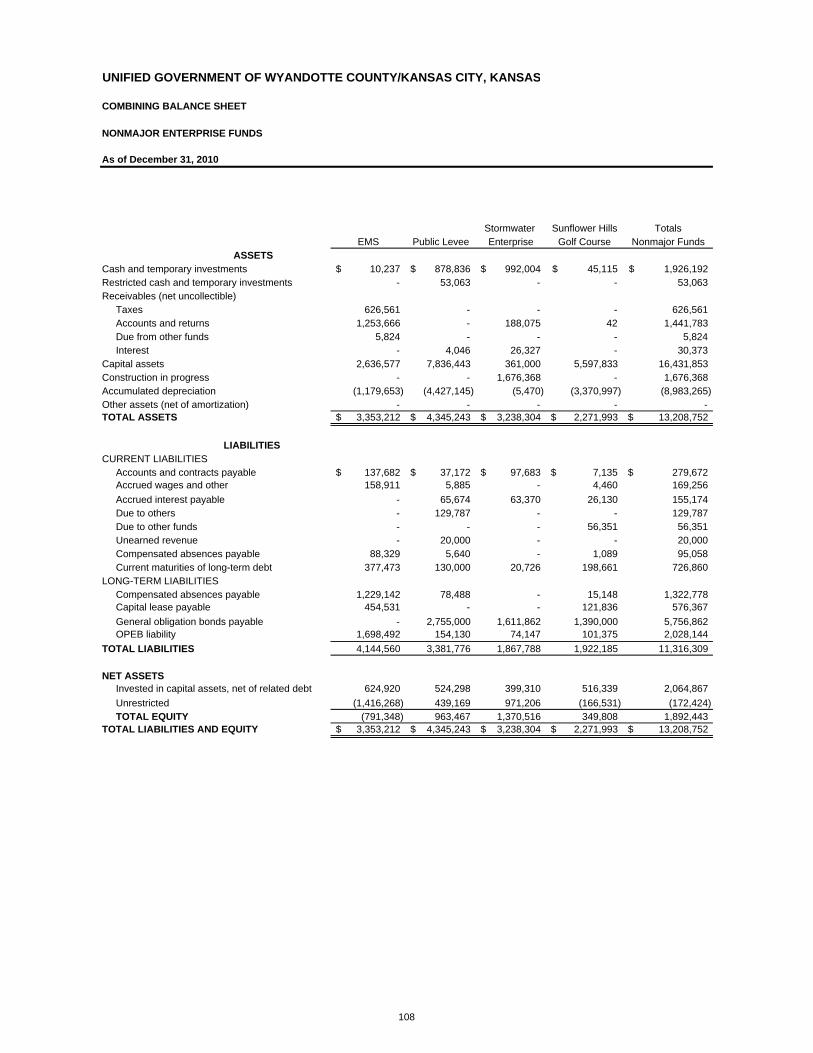
UNIFIED GOVERNMENT OF WYANDOTTE COUNTY/KANSAS CITY, KANSAS
COMBINING BALANCE SHEET
NONMAJOR ENTERPRISE FUNDS
As of December 31, 2010
Stormwater Sunflower Hills TotalsEMS Public Levee Enterprise Golf Course Nonmajor Funds
ASSETSCash and temporary investments 10,237$ 878,836$ 992,004$ 45,115$ 1,926,192$ Restricted cash and temporary investments - 53,063 - - 53,063 Receivables (net uncollectible)
Taxes 626,561 - - - 626,561 Accounts and returns 1,253,666 - 188,075 42 1,441,783 Due from other funds 5,824 - - - 5,824 Interest - 4,046 26,327 - 30,373
Capital assets 2,636,577 7,836,443 361,000 5,597,833 16,431,853 Construction in progress - - 1,676,368 - 1,676,368 Accumulated depreciation (1,179,653) (4,427,145) (5,470) (3,370,997) (8,983,265) Other assets (net of amortization) - - - - - TOTAL ASSETS 3,353,212$ 4,345,243$ 3,238,304$ 2,271,993$ 13,208,752$
LIABILITIES CURRENT LIABILITIES
Accounts and contracts payable 137,682$ 37,172$ 97,683$ 7,135$ 279,672$ Accrued wages and other 158,911 5,885 - 4,460 169,256 Accrued interest payable - 65,674 63,370 26,130 155,174 Due to others - 129,787 - - 129,787 Due to other funds - - - 56,351 56,351 Unearned revenue - 20,000 - - 20,000 Compensated absences payable 88,329 5,640 - 1,089 95,058 Current maturities of long-term debt 377,473 130,000 20,726 198,661 726,860
LONG-TERM LIABILITIES Compensated absences payable 1,229,142 78,488 - 15,148 1,322,778 Capital lease payable 454,531 - - 121,836 576,367 General obligation bonds payable - 2,755,000 1,611,862 1,390,000 5,756,862 OPEB liability 1,698,492 154,130 74,147 101,375 2,028,144
TOTAL LIABILITIES 4,144,560 3,381,776 1,867,788 1,922,185 11,316,309
NET ASSETSInvested in capital assets, net of related debt 624,920 524,298 399,310 516,339 2,064,867 Unrestricted (1,416,268) 439,169 971,206 (166,531) (172,424) TOTAL EQUITY (791,348) 963,467 1,370,516 349,808 1,892,443
TOTAL LIABILITIES AND EQUITY 3,353,212$ 4,345,243$ 3,238,304$ 2,271,993$ 13,208,752$
108

UNIFIED GOVERNMENT OF WYANDOTTE COUNTY/KANSAS CITY, KANSAS
COMBINING STATEMENT OF REVENUES, EXPENSESAND CHANGES IN FUND NET ASSETS
NONMAJOR ENTERPRISE FUNDSYear ended December 31, 2010
Stormwater Sunflower Hills TotalsOPERATING REVENUES EMS Public Levee Enterprise Golf Course Nonmajor Funds
Charges for service 4,414,666$ -$ -$ 669,895$ 5,084,561$ Fines/forfeits/fees - 3,950 2,213,075 - 2,217,025 Earned lease income - 846,946 - - 846,946
TOTAL OPERATING REVENUES 4,414,666 850,896 2,213,075 669,895 8,148,532 OPERATING EXPENSES
EMS 7,093,654 - - - 7,093,654 Public Levee - 1,017,900 - - 1,017,900 Stormwater Enterprise - - 1,411,668 - 1,411,668 Sunflower Hills Golf Course - - - 462,830 462,830
Depreciation and amortization 273,599 241,219 5,470 155,482 675,770 TOTAL OPERATING EXPENSES 7,367,253 1,259,119 1,417,138 618,312 10,661,822
Operating income (loss) (2,952,587) (408,223) 795,937 51,583 (2,513,290)
NON-OPERATING REVENUES (EXPENSES)Taxes 3,738,538 - - - 3,738,538 Interest earnings 689 7,111 37,376 (1,451) 43,725 Interest expense - (154,182) (63,370) (61,394) (278,946)
TOTAL NON-OPERATINGREVENUES (EXPENSES) 3,739,227 (147,071) (25,994) (62,845) 3,503,317
INCOME (LOSS) BEFORE CONTRIBUTIONS 786,640 (555,294) 769,943 (11,262) 990,027 AND TRANSFERS
Transfers in 497,975 - - 148,839 646,814 Transfers out (2,606,000) - (1,632,588) (238) (4,238,826) Capital contributions-local government - - 1,890,356 - 1,890,356
TOTAL CONTRIBUTIONS AND TRANSFERS (2,108,025) - 257,768 148,601 (1,701,656)
CHANGE IN NET ASSETS (1,321,385) (555,294) 1,027,711 137,339 (711,629)
Beginning of year 530,037 1,518,761 342,805 212,469 2,604,072 End of year (791,348)$ 963,467$ 1,370,516$ 349,808$ 1,892,443$
109
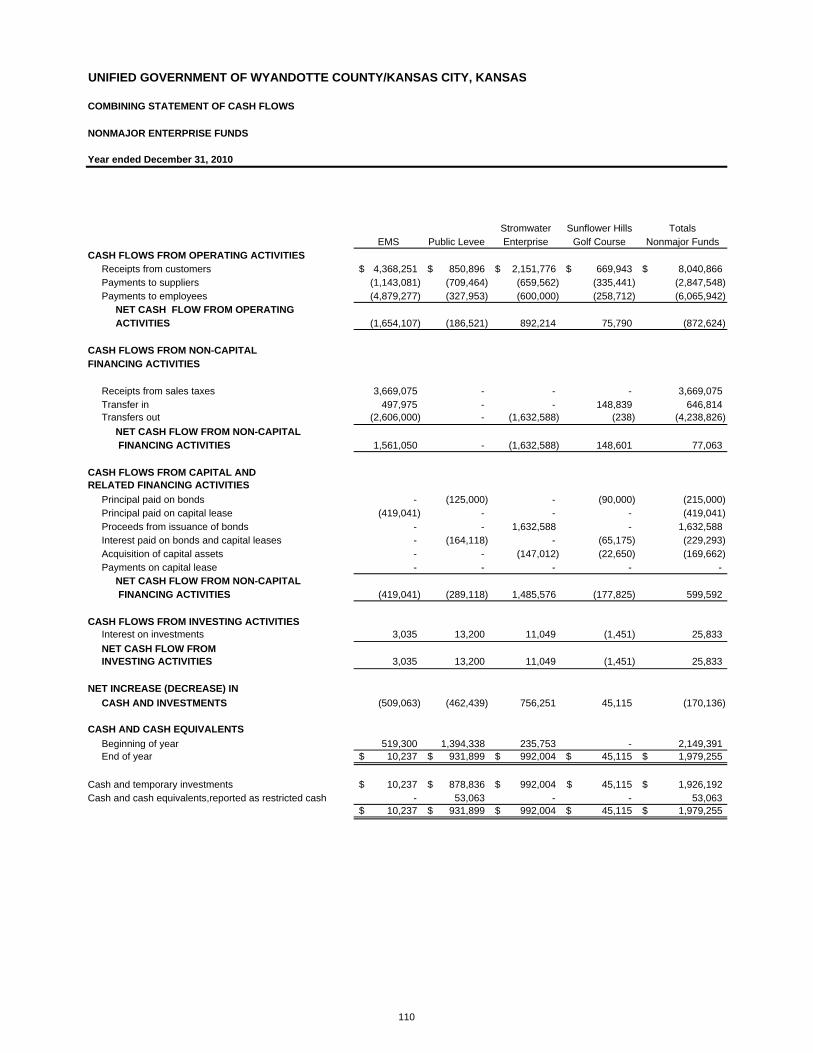
UNIFIED GOVERNMENT OF WYANDOTTE COUNTY/KANSAS CITY, KANSAS
COMBINING STATEMENT OF CASH FLOWS
NONMAJOR ENTERPRISE FUNDS
Year ended December 31, 2010
Stromwater Sunflower Hills TotalsEMS Public Levee Enterprise Golf Course Nonmajor Funds
CASH FLOWS FROM OPERATING ACTIVITIESReceipts from customers 4,368,251$ 850,896$ 2,151,776$ 669,943$ 8,040,866$ Payments to suppliers (1,143,081) (709,464) (659,562) (335,441) (2,847,548) Payments to employees (4,879,277) (327,953) (600,000) (258,712) (6,065,942)
NET CASH FLOW FROM OPERATING ACTIVITIES (1,654,107) (186,521) 892,214 75,790 (872,624)
CASH FLOWS FROM NON-CAPITAL FINANCING ACTIVITIES
Receipts from sales taxes 3,669,075 - - - 3,669,075 Transfer in 497,975 - - 148,839 646,814 Transfers out (2,606,000) - (1,632,588) (238) (4,238,826)
NET CASH FLOW FROM NON-CAPITAL FINANCING ACTIVITIES 1,561,050 - (1,632,588) 148,601 77,063
CASH FLOWS FROM CAPITAL AND RELATED FINANCING ACTIVITIES
Principal paid on bonds - (125,000) - (90,000) (215,000) Principal paid on capital lease (419,041) - - - (419,041) Proceeds from issuance of bonds - - 1,632,588 - 1,632,588 Interest paid on bonds and capital leases - (164,118) - (65,175) (229,293) Acquisition of capital assets - - (147,012) (22,650) (169,662) Payments on capital lease - - - - -
NET CASH FLOW FROM NON-CAPITAL FINANCING ACTIVITIES (419,041) (289,118) 1,485,576 (177,825) 599,592
CASH FLOWS FROM INVESTING ACTIVITIESInterest on investments 3,035 13,200 11,049 (1,451) 25,833 NET CASH FLOW FROM INVESTING ACTIVITIES 3,035 13,200 11,049 (1,451) 25,833
NET INCREASE (DECREASE) IN CASH AND INVESTMENTS (509,063) (462,439) 756,251 45,115 (170,136)
CASH AND CASH EQUIVALENTSBeginning of year 519,300 1,394,338 235,753 - 2,149,391 End of year 10,237$ 931,899$ 992,004$ 45,115$ 1,979,255$
Cash and temporary investments 10,237$ 878,836$ 992,004$ 45,115$ 1,926,192$ Cash and cash equivalents,reported as restricted cash - 53,063 - - 53,063
10,237$ 931,899$ 992,004$ 45,115$ 1,979,255$
110

Stormwater Sunflower Hills TotalsEMS Public Levee Enterprise Golf Course Nonmajor Funds
RECONCILIATION OF OPERATING INCOME TO CASH FLOWS FROM OPERATING ACTIVITIES
Operating Income (2,952,587)$ (408,223)$ 795,937$ 51,583$ (2,513,290)$ Adjustments to reconcile operating income to cash flowfrom operating activities
Depreciation and amortization 273,599 241,219 5,470 155,482 675,770 Changes in assets and liabilities
Accounts receivable (46,415) - (61,299) 48 (107,666) Due from other funds (22,975) - - - (22,975)
Accrued wages and expenses (22,864) 117 - (47,309) (70,056) Accounts payable 81,781 (106,333) 88,389 1,719 65,556 Accrued vacation and sick pay 518,207 21,698 - (55,481) 484,424 Due to others - 30,245 - - 30,245 Due to other funds - - - (57,737) (57,737) OPEB liability 517,147 34,756 63,717 27,485 643,105
NET CASH FROM OPERATING ACTIVITIES (1,654,107)$ (186,521)$ 892,214$ 75,790$ (872,624)$
SUPPLMENTAL DISCLOSURE OF NONCASHCAPITAL AND RELATED FINANCING ACTIVITIES
Capital contributions-local government -$ -$ 1,890,356$ -$ 1,890,356$ Property, plant and equipment acquired with capital leases 482,152 - - 150,497 632,649
111
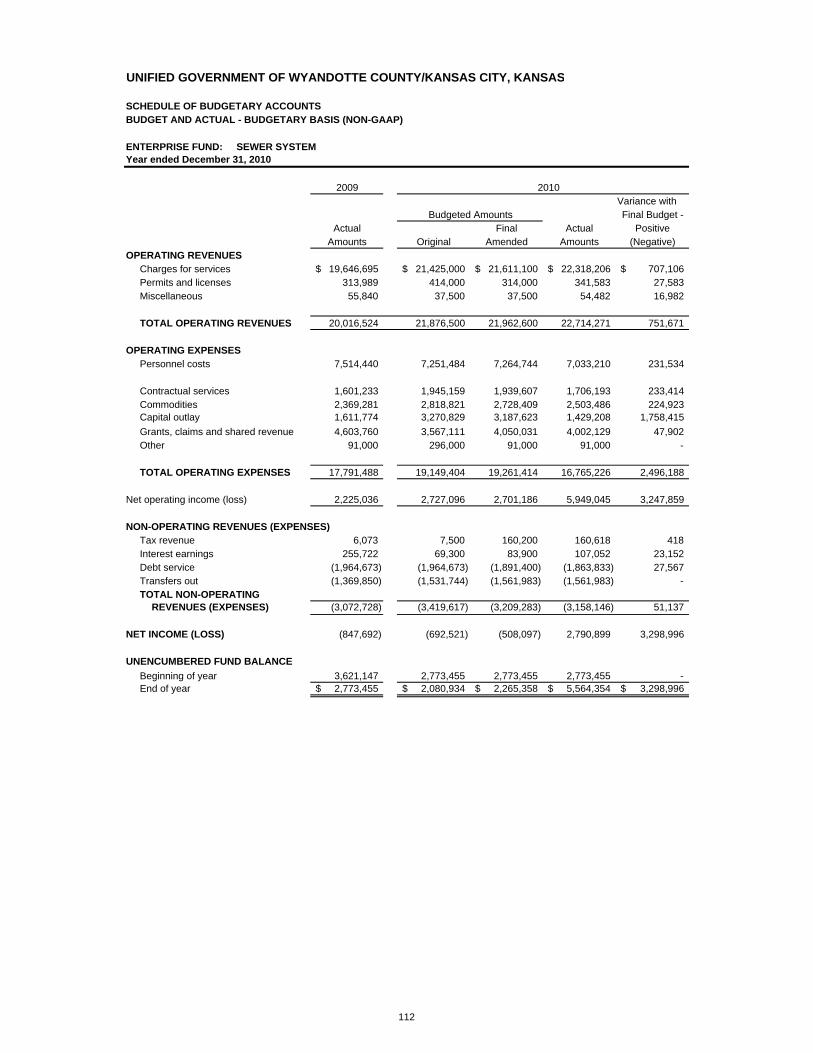
UNIFIED GOVERNMENT OF WYANDOTTE COUNTY/KANSAS CITY, KANSAS
SCHEDULE OF BUDGETARY ACCOUNTSBUDGET AND ACTUAL - BUDGETARY BASIS (NON-GAAP)
ENTERPRISE FUND: SEWER SYSTEMYear ended December 31, 2010
2009 2010Variance withFinal Budget -
Actual Final Actual PositiveAmounts Original Amended Amounts (Negative)
OPERATING REVENUESCharges for services 19,646,695$ 21,425,000$ 21,611,100$ 22,318,206$ 707,106$ Permits and licenses 313,989 414,000 314,000 341,583 27,583 Miscellaneous 55,840 37,500 37,500 54,482 16,982
TOTAL OPERATING REVENUES 20,016,524 21,876,500 21,962,600 22,714,271 751,671
OPERATING EXPENSESPersonnel costs 7,514,440 7,251,484 7,264,744 7,033,210 231,534
Contractual services 1,601,233 1,945,159 1,939,607 1,706,193 233,414 Commodities 2,369,281 2,818,821 2,728,409 2,503,486 224,923 Capital outlay 1,611,774 3,270,829 3,187,623 1,429,208 1,758,415 Grants, claims and shared revenue 4,603,760 3,567,111 4,050,031 4,002,129 47,902 Other 91,000 296,000 91,000 91,000 -
TOTAL OPERATING EXPENSES 17,791,488 19,149,404 19,261,414 16,765,226 2,496,188
Net operating income (loss) 2,225,036 2,727,096 2,701,186 5,949,045 3,247,859
NON-OPERATING REVENUES (EXPENSES)Tax revenue 6,073 7,500 160,200 160,618 418 Interest earnings 255,722 69,300 83,900 107,052 23,152 Debt service (1,964,673) (1,964,673) (1,891,400) (1,863,833) 27,567 Transfers out (1,369,850) (1,531,744) (1,561,983) (1,561,983) - TOTAL NON-OPERATING
REVENUES (EXPENSES) (3,072,728) (3,419,617) (3,209,283) (3,158,146) 51,137
NET INCOME (LOSS) (847,692) (692,521) (508,097) 2,790,899 3,298,996
UNENCUMBERED FUND BALANCEBeginning of year 3,621,147 2,773,455 2,773,455 2,773,455 - End of year 2,773,455$ 2,080,934$ 2,265,358$ 5,564,354$ 3,298,996$
Budgeted Amounts
112
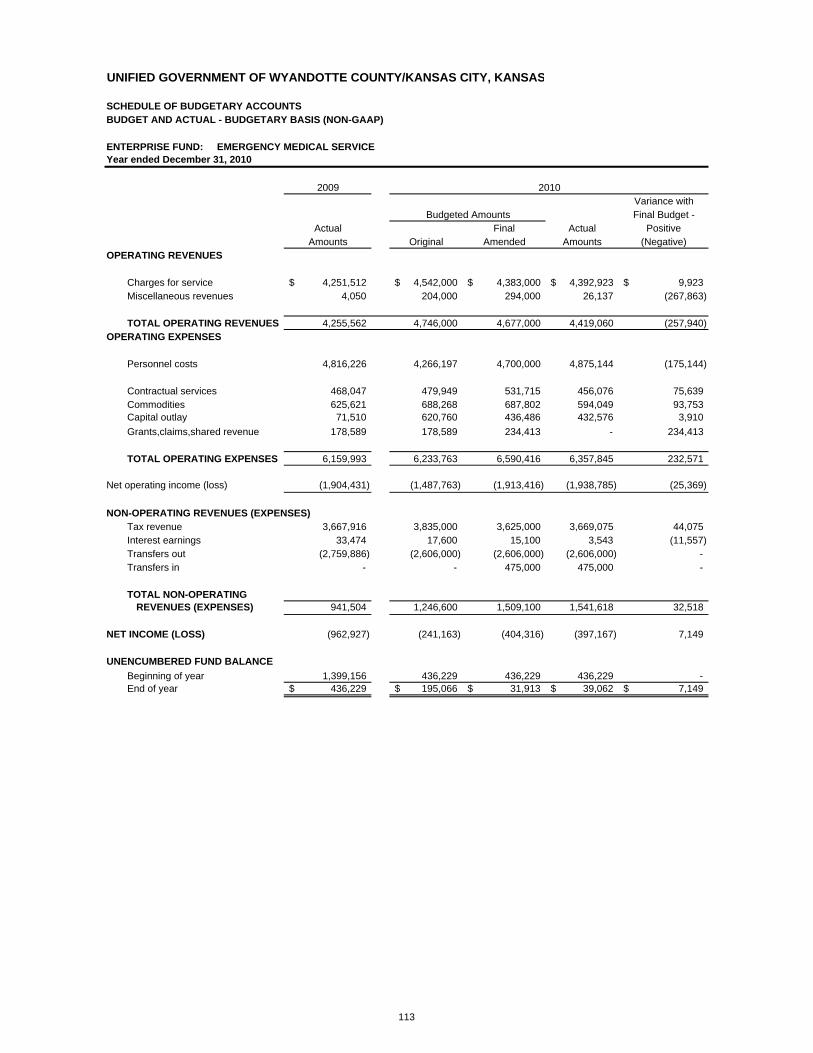
UNIFIED GOVERNMENT OF WYANDOTTE COUNTY/KANSAS CITY, KANSAS
SCHEDULE OF BUDGETARY ACCOUNTSBUDGET AND ACTUAL - BUDGETARY BASIS (NON-GAAP)
ENTERPRISE FUND: EMERGENCY MEDICAL SERVICEYear ended December 31, 2010
2009 2010Variance withFinal Budget -
Actual Final Actual PositiveAmounts Original Amended Amounts (Negative)
OPERATING REVENUES
Charges for service 4,251,512$ 4,542,000$ 4,383,000$ 4,392,923$ 9,923$ Miscellaneous revenues 4,050 204,000 294,000 26,137 (267,863)
TOTAL OPERATING REVENUES 4,255,562 4,746,000 4,677,000 4,419,060 (257,940) OPERATING EXPENSES
Personnel costs 4,816,226 4,266,197 4,700,000 4,875,144 (175,144)
Contractual services 468,047 479,949 531,715 456,076 75,639 Commodities 625,621 688,268 687,802 594,049 93,753 Capital outlay 71,510 620,760 436,486 432,576 3,910 Grants,claims,shared revenue 178,589 178,589 234,413 - 234,413
TOTAL OPERATING EXPENSES 6,159,993 6,233,763 6,590,416 6,357,845 232,571
Net operating income (loss) (1,904,431) (1,487,763) (1,913,416) (1,938,785) (25,369)
NON-OPERATING REVENUES (EXPENSES)Tax revenue 3,667,916 3,835,000 3,625,000 3,669,075 44,075 Interest earnings 33,474 17,600 15,100 3,543 (11,557) Transfers out (2,759,886) (2,606,000) (2,606,000) (2,606,000) - Transfers in - - 475,000 475,000 -
TOTAL NON-OPERATING REVENUES (EXPENSES) 941,504 1,246,600 1,509,100 1,541,618 32,518
NET INCOME (LOSS) (962,927) (241,163) (404,316) (397,167) 7,149
UNENCUMBERED FUND BALANCEBeginning of year 1,399,156 436,229 436,229 436,229 - End of year 436,229$ 195,066$ 31,913$ 39,062$ 7,149$
Budgeted Amounts
113

UNIFIED GOVERNMENT OF WYANDOTTE COUNTY/KANSAS CITY, KANSAS
SCHEDULE OF BUDGETARY ACCOUNTSBUDGET AND ACTUAL - BUDGETARY BASIS (NON-GAAP)
ENTERPRISE FUND: PUBLIC LEVEEYear ended December 31, 2010
2009 2010Variance withFinal Budget -
Actual Final Actual PositiveAmounts Original Amended Amounts (Negative)
OPERATING REVENUESFines/fees/forfeits 5,925$ 6,000$ 6,000$ 3,950$ (2,050)$ Miscellaneous revenues 1,072,965 965,000 855,000 852,162 (2,838)
TOTAL OPERATING REVENUES 1,078,890 971,000 861,000 856,112 (4,888)
OPERATING EXPENSESPersonnel costs 355,428 444,389 444,389 328,070 116,319 Contractual services 381,927 308,806 321,306 270,925 50,381
Commodities 65,807 133,138 124,638 86,372 38,266 Capital outlay 334,888 57,000 30,000 28,566 1,434 Grants, claims, shared revenue 156,021 110,884 95,085 95,085 - Other expenses - 25,000 25,701 - 25,701
TOTAL OPERATING EXPENSES 1,294,071 1,079,217 1,041,119 809,018 232,101
Net operating income (loss) (215,181) (108,217) (180,119) 47,094 227,213
NON-OPERATING REVENUES (EXPENSES)Interest earnings 49,107 24,000 22,100 13,200 (8,900) Debt service (290,298) (289,819) (289,118) (289,118) -
TOTAL NON-OPERATING REVENUES (EXPENSES) (241,191) (265,819) (267,018) (275,918) (8,900)
NET INCOME (LOSS) (456,372) (374,036) (447,137) (228,824) 218,313
UNENCUMBERED FUND BALANCEBeginning of year 1,392,335 935,963 935,963 935,963 - End of year 935,963$ 561,927$ 488,826$ 707,139$ 218,313$
Budgeted Amounts
114
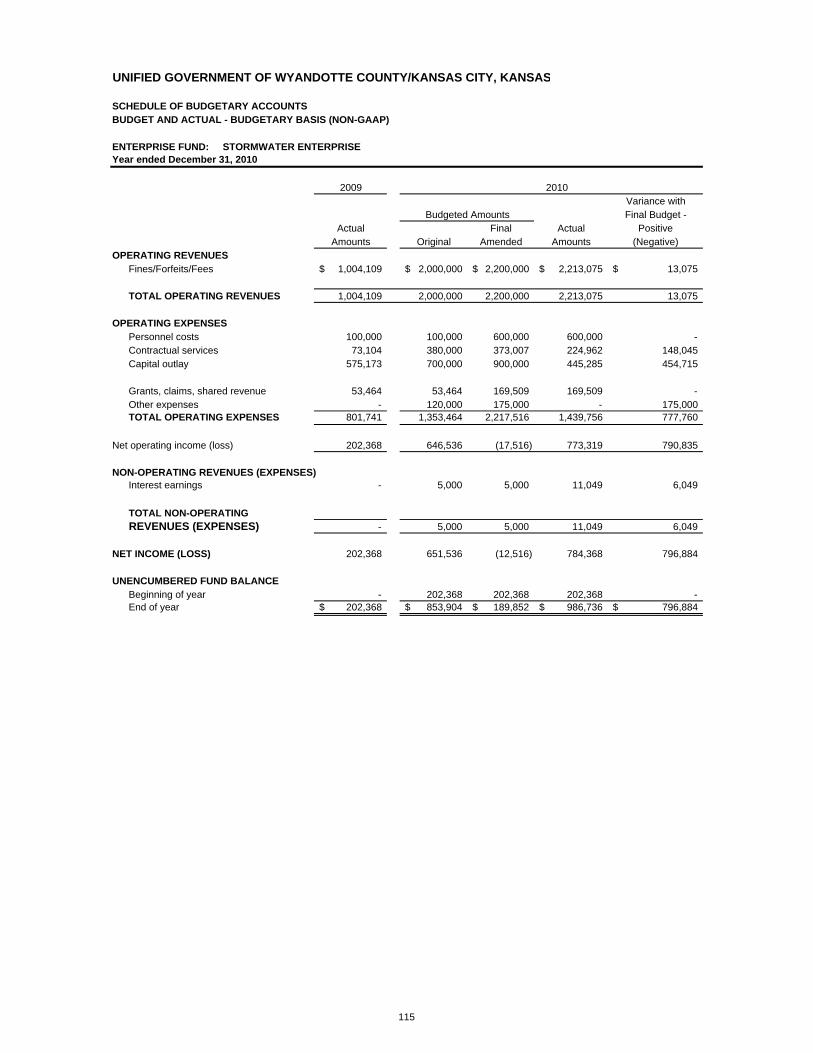
UNIFIED GOVERNMENT OF WYANDOTTE COUNTY/KANSAS CITY, KANSAS
SCHEDULE OF BUDGETARY ACCOUNTSBUDGET AND ACTUAL - BUDGETARY BASIS (NON-GAAP)
ENTERPRISE FUND: STORMWATER ENTERPRISEYear ended December 31, 2010
2009 2010Variance withFinal Budget -
Actual Final Actual PositiveAmounts Original Amended Amounts (Negative)
OPERATING REVENUESFines/Forfeits/Fees 1,004,109$ 2,000,000$ 2,200,000$ 2,213,075$ 13,075$
TOTAL OPERATING REVENUES 1,004,109 2,000,000 2,200,000 2,213,075 13,075
OPERATING EXPENSESPersonnel costs 100,000 100,000 600,000 600,000 - Contractual services 73,104 380,000 373,007 224,962 148,045 Capital outlay 575,173 700,000 900,000 445,285 454,715
Grants, claims, shared revenue 53,464 53,464 169,509 169,509 - Other expenses - 120,000 175,000 - 175,000 TOTAL OPERATING EXPENSES 801,741 1,353,464 2,217,516 1,439,756 777,760
Net operating income (loss) 202,368 646,536 (17,516) 773,319 790,835
NON-OPERATING REVENUES (EXPENSES)Interest earnings - 5,000 5,000 11,049 6,049
TOTAL NON-OPERATING REVENUES (EXPENSES) - 5,000 5,000 11,049 6,049
NET INCOME (LOSS) 202,368 651,536 (12,516) 784,368 796,884
UNENCUMBERED FUND BALANCEBeginning of year - 202,368 202,368 202,368 - End of year 202,368$ 853,904$ 189,852$ 986,736$ 796,884$
Budgeted Amounts
115
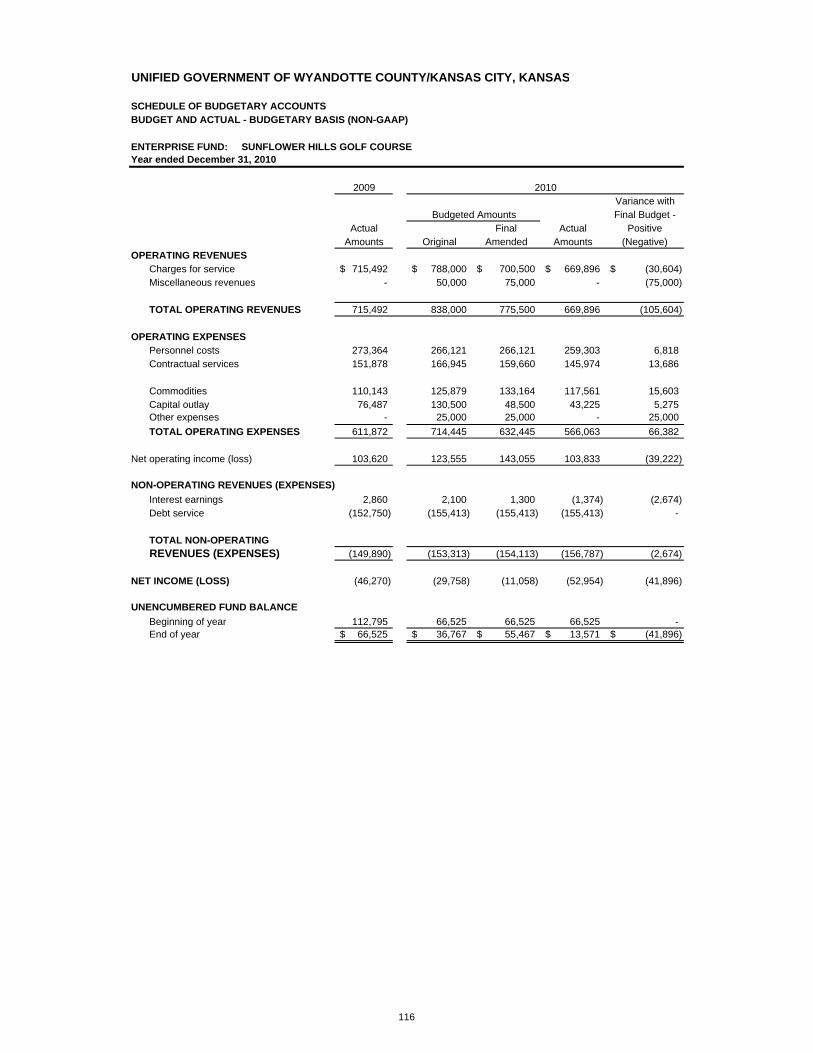
UNIFIED GOVERNMENT OF WYANDOTTE COUNTY/KANSAS CITY, KANSAS
SCHEDULE OF BUDGETARY ACCOUNTSBUDGET AND ACTUAL - BUDGETARY BASIS (NON-GAAP)
ENTERPRISE FUND: SUNFLOWER HILLS GOLF COURSEYear ended December 31, 2010
2009 2010Variance withFinal Budget -
Actual Final Actual PositiveAmounts Original Amended Amounts (Negative)
OPERATING REVENUESCharges for service 715,492$ 788,000$ 700,500$ 669,896$ (30,604)$ Miscellaneous revenues - 50,000 75,000 - (75,000)
TOTAL OPERATING REVENUES 715,492 838,000 775,500 669,896 (105,604)
OPERATING EXPENSESPersonnel costs 273,364 266,121 266,121 259,303 6,818 Contractual services 151,878 166,945 159,660 145,974 13,686
Commodities 110,143 125,879 133,164 117,561 15,603 Capital outlay 76,487 130,500 48,500 43,225 5,275 Other expenses - 25,000 25,000 - 25,000 TOTAL OPERATING EXPENSES 611,872 714,445 632,445 566,063 66,382
Net operating income (loss) 103,620 123,555 143,055 103,833 (39,222)
NON-OPERATING REVENUES (EXPENSES)Interest earnings 2,860 2,100 1,300 (1,374) (2,674) Debt service (152,750) (155,413) (155,413) (155,413) -
TOTAL NON-OPERATING REVENUES (EXPENSES) (149,890) (153,313) (154,113) (156,787) (2,674)
NET INCOME (LOSS) (46,270) (29,758) (11,058) (52,954) (41,896)
UNENCUMBERED FUND BALANCEBeginning of year 112,795 66,525 66,525 66,525 - End of year 66,525$ 36,767$ 55,467$ 13,571$ (41,896)$
Budgeted Amounts
116
UNIFIED GOVERNMENT OF WYANDOTTE COUNTY/KANSAS CITY, KANSAS COMPREHENSIVE ANNUAL FINANCIAL REPORT For the year ended DECEMBER 31, 2010
117
INTERNAL SERVICE FUNDS
The Internal Service Funds section is comprised of three (3) funds. These funds derive their revenues primarily from other Unified Government units and exist to support the implementation of a function. These funds are: The Workers’ Compensation Fund receives revenue from the Unified Government and pays claims submitted by Unified Government employees related to injuries incurred on the job. The fund also pays for administrative services associated with claims review. The Employees’ Hospitalization Fund receives premium revenue from former employees, from current employees to the extent of their contribution, and from the Unified Government as the employer’s share of premiums for health insurance. Expenses include claims paid on behalf of employees and covered dependents, insurance premiums to the Health Plans, administrative services associated with claims review of self-insured plans, and stop-loss insurance premiums for the self-insured plans. The Section 125 – Cafeteria Plan receives deductions from employees’ salary and reimburses employees for expenses related to medical claims or dependent care. All contributions not claimed by employees revert to the Unified Government.
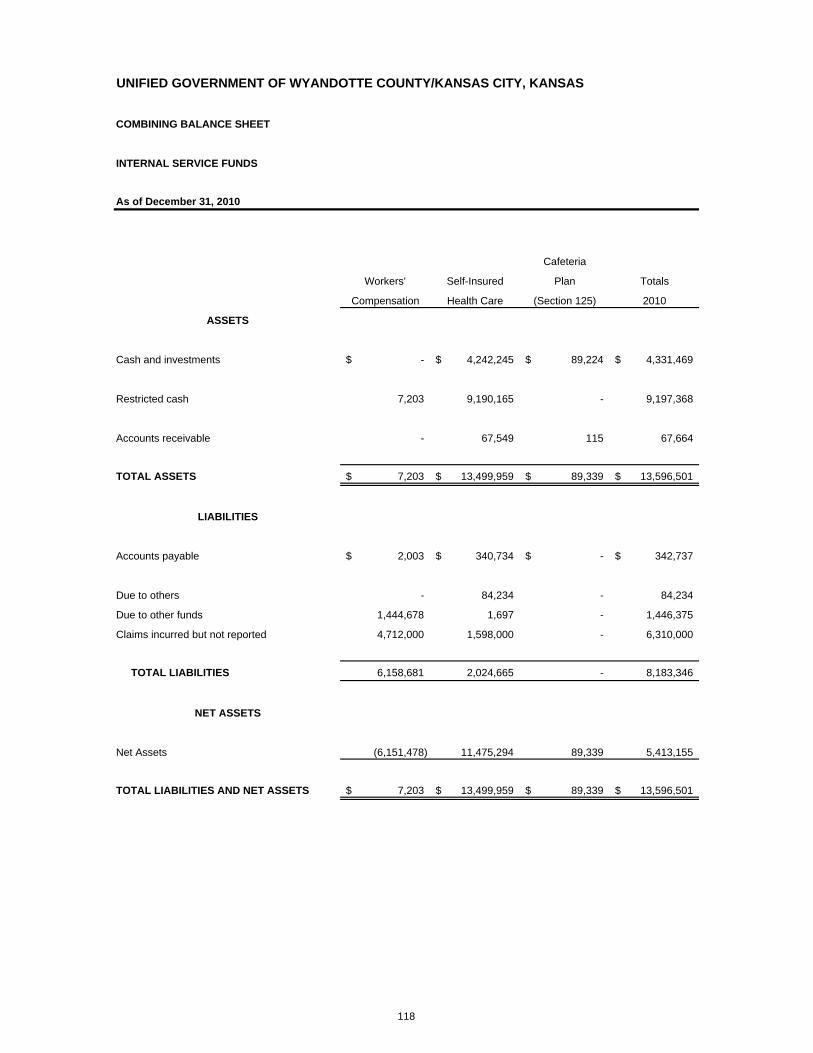
UNIFIED GOVERNMENT OF WYANDOTTE COUNTY/KANSAS CITY, KANSAS
COMBINING BALANCE SHEET
INTERNAL SERVICE FUNDS
As of December 31, 2010
Cafeteria
Workers' Self-Insured Plan Totals
Compensation Health Care (Section 125) 2010
ASSETS
Cash and investments -$ 4,242,245$ 89,224$ 4,331,469$
Restricted cash 7,203 9,190,165 - 9,197,368
Accounts receivable - 67,549 115 67,664
TOTAL ASSETS 7,203$ 13,499,959$ 89,339$ 13,596,501$
LIABILITIES
Accounts payable 2,003$ 340,734$ -$ 342,737$
Due to others - 84,234 - 84,234
Due to other funds 1,444,678 1,697 - 1,446,375
Claims incurred but not reported 4,712,000 1,598,000 - 6,310,000
TOTAL LIABILITIES 6,158,681 2,024,665 - 8,183,346
NET ASSETS
Net Assets (6,151,478) 11,475,294 89,339 5,413,155
TOTAL LIABILITIES AND NET ASSETS 7,203$ 13,499,959$ 89,339$ 13,596,501$
118
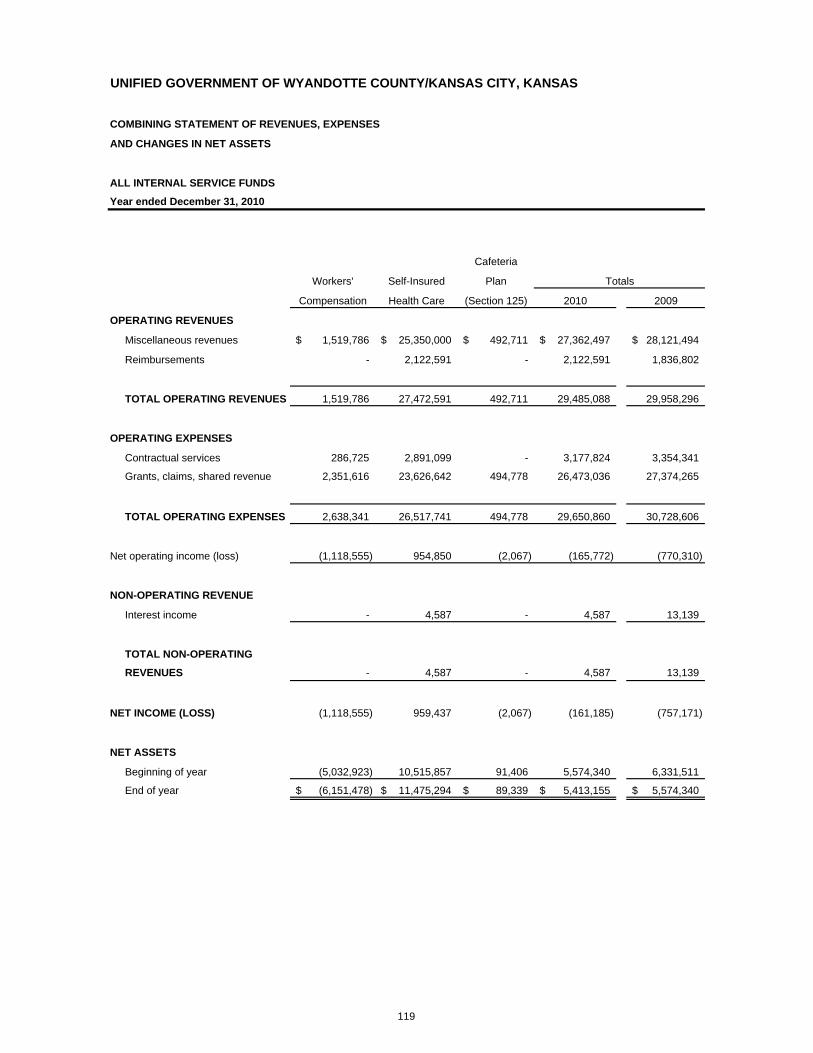
UNIFIED GOVERNMENT OF WYANDOTTE COUNTY/KANSAS CITY, KANSAS
COMBINING STATEMENT OF REVENUES, EXPENSES
AND CHANGES IN NET ASSETS
ALL INTERNAL SERVICE FUNDS
Year ended December 31, 2010
Cafeteria
Workers' Self-Insured Plan Totals
Compensation Health Care (Section 125) 2010 2009
OPERATING REVENUES
Miscellaneous revenues 1,519,786$ 25,350,000$ 492,711$ 27,362,497$ 28,121,494$
Reimbursements - 2,122,591 - 2,122,591 1,836,802
TOTAL OPERATING REVENUES 1,519,786 27,472,591 492,711 29,485,088 29,958,296
OPERATING EXPENSES
Contractual services 286,725 2,891,099 - 3,177,824 3,354,341
Grants, claims, shared revenue 2,351,616 23,626,642 494,778 26,473,036 27,374,265
TOTAL OPERATING EXPENSES 2,638,341 26,517,741 494,778 29,650,860 30,728,606
Net operating income (loss) (1,118,555) 954,850 (2,067) (165,772) (770,310)
NON-OPERATING REVENUE
Interest income - 4,587 - 4,587 13,139
TOTAL NON-OPERATING
REVENUES - 4,587 - 4,587 13,139
NET INCOME (LOSS) (1,118,555) 959,437 (2,067) (161,185) (757,171)
NET ASSETS
Beginning of year (5,032,923) 10,515,857 91,406 5,574,340 6,331,511
End of year (6,151,478)$ 11,475,294$ 89,339$ 5,413,155$ 5,574,340$
119
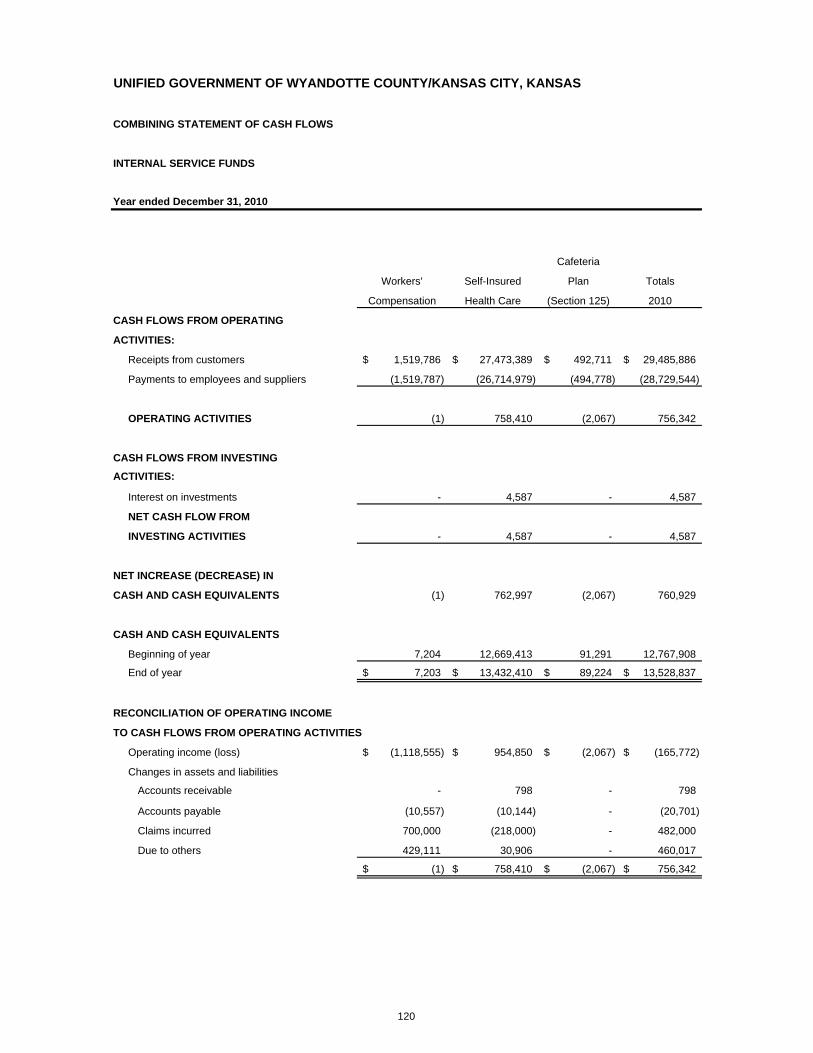
UNIFIED GOVERNMENT OF WYANDOTTE COUNTY/KANSAS CITY, KANSAS
COMBINING STATEMENT OF CASH FLOWS
INTERNAL SERVICE FUNDS
Year ended December 31, 2010
Cafeteria
Workers' Self-Insured Plan Totals
Compensation Health Care (Section 125) 2010
CASH FLOWS FROM OPERATING
ACTIVITIES:
Receipts from customers 1,519,786$ 27,473,389$ 492,711$ 29,485,886$
Payments to employees and suppliers (1,519,787) (26,714,979) (494,778) (28,729,544)
OPERATING ACTIVITIES (1) 758,410 (2,067) 756,342
CASH FLOWS FROM INVESTING
ACTIVITIES:
Interest on investments - 4,587 - 4,587
NET CASH FLOW FROM
INVESTING ACTIVITIES - 4,587 - 4,587
NET INCREASE (DECREASE) IN
CASH AND CASH EQUIVALENTS (1) 762,997 (2,067) 760,929
CASH AND CASH EQUIVALENTS
Beginning of year 7,204 12,669,413 91,291 12,767,908
End of year 7,203$ 13,432,410$ 89,224$ 13,528,837$
RECONCILIATION OF OPERATING INCOME
TO CASH FLOWS FROM OPERATING ACTIVITIES
Operating income (loss) (1,118,555)$ 954,850$ (2,067)$ (165,772)$
Changes in assets and liabilities
Accounts receivable - 798 - 798
Accounts payable (10,557) (10,144) - (20,701)
Claims incurred 700,000 (218,000) - 482,000
Due to others 429,111 30,906 - 460,017
(1)$ 758,410$ (2,067)$ 756,342$
120
UNIFIED GOVERNMENT OF WYANDOTTE COUNTY/KANSAS CITY, KANSAS COMPREHENSIVE ANNUAL FINANCIAL REPORT For the year ended DECEMBER 31, 2010
121
AGENCY FUNDS
An Agency Fund holds money for short periods of time operating primarily as a clearing account. All cash balances are offset by amounts due to others. Agency funds render custodial care to assets pending disbursement to outside entities and include:
• Agency Fund • ETAC Police Chiefs’ Fund • Fire Insurance • Kansas State Withholding • Payroll Deductions
• Register of Deeds • Sheriff • Tax Collection • Tax Distribution • U.S. Savings Bonds
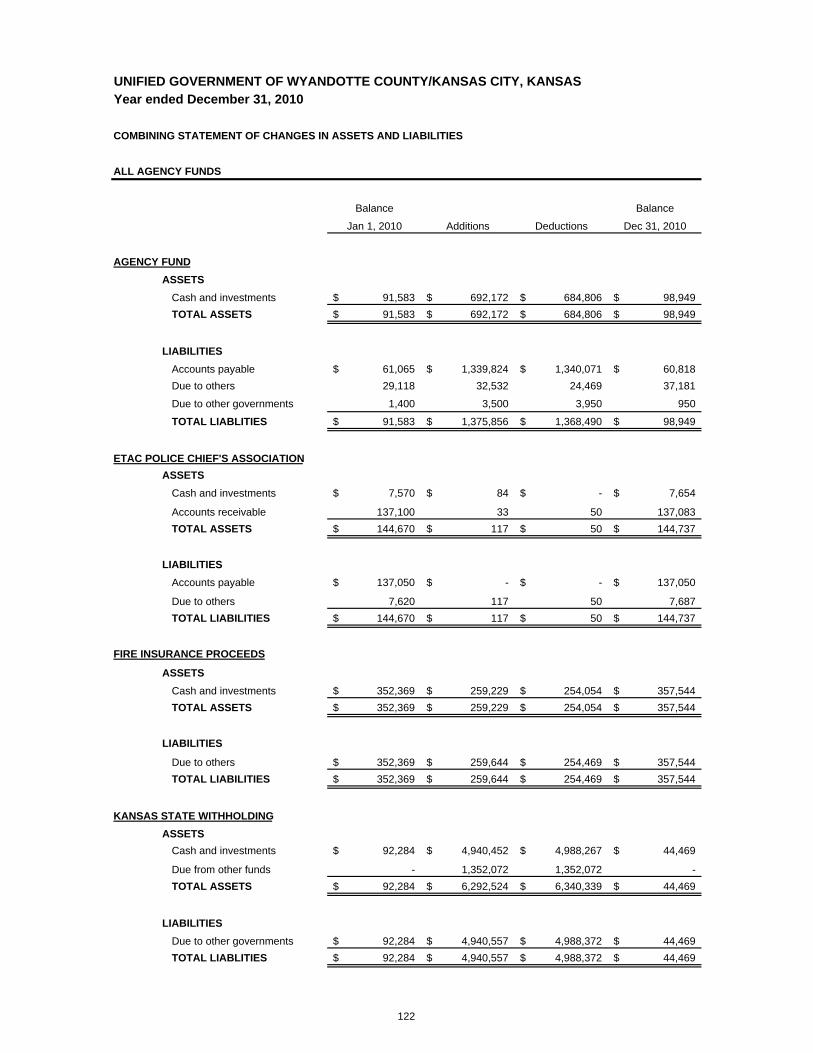
UNIFIED GOVERNMENT OF WYANDOTTE COUNTY/KANSAS CITY, KANSASYear ended December 31, 2010
COMBINING STATEMENT OF CHANGES IN ASSETS AND LIABILITIES
ALL AGENCY FUNDS
Balance Balance
Jan 1, 2010 Additions Deductions Dec 31, 2010
AGENCY FUNDASSETS
Cash and investments 91,583$ 692,172$ 684,806$ 98,949$ TOTAL ASSETS 91,583$ 692,172$ 684,806$ 98,949$
LIABILITIESAccounts payable 61,065$ 1,339,824$ 1,340,071$ 60,818$ Due to others 29,118 32,532 24,469 37,181
Due to other governments 1,400 3,500 3,950 950
TOTAL LIABLITIES 91,583$ 1,375,856$ 1,368,490$ 98,949$
ETAC POLICE CHIEF'S ASSOCIATION ASSETS
Cash and investments 7,570$ 84$ -$ 7,654$
Accounts receivable 137,100 33 50 137,083 TOTAL ASSETS 144,670$ 117$ 50$ 144,737$
LIABILITIESAccounts payable 137,050$ -$ -$ 137,050$
Due to others 7,620 117 50 7,687 TOTAL LIABILITIES 144,670$ 117$ 50$ 144,737$
FIRE INSURANCE PROCEEDS
ASSETSCash and investments 352,369$ 259,229$ 254,054$ 357,544$ TOTAL ASSETS 352,369$ 259,229$ 254,054$ 357,544$
LIABILITIES
Due to others 352,369$ 259,644$ 254,469$ 357,544$ TOTAL LIABILITIES 352,369$ 259,644$ 254,469$ 357,544$
KANSAS STATE WITHHOLDINGASSETS
Cash and investments 92,284$ 4,940,452$ 4,988,267$ 44,469$
Due from other funds - 1,352,072 1,352,072 - TOTAL ASSETS 92,284$ 6,292,524$ 6,340,339$ 44,469$
LIABILITIESDue to other governments 92,284$ 4,940,557$ 4,988,372$ 44,469$ TOTAL LIABLITIES 92,284$ 4,940,557$ 4,988,372$ 44,469$
122
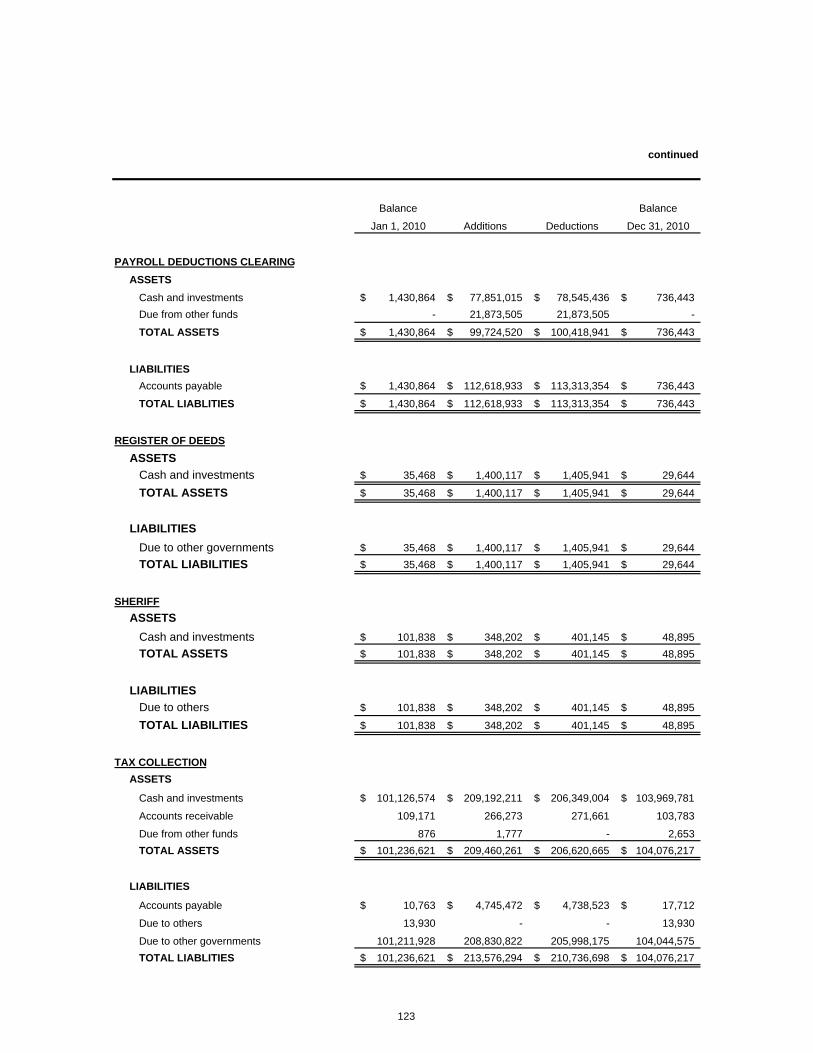
continued
Balance Balance
Jan 1, 2010 Additions Deductions Dec 31, 2010
PAYROLL DEDUCTIONS CLEARINGASSETS
Cash and investments 1,430,864$ 77,851,015$ 78,545,436$ 736,443$ Due from other funds - 21,873,505 21,873,505 -
TOTAL ASSETS 1,430,864$ 99,724,520$ 100,418,941$ 736,443$
LIABILITIESAccounts payable 1,430,864$ 112,618,933$ 113,313,354$ 736,443$
TOTAL LIABLITIES 1,430,864$ 112,618,933$ 113,313,354$ 736,443$
REGISTER OF DEEDSASSETS
Cash and investments 35,468$ 1,400,117$ 1,405,941$ 29,644$
TOTAL ASSETS 35,468$ 1,400,117$ 1,405,941$ 29,644$
LIABILITIESDue to other governments 35,468$ 1,400,117$ 1,405,941$ 29,644$ TOTAL LIABILITIES 35,468$ 1,400,117$ 1,405,941$ 29,644$
SHERIFFASSETS
Cash and investments 101,838$ 348,202$ 401,145$ 48,895$ TOTAL ASSETS 101,838$ 348,202$ 401,145$ 48,895$
LIABILITIESDue to others 101,838$ 348,202$ 401,145$ 48,895$
TOTAL LIABILITIES 101,838$ 348,202$ 401,145$ 48,895$
TAX COLLECTIONASSETS
Cash and investments 101,126,574$ 209,192,211$ 206,349,004$ 103,969,781$
Accounts receivable 109,171 266,273 271,661 103,783
Due from other funds 876 1,777 - 2,653 TOTAL ASSETS 101,236,621$ 209,460,261$ 206,620,665$ 104,076,217$
LIABILITIES
Accounts payable 10,763$ 4,745,472$ 4,738,523$ 17,712$
Due to others 13,930 - - 13,930
Due to other governments 101,211,928 208,830,822 205,998,175 104,044,575 TOTAL LIABLITIES 101,236,621$ 213,576,294$ 210,736,698$ 104,076,217$
123
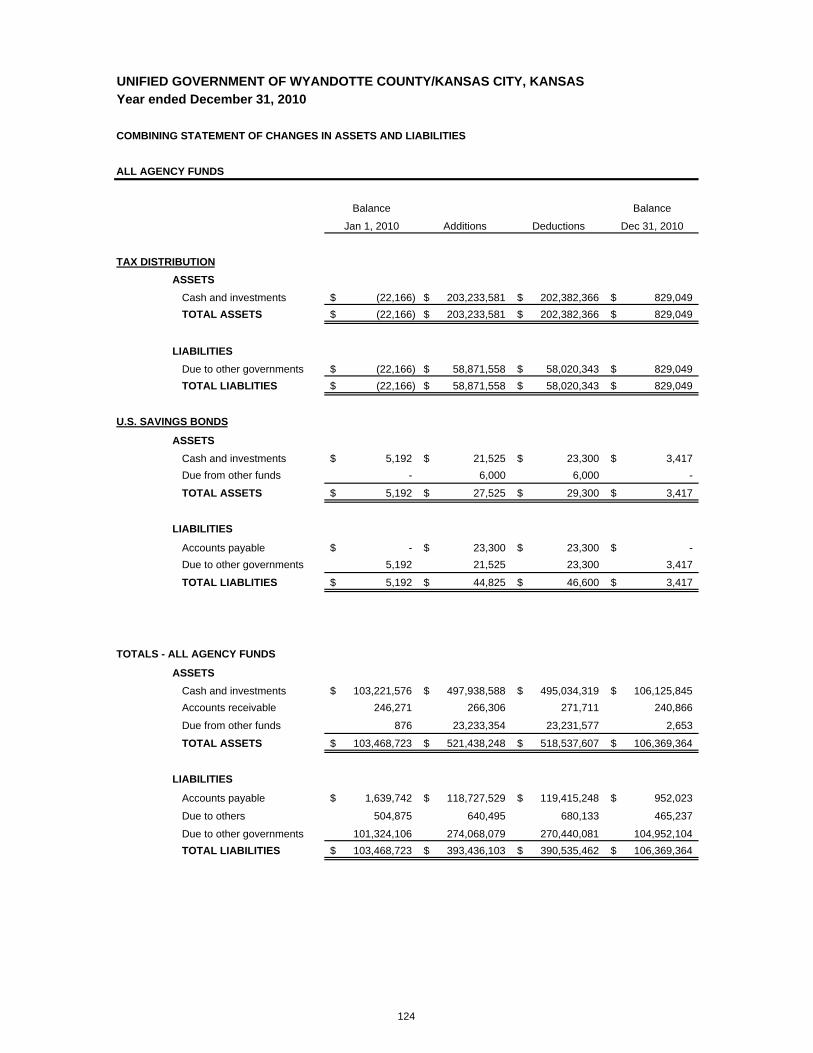
UNIFIED GOVERNMENT OF WYANDOTTE COUNTY/KANSAS CITY, KANSASYear ended December 31, 2010
COMBINING STATEMENT OF CHANGES IN ASSETS AND LIABILITIES
ALL AGENCY FUNDS
Balance Balance
Jan 1, 2010 Additions Deductions Dec 31, 2010
TAX DISTRIBUTIONASSETS
Cash and investments (22,166)$ 203,233,581$ 202,382,366$ 829,049$ TOTAL ASSETS (22,166)$ 203,233,581$ 202,382,366$ 829,049$
LIABILITIESDue to other governments (22,166)$ 58,871,558$ 58,020,343$ 829,049$ TOTAL LIABLITIES (22,166)$ 58,871,558$ 58,020,343$ 829,049$
U.S. SAVINGS BONDS
ASSETSCash and investments 5,192$ 21,525$ 23,300$ 3,417$ Due from other funds - 6,000 6,000 -
TOTAL ASSETS 5,192$ 27,525$ 29,300$ 3,417$
LIABILITIES
Accounts payable -$ 23,300$ 23,300$ -$ Due to other governments 5,192 21,525 23,300 3,417
TOTAL LIABLITIES 5,192$ 44,825$ 46,600$ 3,417$
TOTALS - ALL AGENCY FUNDS
ASSETS
Cash and investments 103,221,576$ 497,938,588$ 495,034,319$ 106,125,845$ Accounts receivable 246,271 266,306 271,711 240,866
Due from other funds 876 23,233,354 23,231,577 2,653
TOTAL ASSETS 103,468,723$ 521,438,248$ 518,537,607$ 106,369,364$
LIABILITIES
Accounts payable 1,639,742$ 118,727,529$ 119,415,248$ 952,023$
Due to others 504,875 640,495 680,133 465,237
Due to other governments 101,324,106 274,068,079 270,440,081 104,952,104 TOTAL LIABILITIES 103,468,723$ 393,436,103$ 390,535,462$ 106,369,364$
124

125
STATISTICAL SECTION
The Statistical Section presents detailed information as a context for understanding what the information in the financial statements, note disclosures, and required supplementary information says about the city’s overall financial health. Contents Page Financial Trends 126
These schedules contain trend information to help the reader understand how the city’s financial performance and well-being have changed over time.
Revenue Capacity 132 These schedules contain information to help the reader assess the factors affecting the
city’s ability to generate its property and sales tax. Debt Capacity 137 These schedules present information to help the reader assess the affordability of the
city’s current levels of outstanding debt and the city’s ability to issue additional debt in the future.
Demographic and Economic Information 141 These schedules offer demographic and economic indicators to help the reader
understand the environment within which the city’s financial activities take place and to help make comparisons over time and with other governments.
Operating Information 143 These schedules contain information about the city’s operations and resources to help
the reader understand how the city’s financial information relates to the services the city provides and the activities it performs.
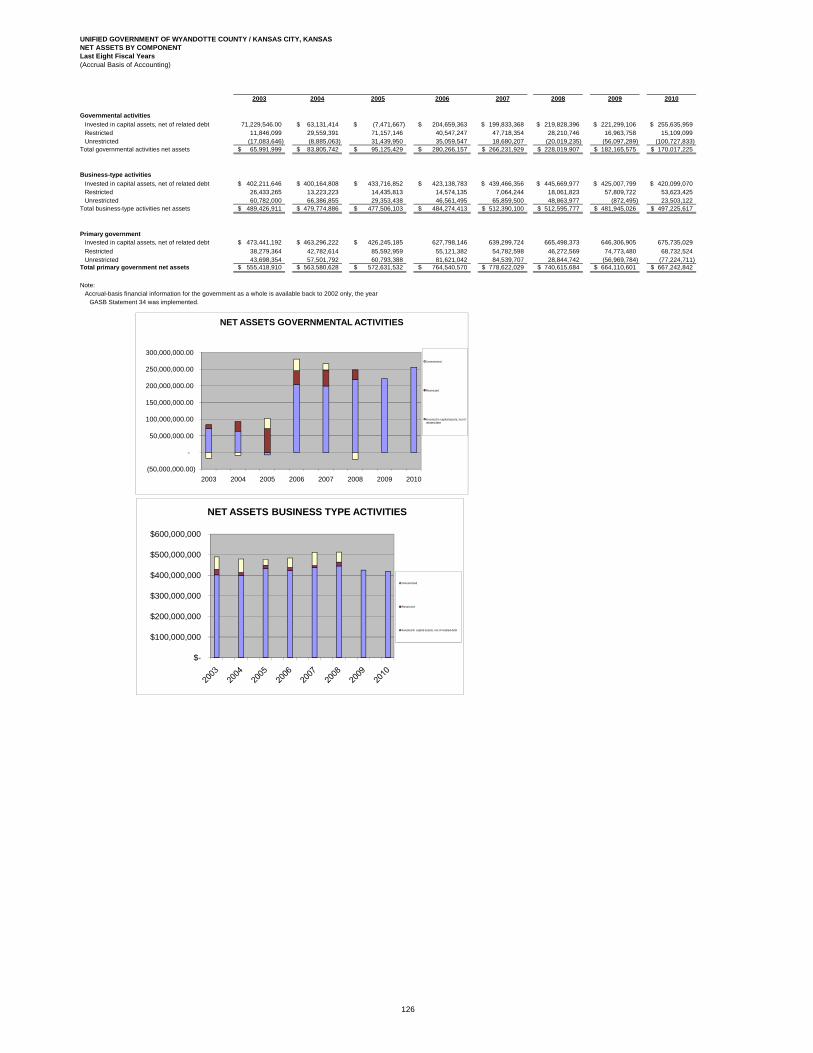
2003 2004 2005 2006 2007 2008 2009 2010
Governmental activitiesInvested in capital assets, net of related debt 71,229,546.00 63,131,414$ (7,471,667)$ 204,659,363$ 199,833,368$ 219,828,396$ 221,299,106$ 255,635,959$ Restricted 11,846,099 29,559,391 71,157,146 40,547,247 47,718,354 28,210,746 16,963,758 15,109,099Unrestricted (17,083,646) (8,885,063) 31,439,950 35,059,547 18,680,207 (20,019,235) (56,097,289) (100,727,833)
Total governmental activities net assets 65,991,999$ 83,805,742$ 95,125,429$ 280,266,157$ 266,231,929$ 228,019,907$ 182,165,575$ 170,017,225$
Business-type activitiesInvested in capital assets, net of related debt 402,211,646$ 400,164,808$ 433,716,852$ 423,138,783$ 439,466,356$ 445,669,977$ 425,007,799$ 420,099,070$ Restricted 26,433,265 13,223,223 14,435,813 14,574,135 7,064,244 18,061,823 57,809,722 53,623,425 Unrestricted 60,782,000 66,386,855 29,353,438 46,561,495 65,859,500 48,863,977 (872,495) 23,503,122
Total business-type activities net assets 489,426,911$ 479,774,886$ 477,506,103$ 484,274,413$ 512,390,100$ 512,595,777$ 481,945,026$ 497,225,617$
Primary governmentInvested in capital assets, net of related debt 473,441,192$ 463,296,222$ 426,245,185$ 627,798,146 639,299,724 665,498,373 646,306,905 675,735,029Restricted 38,279,364 42,782,614 85,592,959 55,121,382 54,782,598 46,272,569 74,773,480 68,732,524Unrestricted 43,698,354 57,501,792 60,793,388 81,621,042 84,539,707 28,844,742 (56,969,784) (77,224,711)
Total primary government net assets 555,418,910$ 563,580,628$ 572,631,532$ 764,540,570$ 778,622,029$ 740,615,684$ 664,110,601$ 667,242,842$
Note: Accrual-basis financial information for the government as a whole is available back to 2002 only, the year
GASB Statement 34 was implemented.
UNIFIED GOVERNMENT OF WYANDOTTE COUNTY / KANSAS CITY, KANSASNET ASSETS BY COMPONENTLast Eight Fiscal Years(Accrual Basis of Accounting)
(50,000,000.00)
-
50,000,000.00
100,000,000.00
150,000,000.00
200,000,000.00
250,000,000.00
300,000,000.00
2003 2004 2005 2006 2007 2008 2009 2010
NET ASSETS GOVERNMENTAL ACTIVITIES
Unrestricted
Restricted
Invested in capital assets, net of related debt
NET ASSETS BUSINESS TYPE ACTIVITIES
$-
$100,000,000
$200,000,000
$300,000,000
$400,000,000
$500,000,000
$600,000,000
Unrestricted
Restricted
Invested in capital assets, net of related debt
126
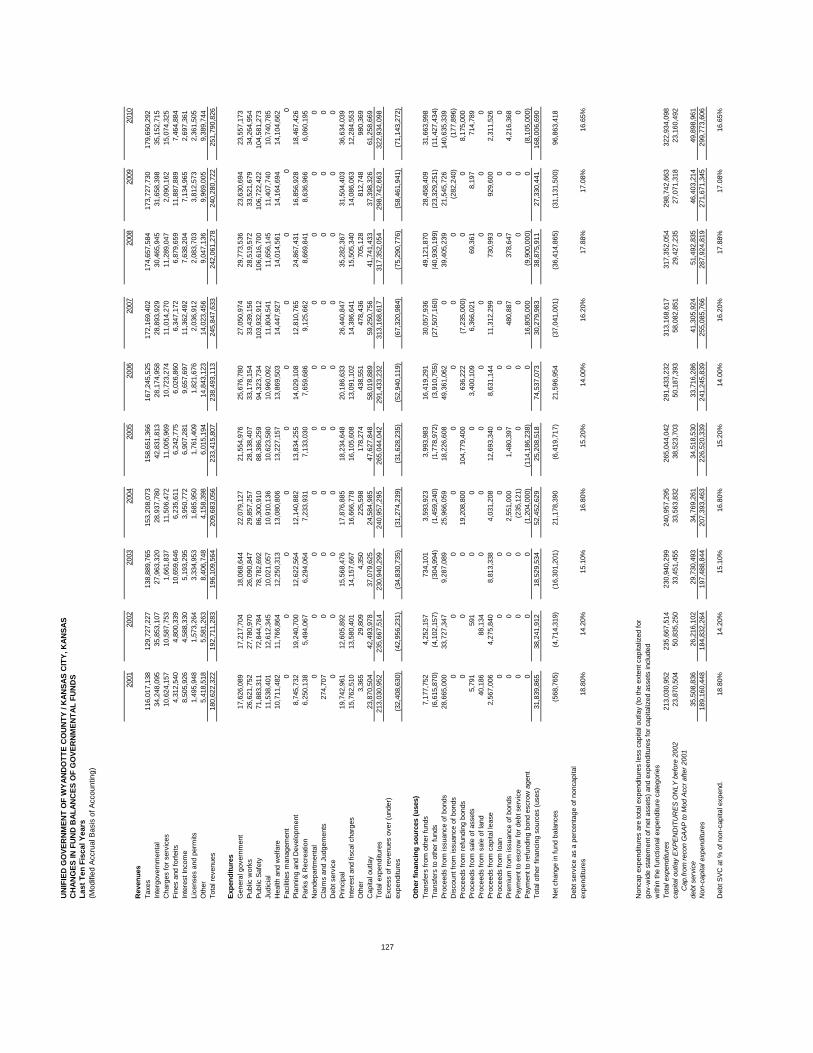
2001
2002
2003
2004
2005
2006
2007
2008
2009
2010
Rev
enue
sTa
xes
116,
017,
138
129,
727,
227
138,
889,
765
153,
208,
073
158,
651,
366
167,
245,
525
172,
169,
402
174,
657,
584
173,
727,
730
179,
650,
292
Inte
rgov
ernm
enta
l34
,248
,095
35,8
53,1
0727
,963
,320
28,9
37,7
8042
,831
,813
28,1
74,9
5828
,893
,929
30,4
65,9
45
31,6
58,3
98
35,1
52,7
15
Cha
rges
for s
ervi
ces
10,6
24,1
5710
,587
,753
1,66
1,83
711
,506
,472
11,0
05,9
6910
,723
,274
11,0
14,2
70
11
,289
,047
2,
090,
162
15
,074
,325
Fi
nes
and
forfe
its4,
312,
540
4,80
0,33
910
,659
,646
6,23
5,61
16,
242,
775
6,02
6,86
06,
347,
172
6,
879,
659
11,8
87,8
89
7,46
4,88
4In
tere
st In
com
e8,
505,
926
4,58
8,33
05,
193,
295
3,95
0,77
26,
907,
281
9,65
7,69
711
,362
,492
7,63
8,20
4
7,
134,
965
2,
697,
361
Li
cens
es a
nd p
erm
its1,
495,
948
1,57
3,26
43,
334,
953
1,68
5,95
01,
761,
409
1,82
1,67
62,
036,
912
2,
083,
703
3,81
2,57
3
2,36
1,50
5
Oth
er5,
418,
518
5,58
1,26
38,
406,
748
4,15
8,39
86,
015,
194
14,8
43,1
2314
,023
,456
9,04
7,13
6
9,
969,
005
9,
389,
744
To
tal r
even
ues
180,
622,
322
192,
711,
283
196,
109,
564
209,
683,
056
233,
415,
807
238,
493,
113
245,
847,
633
242,
061,
278
240,
280,
722
251,
790,
826
Expe
nditu
res
Gen
eral
gov
ernm
ent
17,6
26,0
8917
,217
,704
18,0
68,6
4422
,079
,127
21,5
54,9
7625
,676
,780
27,0
50,9
74
29
,773
,536
23
,630
,694
23
,557
,173
Pu
blic
wor
ks26
,621
,752
27,7
80,9
7026
,090
,847
29,8
57,2
5728
,138
,407
33,1
78,1
5433
,439
,156
28,5
19,5
7233
,521
,679
34,2
64,9
54Pu
blic
Saf
ety
71,8
83,3
1172
,844
,784
78,7
82,6
9286
,300
,910
88,3
86,2
5994
,323
,734
103,
932,
912
106,
616,
700
106,
722,
422
104,
581,
273
Judi
cial
11,5
38,4
0112
,612
,345
10,0
21,0
5710
,910
,136
10,6
23,5
8010
,960
,092
11,8
04,5
41
11
,656
,145
11
,407
,740
10
,740
,785
H
ealth
and
wel
fare
10,7
11,4
8211
,766
,864
12,2
50,3
1313
,080
,806
13,2
27,1
5713
,869
,503
14,4
47,9
27
14
,014
,561
14
,164
,694
14
,104
,662
Fa
cilit
ies
man
agem
ent
00
00
00
00
00
Plan
ning
and
Dev
elop
men
t8,
745,
732
19,2
40,7
0012
,622
,564
12,1
40,8
8213
,834
,255
14,0
29,1
0812
,810
,765
24,8
67,4
31
16,8
56,9
2818
,467
,426
Park
s &
Rec
reat
ion
6,25
0,13
85,
494,
067
6,29
4,06
47,
233,
931
7,13
3,03
07,
659,
686
9,12
5,66
2
8,66
9,84
1
8,
636,
966
6,
060,
195
N
onde
partm
enta
l0
00
00
00
00
0C
laim
s an
d Ju
dgem
ents
274,
707
00
00
00
00
0D
ebt s
ervi
ce0
00
00
00
00
0Pr
inci
pal
19,7
42,9
6112
,605
,892
15,5
68,4
7617
,876
,885
18,2
34,6
4820
,186
,633
26,4
40,8
47
35
,282
,367
31
,504
,403
36,6
34,0
39In
tere
st a
nd fi
scal
cha
rges
15,7
62,5
1013
,580
,401
14,1
57,6
6716
,666
,778
16,1
05,6
0813
,091
,102
14,3
86,6
41
15
,505
,340
14
,086
,063
12,2
84,5
53O
ther
3,36
529
,809
4,35
022
5,59
817
8,27
443
8,55
147
8,43
6
70
5,12
8
812,
748
980,
369
Cap
ital o
utla
y23
,870
,504
42,4
93,9
7837
,079
,625
24,5
84,9
8547
,627
,848
58,0
19,8
8959
,250
,756
41,7
41,4
33
37,3
98,3
26
61,2
58,6
69
Tota
l exp
endi
ture
s21
3,03
0,95
223
5,66
7,51
423
0,94
0,29
924
0,95
7,29
526
5,04
4,04
229
1,43
3,23
231
3,16
8,61
731
7,35
2,05
429
8,74
2,66
332
2,93
4,09
8Ex
cess
of r
even
ues
over
(und
er)
expe
nditu
res
(32,
408,
630)
(42,
956,
231)
(34,
830,
735)
(31,
274,
239)
(31,
628,
235)
(52,
940,
119)
(67,
320,
984)
(75,
290,
776)
(58,
461,
941)
(71,
143,
272)
Oth
er fi
nanc
ing
sour
ces
(use
s)Tr
ansf
ers
from
oth
er fu
nds
7,17
7,75
24,
252,
157
734,
101
3,59
3,92
33,
993,
983
16,4
19,2
9130
,057
,936
49,1
21,8
70
28,4
58,4
09
31,6
63,9
98
Tran
sfer
s to
oth
er fu
nds
(6,6
15,8
70)
(4,1
02,1
57)
(304
,994
)(1
,459
,240
)(1
,778
,972
)(3
,910
,755
)(2
7,50
7,16
0)
(40,
930,
199)
(23,
329,
251)
(1
1,42
7,43
4)
UN
IFIE
D G
OVE
RN
MEN
T O
F W
YAN
DO
TTE
CO
UN
TY /
KAN
SAS
CIT
Y, K
ANSA
SC
HAN
GES
IN F
UN
D B
ALAN
CES
OF
GO
VER
NM
ENTA
L FU
ND
SLa
st T
en F
isca
l Yea
rs(M
odifi
ed A
ccru
al B
asis
of A
ccou
ntin
g)
127
(,
,)
(,
,)
(,
)(
,,
)(
,,
)(
,,
)(
,,
)(
,,
)(
,,
)(
,,
)Pr
ocee
ds fr
om is
suan
ce o
f bon
ds28
,665
,000
33,7
27,3
479,
287,
089
25,9
66,0
5918
,226
,608
49,3
61,0
620
39,4
05,2
39
21,5
45,7
26
140,
635,
339
Dis
coun
t fro
m is
suan
ce o
f bon
ds0
00
00
00
0(2
82,2
40)
(177
,896
)Pr
ocee
ds fr
om re
fund
ing
bond
s0
00
19,2
08,8
0010
4,77
9,40
063
6,22
2(7
,235
,000
)
00
8,17
5,00
0Pr
ocee
ds fr
om s
ale
of a
sset
s5,
791
591
00
03,
400,
109
6,36
6,02
1
69,3
61
8,19
7
71
4,78
9
Pr
ocee
ds fr
om s
ale
of la
nd40
,186
88,1
340
00
00
00
0Pr
ocee
ds fr
om c
apita
l lea
se2,
567,
006
4,27
5,84
08,
813,
338
4,03
1,20
812
,693
,340
8,63
1,14
411
,312
,299
730,
993
929,
600
2,31
1,52
6Pr
ocee
ds fr
om lo
an0
00
00
00
00
0Pr
emiu
m fr
om is
suan
ce o
f bon
ds0
00
2,55
1,00
01,
480,
397
048
0,88
7
37
8,64
7
04,
216,
368
Paym
ent t
o es
crow
for d
ebt s
ervi
ce0
00
(235
,121
)0
00
00
0Pa
ymen
t to
refu
ndin
g bo
nd e
scro
w a
gent
00
0(1
,204
,000
)(1
14,1
86,2
38)
016
,805
,000
(9,9
00,0
00)
0(8
,105
,000
)To
tal o
ther
fina
ncin
g so
urce
s (u
ses)
31,8
39,8
6538
,241
,912
18,5
29,5
3452
,452
,629
25,2
08,5
1874
,537
,073
30,2
79,9
8338
,875
,911
27,3
30,4
4116
8,00
6,69
0
Net
cha
nge
in fu
nd b
alan
ces
(568
,765
)(4
,714
,319
)(1
6,30
1,20
1)21
,178
,390
(6,4
19,7
17)
21,5
96,9
54(3
7,04
1,00
1)(3
6,41
4,86
5)(3
1,13
1,50
0)96
,863
,418
Deb
t ser
vice
as
a pe
rcen
tage
of n
onca
pita
lex
pend
iture
s18
.80%
14.2
0%15
.10%
16.8
0%15
.20%
14.0
0%16
.20%
17.8
8%17
.08%
16.6
5%
Non
cap
expe
nditu
res
are
tota
l exp
endi
ture
s le
ss c
apita
l out
lay
(to th
e ex
tent
cap
italiz
ed fo
rgo
v-w
ide
stat
emen
t of n
et a
sset
s) a
nd e
xpen
ditu
res
for c
apita
lized
ass
ets
incl
uded
with
in th
e fu
nctio
nal e
xpen
ditu
re c
ateg
orie
sTo
tal e
xpen
ditu
res
213,
030,
952
235,
667,
514
230,
940,
299
240,
957,
295
265,
044,
042
291,
433,
232
313,
168,
617
317,
352,
054
298,
742,
663
322,
934,
098
capi
tal o
utla
y EX
PEN
DIT
UR
ES O
NLY
bef
ore
2002
23,8
70,5
0450
,835
,250
33,4
51,4
5533
,563
,832
38,5
23,7
0350
,187
,393
58,0
82,8
5129
,427
,235
27,0
71,3
1823
,160
,492
C
ap.fr
om re
con
GAA
P to
Mod
Acc
r afte
r 200
1de
bt s
ervi
ce35
,508
,836
26,2
16,1
0229
,730
,493
34,7
69,2
6134
,518
,530
33,7
16,2
8641
,305
,924
51,4
92,8
3546
,403
,214
49,8
98,9
61N
on-c
apita
l exp
endi
ture
s18
9,16
0,44
818
4,83
2,26
419
7,48
8,84
420
7,39
3,46
322
6,52
0,33
924
1,24
5,83
925
5,08
5,76
628
7,92
4,81
927
1,67
1,34
529
9,77
3,60
6
Deb
t SVC
at %
of n
on-c
apita
l exp
end.
18.8
0%14
.20%
15.1
0%16
.80%
15.2
0%14
.00%
16.2
0%17
.88%
17.0
8%16
.65%

2003 2004 2005 2006 2007 2008 2009 2010ExpensesGovernmental activities:
General government 20,450,817$ 24,150,922$ 25,959,678$ 27,673,242$ $30,290,793 $38,152,695 $28,883,020 $27,087,733Public safety 91,883,771 97,508,137 101,728,966 105,717,926 124,080,775 133,104,186 135,838,855 128,169,717 Public works 40,662,535 33,112,307 44,311,788 58,489,179 54,490,909 58,852,528 58,231,382 49,439,819 Health and welfare 12,655,563 12,795,008 13,373,754 13,769,503 14,798,255 14,715,932 14,496,775 14,729,903 Parks and recreation 6,664,348 6,813,175 7,002,155 7,361,313 9,343,632 9,801,025 9,409,508 6,476,736 Planning and development 12,210,291 12,418,389 14,304,521 14,283,076 12,907,802 17,431,756 23,102,672 41,321,126 Interest on long-term debt 13,790,519 13,516,281 12,963,447 14,125,057 15,987,447 16,041,480 15,629,555 17,491,196
Total governmental activities expenses 198,317,844 200,314,219 219,644,309 241,419,296 261,899,613 288,099,602 285,591,767 284,716,230
Business-type activities: Electric and water systems 199,977,106 209,076,832 232,559,743 250,258,575 230,920,697 238,766,982 236,173,513 221,565,124 Public levee 1,005,850 1,061,810 1,093,984 1,271,762 1,527,795 1,164,347 1,504,174 1,413,301 EMS 0 0 3,734,121 3,849,025 5,081,613 5,824,847 6,944,949 7,367,253 Stormwater 0 0 0 0 0 0 661,304 1,480,508 Sewer system 18,750,083 20,864,558 20,094,031 21,530,247 21,365,521 22,056,220 23,788,544 17,772,564 Sunflower Hills golf course 911,061 883,174 949,965 861,923 759,816 910,510 819,472 679,706 Total business-type activities expenses 220,644,100 231,886,374 258,431,844 277,771,532 259,655,442 268,722,906 269,891,956 250,278,456
Total primary government expenses 418,961,944$ 432,200,593$ 478,076,153$ 519,190,828$ 521,555,055$ 556,822,508$ 555,483,723$ 534,994,686$
Program RevenuesCharges for services:
General government 3,079,145$ 3,746,853$ 2,859,284$ 2,738,188$ 2,931,976$ 2,582,381$ 3,549,937$ 4,623,345$ Public safety 6,393,201 8,247,080 7,513,049 7,293,839 8,062,735 9,021,180 9,073,041 9,840,757 Public works 4,425,284 4,466,741 3,971,522 4,464,289 4,271,881 4,716,235 6,693,601 8,028,250 Health and welfare 898,229 510,671 942,128 945,870 987,319 1,539,141 789,085 162,850 Parks and recreation 505,744 508,492 538,004 540,683 584,603 556,240 585,003 1,166,756 Planning and development 2,429,005 2,926,358 3,690,690 3,113,349 3,128,384 2,615,712 2,259,151 3,201,347
Operating grants and contributions:General government 101,650 55,217 404,467 461,422 559,762 588,008 857,042 886,779 Public safety 5,879,312 4,837,755 5,610,602 6,214,383 5,724,447 6,248,268 4,685,658 6,135,125 Public works 7,752,699 8,444,469 8,809,026 7,430,081 9,664,249 9,000,428 7,863,473 7,696,076 Health and welfare 7,492,093 7,868,850 8,192,238 8,409,496 8,276,022 7,896,489 7,921,420 8,087,027 Parks and recreation 253,403 459,032 347,330 422,436 830,506 580,812 3,050,717 2,700,000 Planning and development 5,808,274 7,090,819 5,992,414 5,725,466 4,893,831 7,677,848 8,537,247 12,826,305 Interest on long-term debt 0 0 0 0 0 0 0 340,372
Capital grants and contributions:General government 108,829 0 0 0 0 0 0 0Public works 877,367 2,012,330 14,404,547 789,990 249,372 2,284,824 2,742,209 1,446,928Planning and development 665,708 589,030 212,243 972,508 187,037 139,622 217,585 649,659
Total governmental activities program revenues 46,669,943 51,763,697 63,487,544 49,522,000 50,352,124 55,447,188 58,825,169 67,791,576
Business-type activities:Charges for services:Electric and Water systems 201,535,316 207,407,693 221,945,484 258,910,231 228,782,367 240,093,868 210,068,949 237,159,626 EMS 0 0 3,207,214 3,365,556 3,269,900 4,216,457 4,251,550 4,414,666 Public Levee 957,759 985,475 984,779 988,970 991,053 1,083,636 1,077,112 850,896 Stormwater 0 0 0 0 0 0 1,004,109 2,213,075 Sewer System 17,033,222 17,017,442 15,628,899 17,279,920 17,515,426 18,067,391 18,140,230 19,855,939 Sunflower Hill Golf Course 632,293 720,372 740,497 826,618 747,656 729,321 715,492 669,895
Operating grants and contributions:Capital grants and contributions:
Electric and Water systems 1,166,323 275,314 1,281,668 1,403,996 880,873 1,466,171 209,965 300,888 Sewer System 0 0 0 0 0 0 0 566,162
Total business-type activities program revenues 221,324,913 226,406,296 243,788,541 282,775,291 252,187,275 265,656,844 235,467,407 266,031,147 Total primary government program revenues 267,994,856$ 278,169,993$ 307,276,085$ 332,297,291$ 302,539,399$ 321,104,032$ 294,292,576$ 333,822,723$
Net (Expense)/RevenueGovernmental activities (151,647,901)$ (148,550,522)$ (156,156,765)$ (191,897,296)$ (211,547,489)$ (232,652,414)$ (226,766,598)$ (216,924,654)$ Business-type activities 680,813 (5,480,078) (14,643,303) 5,003,759 (7,468,167) (3,066,062) (34,424,549) 15,752,691
Total primary government net expense (150,967,088)$ (154,030,600)$ (170,800,068)$ (186,893,537)$ (219,015,656)$ (235,718,476)$ (261,191,147)$ (201,171,963)$
UNIFIED GOVERNMENT OF WYANDOTTE COUNTY / KANSAS CHANGES IN NET ASSETSLast Seven Fiscal Years(Accrual Basis of Accounting)
128
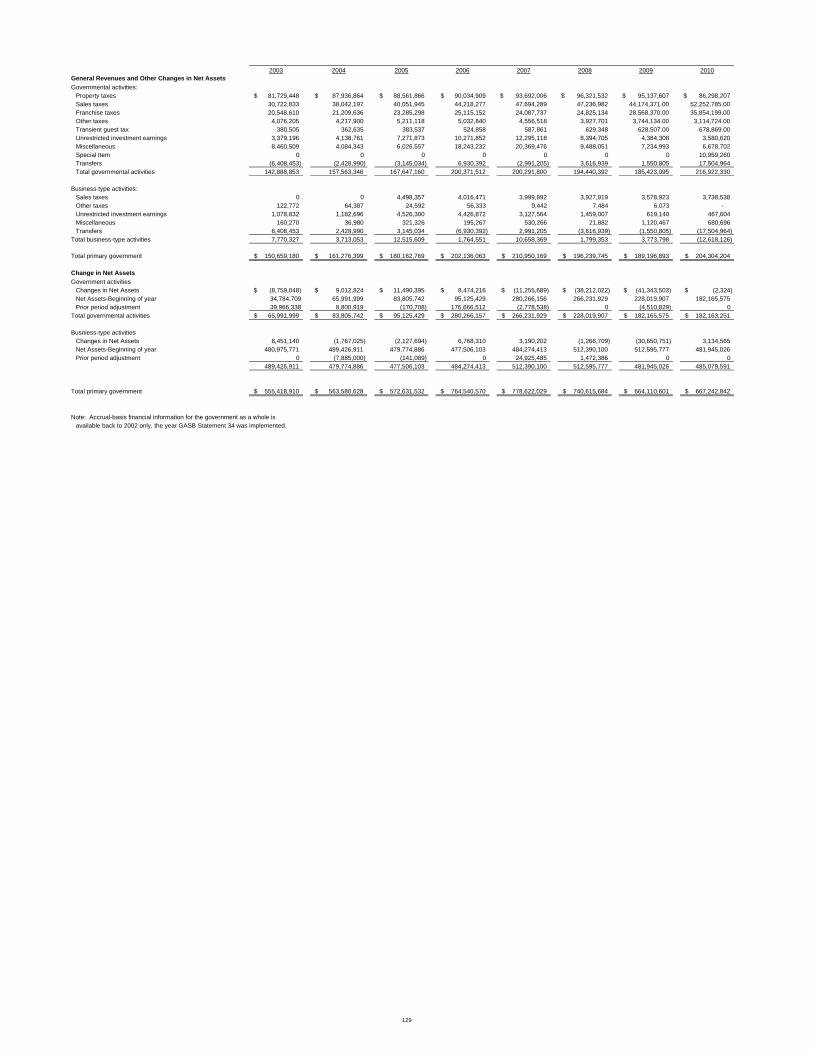
2003 2004 2005 2006 2007 2008 2009 2010General Revenues and Other Changes in Net AssetsGovernmental activities:
Property taxes 81,729,448$ 87,936,864$ 88,561,866$ 90,034,909$ 93,692,006$ 96,321,532$ 95,137,607$ 86,298,207$ Sales taxes 30,722,833 38,042,197 40,051,945 44,218,277 47,694,289 47,236,982 44,174,371.00 52,252,785.00 Franchise taxes 20,548,610 21,209,636 23,285,298 25,115,152 24,087,737 24,825,134 28,568,370.00 35,854,199.00 Other taxes 4,076,205 4,217,900 5,211,118 5,032,840 4,556,518 3,927,701 3,744,134.00 3,114,724.00 Transient guest tax 380,505 362,635 383,537 524,858 587,861 629,348 628,507.00 678,869.00 Unrestricted investment earnings 3,379,196 4,138,761 7,271,873 10,271,852 12,295,118 8,394,705 4,384,308 3,580,620 Miscellaneous 8,460,509 4,084,343 6,026,557 18,243,232 20,369,476 9,488,051 7,234,993 6,678,702 Special Item 0 0 0 0 0 0 0 10,959,260 Transfers (6,408,453) (2,428,990) (3,145,034) 6,930,392 (2,991,205) 3,616,939 1,550,805 17,504,964 Total governmental activities 142,888,853 157,563,346 167,647,160 200,371,512 200,291,800 194,440,392 185,423,095 216,922,330
Business-type activities:Sales taxes 0 0 4,498,357 4,016,471 3,999,892 3,927,919 3,578,923 3,738,538 Other taxes 122,772 64,387 24,592 56,333 9,442 7,484 6,073 - Unrestricted investment earnings 1,078,832 1,182,696 4,526,300 4,426,872 3,127,564 1,459,007 619,140 467,604 Miscellaneous 160,270 36,980 321,326 195,267 530,266 21,882 1,120,467 680,696 Transfers 6,408,453 2,428,990 3,145,034 (6,930,392) 2,991,205 (3,616,939) (1,550,805) (17,504,964)
Total business-type activities 7,770,327 3,713,053 12,515,609 1,764,551 10,658,369 1,799,353 3,773,798 (12,618,126)
Total primary government 150,659,180$ 161,276,399$ 180,162,769$ 202,136,063$ 210,950,169$ 196,239,745$ 189,196,893$ 204,304,204$
Change in Net AssetsGovernment activities
Changes in Net Assets (8,759,048)$ 9,012,824$ 11,490,395$ 8,474,216$ (11,255,689)$ (38,212,022)$ (41,343,503)$ (2,324)$ Net Assets-Beginning of year 34,784,709 65,991,999 83,805,742 95,125,429 280,266,156 266,231,929 228,019,907 182,165,575 Prior period adjustment 39,966,338 8,800,919 (170,708) 176,666,512 (2,778,538) 0 (4,510,829) 0
Total governmental activities 65,991,999$ 83,805,742$ 95,125,429$ 280,266,157$ 266,231,929$ 228,019,907$ 182,165,575$ 182,163,251$
Busniess-type activitiesChanges in Net Assets 8,451,140 (1,767,025) (2,127,694) 6,768,310 3,190,202 (1,266,709) (30,650,751) 3,134,565 Net Assets-Beginning of year 480,975,771 489,426,911 479,774,886 477,506,103 484,274,413 512,390,100 512,595,777 481,945,026 Prior period adjustment 0 (7,885,000) (141,089) 0 24,925,485 1,472,386 0 0
489,426,911 479,774,886 477,506,103 484,274,413 512,390,100 512,595,777 481,945,026 485,079,591
Total primary government 555,418,910$ 563,580,628$ 572,631,532$ 764,540,570$ 778,622,029$ 740,615,684$ 664,110,601$ 667,242,842$
Note: Accrual-basis financial information for the government as a whole isavailable back to 2002 only, the year GASB Statement 34 was implemented.
129
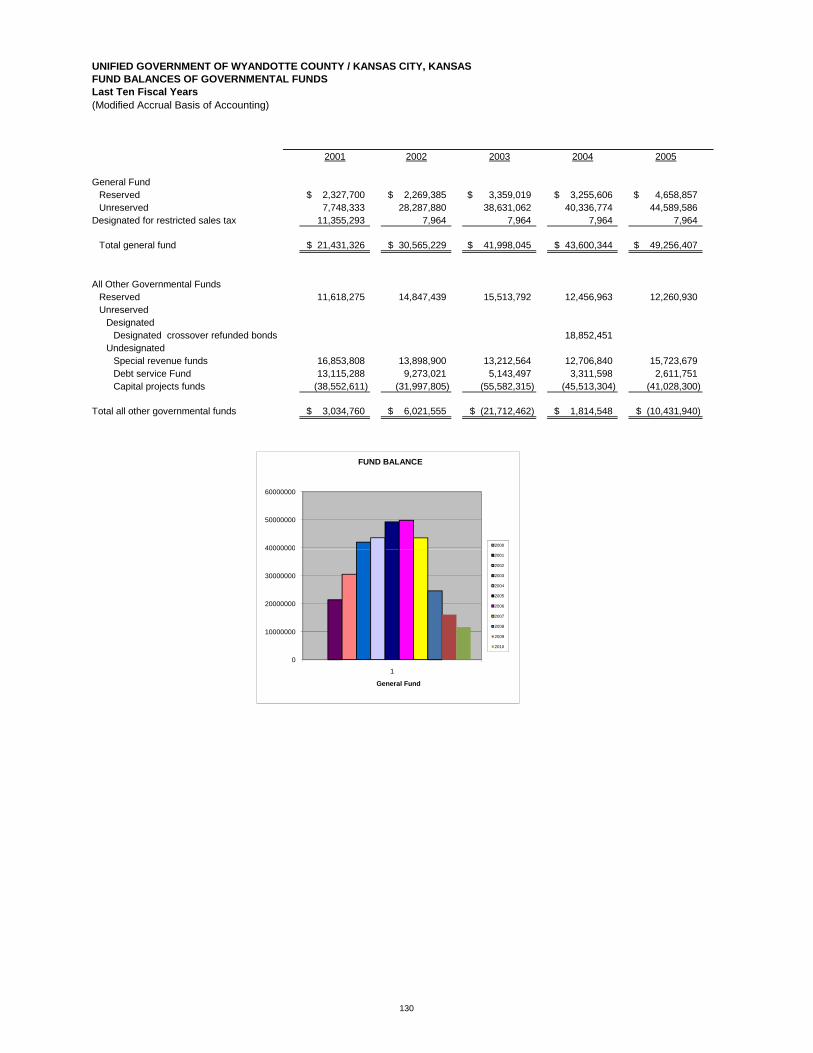
2001 2002 2003 2004 2005
General FundReserved 2,327,700$ 2,269,385$ 3,359,019$ 3,255,606$ 4,658,857$ Unreserved 7,748,333 28,287,880 38,631,062 40,336,774 44,589,586
Designated for restricted sales tax 11,355,293 7,964 7,964 7,964 7,964
Total general fund 21,431,326$ 30,565,229$ 41,998,045$ 43,600,344$ 49,256,407$
All Other Governmental FundsReserved 11,618,275 14,847,439 15,513,792 12,456,963 12,260,930 Unreserved
DesignatedDesignated crossover refunded bonds 18,852,451
UndesignatedSpecial revenue funds 16,853,808 13,898,900 13,212,564 12,706,840 15,723,679 Debt service Fund 13,115,288 9,273,021 5,143,497 3,311,598 2,611,751 Capital projects funds (38,552,611) (31,997,805) (55,582,315) (45,513,304) (41,028,300)
Total all other governmental funds 3,034,760$ 6,021,555$ (21,712,462)$ 1,814,548$ (10,431,940)$
UNIFIED GOVERNMENT OF WYANDOTTE COUNTY / KANSAS CITY, KANSASFUND BALANCES OF GOVERNMENTAL FUNDSLast Ten Fiscal Years(Modified Accrual Basis of Accounting)
40000000
50000000
60000000
FUND BALANCE
2000
0
10000000
20000000
30000000
40000000
1
General Fund
2001
2002
2003
2004
2005
2006
2007
2008
2009
2010
130
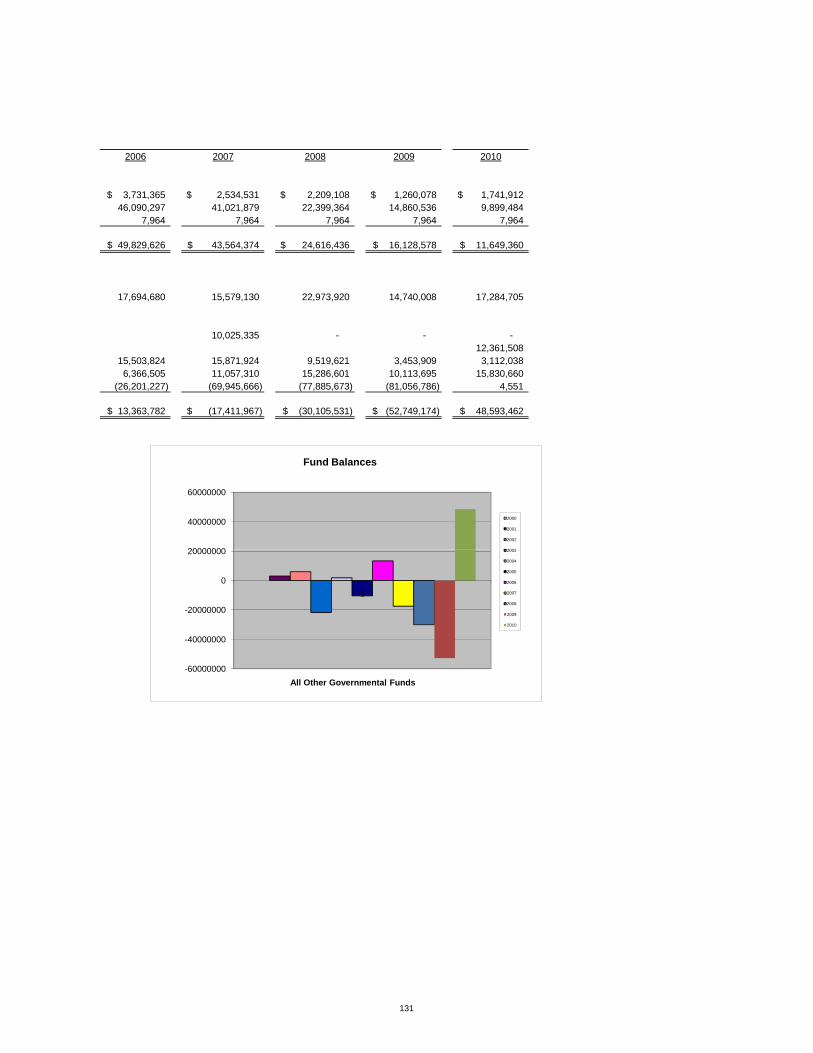
2006 2007 2008 2009 2010
3,731,365$ 2,534,531$ 2,209,108$ 1,260,078$ 1,741,912$ 46,090,297 41,021,879 22,399,364 14,860,536 9,899,484
7,964 7,964 7,964 7,964 7,964
49,829,626$ 43,564,374$ 24,616,436$ 16,128,578$ 11,649,360$
17,694,680 15,579,130 22,973,920 14,740,008 17,284,705
10,025,335 - - - 12,361,508
15,503,824 15,871,924 9,519,621 3,453,909 3,112,038 6,366,505 11,057,310 15,286,601 10,113,695 15,830,660
(26,201,227) (69,945,666) (77,885,673) (81,056,786) 4,551
13,363,782$ (17,411,967)$ (30,105,531)$ (52,749,174)$ 48,593,462$
20000000
40000000
60000000
Fund Balances
2000
2001
2002
2003
-60000000
-40000000
-20000000
0
20000000
1
All Other Governmental Funds
2003
2004
2005
2006
2007
2008
2009
2010
131

UNIFIED GOVERNMENT OF WYANDOTTE COUNTY / KANSAS CITY, KANSASASSESSED AND ESTIMATED ACTUAL VALUES OF TAXABLE TANGIBLE PROPERTYIncluding Motor Vehicles, Last Ten Fiscal Years
Real Property (1) Personal Property (2) Utilities (2) Total
Fiscal Assessed Assessed Assessed AssessedYear Value Value Value Value
2001 549,585,462 307,150,275 60,703,594 917,439,3312002 609,116,757 321,917,175 60,956,276 991,990,2082003 709,640,218 325,724,475 60,402,920 1,095,767,6132004 764,230,086 316,770,970 64,463,803 1,145,464,8592005 832,146,776 322,022,598 62,065,428 1,216,234,8022006 908,899,542 324,970,743 60,672,383 1,294,542,6682007 1,026,694,090 293,356,034 60,003,173 1,380,053,2972008 1,069,442,741 265,953,815 59,613,262 1,395,009,8182009 966,053,674 242,392,251 55,937,343 1,264,383,2682010 927,030,390 225,604,185 63,329,809 1,215,964,384
UNIFIED GOVERNMENT PRIMARY GOVERNMENT
800,000,000
1,000,000,000
1,200,000,000
1,400,000,000
ASSESSED VALUE OF PROPERTY
1 Real Property Estimated Actual Value is the value assinged by the County Appraiser on taxable property.2 Personal Property Estimated Actual Value and Utilies Estimated Actual Value was calculated using a formula based on assessed rate
Source: Unified Government Clerk
0
200,000,000
400,000,000
600,000,000
2001 2002 2003 2004 2005 2006 2007 2008 2009 2010
"Real Property" "Personal Property" "Utilities"
132

Real Property (1) Personal Property (2) Utilities (2)Total
Fiscal Estimated Estimated Estimated Estimated Assessed/ DirectYear Actual Value Actual Value Actual Value Actual Value Actual Ratio Tax Rate
2001 3,699,471,451 781,859,024 183,950,285 4,665,280,760 19.67% 166.2292002 4,134,020,162 824,754,508 184,715,988 5,143,490,658 19.29% 164.4722003 4,921,733,506 838,907,600 183,039,150 5,943,680,256 18.44% 158.3432004 5,311,900,328 758,214,491 195,344,662 6,265,459,481 18.28% 158.9112005 5,783,420,083 768,418,871 188,058,247 6,739,897,201 18.05% 159.2212006 6,214,268,915 802,291,592 183,855,706 7,200,416,213 17.98% 158.5102007 6,848,879,075 628,612,840 181,827,797 7,659,319,712 18.02% 155.5992008 7,135,799,722 1,188,771,374 180,646,248 8,505,217,344 16.40% 152.7022009 6,641,739,576 1,090,054,600 169,507,100 7,901,301,276 16.00% 164.6632010 6,641,739,576 1,019,460,051 191,908,512 7,853,108,139 15.48% 167.745
5,000,000,000
6,000,000,000
7,000,000,000
8,000,000,000
9,000,000,000
ESTIMATED ACTUAL VALUE
0
1,000,000,000
2,000,000,000
3,000,000,000
4,000,000,000
2001 2002 2003 2004 2005 2006 2007 2008 2009 2010
"Real Property" "Personal Property" "Utilities"
133
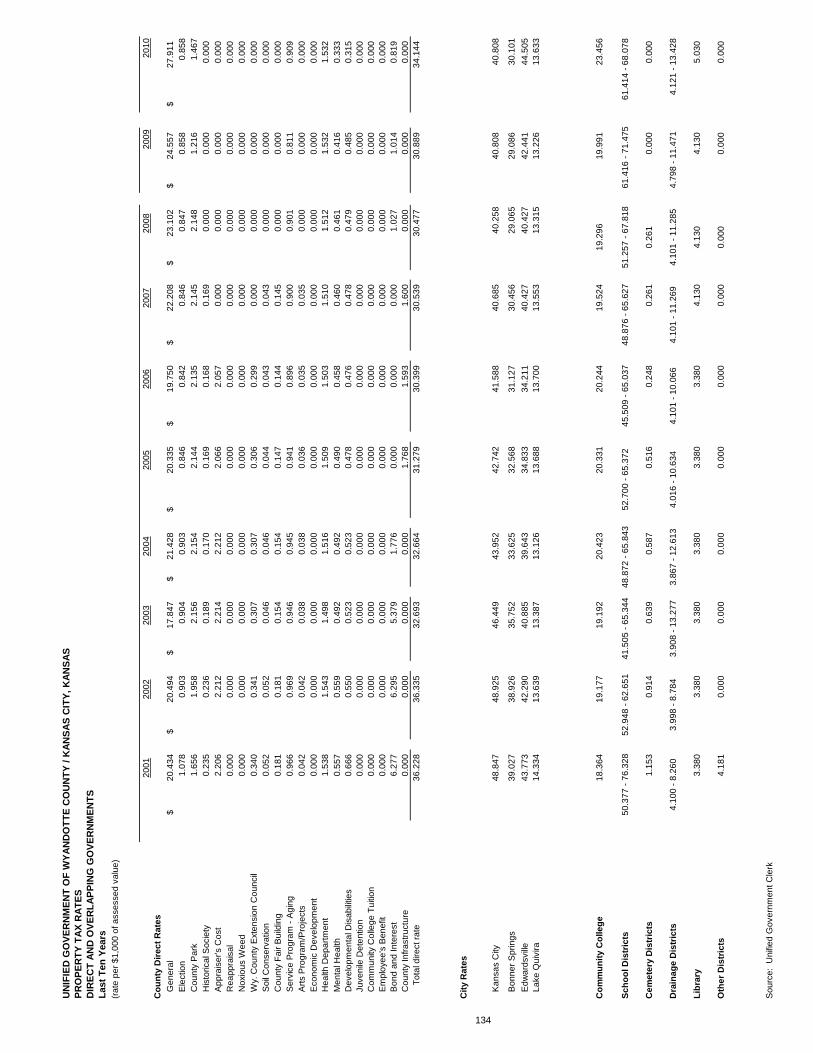
2001
2002
2003
2004
2005
2006
2007
2008
2009
2010
Cou
nty
Dire
ct R
ates
Gen
eral
20.4
34$
20.4
94$
17.8
47$
21
.428
$
20.3
35$
19
.750
$
22
.208
$
23
.102
$
24
.557
$
27
.911
$
Ele
ctio
n1.
078
0.90
3
0.
904
0.
903
0.84
6
0.84
2
0.
846
0.84
7
0.85
8
0.85
8C
ount
y P
ark
1.65
6
1.
958
2.15
6
2.15
4
2.
144
2.
135
2.14
5
2.
148
1.
216
1.
467
His
toric
al S
ocie
ty0.
235
0.23
6
0.
189
0.
170
0.16
9
0.16
8
0.
169
0.00
00.
000
0.00
0A
ppra
iser
's C
ost
2.20
6
2.
212
2.21
4
2.21
2
2.
066
2.
057
0.00
00.
000
0.00
00.
000
Rea
ppra
isal
0.00
00.
000
0.00
00.
000
0.00
00.
000
0.00
00.
000
0.00
00.
000
Nox
ious
Wee
d0.
000
0.00
00.
000
0.00
00.
000
0.00
00.
000
0.00
00.
000
0.00
0W
y. C
ount
y E
xten
sion
Cou
ncil
0.34
0
0.
341
0.30
7
0.30
7
0.
306
0.
299
0.00
00.
000
0.00
00.
000
Soi
l Con
serv
atio
n0.
052
0.05
2
0.
046
0.
046
0.04
4
0.04
3
0.
043
0.00
00.
000
0.00
0C
ount
y Fa
ir B
uild
ing
0.18
1
0.
181
0.15
4
0.15
4
0.
147
0.
144
0.14
5
0.
000
0.00
00.
000
Ser
vice
Pro
gram
- A
ging
0.96
6
0.
969
0.94
6
0.94
5
0.
941
0.
896
0.90
0
0.
901
0.
811
0.
909
A
rts P
rogr
am/P
roje
cts
0.04
2
0.
042
0.03
8
0.03
8
0.
036
0.
035
0.03
5
0.
000
0.00
00.
000
Eco
nom
ic D
evel
opm
ent
0.00
00.
000
0.00
00.
000
0.00
00.
000
0.00
00.
000
0.00
00.
000
Hea
lth D
epar
tmen
t1.
538
1.54
3
1.
498
1.
516
1.50
9
1.50
3
1.
510
1.51
2
1.53
2
1.53
2
Men
tal H
ealth
0.55
7
0.
559
0.49
2
0.49
2
0.
490
0.
458
0.46
0
0.
461
0.
416
0.
333
D
evel
opm
enta
l Dis
abilit
ies
0.66
6
0.
550
0.52
3
0.52
3
0.
478
0.
476
0.47
8
0.
479
0.
485
0.
315
Ju
veni
le D
eten
tion
0.00
00.
000
0.00
00.
000
0.00
00.
000
0.00
00.
000
0.00
00.
000
Com
mun
ity C
olle
ge T
uitio
n0.
000
0.00
00.
000
0.00
00.
000
0.00
00.
000
0.00
00.
000
0.00
0E
mpl
oyee
's B
enef
it0.
000
0.00
00.
000
0.00
00.
000
0.00
00.
000
0.00
00.
000
0.00
0B
ond
and
Inte
rest
6.27
7
6.
295
5.37
9
1.77
6
0.
000
0.00
00.
000
1.02
7
1.01
4
0.81
9
Cou
nty
Infra
stru
ctur
e0.
000
0.00
00.
000
0.00
01.
768
1.
593
1.60
0
0.
000
0.00
00.
000
Tota
l dire
ct ra
te36
.228
36
.335
32
.693
32.6
64
31
.279
30.3
99
30.5
39
30.4
77
30.8
89
34.1
44
(rate
per
$1,
000
of a
sses
sed
valu
e)
UN
IFIE
D G
OVE
RN
MEN
T O
F W
YAN
DO
TTE
CO
UN
TY /
KAN
SAS
CIT
Y, K
ANSA
SPR
OPE
RTY
TAX
RAT
ESD
IREC
T AN
D O
VER
LAPP
ING
GO
VER
NM
ENTS
Last
Ten
Yea
rs
City
Rat
es
Kan
sas
City
48.8
47
48.9
25
46.4
49
43
.952
42.7
42
41
.588
40
.685
40
.258
40.8
08
40.8
08
Bon
ner S
prin
gs39
.027
38
.926
35
.752
33.6
25
32
.568
31.1
27
30.4
56
29.0
6529
.086
30
.101
Edw
ards
ville
43.7
73
42.2
90
40.8
85
39
.643
34.8
33
34
.211
40
.427
40
.427
42.4
41
44.5
05La
ke Q
uivi
ra14
.334
13
.639
13
.387
13.1
26
13
.688
13.7
00
13.5
53
13.3
1513
.226
13
.633
Com
mun
ity C
olle
ge18
.364
19
.177
19
.192
20.4
23
20
.331
20.2
44
19.5
24
19.2
9619
.991
23
.456
Scho
ol D
istr
icts
50
.377
- 76
.328
52.9
48 -
62.6
5141
.505
- 65
.344
48.8
72 -
65.8
4352
.700
- 65
.372
45.5
09 -
65.0
3748
.876
- 65
.627
51.2
57 -
67.8
1861
.416
- 71
.475
61.4
14 -
68.0
78
Cem
eter
y D
istr
icts
1.15
3
0.
914
0.63
9
0.58
7
0.
516
0.
248
0.26
1
0.
261
0.00
00.
000
Dra
inag
e D
istr
icts
4.10
0 - 8
.260
3.99
8 - 8
.784
3.90
8 - 1
3.27
73.
867
- 12.
613
4.01
6 - 1
0.63
44.
101
- 10.
066
4.10
1 - 1
1.26
94.
101
- 11.
285
4.79
8 - 1
1.47
14.
121
- 13.
428
Libr
ary
3.38
0
3.
380
3.38
0
3.38
0
3.
380
3.
380
4.13
0
4.
130
4.13
0
5.03
0
Oth
er D
istr
icts
4.18
1
0.
000
0.00
00.
000
0.00
00.
000
0.00
00.
000
0.00
00.
000
Sou
rce:
Uni
fied
Gov
ernm
ent C
lerk
134
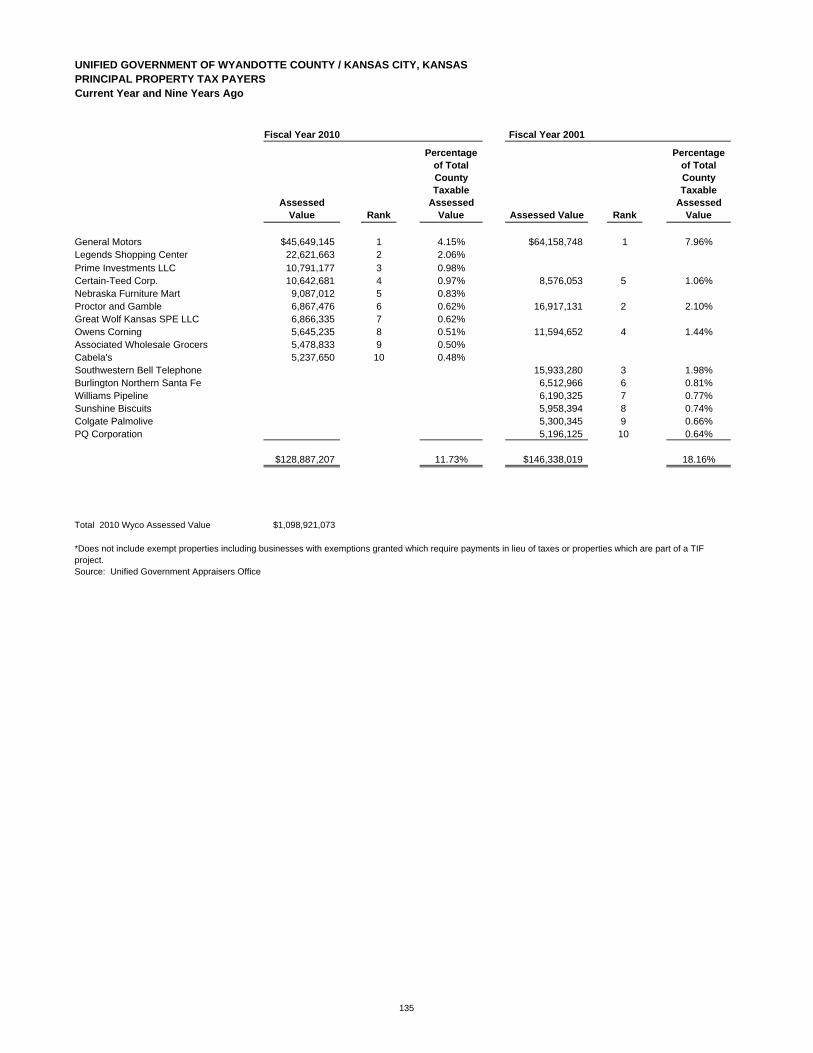
UNIFIED GOVERNMENT OF WYANDOTTE COUNTY / KANSAS CITY, KANSASPRINCIPAL PROPERTY TAX PAYERSCurrent Year and Nine Years Ago
Fiscal Year 2010 Fiscal Year 2001
Assessed Value Rank
Percentage of Total County Taxable
Assessed Value Assessed Value Rank
Percentage of Total County Taxable
Assessed Value
General Motors $45,649,145 1 4.15% $64,158,748 1 7.96%Legends Shopping Center 22,621,663 2 2.06%Prime Investments LLC 10,791,177 3 0.98%Certain-Teed Corp. 10,642,681 4 0.97% 8,576,053 5 1.06%Nebraska Furniture Mart 9,087,012 5 0.83%Proctor and Gamble 6,867,476 6 0.62% 16,917,131 2 2.10%Great Wolf Kansas SPE LLC 6,866,335 7 0.62%Owens Corning 5,645,235 8 0.51% 11,594,652 4 1.44%Associated Wholesale Grocers 5,478,833 9 0.50%Cabela's 5,237,650 10 0.48%Southwestern Bell Telephone 15,933,280 3 1.98%Burlington Northern Santa Fe 6,512,966 6 0.81%Williams Pipeline 6,190,325 7 0.77%Sunshine Biscuits 5,958,394 8 0.74%Colgate Palmolive 5,300,345 9 0.66%PQ Corporation 5,196,125 10 0.64%
$128,887,207 11.73% $146,338,019 18.16%
Total 2010 Wyco Assessed Value $1,098,921,073
Source: Unified Government Appraisers Office
*Does not include exempt properties including businesses with exemptions granted which require payments in lieu of taxes or properties which are part of a TIF project.
135
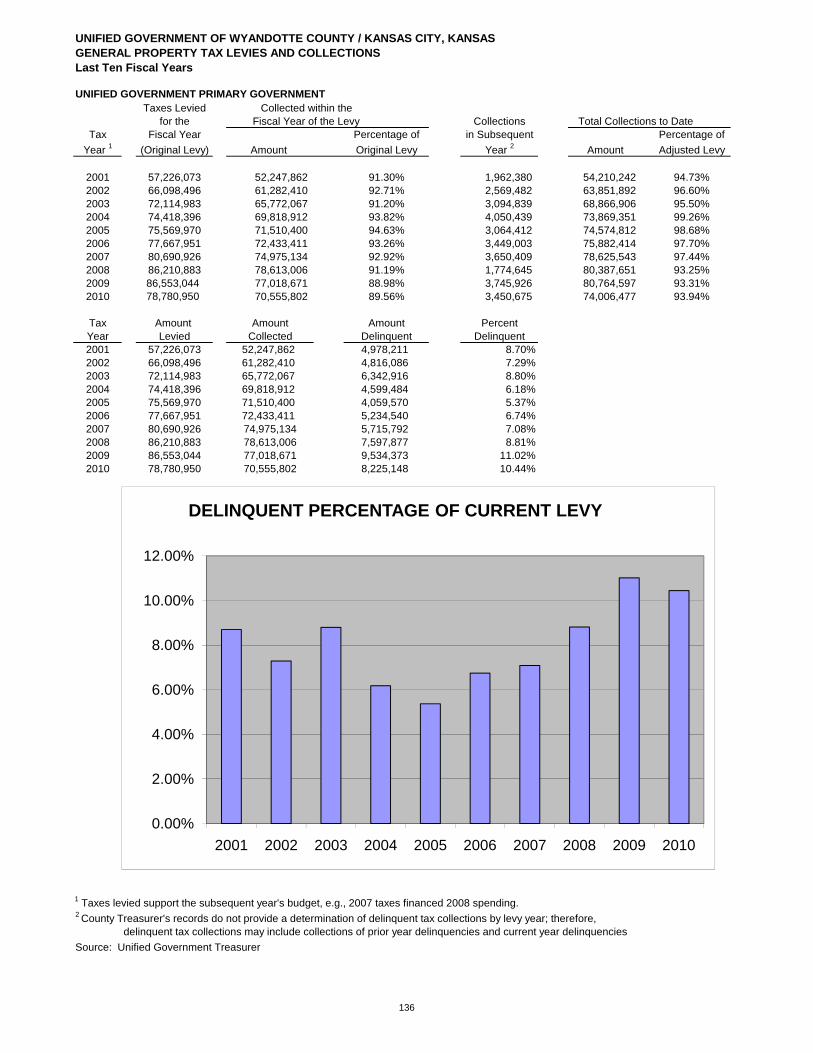
UNIFIED GOVERNMENT OF WYANDOTTE COUNTY / KANSAS CITY, KANSASGENERAL PROPERTY TAX LEVIES AND COLLECTIONSLast Ten Fiscal Years
UNIFIED GOVERNMENT PRIMARY GOVERNMENTTaxes Levied Collected within the
for the Fiscal Year of the Levy Collections Total Collections to DateTax Fiscal Year Percentage of in Subsequent Percentage of
Year 1 (Original Levy) Amount Original Levy Year 2 Amount Adjusted Levy
2001 57,226,073 52,247,862 91.30% 1,962,380 54,210,242 94.73%2002 66,098,496 61,282,410 92.71% 2,569,482 63,851,892 96.60%2003 72,114,983 65,772,067 91.20% 3,094,839 68,866,906 95.50%2004 74,418,396 69,818,912 93.82% 4,050,439 73,869,351 99.26%2005 75,569,970 71,510,400 94.63% 3,064,412 74,574,812 98.68%2006 77,667,951 72,433,411 93.26% 3,449,003 75,882,414 97.70%2007 80,690,926 74,975,134 92.92% 3,650,409 78,625,543 97.44%2008 86,210,883 78,613,006 91.19% 1,774,645 80,387,651 93.25%2009 86,553,044 77,018,671 88.98% 3,745,926 80,764,597 93.31%2010 78,780,950 70,555,802 89.56% 3,450,675 74,006,477 93.94%
Tax Amount Amount Amount PercentYear Levied Collected Delinquent Delinquent2001 57,226,073 52,247,862 4,978,211 8.70%2002 66,098,496 61,282,410 4,816,086 7.29%2003 72,114,983 65,772,067 6,342,916 8.80%2004 74,418,396 69,818,912 4,599,484 6.18%2005 75,569,970 71,510,400 4,059,570 5.37%2006 77,667,951 72,433,411 5,234,540 6.74%2007 80,690,926 74,975,134 5,715,792 7.08%2008 86,210,883 78,613,006 7,597,877 8.81%2009 86,553,044 77,018,671 9,534,373 11.02%2010 78,780,950 70,555,802 8,225,148 10.44%
DELINQUENT PERCENTAGE OF CURRENT LEVY
1 Taxes levied support the subsequent year's budget, e.g., 2007 taxes financed 2008 spending.2 County Treasurer's records do not provide a determination of delinquent tax collections by levy year; therefore,
delinquent tax collections may include collections of prior year delinquencies and current year delinquenciesSource: Unified Government Treasurer
0.00%
2.00%
4.00%
6.00%
8.00%
10.00%
12.00%
2001 2002 2003 2004 2005 2006 2007 2008 2009 2010
136
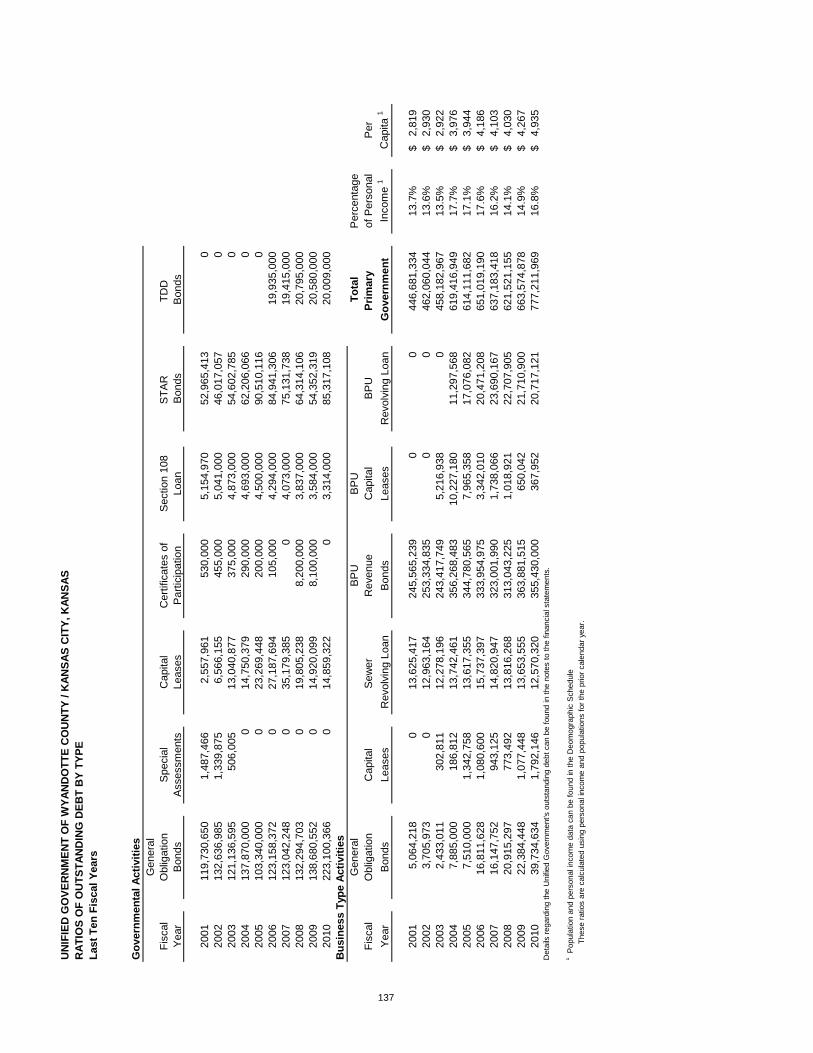
UN
IFIE
D G
OVE
RN
MEN
T O
F W
YAN
DO
TTE
CO
UN
TY /
KAN
SAS
CIT
Y, K
ANSA
SR
ATIO
S O
F O
UTS
TAN
DIN
G D
EBT
BY
TYPE
Last
Ten
Fis
cal Y
ears
Gov
ernm
enta
l Act
iviti
esG
ener
alFi
scal
Obl
igat
ion
Spe
cial
Cap
ital
Cer
tific
ates
of
Sec
tion
108
STA
R
TDD
Y
ear
Bon
dsA
sses
smen
tsLe
ases
Par
ticip
atio
nLo
anB
onds
Bon
ds
2001
119,
730,
650
1,48
7,46
6
2,55
7,96
1
530,
000
5,
154,
970
52,9
65,4
13
020
0213
2,63
6,98
5
1,
339,
875
6,
566,
155
45
5,00
0
5,
041,
000
46,0
17,0
57
020
0312
1,13
6,59
5
50
6,00
5
13
,040
,877
37
5,00
0
4,
873,
000
54,6
02,7
85
020
0413
7,87
0,00
0
0
14,7
50,3
79
290,
000
4,69
3,00
0
62
,206
,066
0
2005
103,
340,
000
023
,269
,448
20
0,00
0
4,
500,
000
90,5
10,1
16
020
0612
3,15
8,37
2
0
27,1
87,6
94
105,
000
4,29
4,00
0
84
,941
,306
19
,935
,000
20
0712
3,04
2,24
8
0
35,1
79,3
85
04,
073,
000
75,1
31,7
38
19,4
15,0
00
2008
132,
294,
703
019
,805
,238
8,
200,
000
3,83
7,00
0
64
,314
,106
20
,795
,000
20
0913
8,68
0,55
2
0
14,9
20,0
99
8,10
0,00
03,
584,
000
54,3
52,3
19
20,5
80,0
00
2010
223,
100,
366
014
,859
,322
0
3,31
4,00
0
85
,317
,108
20
,009
,000
B
usin
ess
Type
Act
iviti
esG
ener
alB
PU
BP
UTo
tal
Per
cent
age
Fisc
alO
blig
atio
nC
apita
lS
ewer
R
even
ueC
apita
lB
PU
Prim
ary
of P
erso
nal
Per
Yea
rB
onds
Leas
esR
evol
ving
Loa
nB
onds
Leas
esR
evol
ving
Loa
nG
over
nmen
tIn
com
e 1
Cap
ita 1
2001
5,06
4,21
8
013
,625
,417
24
5,56
5,23
9
0
044
6,68
1,33
4
13
.7%
2,81
9$
20
023,
705,
973
0
12,9
63,1
64
253,
334,
835
00
462,
060,
044
13.6
%2,
930
$
2003
243
301
130
281
112
278
196
243
417
749
521
693
80
458
182
967
135%
292
2$
137
2003
2,43
3,01
1
302,
811
12,2
78,1
96
24
3,41
7,74
9
5,21
6,93
8
0
458,
182,
967
13.5
%2,
922
$
2004
7,88
5,00
0
186,
812
13,7
42,4
61
356,
268,
483
10,2
27,1
80
11
,297
,568
61
9,41
6,94
9
17
.7%
3,97
6$
20
057,
510,
000
1,
342,
758
13
,617
,355
34
4,78
0,56
5
7,
965,
358
17,0
76,0
82
614,
111,
682
17.1
%3,
944
$
2006
16,8
11,6
28
1,08
0,60
0
15,7
37,3
97
333,
954,
975
3,34
2,01
0
20
,471
,208
65
1,01
9,19
0
17
.6%
4,18
6$
20
0716
,147
,752
94
3,12
5
14
,820
,947
32
3,00
1,99
0
1,
738,
066
23,6
90,1
6763
7,18
3,41
8
16
.2%
4,10
3$
20
0820
,915
,297
77
3,49
2
13
,816
,268
31
3,04
3,22
5
1,
018,
921
22,7
07,9
05
621,
521,
155
14.1
%4,
030
$
2009
22,3
84,4
48
1,07
7,44
8
13,6
53,5
55
363,
881,
515
650,
042
21
,710
,900
66
3,57
4,87
8
14
.9%
4,26
7$
20
1039
,734
,634
1,
792,
146
12
,570
,320
35
5,43
0,00
0
36
7,95
2
20,7
17,1
21
777,
211,
969
16.8
%4,
935
$
Det
ails
rega
rdin
g th
e U
nifie
d G
over
nmen
t's o
utst
andi
ng d
ebt c
an b
e fo
und
in th
e no
tes
to th
e fin
anci
al s
tate
men
ts.
1 Pop
ulat
ion
and
pers
onal
inco
me
data
can
be
foun
d in
the
Deo
mog
raph
ic S
ched
ule
Thes
e ra
tios
are
calc
ulat
ed u
sing
per
sona
l inc
ome
and
popu
latio
ns fo
r the
prio
r cal
enda
r yea
r.

Less
:P
erce
ntag
e of
G
ener
alA
mou
nts
Per
cent
age
ofA
ctua
l Val
ueFi
scal
Obl
igat
ion
Res
trict
ed to
Per
sona
lof
Tax
able
P
erYe
ar
Deb
t 1R
epay
ing
Prin
cipa
lTo
tal
Inco
me
2P
rope
rty 3
Cap
ita 2
2001
124,
794,
868
(1
3,11
5,28
8)
11
1,67
9,58
0
3.31
%2.
39%
705
2002
136,
342,
958
(9
,273
,021
)
12
7,06
9,93
7
3.64
%2.
47%
806
2003
123,
569,
606
(5
,143
,497
)
11
8,42
6,10
9
3.32
%1.
99%
755
2004
145,
755,
000
(2
2,16
4,04
9)
12
3,59
0,95
1
3.48
%1.
97%
793
2005
110,
850,
000
(2
,611
,751
)
10
8,23
8,24
9
2.94
%1.
61%
695
2006
139,
970,
000
(6
,366
,505
)
13
3,60
3,49
5
3.51
%1.
86%
859
2007
139,
190,
000
(1
5,74
4,12
9)
12
3,44
5,87
1
3.14
%1.
61%
795
2008
153,
210,
000
(5
,927
,079
)
14
7,28
2,92
1
3.34
%1.
73%
955
2009
161,
065,
000
(3
,846
,913
)15
7,21
8,08
7
3.52
%1.
99%
1,01
1
2010
262,
835,
000
(3
,846
,913
)25
8,98
8,08
7
5.60
%3.
30%
1,64
4
1 Incl
udes
Gen
eral
Obl
igat
ion
Bon
ds2 P
opul
atio
n an
d pe
rson
al in
com
e da
ta c
an b
e fo
und
in th
e D
emog
raph
ic S
ched
ule
3 Pro
perty
val
ue d
ata
can
be fo
und
in S
ched
ule
Act
ual V
alue
s S
ched
ule
Gen
eral
Bon
d D
ebt O
utst
andi
ng
UN
IFIE
D G
OVE
RN
MEN
T O
F W
YAN
DO
TTE
CO
UN
TY /
KAN
SAS
CIT
Y, K
ANSA
SR
ATIO
S O
F G
ENER
AL B
ON
DED
DEB
T O
UTS
TAN
DIN
GLa
st T
en F
isca
l Yea
rs
138
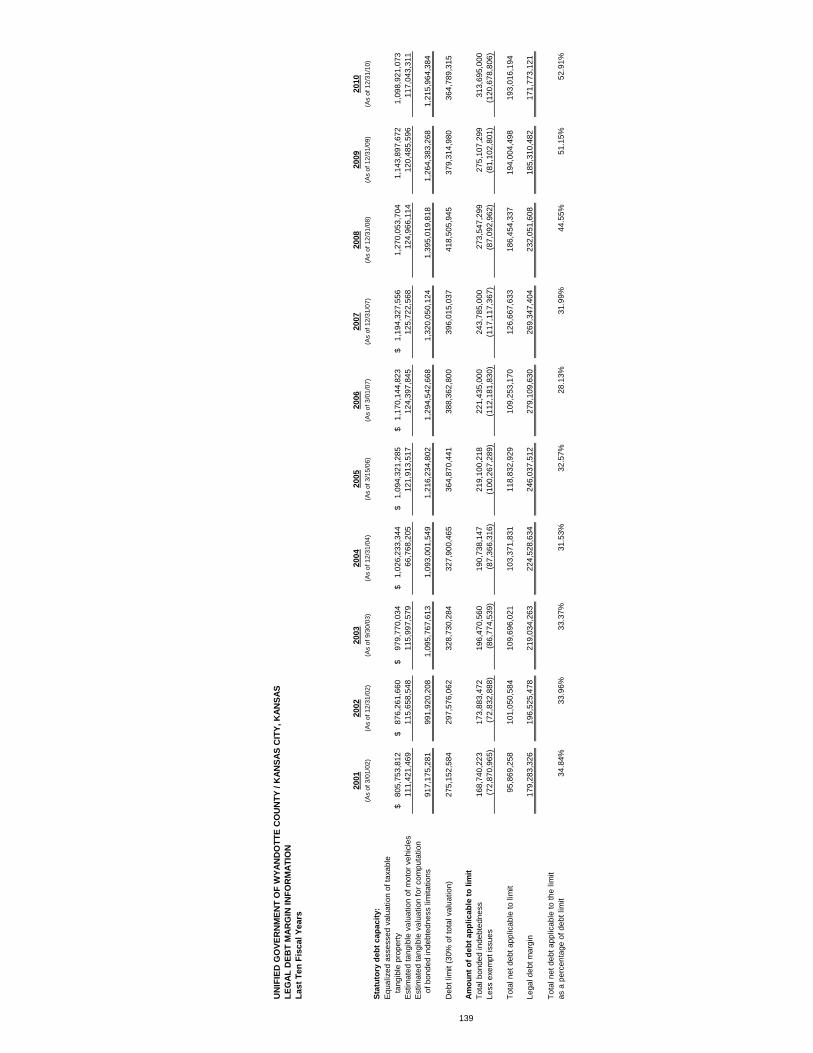
20
0120
0220
0320
0420
0520
0620
0720
0820
0920
10(A
s of
3/0
1/02
)(A
s of
12/
31/0
2)(A
s of
9/3
0/03
)(A
s of
12/
31/0
4)(A
s of
3/1
5/06
)(A
s of
3/0
1/07
)(A
s of
12/
31/0
7)(A
s of
12/
31/0
8)(A
s of
12/
31/0
9)(A
s of
12/
31/1
0)St
atut
ory
debt
cap
acity
:Eq
ualiz
ed a
sses
sed
valu
atio
n of
taxa
ble
tang
ible
pro
perty
805,
753,
812
$
876,
261,
660
$
979,
770,
034
$
1,
026,
233,
344
$
1,09
4,32
1,28
5$
1,
170,
144,
823
$
1,19
4,32
7,55
6$
1,
270,
053,
704
1,14
3,89
7,67
21,
098,
921,
073
Estim
ated
tang
ible
val
uatio
n of
mot
or v
ehic
les
111,
421,
469
11
5,65
8,54
8
11
5,99
7,57
9
66,7
68,2
05
12
1,91
3,51
7
124,
397,
845
12
5,72
2,56
8
124,
966,
114
120,
485,
596
117,
043,
311
Estim
ated
tang
ible
val
uatio
n fo
r com
puta
tion
of b
onde
d in
debt
edne
ss li
mita
tions
917,
175,
281
991,
920,
208
1,09
5,76
7,61
3
1,09
3,00
1,54
9
1,
216,
234,
802
1,29
4,54
2,66
8
1,
320,
050,
124
1,39
5,01
9,81
8
1,
264,
383,
268
1,
215,
964,
384
UN
IFIE
D G
OVE
RN
MEN
T O
F W
YAN
DO
TTE
CO
UN
TY /
KAN
SAS
CIT
Y, K
ANSA
SLE
GAL
DEB
T M
ARG
IN IN
FOR
MAT
ION
Last
Ten
Fis
cal Y
ears
Deb
t lim
it (3
0% o
f tot
al v
alua
tion)
275,
152,
584
297,
576,
062
328,
730,
284
32
7,90
0,46
5
364,
870,
441
38
8,36
2,80
0
396,
015,
037
41
8,50
5,94
5
37
9,31
4,98
0
364,
789,
315
Am
ount
of d
ebt a
pplic
able
to li
mit
Tota
l bon
ded
inde
bted
ness
168,
740,
223
173,
883,
472
196,
470,
560
19
0,73
8,14
7
219,
100,
218
22
1,43
5,00
0
243,
785,
000
27
3,54
7,29
927
5,10
7,29
931
3,69
5,00
0Le
ss e
xem
pt is
sues
(72,
870,
965)
(7
2,83
2,88
8)
(86,
774,
539)
(8
7,36
6,31
6)
(1
00,2
67,2
89)
(1
12,1
81,8
30)
(1
17,1
17,3
67)
(8
7,09
2,96
2)(8
1,10
2,80
1)(1
20,6
78,8
06)
Tota
l net
deb
t app
licab
le to
lim
it95
,869
,258
10
1,05
0,58
4
10
9,69
6,02
1
103,
371,
831
11
8,83
2,92
9
109,
253,
170
12
6,66
7,63
3
186,
454,
337
194,
004,
498
19
3,01
6,19
4
Lega
l deb
t mar
gin
179,
283,
326
196,
525,
478
219,
034,
263
224,
528,
634
24
6,03
7,51
2
279,
109,
630
26
9,34
7,40
4
232,
051,
608
18
5,31
0,48
2
17
1,77
3,12
1
Tota
l net
deb
t app
licab
le to
the
limit
as a
per
cent
age
of d
ebt l
imit
34.8
4%33
.96%
33.3
7%31
.53%
32.5
7%28
.13%
31.9
9%44
.55%
51.1
5%52
.91%
139

UN
IFIE
D G
OVE
RN
MEN
T O
F W
YAN
DO
TTE
CO
UN
TY /
KAN
SAS
CIT
Y, K
ANSA
SPL
EDG
ED-R
EVEN
UE
CO
VER
AGE
Last
Ten
Fis
cal Y
ears
BP
U R
even
ue B
onds
STA
R B
onds
1TD
D B
onds
2
D
irect
Net
Tota
lFi
scal
Gro
ss
Ope
ratin
gA
vaila
ble
Deb
t Ser
vice
Sal
es T
axS
ales
Tax
Year
R
even
ues
3E
xpen
ses
3R
even
ueR
equi
rem
ents
Cov
erag
eR
even
ues
Prin
cipa
lIn
tere
stC
over
age
Rev
enue
sP
rinci
pal
Inte
rest
Cov
erag
e
2001
166,
979,
319
127,
369,
709
39,6
09,6
10
26,1
42,1
32
1.
52
24
2,67
0
020
4,80
4
1.18
0
00
n/a
2002
193,
423,
024
132,
731,
055
60,6
91,9
69
27,0
09,4
57
2.
25
13
9,79
8
059
4,51
4
0.24
0
00
n/a
2003
202,
392,
507
145,
425,
899
56,9
66,6
08
27,5
12,7
85
2.
07
2,
967,
510
701,
346
1,
976,
216
1.11
0
00
n/a
2004
208,
395,
400
154,
234,
242
54,1
61,1
58
32,4
10,0
66
1.
67
6,
764,
383
2,51
1,57
8
5,
172,
211
0.88
0
00
n/a
2005
226,
137,
858
163,
244,
269
62,8
93,5
89
32,8
90,2
29
1.
91
7,
512,
182
370,
720
5,
687,
718
1.24
0
00
n/a
2006
262,
805,
352
181,
735,
686
81,0
69,6
66
32,8
57,2
08
2.
47
9,
956,
814
5,56
8,81
0
4,
135,
336
1.03
25
7,39
8
095
,929
2.68
20
0724
8,62
8,39
2
18
0,40
8,17
4
68
,220
,218
31
,666
,838
2.15
12,7
69,3
16
9,
809,
568
3,83
9,33
2
0.
94
1,27
7,77
752
0,00
093
3,24
10.
88
2008
258,
694,
309
191,
646,
083
67,0
48,2
26
28,2
54,7
202.
37
12
,785
,814
10,8
17,6
32
3,
485,
647
0.89
1,
221,
851
620,
000
963,
369
0.77
20
0923
1,95
5,32
8
18
5,12
9,86
9
46
,825
,459
32
,331
,488
1.45
12,0
10,6
38
9,
961,
787
3,19
0,80
40.
91
1,38
4,66
861
5,00
01,
019,
714
0.85
20
1026
5,90
7,85
4
17
1,63
5,39
5
94
,272
,459
32
,032
,299
2.94
13,5
29,6
36
11
,116
,268
2,72
3,39
50.
98
1,65
3,31
257
1,00
01,
016,
321
1.04
2.50
3.00
3.50
)
BO
ARD
OF
PUB
LIC
UTI
LITI
ESR
EVEN
UE
BO
ND
CO
VER
AG
E
14
1 Incl
udes
sal
es ta
x ge
nera
ted
in th
e P
rairi
e D
elaw
are
Red
evel
opm
ent D
istri
ct.
See
mor
e in
Not
e III
.F. t
o th
e fin
anci
al s
tate
men
ts.
2 Incl
udes
sal
es ta
x ge
nera
ted
in th
ree
trans
pora
tion
deve
lopm
ent d
istri
cts.
See
mor
e in
Not
e III
.F. t
o th
e fin
anci
al s
tate
men
ts.
3 Exc
lude
s de
prec
iatio
n ex
pens
e, a
mor
tizat
ion
expe
nse,
and
am
ortiz
atio
n re
venu
e.
-
0.50
1.00
1.50
2.00
2001
2002
2003
2004
2005
2006
2007
2008
2009
2010
(TIMES)
40
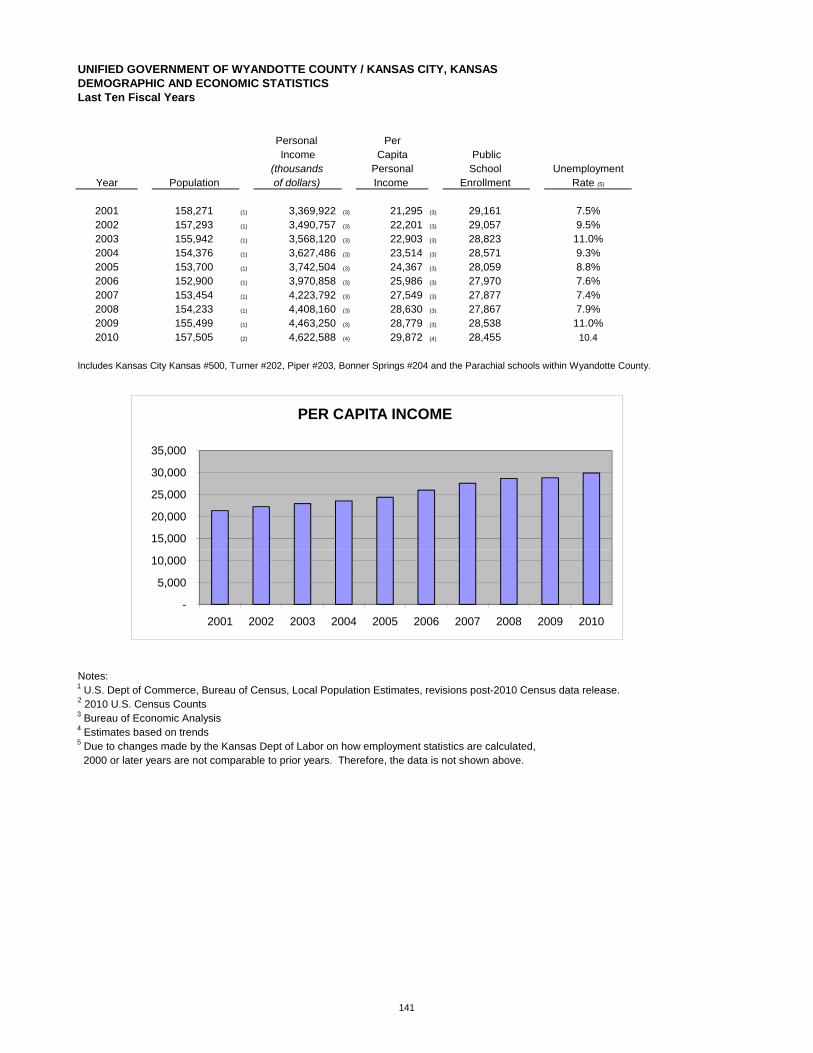
Personal Per Income Capita Public
(thousands Personal School UnemploymentYear Population of dollars) Income Enrollment Rate (5)
2001 158,271 (1) 3,369,922 (3) 21,295 (3) 29,161 7.5%2002 157,293 (1) 3,490,757 (3) 22,201 (3) 29,057 9.5%2003 155,942 (1) 3,568,120 (3) 22,903 (3) 28,823 11.0%
2004 154,376 (1) 3,627,486 (3) 23,514 (3) 28,571 9.3%2005 153,700 (1) 3,742,504 (3) 24,367 (3) 28,059 8.8%2006 152,900 (1) 3,970,858 (3) 25,986 (3) 27,970 7.6%2007 153,454 (1) 4,223,792 (3) 27,549 (3) 27,877 7.4%2008 154,233 (1) 4,408,160 (3) 28,630 (3) 27,867 7.9%2009 155,499 (1) 4,463,250 (3) 28,779 (3) 28,538 11.0%2010 157,505 (2) 4,622,588 (4) 29,872 (4) 28,455 10.4
Includes Kansas City Kansas #500, Turner #202, Piper #203, Bonner Springs #204 and the Parachial schools within Wyandotte County.
UNIFIED GOVERNMENT OF WYANDOTTE COUNTY / KANSAS CITY, KANSASDEMOGRAPHIC AND ECONOMIC STATISTICSLast Ten Fiscal Years
15,000
20,000
25,000
30,000
35,000
PER CAPITA INCOME
Notes:1 U.S. Dept of Commerce, Bureau of Census, Local Population Estimates, revisions post-2010 Census data release.2 2010 U.S. Census Counts3 Bureau of Economic Analysis4 Estimates based on trends5 Due to changes made by the Kansas Dept of Labor on how employment statistics are calculated, 2000 or later years are not comparable to prior years. Therefore, the data is not shown above.
-
5,000
10,000
2001 2002 2003 2004 2005 2006 2007 2008 2009 2010
141
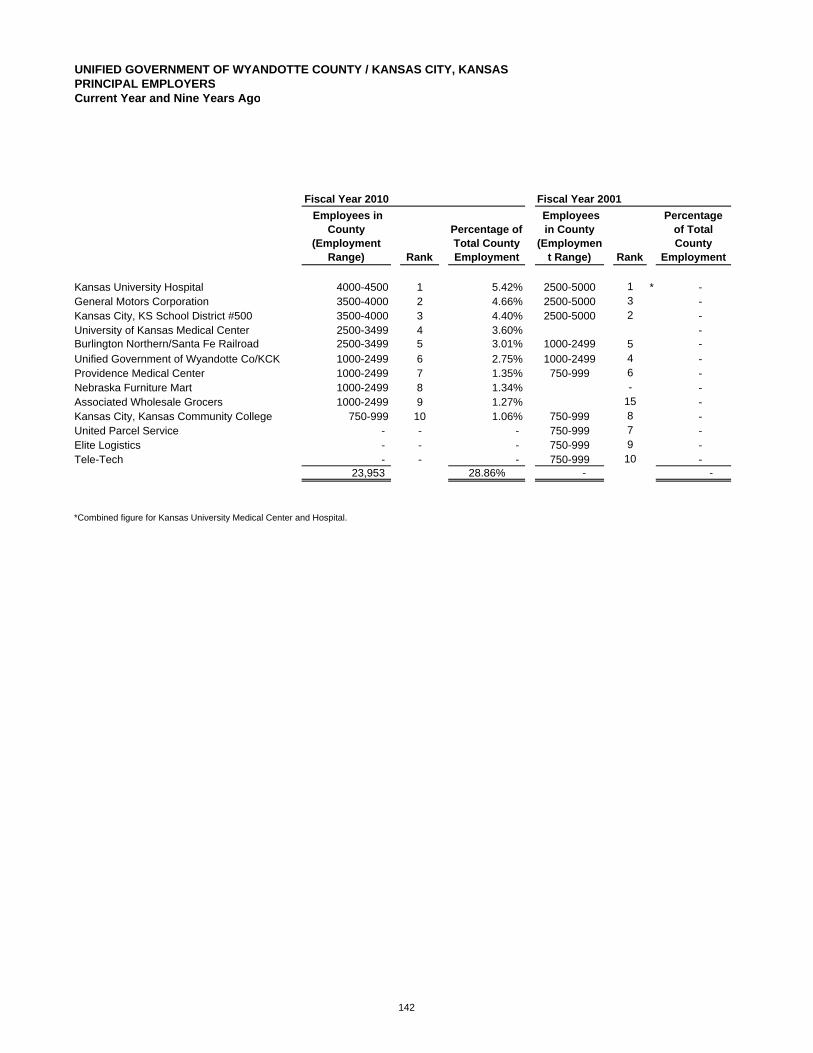
Fiscal Year 2010 Fiscal Year 2001 Employees in
County (Employment
Range) Rank
Percentage of Total County Employment
Employees in County
(Employment Range) Rank
Percentage of Total County
Employment
Kansas University Hospital 4000-4500 1 5.42% 2500-5000 1 * -General Motors Corporation 3500-4000 2 4.66% 2500-5000 3 -Kansas City, KS School District #500 3500-4000 3 4.40% 2500-5000 2 -University of Kansas Medical Center 2500-3499 4 3.60% -Burlington Northern/Santa Fe Railroad 2500-3499 5 3.01% 1000-2499 5 -Unified Government of Wyandotte Co/KCK 1000-2499 6 2.75% 1000-2499 4 -Providence Medical Center 1000-2499 7 1.35% 750-999 6 -Nebraska Furniture Mart 1000-2499 8 1.34% - -Associated Wholesale Grocers 1000-2499 9 1.27% 15 -Kansas City, Kansas Community College 750-999 10 1.06% 750-999 8 -United Parcel Service - - - 750-999 7 -Elite Logistics - - - 750-999 9 -Tele-Tech - - - 750-999 10 -
23,953 28.86% - -
*Combined figure for Kansas University Medical Center and Hospital.
UNIFIED GOVERNMENT OF WYANDOTTE COUNTY / KANSAS CITY, KANSASPRINCIPAL EMPLOYERSCurrent Year and Nine Years Ago
142

Bud
gete
d Fu
ll-tim
e Eq
uiva
lent
Em
ploy
ees
as o
f Dec
embe
r 31
Func
tion/
Pro
gram
2001
2002
2003
2004
2005
2006
2007
2008
2009
2010
Gen
eral
Gov
ernm
ent
440
433
381
405
413
418
419
409
409
40
4P
ublic
Saf
ety
1,17
4
1,17
4
1,12
8
1,22
1
1,22
7
1,23
6
1,26
0
1,27
0
1,27
0
1,
177
Pub
lic F
acilit
y &
Impr
ovem
ent
419
422
386
409
416
416
430
431
431
30
8P
arks
& R
ecre
atio
n11
1
11
1
11
2
111
111
111
108
108
108
72
Com
mun
ity &
Nei
ghbo
rhoo
d D
evel
opm
ent
72
72
70
65
68
69
67
69
69
79
Hea
lth &
Wel
fare
137
137
144
123
116
120
120
120
120
10
4
2,35
2
2,34
8
2,22
1
2,33
3
2,35
1
2,37
1
2,40
4
2,40
7
2,40
7
2,
144
UN
IFIE
D G
OVE
RN
MEN
T O
F W
YAN
DO
TTE
CO
UN
TY /
KAN
SAS
CIT
Y, K
ANSA
SFU
LL-T
IME
EQU
IVAL
ENT
CO
UN
TY G
OVE
RN
MEN
T EM
PLO
YEES
BY
FUN
CTI
ON
Last
Ten
Fis
cal Y
ears
2,50
0
3,00
0
FULL
TIM
E EM
PLO
YEES
BY
FUN
CTI
ON
143
Sou
rce:
Uni
fied
Gov
ernm
ent A
nnua
l Bud
get R
epor
ts
Cou
nty
& C
ity U
nifie
d O
ctob
er 1
997
-
500
1,00
0
1,50
0
2,00
0
2001
2002
2003
2004
2005
2006
2007
2008
2009
2010
Hea
lth &
Wel
fare
Com
mun
ity &
Nei
ghbo
rhoo
d D
evel
opm
ent
Par
ks &
Rec
reat
ion
Pub
lic F
acili
ty &
Impr
ovem
ent
Pub
lic S
afet
y
Gen
eral
Gov
ernm
ent

Fisc
al Y
ear
Func
tion/
Prog
ram
2001
2002
2003
2004
2005
2006
2007
2008
2009
2010
Gen
eral
Gov
ernm
ent
Num
ber o
f Doc
umen
ts re
cord
ed in
Reg
iste
r of D
eeds
30,5
31
33
,142
39,3
79
35
,848
34
,854
32,5
93
28
,340
22,3
2020
,479
18,0
08
Num
ber o
f reg
iste
red
vote
rs80
,937
75,8
68
81
,476
89,2
07
85,8
58
84
,300
83,7
78
91
,201
90,7
64
76
,174
Publ
ic S
afet
y
Num
ber o
f 911
cal
ls18
2,07
9
183,
758
15
1,73
3
182,
920
19
7,28
4
19
5,07
0
19
0,06
7
17
8,11
918
1,16
4
18
0,82
6
N
umbe
r of F
ire D
epar
tmen
t Cal
ls18
,311
19,0
55
18
,580
19,5
61
21,9
14
23
,603
24,6
19
25
,166
24,9
70
25
,592
Vi
olen
t Crim
es
1,38
4
1,13
8
1,12
7
1,00
4
1,16
3
1,26
9
1,20
4
917
942
808
Publ
ic F
acili
ty &
Impr
ovem
ent
N
umbe
r of b
ridge
s m
aint
aine
d14
9
14
9
14
9
14
9
15
1
15
1
15
1
15
115
1
15
1
Mile
s of
road
mai
ntai
ned
1,90
0
1,90
0
1,90
0
1,90
1
1,90
9
1,92
4
1,94
3
1,94
71,
943
1,
943
Park
s &
Rec
reat
ion
Park
acr
es m
aint
aine
d2,
729
2,
729
2,
729
2,
729
2,
729
2,
729
2,
729
2,
729
2,60
0
2,60
0
Com
mun
ity &
Nei
ghbo
rhoo
d D
evel
opm
ent
N
umbe
r of B
usin
ess
Lice
nses
Issu
ed5,
871
6,
049
6,
360
6,
626
7,
170
7,
394
7,
515
7,
387
7,18
5
7,09
2
N
umbe
r of D
emol
ition
Per
mits
Issu
ed27
0
26
0
23
4
24
2
23
2
21
2
19
2
53
119
195
1 N
umbe
r of D
ownp
aym
ent A
ssis
tanc
e37
33
45
42
46
20
16
1016
13
2UN
IFIE
D G
OVE
RN
MEN
T O
F W
YAN
DO
TTE
CO
UN
TY /
KAN
SAS
CIT
Y, K
ANSA
SO
PER
ATIN
G IN
DIC
ATO
RS
BY
FUN
CTI
ON
Last
Ten
Fis
cal Y
ears
144
2
Num
ber o
f Gra
nts/
Loan
s24
4
24
7
19
0
20
4
15
5
14
1
95
86
149
97
Hea
lth &
Wel
fare
Num
ber o
f Vis
its to
the
Hea
lth D
epar
tmen
t30
,311
30,9
1330
,564
29,7
7528
,008
25,9
3824
,682
26,3
1334
,537
30,5
06
Num
ber o
f Clie
nts
to th
e H
ealth
Dep
artm
ent
13,6
2514
,377
14,9
5313
,239
12,7
8212
,386
15,8
94
13
,844
19,0
71
20
,381
N
umbe
r of V
isits
to th
e W
IC D
epar
tmen
t60
,131
69,3
2374
,526
61,7
7475
,874
81,6
7250
,531
59,0
6065
,225
64,3
37
Num
ber o
f Clie
nts
to th
e W
IC D
epar
tmen
t*
4,78
05,
559
6,05
85,
333
6,21
06,
917
7,
485
8,04
7
7,72
2
N
umbe
r of C
ongr
egat
e M
eals
Ser
ved
to S
enio
rs73
,370
72,3
9370
,996
71,6
3570
,724
69,1
59
62
,268
67,0
4158
,828
50,4
26
Num
ber o
f Hom
e D
eliv
ered
Mea
ls S
erve
d to
Sen
iors
166,
456
157,
882
155,
322
147,
443
128,
748
138,
782
139,
392
144,
969
147,
914
138,
776
Num
ber o
f New
slet
ters
dis
tribu
ted
18,1
9619
,498
20,5
6121
,373
22,8
1124
,341
33,0
54
16
,157
24,4
18
20
,751
N
umbe
r of L
egal
Hou
rs p
rovi
ded
650
579
576
576
550
506
478
522
534
510
* In
form
atio
n no
t ava
ilabl
e.
Not
e: 9
11 C
alls
Wire
line
& W
irele
ss 2
003
does
not
incl
ude
first
4 m
onth
s of
wire
less
cal
l sta
ts
1 Dow
npay
men
t Ass
ista
nce
Pro
gram
(CH
IP) i
s ai
med
at l
ow-to
mod
erat
e-in
com
e ho
useh
olds
for a
ssis
tanc
e to
pur
chas
e si
ngle
-fam
ily h
omes
1 At a
n av
erag
e es
timat
ed v
alue
of $
12,0
00 e
ach
over
a te
n ye
ar p
erio
d re
pres
ents
an
estim
ated
$5,
808,
000
inve
stm
ent
2 Gra
nts
are
aim
ed a
t ver
y lo
w-in
com
e si
ngle
-fam
ily h
ouse
hold
s an
d in
clud
es e
mer
genc
y gr
ants
, roo
fs, s
ewer
s, re
side
ntia
l bar
rier r
emov
al,
spe
cial
ser
vice
gra
nts,
lead
-bas
ed p
aint
rem
oval
, etc
. 2 A
lso
incl
udes
gra
nts/
loan
s fo
r low
-to m
oder
ate
inco
me
hous
ehol
ds s
uch
as th
e H
ELP
loan
pro
gram
. 2 A
t an
aver
age
estim
ated
val
ue o
f $4,
000
each
ove
r a te
n ye
ar p
erio
d re
pres
ents
an
estim
ated
$7,
412,
000
inve
stm
ent
Sou
rce:
Uni
fied
Gov
ernm
ent b
udge
t dep
artm
ent a
nd in
divi
dual
dep
artm
ents
.

Func
tion/
Prog
ram
2001
2002
2003
2004
2005
2006
2007
2008
2009
2010
Gen
eral
Gov
ernm
ent
Offi
ce B
uild
ings
11
11
11
11
11
11
11
11
12
12
Oth
er B
uild
ings
31
31
31
31
31
31
27
27
27
27
Publ
ic S
afet
yFi
re S
tatio
ns17
1818
18
18
1818
18
18
18Fi
re T
ruck
s/En
gine
s22
2222
2222
2222
22
22
22
Ambu
lanc
es11
11
11
12
12
12
12Po
lice
Stat
ions
6
6
6
6
6
6
7
7
7
7
Publ
ic F
acili
ty &
Impr
ovem
ent
N
umbe
r of B
ridge
s14
9
14
9
14
9
14
9
15
1
15
1
15
1
151
15
1
151
Mile
s of
Roa
ds1,
900
1,
900
1,
900
1,
901
1,
909
1,
924
1,
943
1,94
7
1,
943
1,94
3
N
umbe
r of W
aste
Wat
er P
lant
s5
4
4
4
4
4
4
5
5
5
Park
s &
Rec
reat
ion
Num
ber o
f Rec
reat
ion
Cen
ters
5
5
7
6
6
6
9
8
7
7
Num
ber o
f Par
ks50
50
50
50
50
50
48
51
54
54
UN
IFIE
D G
OVE
RN
MEN
T O
F W
YAN
DO
TTE
CO
UN
TY /
KAN
SAS
CIT
Y, K
ANSA
SC
APIT
AL A
SSET
STA
TIST
ICS
BY
FUN
CTI
ON
Last
Ten
Fis
cal Y
ears
145
Sour
ce:
Uni
fied
Gov
ernm
ent b
udge
t dep
artm
ent a
nd in
divi
dual
dep
artm
ents
.

This page intentionally left blank
146