Unifi High Yield Fund
24
Unifi High Yield Fund
Transcript of Unifi High Yield Fund

Unifi High Yield Fund

Preface
Investor Predicament
Conventional Equity •High / above average return potential •Accompanied by extreme volatility
Conventional Debt •Low / below average volatility •Hardly any real returns post tax and inflation
Cyclicality of asset values combined with misconstructed risk-return expectations push investors to either • settle for sub-par returns (or) • bear volatility beyond one’s temperament leading to capital loss
Unifi HYF Proposition
High Yield Fund
•Consistent above average returns •Minimal / below average volatility
Risk adjusted arbitrage and fixed income opportunities arising from
• corporate events
• macro-economic cycles
• emerging credit

The following table presents the backdrop of choices and challenges that we typically face in planning our investments. Every one of these 4 choices suffers from at-least one serious flaw that renders it suboptimal. Equity is the one option that earns an attractive return, but its deep cyclicality naturally limits the proportion of capital that most investors are willing to expose to it. Unifi High Yield Fund (HYF) seeks to address this investor dilemma i.e. finding a middle path that could consistently generate a solid return over inflation, without any restrictions on free and unfettered access to one’s own money. We set ourselves a goal of earning a real return of 3% - 4% p.a. after inflation, taxes and all costs, using strategies that we understand and trust.
CAGR RETURNS FOR PAST 28 YEARS
Bank deposit/
Debt mutual
funds5
8.92-8.94%1 Just barely beats inflation post tax
Real Estate 10.20%2 Illiquid, highly cyclical, high transaction costs, complex
title & project specific issues
Gold 10.64%3 Driven purely by psychological factors, cyclical & volatile
Equity 14.30%4
The predicament of having to time one’s need for capital
with the right moment in the cycle, limits the proportion
of savings that one can deploy
Preface (Contd.)

Preface (Contd.)
Our real challenge is to diligently find the pockets of opportunity that are constantly
created by the ebb and flow of economic trends, corporate actions and human-emotion. We closely monitor a wide range of asset classes and devise simple methods to continually access the market’s evolving energy, always mindful of probable scenarios that could surprise us.
Unifi High Yield Fund was started in April 2013 and over the past five years has earned a compounded annual return of 15.02% (9.68% post tax) after all expenses with a standard deviation of just 1.8%. Additional highlight is the fund’s outperformance over the category average of comparable debt mutual funds in all of these five years.
Fund / Returns FY2018 FY2017 FY2016 FY2015 FY2014
Unifi High Yield Fund 14.47% 13.70% 14.67% 16.82% 14.40%
Debt MFs - Dynamic bond category average 4.69% 12.13% 6.55% 10.54% 5.86%
- Dynamic bond category topper 7.98% 14.40% 8.07% 15.13% 10.36%
Debt MFs - Credit funds category average 7.70% 10.65% 8.99% 9.28% 8.41%
- Credit funds category topper 9.43% 11.50% 10.02% 11.87% 11.12%
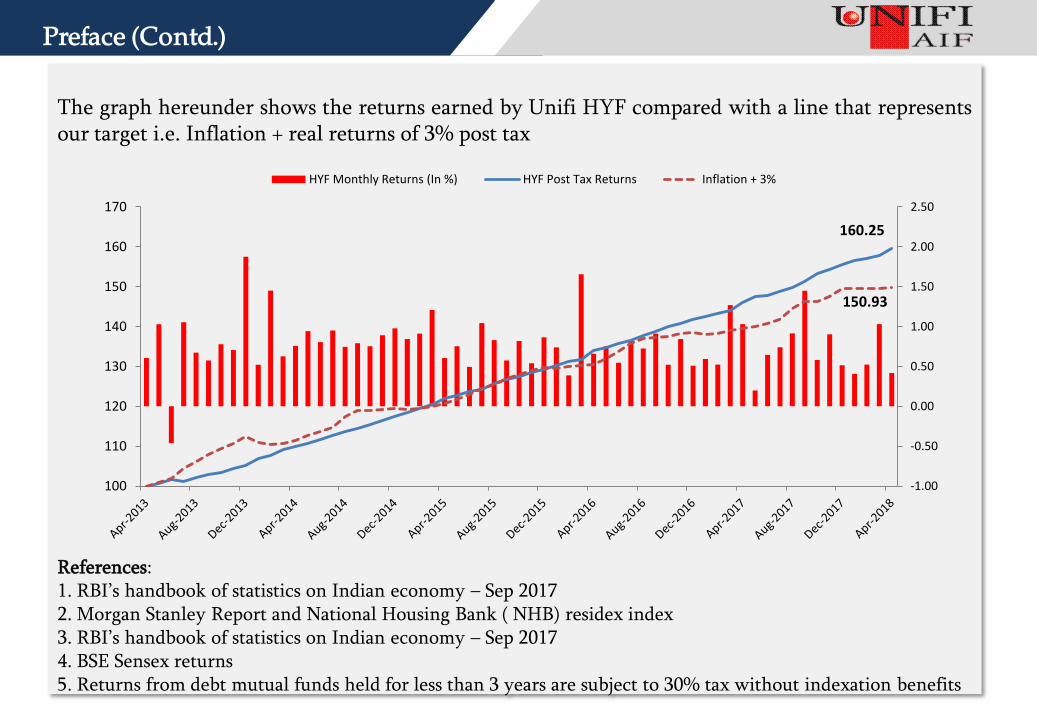
The graph hereunder shows the returns earned by Unifi HYF compared with a line that represents our target i.e. Inflation + real returns of 3% post tax References: 1. RBI’s handbook of statistics on Indian economy – Sep 2017 2. Morgan Stanley Report and National Housing Bank ( NHB) residex index 3. RBI’s handbook of statistics on Indian economy – Sep 2017 4. BSE Sensex returns 5. Returns from debt mutual funds held for less than 3 years are subject to 30% tax without indexation benefits
Preface (Contd.)
-1.00
-0.50
0.00
0.50
1.00
1.50
2.00
2.50
100
110
120
130
140
150
160
170
HYF Monthly Returns (In %) HYF Post Tax Returns Inflation + 3%
160.25
150.93

Overview
Investment Objective
Unifi High Yield AIF is a discretionary fund focusing on event arbitrage and structured investment opportunities across
multiple asset classes with an objective to generate absolute returns of 15% p.a with a standard deviation of 12% or less.
The endeavor is to consistently generate superior compounded annual returns than conventional fixed income
instruments with uncompromising emphasis on capital preservation.
Unifi Capital Pvt. Ltd. Fund Manager
Min Investment INR 1 crore
Performance Reporting
Monthly NAV & Quarterly Review
Independent Custodian & Accountant
IL&FS Securities Services Ltd
Lock in period None
Tenure Open ended; Monthly subscription and redemption
Fees 1% per annum fixed and 20% performance over hurdle rate (Monthly Chargeable)
Valuation S&P CRISIL
Launch Date 04-Apr-2013.
AUM (INR Crs) INR 518 crores
Hurdle Rate Non cumulative pre tax return of 10% per annum
Setup Fees None

Investment Allocation Approach
Rise
Fall
Unifi AIF’s core investment strategy is
to exploit corporate event arbitrage
opportunities that inherently have
limited correlation to economic cycles
and market volatility. In the debt
segment, the focus is on high yield
opportunities with an accrual mindset
besides tax efficiency.
Event Arbitrage
Nominal Bonds
High Yield Bonds
Select Equities
Event Arbitrage
High Yield Bonds
Select Equities
Event Arbitrage
Floating rate notes
Gold ETFs
Event Arbitrage - 100% acceptance
Nominal Bonds
Change in Economic Growth Rate Expectations
Change in Inflation Expectations
Rise
Fall
Rise Fall
Rise
Fall
-5.0
-
5.0
10.0
15.0
19
95
19
96
19
97
19
98
19
99
200
0 2
001
2
002
2
003
2
004
2
005
2
006
2
007
2
008
2
009
2
010
20
11
20
12
20
13
20
14
20
15
20
16
20
17
20
18
Real GDP WPI Inflation

Investment Allocation
Strategies Instruments Indicative Allocation
Avg Allocation FY 2018
Avg Allocation FY 2017
Avg Allocation FY 2016
Event Arbitrage
Arbitrage opportunities in Listed Equities arising from open offers, delisting, mergers & de-mergers, IPOs, Cash-Futures
0 – 100% 21% 26.2% 16%
Nominal Bonds Conventional AAA & AA bonds of various Indian Companies – Typically HTM
0 – 50% 26% 23% 22%
Structured & High yield Debt
Structured Secured Corporate Debt, Commercial Papers, short term bonds and tax efficient Preference Shares of NBFCs focusing on Housing, SME , CV, Agri and Micro Finance.
0 – 75% 46% 46.3% 53%
Directional Calls Equity, G-Secs and AAA debt (duration calls)
0 – 10% 1% 1.8% 2%
Cash / Liquid For liquidity purposes/ temporary parking of funds.
6% 2.7% 7%

Investment Strategy
• Emerge from corporate events like acquisition, buyback regulation triggered / voluntary open offers made to the public by controlling shareholders, company delisting, merger of two listed companies etc.
• The risk- return pay-off in most of such deals is deal-specific and has limited correlation to market cycles.
• Emerge in such cases due to the perceived discount in the pre-event market price in relation to the open offer / post-event price, occurring largely due to asymmetric information distribution, difference in investment objectives and expectation amongst investors
Event Arbitrage opportunities
• Also emerge across asset classes including
• Conventional Debt (Wholesale-Retail Arbitrage; Subsidiary-Holding Company Arbitrage)
• Structured High Yield Debt issuances collateralized with home loan, auto loan, micro finance receivables etc (Asset Liability Management Arbitrage in Alternative NBFCs )
Debt Arbitrage opportunities

Unifi Event Arbitrage - Track Record
15+ Years
150+ investments (Out of 200+ opportunities reviewed)
1500+ crores deployed successfully
~ 15% CAGR returns with a standard deviation of ~ 7% (Adjusted for Cash)
Synopsis of past performance
Total no. of deals till Mar 2018
188
Profitable deals 165
Average returns per deal
6%
Average tenure of deals
3 - 4 months
-30.00%
-20.00%
-10.00%
0.00%
10.00%
20.00%
30.00%
40.00%
50.00%
0 20 40 60 80 100 120 140 160 180
% R
etu
rns
Sequential Event Arbitrage Deals

Event Arbitrage
In a typical open offer, the price movement during the period between public announcement and the offer closure is largely insulated from market volatility and delivers a debt like absolute return.
Particulars FY18 FY17 FY16 FY15 FY14 FY13 FY12
Total no. of offers
45 51 73 60 60 74 71
No. of offers participated
1 2 7 9 12 16 11
Average offer size (in crs)
70 186 161 287 3941 523 288
Largest Offer invested (in crs)
0.91 415 1621 11449 29200 5222 931
Smallest Offer invested (in crs)
0.91 115 26 251 30 40 27
175
185
195
205
215
225
0
10000
20000
30000
40000
14/07/2015 14/08/2015 14/09/2015 14/10/2015 14/11/2015 14/12/2015
Shar
e P
rice
Vo
lum
e (i
n 0
0's
)
IIFL Open Offer
Volumes (in 00's) Share Price
Similar to Debt Returns
PA Date: 14 Jul 2015 Purchase Date: 25 Aug 2015 Purchase Date: 185 Offer Price: 195
Payment Date: 8th Dec 2015 Acceptance: 100% Return: 5.40% Annualized Returns: 18.79%
0
20
40
60
80
100
120
19
97
19
98
19
99
20
00
20
01
20
02
20
03
20
04
20
05
20
06
20
07
20
08
20
09
20
10
20
11
20
12
20
13
20
14
20
15
20
16
20
17
20
18
Historical No of Open Offers

Merger Arbitrage
Case Study – (HCL – Geometric Merger)
HCL-Geometric merger was announced in Apr 2016 wherein for every 43 shares of Geometric, its shareholder would get 10 shares of HCL Tech and 43 preference shares of 3DL PLM (7% redeemable) with a face value of Rs.68 each. We started tracking the spreads and entered into the trade in April 2016 where we reckoned that we could make 14% per annum. We bought shares of Geometric and sold HCL Tech in the futures market. HCL Tech being a highly liquid F&O scrip enabled us to hedge our Geometric exposure completely and lock-in the desired spreads. All the deal related approvals were obtained by Jan 2017 and the spreads had also narrowed to 8% p.a by then. As we had realized the intended holding period return of 14% p.a, we exited the trade during February month just before the record date for share swap and moved into another opportunity with better yield. . Below is the timeline of approvals and respective spreads. Event Date
Annualized return
Merger Announcement date 1-Apr-16 25.22%
Unifi Entered the trade 4-Apr-16 14.97%
NOC approval from exchange 8-Jun-16 13.61%
CCI Approval 21-Aug-16 14.10%
Shareholders approval 4-Oct-16 16.50%
High Court Approval 14-Dec-16 11.55%
Copy of High court approval submitted to exchange 18-Jan-17 12.05% Unifi Exit prior to record date of 15-03-17 28-Feb-17 7.83%
80.00
90.00
100.00
110.00
120.00
130.00
140.00 HCL - Geometric Price Movement
HCL Tech Geometric

Debt Investments – Approach and Strategy
Investment Strategy - The focus would be on opportunities in the AA to Investment Grade
segment to optimize after tax yields while balancing risks. Typically, all debt investments are
made with Hold to Maturity (HTM) mindset but some of it could be traded opportunistically to
maximize capital appreciation or minimize risk. Arbitrage opportunities emerging from the
following possibilities will be actively pursued to enhance the overall portfolio yields.
Wholesale to Retail – Bulk Buying from Bank
Treasuries / Primary Issuances at finer rates and
selling in smaller lots with a mark-up to HNIs /
Private Provident Fund Treasuries.
Aggregator of Retail Lots – Provide the much
needed liquidity channel for retail bond
holders at market yields plus spread.
Subsidiary – Holding Company – Focus on 100%
Subsidiaries whose papers are rated lower than their
highly rated Parent companies but offer an higher
yield.
Tactical Calls - Consider macro-economy
driven opportunities like softening of Yield
Curve (duration play) due to fall in Interest
Rates and conducive Rating Upgrades cycle
resulting in capital gains.

Debt Investments – Approach and Strategy
Structured Papers from Emerging Financial Sectors- Consider high yield opportunities arising from
well-capitalized and professionally managed Alternative NBFCs focusing on
The following criteria is firmly applied for selection of investment opportunities in this segment -
Fundamentally sound and profitable business model
Management with proven track record
Robust process for credit evaluation, security creation, operations control and collections
Presence of seasoned Private Equity investors in the board
Recent round of promoter / private equity infusion strengthening the capital adequacy
Short Term Maturity and being in the top quadrant of the Company’s Liability
Repayment profile thereby placing our exposure in a positive Asset Liability bucket.
Affordable Housing SME Financing
backed by Mortgages
Commercial Vehicles Financing
Micro Financing

Debt Investments – Approach and Strategy
Case Study – (SME Finance) – Capital Float
We invested in a 13.85% interest yielding medium term (2 years) Non-convertible debentures of Bengaluru based Capital Float, an NBFC pursuing SME finance business with the support of fintech. Its current net-worth is about Rs.460 crs and its present AUM is about Rs.617 crs. Run by professional and experienced Management (Ex- Bajaj Finance, Ex-Deutsche Bank) 50+% of the company owned by credible PE and Foreign Institutions – Sequioa, SAIF, Creations Diversified lender base – 9 Banks & NBFCs – successful raising of long term debt Well capitalized NBFC tapping the SME market with innovative products like Cash advances against POS bills, Taxi loans , etc., Comfortable Asset Liability Profile with huge surplus The NCDs were issued to the company to enable it to expand its AUM and leverage its balance sheet. We had put a covenant to limit the leverage at 3x of equity. Subsequent to the NCD issue in Dec 2016, the management was able to expand its AUM and attracted further equity of Rs 293 Cr in Aug 2017.
Rs. in Crore Favourable Asset Liability Profile at the time of Investment - Dec 2016
<30
days
31 - 60
days
61-90
days
91 - 365
days 1 -2 years
2-3
years
> 3
years Total
Total Assets (a)
119.84
21.55
13.88
103.26
58.05
23.58
4.99
345.15
Total Liabilities (b)
37.70
5.44
7.47
47.87
30.96
0.00
215.71
345.15
Mismatch (a-b) 82.14 16.11 6.41 55.39 27.09 23.58 (210.72)
-
Cumulative Mismatch 82.14 98.25 104.66 160.05 187.14 210.72 0
Ratings Migration
Financial Year Name of the Company Upgrade /
Downgrade From To
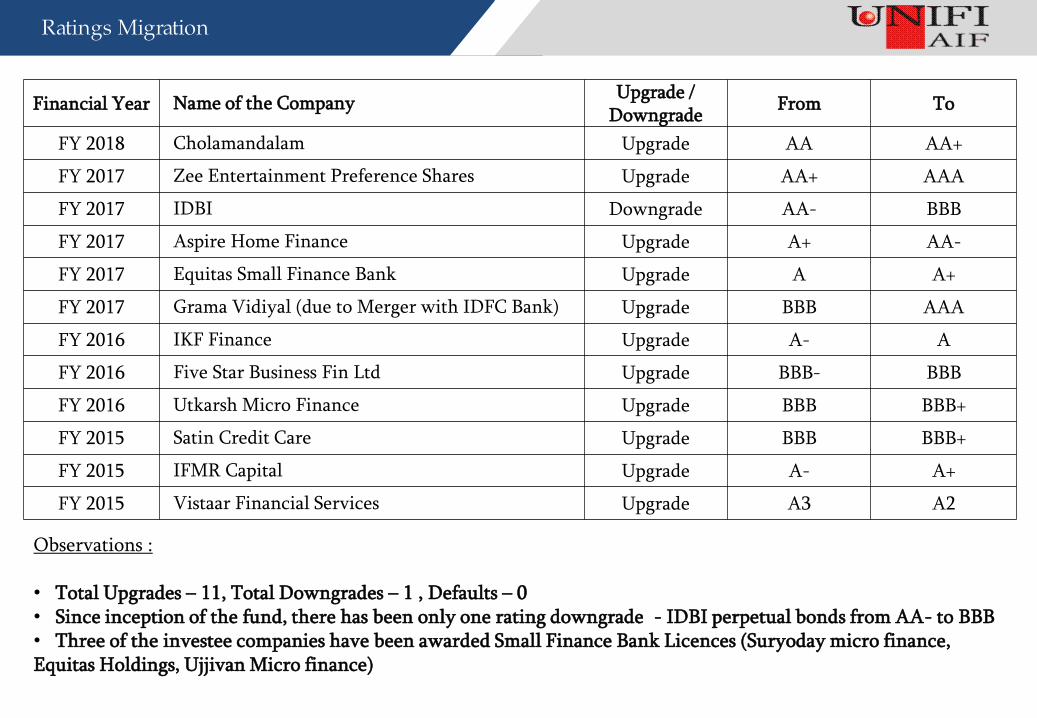
FY 2018 Cholamandalam Upgrade AA AA+
FY 2017 Zee Entertainment Preference Shares Upgrade AA+ AAA
FY 2017 IDBI Downgrade AA- BBB
FY 2017 Aspire Home Finance Upgrade A+ AA-
FY 2017 Equitas Small Finance Bank Upgrade A A+
FY 2017 Grama Vidiyal (due to Merger with IDFC Bank) Upgrade BBB AAA
FY 2016 IKF Finance Upgrade A- A
FY 2016 Five Star Business Fin Ltd Upgrade BBB- BBB
FY 2016 Utkarsh Micro Finance Upgrade BBB BBB+
FY 2015 Satin Credit Care Upgrade BBB BBB+
FY 2015 IFMR Capital Upgrade A- A+
FY 2015 Vistaar Financial Services Upgrade A3 A2
Observations : • Total Upgrades – 11, Total Downgrades – 1 , Defaults – 0 • Since inception of the fund, there has been only one rating downgrade - IDBI perpetual bonds from AA- to BBB • Three of the investee companies have been awarded Small Finance Bank Licences (Suryoday micro finance, Equitas Holdings, Ujjivan Micro finance)

Latest Holdings – Key Attributes
Average Exposure in May 2018
Event Arbitrage 5.6%
Fixed Income (Debt) 82.6%
Directional Calls 2%
Cash / (Leverage) 9.8%
Debt Quants as on May 2018
Weighted Average Maturity 1.85 Yrs
Carry Yield 11.47%
Ratings Exposure of Fixed Income as on May2018
Rating wise Modified duration
As on May 2018
AAA 1.62 Yrs
AA 1.32 Yrs
A 0.97 Yrs
BBB 1.48 Yrs
Overall Debt 1.25 Yrs
AAA
Rated, 4%
AA Rated,
32%
A Rated,
35%
BBB Rated,
29%
MF &
REIT, 0%

AIF Performance
Monthly Performance in (%)
Year Apr May Jun Jul Aug Sep Oct Nov Dec Jan Feb Mar Annual
FY14 0.92% 1.56% -0.70% 1.60% 1.02% 0.87% 1.18% 1.07% 2.84% 0.79% 2.20% 0.95% 14.40%
FY15 1.15% 1.43% 1.22% 1.44% 1.13% 1.20% 1.14% 1.36% 1.48% 1.28% 1.38% 1.83% 16.82%
FY16 0.92% 1.14% 0.75% 1.58% 1.26% 0.87% 1.24% 0.82% 1.31% 1.12% 0.59% 2.51% 14.67%
FY17 1.00% 1.14% 0.83% 1.24% 1.10% 1.38% 0.79% 1.28% 0.77% 0.90% 0.80% 1.97% 13.70%
FY18 1.60% 0.32% 1.00% 1.15% 1.42% 2.25% 0.90% 1.40% 0..80% 0.63% 0.81% 1.60% 14.47%
FY19 0.65% 0.31% 0.95%
Returns
UNIFI AIF
Birla Sh. Opp.
Fund(G)
Fran. Corp. Bond
fund(G)
BSL Dynamic
Bond Fund(G)
Reliance Dynamic Bond(G)
Average Monthly Return
1.17% 0.75% 0.79% 0.71% 0.68%
CAGR 14.72% 9.34% 9.88% 8.69% 8.33%
Cumulative Returns 105.38% 58.62% 62.70% 53.83% 51.22%
Largest Monthly Gain 2.84% 2.34% 3.06% 4.85% 4.28%
Largest Monthly Loss -0.70% -1.17% -2.10% -3.63% -3.81%
% of positive Months 98.39% 91.94% 93.55% 75.81% 72.58%
Risk
Standard Deviation (Annualised)
1.83% 2.16% 2.25% 4.74% 4.94%
UNIFI AIF Vs Debt Fund's
-4%
-3%
-2%
-1%
0%
1%
2%
3%
4%
5%
50
70
90
110
130
150
170
190
210
230 A
pr/
13
May/
13
Jul/13
Sep/1
3
Nov/1
3
Jan/1
4
Mar/
14
May/
14
Jul/14
Sep/1
4
Nov/1
4
Jan/1
5
Mar/
15
May/
15
Jul/15
Sep/1
5
Nov/1
5
Jan/1
6
Mar/
16
May/
16
Jul/16
Sep/1
6
Nov/1
6
Jan/1
7
Mar/
17
May/
17
Jul/17
Sep/1
7
Nov/1
7
Jan/1
8
Mar/
18
May/
18
Month
ly R
etu
rns
Valu
e o
f R
s.1
00 I
nveste
d
Monthly Returns UNIFI AIF Birla Sh. Term Opp. Fund Fran Temp Corp. Bond BSL Dynamic Bond Fund(G) Reliance Dynamic Bond(G)

Investment Allocation & Returns Attribution
Returns Attribution Investment Allocation
16% 11% 16% 26% 21%
71% 84% 75% 69%
72%
0.00%
10.00%
20.00%
30.00%
40.00%
50.00%
60.00%
70.00%
80.00%
90.00%
100.00%
FY 2014 FY 2015 FY 2016 FY 2017 FY 2018
Event Arbitrage Fixed Income
Directional Calls Liquid Funds / (Leverage)
5%
2% 2% 4%
5%
9% 14%
11% 9% 6%
0.0%
2.0%
4.0%
6.0%
8.0%
10.0%
12.0%
14.0%
16.0%
18.0%
FY 2014 FY 2015 FY 2016 FY 2017 FY 2018
Event Arbitrage Fixed Income
Directional Calls Liquid Funds / (Leverage)

Investment Process
Idea Origination
Opportunity validation, review and evaluation of risk / return scenarios
Investment Committee Review
Initiation of Investment
Unifi Capital (P) Ltd – Fund Manager to the Trust
Post Investment Monitoring and Risk Management
CIO, Head-Research and Head-Relationship
AIF Trustees
Internal Review
Statutory Auditors

Portfolio Parameters
Pre-trade
Ongoing Surveillance
Post-trade Firm Infrastructure
In-depth bottom-up review of all investment
opportunities by documented and well
seasoned evaluation process
Sensible Exposure Limits:
- Theme Specific
- Company Specific (not more than 10%)
‘Marketable Liquidity’ Assessment
Rigorous due-diligence on structure and
security w.r.t debt investment opportunities
Maximum Leverage limit including
derivative exposures capped at 1.5 times the
fund corpus
Daily Mark-to-Market assessment including
detailed review of extreme movements
Real-time monitoring of economic developments,
corporate communications to stock exchanges and
methodical tracking of economy and company
specific developments
Periodical meeting / calls with management of all
the investment companies to measure progress,
review results and revalidate assumptions
Opportunistic hedging/tactical trading to respond
to short-term, counter-theme market moves
Best-in-class IT infrastructure with
back-up
Documented Process Flow
Reputed Trustees, Custodian, Valuer
etc
Research Access to premium
databases capturing economic, sector
and company specific trends
Periodical Internal Review and
Statutory Audit
Risk Management Framework
Why Unifi High Yield Fund
• Successful 5 year performance record of Unifi High Yield Fund
• Stable and Experienced Investment Management Team that co-founded
the company in 2001
• Focus on result oriented unique investment themes; even willing to
sacrifice scale (AUM growth) in favor of desired risk adjusted returns
• Scope for consistent compound returns with low volatility
• Robust risk management and operational risk controls

P . S . - The Power of Compounding
The power of compounding is the eight wonder of the world – Einstein. A portfolio with consistent above average compounded returns over years creates more wealth than a one offering high returns at a higher volatility. See the example below – Even one bad year in a 5 yr time period could significantly bring down the returns and dilute the power of compounding.
Year 1 Year 2 Year 3 Year 4 Year 5
Portfolio A 100 18% 16% 17% 19% 15%
219
Portfolio B 100 40% 27% -38% 24% 22%
167
For further information visit:
www.unificap.com
CHENNAI: 11, Kakani Towers 15 Khader Nawaz Khan Road Nungambakkam High Road Chennai - 600 006. INDIA Ph: +91-44-3022 4466 +91-44-2833 1556 Fax: +91-44-2833 2732
BANGALORE: 511, Barton Centre 84, M.G. Road Bangalore - 560 001. INDIA Ph: +91-80-255 9418/19
HYDERABAD: H No. 6-3-346/1, Road No. 1 Banjara Hills Scotia Bank Building Hyderabad – 500 034. INDIA Ph: +91-40-6675 2622/23
MUMBAI: Shiv Sagar Estate, A Block, 8th Floor, Dr. Annie Besant Road, Worli, Mumbai – 400018. Ph: +91-22-24927671 +91-22-24925319 Fax: +91-22-24950580
Thank You
DELHI: No.818, International Trade Tower, Nehru Place , Delhi – 110 019. Ph: +91-8800333799