
UNIDO EnMS Expert Training Module 1 Day 1 -...
272
UNIDO EnMS Expert Training Module 1 Day 1
Transcript of UNIDO EnMS Expert Training Module 1 Day 1 -...
UNIDO EnMS Expert Training
Module 1
Day 1
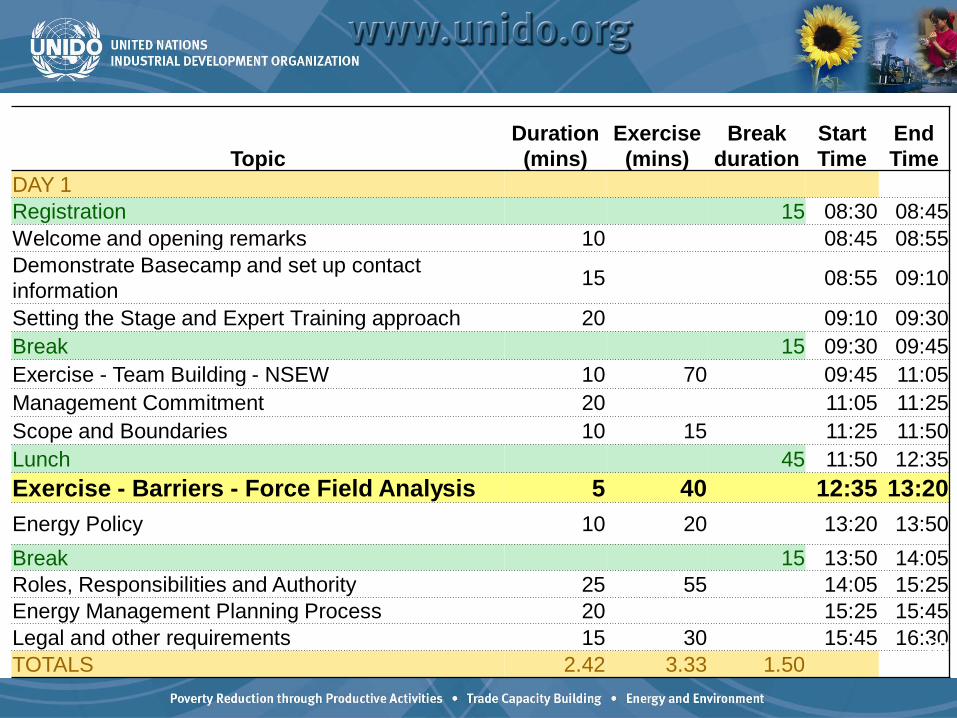
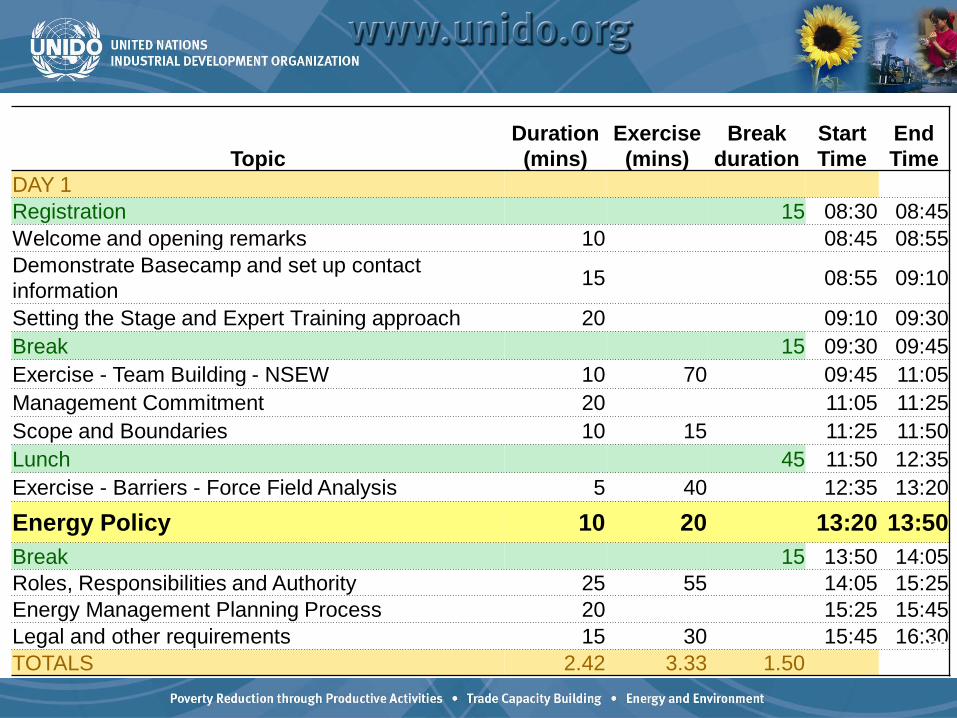
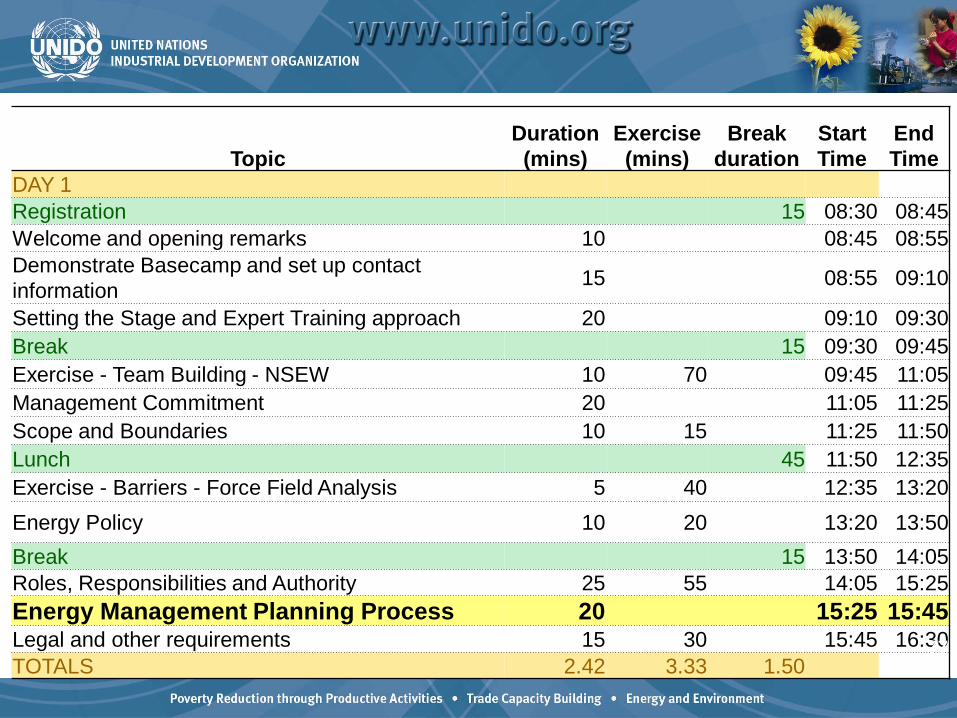
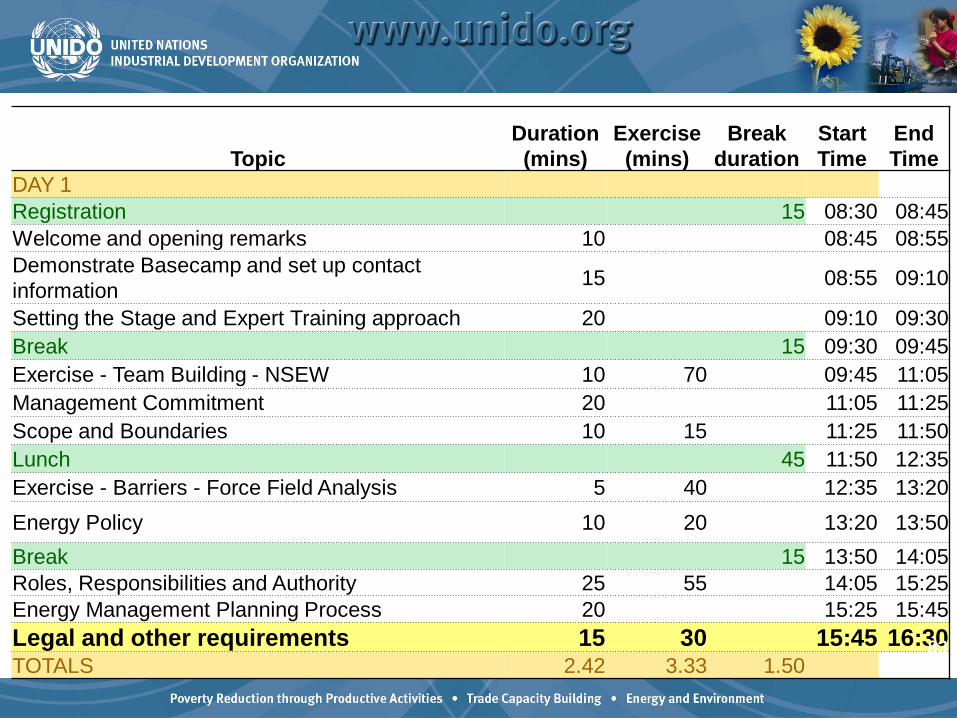
TopicDuration (mins)
Exercise (mins)
Break duration
Start Time
End Time
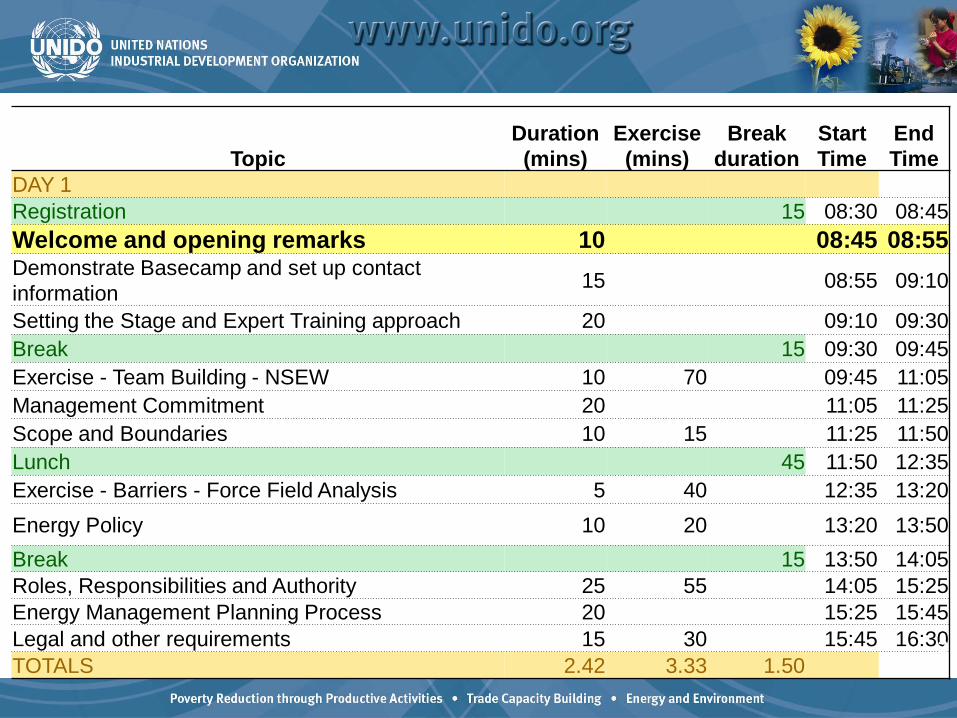
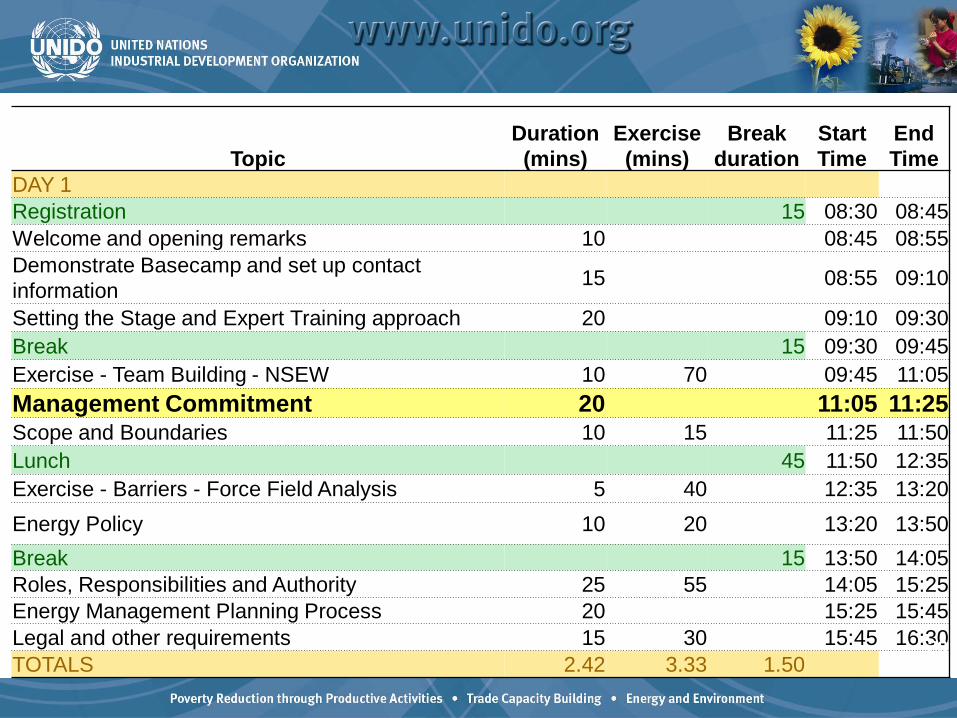
DAY 1Registration 15 08:30 08:45Welcome and opening remarks 10 08:45 08:55Demonstrate Basecamp and set up contact information 15 08:55 09:10
Setting the Stage and Expert Training approach 20 09:10 09:30Break 15 09:30 09:45Exercise - Team Building - NSEW 10 70 09:45 11:05Management Commitment 20 11:05 11:25Scope and Boundaries 10 15 11:25 11:50Lunch 45 11:50 12:35Exercise - Barriers - Force Field Analysis 5 40 12:35 13:20Energy Policy 10 20 13:20 13:50Break 15 13:50 14:05Roles, Responsibilities and Authority 25 55 14:05 15:25Energy Management Planning Process 20 15:25 15:45Legal and other requirements 15 30 15:45 16:30TOTALS 2.42 3.33 1.50
2

Welcome
•Introductions•Overview of the 3 days•Purpose
- Improve energy performance

TopicDuration (mins)
Exercise (mins)
Break duration
Start Time
End Time
DAY 1Registration 15 08:30 08:45Welcome and opening remarks 10 08:45 08:55Demonstrate Basecamp and set up contact information 15 08:55 09:10
Setting the Stage and Expert Training approach 20 09:10 09:30Break 15 09:30 09:45Exercise - Team Building - NSEW 10 70 09:45 11:05Management Commitment 20 11:05 11:25Scope and Boundaries 10 15 11:25 11:50Lunch 45 11:50 12:35Exercise - Barriers - Force Field Analysis 5 40 12:35 13:20Energy Policy 10 20 13:20 13:50Break 15 13:50 14:05Roles, Responsibilities and Authority 25 55 14:05 15:25Energy Management Planning Process 20 15:25 15:45Legal and other requirements 15 30 15:45 16:30TOTALS 2.42 3.33 1.50
4
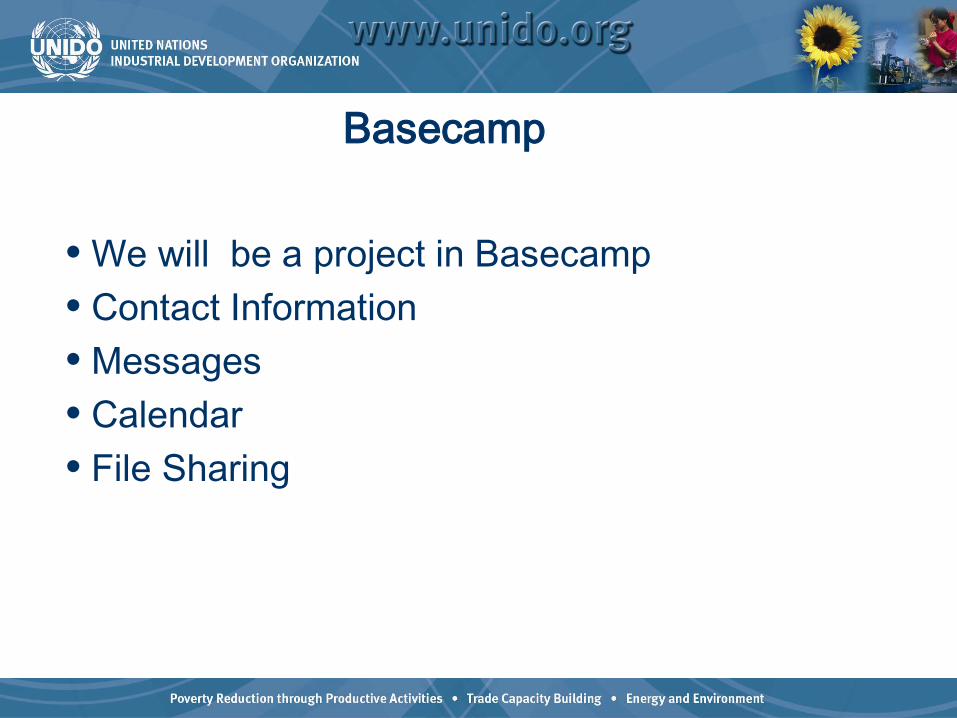
Basecamp
• We will be a project in Basecamp• Contact Information• Messages• Calendar• File Sharing
TopicDuration (mins)
Exercise (mins)
Break duration
Start Time
End Time
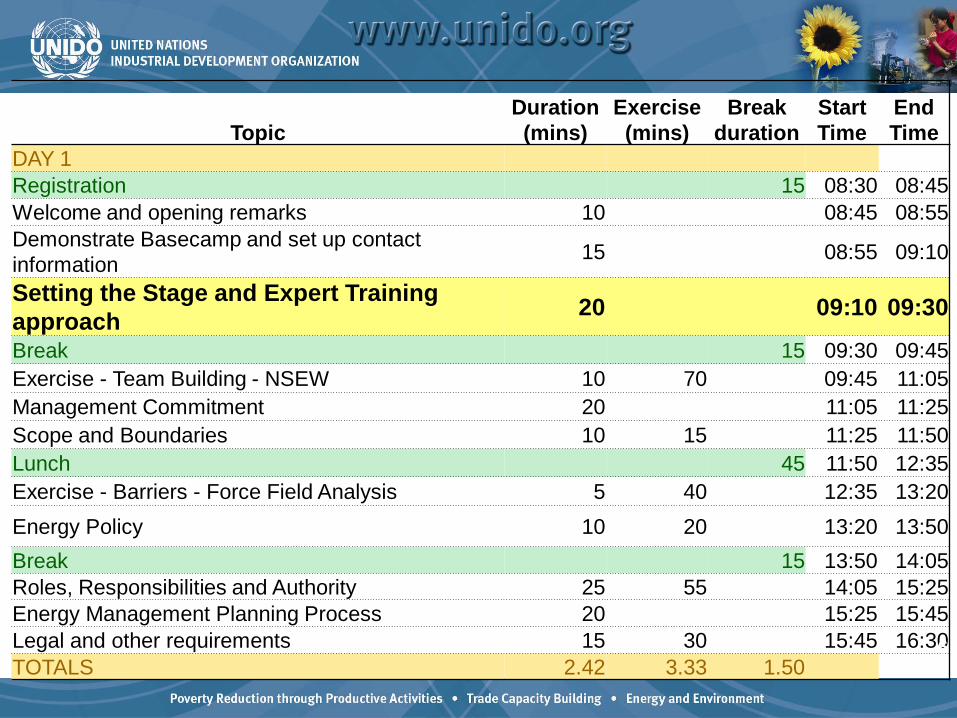
DAY 1Registration 15 08:30 08:45Welcome and opening remarks 10 08:45 08:55Demonstrate Basecamp and set up contact information 15 08:55 09:10
Setting the Stage and Expert Training approach 20 09:10 09:30
Break 15 09:30 09:45Exercise - Team Building - NSEW 10 70 09:45 11:05Management Commitment 20 11:05 11:25Scope and Boundaries 10 15 11:25 11:50Lunch 45 11:50 12:35Exercise - Barriers - Force Field Analysis 5 40 12:35 13:20Energy Policy 10 20 13:20 13:50Break 15 13:50 14:05Roles, Responsibilities and Authority 25 55 14:05 15:25Energy Management Planning Process 20 15:25 15:45Legal and other requirements 15 30 15:45 16:30TOTALS 2.42 3.33 1.50
6

Overview of the UNIDO EnMS
Capacity Building Programme
Industrial Energy Efficiency UnitUNIDO

UNIDO Industrial Energy Efficiency Programme
Thematic focus areas• Energy management systems (EnMS) and standards• Energy systems optimization (steam, pumps, etc.)• Industrial energy and carbon benchmarking• Sub-sector, process and product specific low-carbon technology• Energy and Carbon Storage technologies
• Hydrogen technology applications (RE+H2, fuel-cells in industry & transport)• Carbon Capture & Storage technology in selected industrial sectors
• Renewable energy technologies for industrial applications
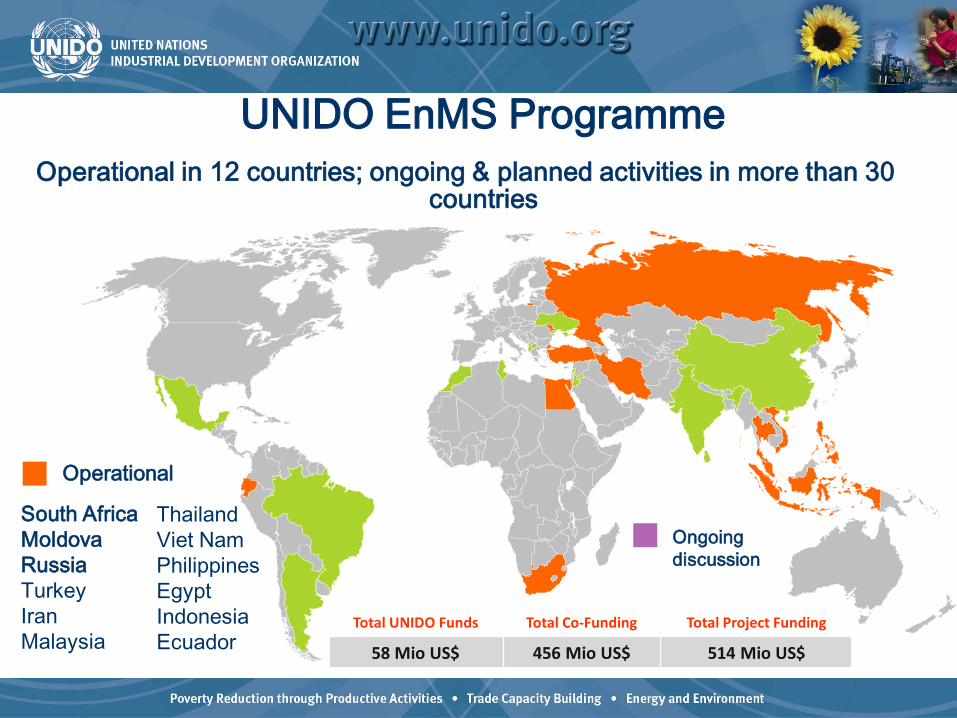
Operational in 12 countries; ongoing & planned activities in more than 30 countries
UNIDO EnMS Programme
Operational
South AfricaMoldovaRussiaTurkeyIranMalaysia
ThailandViet NamPhilippinesEgyptIndonesiaEcuador
Total UNIDO Funds Total Co-Funding Total Project Funding
58 Mio US$ 456 Mio US$ 514 Mio US$
Ongoing discussion

UNIDO Industrial Energy Efficiency Programme
Taking a Comprehensive ApproachObjectives: To reduce GHG emissions & enhancecompetitiveness of industry through improved energyefficiency and the transformation of the market forindustrial energy efficiency products and services.
Component 1
National Program to
define energy benchmarks and
EE policy
Component 2
Awareness raising on
industrial EE and
Management in Industry
Component 3
Technical capacity
building on EE services
Component 4
Access to finance for EE
improvement projects
Component 5
Implementation of Energy
Management systems and
System Optimization
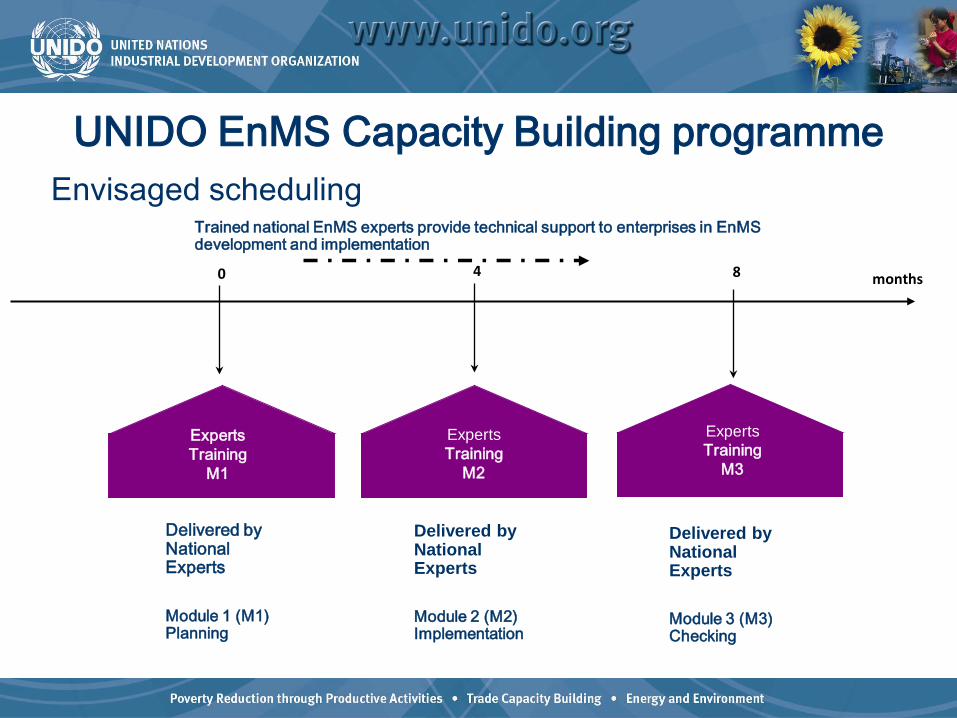
UNIDO EnMS Capacity Building programme• Envisaged scheduling
months0 4 8
½ day Workshops
Experts Training
M1
Experts Training
M2
2 day Users Training
Experts Training
M3
Delivered by National Experts
Module 1 (M1) Planning
Delivered by National Experts
Module 2 (M2) Implementation
Delivered by National Experts
Module 3 (M3) Checking
Trained national EnMS experts provide technical support to enterprises in EnMSdevelopment and implementation
Experts Training
M1
ExpertsTraining
M2
ExpertsTraining
M3
Several national experts teaming withdemonstration plant to implement EnMS
Conflicting messages and styles can delayimplementation
PMU will match consultants and companies Consequences of not working together:
− Not included in the national training program− Will not be certified as trainers or service
providers
Multiple Consultant Model

See you in 15 minutes!

TopicDuration (mins)
Exercise (mins)
Break duration
Start Time
End Time
DAY 1Registration 15 08:30 08:45Welcome and opening remarks 10 08:45 08:55Demonstrate Basecamp and set up contact information 15 08:55 09:10
Setting the Stage and Expert Training approach 20 09:10 09:30Break 15 09:30 09:45Exercise - Team Building - NSEW 10 70 09:45 11:05Management Commitment 20 11:05 11:25Scope and Boundaries 10 15 11:25 11:50Lunch 45 11:50 12:35Exercise - Barriers - Force Field Analysis 5 40 12:35 13:20Energy Policy 10 20 13:20 13:50Break 15 13:50 14:05Roles, Responsibilities and Authority 25 55 14:05 15:25Energy Management Planning Process 20 15:25 15:45Legal and other requirements 15 30 15:45 16:30TOTALS 2.42 3.33 1.50
14
Exercise 01: Team Building
Leadership Compass

Step 1: Determine your work approach
Step 2: Define your direction
Step 3: Plan a vacation
Step 4: Characterize work style
Exercise Format
Step 1: Work Approach
1. Review the 4 approaches to work – North, South, Eastand West.
2. Determine which work style best describes you.3. Join your small group at the flip chart labeled with your
compass direction.

North: The “Get It Done” person

Approach to work•Assertive, Active, Decisive•Likes to be in control and determine the course of events•Quick to act, expresses urgency for others to act quickly also•Enjoys challenging people and situations•Thinks in terms of the “bottom line”•Likes a quick pace and the fast track•Courageous, Ambitious, and Confident•Perseveres – Not stopped by “NO”•Goal-centered, ambitious•Hardworking leader who is comfortable being in front•Value Words – “Do it now!” “I’ll do it.”
North: The “Get It Done” person

South: The Nurturer
Approach to work•Friendly, likeable team player•Allows others to feel important•Supportive, nurturing and caring towards colleagues•Willing to trust others’ statements at face value•Peace-loving, sympathetic, and helpful•Feelings-based, trusts own emotions and intuition as truth•Able to focus on the present moment•Process-centered•Generous, non-competitive and likes to build on the ideas ofothers•Value Words: “Right” and “Fair”
South: The Nurturer

East: The Visionary

Approach to work•Innovative, Creative and sees the big picture•Very idea oriented, focuses on future thought•Risk-taker, adventurous, spontaneous•Has insight into mission and purpose•Looks for overarching themes and ideas•Appreciates a lot of information•Strong spiritual awareness, free spirited, unconventional•Likes to experiment and explore•Value words: “Option” “Possibility”
East: The Visionary

West: The Analyst

Approach to work•Seen as practical, dependable, and thorough•Provide planning and resources to others•Moves carefully, deliberately, and follows procedures andguidelines•Use data to make logical and analytical decisions•Weighs all sides of an issue, balanced•Introspective, self-analytical, focused, reserved•Careful, thoroughly examines people’s needs in situations•Works well with existing resources – gets the most out of whathas been done in the past•Skilled at finding the fatal flaw in an idea or a project•Value Words: “Objective,” “Organized”
West: The Analyst

Step 2: Define your DirectionOn the flip chart:1.List what is really great about being your “direction”.
2.List what is really hard about being your “direction”.
You have 10 minutes!

Step 3: Vacation Planning 1. Each group will plan a vacation. Describe the
vacation including what, where, how and why.You have 15 minutes!
2. Assign a spokesperson.3. Each group has 3 minutes to describe their
vacation.

Step 4: Work Style1. Brainstorm the best ways to work with your
“direction”. Choose the top 3 ways to work withyour “direction”.
2. Assign a new spokesperson. You have 10minutes!
3. Each group has 2 minutes to describe the top 3ways to work with your “direction”
TopicDuration (mins)
Exercise (mins)
Break duration
Start Time
End Time
DAY 1Registration 15 08:30 08:45Welcome and opening remarks 10 08:45 08:55Demonstrate Basecamp and set up contact information 15 08:55 09:10
Setting the Stage and Expert Training approach 20 09:10 09:30Break 15 09:30 09:45Exercise - Team Building - NSEW 10 70 09:45 11:05Management Commitment 20 11:05 11:25Scope and Boundaries 10 15 11:25 11:50Lunch 45 11:50 12:35Exercise - Barriers - Force Field Analysis 5 40 12:35 13:20Energy Policy 10 20 13:20 13:50Break 15 13:50 14:05Roles, Responsibilities and Authority 25 55 14:05 15:25Energy Management Planning Process 20 15:25 15:45Legal and other requirements 15 30 15:45 16:30TOTALS 2.42 3.33 1.50
29
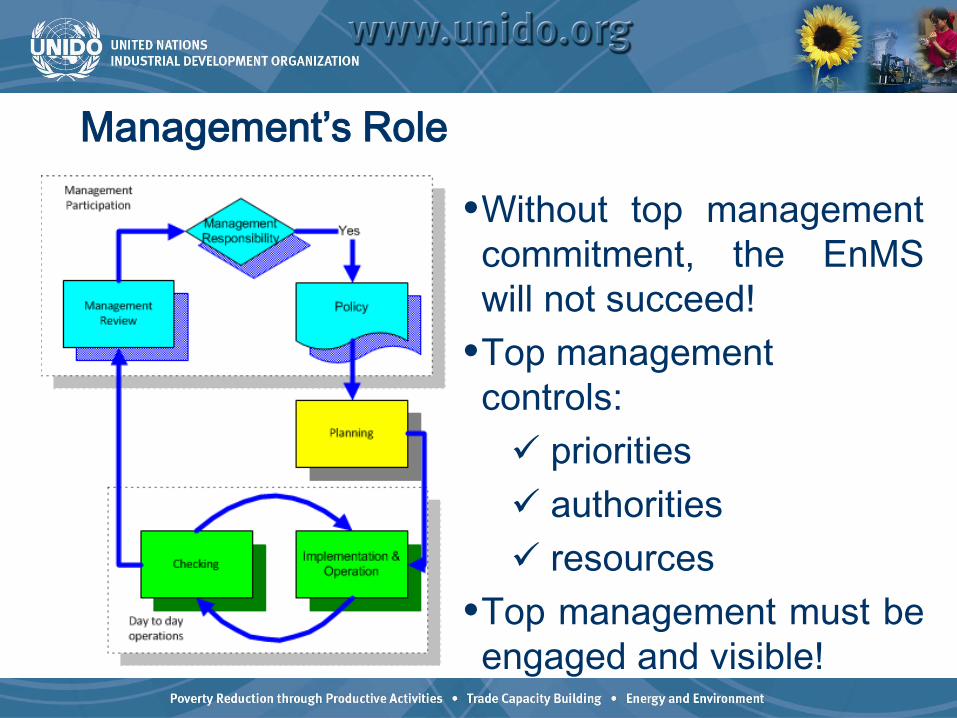
Management’s Role
•Without top managementcommitment, the EnMSwill not succeed!
•Top management controls: priorities authorities resources
•Top management must beengaged and visible!
The foundation of management commitmentManagement commitment begins with buy-in tothe business value of a systematic approach toenergy management.Continued management commitment relies oncontinual refinement and communication of thebusiness value of energy management.Over time, the organization’s own achievementsand improvements will demonstrate the businessvalue of energy management.

It is imperative that energymanagement goals flowthrough the managementhierarchy from the topthrough middle managementto the employee on the frontlines, so that everyone has aclear understanding of theirroles and responsibilities inachieving those goals.
Organizational Reality
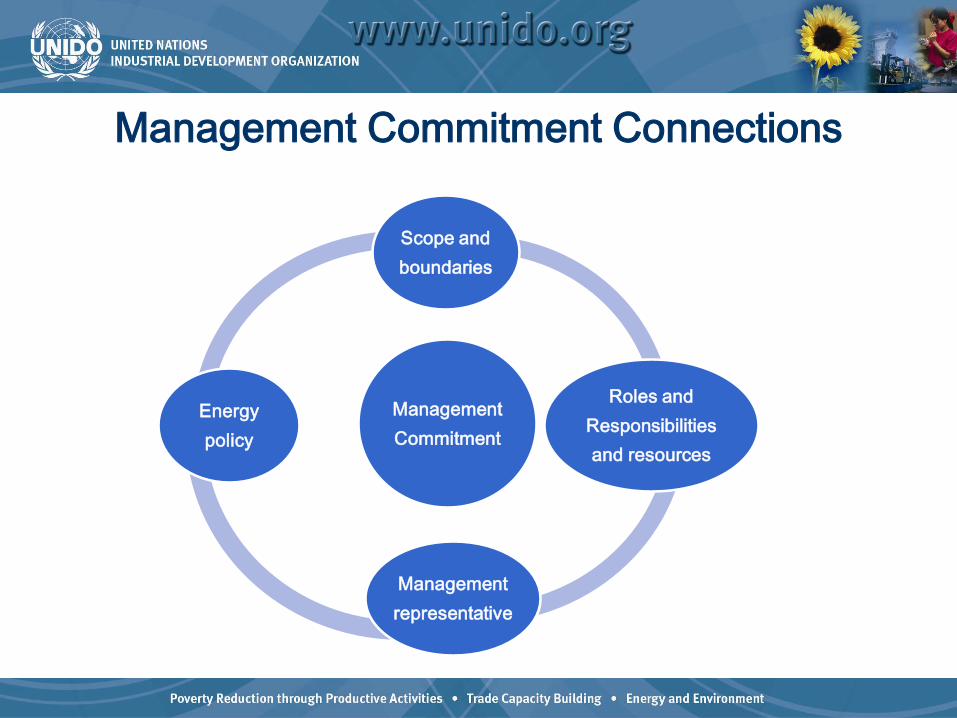
Management Commitment Connections
Management Commitment
Scope and boundaries
Roles and Responsibilities and resources
Management representative
Energy policy
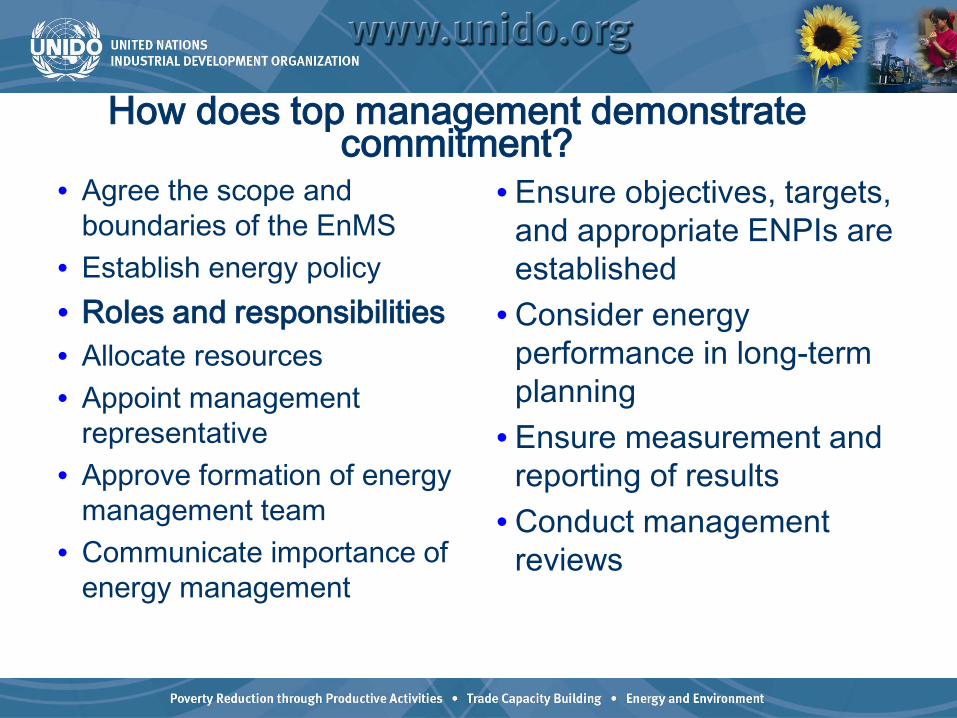
How does top management demonstrate commitment?
• Agree the scope andboundaries of the EnMS
• Establish energy policy• Roles and responsibilities• Allocate resources• Appoint management
representative• Approve formation of energy
management team• Communicate importance of
energy management
• Ensure objectives, targets,and appropriate ENPIs areestablished
• Consider energyperformance in long-termplanning
• Ensure measurement andreporting of results
• Conduct managementreviews
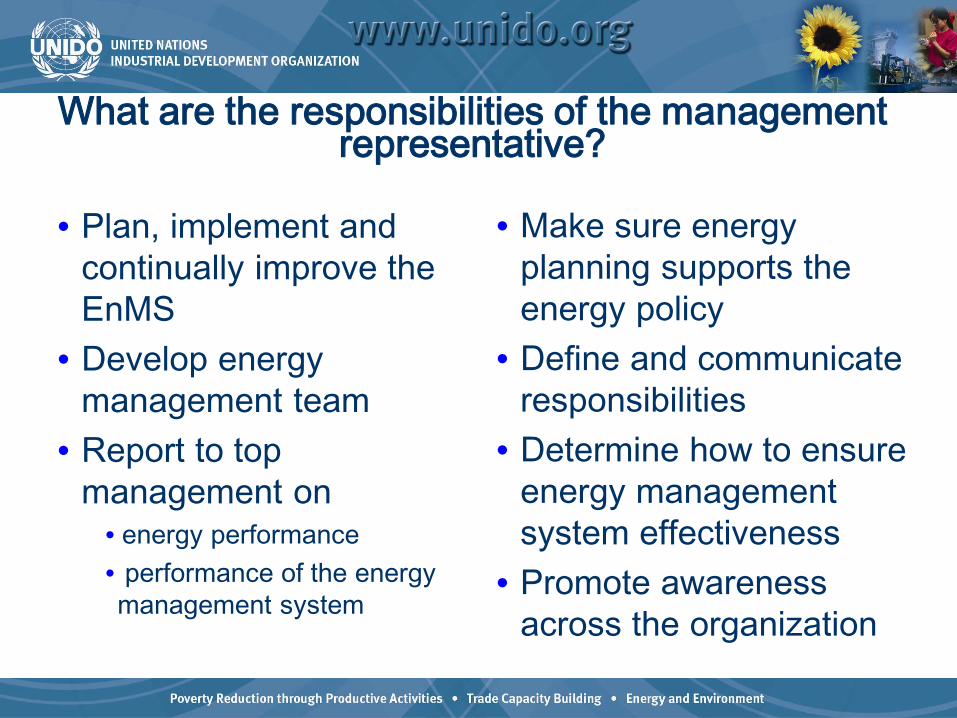
What are the responsibilities of the management representative?
• Plan, implement and continually improve the EnMS
• Develop energy management team
• Report to top management on
• energy performance • performance of the energy management system
• Make sure energy planning supports the energy policy
• Define and communicate responsibilities
• Determine how to ensure energy management system effectiveness
• Promote awareness across the organization
Reporting is key!
• Reporting is a key element in maintainingmanagement commitment
• Ongoing communication of successes buildsconfidence and buy-in
• Clear, concise information on results makesbest use of valuable management time
• Value-added information leads to informeddecision-making
Expert’s Role in Management Commitment
Develop strategies for top management involvement and visibility.
Promote ongoing refinement and communication of the business case.
Mentor the management representative
Ensure framework for reporting to management is established and implemented.
Implement management review as an action-based process.

Typical Barriers
• Competing organizational priorities• Resource constraints• View of energy as overhead• “Aren’t we already doing this?”• “Not my job” mentality• Information overload
Value to the Organization
Aligns energy management with organizational priorities
Ensures long-term sustainability of the EnMSEncourages employee buy-in
and participationProvides visible
demonstration of environmental leadership to external parties

TopicDuration (mins)
Exercise (mins)
Break duration
Start Time
End Time
DAY 1Registration 15 08:30 08:45Welcome and opening remarks 10 08:45 08:55Demonstrate Basecamp and set up contact information 15 08:55 09:10
Setting the Stage and Expert Training approach 20 09:10 09:30Break 15 09:30 09:45Exercise - Team Building - NSEW 10 70 09:45 11:05Management Commitment 20 11:05 11:25Scope and Boundaries 10 15 11:25 11:50Lunch 45 11:50 12:35Exercise - Barriers - Force Field Analysis 5 40 12:35 13:20Energy Policy 10 20 13:20 13:50Break 15 13:50 14:05Roles, Responsibilities and Authority 25 55 14:05 15:25Energy Management Planning Process 20 15:25 15:45Legal and other requirements 15 30 15:45 16:30TOTALS 2.42 3.33 1.50
40
Scope and Boundaries
Scope and boundaries of the EnMS need to be Defined Documented

What Are You Including?
Property and Buildings
Energy Systems and Process
Equipment People
EnMS
Is There Anything That is Not Included? Do you have a building or location that you are
not including? Do you have a process or product line you are
not including? Is there an area on which you do not have
energy information? Is there an area where you cannot gain
employee involvement or participation? Is there a different management team or decision
structure?
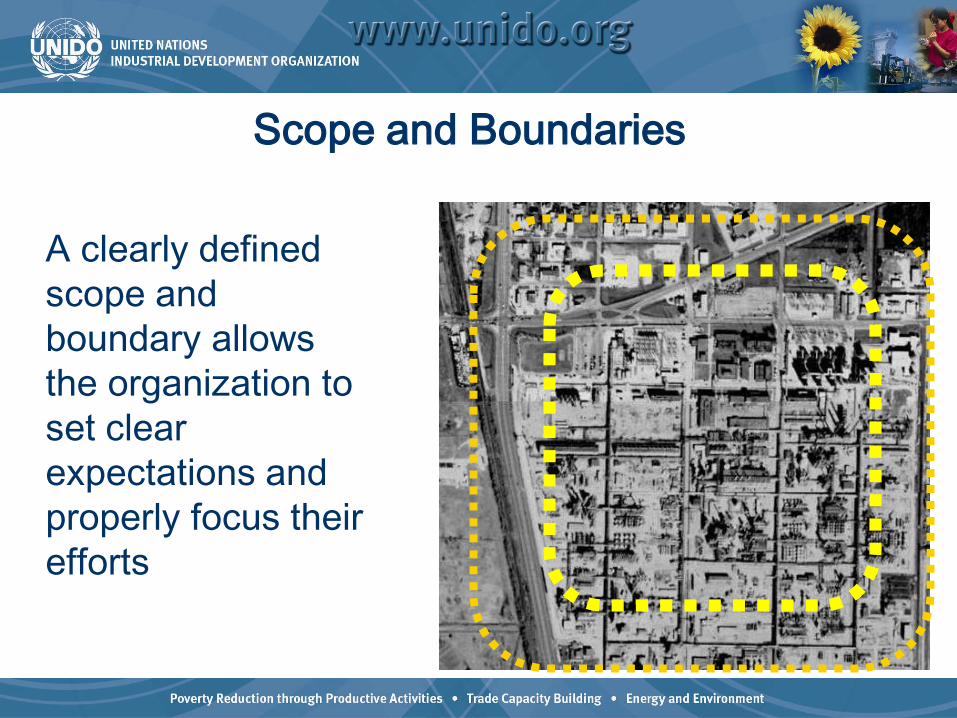
Scope and Boundaries
A clearly defined scope and boundary allows the organization to set clear expectations and properly focus their efforts

Scope and Boundaries
Boundaries mayrepresent separatephysical spaces
Connections and Considerations
Top managementcommitment
Energy review coversthe scope
Competence awarenessand training cover thescope of the system
Were all energy sourcesconsidered?
Were other relationshipssuch as corporatepurchasing addressed?
Were other systems suchas ISO 9001 & ISO 14001considered?
Potential Barriers
Existing management system only covers a part of the organization.
Corporate controls certain functions such as purchasing, or design.
Limited energy data.
Value to the organization
Allows the organization to focus their efforts
Allows the organization to focus their resources
Allows the organization to clearly communicate the expectations

Exercise
•Use scope and boundaries tab
•List all energy sources included and excluded
•List all buildings/facilities included
•Is water use included?
•Is transport included?
•Document reasons for excluding anything

See you in 45 minutes!
TopicDuration (mins)
Exercise (mins)
Break duration
Start Time
End Time
DAY 1Registration 15 08:30 08:45Welcome and opening remarks 10 08:45 08:55Demonstrate Basecamp and set up contact information 15 08:55 09:10
Setting the Stage and Expert Training approach 20 09:10 09:30Break 15 09:30 09:45Exercise - Team Building - NSEW 10 70 09:45 11:05Management Commitment 20 11:05 11:25Scope and Boundaries 10 15 11:25 11:50Lunch 45 11:50 12:35Exercise - Barriers - Force Field Analysis 5 40 12:35 13:20Energy Policy 10 20 13:20 13:50Break 15 13:50 14:05Roles, Responsibilities and Authority 25 55 14:05 15:25Energy Management Planning Process 20 15:25 15:45Legal and other requirements 15 30 15:45 16:30TOTALS 2.42 3.33 1.50
50

Force field analysis (Lewin, 1951)
Energy PerformanceOpportunity
(EnMS System)
Significant Improvement potential
Low investment
Good Training
Energy Cost Increase
Knowledge of plant
It is working OK Now
We have no money forInvestment
What improvement Potential?CSR
I haven't time for this FAD?
51
TopicDuration (mins)
Exercise (mins)
Break duration
Start Time
End Time
DAY 1Registration 15 08:30 08:45Welcome and opening remarks 10 08:45 08:55Demonstrate Basecamp and set up contact information 15 08:55 09:10
Setting the Stage and Expert Training approach 20 09:10 09:30Break 15 09:30 09:45Exercise - Team Building - NSEW 10 70 09:45 11:05Management Commitment 20 11:05 11:25Scope and Boundaries 10 15 11:25 11:50Lunch 45 11:50 12:35Exercise - Barriers - Force Field Analysis 5 40 12:35 13:20
Energy Policy 10 20 13:20 13:50Break 15 13:50 14:05Roles, Responsibilities and Authority 25 55 14:05 15:25Energy Management Planning Process 20 15:25 15:45Legal and other requirements 15 30 15:45 16:30TOTALS 2.42 3.33 1.50
52
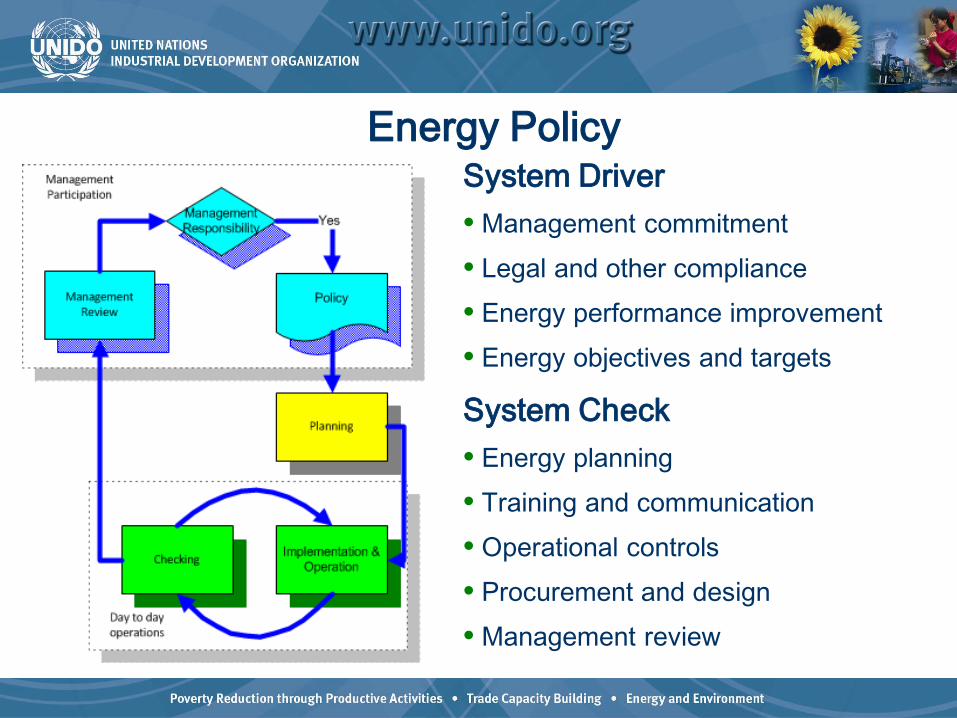
Energy PolicySystem Driver• Management commitment• Legal and other compliance• Energy performance improvement• Energy objectives and targets
System Check• Energy planning• Training and communication• Operational controls• Procurement and design• Management review
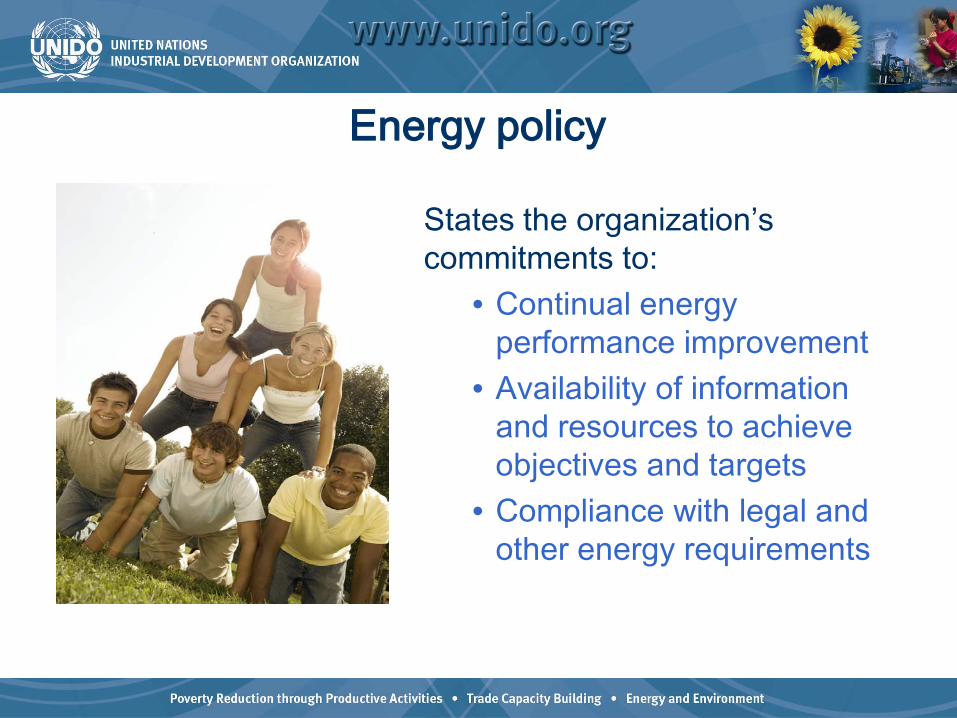
Energy policy
States the organization’s commitments to:
• Continual energy performance improvement
• Availability of information and resources to achieve objectives and targets
• Compliance with legal and other energy requirements
Energy policySupports the organization’s:
Purchase of energy-efficient products andservices
Consideration of energyperformance improvementin design
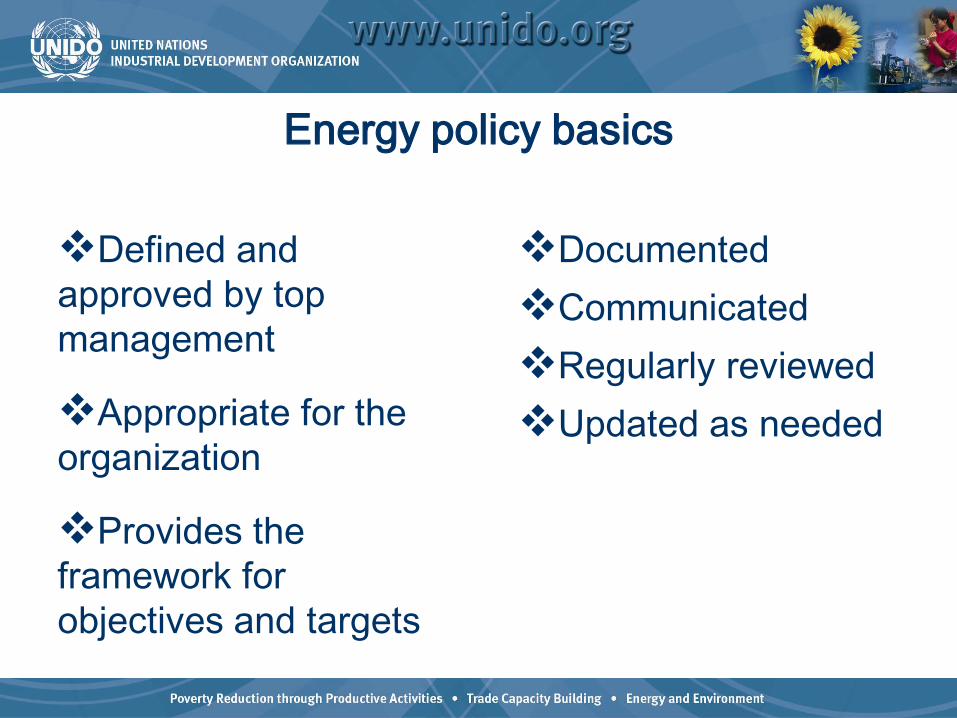
Energy policy basics
Defined and approved by top management
Appropriate for the organization
Provides the framework for objectives and targets
DocumentedCommunicatedRegularly reviewed Updated as needed
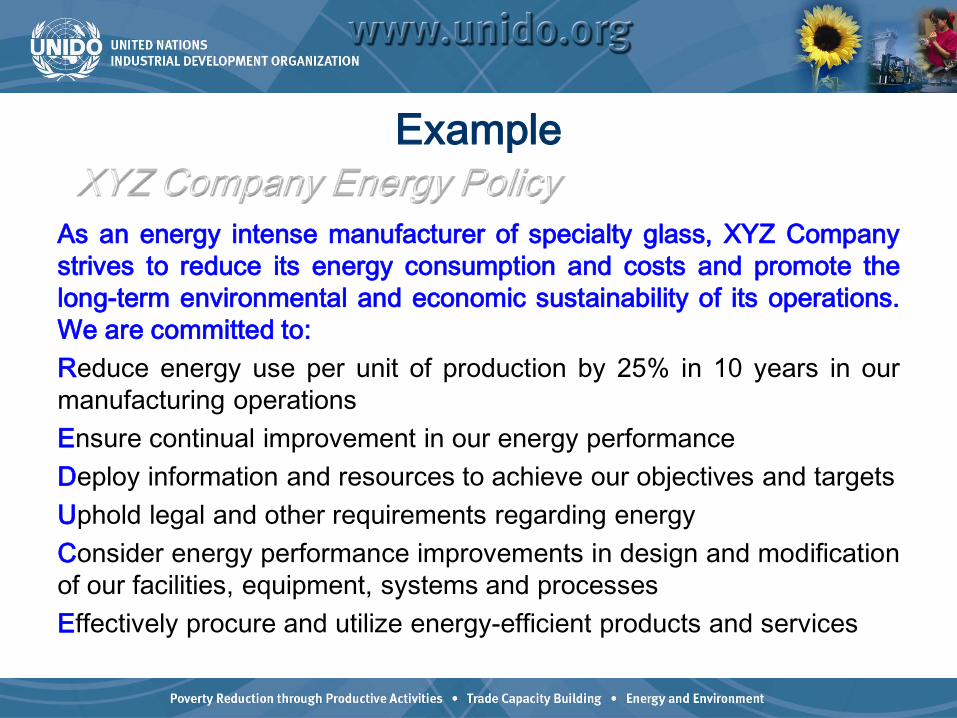
Example
As an energy intense manufacturer of specialty glass, XYZ Companystrives to reduce its energy consumption and costs and promote thelong-term environmental and economic sustainability of its operations.We are committed to:Reduce energy use per unit of production by 25% in 10 years in ourmanufacturing operationsEnsure continual improvement in our energy performanceDeploy information and resources to achieve our objectives and targetsUphold legal and other requirements regarding energyConsider energy performance improvements in design and modificationof our facilities, equipment, systems and processesEffectively procure and utilize energy-efficient products and services
Communicating the Policy•Integral part of a management system awareness andcommunication program—First piece of the EnMS that thewhole organization is exposed to
•Post the policy throughout your facilities/work sites,incorporate in trainings, place on intranet, etc.
•Be creative in communication: backs of ID tags, on hardhats, in annual report, websites, paycheck stuffers, etc.
•Plan for how the policy will be communicated to part-timeand temporary employees and to contractors and suppliersworking on your site.

Typical Barriers
Too lengthy or complicated
Too many levels of management approval
Resistance to integrating the energy policy with other management system policies
Value to the Organization
• Visible statement of top
management commitment
• Sets strategic direction
• Establishes energy as a
priority
• Communicates energy
performance commitments
• Supports sustainability
Exercise
• Review/Update your energy policy• Ensure you include the items discussed here
where applicable• Are you missing anything?• Does each element help to improve energy
performance?• How long will it take to get approved?

See you in 15 minutes!

TopicDuration (mins)
Exercise (mins)
Break duration
Start Time
End Time
DAY 1Registration 15 08:30 08:45Welcome and opening remarks 10 08:45 08:55Demonstrate Basecamp and set up contact information 15 08:55 09:10
Setting the Stage and Expert Training approach 20 09:10 09:30Break 15 09:30 09:45Exercise - Team Building - NSEW 10 70 09:45 11:05Management Commitment 20 11:05 11:25Scope and Boundaries 10 15 11:25 11:50Lunch 45 11:50 12:35Exercise - Barriers - Force Field Analysis 5 40 12:35 13:20Energy Policy 10 20 13:20 13:50Break 15 13:50 14:05Roles, Responsibilities and Authority 25 55 14:05 15:25Energy Management Planning Process 20 15:25 15:45Legal and other requirements 15 30 15:45 16:30TOTALS 2.42 3.33 1.50
63
Roles, Responsibilities and Authorities
• Developed and communicatedby the managementrepresentative with topmanagement support.
• Everyone has a role in andresponsibilities for energymanagement.
• Communication and training arekey to employee understanding.
• Elevate energy as a business priority
• Create a positive culture• Set the direction• Lead by example• Stay visible and involved• Evaluate and communicate
progress
Top Management

• Encourage employee collaboration• Set and achieve milestones and
deliverables for tasks• Be proactive!• Leverage what’s already in place• Communicate effectively • Focus continual improvement efforts
Management Representative
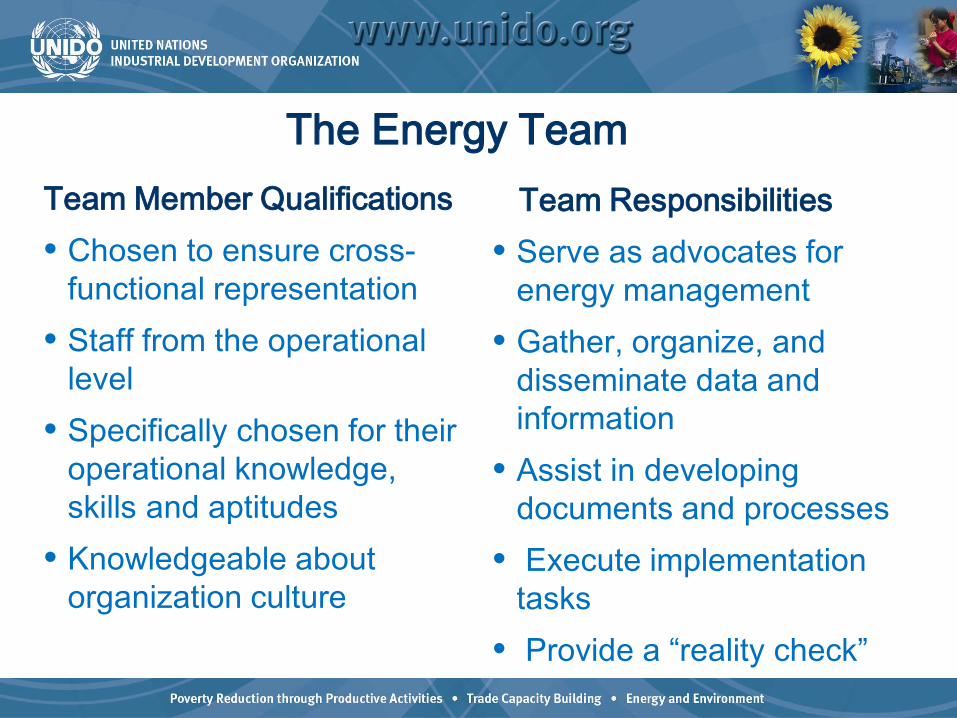
The Energy TeamTeam Member Qualifications• Chosen to ensure cross-
functional representation• Staff from the operational
level• Specifically chosen for their
operational knowledge,skills and aptitudes
• Knowledgeable aboutorganization culture
Team Responsibilities• Serve as advocates for
energy management• Gather, organize, and
disseminate data andinformation
• Assist in developingdocuments and processes
• Execute implementationtasks
• Provide a “reality check”

What are the most critical issues and where are they in the organization?Who has responsibility for energy issues?Which managers are most directly concerned with and/or potentially affected by energy issues?
Who can issue policies and/or allocate resources?Who can give credence to your program?Who do employees trust?Who has strong operational knowledge and experience?Who outside the fence line should be involved in EnMSdecisions?
Forming the Energy Team
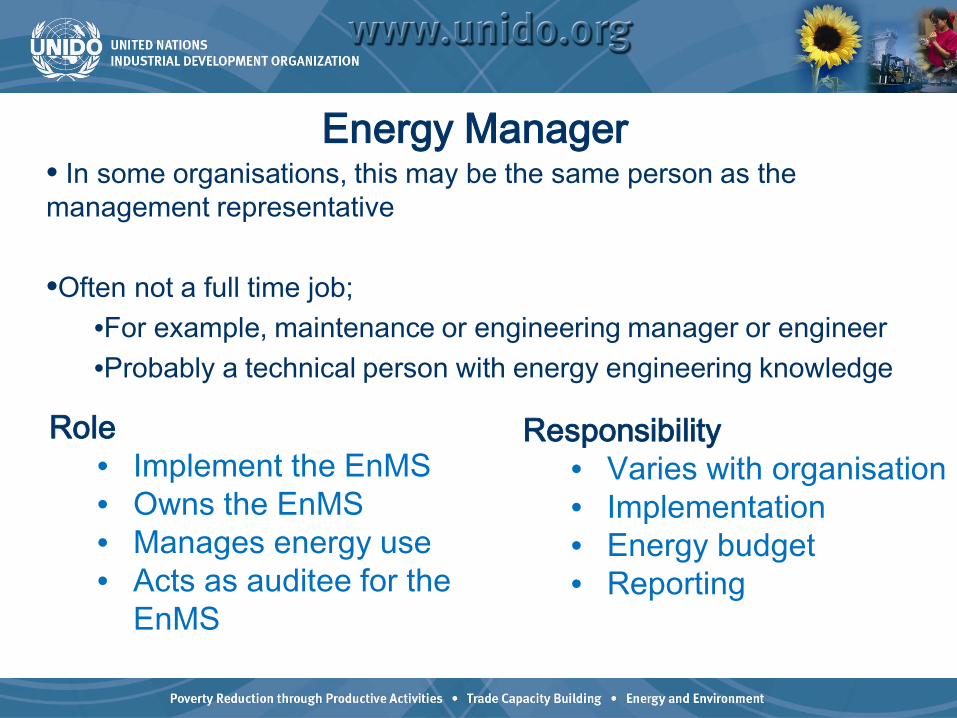
Energy Manager• In some organisations, this may be the same person as themanagement representative
•Often not a full time job;•For example, maintenance or engineering manager or engineer•Probably a technical person with energy engineering knowledge
Role• Implement the EnMS• Owns the EnMS• Manages energy use• Acts as auditee for the
EnMS
Responsibility• Varies with organisation• Implementation• Energy budget• Reporting
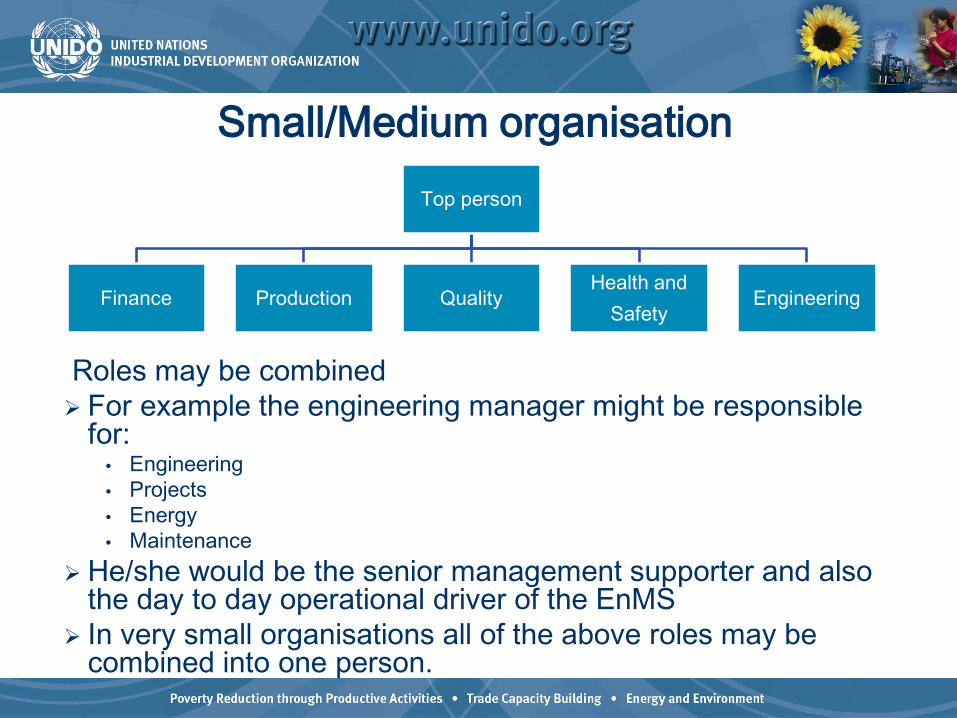
Small/Medium organisationTop person
Finance Production QualityHealth and
SafetyEngineering
Roles may be combined For example the engineering manager might be responsible
for:• Engineering• Projects• Energy• Maintenance
He/she would be the senior management supporter and alsothe day to day operational driver of the EnMS
In very small organisations all of the above roles may becombined into one person.
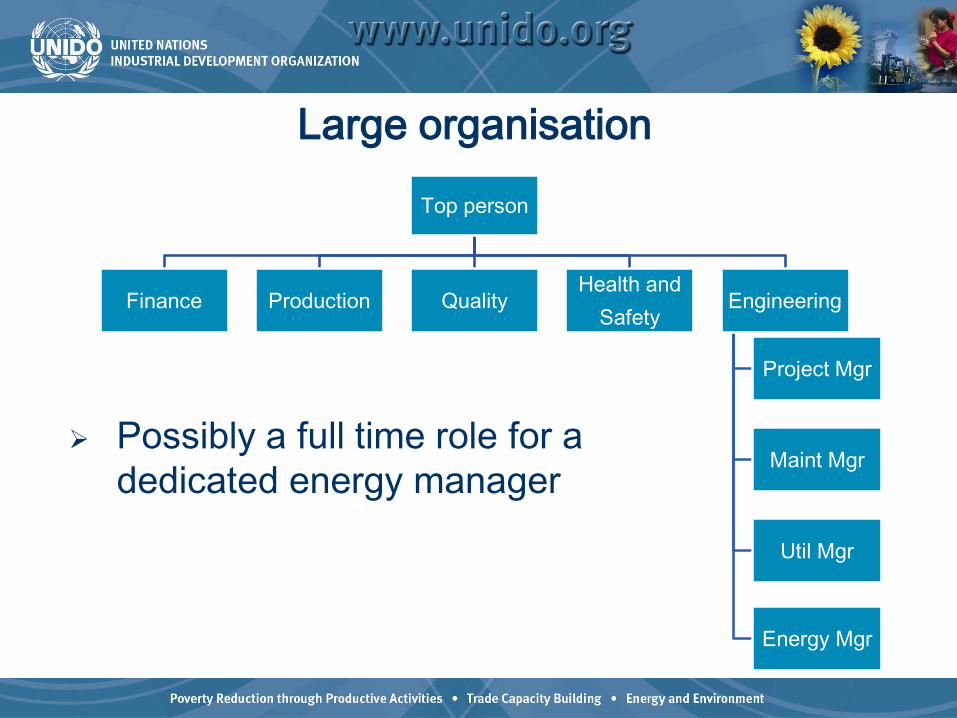
Top person
Finance Production QualityHealth and
SafetyEngineering
Project Mgr
Maint Mgr
Util Mgr
Energy Mgr
Large organisation
Possibly a full time role for a dedicated energy manager
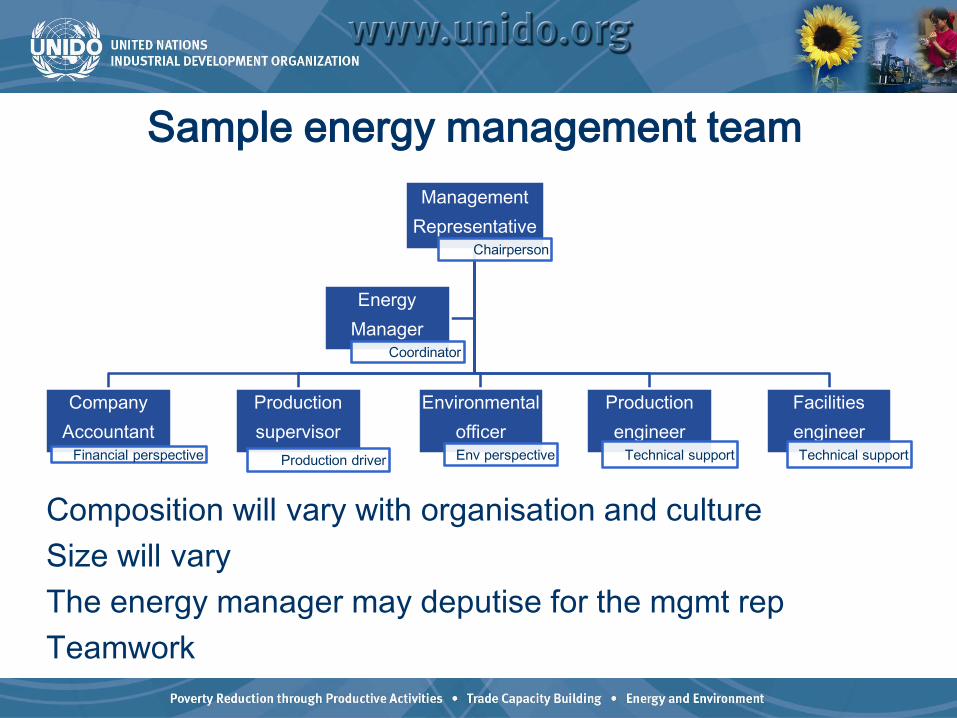
Management Representative
Chairperson
Company Accountant
Financial perspective
Production supervisor
Production driver
Environmental officerEnv perspective
Production engineer
Technical support
Facilities engineerTechnical support
Energy Manager
Coordinator
Sample energy management team
Composition will vary with organisation and cultureSize will varyThe energy manager may deputise for the mgmt repTeamwork
Establishes expectationsEnsures the most appropriate individuals are
performing tasksDecreases work duplication Improves efficiency of organization and teamsDecreases employee frustration
Value to the Organization—Defined Roles, Responsibilities and Authorities
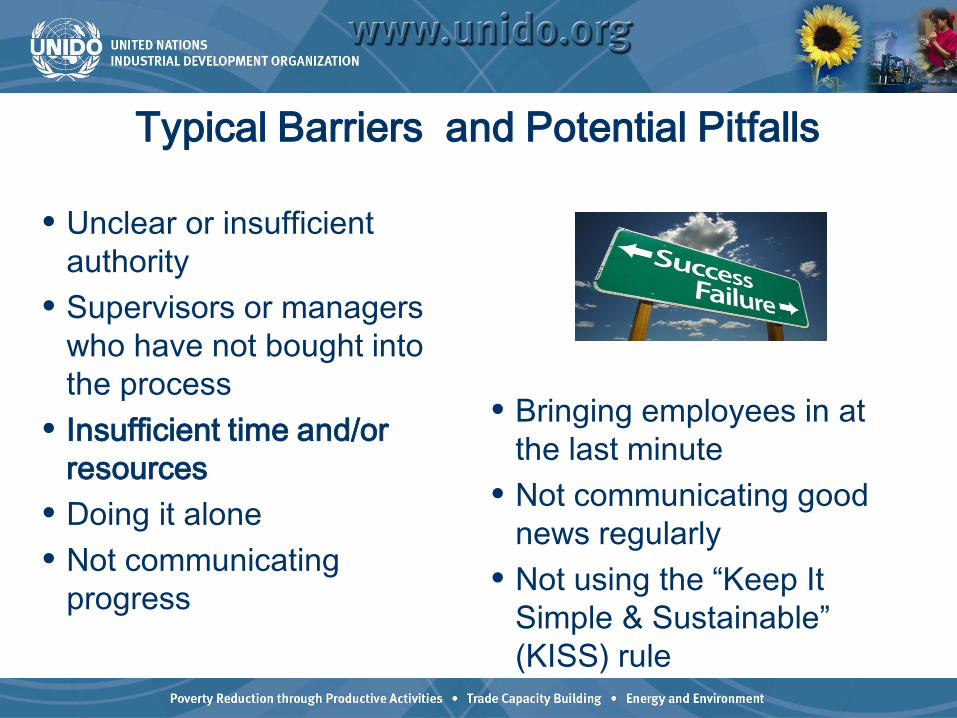
• Unclear or insufficient authority
• Supervisors or managers who have not bought into the process
• Insufficient time and/or resources
• Doing it alone • Not communicating
progress
• Bringing employees in at the last minute
• Not communicating good news regularly
• Not using the “Keep It Simple & Sustainable” (KISS) rule
Typical Barriers and Potential Pitfalls
• Take the time to develop a team dynamic• Provide training to the core and implementation
teams• Be willing to change team make-up based on
activities in each phase of implementation• Hold team members accountable for their roles and
responsibilities• Facilitate the implementation at the core team level• Delegate activities to the implementation team and
employee levels• Document and communicate the energy
management system value to the organization
Tips for Success
ExerciseIn your teams
Use the roles and responsibilities tab
Update for your organization
It will need to be communicated, adjusted and
accepted.
This is critically important
It will need to be regularly updated and maintained
TopicDuration (mins)
Exercise (mins)
Break duration
Start Time
End Time
DAY 1Registration 15 08:30 08:45Welcome and opening remarks 10 08:45 08:55Demonstrate Basecamp and set up contact information 15 08:55 09:10
Setting the Stage and Expert Training approach 20 09:10 09:30Break 15 09:30 09:45Exercise - Team Building - NSEW 10 70 09:45 11:05Management Commitment 20 11:05 11:25Scope and Boundaries 10 15 11:25 11:50Lunch 45 11:50 12:35Exercise - Barriers - Force Field Analysis 5 40 12:35 13:20Energy Policy 10 20 13:20 13:50Break 15 13:50 14:05Roles, Responsibilities and Authority 25 55 14:05 15:25Energy Management Planning Process 20 15:25 15:45Legal and other requirements 15 30 15:45 16:30TOTALS 2.42 3.33 1.50
77
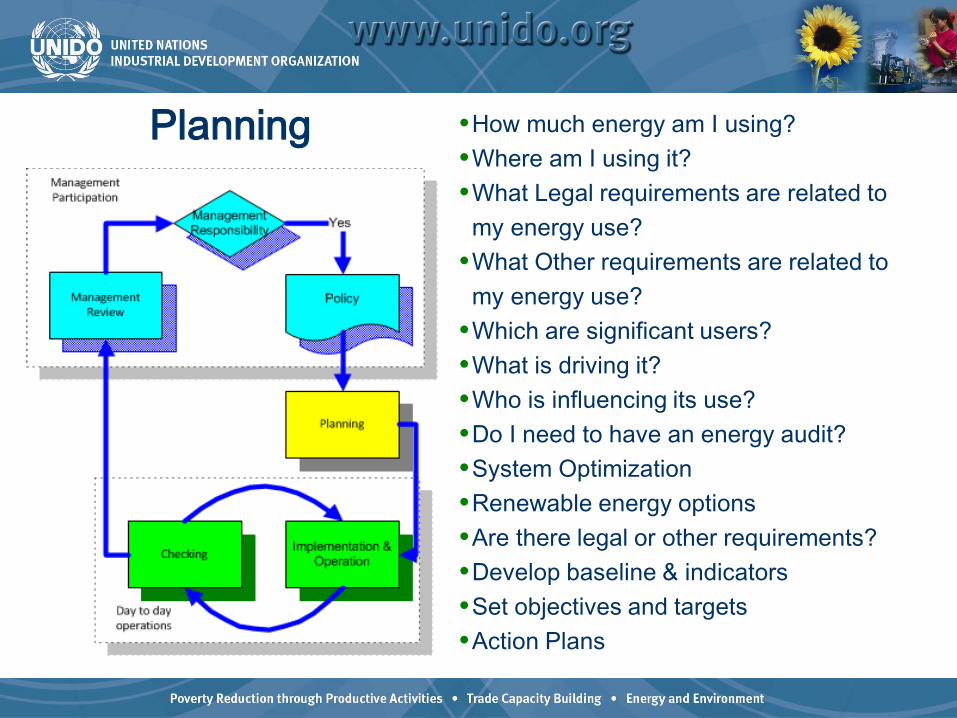
Planning •How much energy am I using?•Where am I using it?•What Legal requirements are related tomy energy use?
•What Other requirements are related tomy energy use?
•Which are significant users?•What is driving it?•Who is influencing its use?•Do I need to have an energy audit?•System Optimization•Renewable energy options•Are there legal or other requirements?•Develop baseline & indicators•Set objectives and targets•Action Plans
Introduction
Detailed look at the planning part of anEnMS
This is the set up of the main part of yoursystem
Remember the purpose is to improveenergy performance, i.e. to save energy
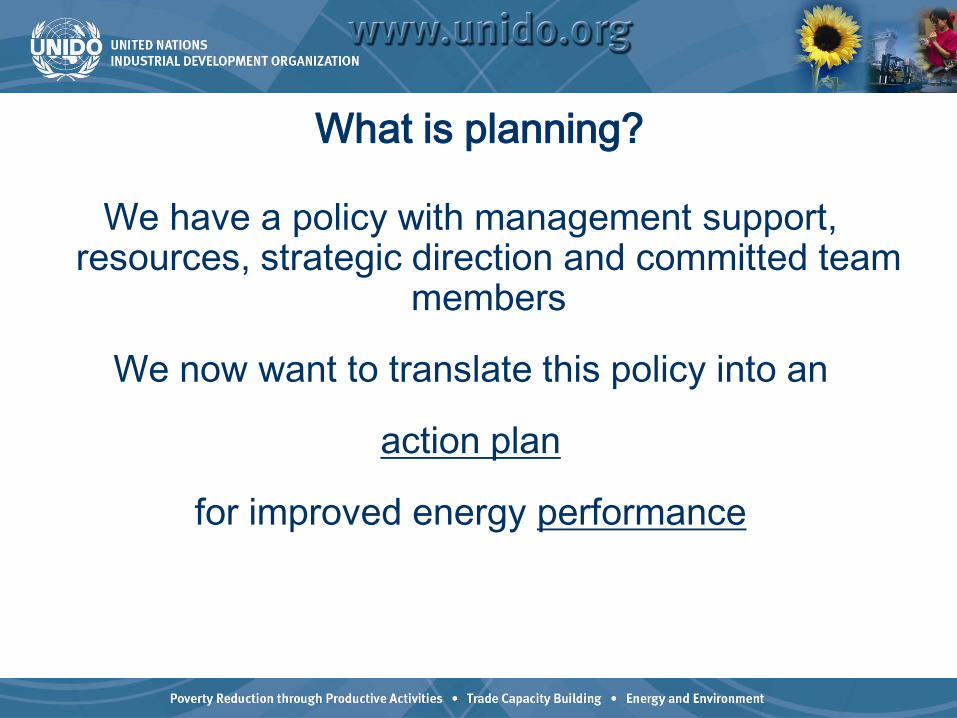
What is planning?
We have a policy with management support, resources, strategic direction and committed team
members
We now want to translate this policy into an
action plan
for improved energy performance
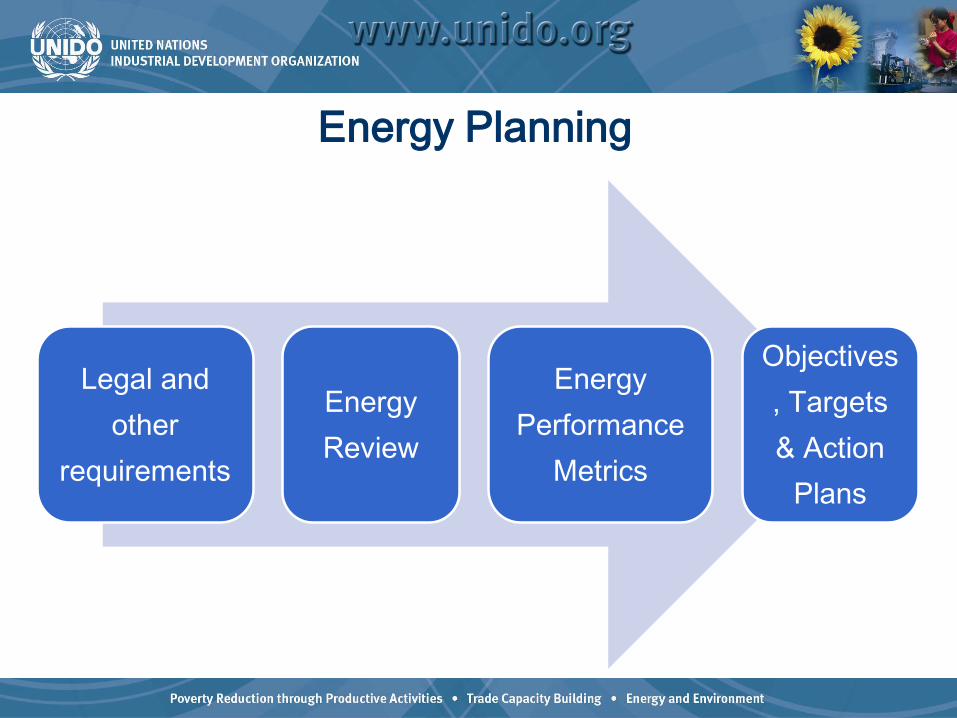
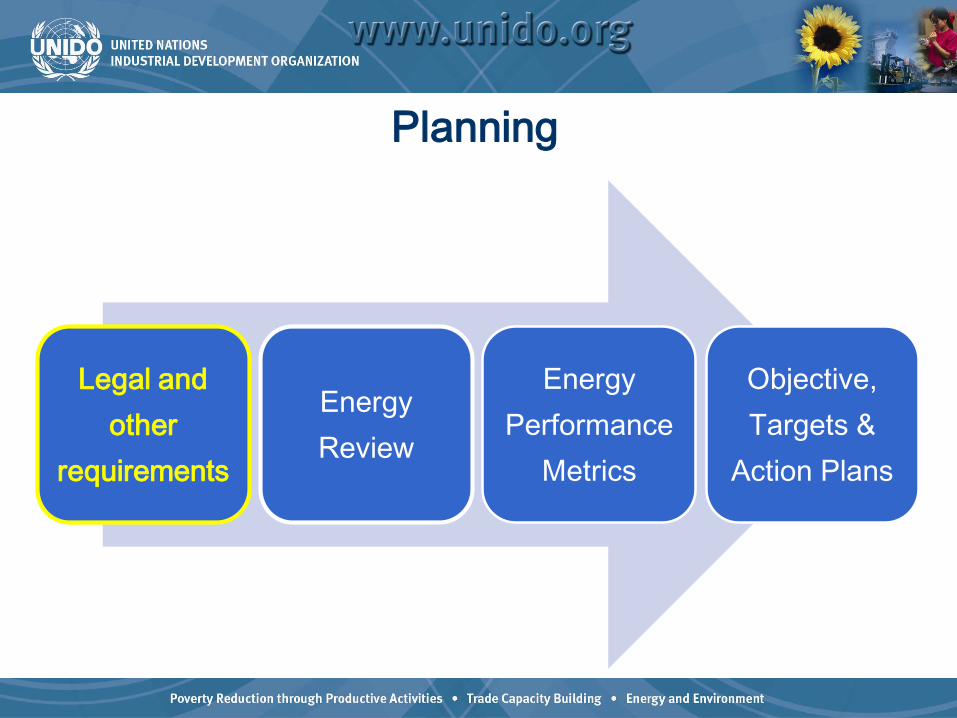
Energy Planning
Legal and other
requirements
Energy Review
Energy Performance
Metrics
Objectives, Targets & Action
Plans
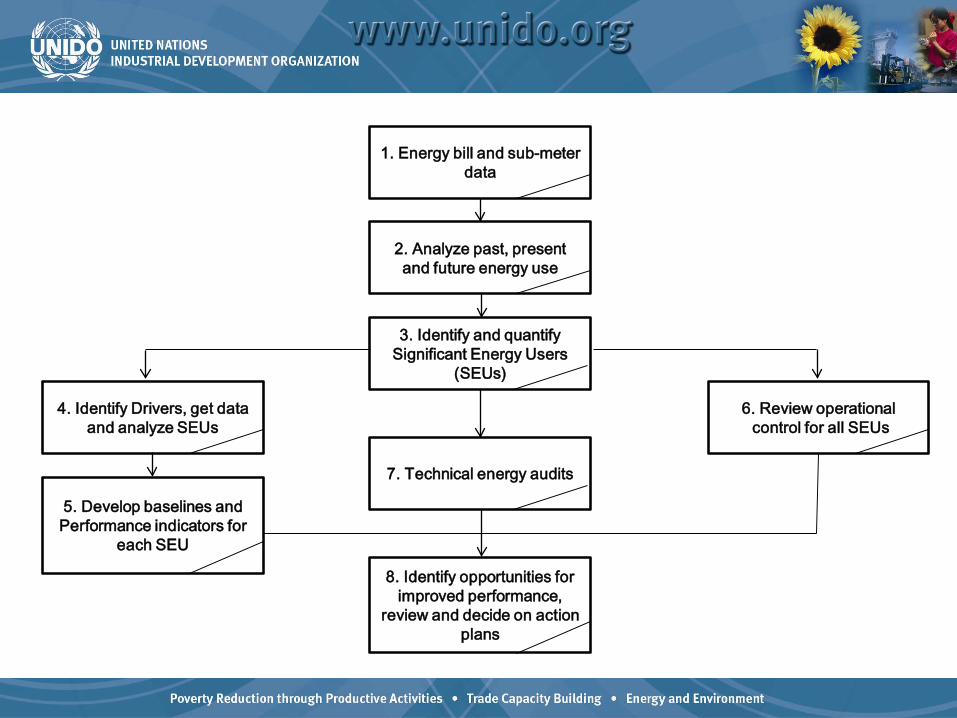
1. Energy bill and sub-meter data
2. Analyze past, present and future energy use
7. Technical energy audits
8. Identify opportunities forimproved performance,
review and decide on action plans
6. Review operationalcontrol for all SEUs
4. Identify Drivers, get dataand analyze SEUs
3. Identify and quantify Significant Energy Users
(SEUs)
5. Develop baselines andPerformance indicators for
each SEU
TopicDuration (mins)
Exercise (mins)
Break duration
Start Time
End Time
DAY 1Registration 15 08:30 08:45Welcome and opening remarks 10 08:45 08:55Demonstrate Basecamp and set up contact information 15 08:55 09:10
Setting the Stage and Expert Training approach 20 09:10 09:30Break 15 09:30 09:45Exercise - Team Building - NSEW 10 70 09:45 11:05Management Commitment 20 11:05 11:25Scope and Boundaries 10 15 11:25 11:50Lunch 45 11:50 12:35Exercise - Barriers - Force Field Analysis 5 40 12:35 13:20Energy Policy 10 20 13:20 13:50Break 15 13:50 14:05Roles, Responsibilities and Authority 25 55 14:05 15:25Energy Management Planning Process 20 15:25 15:45Legal and other requirements 15 30 15:45 16:30TOTALS 2.42 3.33 1.50
83
Planning
Legal and other
requirements
Energy Review
Energy Performance
Metrics
Objective, Targets &
Action Plans
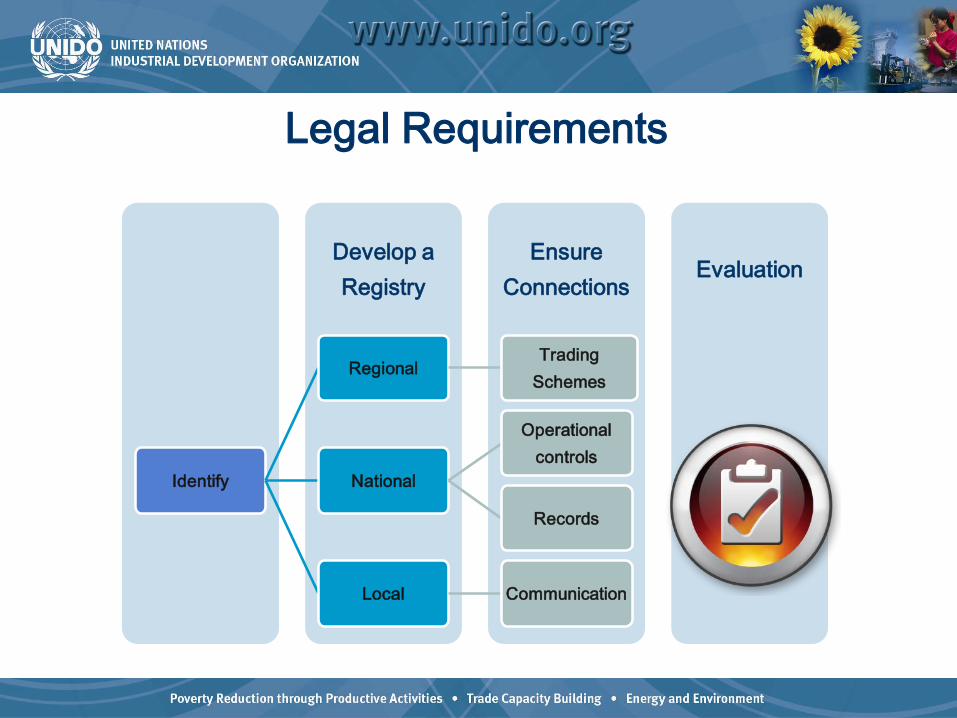
EvaluationEnsure
ConnectionsDevelop a Registry
Identify
RegionalTrading
Schemes
National
Operational controls
Records
Local Communication
Legal Requirements
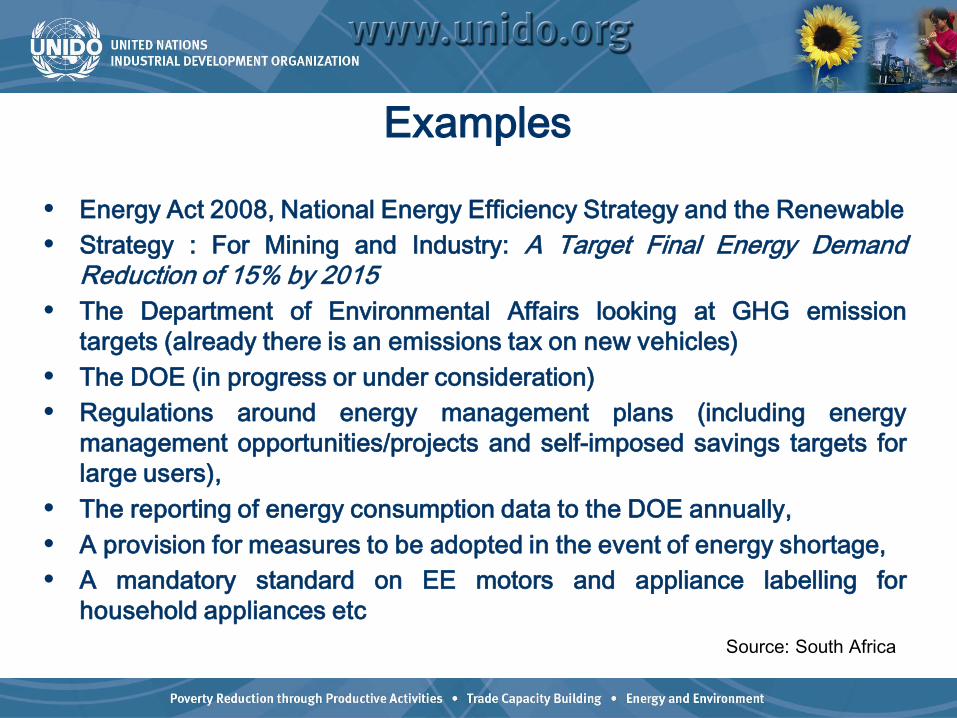
Examples
• Energy Act 2008, National Energy Efficiency Strategy and the Renewable• Strategy : For Mining and Industry: A Target Final Energy Demand
Reduction of 15% by 2015• The Department of Environmental Affairs looking at GHG emission
targets (already there is an emissions tax on new vehicles)• The DOE (in progress or under consideration)• Regulations around energy management plans (including energy
management opportunities/projects and self-imposed savings targets forlarge users),
• The reporting of energy consumption data to the DOE annually,• A provision for measures to be adopted in the event of energy shortage,• A mandatory standard on EE motors and appliance labelling for
household appliances etcSource: South Africa

Are there particular examples from your own country?
Are there online legal services available?

Other requirements
Determine what needs to be done to meet the other requirement
Develop a list of Other requirements
Identify the Other requirements Tax incentives Corporate energy policy Voluntary Agreements

When Things Change
Remember - when activities, equipment, orprocesses change, legal and otherrequirements need to be checked!
Recognize relationship between regulatedactivity process owners and requirements.
When management changes review prioritiesand organizational commitments.

Typical Barriers
Knowledge of the process
Knowledge of the regulations
Knowledge of the organizational commitments
Requirements not currently implemented
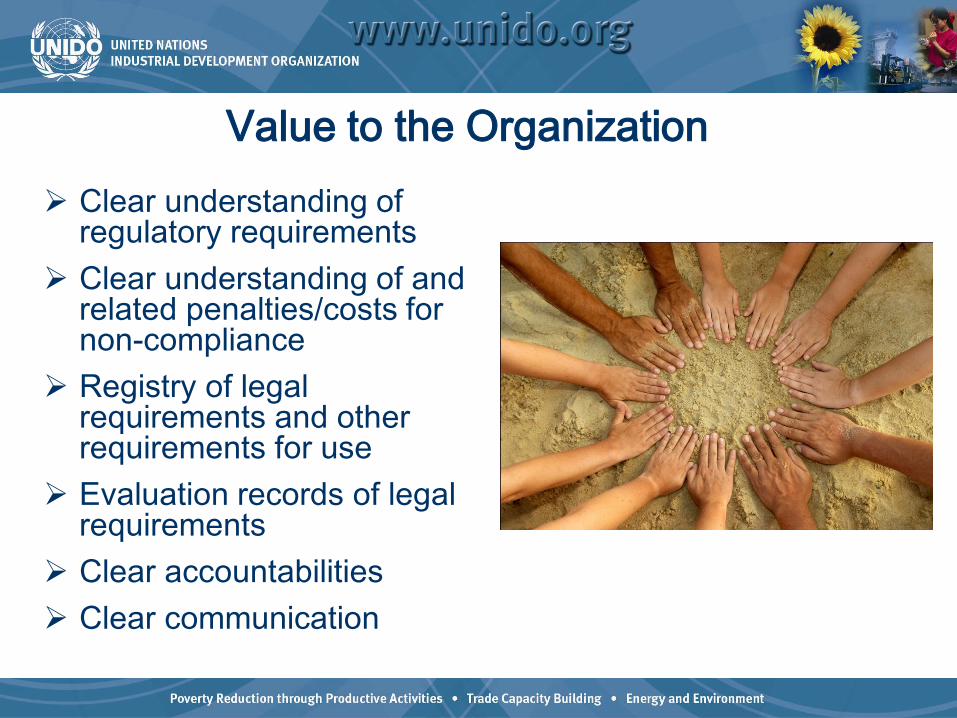
Value to the Organization Clear understanding of
regulatory requirements Clear understanding of and
related penalties/costs for non-compliance
Registry of legal requirements and other requirements for use
Evaluation records of legal requirements
Clear accountabilities Clear communication
Exercise – work on your legal and other requirements list

PRACTISE QUESTIONS!
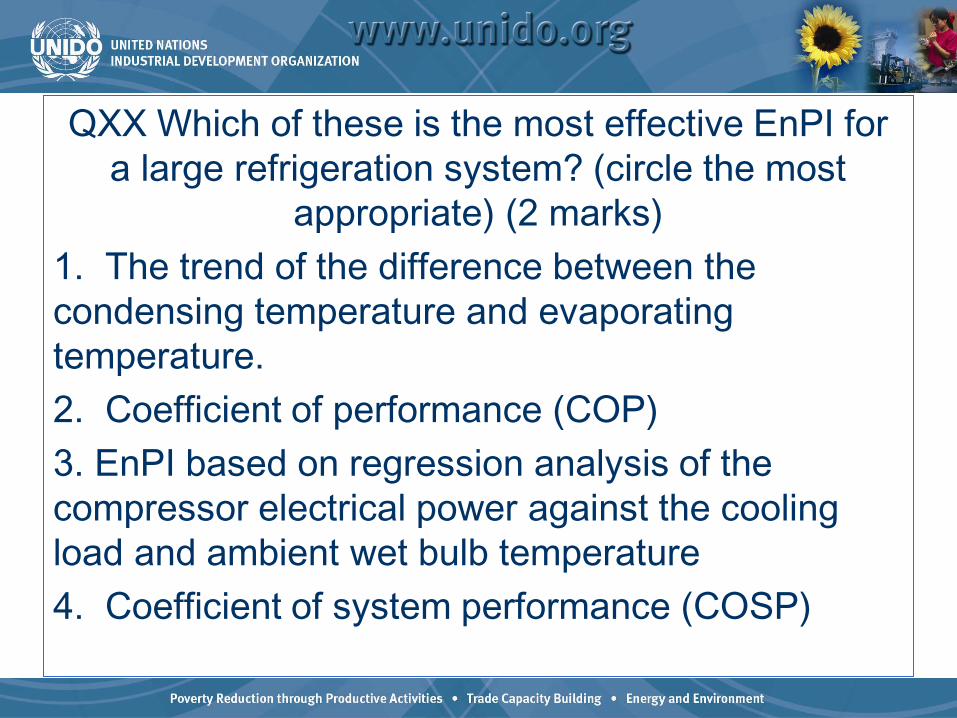
QXX Which of these is the most effective EnPI for a large refrigeration system? (circle the most
appropriate) (2 marks)1. The trend of the difference between the condensing temperature and evaporating temperature.2. Coefficient of performance (COP)3. EnPI based on regression analysis of the compressor electrical power against the cooling load and ambient wet bulb temperature4. Coefficient of system performance (COSP)

QXX Reducing the demand for steam on a steam system (without affecting production output) where boiler efficiency is used as an EnPI will improve the
energy performance of the steam system. (circle correct answer) (1 mark)
1. True2. False
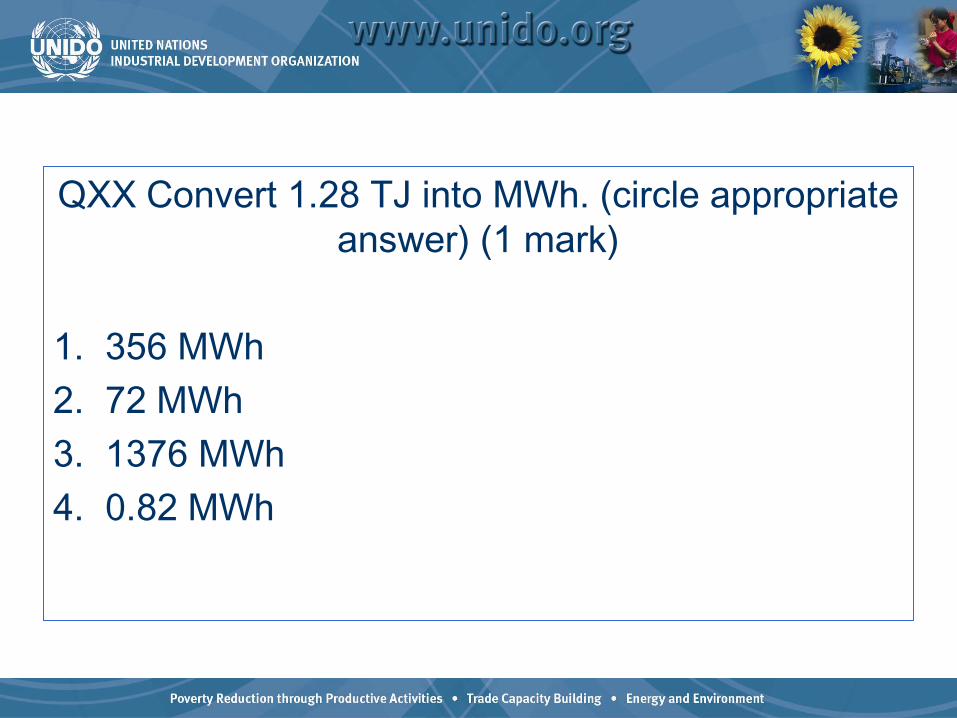
QXX Convert 1.28 TJ into MWh. (circle appropriate answer) (1 mark)
1. 356 MWh2. 72 MWh3. 1376 MWh4. 0.82 MWh

QXX An energy saving investment costs $1,000 and will save $300 per year but increase
maintenance costs by $10 per month, what is its IRR? (circle appropriate answer) (3 marks)
1. 5%2. 13%3. 3%4. 29%
UNIDO EnMS Expert Training
Module 1
Day 2
1
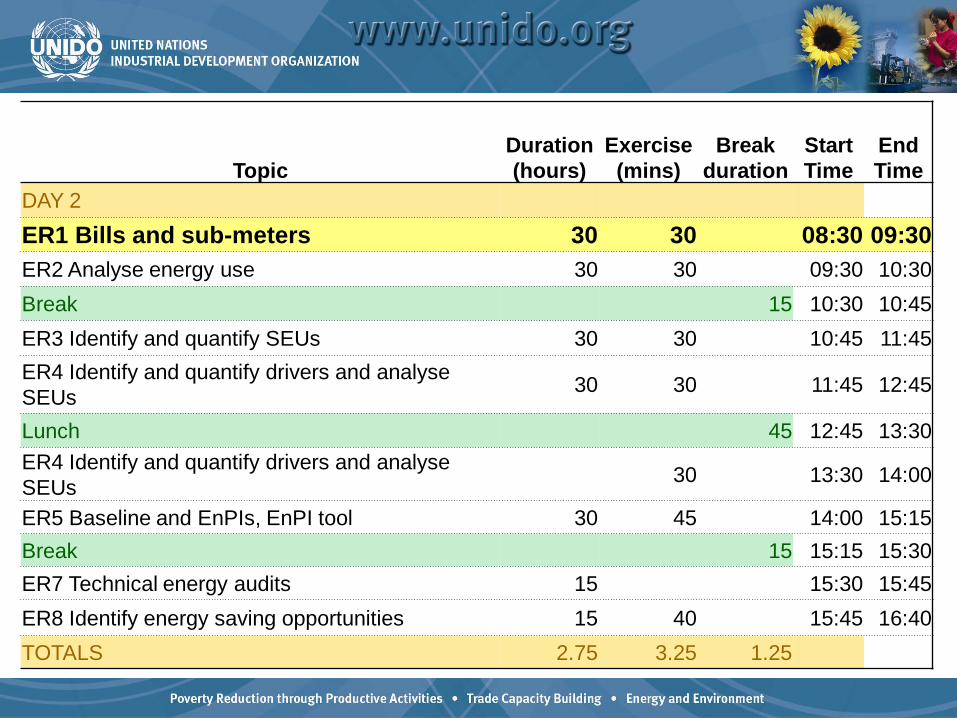
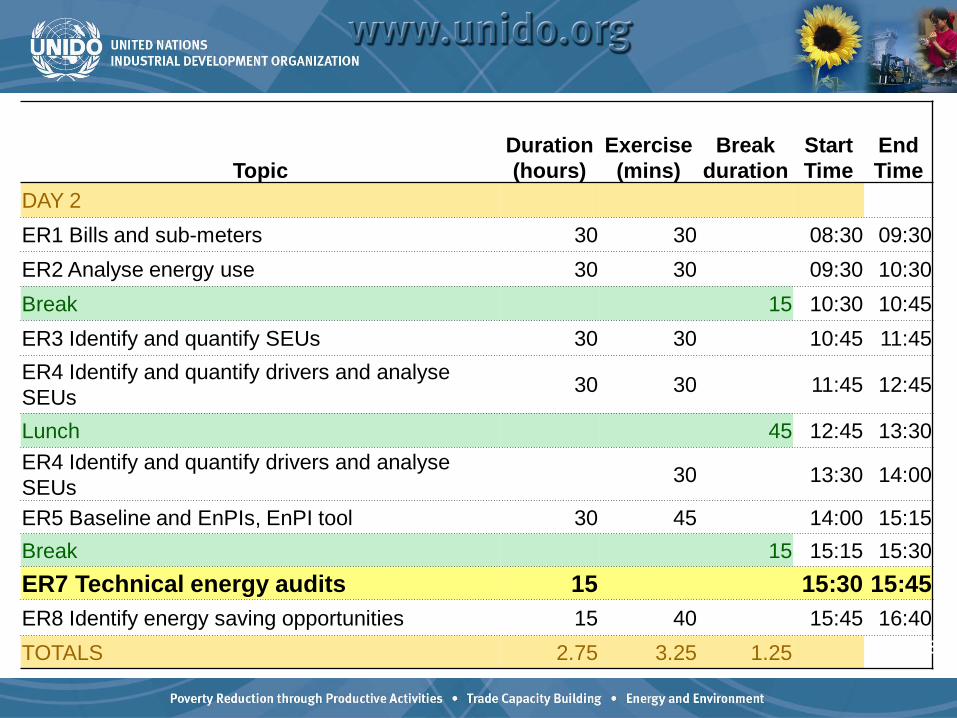
TopicDuration (hours)
Exercise (mins)
Break duration
Start Time
End Time
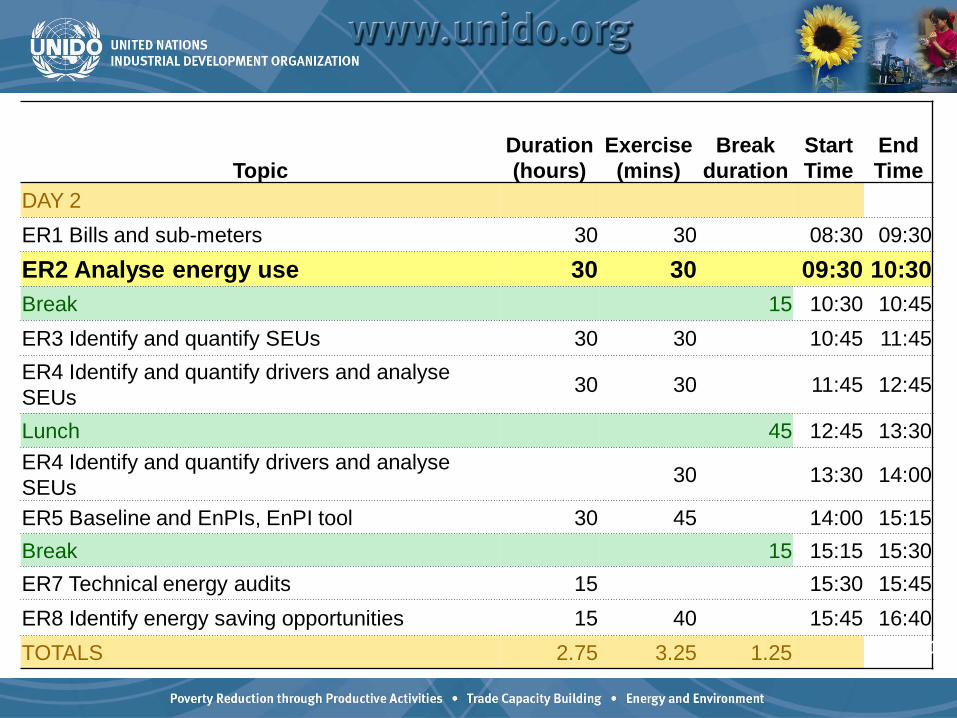
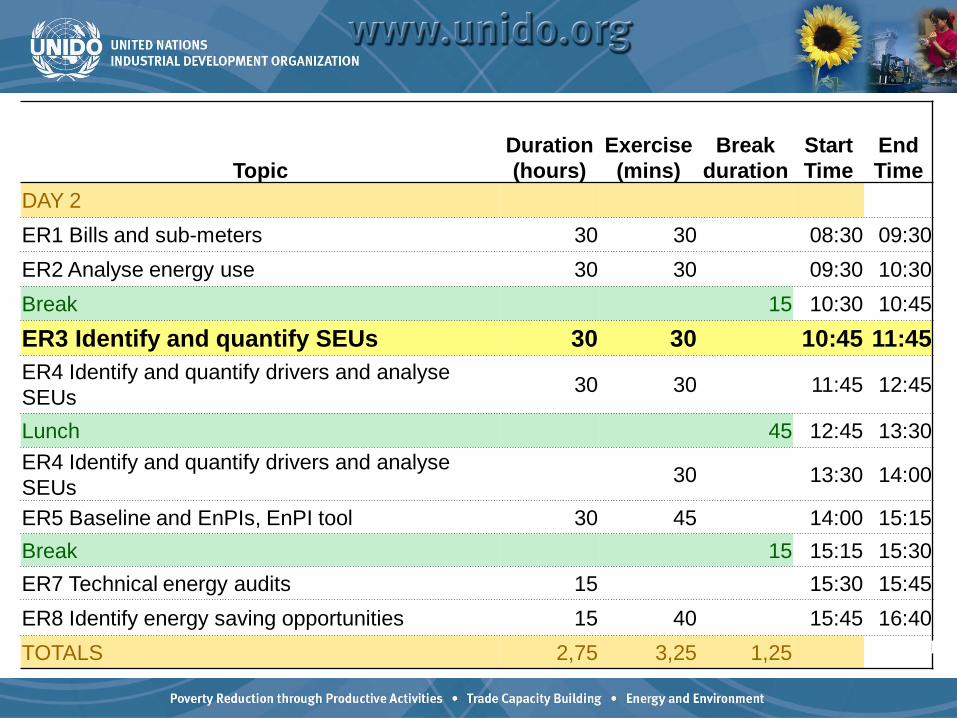
DAY 2ER1 Bills and sub-meters 30 30 08:30 09:30ER2 Analyse energy use 30 30 09:30 10:30Break 15 10:30 10:45ER3 Identify and quantify SEUs 30 30 10:45 11:45ER4 Identify and quantify drivers and analyse SEUs 30 30 11:45 12:45
Lunch 45 12:45 13:30ER4 Identify and quantify drivers and analyse SEUs 30 13:30 14:00
ER5 Baseline and EnPIs, EnPI tool 30 45 14:00 15:15Break 15 15:15 15:30ER7 Technical energy audits 15 15:30 15:45ER8 Identify energy saving opportunities 15 40 15:45 16:40TOTALS 2.75 3.25 1.25 2
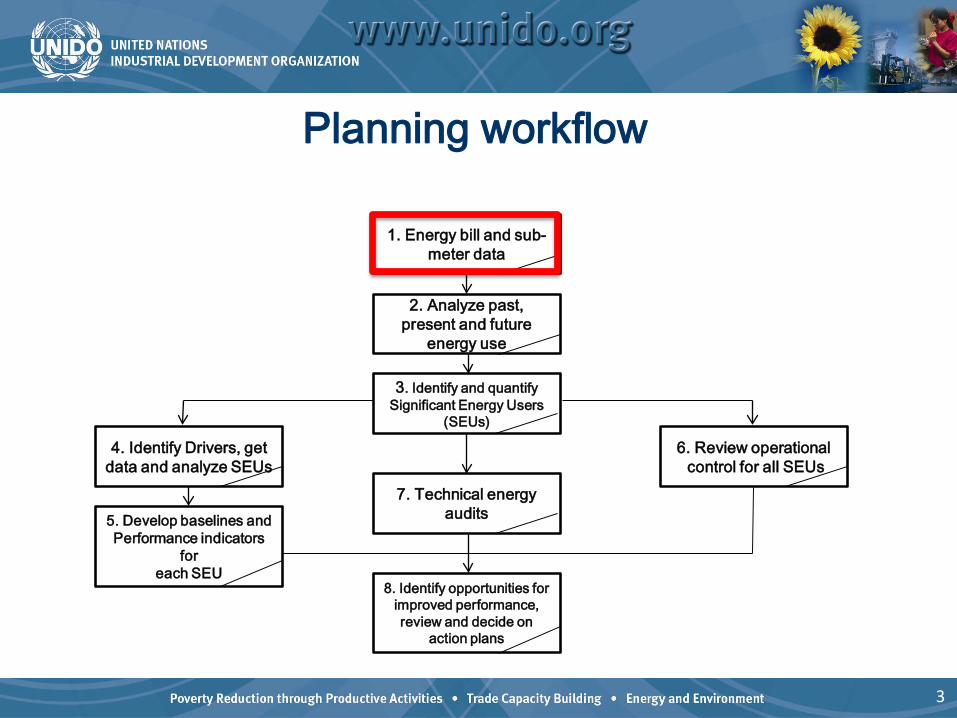
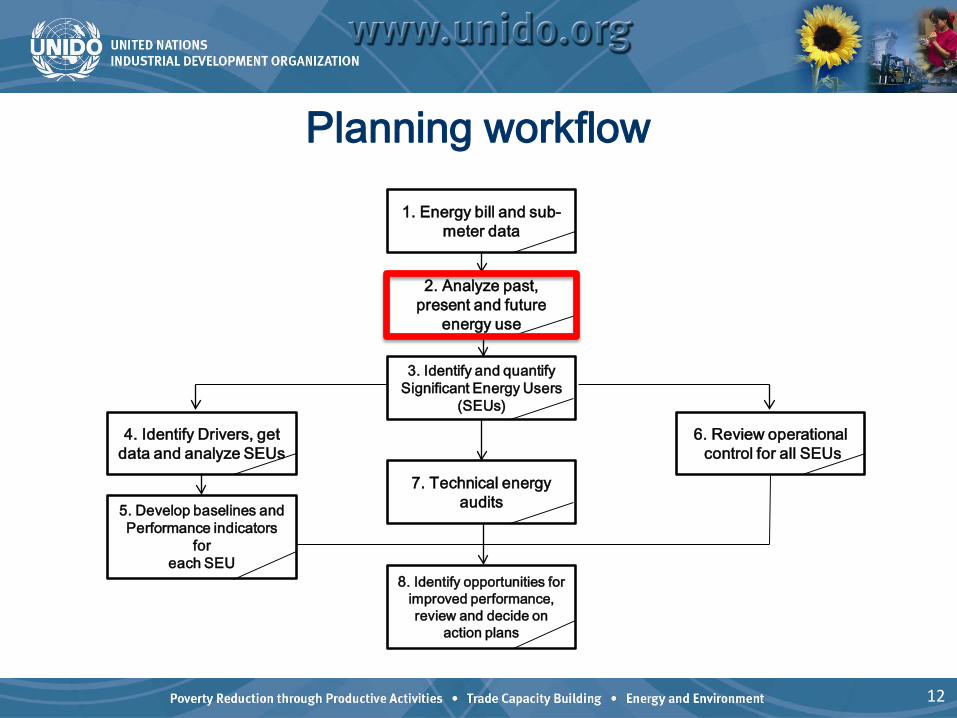
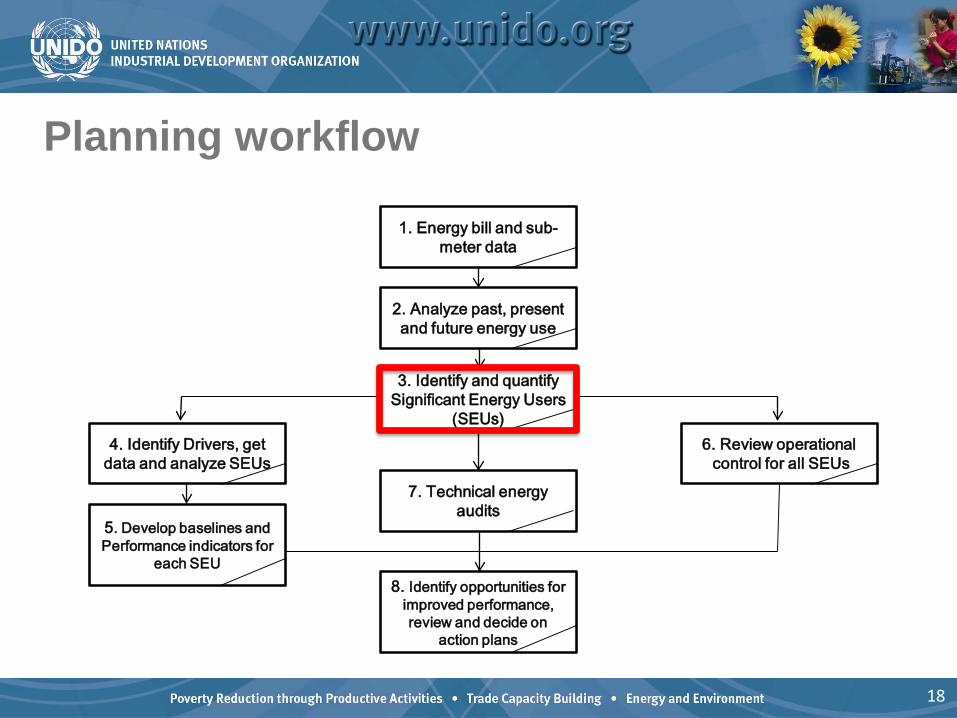
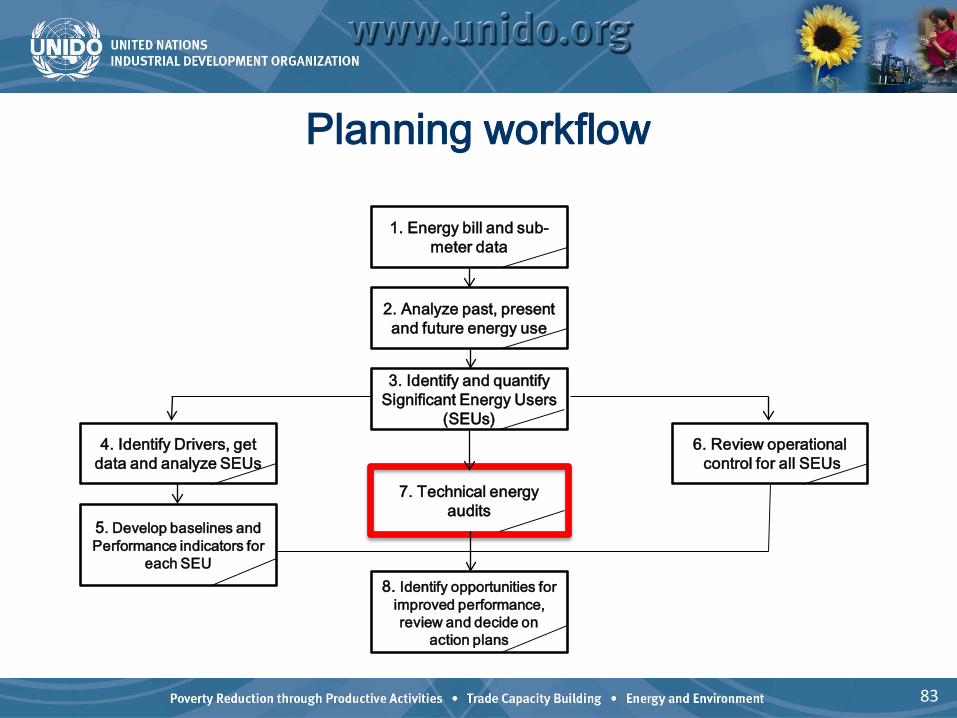
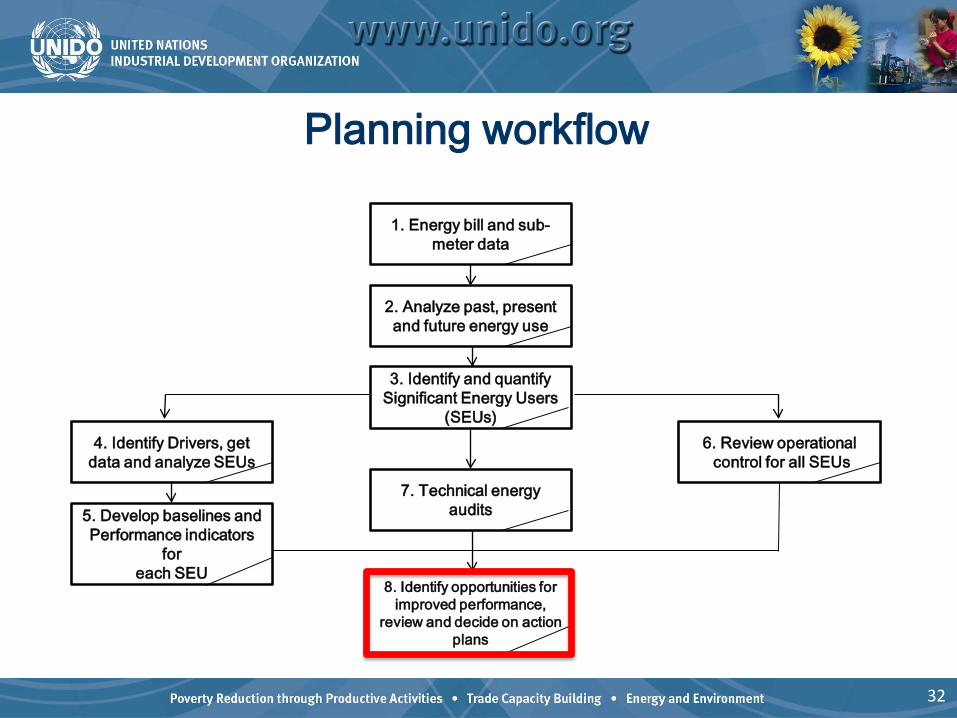
Planning workflow
1. Energy bill and sub-meter data
2. Analyze past, present and future
energy use
7. Technical energy audits
8. Identify opportunities forimproved performance, review and decide on
action plans
6. Review operationalcontrol for all SEUs
4. Identify Drivers, get data and analyze SEUs
3. Identify and quantify Significant Energy Users
(SEUs)
5. Develop baselines andPerformance indicators
foreach SEU
3
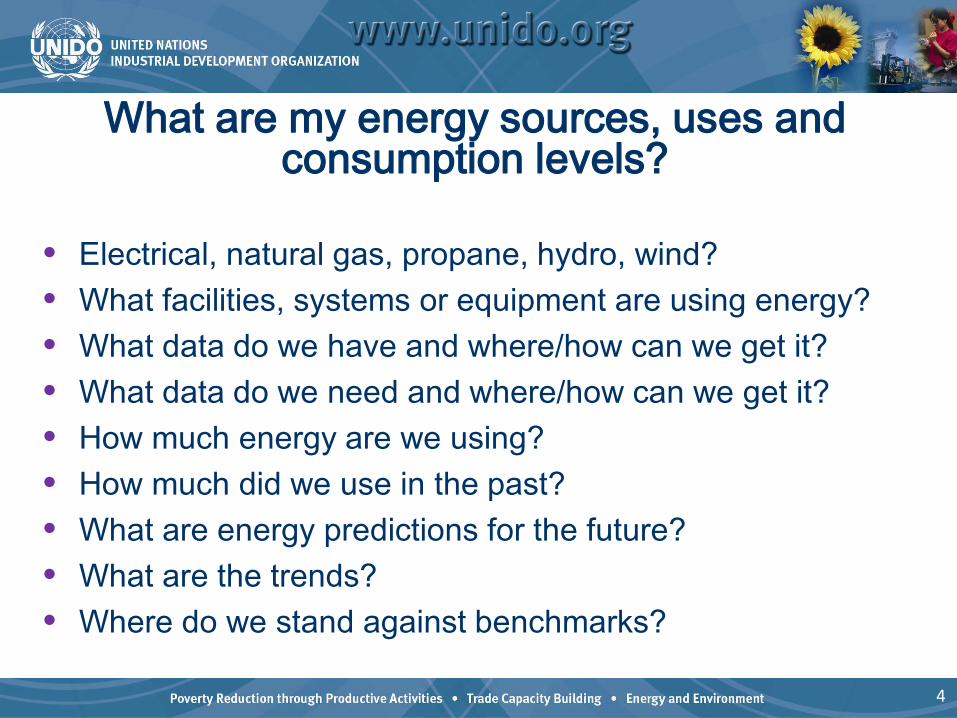
What are my energy sources, uses and consumption levels?
• Electrical, natural gas, propane, hydro, wind?• What facilities, systems or equipment are using energy?• What data do we have and where/how can we get it?• What data do we need and where/how can we get it?• How much energy are we using?• How much did we use in the past?• What are energy predictions for the future?• What are the trends?• Where do we stand against benchmarks?
4
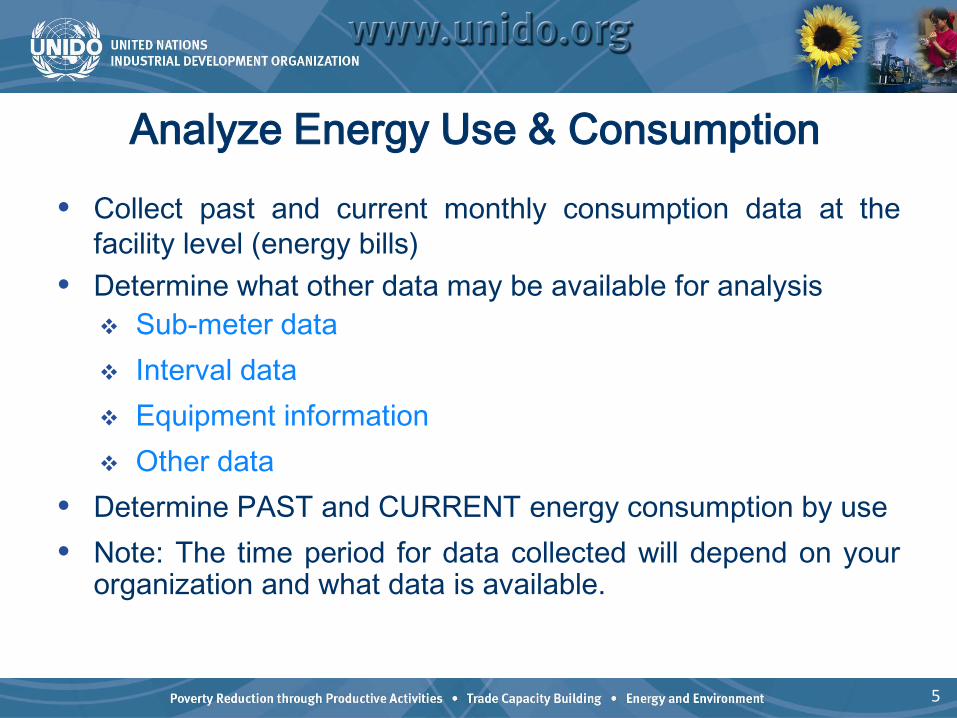
• Collect past and current monthly consumption data at thefacility level (energy bills)
• Determine what other data may be available for analysis Sub-meter data Interval data Equipment information Other data
• Determine PAST and CURRENT energy consumption by use• Note: The time period for data collected will depend on your
organization and what data is available.
Analyze Energy Use & Consumption
5
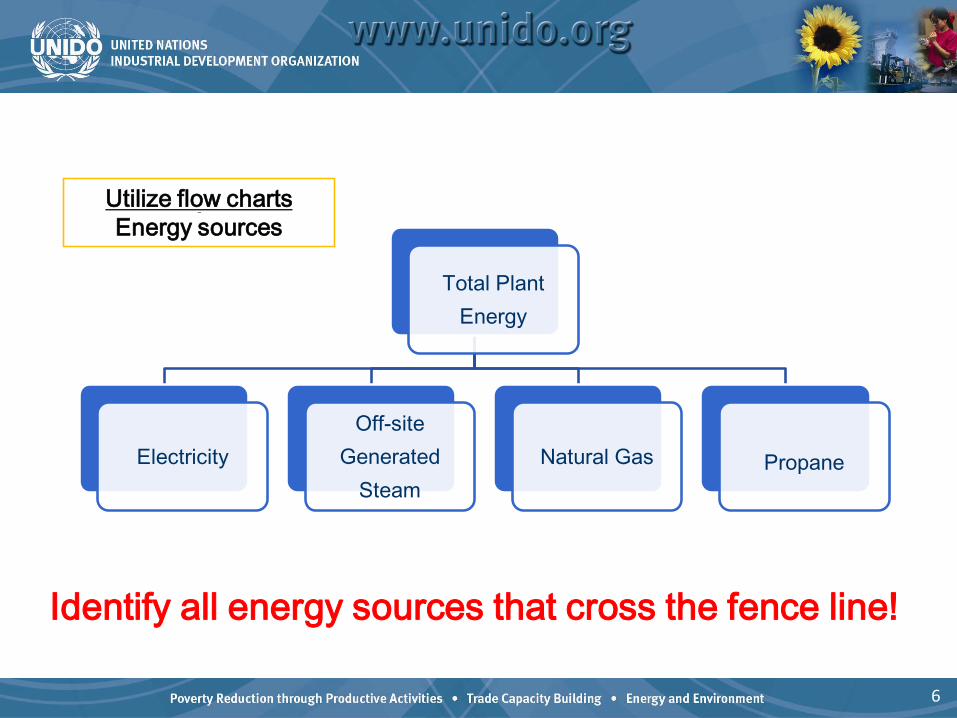
Total Plant Energy
ElectricityOff-site
Generated Steam
Natural Gas Propane
Identify all energy sources that cross the fence line!
Utilize flow chartsEnergy sources
6
6
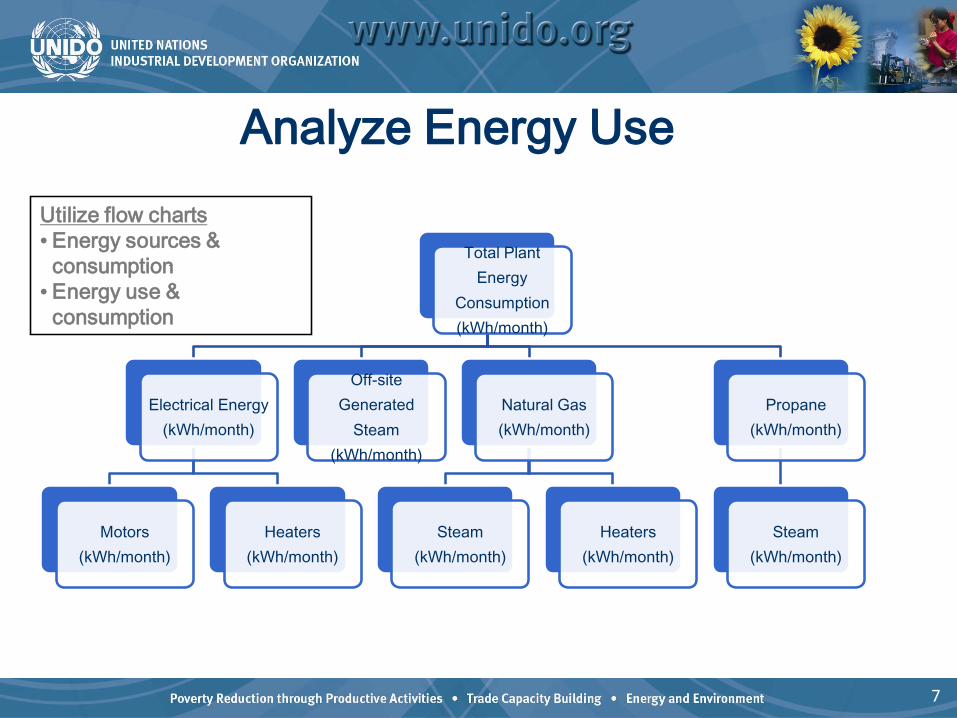
Analyze Energy UseUtilize flow charts• Energy sources &
consumption• Energy use &
consumption
Total Plant Energy
Consumption (kWh/month)
Electrical Energy (kWh/month)
Motors (kWh/month)
Heaters (kWh/month)
Off-site Generated
Steam (kWh/month)
Natural Gas (kWh/month)
Steam (kWh/month)
Heaters (kWh/month)
Propane (kWh/month)
Steam (kWh/month)
7
7

Typical Barriers• Lack of data• Production and energy data on different time frames• Lack of metering• Meters not calibrated• Data not organized for analysis• Notion that energy data not important to equipment operation
8

Identifies most costly uses Identifies trends Highlights problems early Forms basis for comparison Used to evaluate progress
Value to the OrganizationAnalysis of Past and Present Data
9
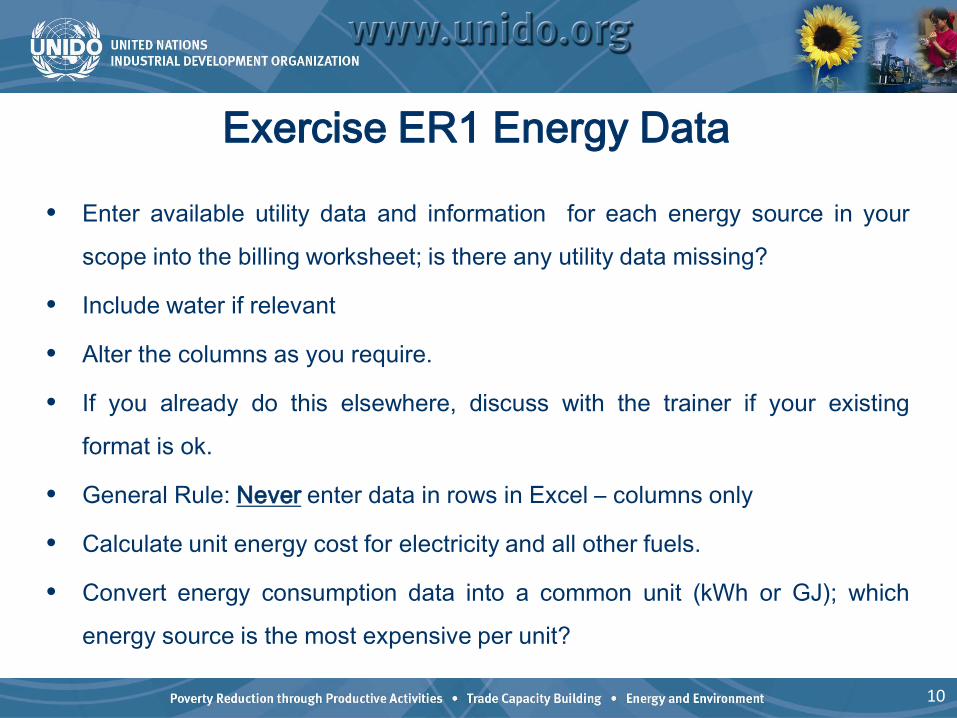
Exercise ER1 Energy Data
• Enter available utility data and information for each energy source in your
scope into the billing worksheet; is there any utility data missing?
• Include water if relevant
• Alter the columns as you require.
• If you already do this elsewhere, discuss with the trainer if your existing
format is ok.
• General Rule: Never enter data in rows in Excel – columns only
• Calculate unit energy cost for electricity and all other fuels.
• Convert energy consumption data into a common unit (kWh or GJ); which
energy source is the most expensive per unit?
10
TopicDuration (hours)
Exercise (mins)
Break duration
Start Time
End Time
DAY 2ER1 Bills and sub-meters 30 30 08:30 09:30ER2 Analyse energy use 30 30 09:30 10:30Break 15 10:30 10:45ER3 Identify and quantify SEUs 30 30 10:45 11:45ER4 Identify and quantify drivers and analyse SEUs 30 30 11:45 12:45
Lunch 45 12:45 13:30ER4 Identify and quantify drivers and analyse SEUs 30 13:30 14:00
ER5 Baseline and EnPIs, EnPI tool 30 45 14:00 15:15Break 15 15:15 15:30ER7 Technical energy audits 15 15:30 15:45ER8 Identify energy saving opportunities 15 40 15:45 16:40TOTALS 2.75 3.25 1.25 11
Planning workflow
1. Energy bill and sub-meter data
2. Analyze past, present and future
energy use
7. Technical energy audits
8. Identify opportunities forimproved performance, review and decide on
action plans
6. Review operationalcontrol for all SEUs
4. Identify Drivers, get data and analyze SEUs
3. Identify and quantify Significant Energy Users
(SEUs)
5. Develop baselines andPerformance indicators
foreach SEU
12
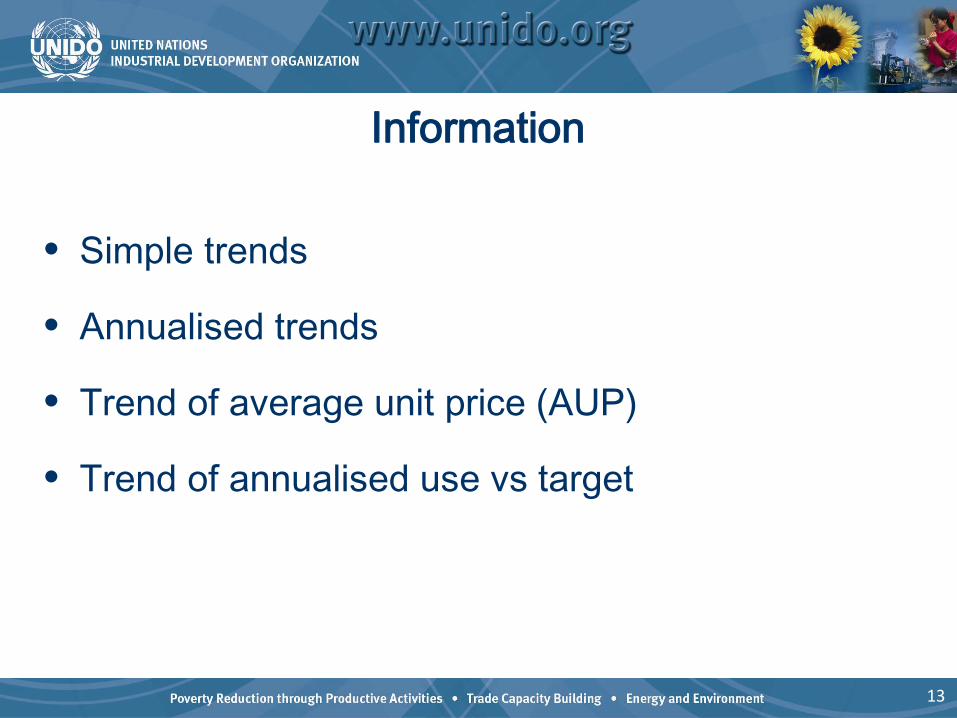
Information
• Simple trends
• Annualised trends
• Trend of average unit price (AUP)
• Trend of annualised use vs target
13
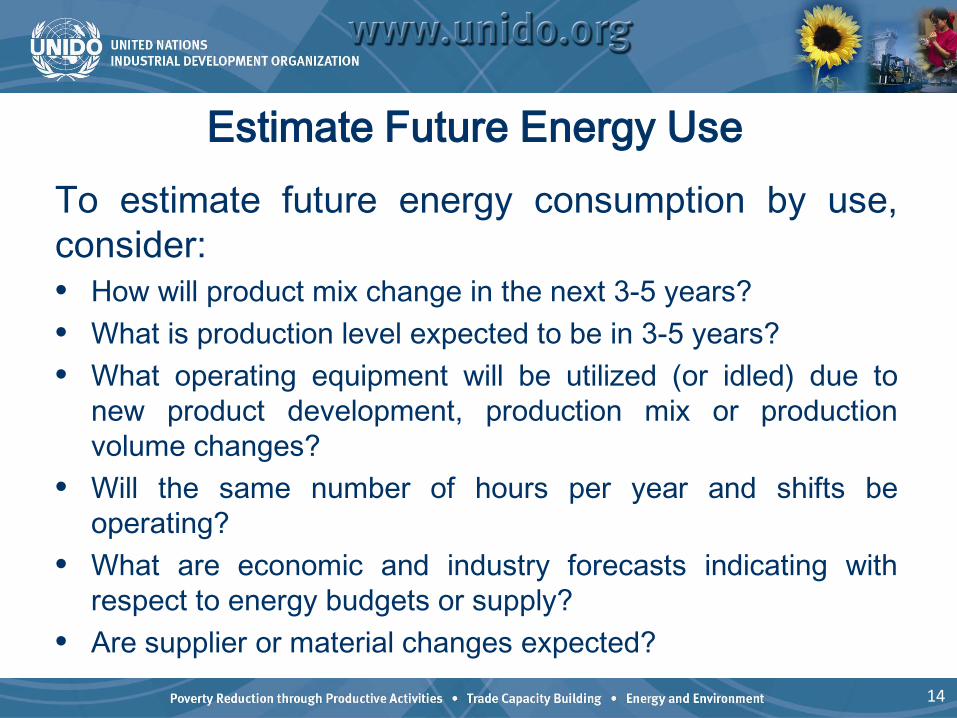
To estimate future energy consumption by use,consider:• How will product mix change in the next 3-5 years?• What is production level expected to be in 3-5 years?• What operating equipment will be utilized (or idled) due to
new product development, production mix or productionvolume changes?
• Will the same number of hours per year and shifts beoperating?
• What are economic and industry forecasts indicating withrespect to energy budgets or supply?
• Are supplier or material changes expected?
Estimate Future Energy Use
14
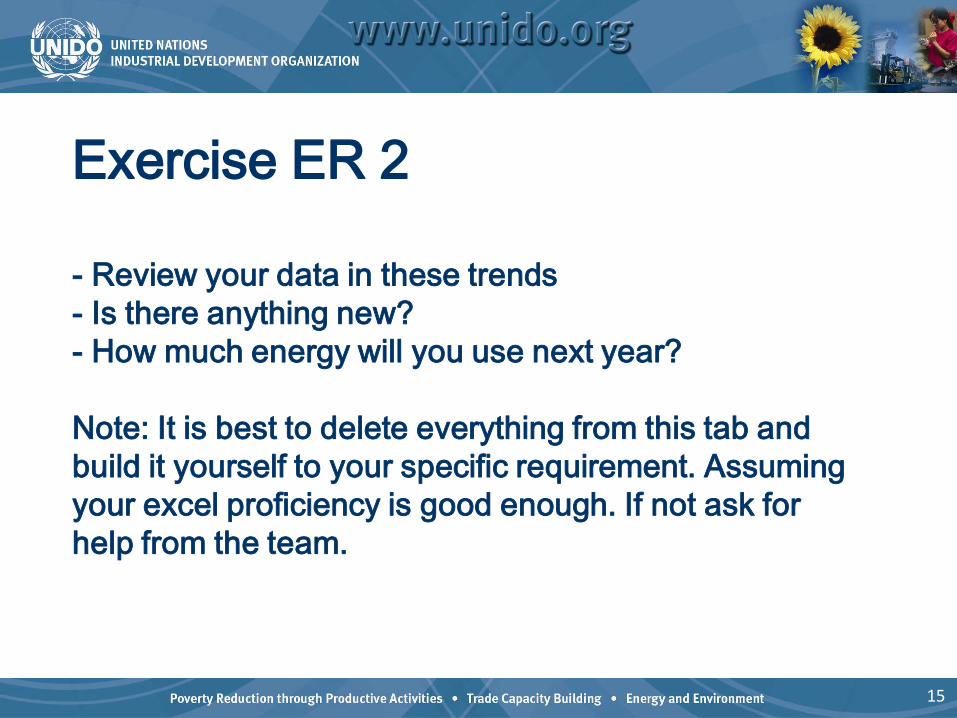
Exercise ER 2
- Review your data in these trends- Is there anything new?- How much energy will you use next year?
Note: It is best to delete everything from this tab and build it yourself to your specific requirement. Assuming your excel proficiency is good enough. If not ask for help from the team.
15

See you in 15 minutes!
16
TopicDuration (hours)
Exercise (mins)
Break duration
Start Time
End Time
DAY 2ER1 Bills and sub-meters 30 30 08:30 09:30ER2 Analyse energy use 30 30 09:30 10:30Break 15 10:30 10:45ER3 Identify and quantify SEUs 30 30 10:45 11:45ER4 Identify and quantify drivers and analyse SEUs 30 30 11:45 12:45
Lunch 45 12:45 13:30ER4 Identify and quantify drivers and analyse SEUs 30 13:30 14:00
ER5 Baseline and EnPIs, EnPI tool 30 45 14:00 15:15Break 15 15:15 15:30ER7 Technical energy audits 15 15:30 15:45ER8 Identify energy saving opportunities 15 40 15:45 16:40TOTALS 2,75 3,25 1,25 17
Planning workflow
1. Energy bill and sub-meter data
2. Analyze past, present and future energy use
7. Technical energy audits
8. Identify opportunities forimproved performance, review and decide on
action plans
6. Review operationalcontrol for all SEUs
4. Identify Drivers, get data and analyze SEUs
3. Identify and quantify Significant Energy Users
(SEUs)
5. Develop baselines andPerformance indicators for
each SEU
18
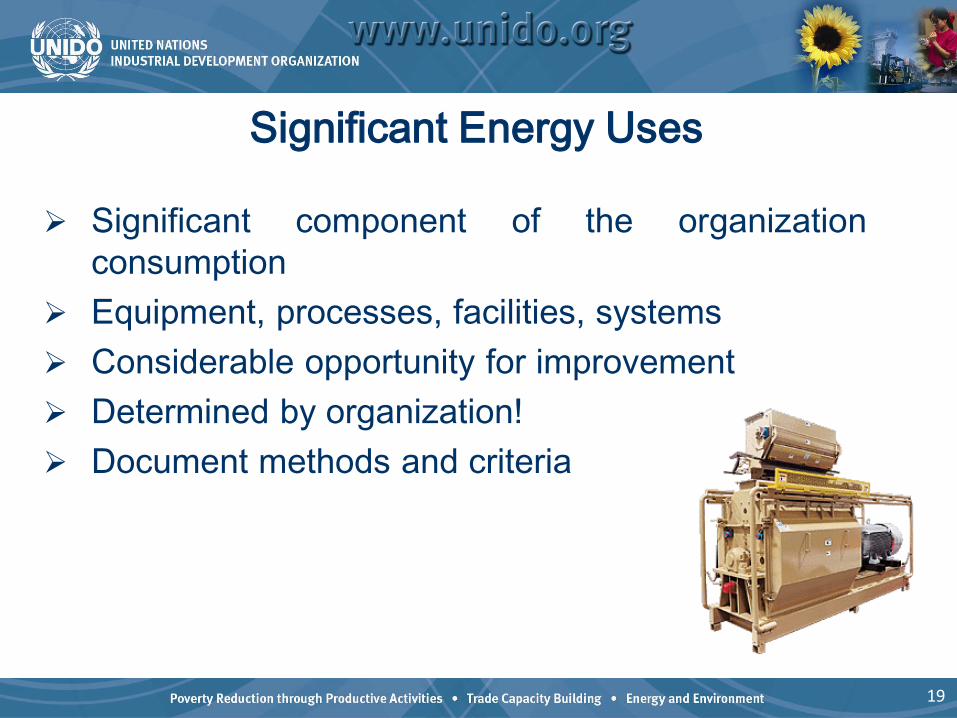
Significant Energy Uses
Significant component of the organizationconsumption
Equipment, processes, facilities, systems Considerable opportunity for improvement Determined by organization! Document methods and criteria
19

Significant Energy Use Identification
• Use facility and process flow diagrams to identify energy
uses and interactions
• Show primary and secondary energy streams
• Use previously collected data to determine energy use
• Is additional data required?
• Group equipment and processes into logical systems
• Which people affect the energy use of that item/system?
20
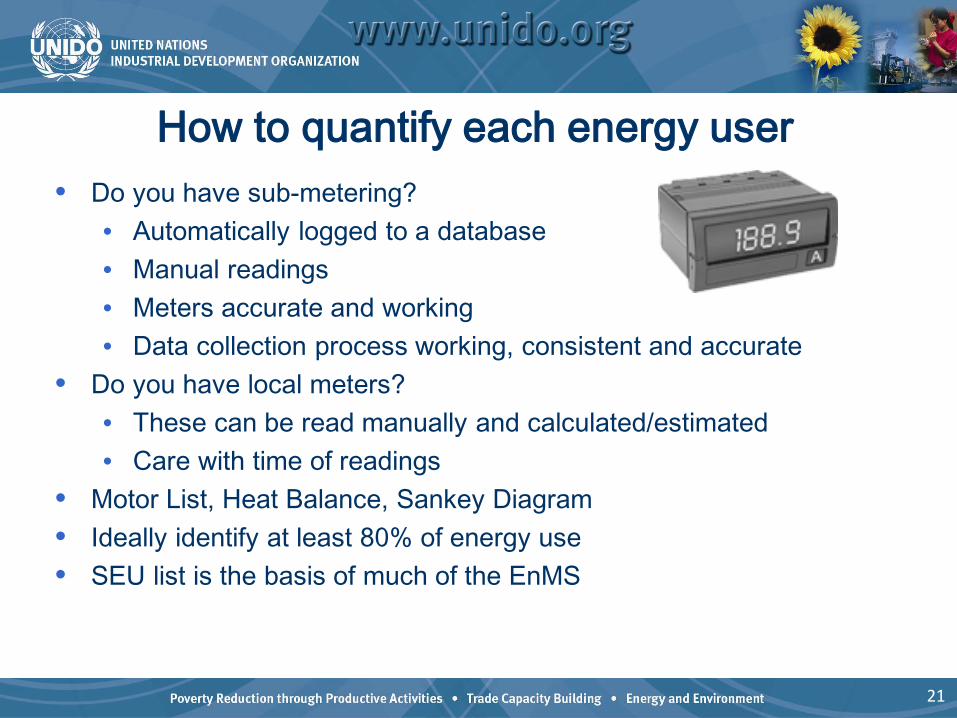
How to quantify each energy user• Do you have sub-metering?
• Automatically logged to a database• Manual readings• Meters accurate and working• Data collection process working, consistent and accurate
• Do you have local meters?• These can be read manually and calculated/estimated• Care with time of readings
• Motor List, Heat Balance, Sankey Diagram• Ideally identify at least 80% of energy use• SEU list is the basis of much of the EnMS
21

Heat (energy) balance• Use what you know:
• Steam flow• Feedwater flow (= steam flow approximately)• Fuel flow (heat flow = fuel flow * efficiency)• Gas bills• Hot water flow and temperature difference (dT)
(Q=m*Cp*dT)• Build up a balance
• Heat in = heat out• If you have a significant gap, you may need to measure it• Ultrasonic flow meters, portable heat meters
• More challenging than electrical power• Typically fewer measuring points
22
• Organize data in energy balance or other method to identify equipment and processes
• Use internal knowledge to add to list
• Techniques
• Energy balance
• Ranking methods
• Six sigma tools
• Other data analyses
• Remember Pareto Rule (80/20)
• Start with a few
Significant Energy Use Identification
23
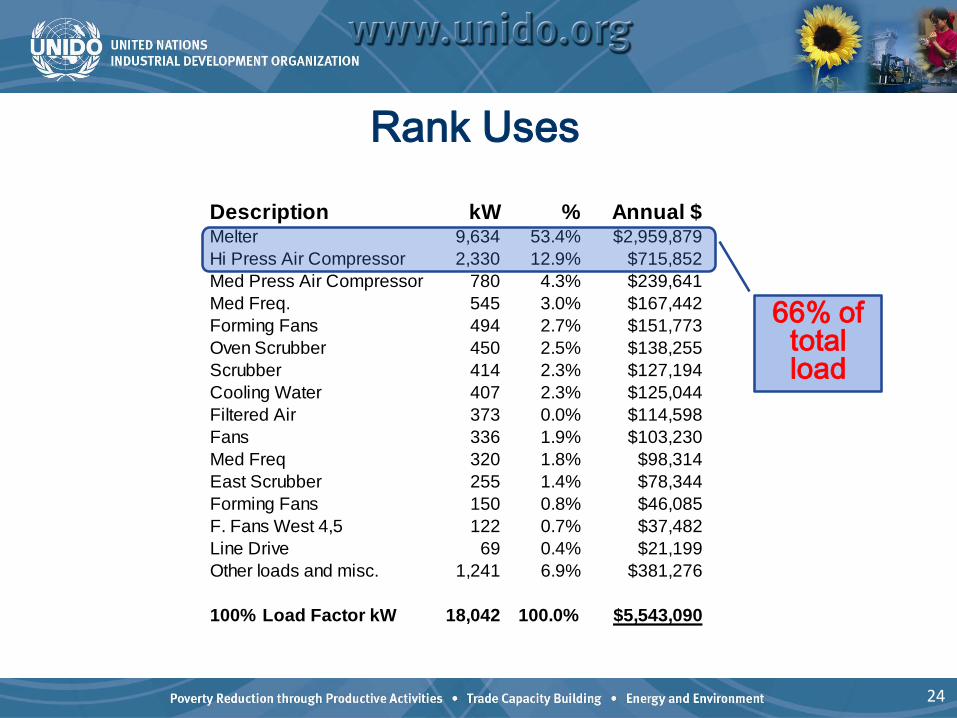
Description kW % Annual $Melter 9,634 53.4% $2,959,879Hi Press Air Compressor 2,330 12.9% $715,852Med Press Air Compressor 780 4.3% $239,641Med Freq. 545 3.0% $167,442Forming Fans 494 2.7% $151,773Oven Scrubber 450 2.5% $138,255Scrubber 414 2.3% $127,194Cooling Water 407 2.3% $125,044Filtered Air 373 0.0% $114,598Fans 336 1.9% $103,230Med Freq 320 1.8% $98,314East Scrubber 255 1.4% $78,344Forming Fans 150 0.8% $46,085F. Fans West 4,5 122 0.7% $37,482Line Drive 69 0.4% $21,199Other loads and misc. 1,241 6.9% $381,276
100% Load Factor kW 18,042 100.0% $5,543,090
66% of total load
Rank Uses
24
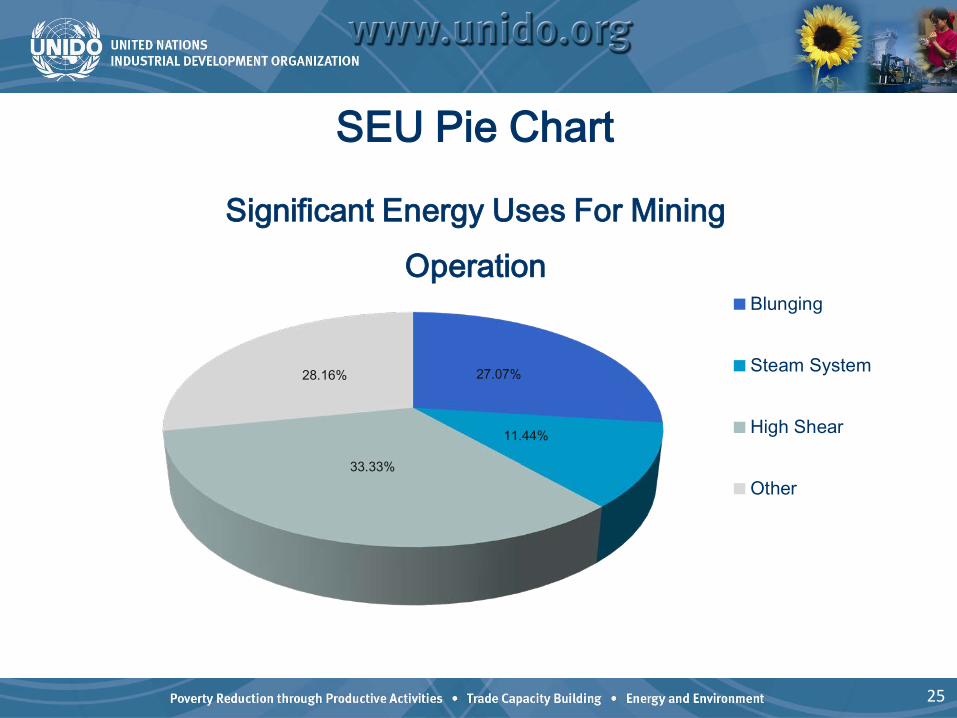
SEU Pie Chart
27.07%
11.44%
33.33%
28.16%
Significant Energy Uses For Mining Operation
Blunging
Steam System
High Shear
Other
25
26
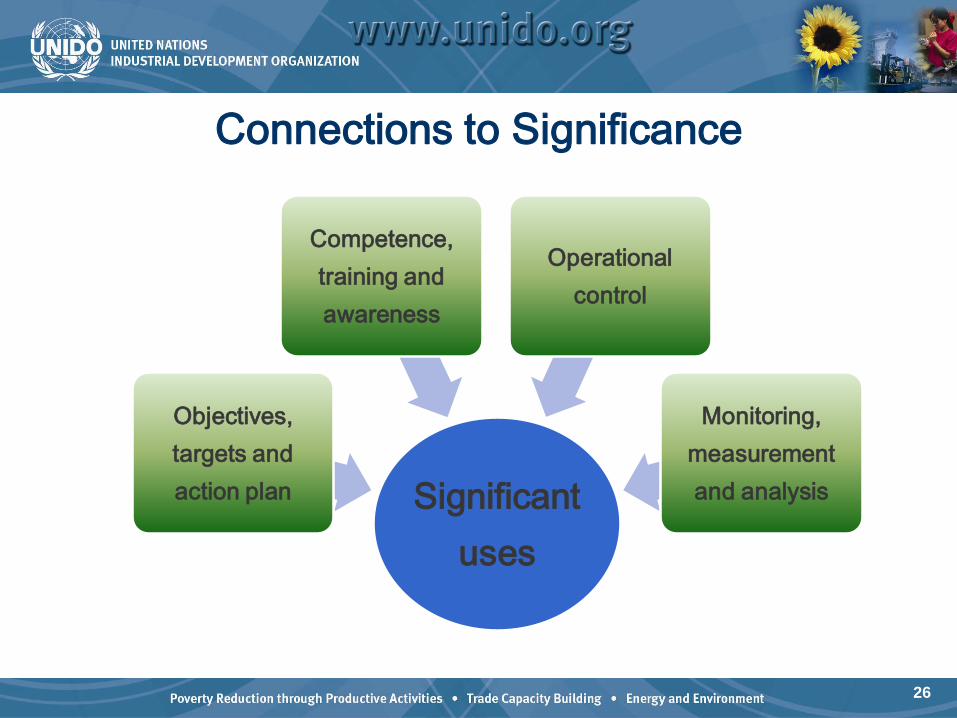
Connections to Significance
Significant uses
Objectives, targets and action plan
Competence, training and awareness
Operational control
Monitoring, measurement and analysis
Continual Improvement• Start with a few significant uses – keep it manageable!
• Add to the identified significant energy uses over time,improving the efficiency and control of moreequipment, systems, and processes.
• Addressing the connections associated with significantenergy uses will quickly consume resources!
27
Typical Barriers• Not focusing on large energy users and systems• Not including a cross-functional team when determining
significance• Identifying too many significant systems• Inadequate submetering• Inadequate data analysis• Lack of connection with organization’s strategic focus for future
energy use estimation• Focus on data or system inadequacies
28
Exercise – Significant Energy Uses
• Use the ER3 tabs• Motor List• SEU list and calculation
29

TopicDuration (hours)
Exercise (mins)
Break duration
Start Time
End Time
DAY 2ER1 Bills and sub-meters 30 30 08:30 09:30ER2 Analyse energy use 30 30 09:30 10:30Break 15 10:30 10:45ER3 Identify and quantify SEUs 30 30 10:45 11:45ER4 Identify and quantify drivers and analyse SEUs 30 30 11:45 12:45
Lunch 45 12:45 13:30ER4 Identify and quantify drivers and analyse SEUs 30 13:30 14:00
ER5 Baseline and EnPIs, EnPI tool 30 45 14:00 15:15Break 15 15:15 15:30ER7 Technical energy audits 15 15:30 15:45ER8 Identify energy saving opportunities 15 40 15:45 16:40TOTALS 2.75 3.25 1.25 30
Problem: energy consumption varies due to,
• Weather • Daylight availability• Production throughputs• Mileages• Occupancy• …etc• “driving factors”• Terminology: drivers, independent variables, energy factors
All mean the same, decide which you will use
31

Planning workflow
1. Energy bill and sub-meter data
2. Analyze past, present and future energy use
7. Technical energy audits
8. Identify opportunities forimproved performance, review and decide on
action plans
6. Review operationalcontrol for all SEUs
4. Identify Drivers, get data and analyze SEUs
3. Identify and quantify Significant Energy Users
(SEUs)
5. Develop baselines andPerformance indicators for
each SEU
32
33
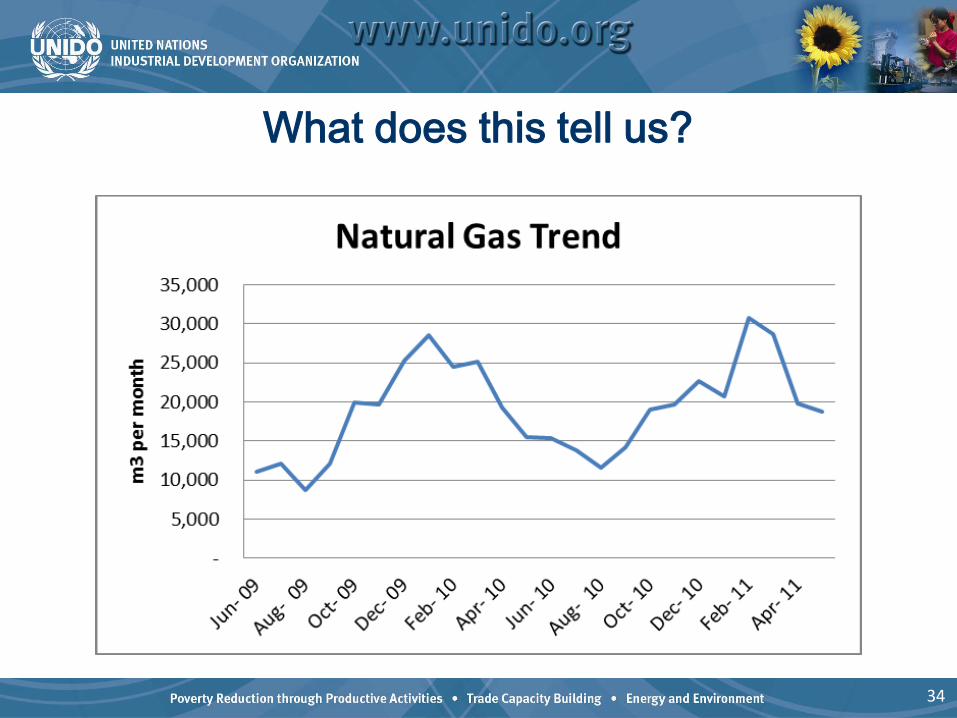
What does this tell us?
34
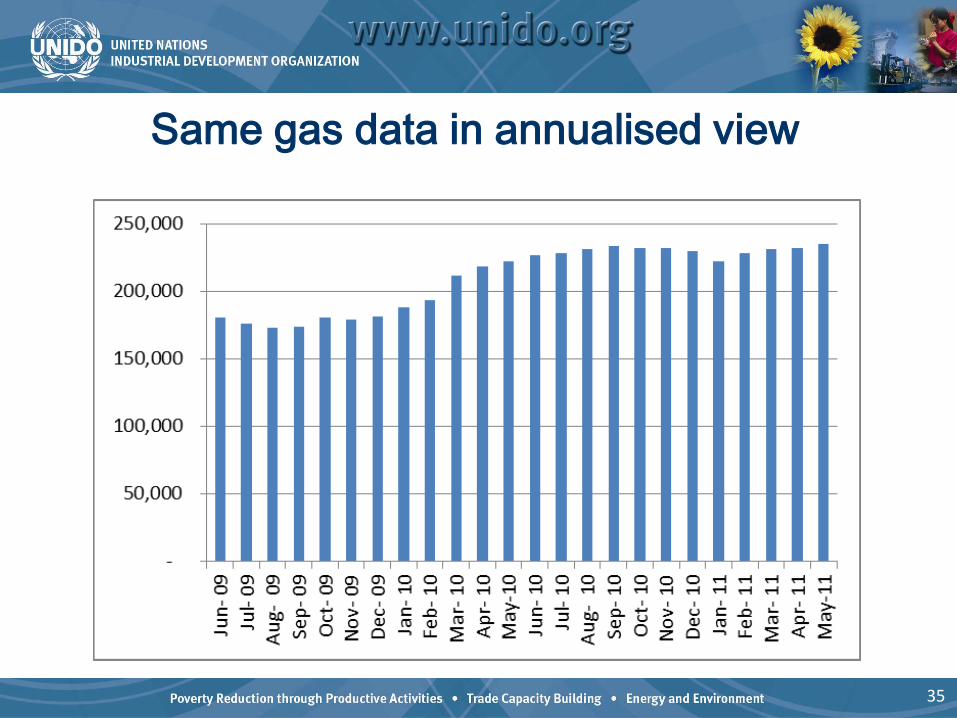
Same gas data in annualised view
35
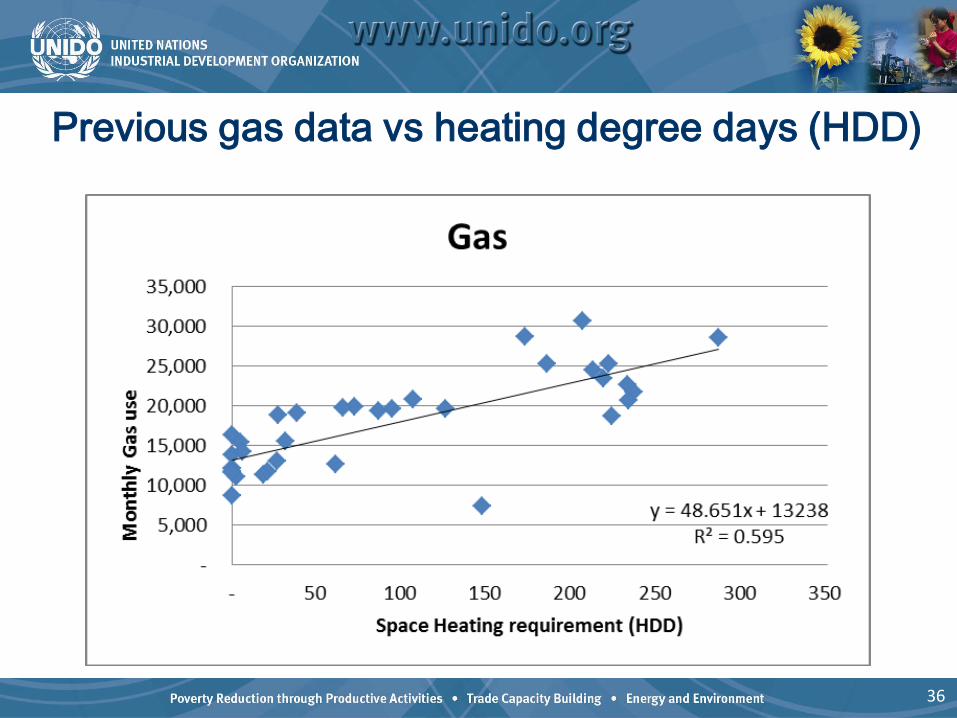
Previous gas data vs heating degree days (HDD)
36
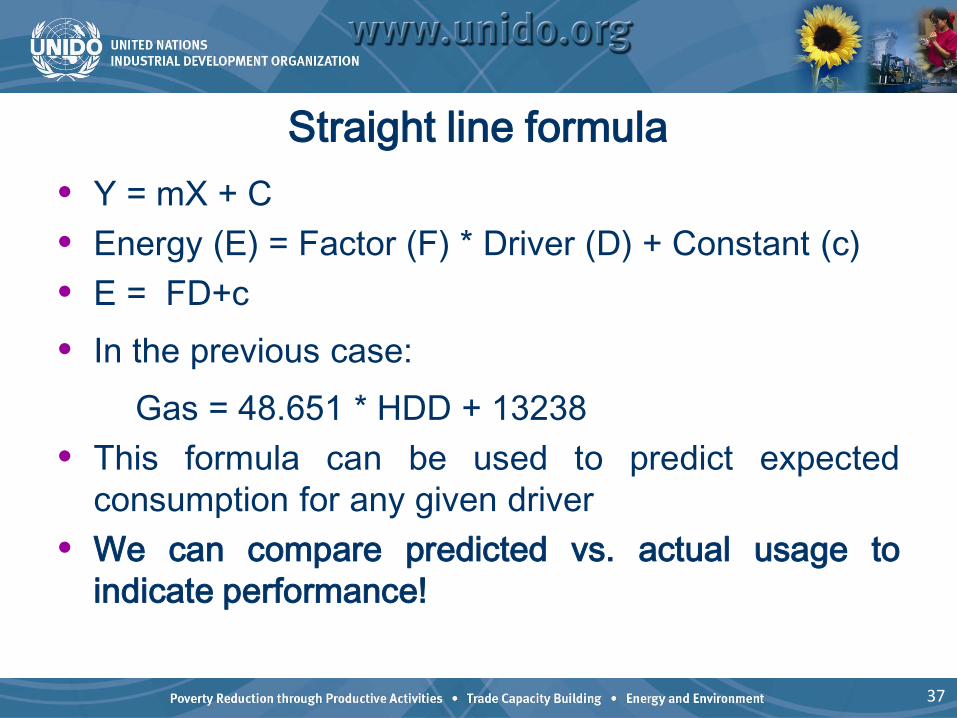
Straight line formula• Y = mX + C• Energy (E) = Factor (F) * Driver (D) + Constant (c)• E = FD+c• In the previous case:
Gas = 48.651 * HDD + 13238• This formula can be used to predict expected
consumption for any given driver• We can compare predicted vs. actual usage to
indicate performance!
37
In general
• Expected energy consumption can be anyfunction of relevant driving factors, D
E = f(D1, D2, ……. Dn)• Use the simplest effective model• A straight-line relationship is often good enough
38
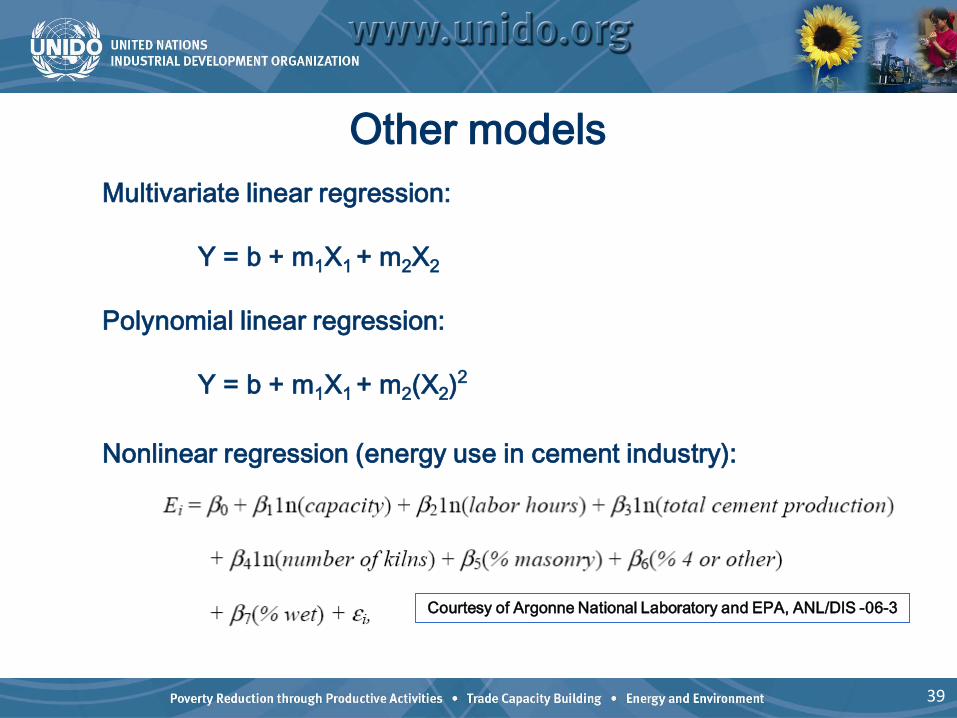
Other modelsMultivariate linear regression:
Y = b + m1X1 + m2X2
Polynomial linear regression:
Y = b + m1X1 + m2(X2)2
Nonlinear regression (energy use in cement industry):
Courtesy of Argonne National Laboratory and EPA, ANL/DIS -06-3
39
The main message
• Establish relationships between energy consumptions andappropriate energy (driving) factors
• Sometimes called “performance characteristics”
• Use these to calculate expected consumption based onproduction activity, prevailing weather etc.
• Thereby detect unexplained deviations
40
Measurement Plan
• Do you have enough instrumentation to develop yourEnPIs?
• List additional instrumentation needed if any
41

Exercise – Work on your drivers
Demo how to do it in Excel
Note: it is critical that all participants can do this. It will come up again and again. It is in the exam and is required to have an
effective EnMS!
42

See you in 15 minutes!
43
TopicDuration (hours)
Exercise (mins)
Break duration
Start Time
End Time
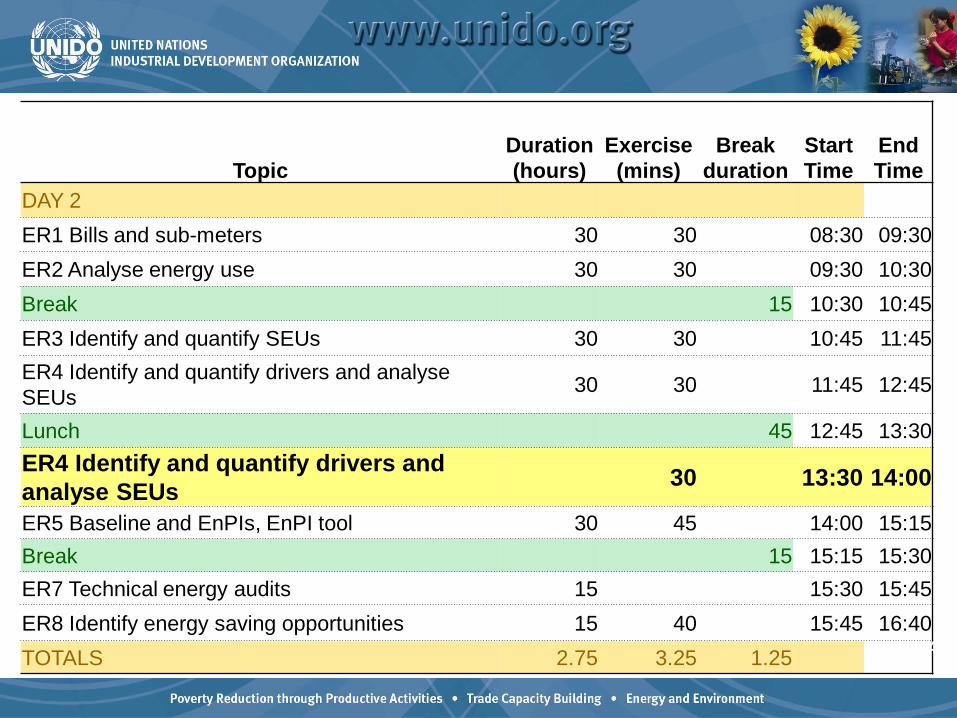
DAY 2ER1 Bills and sub-meters 30 30 08:30 09:30ER2 Analyse energy use 30 30 09:30 10:30Break 15 10:30 10:45ER3 Identify and quantify SEUs 30 30 10:45 11:45ER4 Identify and quantify drivers and analyse SEUs 30 30 11:45 12:45
Lunch 45 12:45 13:30ER4 Identify and quantify drivers and analyse SEUs 30 13:30 14:00
ER5 Baseline and EnPIs, EnPI tool 30 45 14:00 15:15Break 15 15:15 15:30ER7 Technical energy audits 15 15:30 15:45ER8 Identify energy saving opportunities 15 40 15:45 16:40TOTALS 2.75 3.25 1.25 44

Exercise
• Continue with the exercise
45
TopicDuration (hours)
Exercise (mins)
Break duration
Start Time
End Time
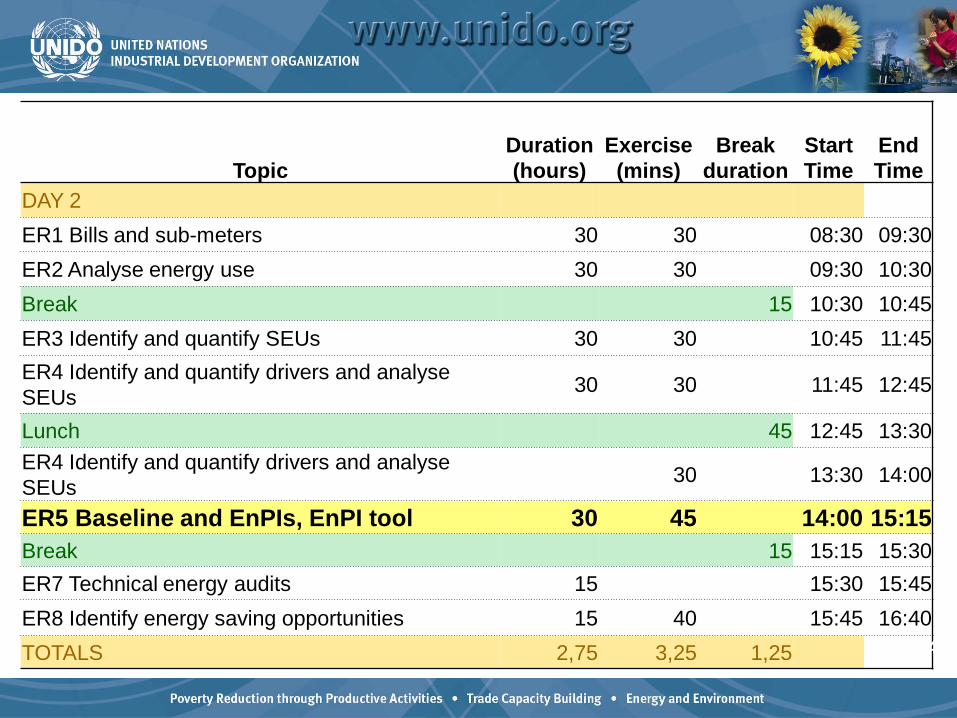
DAY 2ER1 Bills and sub-meters 30 30 08:30 09:30ER2 Analyse energy use 30 30 09:30 10:30Break 15 10:30 10:45ER3 Identify and quantify SEUs 30 30 10:45 11:45ER4 Identify and quantify drivers and analyse SEUs 30 30 11:45 12:45
Lunch 45 12:45 13:30ER4 Identify and quantify drivers and analyse SEUs 30 13:30 14:00
ER5 Baseline and EnPIs, EnPI tool 30 45 14:00 15:15Break 15 15:15 15:30ER7 Technical energy audits 15 15:30 15:45ER8 Identify energy saving opportunities 15 40 15:45 16:40TOTALS 2,75 3,25 1,25 46
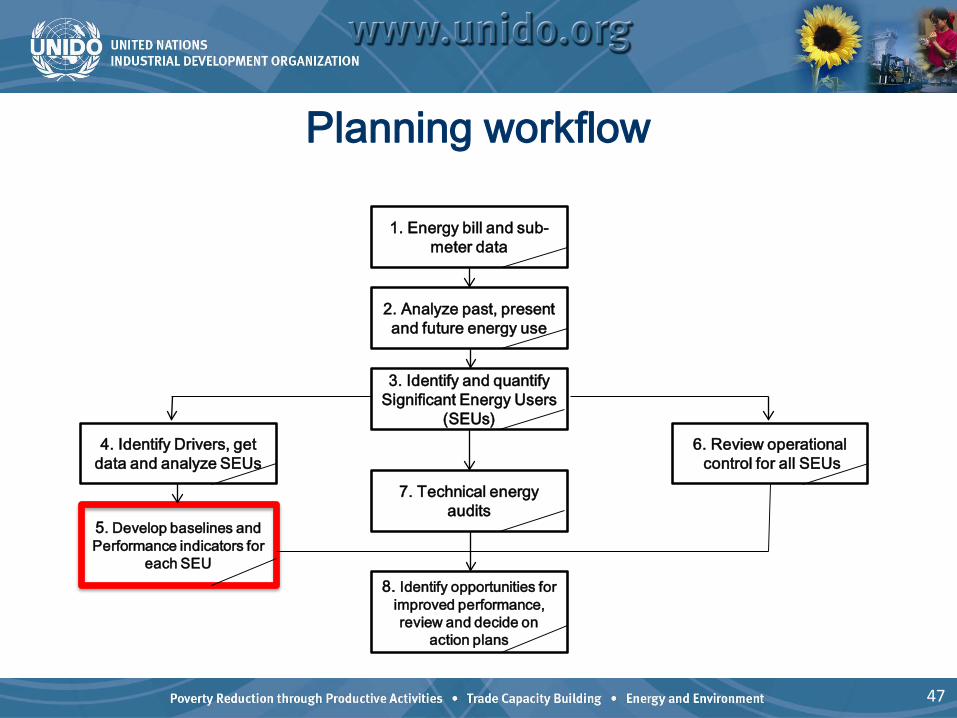
Planning workflow
1. Energy bill and sub-meter data
2. Analyze past, present and future energy use
7. Technical energy audits
8. Identify opportunities forimproved performance, review and decide on
action plans
6. Review operationalcontrol for all SEUs
4. Identify Drivers, get data and analyze SEUs
3. Identify and quantify Significant Energy Users
(SEUs)
5. Develop baselines andPerformance indicators for
each SEU
47

Energy Metrics – levels of complexity• Simple:
• Simple: consumption last month v same month lastyear
• Simple: compare actual consumption with budget• Simple: annualised trend of cost and consumption
• More complex (but beware!)• Energy use per unit output• Cooling energy per cooling degree day• Specific energy consumption (SEC)
• Regression analysis is usually best• Same principles apply to EnPIs and verification of
savings
48
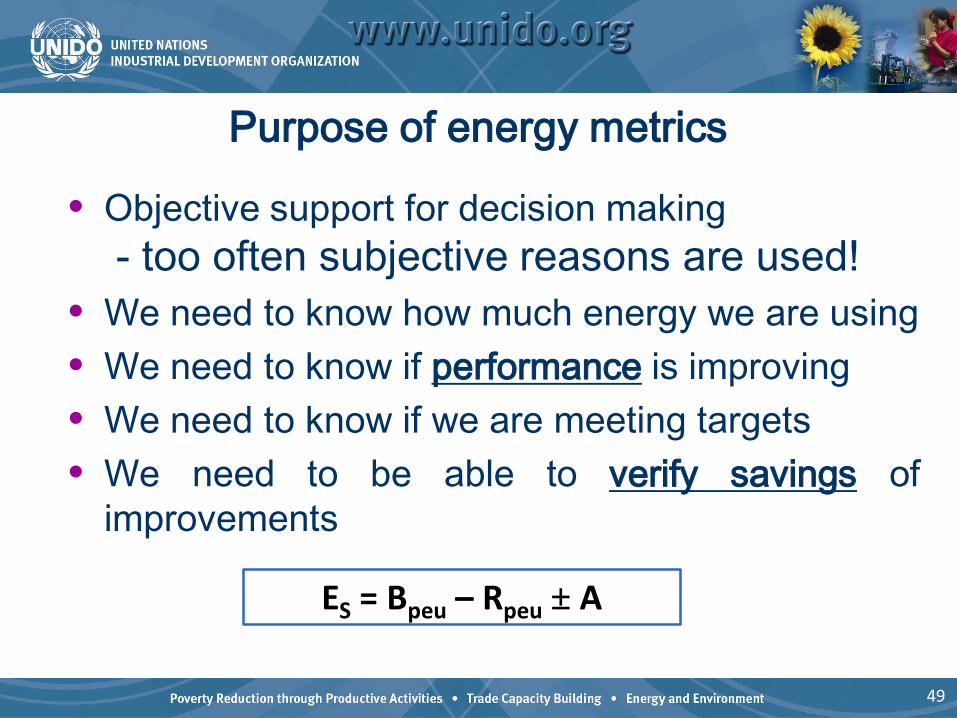
Purpose of energy metrics
• Objective support for decision making- too often subjective reasons are used!
• We need to know how much energy we are using• We need to know if performance is improving• We need to know if we are meeting targets• We need to be able to verify savings of
improvements
ES = Bpeu – Rpeu ± A
49
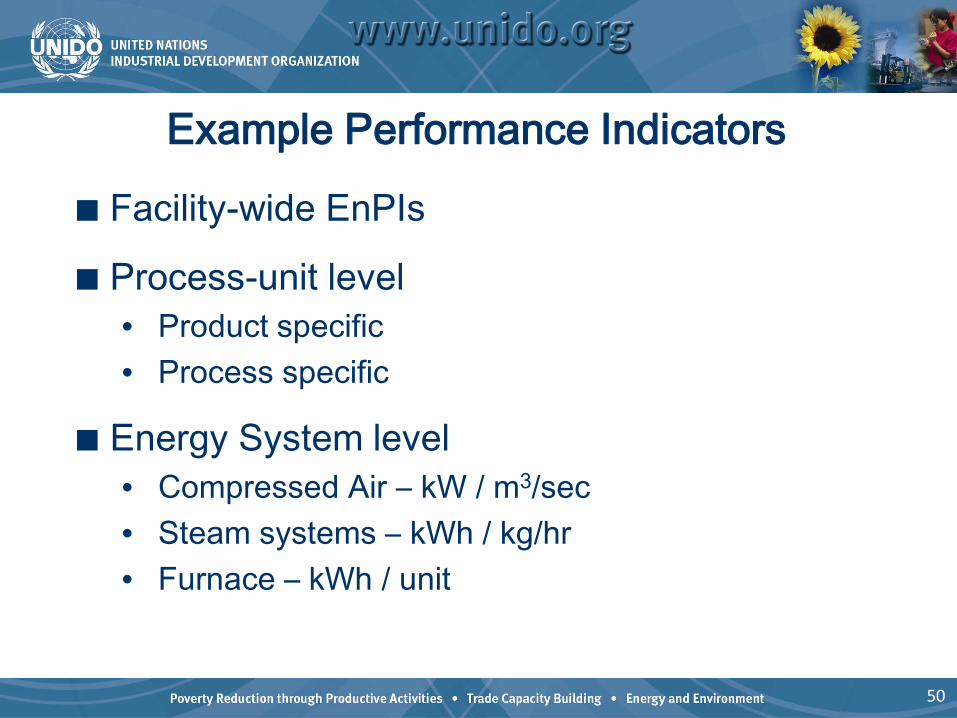
■ Facility-wide EnPIs
■ Process-unit level• Product specific • Process specific
■ Energy System level• Compressed Air – kW / m3/sec• Steam systems – kWh / kg/hr• Furnace – kWh / unit
Example Performance Indicators
50
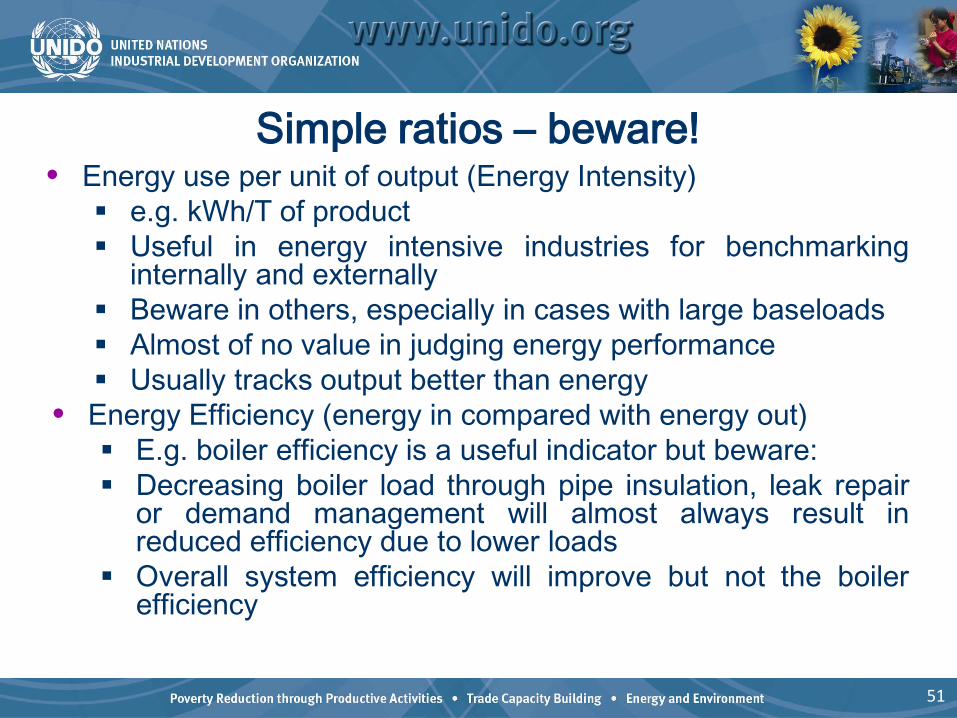
Simple ratios – beware!• Energy use per unit of output (Energy Intensity) e.g. kWh/T of product Useful in energy intensive industries for benchmarking
internally and externally Beware in others, especially in cases with large baseloads Almost of no value in judging energy performance Usually tracks output better than energy
• Energy Efficiency (energy in compared with energy out) E.g. boiler efficiency is a useful indicator but beware: Decreasing boiler load through pipe insulation, leak repair
or demand management will almost always result inreduced efficiency due to lower loads
Overall system efficiency will improve but not the boilerefficiency
51
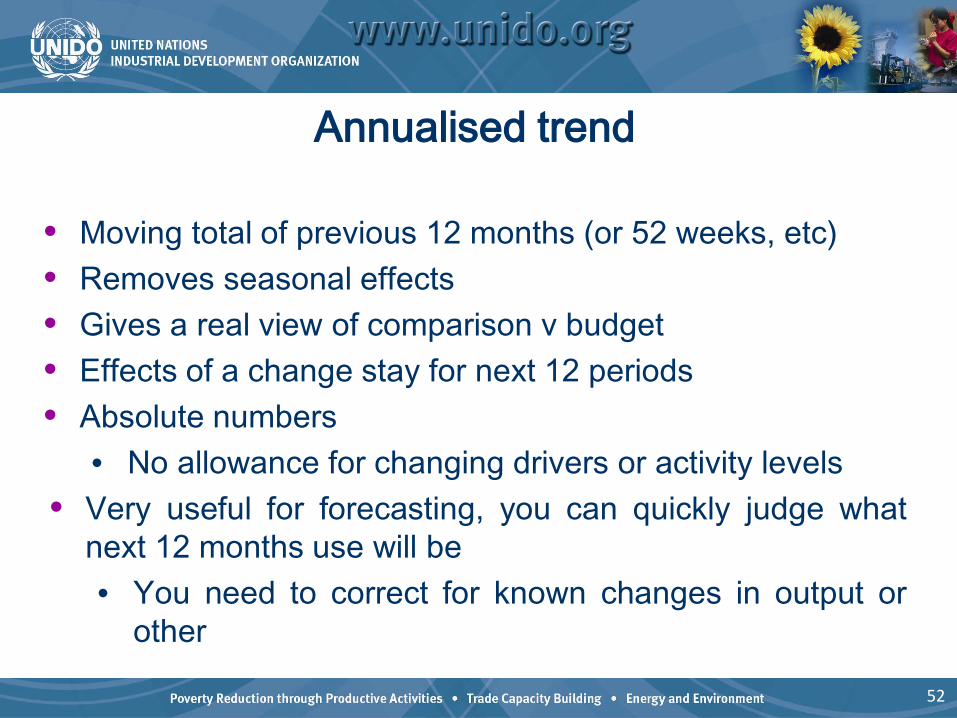
Annualised trend
• Moving total of previous 12 months (or 52 weeks, etc)• Removes seasonal effects• Gives a real view of comparison v budget• Effects of a change stay for next 12 periods• Absolute numbers
• No allowance for changing drivers or activity levels• Very useful for forecasting, you can quickly judge what
next 12 months use will be• You need to correct for known changes in output or
other
52
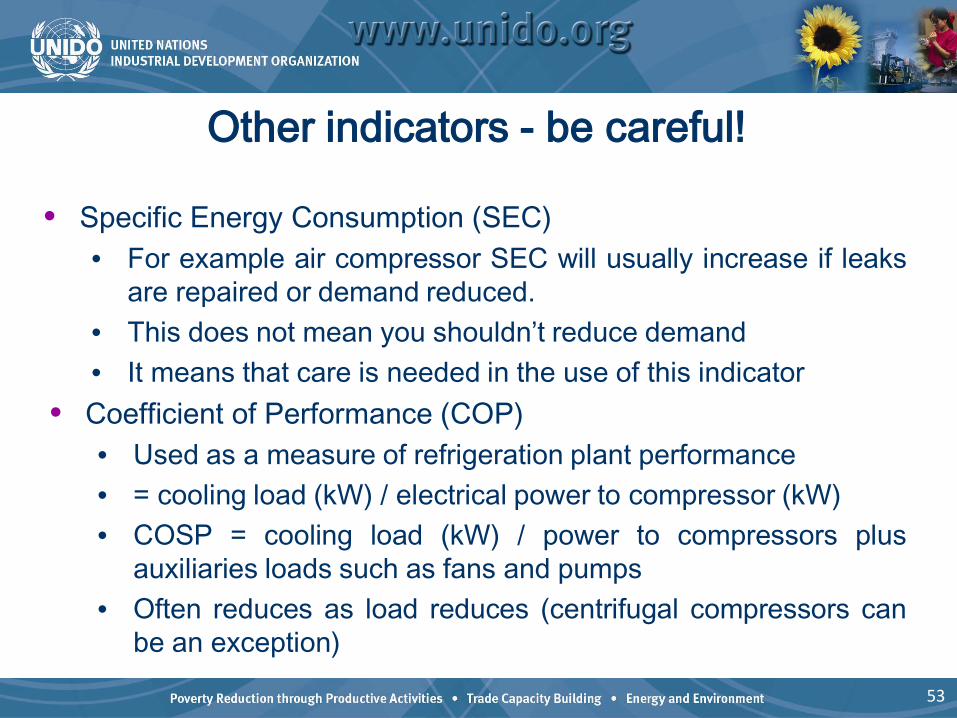
Other indicators - be careful!
• Specific Energy Consumption (SEC)• For example air compressor SEC will usually increase if leaks
are repaired or demand reduced.• This does not mean you shouldn’t reduce demand• It means that care is needed in the use of this indicator
• Coefficient of Performance (COP)• Used as a measure of refrigeration plant performance• = cooling load (kW) / electrical power to compressor (kW)• COSP = cooling load (kW) / power to compressors plus
auxiliaries loads such as fans and pumps• Often reduces as load reduces (centrifugal compressors can
be an exception)
53
Performance checking with EnPI
• We use energy for known purposes (“outputs”)
• If we can measure useful output, we should be able toestimate expected energy consumption
• Thus we can gauge actual consumption…
Waste relative to target characteristic Savings relative to historical baseline
54

Energy Baseline• Basis of comparison for evaluating energy performance
• Facility-wide• Systems and equipment• Significant energy uses
• Uses pieces of initial energy review• Energy use data• Energy consumption data
• Facility-determined time period• Point in time• Period of time
• Measure energy performance improvement against thebaseline
55
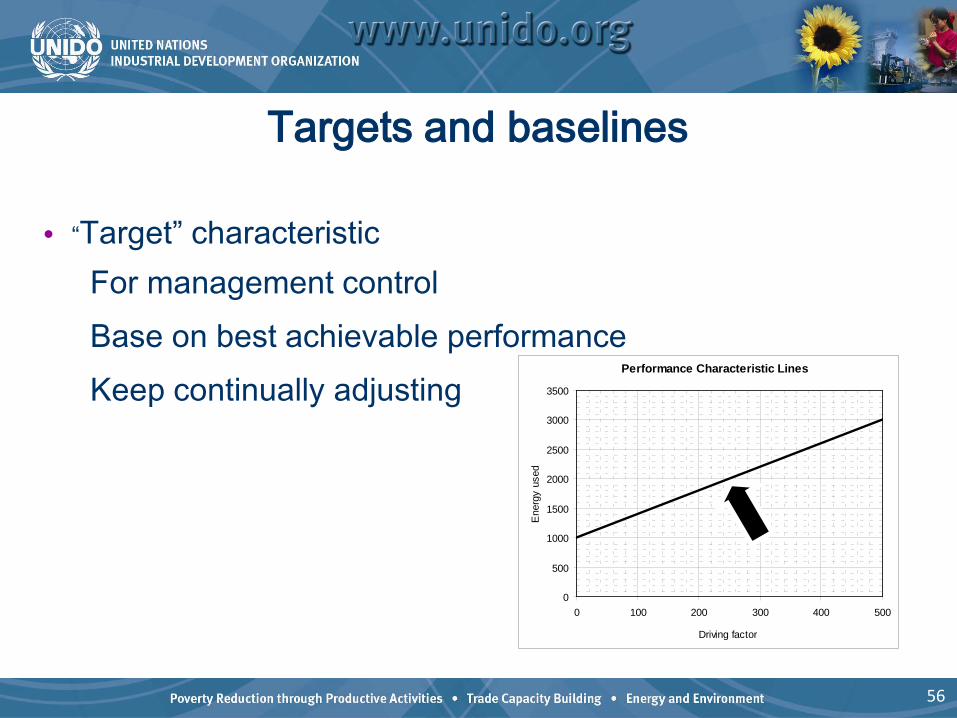
Targets and baselines
• “Target” characteristicFor management controlBase on best achievable performanceKeep continually adjusting
Performance Characteristic Lines
0
500
1000
1500
2000
2500
3000
3500
0 100 200 300 400 500
Driving factor
Ene
rgy
used
56
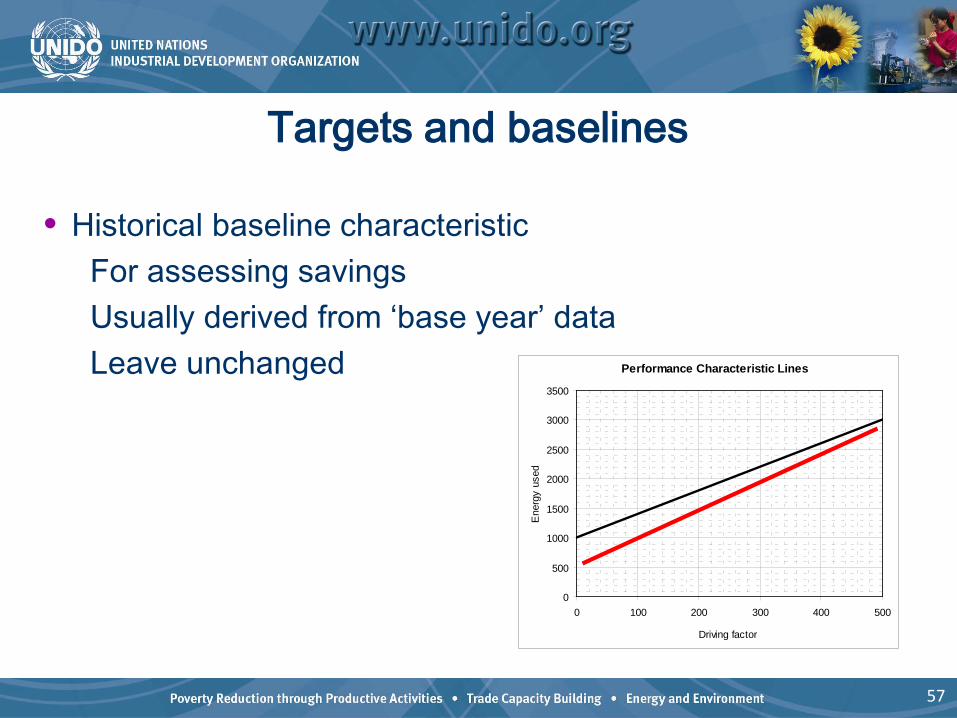
Targets and baselines
• Historical baseline characteristicFor assessing savingsUsually derived from ‘base year’ dataLeave unchanged Performance Characteristic Lines
0
500
1000
1500
2000
2500
3000
3500
0 100 200 300 400 500
Driving factor
Ene
rgy
used
57

58
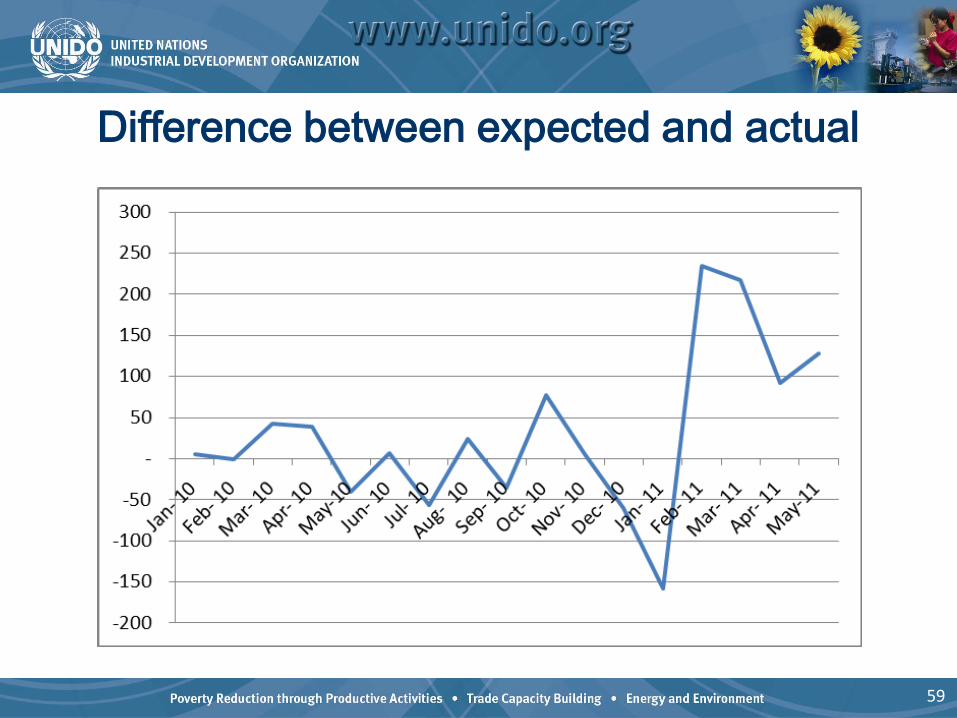
Difference between expected and actual
59

CUmulative SUM of difference (CUSUM)
60
Historical baseline characteristic
• Answers the question “how much would Ihave used in the absence of my energy-saving measures?”
• Allows absolute kWh savings to becomputed Gives clean, objective view Production, weather, etc. already
accounted for
61
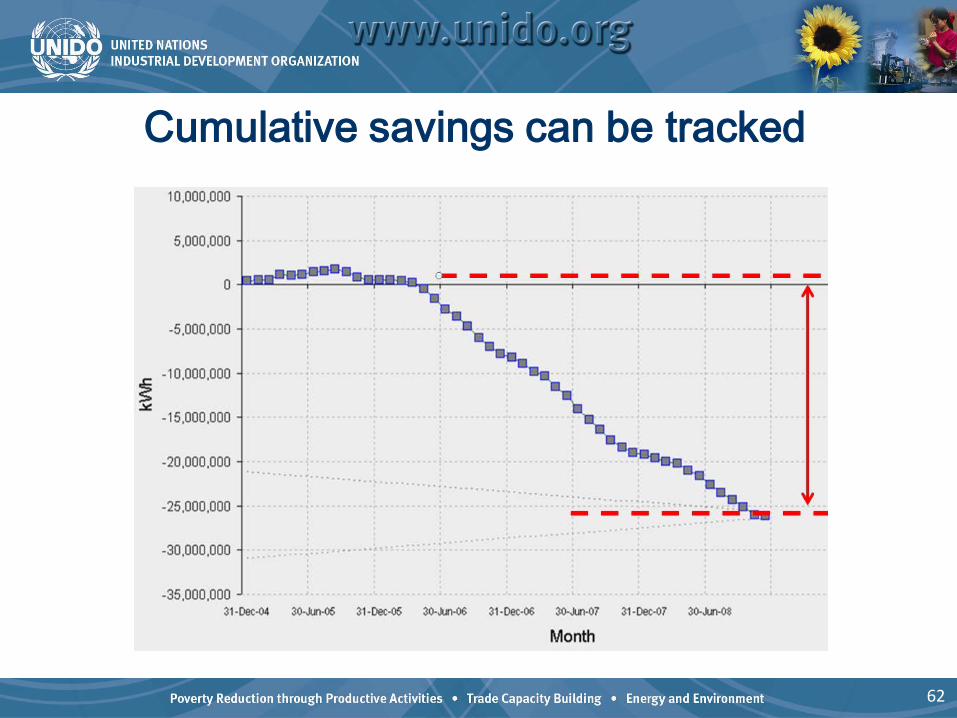
Cumulative savings can be tracked
62

Baseline alternatives
• Baseline will be used for future comparison of
improvements
• Ideally based on regression analysis as shown
• Can be absolute consumption, e.g. 1 GWh per
annum
• SEC: kWh per unit of output (beware)
63
Adjust Energy Baseline
Major process changes Major operational changes Major energy system changes When EnPIs no longer reflect organizational
use As determined by the organization
(predetermined method)
64
Value to the Organization
• Understand energyuse for baselineperiod
• Have a comparativepoint for measuringimprovement
65
Documents• Identified Energy Performance Indicators (EnPIs)• Method for determining and updating EnPIs• Energy management baseline
Records• Baseline (data pieces of initial energy review)• Review and comparison of EnPIs to baseline
Documents & Records
66
• Drivers worksheet• EnPI Tool• EnPI Tool Instruction Guide
Tools
67
EnPI Tool
68
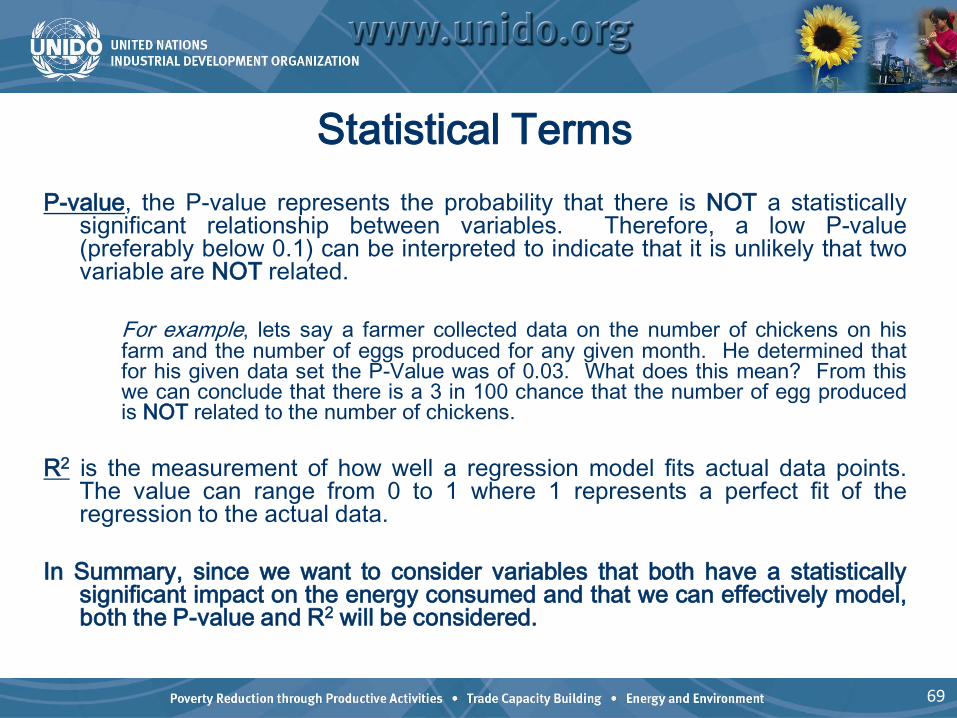
P-value, the P-value represents the probability that there is NOT a statisticallysignificant relationship between variables. Therefore, a low P-value(preferably below 0.1) can be interpreted to indicate that it is unlikely that twovariable are NOT related.
For example, lets say a farmer collected data on the number of chickens on hisfarm and the number of eggs produced for any given month. He determined thatfor his given data set the P-Value was of 0.03. What does this mean? From thiswe can conclude that there is a 3 in 100 chance that the number of egg producedis NOT related to the number of chickens.
R2 is the measurement of how well a regression model fits actual data points.The value can range from 0 to 1 where 1 represents a perfect fit of theregression to the actual data.
In Summary, since we want to consider variables that both have a statisticallysignificant impact on the energy consumed and that we can effectively model,both the P-value and R2 will be considered.
Statistical Terms
69
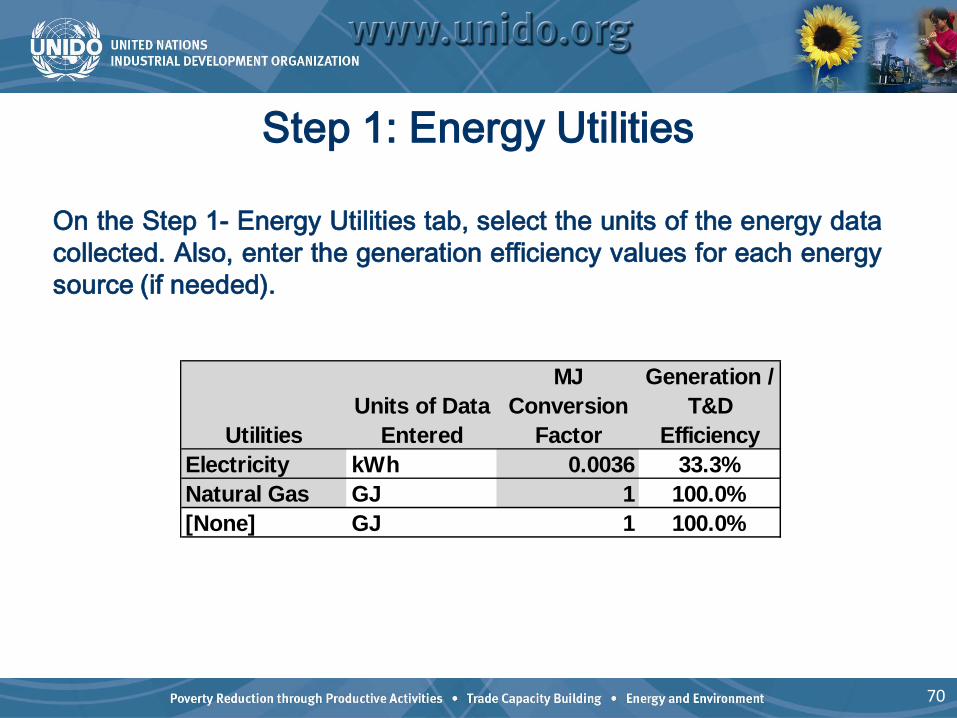
Step 1: Energy Utilities
UtilitiesUnits of Data
Entered
MJ Conversion
Factor
Generation / T&D
EfficiencyElectricity kWh 0.0036 33.3%Natural Gas GJ 1 100.0%[None] GJ 1 100.0%
On the Step 1- Energy Utilities tab, select the units of the energy datacollected. Also, enter the generation efficiency values for each energysource (if needed).
70
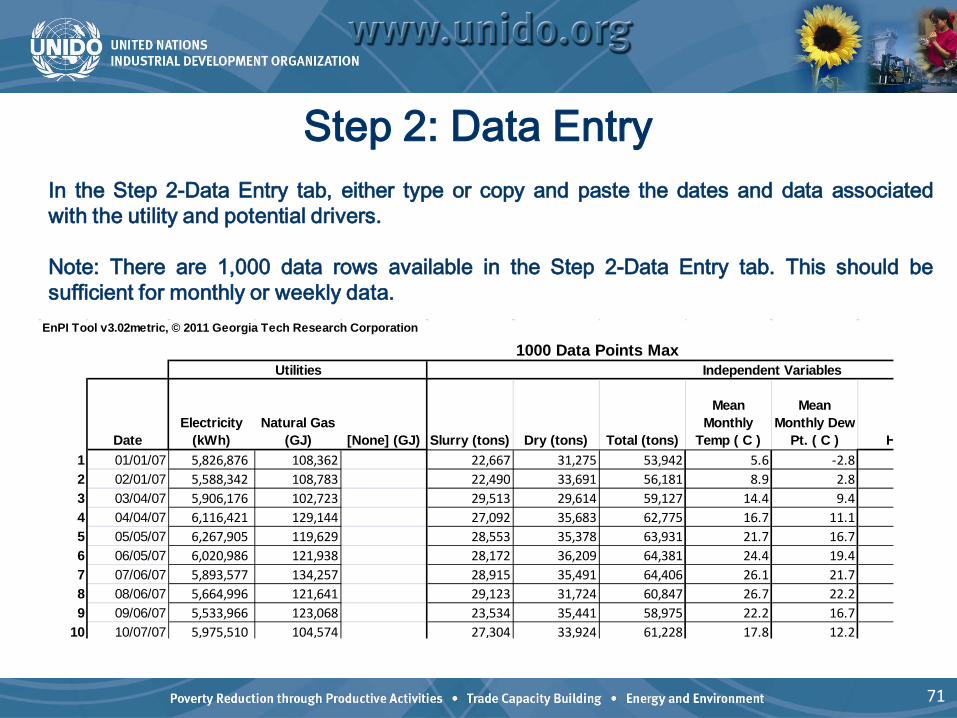
Step 2: Data Entry
EnPI Tool v3.02metric, © 2011 Georgia Tech Research Corporation
1000 Data Points Max
DateElectricity
(kWh)Natural Gas
(GJ) [None] (GJ) Slurry (tons) Dry (tons) Total (tons)
Mean Monthly
Temp ( C )
Mean Monthly Dew
Pt. ( C ) H1 01/01/07 5,826,876 108,362 22,667 31,275 53,942 5.6 -2.82 02/01/07 5,588,342 108,783 22,490 33,691 56,181 8.9 2.83 03/04/07 5,906,176 102,723 29,513 29,614 59,127 14.4 9.44 04/04/07 6,116,421 129,144 27,092 35,683 62,775 16.7 11.15 05/05/07 6,267,905 119,629 28,553 35,378 63,931 21.7 16.76 06/05/07 6,020,986 121,938 28,172 36,209 64,381 24.4 19.47 07/06/07 5,893,577 134,257 28,915 35,491 64,406 26.1 21.78 08/06/07 5,664,996 121,641 29,123 31,724 60,847 26.7 22.29 09/06/07 5,533,966 123,068 23,534 35,441 58,975 22.2 16.7
10 10/07/07 5,975,510 104,574 27,304 33,924 61,228 17.8 12.2
Utilities Independent Variables
In the Step 2-Data Entry tab, either type or copy and paste the dates and data associatedwith the utility and potential drivers.
Note: There are 1,000 data rows available in the Step 2-Data Entry tab. This should besufficient for monthly or weekly data.
71
Step 3: Data Review
72
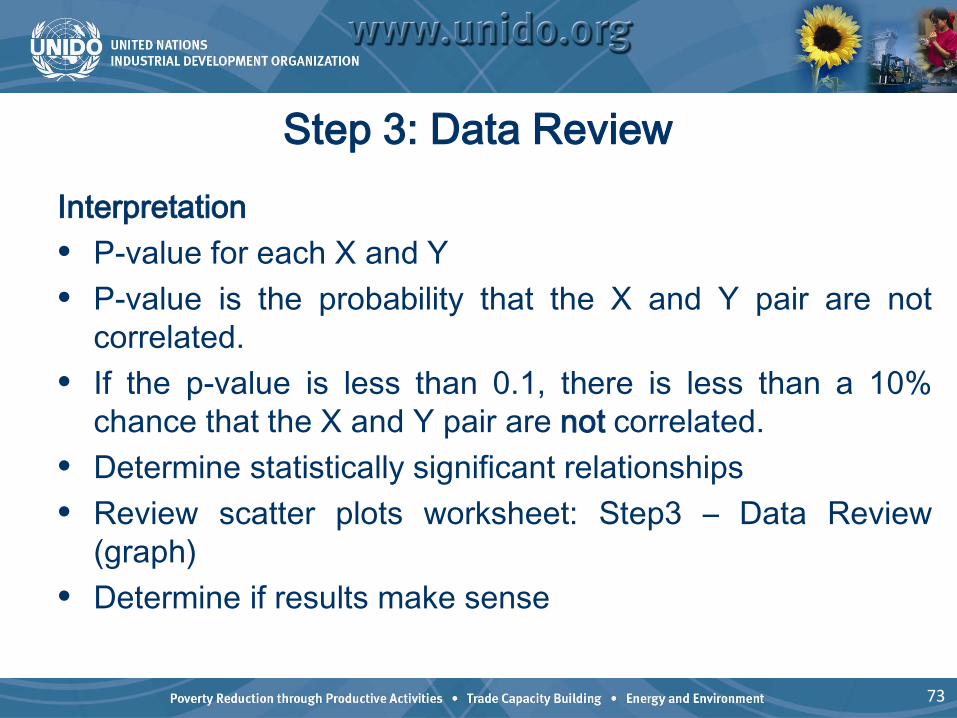
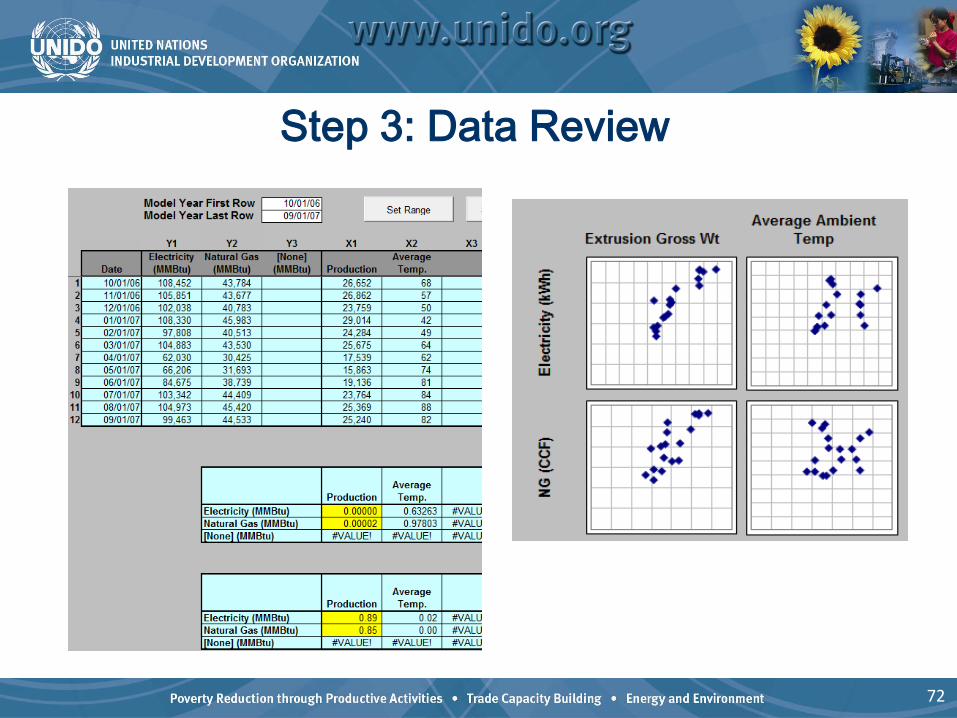
Interpretation• P-value for each X and Y• P-value is the probability that the X and Y pair are not
correlated.• If the p-value is less than 0.1, there is less than a 10%
chance that the X and Y pair are not correlated.• Determine statistically significant relationships• Review scatter plots worksheet: Step3 – Data Review
(graph)• Determine if results make sense
Step 3: Data Review
73
Step 4: Y1-Y3 Regression
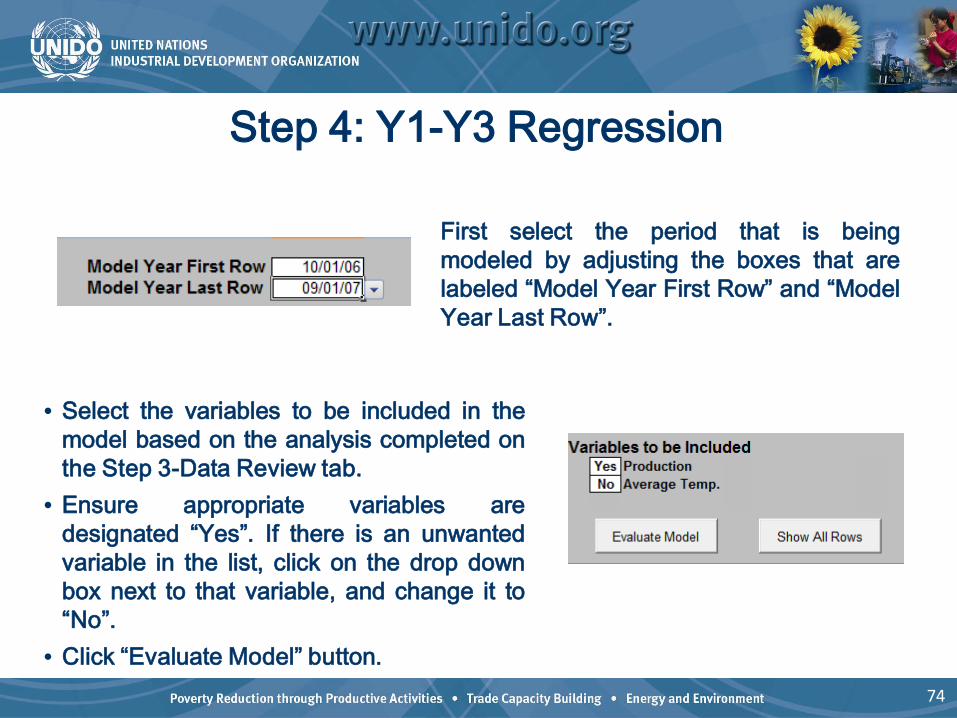
First select the period that is beingmodeled by adjusting the boxes that arelabeled “Model Year First Row” and “ModelYear Last Row”.
• Select the variables to be included in themodel based on the analysis completed onthe Step 3-Data Review tab.
• Ensure appropriate variables aredesignated “Yes”. If there is an unwantedvariable in the list, click on the drop downbox next to that variable, and change it to“No”.
• Click “Evaluate Model” button.74
75
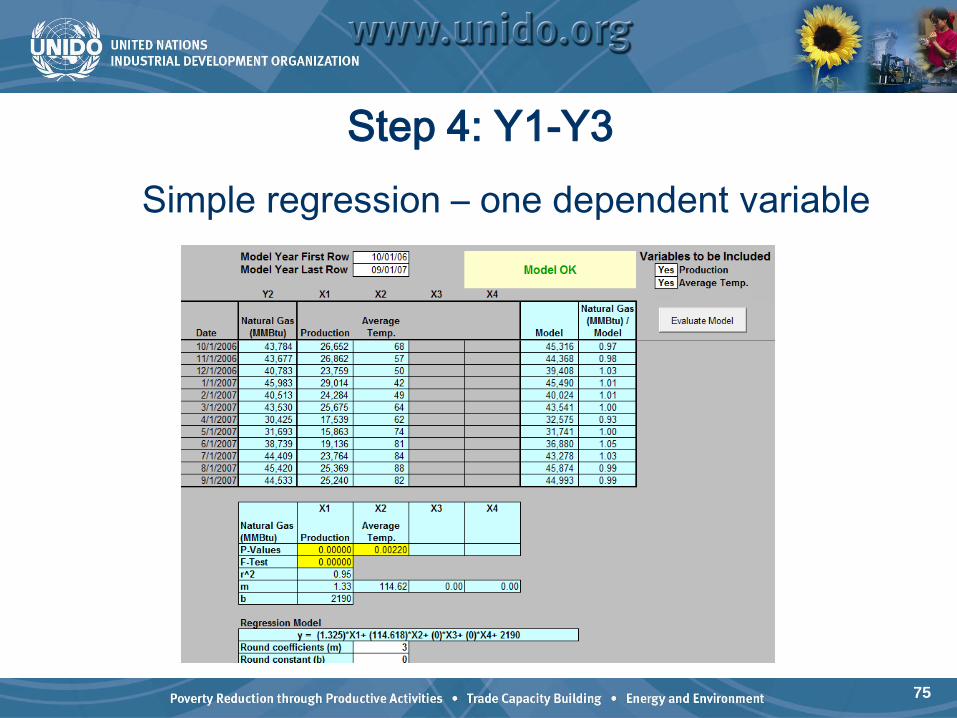
Step 4: Y1-Y3Simple regression – one dependent variable
Interpretation
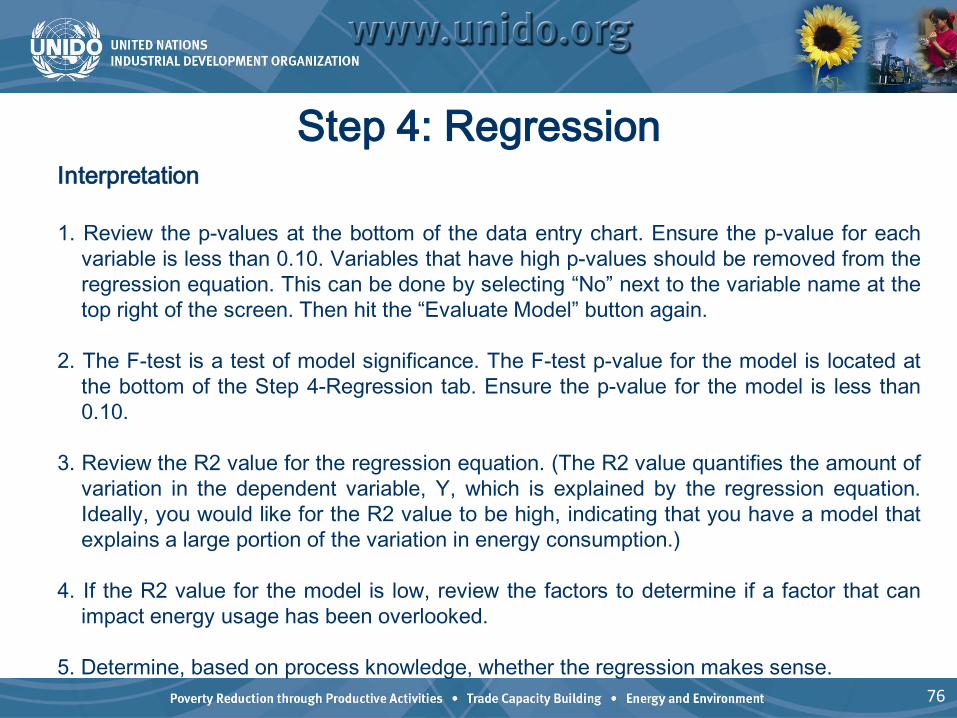
1. Review the p-values at the bottom of the data entry chart. Ensure the p-value for eachvariable is less than 0.10. Variables that have high p-values should be removed from theregression equation. This can be done by selecting “No” next to the variable name at thetop right of the screen. Then hit the “Evaluate Model” button again.
2. The F-test is a test of model significance. The F-test p-value for the model is located atthe bottom of the Step 4-Regression tab. Ensure the p-value for the model is less than0.10.
3. Review the R2 value for the regression equation. (The R2 value quantifies the amount ofvariation in the dependent variable, Y, which is explained by the regression equation.Ideally, you would like for the R2 value to be high, indicating that you have a model thatexplains a large portion of the variation in energy consumption.)
4. If the R2 value for the model is low, review the factors to determine if a factor that canimpact energy usage has been overlooked.
5. Determine, based on process knowledge, whether the regression makes sense.
Step 4: Regression
76
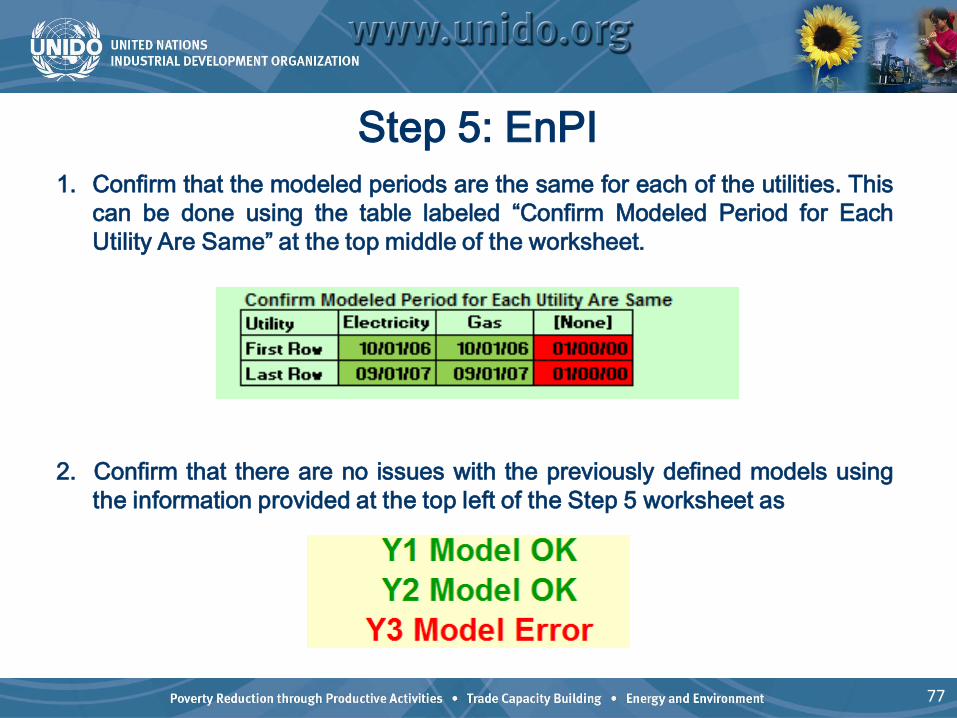
Step 5: EnPI1. Confirm that the modeled periods are the same for each of the utilities. This
can be done using the table labeled “Confirm Modeled Period for EachUtility Are Same” at the top middle of the worksheet.
2. Confirm that there are no issues with the previously defined models usingthe information provided at the top left of the Step 5 worksheet as
77
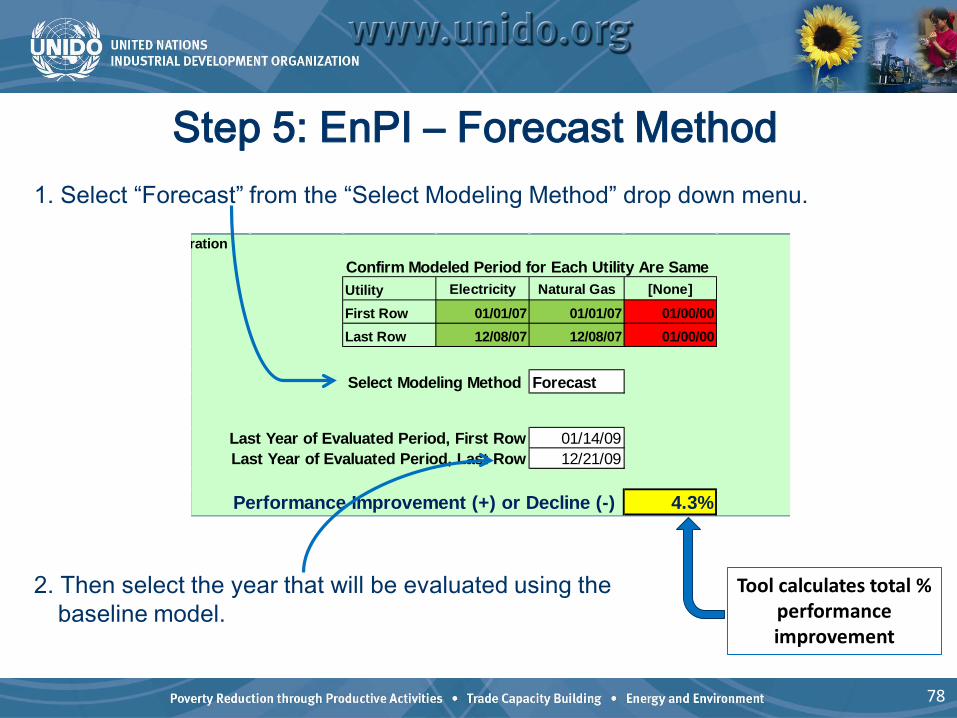
Step 5: EnPI – Forecast Method1. Select “Forecast” from the “Select Modeling Method” drop down menu.
2. Then select the year that will be evaluated using the baseline model.
rationConfirm Modeled Period for Each Utility Are SameUtility Electricity Natural Gas [None]First Row 01/01/07 01/01/07 01/00/00Last Row 12/08/07 12/08/07 01/00/00
Select Modeling Method Forecast
Year Zero Last YearLast Year of Evaluated Period, First Row 01/14/09Last Year of Evaluated Period, Last Row 12/21/09
Performance Improvement (+) or Decline (-) 4.3%
Tool calculates total % performance improvement
78
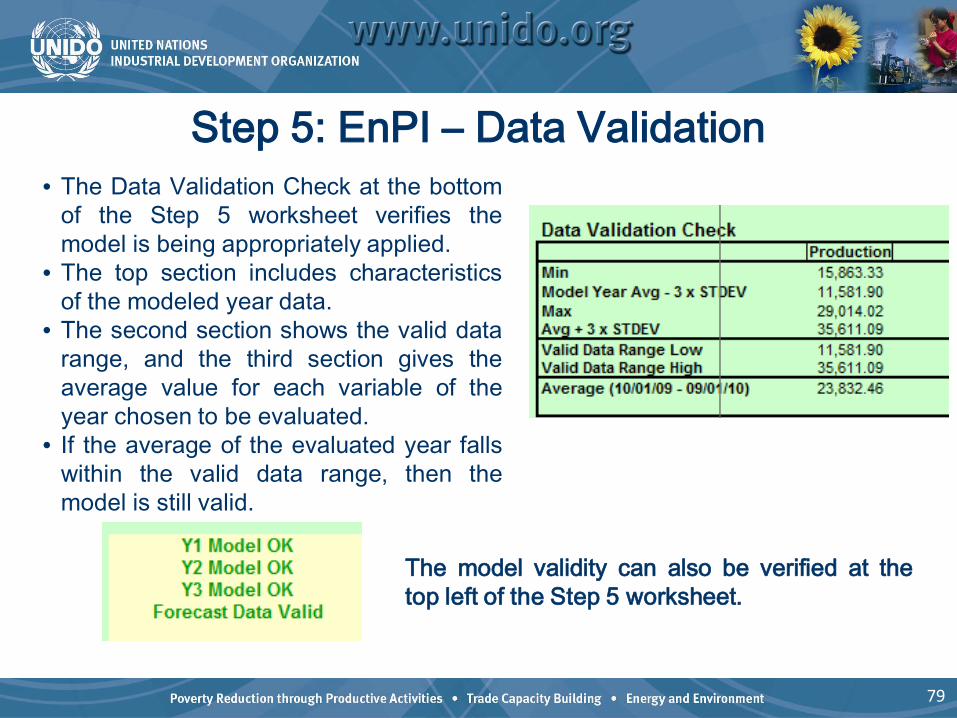
Step 5: EnPI – Data Validation• The Data Validation Check at the bottom
of the Step 5 worksheet verifies themodel is being appropriately applied.
• The top section includes characteristicsof the modeled year data.
• The second section shows the valid datarange, and the third section gives theaverage value for each variable of theyear chosen to be evaluated.
• If the average of the evaluated year fallswithin the valid data range, then themodel is still valid.
The model validity can also be verified at thetop left of the Step 5 worksheet.
79
Exercise: Use the tools with your own data
Establish your own model
Is it good?What does it tell you?
If not good (low R2) what does it tell you?Why is is low?
80

See you in 15 minutes!
81
TopicDuration (hours)
Exercise (mins)
Break duration
Start Time
End Time
DAY 2ER1 Bills and sub-meters 30 30 08:30 09:30ER2 Analyse energy use 30 30 09:30 10:30Break 15 10:30 10:45ER3 Identify and quantify SEUs 30 30 10:45 11:45ER4 Identify and quantify drivers and analyse SEUs 30 30 11:45 12:45
Lunch 45 12:45 13:30ER4 Identify and quantify drivers and analyse SEUs 30 13:30 14:00
ER5 Baseline and EnPIs, EnPI tool 30 45 14:00 15:15Break 15 15:15 15:30ER7 Technical energy audits 15 15:30 15:45ER8 Identify energy saving opportunities 15 40 15:45 16:40TOTALS 2.75 3.25 1.25 82
Planning workflow
1. Energy bill and sub-meter data
2. Analyze past, present and future energy use
7. Technical energy audits
8. Identify opportunities forimproved performance, review and decide on
action plans
6. Review operationalcontrol for all SEUs
4. Identify Drivers, get data and analyze SEUs
3. Identify and quantify Significant Energy Users
(SEUs)
5. Develop baselines andPerformance indicators for
each SEU
83
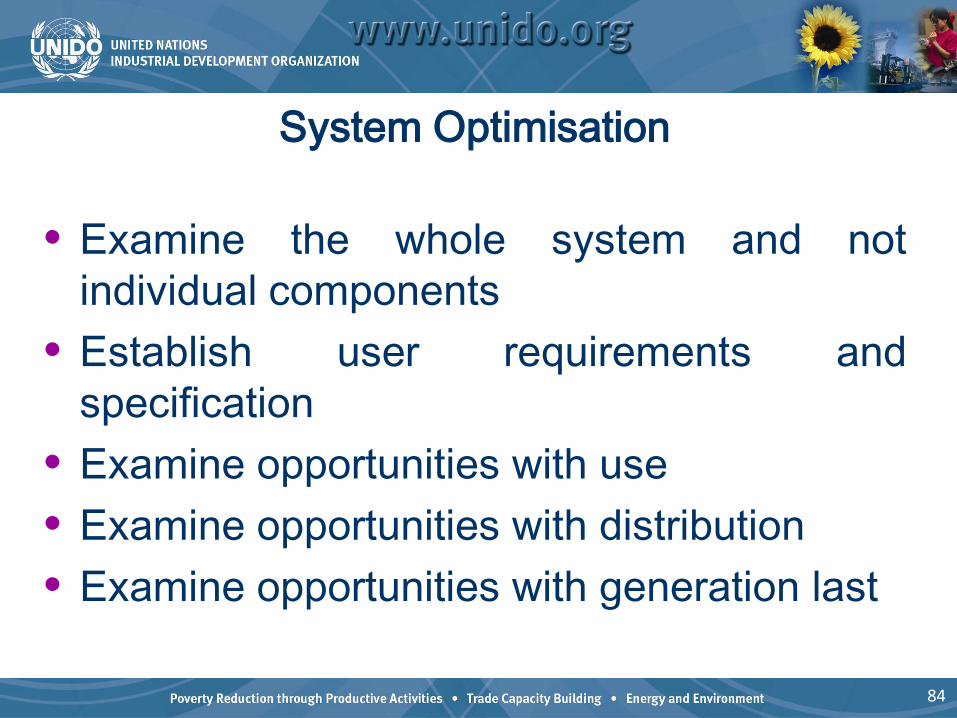
System Optimisation
• Examine the whole system and notindividual components
• Establish user requirements andspecification
• Examine opportunities with use• Examine opportunities with distribution• Examine opportunities with generation last
84
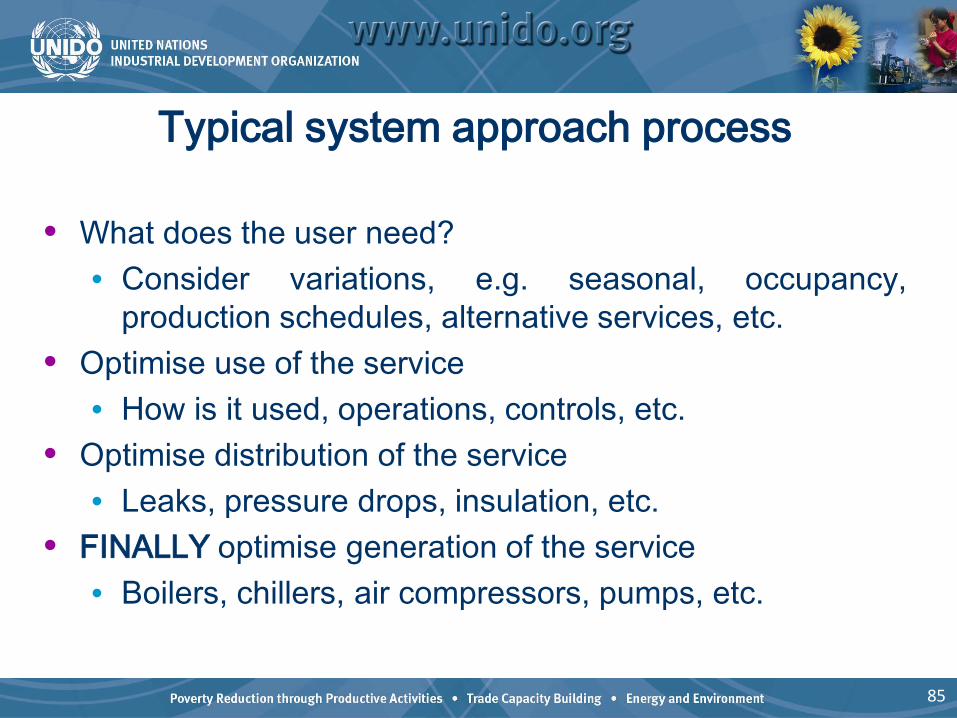
Typical system approach process
• What does the user need?• Consider variations, e.g. seasonal, occupancy,
production schedules, alternative services, etc.• Optimise use of the service
• How is it used, operations, controls, etc.• Optimise distribution of the service
• Leaks, pressure drops, insulation, etc.• FINALLY optimise generation of the service
• Boilers, chillers, air compressors, pumps, etc.
85
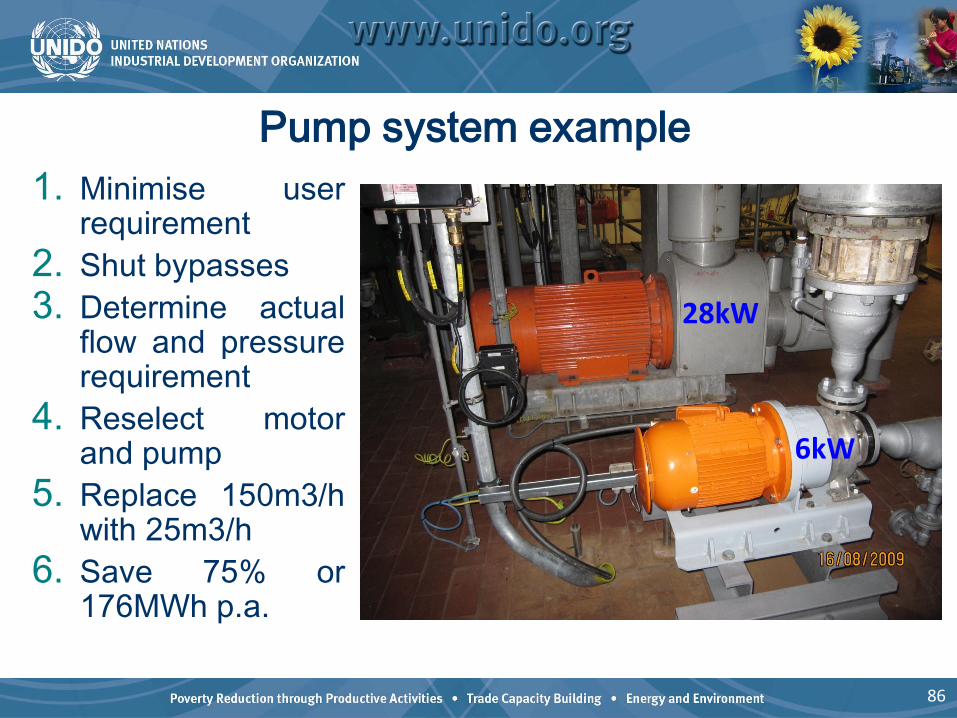
Pump system example1. Minimise user
requirement2. Shut bypasses3. Determine actual
flow and pressurerequirement
4. Reselect motorand pump
5. Replace 150m3/hwith 25m3/h
6. Save 75% or176MWh p.a.
28kW
6kW
86
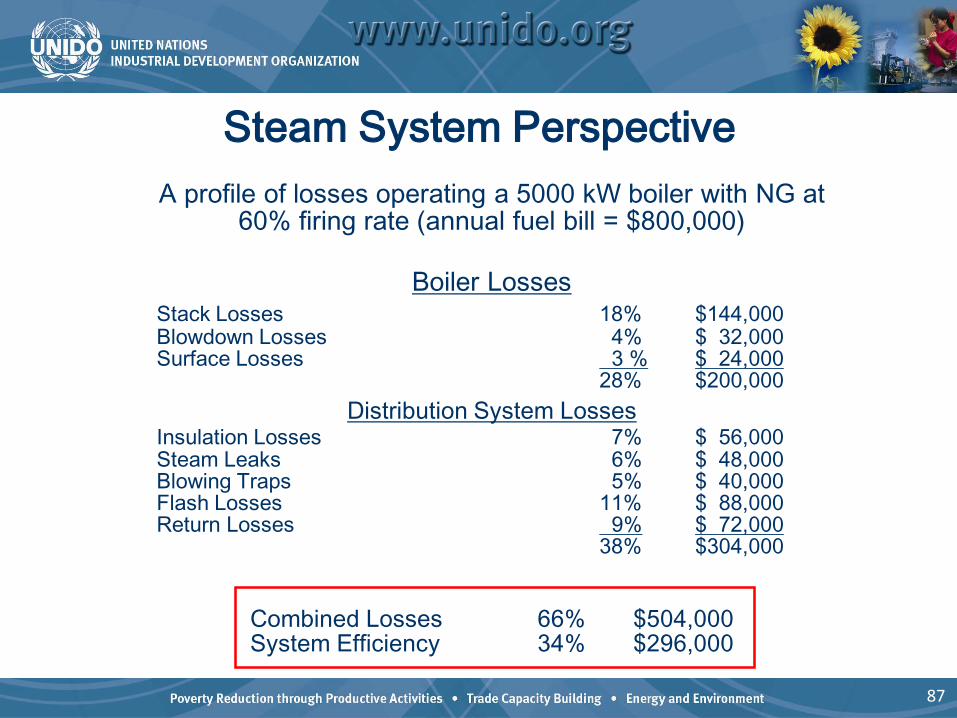
A profile of losses operating a 5000 kW boiler with NG at60% firing rate (annual fuel bill = $800,000)
Boiler LossesStack Losses 18% $144,000Blowdown Losses 4% $ 32,000Surface Losses 3 % $ 24,000
28% $200,000Distribution System Losses
Insulation Losses 7% $ 56,000Steam Leaks 6% $ 48,000Blowing Traps 5% $ 40,000Flash Losses 11% $ 88,000Return Losses 9% $ 72,000
38% $304,000
Combined Losses 66% $504,000System Efficiency 34% $296,000
Steam System Perspective
87

Baseload
• The energy you usewhen there is noproductive activity
• Very often a majoropportunity forimprovement
• Measure andanalyse baseload ifit is significant
Baseload
Production Level (tonnes)
88
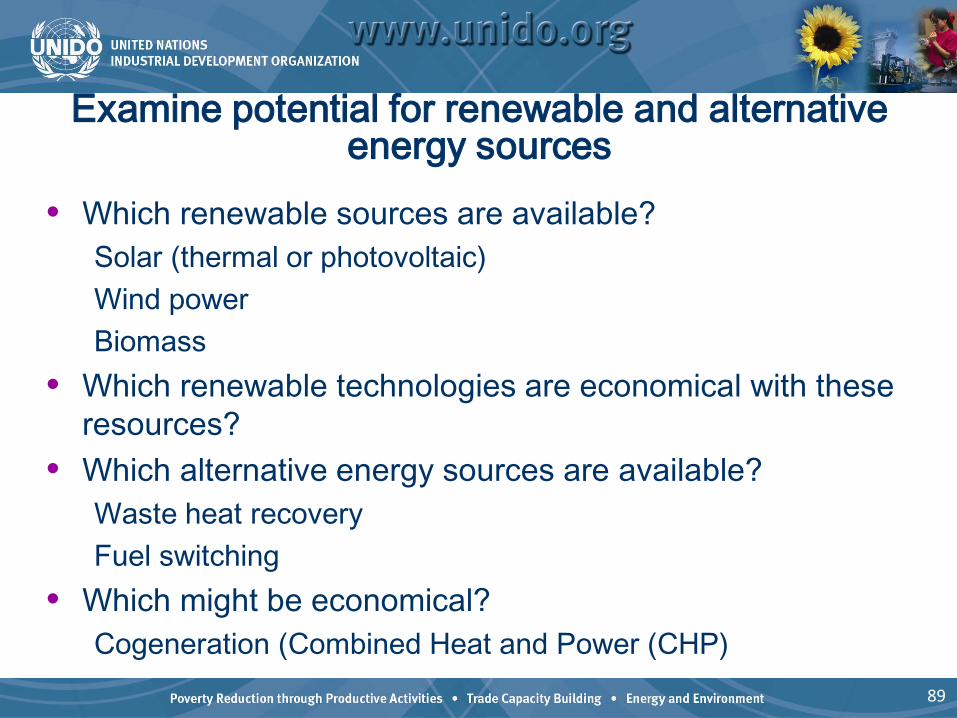
Examine potential for renewable and alternative energy sources
• Which renewable sources are available?Solar (thermal or photovoltaic)Wind powerBiomass
• Which renewable technologies are economical with these resources?
• Which alternative energy sources are available?Waste heat recoveryFuel switching
• Which might be economical?Cogeneration (Combined Heat and Power (CHP)
89
TopicDuration (hours)
Exercise (mins)
Break duration
Start Time
End Time
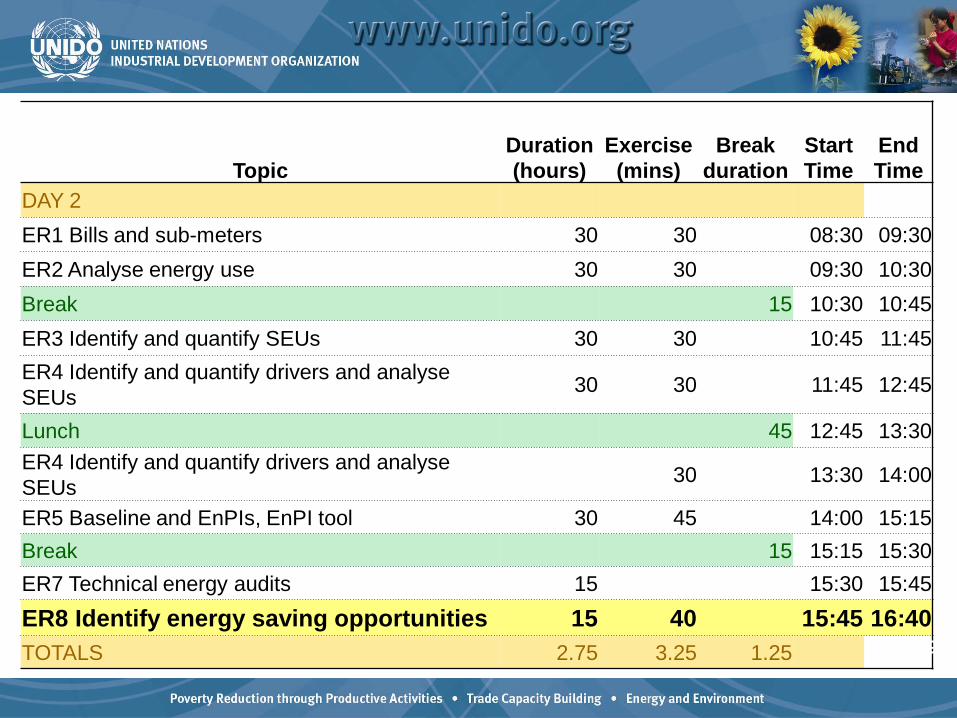
DAY 2ER1 Bills and sub-meters 30 30 08:30 09:30ER2 Analyse energy use 30 30 09:30 10:30Break 15 10:30 10:45ER3 Identify and quantify SEUs 30 30 10:45 11:45ER4 Identify and quantify drivers and analyse SEUs 30 30 11:45 12:45
Lunch 45 12:45 13:30ER4 Identify and quantify drivers and analyse SEUs 30 13:30 14:00
ER5 Baseline and EnPIs, EnPI tool 30 45 14:00 15:15Break 15 15:15 15:30ER7 Technical energy audits 15 15:30 15:45ER8 Identify energy saving opportunities 15 40 15:45 16:40TOTALS 2.75 3.25 1.25 90

Planning workflow
1. Energy bill and sub-meter data
2. Analyze past, present and future energy use
7. Technical energy audits
8. Identify opportunities forimproved performance,
review and decide on action plans
6. Review operationalcontrol for all SEUs
4. Identify Drivers, get data and analyze SEUs
3. Identify and quantify Significant Energy Users
(SEUs)
5. Develop baselines andPerformance indicators
foreach SEU
91
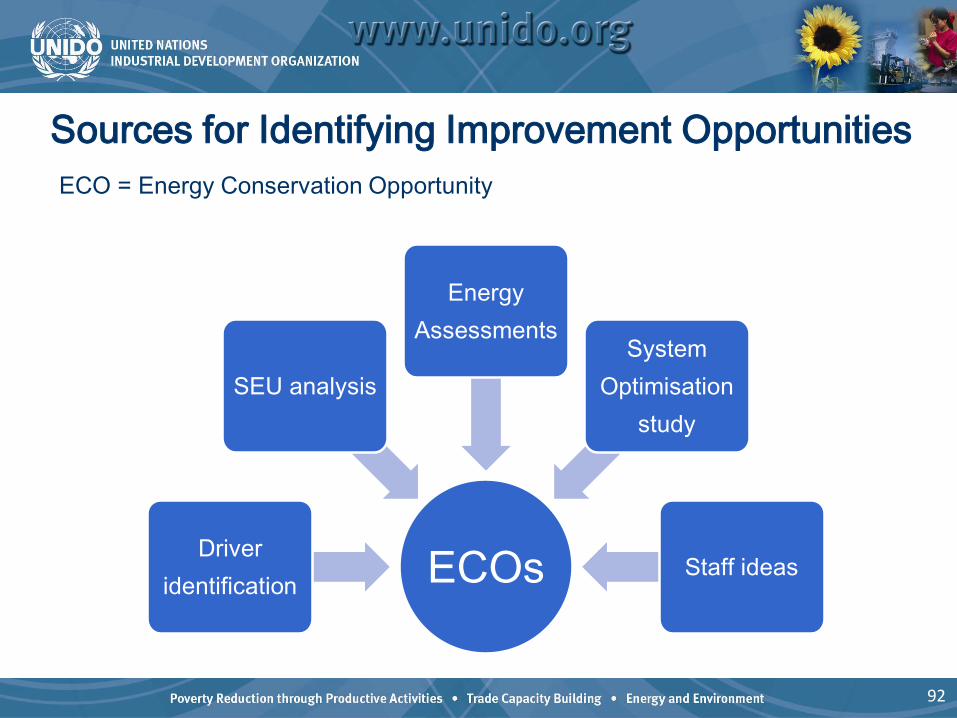
Sources for Identifying Improvement Opportunities
ECOsDriver identification
SEU analysis
Energy Assessments
System Optimisation
study
Staff ideas
ECO = Energy Conservation Opportunity
92
ECO Database
• Develop a list of all potential ideas• Select items for implementation• Plan and manage their implementation
93
• Compile a list of opportunities from energy
assessments, employee suggestions, etc.
• Determine and document prioritization criteria
• Apply the prioritization criteria uniformly to
develop a prioritized list of opportunities
Prioritization of Opportunities
94

Which opportunities to implement?
95
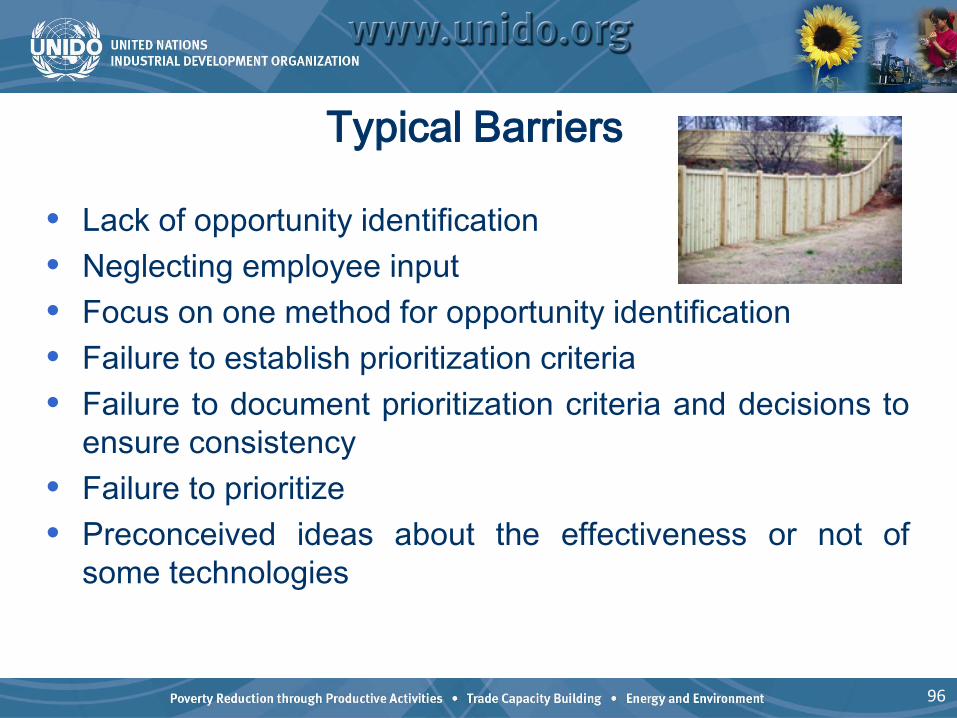
Typical Barriers
• Lack of opportunity identification• Neglecting employee input• Focus on one method for opportunity identification• Failure to establish prioritization criteria• Failure to document prioritization criteria and decisions to
ensure consistency• Failure to prioritize• Preconceived ideas about the effectiveness or not of
some technologies
96
Comprehensive list of opportunities
List of prioritized opportunitiesAdequately focuses
organizational resources
Value to the Organization Identifying Opportunities
97

UNIDO EnMS Expert Training
Module 1
Day 3
1
TopicDuration (hours)
Exercise (mins)
Break duration
Start Time
End Time
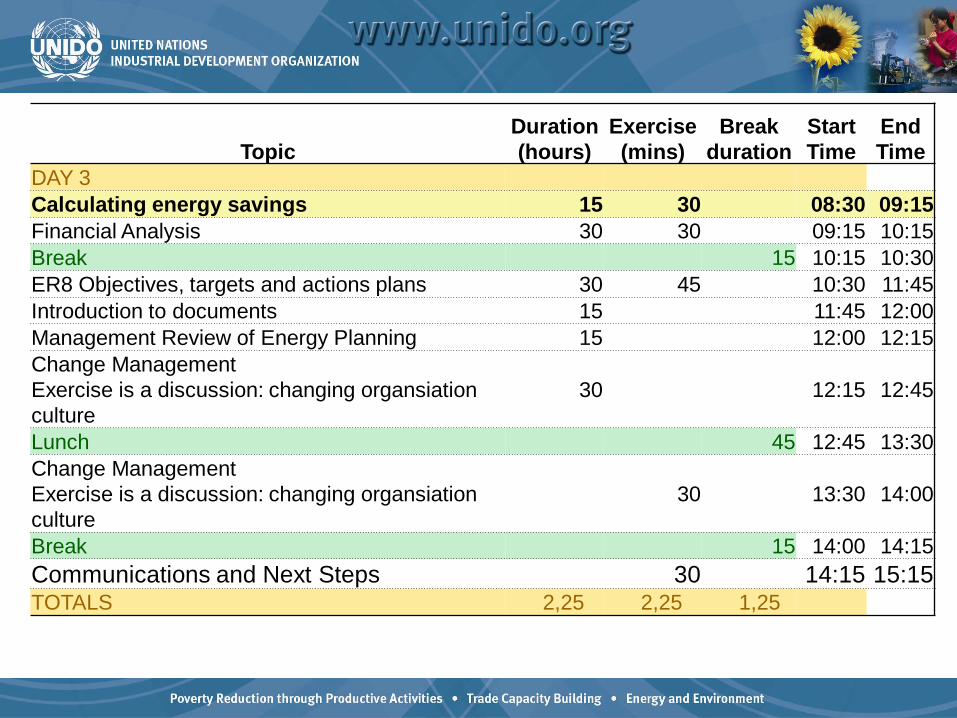
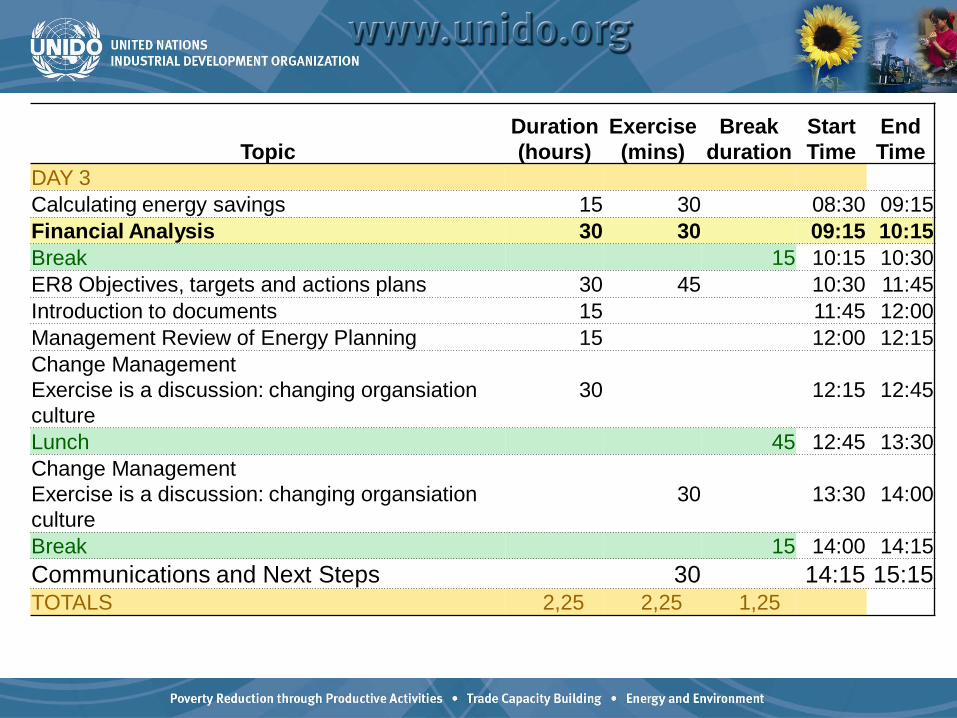
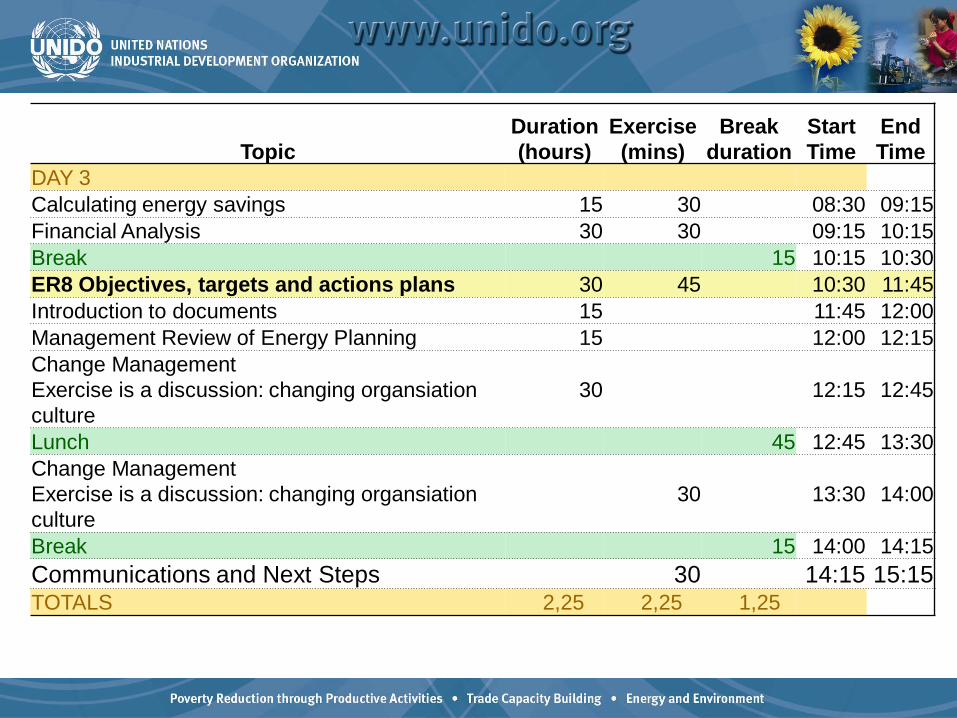
DAY 3Calculating energy savings 15 30 08:30 09:15Financial Analysis 30 30 09:15 10:15Break 15 10:15 10:30ER8 Objectives, targets and actions plans 30 45 10:30 11:45Introduction to documents 15 11:45 12:00Management Review of Energy Planning 15 12:00 12:15Change Management Exercise is a discussion: changing organsiation culture
30 12:15 12:45
Lunch 45 12:45 13:30Change Management Exercise is a discussion: changing organsiation culture
30 13:30 14:00
Break 15 14:00 14:15Communications and Next Steps 30 14:15 15:15TOTALS 2,25 2,25 1,25
2
Energy Saving Calculations
How to measure and verify actual savings from initiatives
3
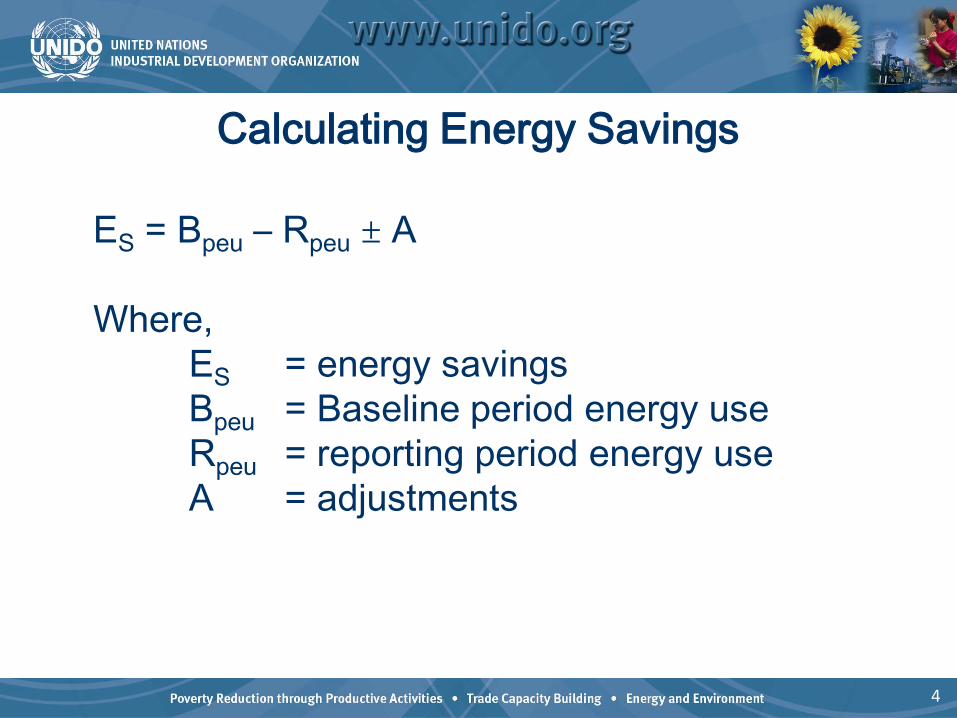
Calculating Energy Savings
No energy savings meter!
ES = Bpeu – Rpeu ± A
Where,ES = energy savingsBpeu = Baseline period energy useRpeu = reporting period energy useA = adjustments
4
4
What is M&V?
M&V= Measurement and Verification
Is the process of determining energy performance
following a defined protocol
Multiple protocols in use
What do you use?
5
5
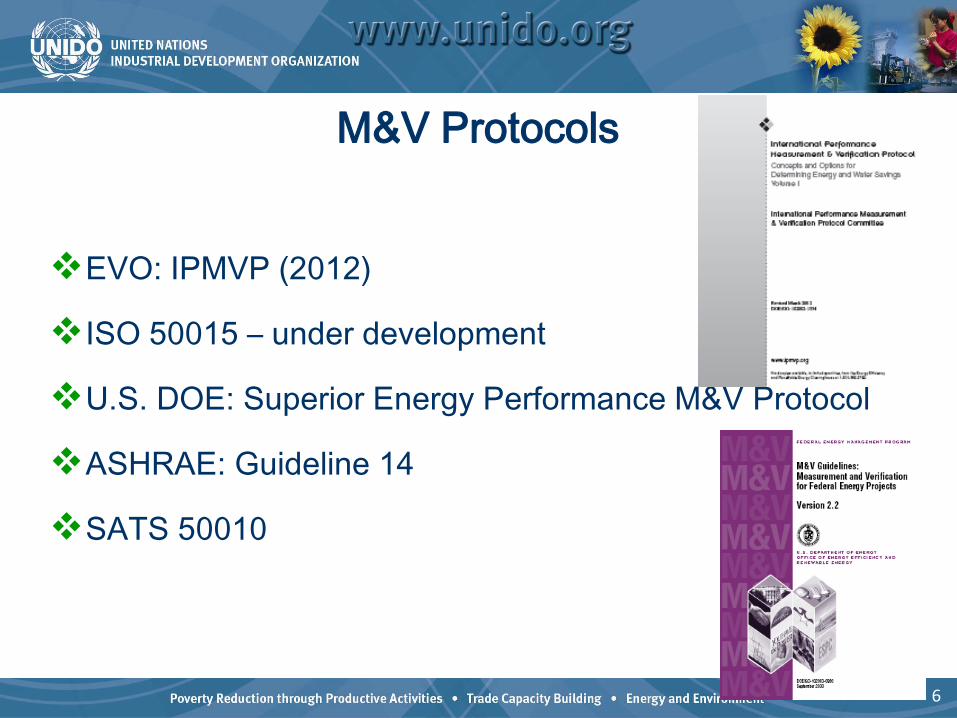
M&V Protocols
EVO: IPMVP (2012)
ISO 50015 – under development
U.S. DOE: Superior Energy Performance M&V Protocol
ASHRAE: Guideline 14
SATS 50010
6
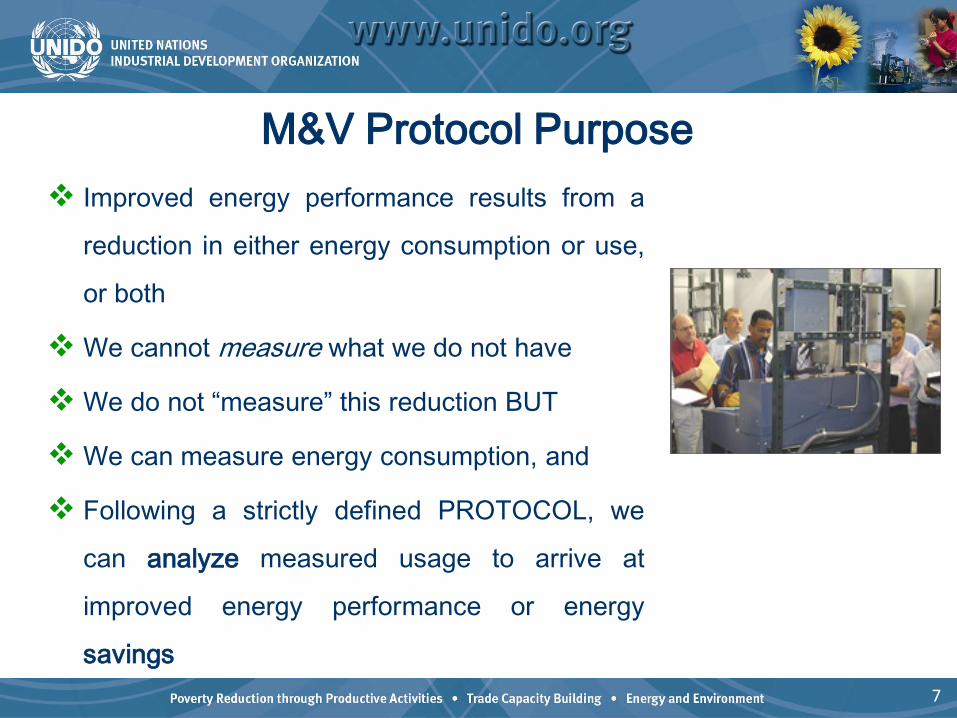
M&V Protocol Purpose Improved energy performance results from a
reduction in either energy consumption or use,
or both
We cannot measure what we do not have
We do not “measure” this reduction BUT
We can measure energy consumption, and
Following a strictly defined PROTOCOL, we
can analyze measured usage to arrive at
improved energy performance or energy
savings7
7
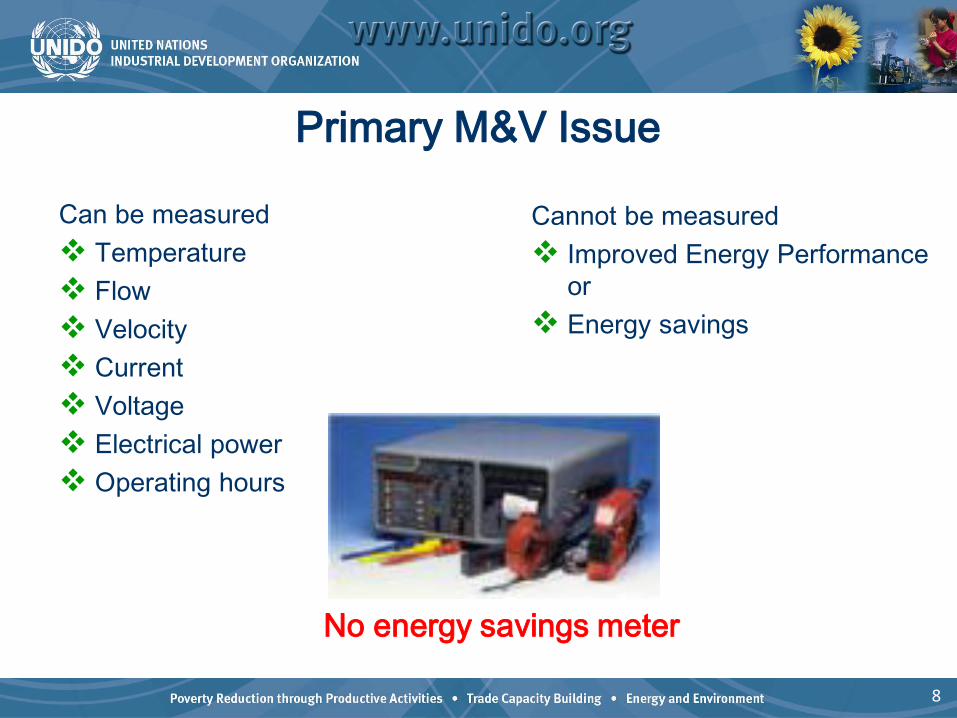
Primary M&V Issue
Can be measured Temperature Flow Velocity Current Voltage Electrical power Operating hours
Cannot be measured Improved Energy Performance
or Energy savings
No energy savings meter!
8
8
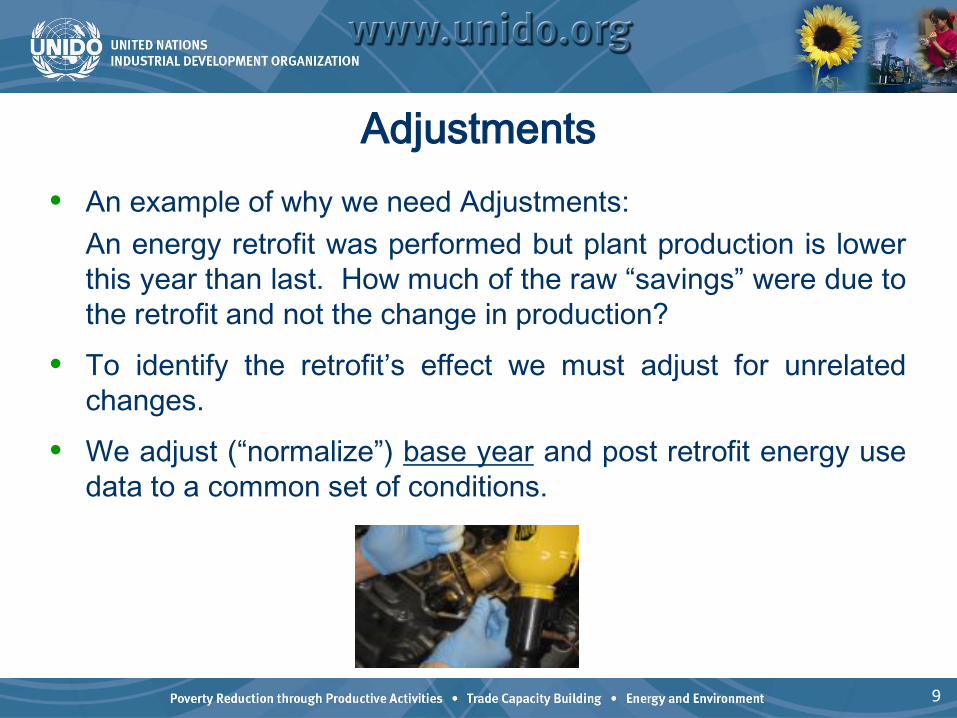
Adjustments• An example of why we need Adjustments:
An energy retrofit was performed but plant production is lowerthis year than last. How much of the raw “savings” were due tothe retrofit and not the change in production?
• To identify the retrofit’s effect we must adjust for unrelatedchanges.
• We adjust (“normalize”) base year and post retrofit energy usedata to a common set of conditions.
9
M&V Cost vs. Uncertainty
There is no absolutely correct savings number.
Every savings number is wrong, but we do notknow the correct value.
10
So, how do you calculate the energy performance improvement for your EnMS?
• Energy performance improvements are due to all of the energysavings occurring within the boundaries of the EnMS
• Some of these savings are due to capital projects• Some of the savings are due to changes in operations and
maintenance• The total savings or energy performance improvement can be
totalized from all of the projects and changes, or• The total savings can be calculated from changes in utility or
revenue meters readings
11
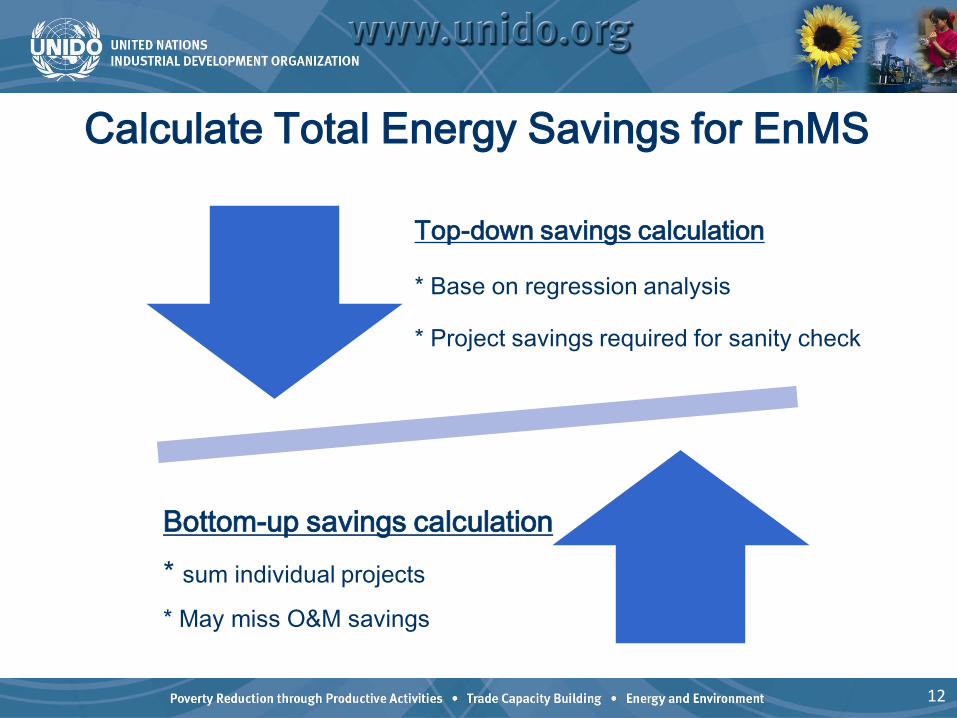
Calculate Total Energy Savings for EnMS
Top-down savings calculation
* Base on regression analysis
* Project savings required for sanity check
Bottom-up savings calculation* sum individual projects
* May miss O&M savings
12

Exercise: Energy Saving Calculations
13
TopicDuration (hours)
Exercise (mins)
Break duration
Start Time
End Time
DAY 3Calculating energy savings 15 30 08:30 09:15Financial Analysis 30 30 09:15 10:15Break 15 10:15 10:30ER8 Objectives, targets and actions plans 30 45 10:30 11:45Introduction to documents 15 11:45 12:00Management Review of Energy Planning 15 12:00 12:15Change Management Exercise is a discussion: changing organsiation culture
30 12:15 12:45
Lunch 45 12:45 13:30Change Management Exercise is a discussion: changing organsiation culture
30 13:30 14:00
Break 15 14:00 14:15Communications and Next Steps 30 14:15 15:15TOTALS 2,25 2,25 1,25
14
What is financial appraisal?• All organisations need to control spending
Current spending (expenses)Capital spending (investment)
• Need to make choices of where to spendSpend; Yes or No?Choose between options for investment in savings projectChoose between options using life cycle cost (LCC)
• Need tools to help with these choices• This is a basic introduction• We will ignore the effects of taxes• We will consider the effects of inflation and interest rates

Some financial choices• Do you buy bread at $1.20 or $1?• Two motors are the same
• One costs $300 and the other $250• Two motors are not the same
• One costs $300 and the other $250• I will give you $1 now or $2 in 12 months time?• Two compressors:
• One costs $5,000 to buy and $10,000 p.a. to operate• The other $6,000 to buy and $9,000 to operate• Which is best?

Simple payback (SPB)
•Advantages•Simple•Quick•Good rule of thumb•Useful as a quick estimate•Useful for low cost opportunities
•Disadvantages•Too simple•What is the effect of the life of the item?•Should not be used for major decisions, either high cost or organisationally critical
•SPB = Cost in $ / Savings in $ p.a.•Usually organisations have a limit e.g. only opportunities with a payback of less than 2 years will be considered
Simple payback (SPB) – Example 1
• Energy Savings that will be made = $1000 p.a.• Cost of modification = $2000• What is the payback?
Simple payback (SPB) – Example 1
• Energy Savings that will be made = $1000 p.a.• Cost of modification = $2000• What is the payback?
• 2 years

Simple payback (SPB) – Example 2
• Energy Savings that will be made = $1000 p.a.• Additional maintenance cost = $500 p.a.• Cost of modification = $500• What is the payback?
Simple payback (SPB) – Example 2
• Energy Savings that will be made = $1000 p.a.• Additional maintenance cost = $500 p.a.• Cost of modification = $500• What is the payback?
1 year

Time value of money• Very important concept• If I offer you the choice of $5,000 now or $800 p.a. for 10
years which would you choose?You need to take into account the option of putting the $5,000 in the
bank and earning interest at say 10%
• Due to inflation money is worth less in the future than it is now• Assume 5% inflation• $100 now is worth $95 in one year
• We need to take this into account• Future savings are worth less than they are now• The reverse may be the case with savings if energy prices
continue to rise
Discount rate (or hurdle rate)
• Need to know discount rate• This is the return the organisation will decide to invest
at• Sometimes increased for more risky projects• Related to the cost the organisation incurs in raising
the capital• Weighted average cost of capital (WACC) (debt and
equity)• Usually your accountant will know the discount rate• Assuming the money is available
Net Present Value (NPV)• Present Value (PV) or present worth (PW)
• The value now of a future amount of money• E.G. $100 in 1 year at 5% inflation has a present value of $95
• NPV is the value now of a future stream of cash flows• Can be incoming or outgoing and is typically a combination of both• Spreadsheets have an NPV function• Typically we spend money now to make a saving• Then we save money in the future on an ongoing basis• In energy terms we save energy each year• We may have extra maintenance costs (or less!)• We may have a salvage value at the end
• If NPV > 0 then it is a viable idea• If you have the money and it is the best NPV available
Internal Rate of return (IRR)
• Very similar to NPV• Doesn’t use discount rate• IRR is the rate of return of the projected cash flows

NPV and IRR calculation
Life cycle cost (LCC)
• Similar to NPV but all cash flows are negative• For example
Two optionsBuy a fixed speed pump for $5,000 and
annual running costs of $7,000ORBuy a variable speed pump for $8,000 and
annual running costs of $3,000
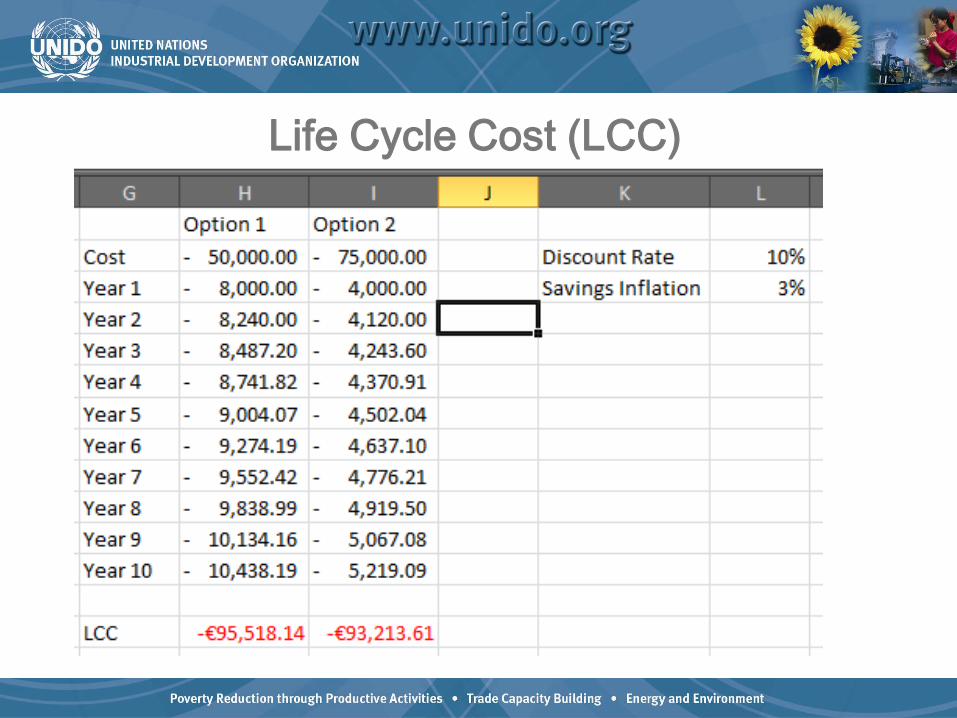
Life Cycle Cost (LCC)
Exercise – Financial appraisal
Each team to consider a real example and perform, payback, NPV and IRR calculations on estimated costs and savings.
Each to comment on financial viability and other barriers.
You need to be able to do this in real life and the exam. Practice.
29

See you in 15 minutes!
30
TopicDuration (hours)
Exercise (mins)
Break duration
Start Time
End Time
DAY 3Calculating energy savings 15 30 08:30 09:15Financial Analysis 30 30 09:15 10:15Break 15 10:15 10:30ER8 Objectives, targets and actions plans 30 45 10:30 11:45Introduction to documents 15 11:45 12:00Management Review of Energy Planning 15 12:00 12:15Change Management Exercise is a discussion: changing organsiation culture
30 12:15 12:45
Lunch 45 12:45 13:30Change Management Exercise is a discussion: changing organsiationculture
30 13:30 14:00
Break 15 14:00 14:15Communications and Next Steps 30 14:15 15:15TOTALS 2,25 2,25 1,25
31
Planning workflow
1. Energy bill and sub-meter data
2. Analyze past, present and future energy use
7. Technical energy audits
8. Identify opportunities forimproved performance,
review and decide on action plans
6. Review operationalcontrol for all SEUs
4. Identify Drivers, get data and analyze SEUs
3. Identify and quantify Significant Energy Users
(SEUs)
5. Develop baselines andPerformance indicators
foreach SEU
32
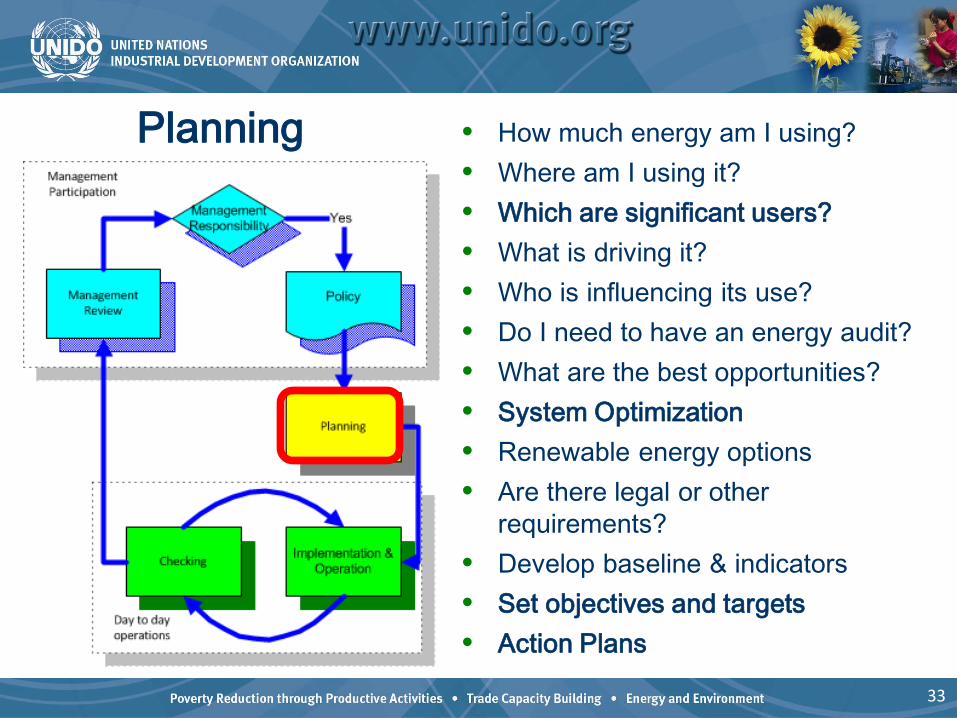
Planning • How much energy am I using?• Where am I using it?• Which are significant users?• What is driving it?• Who is influencing its use?• Do I need to have an energy audit?• What are the best opportunities?• System Optimization• Renewable energy options• Are there legal or other
requirements?• Develop baseline & indicators• Set objectives and targets• Action Plans
33
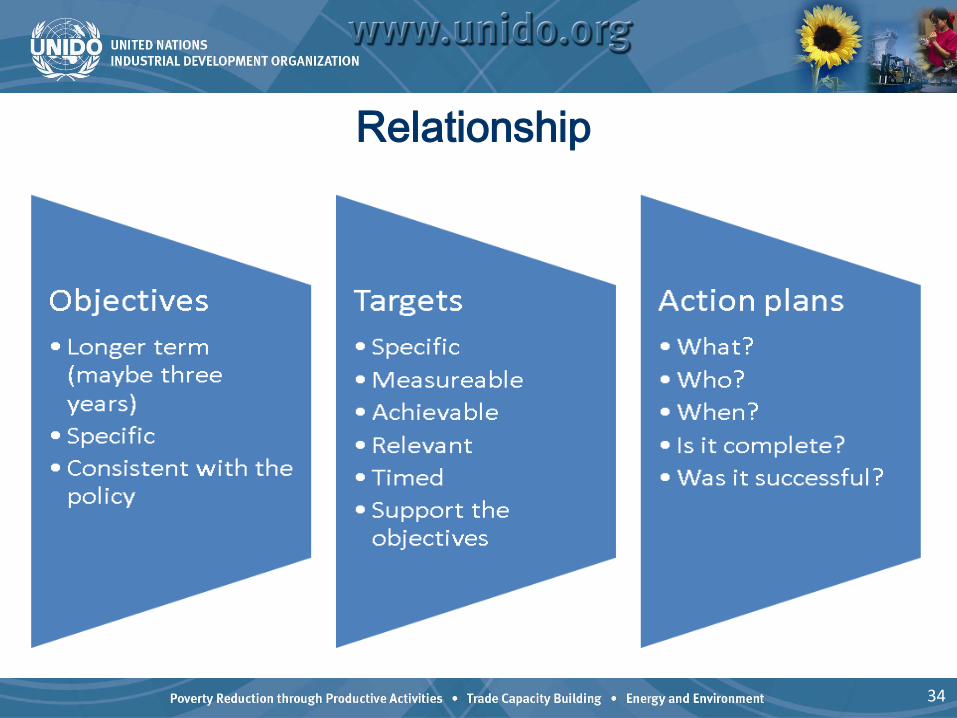
Relationship
34
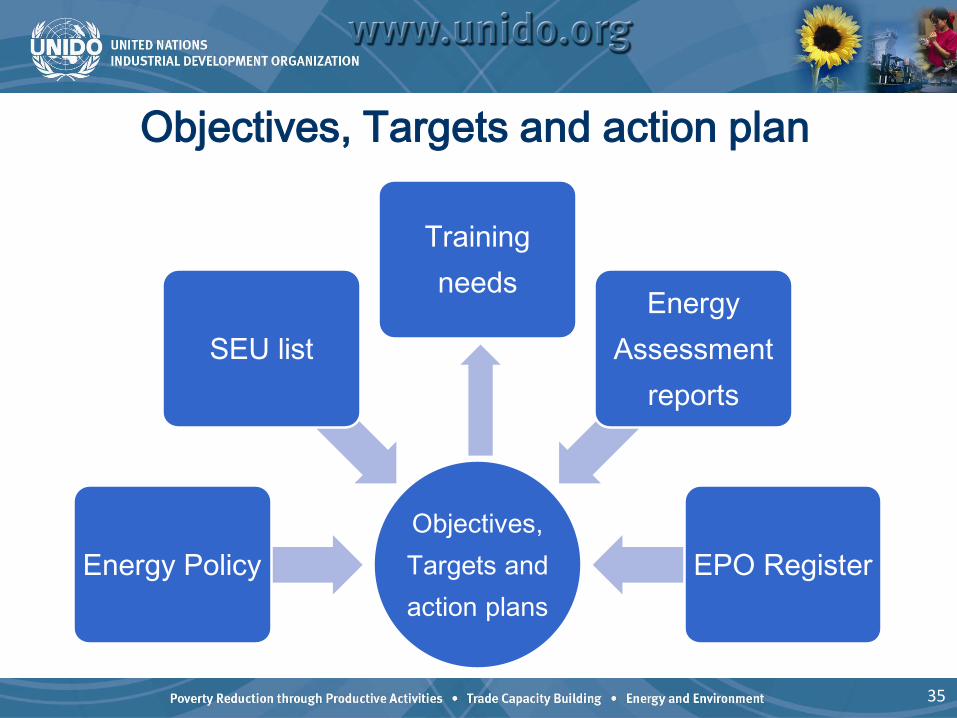
Objectives, Targets and action plan
Objectives, Targets and action plans
Energy Policy
SEU list
Training needs Energy
Assessment reports
EPO Register
35
• Objective: Reduce facilityelectricity costs by 20% overthe next two years.
• Objective: Reduce facilitynatural gas usage by 15% in2012.
• Objective: Reduce facility-wide energy usage by 25% by2020
Examples
36
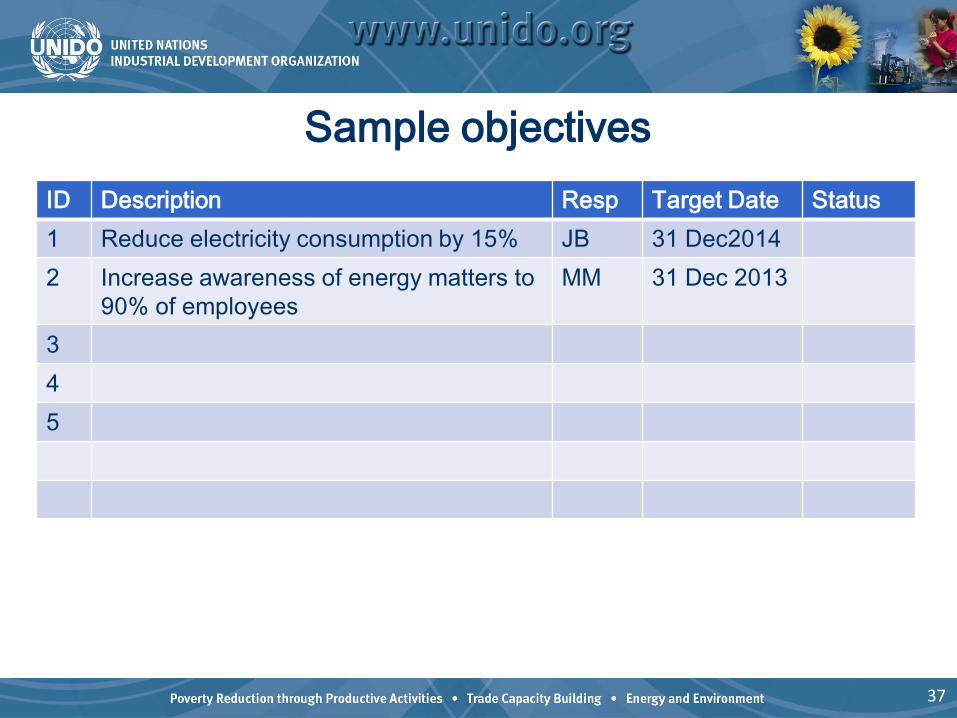
Sample objectivesID Description Resp Target Date Status1 Reduce electricity consumption by 15% JB 31 Dec20142 Increase awareness of energy matters to
90% of employeesMM 31 Dec 2013
345
37
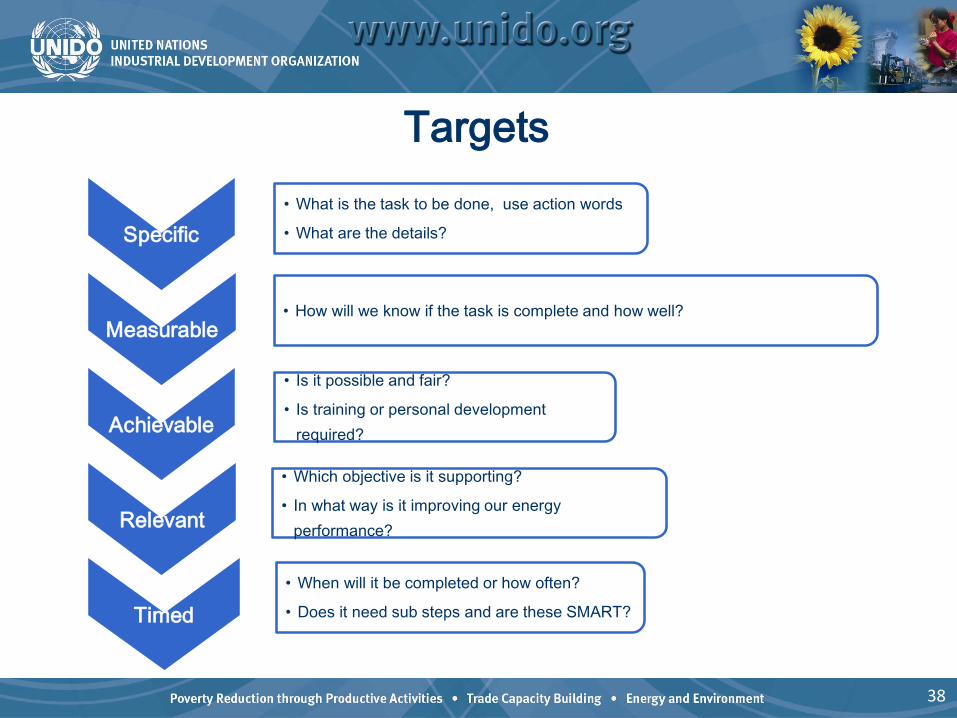
Targets
Specific• What is the task to be done, use action words
• What are the details?
Measurable• How will we know if the task is complete and how well?
Achievable
• Is it possible and fair?
• Is training or personal development required?
Relevant
• Which objective is it supporting?
• In what way is it improving our energy performance?
Timed• When will it be completed or how often?
• Does it need sub steps and are these SMART?
38
•Target: By end of 2010, reduce electricalenergy use in production andadministrative operations by 2% from 2009baseline.
•Target: By end of 2010, reduce naturalgas usage in production operations by 1%from 2009 baseline.
•Target: Reduce natural gas usage inboiler house by 25% in 2012.
•Target: Reduce compressed air usage toallow one compressor to be taken off-linein January 2011.
Examples
39
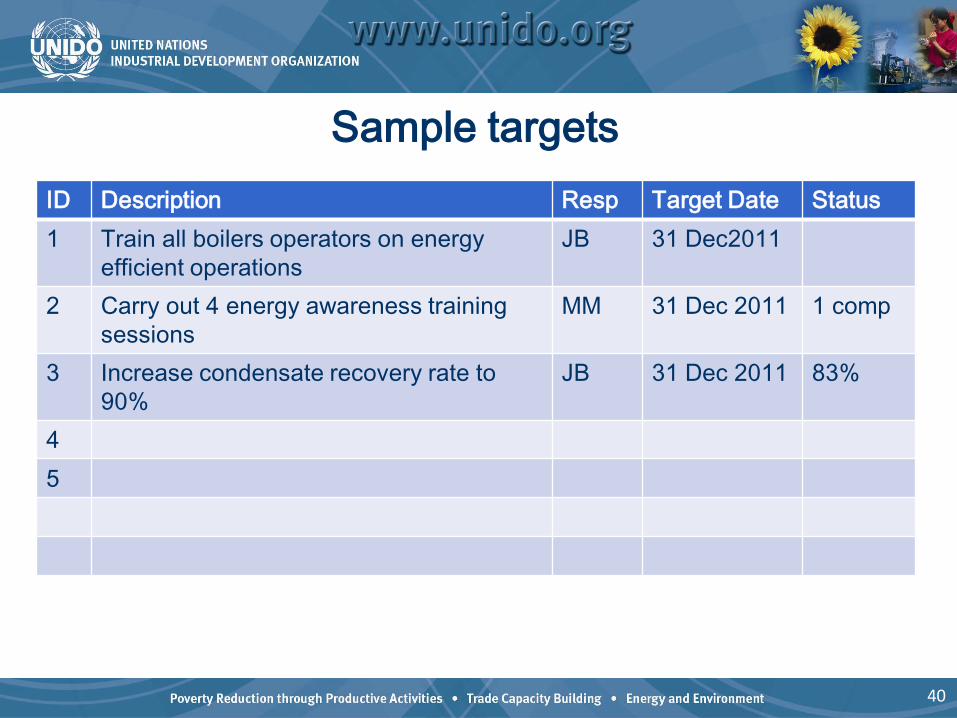
Sample targetsID Description Resp Target Date Status1 Train all boilers operators on energy
efficient operationsJB 31 Dec2011
2 Carry out 4 energy awareness training sessions
MM 31 Dec 2011 1 comp
3 Increase condensate recovery rate to 90%
JB 31 Dec 2011 83%
45
40
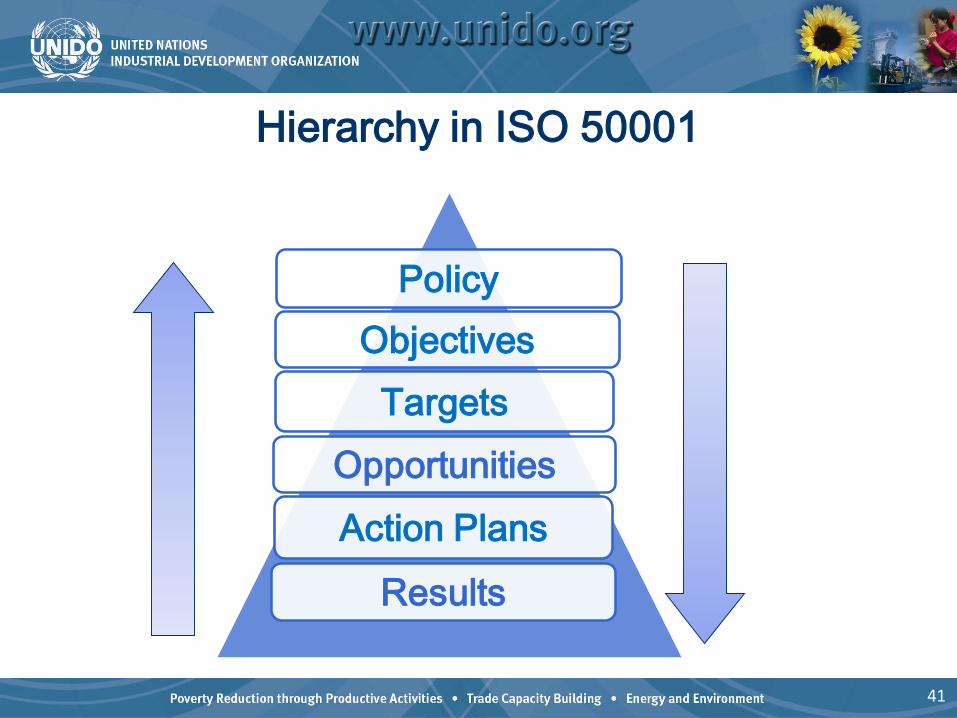
Hierarchy in ISO 50001
PolicyObjectives
TargetsOpportunitiesAction Plans
Results
41

Exercise:Develop potential objectives and
targets for your EnMS
Complete this exercise for real over
the coming months
42
ER8 Action Plans
43

Exercise:
Develop potential action plans for
your organisation
44
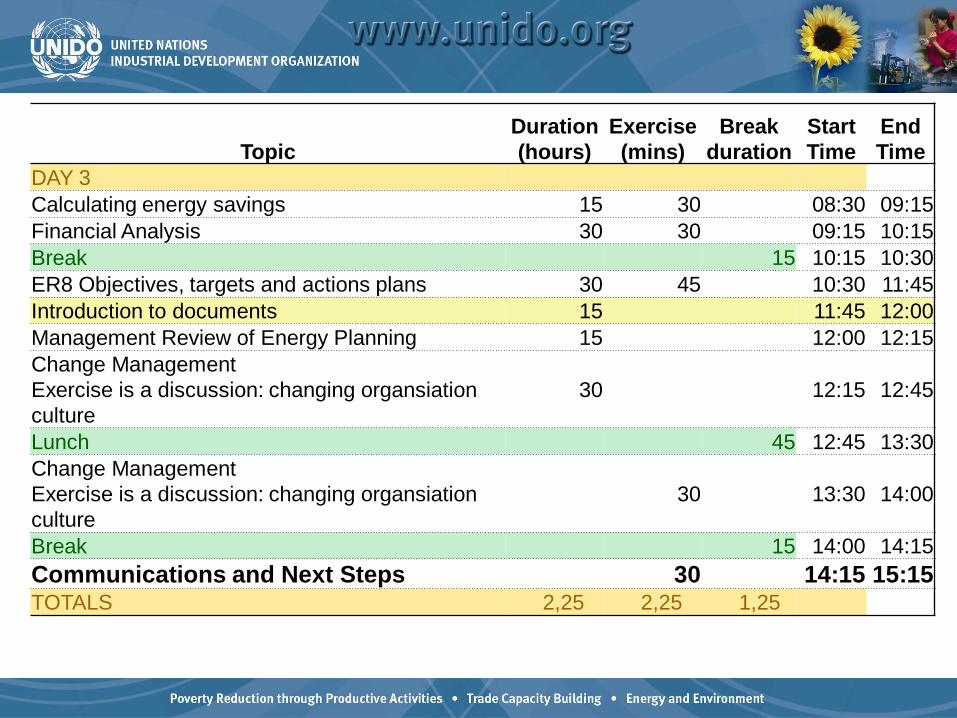
TopicDuration (hours)
Exercise (mins)
Break duration
Start Time
End Time
DAY 3Calculating energy savings 15 30 08:30 09:15Financial Analysis 30 30 09:15 10:15Break 15 10:15 10:30ER8 Objectives, targets and actions plans 30 45 10:30 11:45Introduction to documents 15 11:45 12:00Management Review of Energy Planning 15 12:00 12:15Change Management Exercise is a discussion: changing organsiation culture
30 12:15 12:45
Lunch 45 12:45 13:30Change Management Exercise is a discussion: changing organsiation culture
30 13:30 14:00
Break 15 14:00 14:15Communications and Next Steps 30 14:15 15:15TOTALS 2,25 2,25 1,25
45
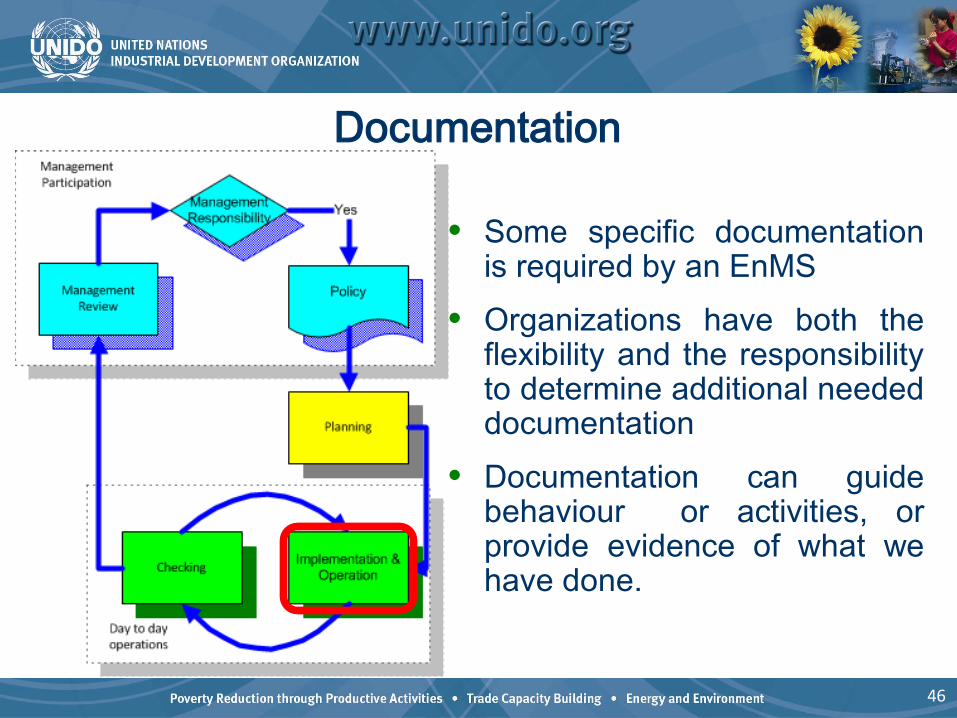
Documentation
• Some specific documentationis required by an EnMS
• Organizations have both theflexibility and the responsibilityto determine additional neededdocumentation
• Documentation can guidebehaviour or activities, orprovide evidence of what wehave done.
46
DOCUMENTATION = INFORMATION
There are two basic types of documentation:• Documents provide information about the
present (say what you do)• Records provide information about the past
(prove you did what you said)
47
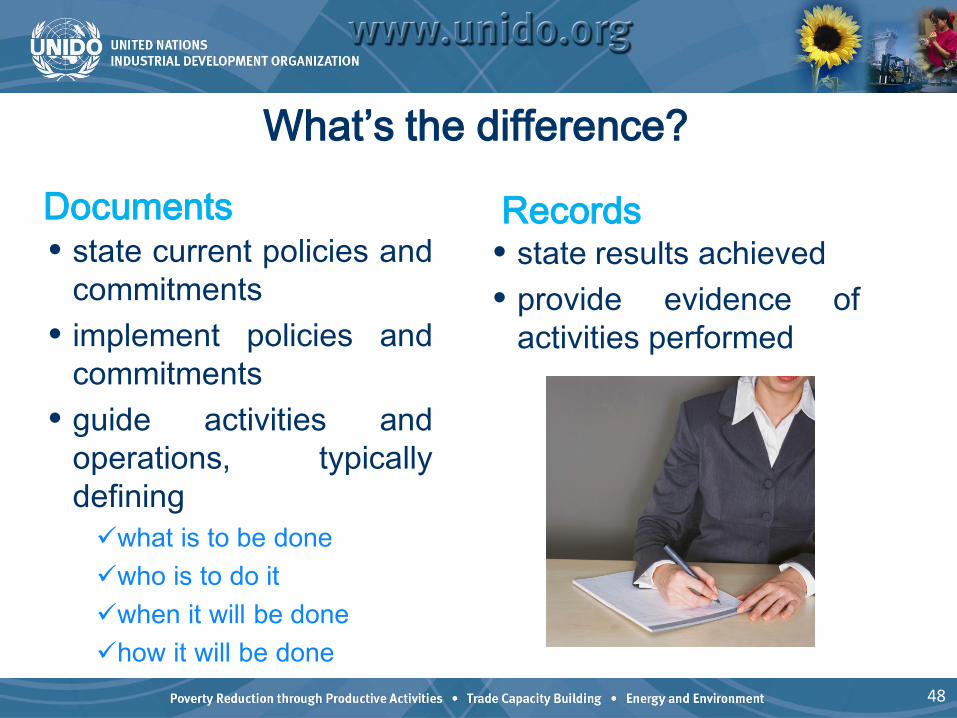
Documents• state current policies and
commitments• implement policies and
commitments• guide activities and
operations, typicallydefiningwhat is to be donewho is to do itwhen it will be donehow it will be done
Records• state results achieved• provide evidence of
activities performed
What’s the difference?
48
48
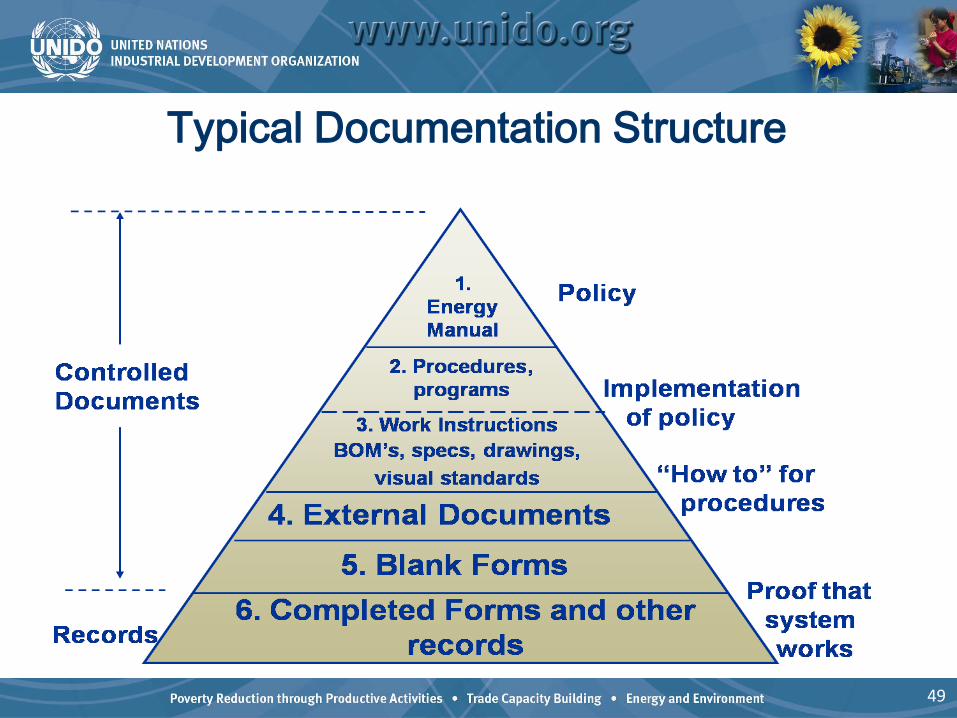
Typical Documentation Structure
49

•Scope and boundaries•Description of core
elements and their interaction
•Energy policy•Energy objectives and
targets•Energy management action
plans
• Methodology and criteria used to develop the energy review
• Methodology for determining and updating the EnPIs
• Other documents determined necessary
Examples of EnMS Documents
50

Typical Barriers
• Organizational culture• Document nothing• Document everything
51
• Provide guidance for employees in new roles
• Consistency in tasks or activities performed
• Communicate expectations to contractors and suppliers
• May facilitate training and understanding
Documents—Value to the Organization
52
• Completed forms• Reports• Data analyses• Meeting minutes• Training certificates
Generic Examples of Records
53
53
• Energy review, baseline, EnPIs• Training records• Decision regarding external communication• Results of design activity• Monitoring and measurement results• Audit results• Management review records
Examples of EnMS Records
54
• Ensures clear evidence of activities and results
• Provides basis for data analysis
• Can serve as “organizational memory” for those who come later
Records—Value to the Organization
55
Exercise - Document list
• Consider using the roles and responsibilities tab of the tools as your document list.
• It has all the tasks that you need to complete to have an effective EnMS
• There is a column for documents. This could be developed.
• If you do this then the document tab becomes redundant and can be deleted or hidden.
• Start developing this list for the parts of the EnMS considered so far.
56
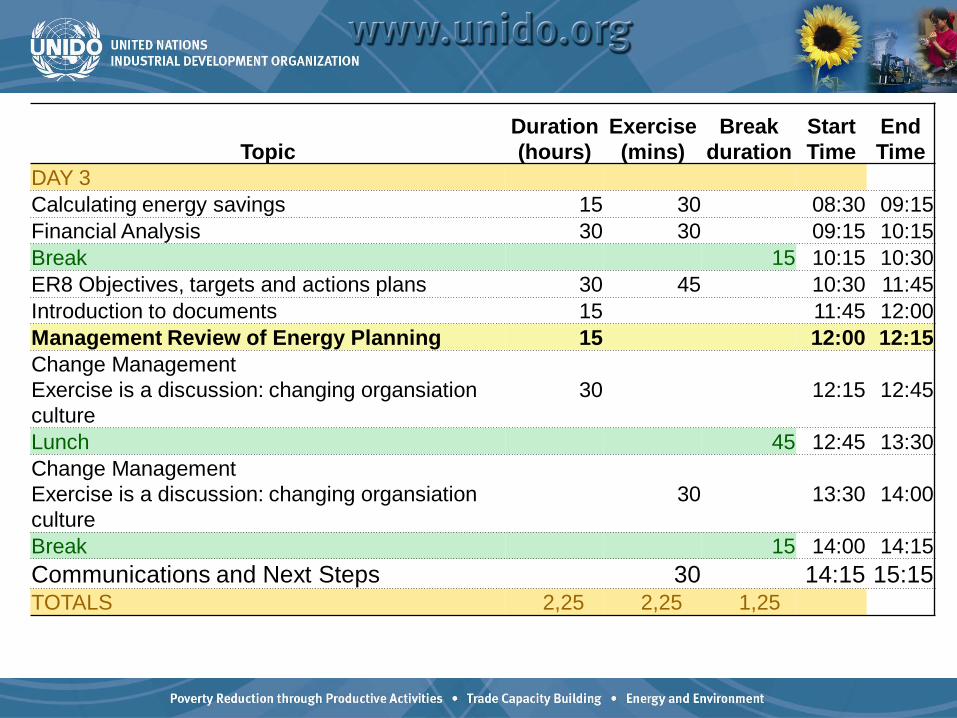
TopicDuration (hours)
Exercise (mins)
Break duration
Start Time
End Time
DAY 3Calculating energy savings 15 30 08:30 09:15Financial Analysis 30 30 09:15 10:15Break 15 10:15 10:30ER8 Objectives, targets and actions plans 30 45 10:30 11:45Introduction to documents 15 11:45 12:00Management Review of Energy Planning 15 12:00 12:15Change Management Exercise is a discussion: changing organsiationculture
30 12:15 12:45
Lunch 45 12:45 13:30Change Management Exercise is a discussion: changing organsiation culture
30 13:30 14:00
Break 15 14:00 14:15Communications and Next Steps 30 14:15 15:15TOTALS 2,25 2,25 1,25
57

Continue to build management support
58

Communicate with management
• Inform management of progress• Ask for support• Inform about issues/problems• Ask for decisions
59
Discussion on management support
• Slides from user training cover this topic very well.• Discuss barriers, issues, why this can be so important.
60
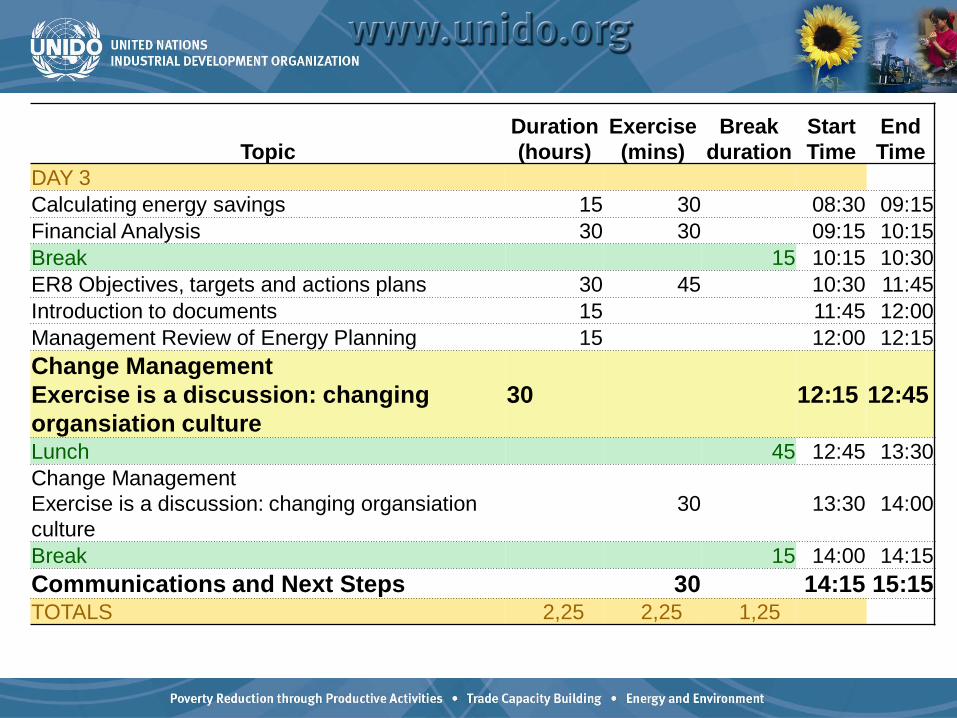
TopicDuration (hours)
Exercise (mins)
Break duration
Start Time
End Time
DAY 3Calculating energy savings 15 30 08:30 09:15Financial Analysis 30 30 09:15 10:15Break 15 10:15 10:30ER8 Objectives, targets and actions plans 30 45 10:30 11:45Introduction to documents 15 11:45 12:00Management Review of Energy Planning 15 12:00 12:15Change Management Exercise is a discussion: changingorgansiation culture
30 12:15 12:45
Lunch 45 12:45 13:30Change Management Exercise is a discussion: changing organsiation culture
30 13:30 14:00
Break 15 14:00 14:15Communications and Next Steps 30 14:15 15:15TOTALS 2,25 2,25 1,25
61
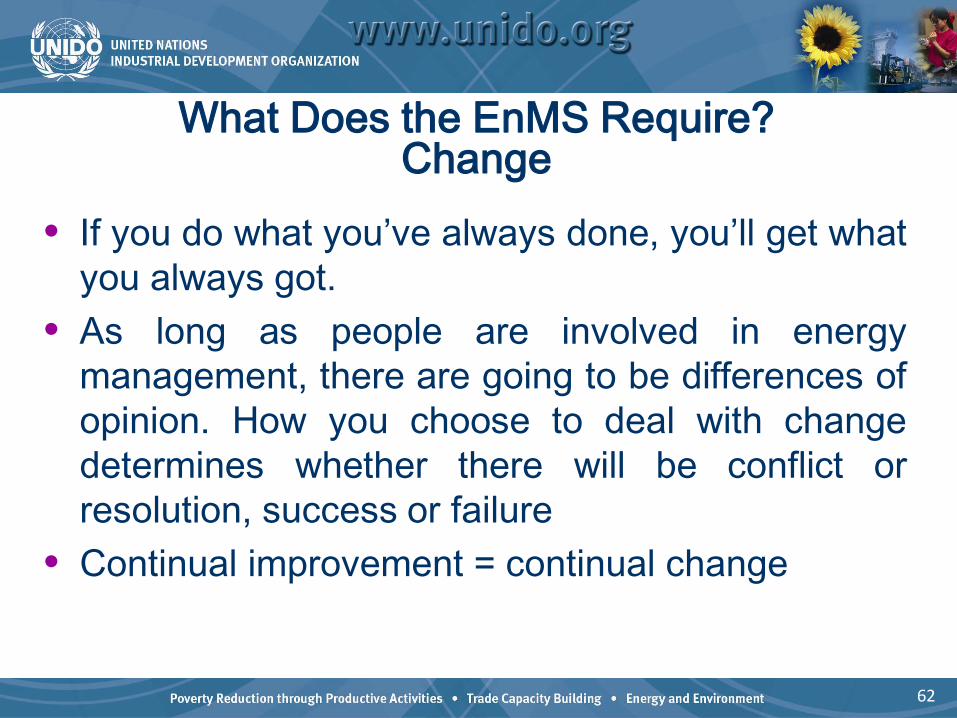
• If you do what you’ve always done, you’ll get whatyou always got.
• As long as people are involved in energymanagement, there are going to be differences ofopinion. How you choose to deal with changedetermines whether there will be conflict orresolution, success or failure
• Continual improvement = continual change
What Does the EnMS Require? Change
62
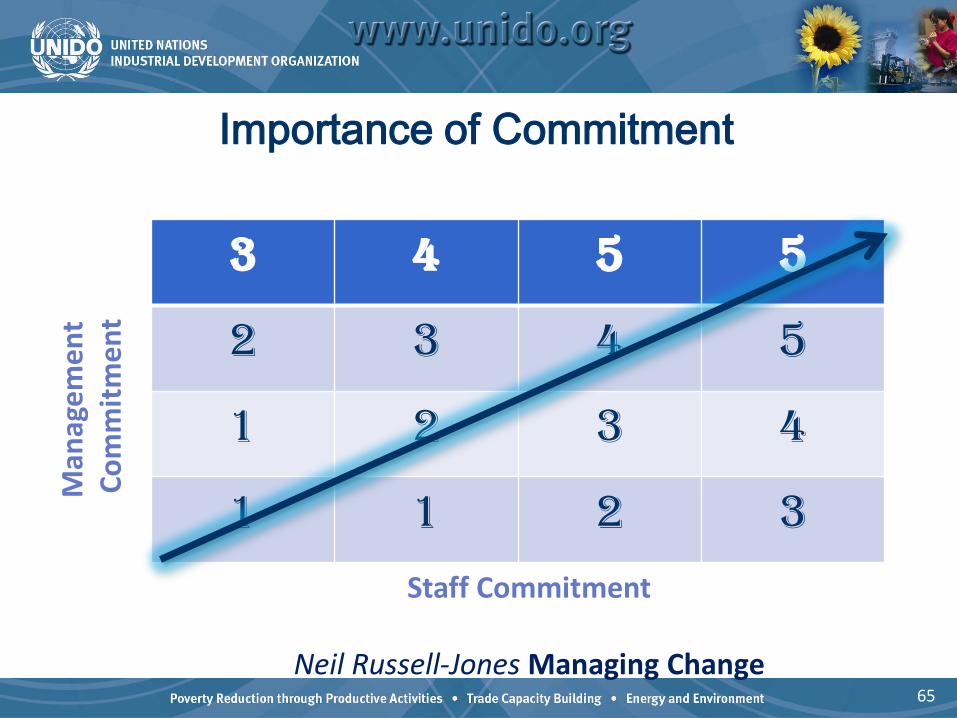
Importance of Commitment
3 4 5 5
2 3 4 5
1 2 3 4
1 1 2 3
Staff Commitment
Neil Russell-Jones Managing Change
Man
agem
ent
Com
mitm
ent
65
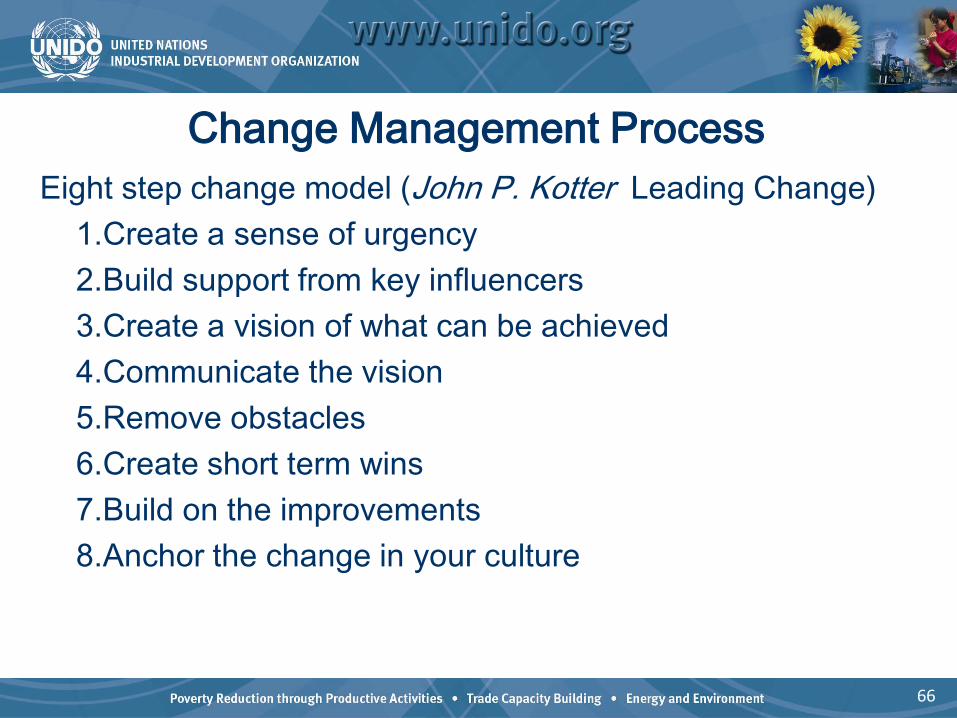
Eight step change model (John P. Kotter Leading Change)1.Create a sense of urgency 2.Build support from key influencers 3.Create a vision of what can be achieved 4.Communicate the vision 5.Remove obstacles 6.Create short term wins 7.Build on the improvements 8.Anchor the change in your culture
Change Management Process
66
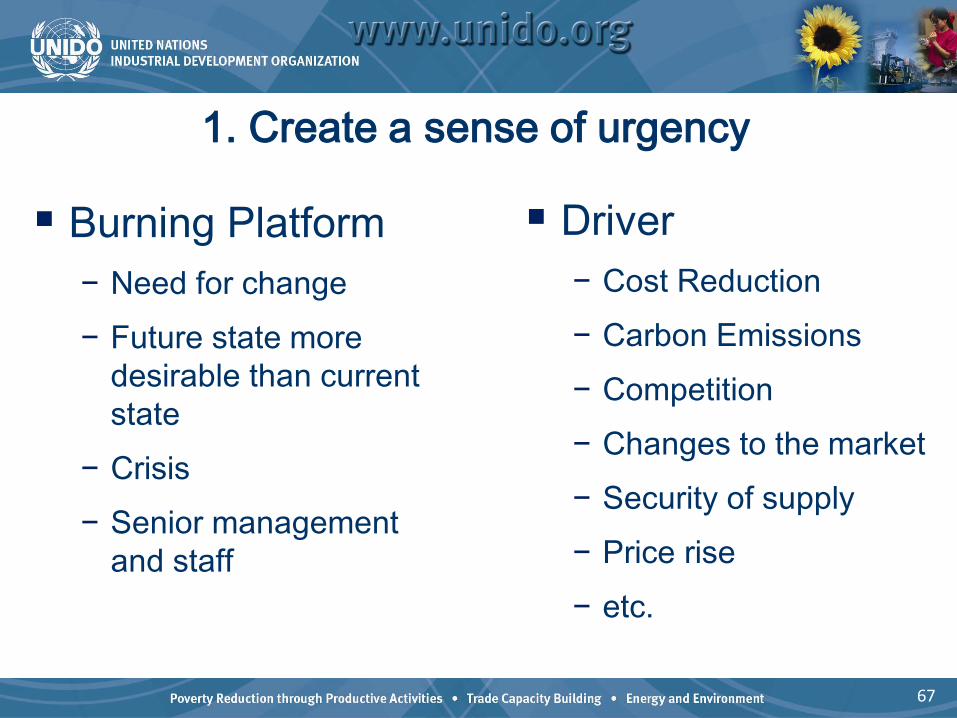
Burning Platform− Need for change− Future state more
desirable than current state
− Crisis− Senior management
and staff
1. Create a sense of urgency
Driver− Cost Reduction− Carbon Emissions− Competition− Changes to the market− Security of supply− Price rise− etc.
67
2. Build support from key influencers
Support− Management− Employees− About bringing people
with you on change journey
− Momentum
Key Personnel− Influencers of change− Production− Quality− Engineering− Employee
Representatives
68
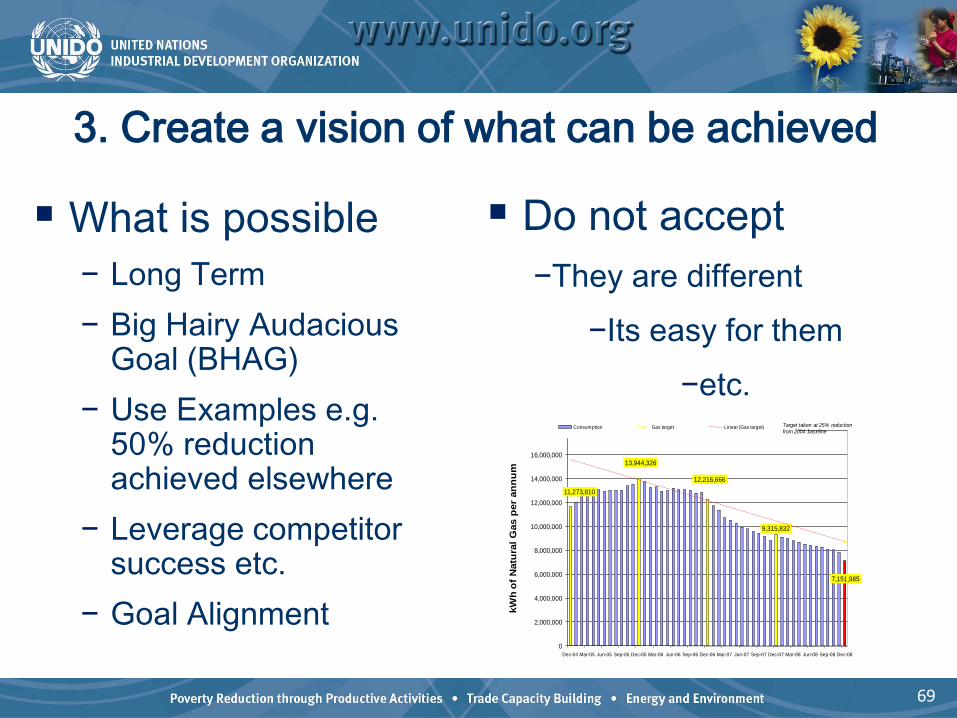
3. Create a vision of what can be achieved
What is possible− Long Term− Big Hairy Audacious
Goal (BHAG)− Use Examples e.g.
50% reduction achieved elsewhere
− Leverage competitor success etc.
− Goal Alignment
11,273,810
13,944,326
12,216,666
9,315,832
7,151,985
0
2,000,000
4,000,000
6,000,000
8,000,000
10,000,000
12,000,000
14,000,000
16,000,000
18,000,000
Dec-04 Mar-05 Jun-05 Sep-05 Dec-05 Mar-06 Jun-06 Sep-06 Dec-06 Mar-07 Jun-07 Sep-07 Dec-07 Mar-08 Jun-08 Sep-08 Dec-08
kWh
of N
atur
al G
as p
er a
nnum
Consumption Gas target Linear (Gas target) Target taken at 25% reduction from 2004 baseline
Do not accept−They are different
−Its easy for them−etc.
69

4. Communicate the vision
The 5 W’s− Who should be told− When to communicate− What is the message− Where will it be
delivered− Who is responsible− Non Verbal
The Critical Steps− Everyone (SEU’s etc)− As early as possible− Vision, targets, policy − Reports, posters
meetings etc.−Management rep etc,−Walk the talk
70
5. Remove obstacles
What barriers?− No need for change− Too busy− Threatened by change − Politics− We heard it all before− ……….
What solutions?− Step 1 sense of urgency− Commitment− Communication− Negotiation− Prove them wrong− ……….
71
6. Create short term wins
Opportunities− Easily implemented− Highly visible− Large impact− Low investment− Focus on the blockers
What kind− Compressed air leaks− PIR on lighting− Boiler house noise
reduction− Reduced heat in
process area− Win over the non
believers
72
7. Build on the improvements
Action Plans− Stakeholder
involvement− More technical projects− Larger teams− Communication− Relentless focus
Focus on the Vision− Regular engagement− Take on bigger
improvements− Engage with more
personnel− Continue
communicating− Not a project
73
8. Anchor the change in your culture
Relentless Focus− Re-evaluate the vision− Communication− Not a Project− Need to make it the
new culture− Make the switch to
sustainability permanent
74
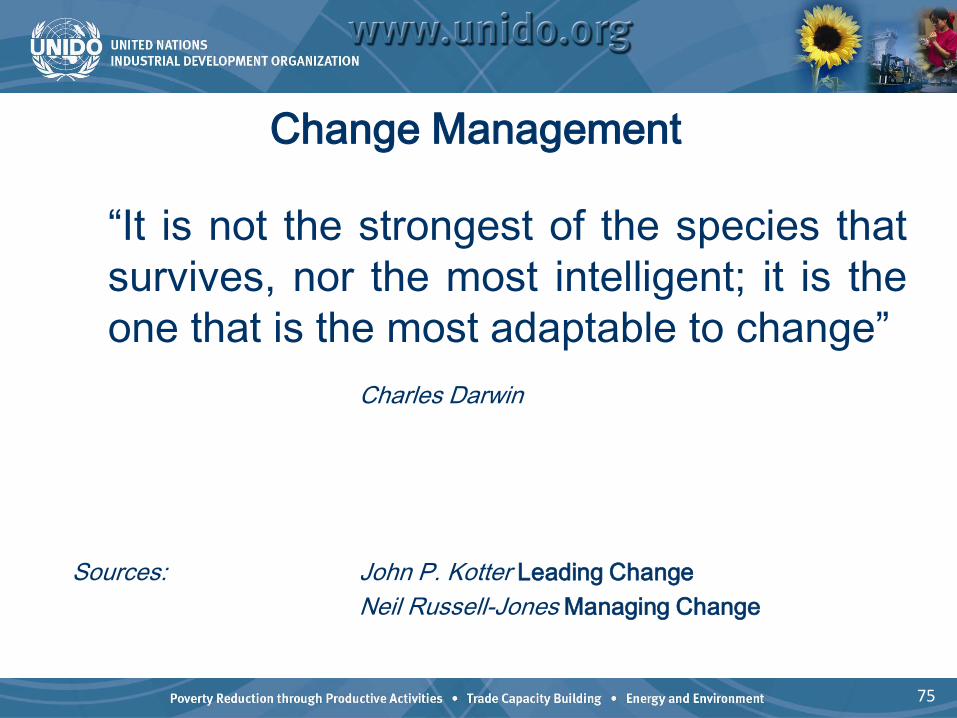
Change Management
“It is not the strongest of the species thatsurvives, nor the most intelligent; it is theone that is the most adaptable to change”
Charles Darwin
Sources: John P. Kotter Leading ChangeNeil Russell-Jones Managing Change
75

See you in 45 minutes!
76
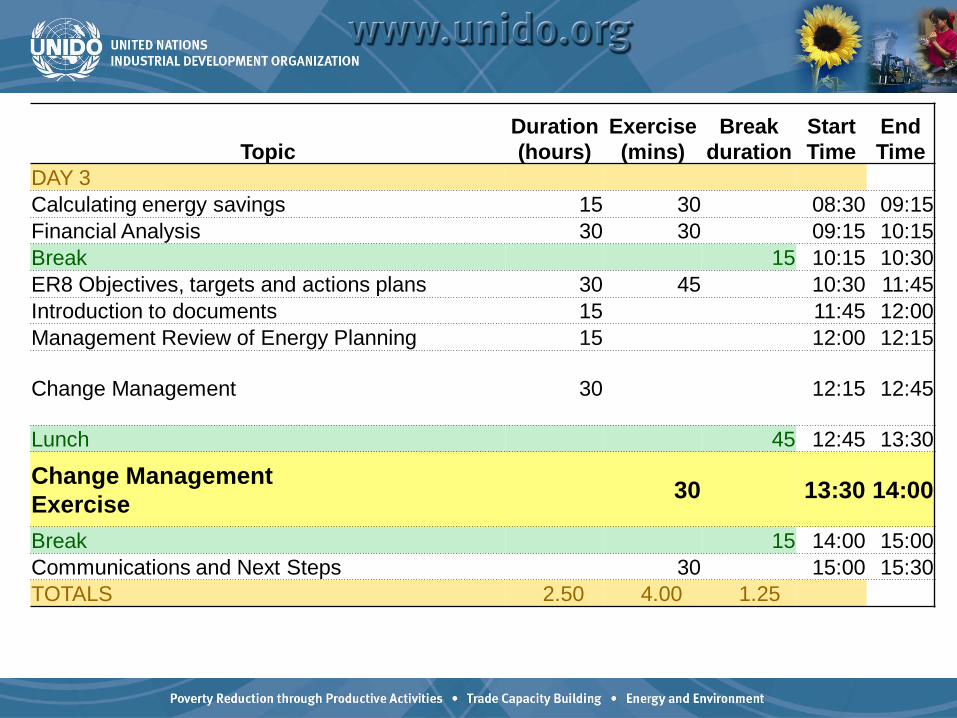
TopicDuration (hours)
Exercise (mins)
Break duration
Start Time
End Time
DAY 3Calculating energy savings 15 30 08:30 09:15Financial Analysis 30 30 09:15 10:15Break 15 10:15 10:30ER8 Objectives, targets and actions plans 30 45 10:30 11:45Introduction to documents 15 11:45 12:00Management Review of Energy Planning 15 12:00 12:15
Change Management 30 12:15 12:45
Lunch 45 12:45 13:30
Change Management Exercise 30 13:30 14:00
Break 15 14:00 15:00Communications and Next Steps 30 15:00 15:30TOTALS 2.50 4.00 1.25
77

Exercise:
Discussion on change management
issues and how to deal with them
78

TopicDuration (hours)
Exercise (mins)
Break duration
Start Time
End Time
DAY 3Calculating energy savings 15 30 08:30 09:15Financial Analysis 30 30 09:15 10:15Break 15 10:15 10:30ER8 Objectives, targets and actions plans 30 45 10:30 11:45Introduction to documents 15 11:45 12:00Management Review of Energy Planning 15 12:00 12:15Change Management Exercise is a discussion: changing organsiation culture
30 12:15 12:45
Lunch 45 12:45 13:30Change Management Exercise is a discussion: changing organsiation culture
30 13:30 14:00
Break 15 14:00 14:15Communications and Next Steps 30 14:15 15:15TOTALS 2,25 2,25 1,25
79
Communication & Next Steps• Basecamp
80