Unichem Laboratories Limited...
49
©Unichem Laboratories Ltd UNICHEM Unichem Laboratories Limited Unichem Laboratories Limited Investor Presentation May, 2014 Investor Presentation May, 2014 1
Transcript of Unichem Laboratories Limited...

©Unichem Laboratories Ltd
UNICHEM
Unichem Laboratories LimitedUnichem Laboratories Limited
Investor PresentationMay, 2014
Investor PresentationMay, 2014
1

©Unichem Laboratories Ltd
UNICHEM
Safe Harbor Statement
This presentation may include certain forward-looking statements and information that involve risks, uncertainties and assumptions based on current expectations, within the meaning of applicable laws and regulations. Forward-looking statements are all statements that concern plans, objectives, goals, strategies, future events or performance and underlying assumptions and other statements that are other than statements of historical fact, including, but not limited to, those that are identified by the use of words such as “anticipates,” “believes,” “estimates,” “expects,” “intends,” “plans,” “predicts,” “projects” and similar expressions. Actual results could differ materially from those projected in forward looking statements and the company does not guarantee realization of these statements. Any forward looking statement or information contained in this presentation speaks only as of the date of the statements. The company also disclaims any obligation to revise any forward looking statements.
No part of this presentation may be reproduced, quoted or circulated without the prior approval from Unichem Laboratories Limited
2

©Unichem Laboratories Ltd
UNICHEM
Agenda
1. Profile & History
2. Growth & Profitability
3. Business Operations
– Domestic Operations
– International Operations
– API Operations
4. Research & Development
5. Management & Governance
6. Financials
3

©Unichem Laboratories Ltd
UNICHEM
One of the India’s leading integrated Pharmaceutical Companies with a strong presence in domestic formulations market
Ranked 25th in the Domestic Formulations market as per AWACS MAT Mar, 2014Amongst the top # 19 companies in representative (covered) marketDomestic Operations contribute ~61% of Consolidated RevenuesInternational Operations contribute ~39% of Consolidate Revenues
– US revenues showing a robust growth
Dedicated focus on International operations –gaining momentum
4 brands featuring among top 300 brands (AWACS MAT Mar, 2014)
Largest brand / brand extensions in excess of Rs160 Cr 17 brands with Rs. 10cr + Revenues15 brands with Rs. 5cr + Revenues and 19 brands waiting to cross this thresholdIn 23 therapeutic sub-groups Unichem’s brand is No 1 brand, over all Unichem’s brands rank in the top 5 in 89 therapeutic sub-groups
Zero debt company and cash generating businessSince many years Company has Net Cash position after reasonable dividend payout
Profile
AWACS: MAT Mar, 2014 4

©Unichem Laboratories Ltd
UNICHEM
� USFDA re-certification of Goa Plant & Roha Plant
� Sikkim & Baddi– Formulation Plant
� Commencement of US sales
� Modernization of BetalactumPlant - Baddi
� SEZ Pithampurconstruction started
� Reorganization of Acute Business
History - Key Milestones(Last 10 Years)
2003-04 2005-06 2007-08 2009
� Modernization of Ghaziabad formulations plant
� Reorganization of Unisearch and launch of Cardio DiabetoDivision
� New PTD at Goa
� Baddi II commissioned
� Acquisition of API plant at Pithampur
� USFDA certification of Goa Plant
� Launch of Specialties Division
� Acquisition of 100% stake in Niche Generics
� Launch of Unikare -Derma Division
� USFDA certification of Ghaziabad Plant
� EDQM certification of RohaPlant
� Goa R&D commissioned
� Sikkim Factory construction started
� Establishment of packing unit at Ireland
5
2010-11 2012
� Expansion of Packaging facility at GOA Plant
� Construction of R & D Centre at GOA started
2013-14
� Sale of Indore SEZ plant to MylanLaboratories Ltd.
� Purchase of additional land at Goa
� Realignment of Chronic Care Portfolio
� Re-location of R&D from Mumbai to Goa (CoE). Filings commissioned from new R&D Centre
� Commenced further sub divisionalization with increased focus on Chronic, launching new division on Cardio & Neuro.
� Commencement of expansion at API facility in Pithampur
� Acquired API facility in Kolhapur, Maharashtra
� USFDA certification of API plant at Pithampur
� USFDA re-certification of API plant Pithampur
©Unichem Laboratories Ltd
UNICHEM
Agenda
1. Profile & History
2. Growth & Profitability
3. Business Operations
– Domestic Operations
– International Operations
– API Operations
4. Research & Development
5. Management & Governance
6. Financials
6

©Unichem Laboratories Ltd
UNICHEM
735 747824
876
1,0811,134
152 177 158 129188 181
Unichem Consolidated Financials {Rs. Crores}Growing Steadily & Focus on Profitability
EBITDA as % of RevenueEBITDA as % of Revenue
2008-092008-09
RevRev RevRev RevRev
2009-10 2009-10
15.7%15.7% 17.3% *17.3% *
7
2010-11 2010-11
RevRev
EBITDA Margin in 2010-11 & 2011-12 declined due to increased field headcount, marketing spend, commissioning of additional plants, and higher R & D expenditure.
2012-13 2012-13
EbitdaEbitda EbitdaEbitda EbitdaEbitda EbitdaEbitda
2011-12 2011-12
RevRev EbitdaEbitda
2013-142013-14
RevRev EbitdaEbitda
* standalone
©Unichem Laboratories Ltd
UNICHEM
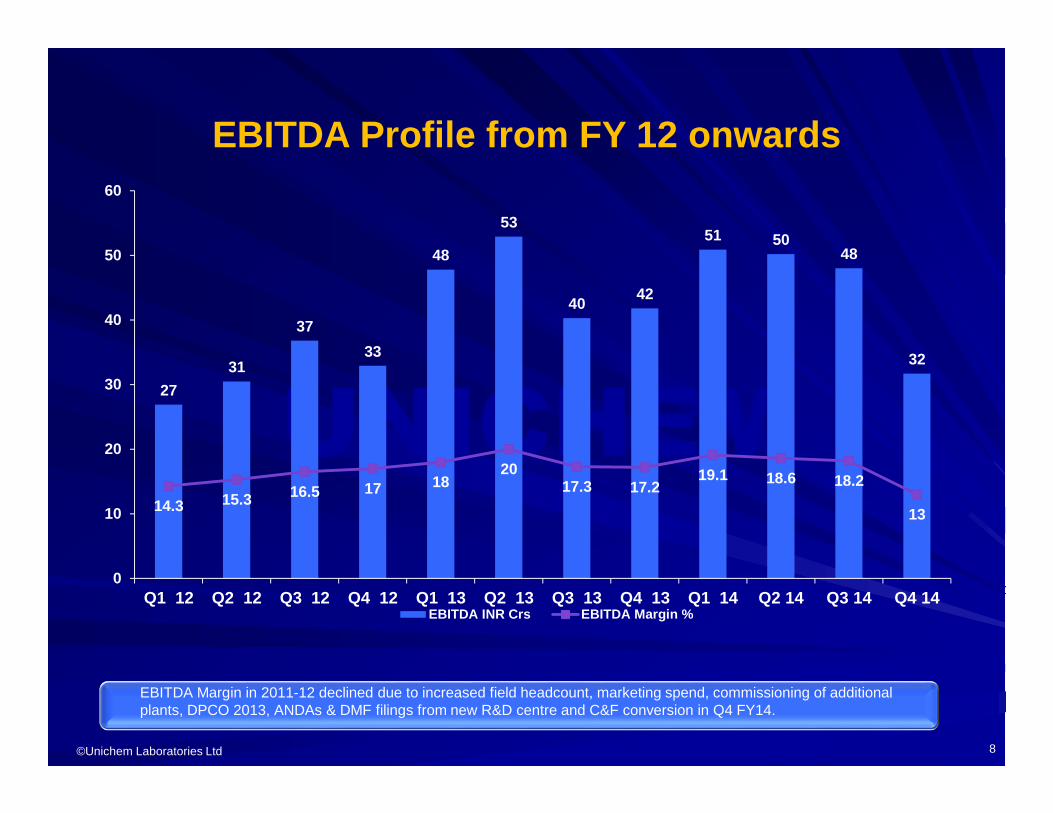
EBITDA Profile from FY 12 onwards
8
EBITDA Margin in 2011-12 declined due to increased field headcount, marketing spend, commissioning of additional plants, DPCO 2013, ANDAs & DMF filings from new R&D centre and C&F conversion in Q4 FY14.
27
31
37
33
48
53
4042
51 5048
32
14.3 15.3 16.5 17 1820
17.3 17.219.1 18.6 18.2
13
0
10
20
30
40
50
60
Q1 12 Q2 12 Q3 12 Q4 12 Q1 13 Q2 13 Q3 13 Q4 13 Q1 14 Q2 14 Q3 14 Q4 14EBITDA INR Crs EBITDA Margin %

©Unichem Laboratories Ltd
UNICHEM
Agenda
1. Profile & History
2. Growth & Profitability
3. Business Operations
– Domestic Operations
– International Operations
– API Operations
4. Research & Development
5. Management & Governance
6. Financials
9
©Unichem Laboratories Ltd
UNICHEM
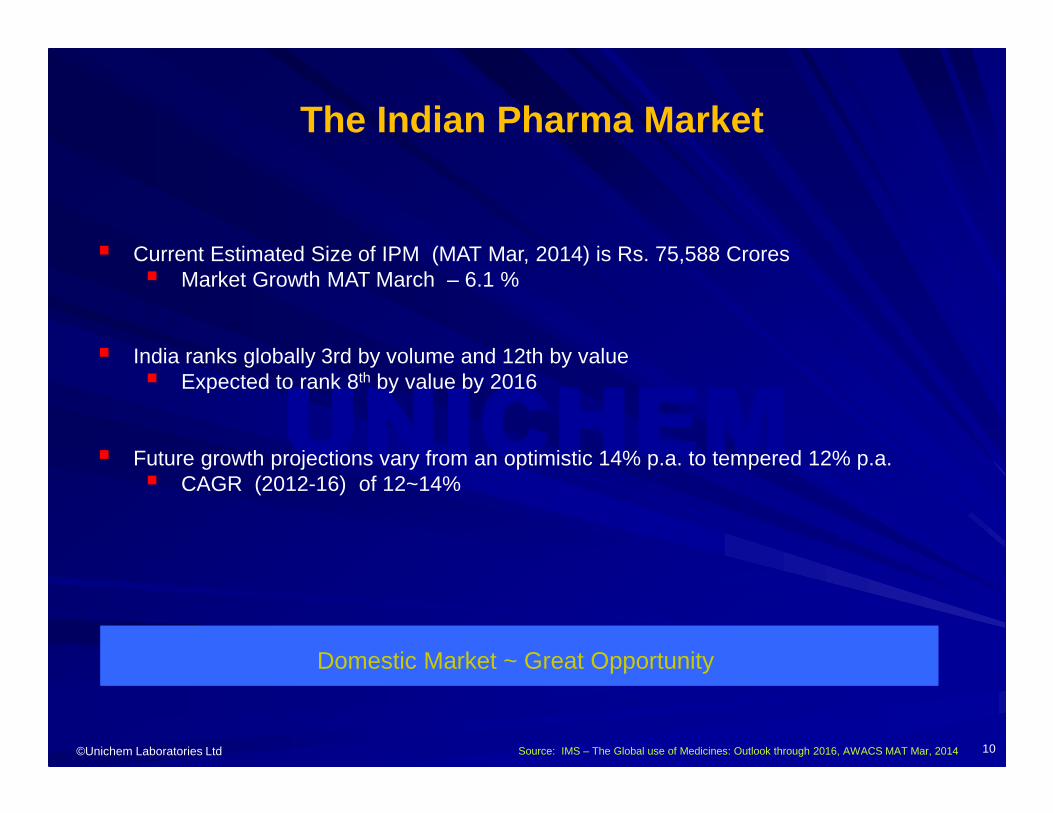
The Indian Pharma Market
� Current Estimated Size of IPM (MAT Mar, 2014) is Rs. 75,588 Crores� Market Growth MAT March – 6.1 %
� India ranks globally 3rd by volume and 12th by value� Expected to rank 8th by value by 2016
� Future growth projections vary from an optimistic 14% p.a. to tempered 12% p.a.� CAGR (2012-16) of 12~14%
10Source: IMS – The Global use of Medicines: Outlook through 2016, AWACS MAT Mar, 2014
Domestic Market ~ Great Opportunity

©Unichem Laboratories Ltd
UNICHEM
Revenue & Business areas break-upConsolidated – FY 2012-13
65861%
35233%
716%
India Business Regulated Markets Emerging Markets
63759%
212%
20119%
848%
484%
908%
Formulation - DomesticAPI - DomesticFormulation - ExportsAPI - ExportsInternational Business -US/BrazilInternational Business - Niche
Revenue Break-up by SegmentRs. Crores Revenue Break-up by Region
Rs. Crores
11

©Unichem Laboratories Ltd
UNICHEM
Revenue & Business areas break-upConsolidated –FY 2013-14
685,60%
393,35%
56,5%
India Business Regulated Markets Emerging Markets
65559%
27 2%
515%
918%
15314%
14113%
Formulation - DomesticAPI - DomesticFormulation - ExportsAPI - ExportsInternational Business -US/BrazilInternational Business - Niche
Revenue Break-up by SegmentRs. Crores
Revenue Break-up by RegionRs. Crores
12
©Unichem Laboratories Ltd
UNICHEMPortfolio
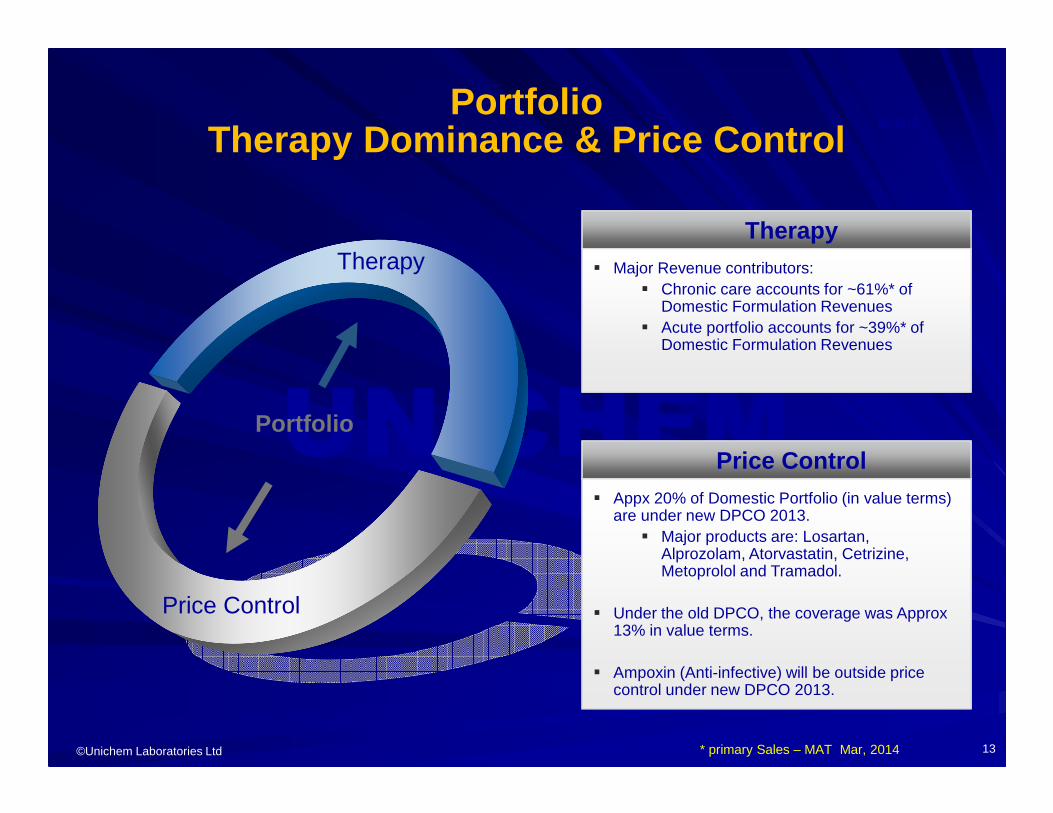
Therapy� Major Revenue contributors:
� Chronic care accounts for ~61%* of Domestic Formulation Revenues
� Acute portfolio accounts for ~39%* of Domestic Formulation Revenues
Price Control� Appx 20% of Domestic Portfolio (in value terms)
are under new DPCO 2013. � Major products are: Losartan,
Alprozolam, Atorvastatin, Cetrizine, Metoprolol and Tramadol.
� Under the old DPCO, the coverage was Approx 13% in value terms.
� Ampoxin (Anti-infective) will be outside price control under new DPCO 2013.
SCENEPortfolio
Therapy Dominance & Price Control
Price Control
Therapy
* primary Sales – MAT Mar, 2014 13
©Unichem Laboratories Ltd
UNICHEM
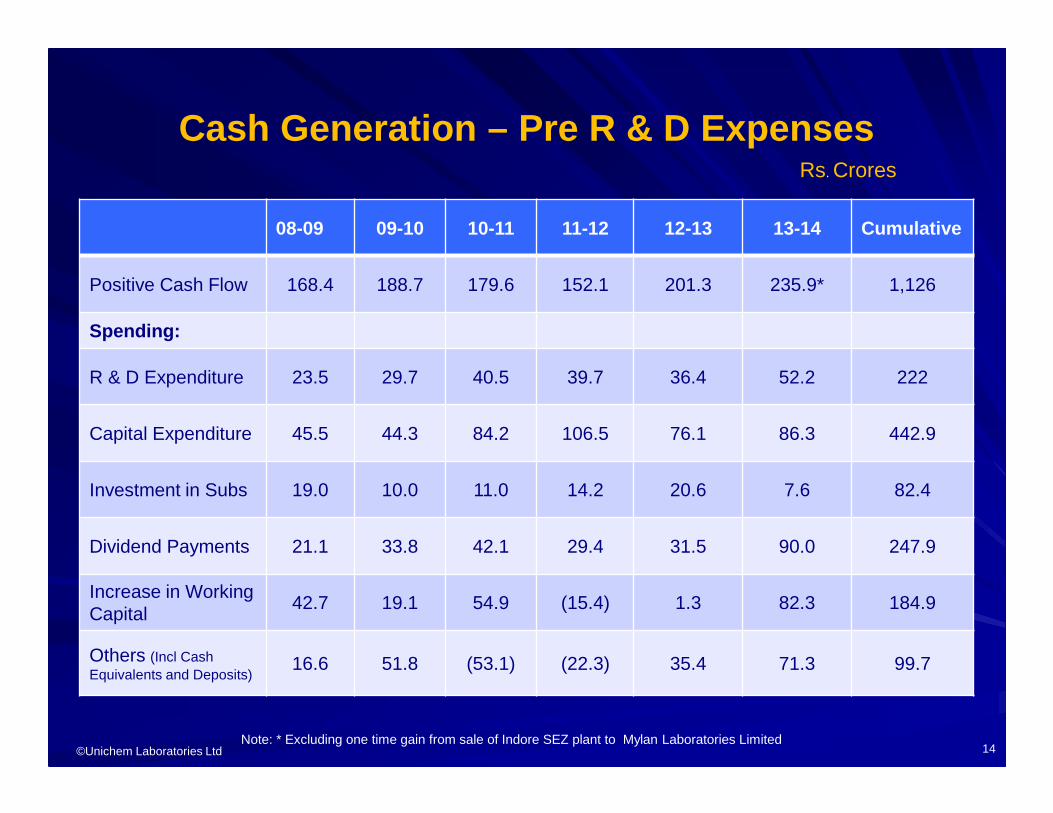
Cash Generation – Pre R & D Expenses
08-09 09-10 10-11 11-12 12-13 13-14 Cumulative
Positive Cash Flow 168.4 188.7 179.6 152.1 201.3 235.9* 1,126
Spending:
R & D Expenditure 23.5 29.7 40.5 39.7 36.4 52.2 222
Capital Expenditure 45.5 44.3 84.2 106.5 76.1 86.3 442.9
Investment in Subs 19.0 10.0 11.0 14.2 20.6 7.6 82.4
Dividend Payments 21.1 33.8 42.1 29.4 31.5 90.0 247.9
Increase in Working Capital
42.7 19.1 54.9 (15.4) 1.3 82.3 184.9
Others (Incl Cash Equivalents and Deposits)
16.6 51.8 (53.1) (22.3) 35.4 71.3 99.7
Rs. Crores
14Note: * Excluding one time gain from sale of Indore SEZ plant to Mylan Laboratories Limited
©Unichem Laboratories Ltd
UNICHEM
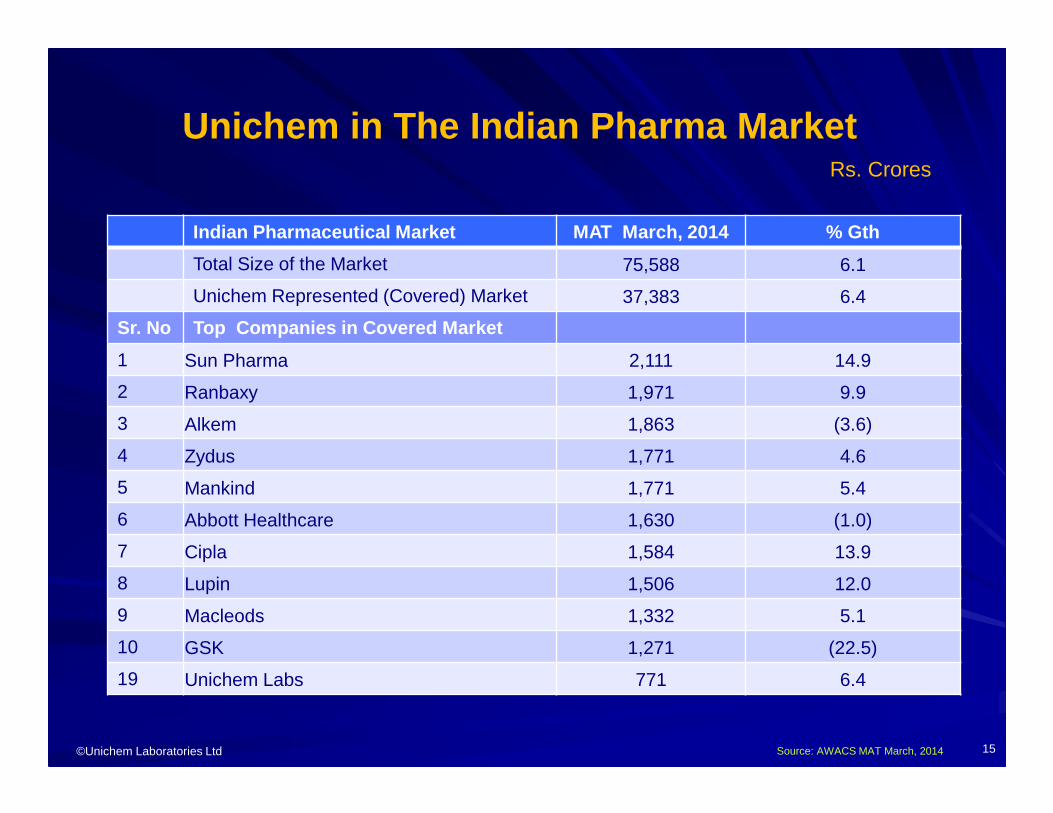
Unichem in The Indian Pharma Market
Indian Pharmaceutical Market MAT March, 2014 % Gth
Total Size of the Market 75,588 6.1
Unichem Represented (Covered) Market 37,383 6.4
Sr. No Top Companies in Covered Market
1 Sun Pharma 2,111 14.9
2 Ranbaxy 1,971 9.9
3 Alkem 1,863 (3.6)
4 Zydus 1,771 4.6
5 Mankind 1,771 5.4
6 Abbott Healthcare 1,630 (1.0)
7 Cipla 1,584 13.9
8 Lupin 1,506 12.0
9 Macleods 1,332 5.1
10 GSK 1,271 (22.5)
19 Unichem Labs 771 6.4
Rs. Crores
15Source: AWACS MAT March, 2014
©Unichem Laboratories Ltd
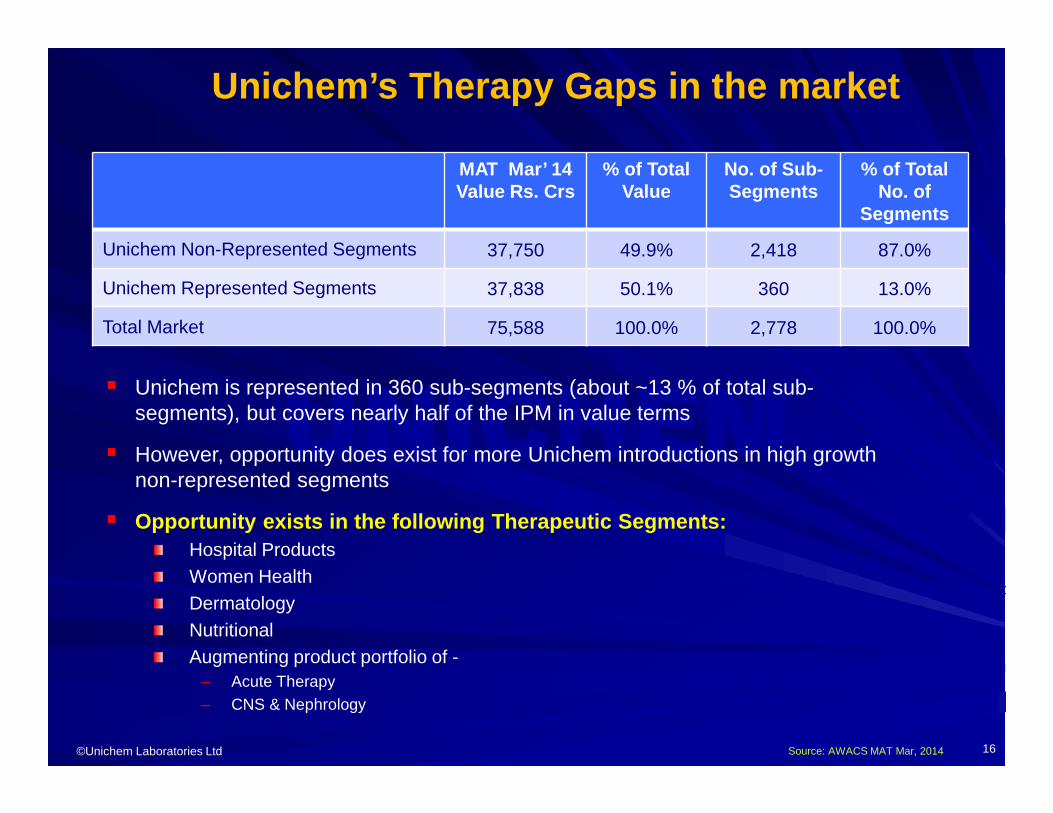
UNICHEM� Unichem is represented in 360 sub-segments (about ~13 % of total sub-
segments), but covers nearly half of the IPM in value terms
� However, opportunity does exist for more Unichem introductions in high growth non-represented segments
� Opportunity exists in the following Therapeutic Segments:Hospital ProductsWomen HealthDermatologyNutritionalAugmenting product portfolio of -
– Acute Therapy– CNS & Nephrology
Unichem’s Therapy Gaps in the market
MAT Mar’ 14 Value Rs. Crs
% of Total Value
No. of Sub-Segments
% of Total No. of
Segments
Unichem Non-Represented Segments 37,750 49.9% 2,418 87.0%
Unichem Represented Segments 37,838 50.1% 360 13.0%
Total Market 75,588 100.0% 2,778 100.0%
16Source: AWACS MAT Mar, 2014

©Unichem Laboratories Ltd
UNICHEM
17
Domestic Formulations: Divisions
Chronic(7)
Cardio-Diabeto(4)
Nero-Psycaitry(2)
Derma-Gynec(1)
CVS-Life
CVS-Star
CD
Integra
Neu-Foreva
Uni-Foreva
Unikare
Anti-Hypertensive & Anti-Anxiolytics
Cardiologists, CPs & GPs
Anti-Hypertensive, Statins& Anti-Anginal Cardiologists, Diabetologists,
CPs & FPs
Anti-Hypertensive, Statins, Diabetes mngmt Cardiologists, Diabetologists,
CPs & FPs
Anti-Hypertensive, Statins, Diabetes mngmt & Related diseases
Cardiologists, Diabetologists, Nephrologists & CPs
Anti-Psychotic, Anxiolytics, Anti-Migraine, & Anti-
Depressant
Neurologists, Psychiatrists & CPs
Anti-Depressant, Anti-Psychotic, Anti-Epilepsy,
Muscle relaxant, High end Anti Biotic
Neuro Physicians, NeuroSurgeons & Psychiatrist
Anti-Allergic, Antioxidants, Revitalizers, Haircare,
Infertility, Contraceptives, Hormones etc.
Dermatologists & Gynecologists
Covered Therapies
Covered Specialist
©Unichem Laboratories Ltd
UNICHEM
18
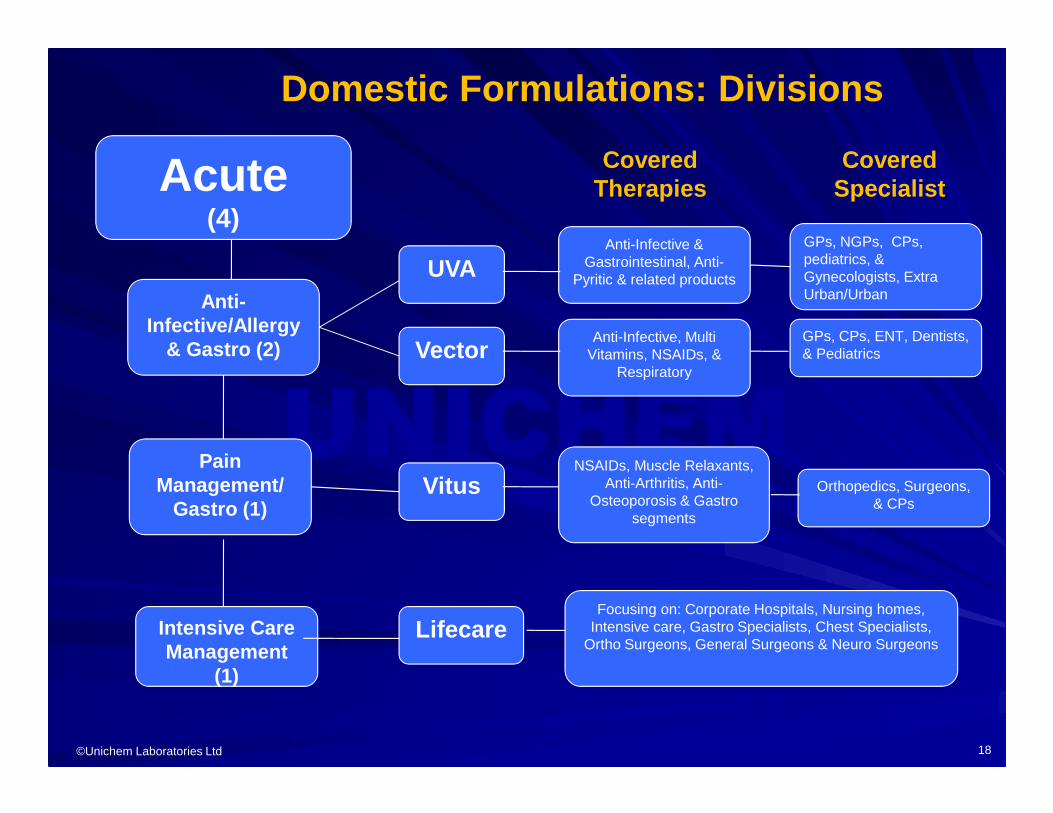
Domestic Formulations: Divisions
Acute(4)
Anti-Infective/Allergy
& Gastro (2)
Pain Management/
Gastro (1)
Intensive Care Management
(1)
UVA
Vector
Vitus
Lifecare
Anti-Infective & Gastrointestinal, Anti-
Pyritic & related products
GPs, NGPs, CPs, pediatrics, & Gynecologists, Extra Urban/Urban
Anti-Infective, Multi Vitamins, NSAIDs, &
Respiratory
GPs, CPs, ENT, Dentists, & Pediatrics
NSAIDs, Muscle Relaxants, Anti-Arthritis, Anti-
Osteoporosis & Gastro segments
Orthopedics, Surgeons, & CPs
Focusing on: Corporate Hospitals, Nursing homes, Intensive care, Gastro Specialists, Chest Specialists,
Ortho Surgeons, General Surgeons & Neuro Surgeons
Covered Therapies
Covered Specialist
©Unichem Laboratories Ltd
UNICHEM
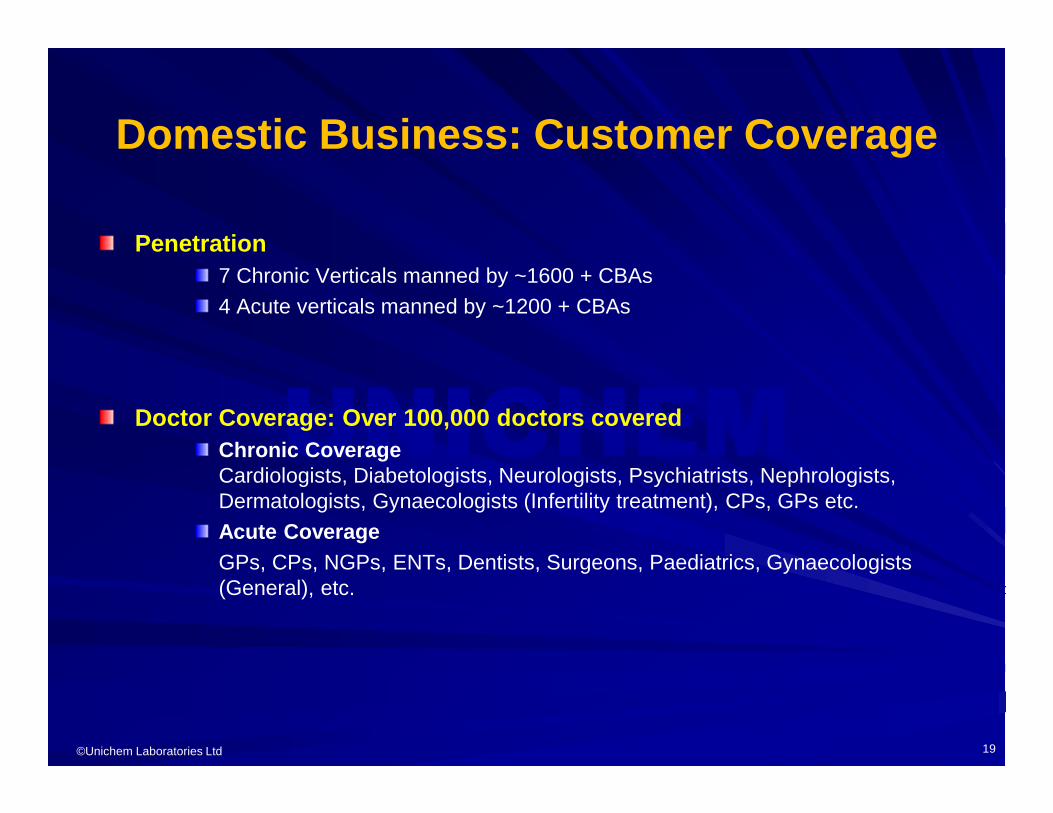
Domestic Business: Customer Coverage
19
Penetration7 Chronic Verticals manned by ~1600 + CBAs4 Acute verticals manned by ~1200 + CBAs
Doctor Coverage: Over 100,000 doctors coveredChronic Coverage Cardiologists, Diabetologists, Neurologists, Psychiatrists, Nephrologists, Dermatologists, Gynaecologists (Infertility treatment), CPs, GPs etc.Acute CoverageGPs, CPs, NGPs, ENTs, Dentists, Surgeons, Paediatrics, Gynaecologists (General), etc.

©Unichem Laboratories Ltd
UNICHEM
Domestic Formulations Business
Leadership position in key participated segments
– Largest brand / brand extensions in excess of Rs160cr
# 4 Brands in Top 300 brands– Losar, Losar H, Ampoxin & Unienzyme
In 23 therapeutic groups Unichem’s brand is No 1 brand
Over all Unichem’s brands rank in the top 5 in 89 therapeutic sub-groups
Healthy balance between chronic (~61%) & acute (~39%)
CVS, 45%
Anti Infective,
17%
CNS, 12%
GI, 11%
Musculo-Skeletal, 4%
Anti-Diabetic, 4% Others, 7%
Therapeutic Segment-wise break-up
20Source: AWACS MAT Mar, 2014

©Unichem Laboratories Ltd
UNICHEM
Brand Building – Focus Brand Portfolio
# Top 10 Brands contributes nearly 50% of the company’s domestic revenues
– Losar H, Losar, Ampoxin, Unienzyme, Trika, Vizylac, Linox, Serta, Telsar and Unistar
# 50 Brands contributes ~82% of the company’s domestic revenues– # 4 - Rs. 50 +crore brands– # 1 - Rs. 30 ~ 50 crore brands– # 2 - Rs. 20 ~ 30 crore brand– # 11 - Rs. 10 ~ 20 crore brands– # 15- Rs. 5 ~ 10 crore brands– # 18 - Rs. 3 ~ 5 crore brands
21Source: AWACS MAT Mar, 2014

©Unichem Laboratories Ltd
UNICHEM
Top 10 Product Groups Performance
MAT Mar, 2014
% Growth
% Market Share
% Contribution to Revenue
Total Revenue 771 6.4 1.0 100
Losar Group 162 (4.6) 33.3 21.0
Ampoxin Group 64 4.4 44.5 8.3
Unienzyme 53 21.5 16.8 6.8
Telsar Group 45 9.6 4.2 5.8
Trika Group 32 (11.8) 20.9 4.1
Olsar Group 31 14.6 6.7 4.0
Vizylac 25 13.1 13.4 3.2
Metride Group 19 2.2 1.2 2.4
Linox 18 7.9 12.3 2.3
Serta 17 34.7 29.8 2.2
Rs. Crores
Source: AWACS MAT Mar, 2014 22

©Unichem Laboratories Ltd
UNICHEM
AWACS Data – MAT Mar, 2014
Therapy Market Segment
Representative Market Unichem Laboratories
Size (Rs. Crs) % Growth Sales (Rs. Crs) % Share % Growth
Cardiac Care6,055 8.5 351 5.8 2.7
Anti-Infectives9,390 (0.3) 129 1.4 15.5
Neuro-Psychiatry2,526 7.4 95 3.7 5.2
Gastroenterologicals4,617 3.5 89 1.9 12.7
Musculoskeletals3,277 3.8 29 0.9 16.7
Anti – Diabetic2,580 14.0 27 1.0 9.1
Gynaecological1,804 4.2 6 0.3 54.1
Others7,590 6.4 46 0.6 (6.5)
TOTAL37,838 4.8 771 2.0 6.4
23Source: AWACS MAT Mar, 2014

©Unichem Laboratories Ltd
UNICHEM
AWACS Data Quarterly Sales & MAT - Mar, 2014
IndicatorsMarket Size
(Crs)Value Growth
(%)Unichem (Crs)
Value Growth (%)
MAT March’ 14 75,588 6.1 771 6.4
Q1 FY 14 18,426 8.3 184 6.0Q2 FY 14 19,357 3.2 187 0.1Q3 FY 14 19,028 4.9 203 11.9Q4 FY 14 18,228 6.6 190 4.8
Q1 FY 13 17,016 16.9 174 7.2Q2 FY 13 18,755 13.6 187 9.2Q3 FY 13 18,137 8.9 182 8.1 Q4 FY 13 17,083 8.1 181 8.4
Source: AWACS 24
©Unichem Laboratories Ltd
UNICHEM
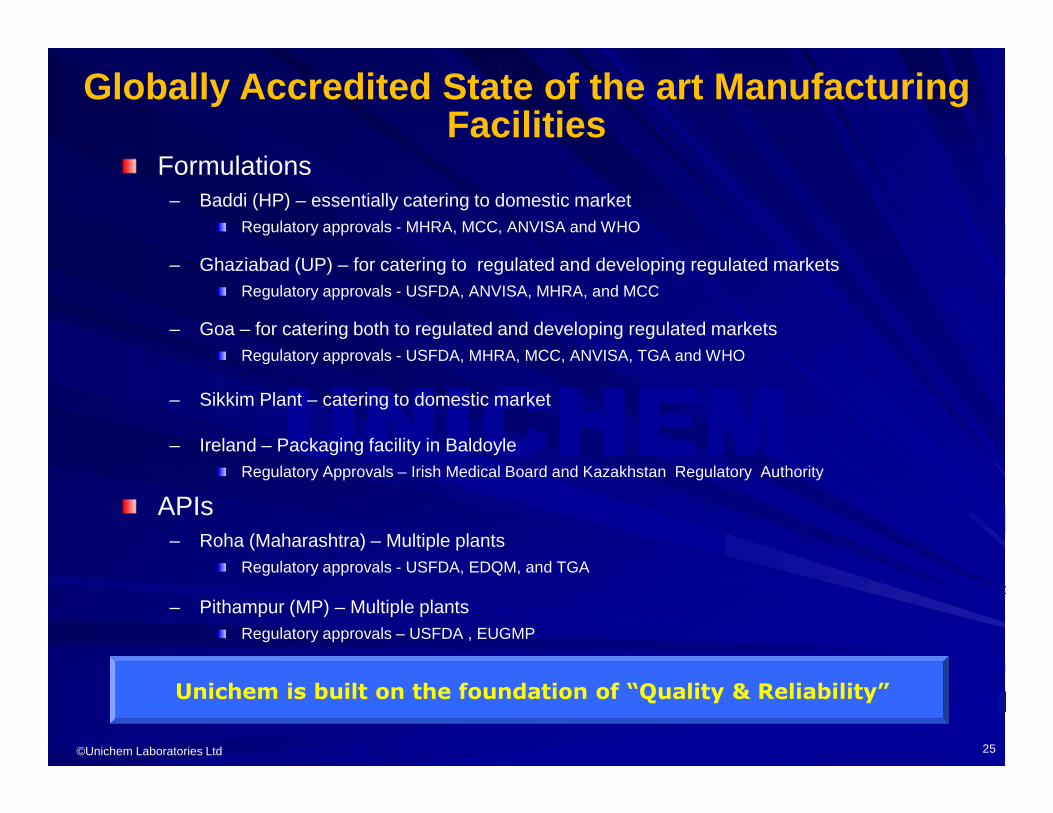
Globally Accredited State of the art Manufacturing Facilities
Formulations– Baddi (HP) – essentially catering to domestic market
Regulatory approvals - MHRA, MCC, ANVISA and WHO
– Ghaziabad (UP) – for catering to regulated and developing regulated marketsRegulatory approvals - USFDA, ANVISA, MHRA, and MCC
– Goa – for catering both to regulated and developing regulated marketsRegulatory approvals - USFDA, MHRA, MCC, ANVISA, TGA and WHO
– Sikkim Plant – catering to domestic market
– Ireland – Packaging facility in BaldoyleRegulatory Approvals – Irish Medical Board and Kazakhstan Regulatory Authority
APIs– Roha (Maharashtra) – Multiple plants
Regulatory approvals - USFDA, EDQM, and TGA
– Pithampur (MP) – Multiple plantsRegulatory approvals – USFDA , EUGMP
Unichem is built on the foundation of “Quality & Reliability”
25
©Unichem Laboratories Ltd
UNICHEM
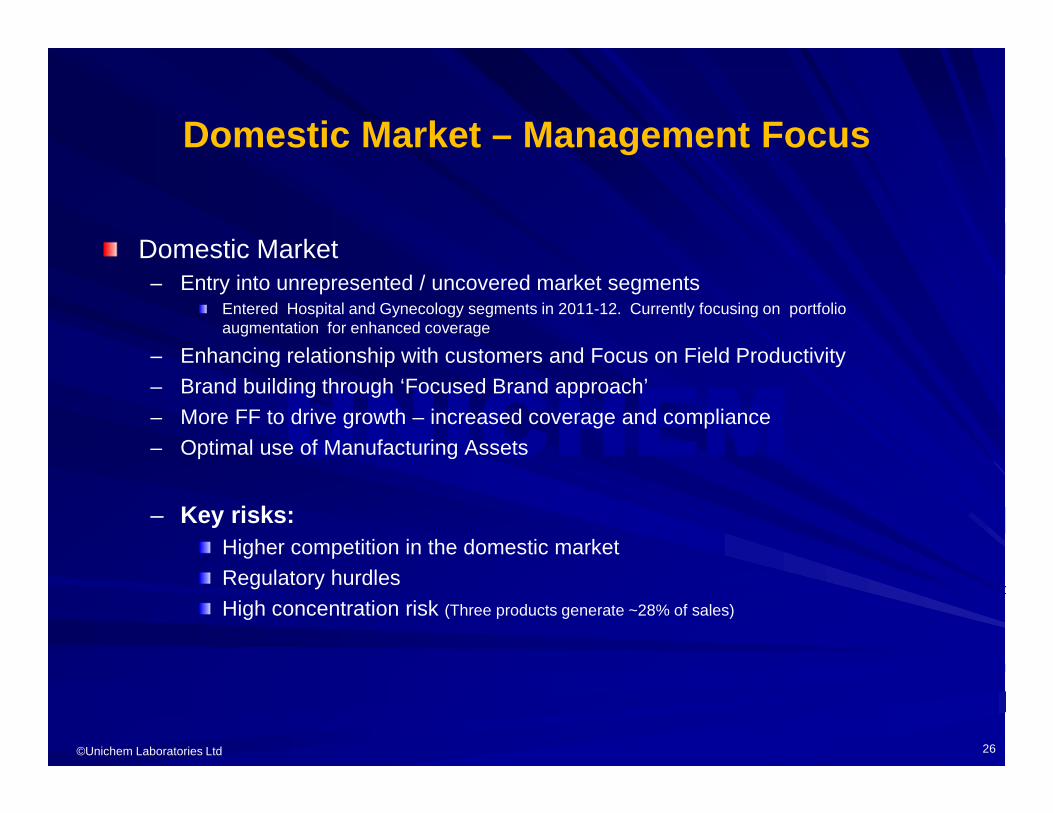
Domestic Market – Management Focus
Domestic Market– Entry into unrepresented / uncovered market segments
Entered Hospital and Gynecology segments in 2011-12. Currently focusing on portfolio augmentation for enhanced coverage
– Enhancing relationship with customers and Focus on Field Productivity– Brand building through ‘Focused Brand approach’– More FF to drive growth – increased coverage and compliance– Optimal use of Manufacturing Assets
– Key risks: Higher competition in the domestic marketRegulatory hurdlesHigh concentration risk (Three products generate ~28% of sales)
26
©Unichem Laboratories Ltd
UNICHEM
Agenda
1. Profile & History
2. Growth & Profitability
3. Business Operations
– Domestic Operations
– International Operations
– API Operations
4. Research & Development
5. Management & Governance
6. Financials
27
©Unichem Laboratories Ltd
UNICHEM
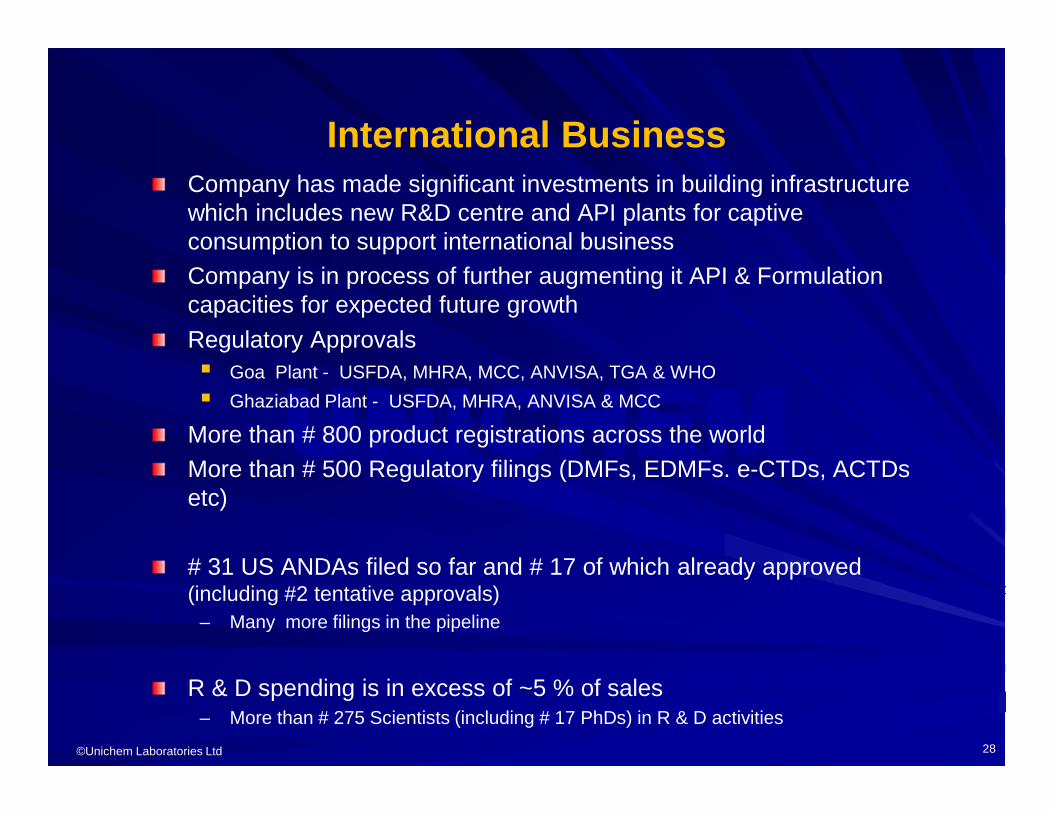
International BusinessCompany has made significant investments in building infrastructure which includes new R&D centre and API plants for captive consumption to support international businessCompany is in process of further augmenting it API & Formulation capacities for expected future growth
Regulatory Approvals � Goa Plant - USFDA, MHRA, MCC, ANVISA, TGA & WHO
� Ghaziabad Plant - USFDA, MHRA, ANVISA & MCC
More than # 800 product registrations across the worldMore than # 500 Regulatory filings (DMFs, EDMFs. e-CTDs, ACTDs etc)
# 31 US ANDAs filed so far and # 17 of which already approved (including #2 tentative approvals)
– Many more filings in the pipeline
R & D spending is in excess of ~5 % of sales– More than # 275 Scientists (including # 17 PhDs) in R & D activities
28

©Unichem Laboratories Ltd
UNICHEM
International Business – Formulations Zone 1 : Emerging Global Markets
Alliances in place for distribution and marketing of branded generics
– In SAARC countries, S.E Asia, Baltic Republics, CIS, Central Asian Republics, Africa and the Middle east
Wholly owned subsidiary in South Africa -UNICHEM SA (PTY) LTD
Augmenting Portfolio and Operations– Where Unichem has direct operations through
Country Managers in few countries
29
Africa, 37%
CIS/Russia, 25%
Middle East, 2%
South East, 36%
Geographic Mix – FY 2012- 13
Africa, 39%
CIS/Russia, 17%
Middle East, 2%
South East, 42%
Geographic Mix – YTD 2013- 14

©Unichem Laboratories Ltd
UNICHEM
International Business – Formulations Regulated Markets
30
Geographic Mix – FY 2012-13
Europe- 27 %
Niche - 39 %
US / Canada -34 %
Geographic Mix – FY 2013-14
Europe - 15%
Niche - 34%US / Canada
- 51%

©Unichem Laboratories Ltd
UNICHEM
UINITED STATES:
� UNICHEM PHARMACEUTICALS (USA) Inc - wholly owned subsidiary to manage ANDA
filings and Business Development
� Business model is based on leveraging Unichem’s technical expertise and production capability with integrated end-to-end value chain
� Tied with large wholesalers and a retail chains for products launched
� Total number of ANDAs filed # 31 and # 20 in development pipeline
� Total ANDAs approved so for # 17 (Including #2 tentative approvals)
� Total number of products launched # 10
� Unichem’s investments in R & D is increasing every year to ensure more ANDA and DMF filings
� Company’s strategy is to scale-up operations for sustained growth over time
International Business – Formulations Regulated Markets - USA and LATAM
31
©Unichem Laboratories Ltd
UNICHEM
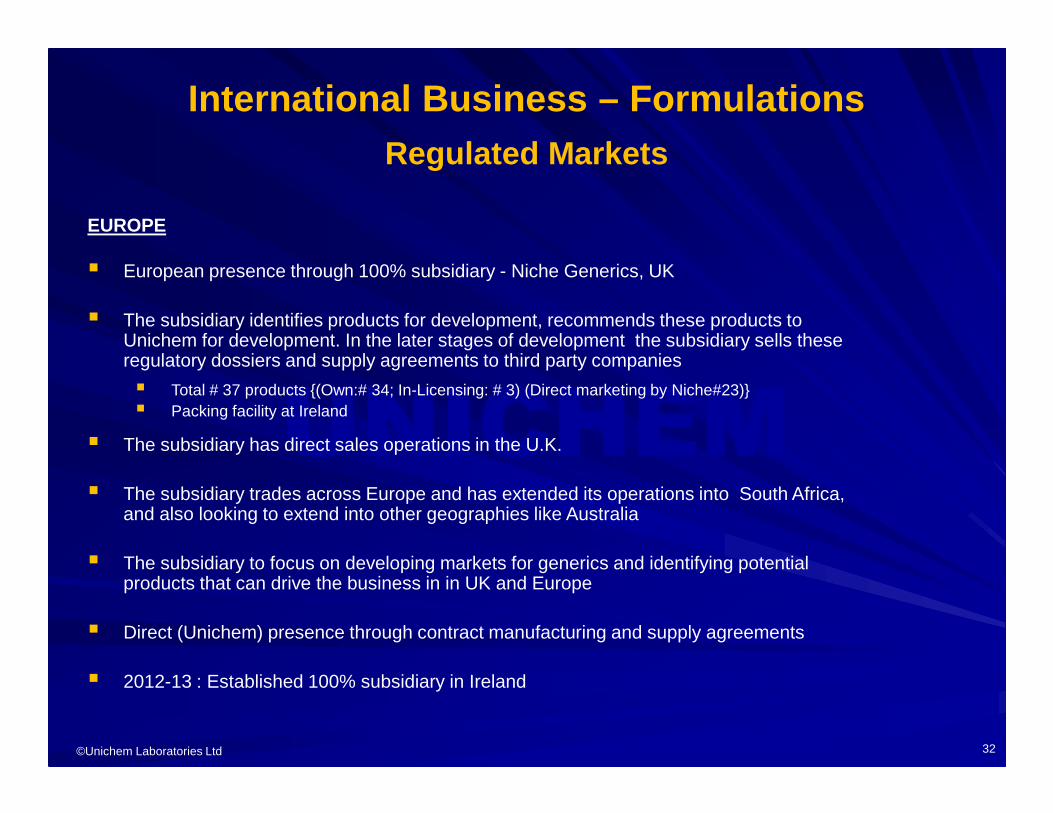
EUROPE
� European presence through 100% subsidiary - Niche Generics, UK
� The subsidiary identifies products for development, recommends these products to Unichem for development. In the later stages of development the subsidiary sells these regulatory dossiers and supply agreements to third party companies
� Total # 37 products {(Own:# 34; In-Licensing: # 3) (Direct marketing by Niche#23)}� Packing facility at Ireland
� The subsidiary has direct sales operations in the U.K.
� The subsidiary trades across Europe and has extended its operations into South Africa, and also looking to extend into other geographies like Australia
� The subsidiary to focus on developing markets for generics and identifying potential products that can drive the business in in UK and Europe
� Direct (Unichem) presence through contract manufacturing and supply agreements
� 2012-13 : Established 100% subsidiary in Ireland
International Business – Formulations Regulated Markets
32

©Unichem Laboratories Ltd
UNICHEM
International Market – Management Focus
United States– Develop long term relationships with local partners – Finalize tie-ups for launching ANDA approved products– More ANDAs filings and approvals– Capitalize end-to-end value chain– Forge relationship with Innovators to become building blocks in NCE Research ( contract
research and supply of APIs)
European Union– Align with existing Key Regional Players across Europe
– Identify and support new players in emerging CEE Markets & Australia
– Develop and manage own commercial capability in UK, and Ireland
Brazil– Additional product registrations
33

©Unichem Laboratories Ltd
UNICHEM
Agenda
1. Profile & History
2. Growth & Profitability
3. Business Operations
– Domestic Operations
– International Operations
– API Operations
4. Research & Development
5. Management & Governance
6. Financials
34

©Unichem Laboratories Ltd
UNICHEM
API-World class Manufacturing Facilities and Infrastructure
Roha (Maharashtra) – Multiple plantsRegulatory Approvals – USFDA, EDQM, and TGA
Pithampur (MP) – Multiple plantsRegulatory Approvals – USFDA, EUGMP
35

©Unichem Laboratories Ltd
UNICHEM
Key APIs
Sr. No
Current Product List Therapeutic Uses US DMFCanadian DMF
EDMF / ASMF
COSJapanese DMF
Technical Package
1 Alfuzosin Hydrochloride Alphablocker � � � �
2 Amlodipine Besylate Anti Hypertensive � � � � �
3 Amlodipine Maleate Anti Hypertensive � �
4 Aripiprazole Antipsychotic � � �
5 Bendroflumethiazide Anti Hypertensive, Diuretic � � � �
6 Bisprolol Hemifumarate B-Blocker � � � � �
7 Brimonidine Tartrate Anti Glucoma ** � �
8 Buprenorphine Hydrochloride Post Operative Analgesic � � ◘ �
9 Clonidine Hydrochloride Anti Hypertensive � � �
10 Donepezil HydrochlorideCholinesterase Inhibitors, Alzhemier’s disease � � �
11 Eprosartan Mesylate Anti Hypertensive � � �
12 Fenofibrate * * �
13 Hydrochlorothiazide Anti Hypertensive, Diuretic � � � � ** �
14 Irbesartan Anti Hypertensive � * *
15 Lacidipine Anti Parkinson’s ** ** **
16 Lamotrigine Anti Epileptic � � � �
� Available ; ◘ Submitted; * Under Compilation; ** Proposed in the near future36

©Unichem Laboratories Ltd
UNICHEM
Key APIs
Sr. No
Current Product List Therapeutic Uses US DMFCanadian DMF
EDMF COSJapanese DMF
Technical Package
17 Losartan Potassium Anti Hypertensive � � ◘ �
18 Meloxicam COX II Inhibitor � * � � � �
19 Memantine HydrochlorideNMDA Receptor Antagonist, Alzheimer’s disease
� ��
20 MetronidazoneAnti Protozoal / Anti Amoebic � � �
21 Neteglinide (Form B) Antidiabetic � � �
22 Neteglinide (Form H) Antidiabetic ** ** �
23PhenylephrineHydrochloride
Nasal Decongestant ** ** ** �
24 Quetiapine Fumarate Anti Psychotic � * � ** �
25 Telmisartan Anti Hypertensive * * �
26 Tizanidine Hydrochloride Muscle Relaxant � � �
27 Valsartan Anti Hypertensive ** ** **
28 Zolpidem Tartrate Hypnotic � � � �
29 Zolmitriptan Anti-migrane � � ** �
�Available ; ◘ Submitted; * Under Compilation; ** Proposed in the near futureNote: Ready for Commercialization – Buspirone; Labetalol; Pramipexole Dihydrochloride; Ranolazine; TamsulosinHydrochloride; Tolterodine (All for USDMF, EDMF/ASMF and Technical Package)
37

©Unichem Laboratories Ltd
UNICHEM
Key APIs (Under Development)Sr. No Current Product List Therapeutic Uses US DMF EDMF Technical Package
1 Atomoxetine Hydrochloride Noradrenaline Reuptake Inhibitor ** ** **
2 Bepotastine Benzene Sulphonate Antihistamine ** ** **
3 Bimatoprost Ant-Glaucoma ** ** **
4 Brinzolamide Carbonic Anhydrase Inhibitors ** ** **
5 Cinacalcet HCl Anti-parathyroid, Ca-Binder ** ** **
6 Colsevelam HClAnticholeteremic, Cholesterol Lowering Agent
** ** **
7 Dabigatran Thrombin Inhibitor ** ** **
8 Dronedarone Cardiac Arrhythmias ** ** **
9 Duloxetine Hydrochloride Anti Depressant ** ** **
10 Eszopiclone Treatment of Insomnia ** ** **
11 Frovatriptan Succinate Anti-migraine ** ** **
12 Ivabradine Antianginal ** ** **
13 MilnacipranSerotonin-Norepinephrine Reuptake Inhibitors (SNRI)
** ** **
14 Paliperidone Schizophrenia ** ** **
15 Prasugrel Platelet Aggregation Inhibitor ** ** **
16 Rivastigmine Acetylcholinesterase Inhibitor ** ** **
17 Rizatriptan Benzoate Anti-migraine ** ** **
18 Sevelamer HCl Ohosphate Binding Agent ** ** **
19 Tadalafil PDE5 Inhibitor ** ** **
20 Warfarine Anticoagulant ** ** **38

©Unichem Laboratories Ltd
UNICHEMUSA/
Canada 2%
Europe, 78%
ROW 20%
Domestic 20%
Exports 80%
API - Total Revenue
Revenue Break-up by Segment
Export Revenue Break-up by Region
39
F Y 2012 - 13
Total API Revenue : Rs.105 Crores
USA / Canada
1 %
Europe 78 %
ROW 21 %
Domestic, 23%
Exports, 77%
Revenue Break-up by Segment
Total API Revenue : Rs. 118 Crores
Export Revenue Break-up by Region
F Y 2013 - 14
©Unichem Laboratories Ltd
UNICHEM
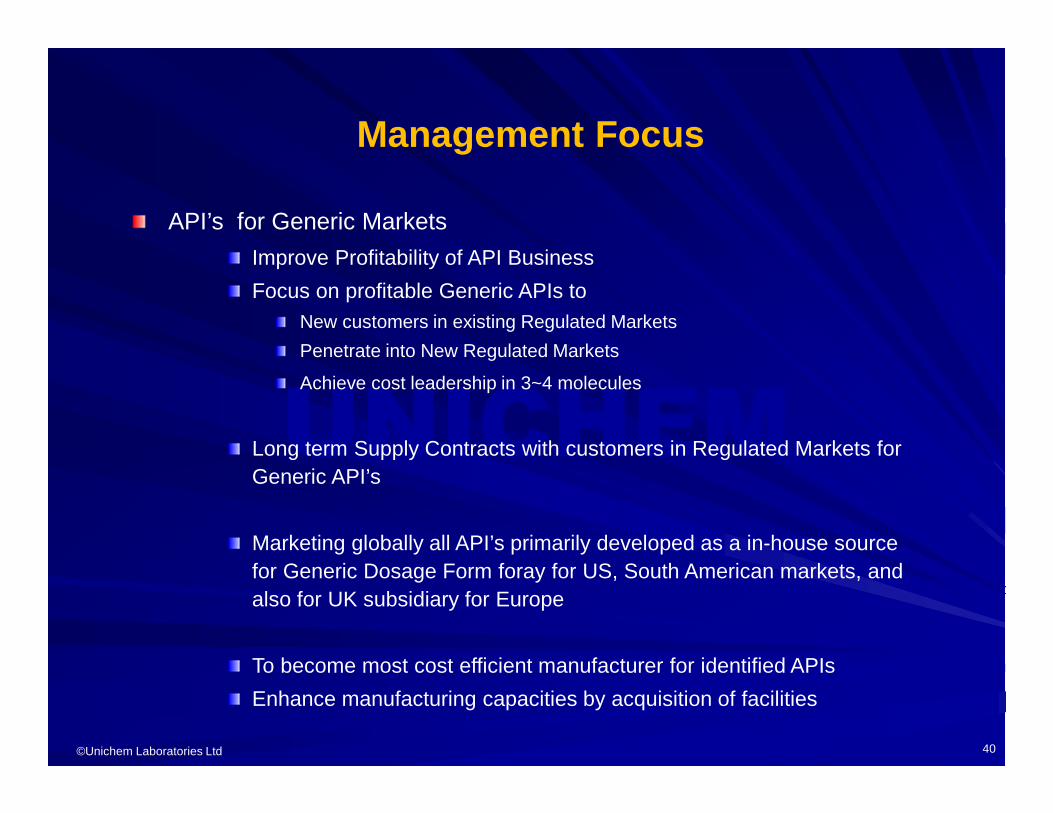
Management Focus
API’s for Generic Markets
Improve Profitability of API Business
Focus on profitable Generic APIs toNew customers in existing Regulated Markets
Penetrate into New Regulated Markets
Achieve cost leadership in 3~4 molecules
Long term Supply Contracts with customers in Regulated Markets for Generic API’s
Marketing globally all API’s primarily developed as a in-house source for Generic Dosage Form foray for US, South American markets, and also for UK subsidiary for Europe
To become most cost efficient manufacturer for identified APIs
Enhance manufacturing capacities by acquisition of facilities
40

©Unichem Laboratories Ltd
UNICHEM
Agenda
1. Profile & History
2. Growth & Profitability
3. Business Operations
– Domestic Operations
– International Operations
– API Operations
4. Research & Development
5. Management & Governance
6. Financials
41

©Unichem Laboratories Ltd
UNICHEM
FocusUnichem has a two fold R&D strategy
– Development of patent non-infringing processes for APIs– Development of Novel Drug Delivery Systems (NDDS)
Chemical R&D– Centre of Excellence at Goa offering the most conducive environment for value added research– Developed novel, innovative & efficient processes for 45 new generation molecules in various
therapeutic categories– Strong synthesis & analytical team fully equipped with latest facilities
Formulations R&D– State-of-the-art Pharma R & D facilities to undertake formulation development of Tablets, Capsules,
Liquid Orals, Creams, Ointments & Injectibles– Separate facilities for antibiotics– Pre-formulation laboratories to carry out drug-excepient compatibility studies and physical
characterization of API regarding compressibility and flow characteristics– Formulation services on contract research and development projects for a number of leading
European companies– Formulation Development and ANDA filings following QbD protocol
Biosimilar products at various stages of development– Recombinant DNA Technique– Fermentation based products– Monoclonal Anti Bodies
42
©Unichem Laboratories Ltd
UNICHEM
Agenda
1. Profile & History
2. Growth & Profitability
3. Business Operations
– Domestic Operations
– International Operations
– API Operations
4. Research & Development
5. Management & Governance
6. Financials
43

©Unichem Laboratories Ltd
UNICHEM
Management & Governance
Board of Directors(Dr. P A Mody; Mr. Prafull Anubhai; Mr. Ramdas M Gandhi;
Mr. Nasser Munjee; Mr. Prafull D Sheth; Mr. Anand Mahajan)
Audit CommitteeShareholders
Grievance Committee
Compensation Committee
Internal Auditor
Chairman & Managing Director
Divisional Heads
Statutory Auditors
Maintains high standards of Corporate Governance
Company Secretary & Compliance Officer
Chairman’s Office: IBD & Mkt Strategy, CEO – Pharmaceuticals; SBU Heads - Sales and Marketing; Manufacturing API; Manufacturing Dosage-form; Research & Development; Quality Assurance & Regulatory; Medical Affairs; Biosciences; Finance; Commercial & Logistics; Human Resources; Information Technology
44

©Unichem Laboratories Ltd
UNICHEM
Agenda
1. Profile & History
2. Growth & Profitability
3. Business Operations
– Domestic Operations
– International Operations
– API Operations
4. Research & Development
5. Management & Governance
6. Financials
45
©Unichem Laboratories Ltd
UNICHEM
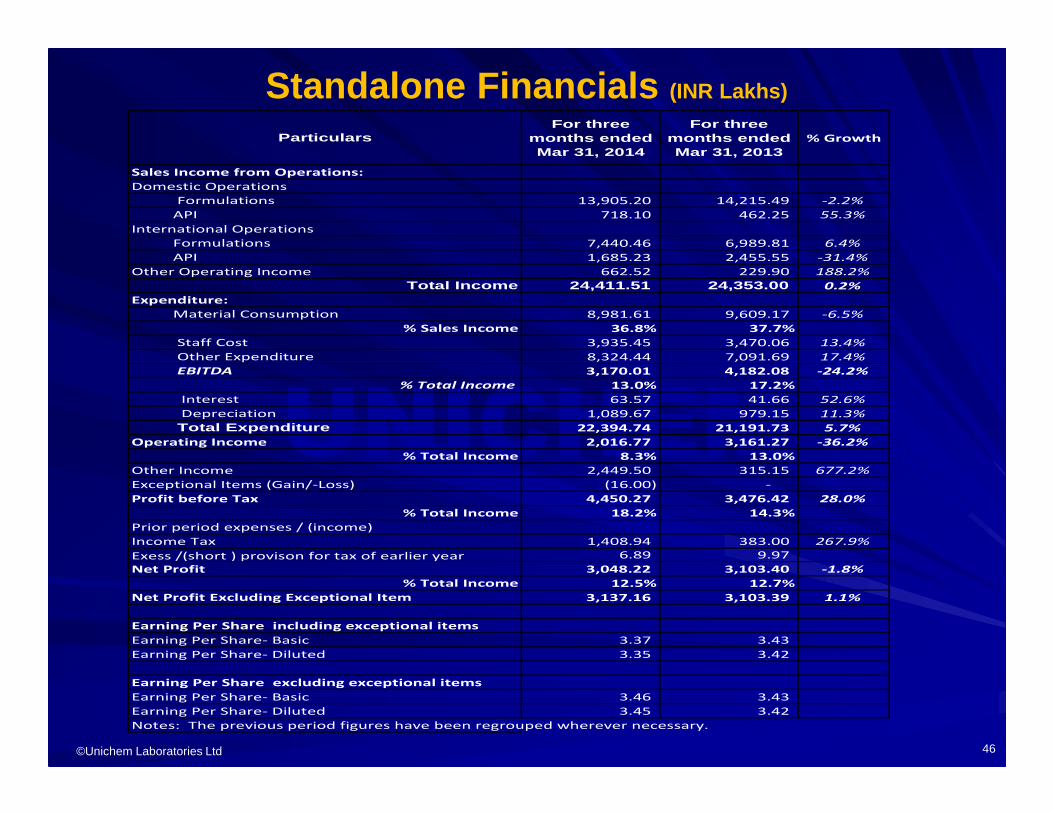
Standalone Financials (INR Lakhs)
46
For three months ended Mar 31, 2014
For three months ended Mar 31, 2013
% Growth
Sales Income from Operations:
Domestic Operations
13,905.20 14,215.49 -2.2%
718.10 462.25 55.3%
International Operations
7,440.46 6,989.81 6.4%
1,685.23 2,455.55 -31.4%
Other Operating Income 662.52 229.90 188.2%
24,411.51 24,353.00 0.2%
Expenditure:
8,981.61 9,609.17 -6.5%
36.8% 37.7%
3,935.45 3,470.06 13.4%
8,324.44 7,091.69 17.4%
3,170.01 4,182.08 -24.2%
13.0% 17.2%
63.57 41.66 52.6%
1,089.67 979.15 11.3%
22,394.74 21,191.73 5.7%
Operating Income 2,016.77 3,161.27 -36.2%
8.3% 13.0%
Other Income 2,449.50 315.15 677.2%
Exceptional Items (Gain/-Loss) (16.00) -
Profit before Tax 4,450.27 3,476.42 28.0%
18.2% 14.3%
Prior period expenses / (income)
Income Tax 1,408.94 383.00 267.9%
6.89 9.97
Net Profit 3,048.22 3,103.40 -1.8%
12.5% 12.7%
3,137.16 3,103.39 1.1%
Earning Per Share- Basic 3.37 3.43
Earning Per Share- Diluted 3.35 3.42
Earning Per Share- Basic 3.46 3.43
Earning Per Share- Diluted 3.45 3.42
Notes: The previous period figures have been regrouped wherever necessary.
Net Profit Excluding Exceptional Item
Earning Per Share including exceptional items
Earning Per Share excluding exceptional items
% Total Income
Total Expenditure Depreciation
Interest
Staff Cost
Other Expenditure
EBITDA
Particulars
Exess /(short ) provison for tax of earlier year
Formulations
API
Formulations
API
Material Consumption
% Sales Income
% Total Income
Total Income
% Total Income
% Total Income

©Unichem Laboratories Ltd
UNICHEM
Standalone Financials (Full year, INR Lakhs)
47
Year ended Mar 31, 2014
Year ended Mar 31, 2013
% Growth
Sales Income from Operations:
Domestic Operations
65,502.04 63,528.70 3.1%
2,698.81 2,091.92 29.0%
International Operations
25,519.69 25,267.23 1.0%
9,171.54 8,798.10 4.2%
Other Operating Income 1,525.42 835.74 82.5%
104,417.50 100,521.69 3.9%
Expenditure:
37,104.12 37,919.66 -2.2%
35.5% 37.7%
16,208.87 14,114.73 14.8%
32,991.30 29,919.56 10.3%
18,113.21 18,567.74 -2.4%
17.3% 18.5%
248.16 248.16 0.0%
4,266.58 3,481.65 22.5%
90,819.03 85,683.76 6.0%
Operating Income 13,598.47 14,837.93 -8.4%
13.0% 14.8%
Other Income 4,283.91 1,406.70 204.5%
Exceptional Items (Gain/-Loss) 4,900.55 -
Profit before Tax 22,782.93 16,244.63 40.2%
21.8% 16.2%
Prior period expenses / (income)
Income Tax 5,093.00 3,295.00 54.6%
6.89 9.97
Net Profit 17,696.83 12,959.60 36.6%
16.9% 12.9%
13,582.27 12,959.60 4.8%
Earning Per Share- Basic 19.54 14.33
Earning Per Share- Diluted 19.47 14.29
Earning Per Share- Basic 15.00 14.33
Earning Per Share- Diluted 14.94 14.29
Notes: The previous period figures have been regrouped wherever necessary.
Net Profit Excluding Exceptional Item
Earning Per Share including exceptional items
Earning Per Share excluding exceptional items
% Total Income
Total Expenditure Depreciation
Interest
Staff Cost
Other Expenditure
EBITDA
Particulars
Exess /(short ) provison for tax of earlier year
Formulations
API
Formulations
API
Material Consumption
% Sales Income
% Total Income
Total Income
% Total Income
% Total Income
©Unichem Laboratories Ltd
UNICHEM
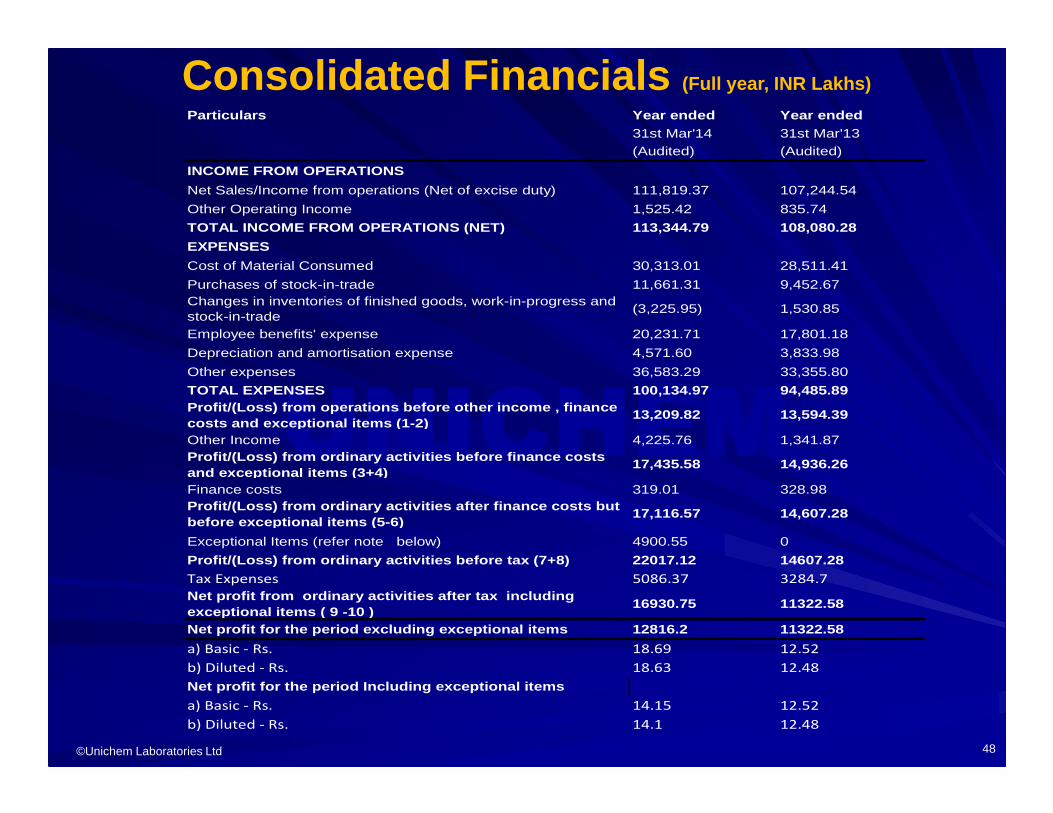
Consolidated Financials (Full year, INR Lakhs)
48
Particulars Year ended Year ended31st Mar'14 31st Mar'13(Audited) (Audited)
INCOME FROM OPERATIONS
Net Sales/Income from operations (Net of excise duty) 111,819.37 107,244.54
Other Operating Income 1,525.42 835.74
TOTAL INCOME FROM OPERATIONS (NET) 113,344.79 108,080 .28
EXPENSES
Cost of Material Consumed 30,313.01 28,511.41
Purchases of stock-in-trade 11,661.31 9,452.67Changes in inventories of finished goods, work-in-progress and stock-in-trade
(3,225.95) 1,530.85
Employee benefits' expense 20,231.71 17,801.18
Depreciation and amortisation expense 4,571.60 3,833.98
Other expenses 36,583.29 33,355.80
TOTAL EXPENSES 100,134.97 94,485.89Profit/(Loss) from operations before other income , finance costs and exceptional items (1-2)
13,209.82 13,594.39
Other Income 4,225.76 1,341.87Profit/(Loss) from ordinary activities before finan ce costs and exceptional items (3+4)
17,435.58 14,936.26
Finance costs 319.01 328.98Profit/(Loss) from ordinary activities after financ e costs but before exceptional items (5-6)
17,116.57 14,607.28
Exceptional Items (refer note below) 4900.55 0
Profit/(Loss) from ordinary activities before tax ( 7+8) 22017.12 14607.28
Tax Expenses 5086.37 3284.7
Net profit from ordinary activities after tax inc luding exceptional items ( 9 -10 )
16930.75 11322.58
Net profit for the period excluding exceptional ite ms 12816.2 11322.58
a) Basic - Rs. 18.69 12.52
b) Diluted - Rs. 18.63 12.48
Net profit for the period Including exceptional ite ms
a) Basic - Rs. 14.15 12.52
b) Diluted - Rs. 14.1 12.48
©Unichem Laboratories Ltd
Thank You