Unfolding CspB by means of biased molecular dynamics
17
Chapter 4 Unfolding CspB by means of biased molecular dynamics 4.1 Introduction Understanding the mechanism of protein folding has been a major challenge for the last twenty years, as pointed out in the first chapter. To this end, the study of energetics and structures of the intermediates of folding and unfolding is of crucial importance. A wide experimental work has been dedicated to the analysis of the transition state of simple protein folding reactions. Small proteins, folding with a two-state mechanism, are particularly suited for such studies [93, 94]. Theory can generally be a useful complement to experiments [95]. While simulation of the pro- tein folding process with conventional molecular dynamics (MD) is practically unfeasible due to computational limitations [96, 41], the unfolding process can be simulated by applying suit- able unfolding conditions that can be elevated temperatures, changes of pH and ionic strength but also other artificial unfolding mechanisms [97, 98]. Partial unfolding can be simulated by MD trajectories at elevated temperatures, the most natural way of providing the necessary energy to push the protein across energetic barriers in phase space [99, 100]. However, MD simulations at elevated temperatures have the drawback that for too high temperatures the free energy landscape is no longer comparable to the situation at room temperature whereas at mod- erate temperatures the sampling of non-native conformations may still be rather limited. Thus, it is generally difficult to obtain statistically reliable results in that way. Recently, Paci and Karplus [101, 102] applied in the framework of MD with CHARMM [29] an unfolding method called biased MD (BMD), originally proposed by Marchi and Ballone [103], which allows pushing a protein towards unfolded states characterized by a large radius of gyration or large root mean square (RMS) deviation with respect to the native structure. From the equilibrium fluctuations of the protein the bias selects the fluctuations that lead to ex- tended structures, and accelerates in this way the exploration of more extended unfolded states. 47
Transcript of Unfolding CspB by means of biased molecular dynamics

Chapter 4
Unfolding CspB by means of biased
molecular dynamics
4.1 Introduction
Understanding the mechanism of protein folding has been a major challenge for the last twenty
years, as pointed out in the first chapter. To this end, the study of energetics and structures of
the intermediates of folding and unfolding is of crucial importance. A wide experimental work
has been dedicated to the analysis of the transition state ofsimple protein folding reactions.
Small proteins, folding with a two-state mechanism, are particularly suited for such studies
[93, 94].
Theory can generally be a useful complement to experiments [95]. While simulation of the pro-
tein folding process with conventional molecular dynamics(MD) is practically unfeasible due
to computational limitations [96, 41], the unfolding process can be simulated by applying suit-
able unfolding conditions that can be elevated temperatures, changes of pH and ionic strength
but also other artificial unfolding mechanisms [97, 98]. Partial unfolding can be simulated
by MD trajectories at elevated temperatures, the most natural way of providing the necessary
energy to push the protein across energetic barriers in phase space [99, 100]. However, MD
simulations at elevated temperatures have the drawback that for too high temperatures the free
energy landscape is no longer comparable to the situation atroom temperature whereas at mod-
erate temperatures the sampling of non-native conformations may still be rather limited. Thus,
it is generally difficult to obtain statistically reliable results in that way.
Recently, Paci and Karplus [101, 102] applied in the framework of MD with CHARMM [29]
an unfolding method called biased MD (BMD), originally proposed by Marchi and Ballone
[103], which allows pushing a protein towards unfolded states characterized by a large radius
of gyration or large root mean square (RMS) deviation with respect to the native structure.
From the equilibrium fluctuations of the protein the bias selects the fluctuations that lead to ex-
tended structures, and accelerates in this way the exploration of more extended unfolded states.
47

48 Chapter 4. Unfolding CspB by means of biased molecular dynamics
Although this unfolding mechanism is rather mild, the protein can easily unfold completely and
the amount of energy the protein can gain by folding back to the compact native state is usually
small (less than 5 kcal/mol, see section Results). One of thefrequently studied model systems
for protein folding is the cold shock protein CspB, a bacterial protein whose crystal structure
is available fromBacillus Caldolyticus (Bc-CspB, 66 residues) and fromBacillus Subtilis (Bs-
CspB 67 residues). With the homologous proteins fromEscherichia coli and fromThermotoga
maritima these small five-strandedβ-barrel proteins share a two-state folding mechanism and
a native-like transition state [104], but they differ significantly in stability [105, 106]. For
instance, the difference in the Gibbs free energy of denaturation at pH 7 between the cold
shock protein Bc-CspB, biologically active inBacillus Caldolyticus, a thermophilic organism,
and its homologous Bs-CspB (fromBacillus Subtilis, a mesophilic organism) is about 15.8
KJ/mol [107]. For both proteins extensive data on structure, stability and kinetics are available
[107, 104, 105, 108]. Moreover, they have been studied by systematic mutagenesis and some
mutants of Bc-CspB have been crystallized and characterized in terms of folding and stability
properties [109].
In this work, we apply a variant of the BMD method to study the unfolding of the thermophilic
protein Bc-CspB (see Fig. 1) and its mutants R3E and E46A, which share the native structure
with the wild type. We are interested in gaining insights into possible mechanisms of unfolding,
which will be discussed in comparison with experimental results.
4.2 Methods
We present a set of MD simulation data that were performed by using the Langevin dynamics
algorithm implemented in the program CHARMM [29] with friction constantβ = 2 ps−1,
which maintains the protein at a constant temperature. Eachone of the generated trajectories
covers several nanoseconds of dynamics. In order to save computer time and memory, we used
an implicit solvent model, namely the EEF1 model introducedby Lazaridis and Karplus [65]
that is available in CHARMM27 and was discussed in chapter 3.
The crystal structure of the cold shock protein (PDB code 1C90) [105] exhibits two molecules
in the unit cell whose RMS deviation for all atoms is 1.17 Å. For our computations, we took
chain B ( fig. 4.1). The side chains were positioned accordingto the most frequent occupied
conformers. We added hydrogen atoms with the HBUILD tool from CHARMM and optimized
their coordinates by minimizing the energy with fixed positions for all other atoms. To get
different initial coordinates for the MD simulations of unfolding we ran an MD simulation of
1 ns at T= 300K from which we extracted 10 snapshots, one aftereach 100 ps simulation time.
The same procedure was applied to the two mutants, R3E and E46A, whose crystal structures
were published in [109].
The RMS deviation for all atoms in the crystal structure is 1.4 Å for the mutant R3E and 1.27
Å for E46A.

4.2. Methods 49
Figure 4.1: Two views of the crystal structure (chain B) of Bc-Csp, view on the right rotatedby 90◦ relative to view on the left. The three-stranded beta sheet (I-II-III, residues 1 to 30) isconnected to the two-stranded beta sheet (IV-V, residues 45to 66) via a flexible loop region (L).Important non local contacts are those between strands I (residues 1 to 10) and IV (residues 45to 57) and those between strand III/loop L (residues 30 to 44)and strand V (residues 59 to 66).
4.2.1 Biased unfolding
The protein unfolding procedure in this study is based on theBMD method introduced and
implemented in CHARMM28 by Paci et al. [101, 102]. In ref. [101] the BMD method was
formulated using the distanceρNC between the N- and C-terminal Cα atoms to characterize the
state of unfolding. In ref. [102] and in the present study a more general global coordinateρis used, which is a function of all or a selection of atomic coordinates of the protein. It serves
to characterize the distance of an actual protein structurefrom a reference structure, which is
generally chosen to be the native structure. This global coordinateρ can be considered to be
the reaction coordinate for protein unfolding. It is related to the conventional radius of gyration
of the protein (eq. 4.4) or more generally refers to the RMS deviation with respect to the native
structure.
To force the protein to explore regions of phase space where the reaction coordinateρ(t) is large
corresponding to extended, unfolded conformations, with increasing t, time of MD simulation,
an energy perturbation term is added to the molecular force field. It has the form of a one-sided
harmonic potential in the reaction coordinateρ(t), with force constantA:
W (ρ(t)) =
{
12A(ρ(t)−ρM(t))2 ρ < ρM(t)
0 ρ ≥ ρM(t)(4.1)
whereρM(t) is the maximum value ofρ(t) reached during the previous time steps of the MD
trajectory, namely
ρM(t) = maxt ′<t
ρ(t ′) (4.2)

50 Chapter 4. Unfolding CspB by means of biased molecular dynamics
As a consequence, the fluctuations of the considered proteinare biased such that the protein
moves freely (unbiased) if it increases its value ofρ(t), whereas motions that lead to lower val-
ues ofρ(t) are hindered by transforming the corresponding kinetic energy in potential energy.
The potential energy is subsequently released again in kinetic energy and used to increase the
reaction coordinateρ(t). We define the reaction coordinate of unfoldingρ(t) as follows
ρ(t) =
[
1N(N −1)
N
∑i, j=1
(ri, j − rrefi, j )
α
]1α
(4.3)
whereα > 0, ri, j are the distance vectors between atoms i and j at time t andrrefi, j are the
distance vectors that belong to the reference structure. The sum runs over a selection of atom
pairs i, j = 1, . . . ,N of the protein. In the present case, the subset of Cα atoms is used for
the sum over atom pairs. If therrefi, j are set to zero in eq. (4.3), we obtain the definition of a
generalized radius of gyration, where the variableρ(t) increases when any of the atom pairs
moves further apart.
We modified the original definition ofρ(t) of ref. [102] with respect to two features. We
applied a root to obtain an expression that has dimension of length. This renders the bias forces
derived from the energy expression in eq. 4.1 to be harmonic,i.e. linear with respect to the
reaction coordinateρ(t). A second and more important generalization is that we substituted
the exponent of power 2 from the conventional definition of the radius of gyration (eq. 4.4) by
an exponentα (α > 0) that can be set by the user. This introduces a control over the strength
of the bias forces acting at the atomic level. Ifα is greater than 1 the distances of atoms that
are far from each other in the initial state will increase more strongly and ifα is smaller than 1
a stronger force will be applied to atom pairs that are at distances close to the reference value .
In our present study, we setα = 1 to achieve that the bias forces are evenly applied to all atom
pairs, regardless of their initial mutual distances. In thesubsequent analysis of the results, the
standard radius of gyration is also used as a conventional measure for the degree of unfolding
of the molecule. It is defined as:
Rgyr =
[
1N(N −1)
N
∑i, j=1
(ri, j)2
]12
(4.4)
The sum runs over the Cα atom pairs i, j=1, . . . , N of the protein and theri, j are the distances
between them.
4.2.2 Contact analysis
Monitoring the time course of residue pair contacts by creating the so called "disappearance
plots"[110] is a useful tool in the structural analysis of the unfolding process of proteins. A
sample of snapshots is extracted from different trajectories, belonging to the same ensemble
of simulations where we used the same unfolding conditions,but different initial structures.

4.3. Results and discussion 51
For each structure obtained in that way the residue pair contacts are counted. Two residues
are considered to be in contact if the distance between theirCα atoms is less than 6.5 Å. By
projecting the contact map of one of these structures onto the native contact map (shown in fig.
4.2) one gets the number of conserved contacts for that considered structure. The structures
are then classified according to the relative number of residual native contacts into four groups
with 0-25%, 25-50%, 50-75% and 75-100% of maintained nativecontacts. Thus, each group
represents a specific stage of the unfolding process. Withinone group of structures, the average
occupancy of each native contact is computed, in order to distinguish between robust, i.e.
highly conserved, native contacts and the ones that disappear more promptly.
4.3 Results and discussion
For the wild type protein two sets of unfolding simulations were performed: one with bias
potential at room temperature (300 K), the other unbiased atelevated temperature (400 K).
The results of the former dataset were compared to the latter, given by pure thermal unfolding
simulations. All data were analyzed in terms of disappearance of native contacts. The aim of
this analysis is double: on one hand, we are interested in comparing the biased unfolding to
the standard thermal unfolding, in order to exclude distortion effects due to the bias; on the
other hand, by outlining the common features of the results,we would like to derive structural
properties of the unfolding process. The biased unfolding simulations were applied with a bias
force constant A = 50 kcal/Å2 (see eq 4.1) on the set of ten initial structures. Since the bias
changes the thermal fluctuations, unfolding is exceedinglyaccelerated at higher temperatures.
To speed up unfolding at lower temperature, a larger value ofA is required. But, since we
are interested in determining the properties of the first unfolding steps, near to the transition
state, that in experiments was found to be very native-like [94, 108], a small bias force was
preferred. This required to enlarge the simulation time, inorder to reach completely extended
protein conformations. The comparison between biased and unbiased simulations is presented
in the next subsection. Under the same conditions as for the wild type protein (T=300K, force
constant A = 50 kcal/Å2), biased unfolding simulations were also performed for thetwo mu-
tants E46A and R3E of Bc-CspB. The three native molecules arestable in the EEF1 potential
at room temperature, as we checked by running a control unbiased MD simulation of 10 ns.
The RMS deviation of Cα atoms from the crystal structure is 1.72 Å for the wild type protein,
1.59 Å for mutant E46A, 1.53 Å for mutant R3E. The average radius of gyration (taking only
Cα atoms into account) is respectively 10.4 Å, 10.4 Å and 10.3 Å.

52 Chapter 4. Unfolding CspB by means of biased molecular dynamics
[h] 0 10 20 30 40 50 60 700
10
20
30
40
50
60
70
I-II
II-III
I-IV
III-V
IV-V
Figure 4.2: The native contact map of Bc-Csp, according to the definition in section 4.2.2.The anti-diagonals refer to contacts involving antiparallel beta strands and are correspondinglylabeled.
4.3.1 Wild type protein: biased unfolding at room temperature
4.3.1.1 Early phase of unfolding
Ten trajectories at 300K each one 5 ns long were simulated with a bias force constant of A=50
kcal/Å2. Under these conditions a partial unfolding can generally be achieved within a few
nanoseconds, although the protein cannot reach a completely extended structure (see fig. 4.3).
0 1000 2000 3000 4000 5000time (ps)
10
11
12
13
14
Ra
diu
s o
f g
yra
tion
(Å
)
Figure 4.3: Increase of the radius of gyration Rgyr (eq. 4.4)with time. Ten trajectories oflength 5 ns were generated with biased unfolding simulations at T = 300 K as described in text.
However, by enlarging the simulation time or by increasing the force constant A we could
easily obtain a completely unfolded protein structure (seefig. 4.5 a, whose RMS deviations
demonstrate that some of the trajectories result in an almost complete unfolding of the protein
after 12 ns simulation time of BMD). We will come back to this point in the next subsection.
In this section, we focus on the properties of the partially unfolded states of the protein. After 5
nanoseconds, in six out of ten trajectories, the protein reaches a partially unfolded state where

4.3. Results and discussion 53
the protein structure is still rather compact with a radius of gyration below 14 Å, as compared to
the value of 10.5 Å for the crystal structure (only Cα atoms are taken into account). Visualizing
the trajectories one can extract qualitative properties ofthe initial unfolding steps. These are
summarized here and illustrated in fig. 4.4.
The very first unfolding event results in a change of protein conformation that usually occurs in
the loop region between strands III and IV. Due to its flexibility, the loop can easily be stretched
applying the bias potential. This is observed for all ten trajectories. Strand III is often involved
in the next structural change. In four out of the six trajectories, in which significant unfolding
events can be observed, strand III diverges from strand II (see for instance fig. 4.4 a and b).
In one trajectory the first conformational change involves the two-stranded beta-sheet (strands
IV and V, 4.4 part c), whose hydrogen bonds get disrupted within the first two nanoseconds.
In another trajectory neither the two-stranded, nor the three-stranded beta-sheet is destroyed,
instead the beta-barrel opens up and the contact between strand I and strand IV is strongly
reduced (fig. 4.4 d).
Four trajectories, where no major structural changes occurred, exhibit larger RMS fluctuations
in the strands III and IV, next to the loop region.
4.3.1.2 Later phase of unfolding
The MD simulation of three trajectories from the previous simulations was continued for an-
other 5 ns; two trajectories were prolonged for 7 ns, to investigate the subsequent unfolding
events. As mentioned before, the unfolding process needs much more time at room tempera-
ture than at elevated temperature, however increasing the force constant A of the bias potential
would have a similar effect as raising the temperature. The expansion of Rgyr is correlated
with the loss of native Cα contacts in Fig. 4B. We note that at the early stages of unfolding
some native contacts are lost before the protein starts to expand.
We observed (fig. 4.3) that in the time dependence of the radius of gyration (eq.4.4) at least two
extended plateau regions are present for all trajectories after which rapid unfolding continues.
The first plateau region is at a radius of gyration of about 11.5-12 Å, the second plateau is at
higher values, namely 13.5-14 Å. These plateaus correspondto a phase of unfolding where the
protein structure does not change and the protein tries to overcome an energy barrier. When the
second barrier is surmounted, i.e. at the end of the second plateau, the protein unfolds rapidly.
This event corresponds to the disruption of the non-local contacts primarily between strands I
and IV. At this point, the non-local contact between strand III and strand V is disrupted as well.
In one case, even after 12 ns the protein practically did not unfold (fig. 4.5). Here, the structure
obtained after 5 ns was conserved for the remaining simulation time. This structure is shown
in fig. 4.4. This means that the non-local contacts between strands I and IV and between strand
V and the stand III, whose disruption would lead to an increase of the radius of gyration, are
indeed very stable.
Our observations are confirmed by the analysis of the disappearance of contacts (see Fig. 6).
54 Chapter 4. Unfolding CspB by means of biased molecular dynamics
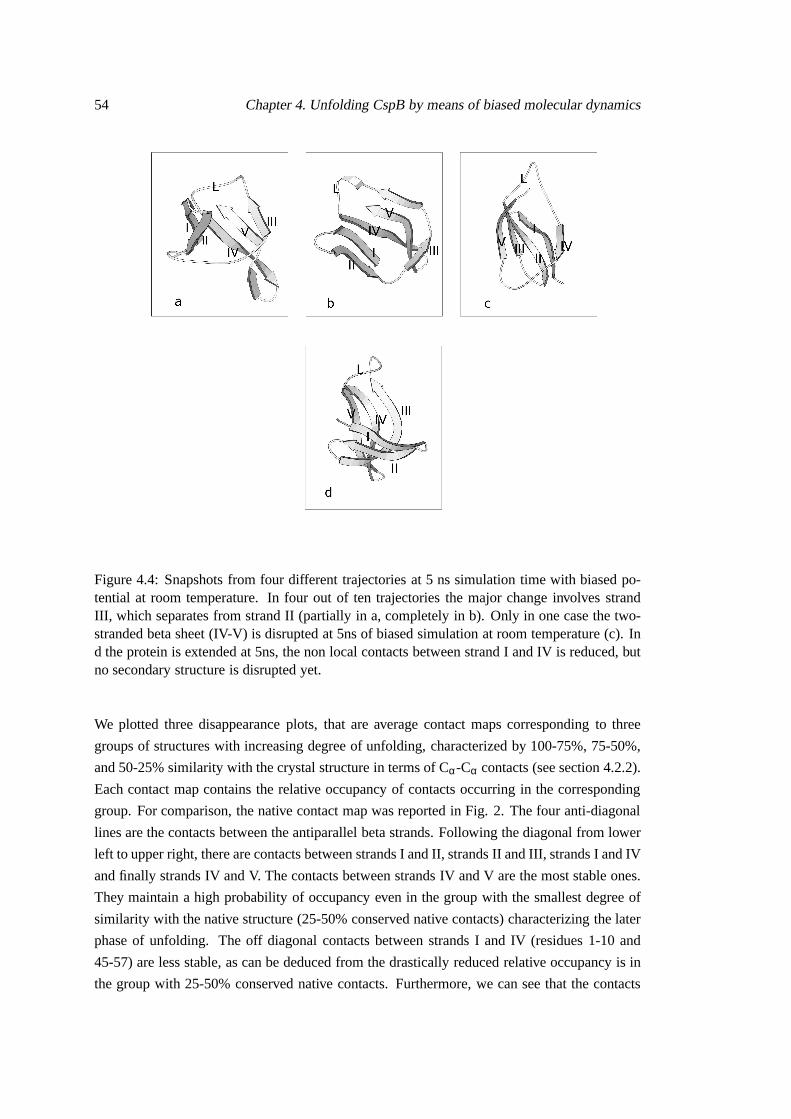
Figure 4.4: Snapshots from four different trajectories at 5ns simulation time with biased po-tential at room temperature. In four out of ten trajectoriesthe major change involves strandIII, which separates from strand II (partially in a, completely in b). Only in one case the two-stranded beta sheet (IV-V) is disrupted at 5ns of biased simulation at room temperature (c). Ind the protein is extended at 5ns, the non local contacts between strand I and IV is reduced, butno secondary structure is disrupted yet.
We plotted three disappearance plots, that are average contact maps corresponding to three
groups of structures with increasing degree of unfolding, characterized by 100-75%, 75-50%,
and 50-25% similarity with the crystal structure in terms ofCα-Cα contacts (see section 4.2.2).
Each contact map contains the relative occupancy of contacts occurring in the corresponding
group. For comparison, the native contact map was reported in Fig. 2. The four anti-diagonal
lines are the contacts between the antiparallel beta strands. Following the diagonal from lower
left to upper right, there are contacts between strands I andII, strands II and III, strands I and IV
and finally strands IV and V. The contacts between strands IV and V are the most stable ones.
They maintain a high probability of occupancy even in the group with the smallest degree of
similarity with the native structure (25-50% conserved native contacts) characterizing the later
phase of unfolding. The off diagonal contacts between strands I and IV (residues 1-10 and
45-57) are less stable, as can be deduced from the drastically reduced relative occupancy is in
the group with 25-50% conserved native contacts. Furthermore, we can see that the contacts

4.3. Results and discussion 55
5000 6000 7000 8000 9000 10000 11000 12000time (ps)
0
10
20
30
40
50
60
Ra
diu
s o
f g
yra
tion
(Å
)
0 1 2 3 4 5 6 7 8 9 10 11 12time (ns)
0
50
100
150
nu
mb
er
of
na
tive
co
nta
cts
Figure 4.5: Left: increase of radius of gyration Rgyr from data of five trajectories between 5ns and 12 ns simulation time with bias potential at T=300K; Right:. A set of structures wasextracted by picking out one snapshot each 200 ps from all simulated trajectories at room tem-perature. The number of native Cα-Cα contacts of each structure is plotted here as a functionof the radius of gyration Rgyr.
between strand II and III (residues 11-22 and 23-30), and those between strand III and V
(residues 23-29 and residues 59-66) are disrupted first during the unfolding process, since they
begin to disappear already in the second group with 50-75% conserved native contacts.
0 10 20 30 40 50 60 700
10
20
30
40
50
60
70
0-50%51-70%>70%
0 10 20 30 40 50 60 700
10
20
30
40
50
60
70
0-50%51-70%>70%
0 10 20 30 40 50 60 700
10
20
30
40
50
60
70
0-50%51-70%>70%
Figure 4.6: Biased simulations at T=300K. Left, occupancy in the group containing more than75% conserved native contacts; center, between 50% and 75% conserved contacts; right, lessthan 50% conserved contacts.
4.3.2 Simulation of unfolding at elevated temperature
Ten trajectories were generated at T = 400K without bias potential with a length of 12-15 ns
that lead to a partial unfolding of the protein. The loss of native Cα contacts is only in a few
cases larger than 50% (see fig. 4.7, right). In comparison to the biased trajectories (fig. 4.5)
we observe that the thermal simulation data present a much weaker correlation between degree
of expansion and loss of native contacts, which could be expected. Nevertheless, the analysis
of contact disappearance plots, limited to three groups (over 75%, between 50-75%, between

56 Chapter 4. Unfolding CspB by means of biased molecular dynamics
25-50% conserved native contacts) leads to results that do not differ substantially from the
ones obtained with the bias potential at room temperature (Fig. 8). Good agreement between
the data obtained with the two different simulation conditions for unfolding is reached with
respect to the three-strandedβ-sheet (strands I, II, III). Both in the thermal and in the biased
simulations the third strand is destabilized in the early stages of unfolding. Also, the non-local
contacts between strands I and IV and between III and V are about to be disrupted at the later
stage of unfolding where only 25-50% native contacts remainconserved.
0 2000 4000 6000 8000 10000time (ps)
10
10,5
11
11,5
12
12,5
13
Ra
diu
s o
f g
yra
tion
(Å
)
0 1 2 3 4 5 6 7 8 9 10 11 12 13 1415time (ns)
0
20
40
60
80
100
120
140
nu
mb
er
of
na
tive
co
nta
cts
Figure 4.7: Left: Increase of the radius of gyration Rgyr with time in thermal unfolding simula-tions. Ten trajectories of length 10 ns were generated without bias potential at T=400K. B: Asfor the biased simulations, a set of structures was extracted by picking out one snapshot each200 ps from all simulated trajectories at elevated temperature. The number of native Cα-Cαcontacts of each structure is plotted here as a function of the radius of gyration Rgyr .
0 10 20 30 40 50 60 700
10
20
30
40
50
60
70
0-50%51-70%>70%
0 10 20 30 40 50 60 700
10
20
30
40
50
60
70
0-50%51-70%>70%
0 10 20 30 40 50 60 700
10
20
30
40
50
60
70
0-50%51-70%>70%
Figure 4.8: Contact disappearance plots for unbiased simulations at T=400K. Left, occupancyin the group containing more than 75% conserved native contacts; center, between 50% and75% conserved contacts; right, less than 50% conserved contacts.
4.3.3 Biased unfolding of mutants
The biased unfolding of the mutants E46A and R3E of Bc-Csp wassimulated using the same
bias conditions as for the wild type protein (T = 300K, bias force constant A = 50 kcal/Å). For
4.3. Results and discussion 57
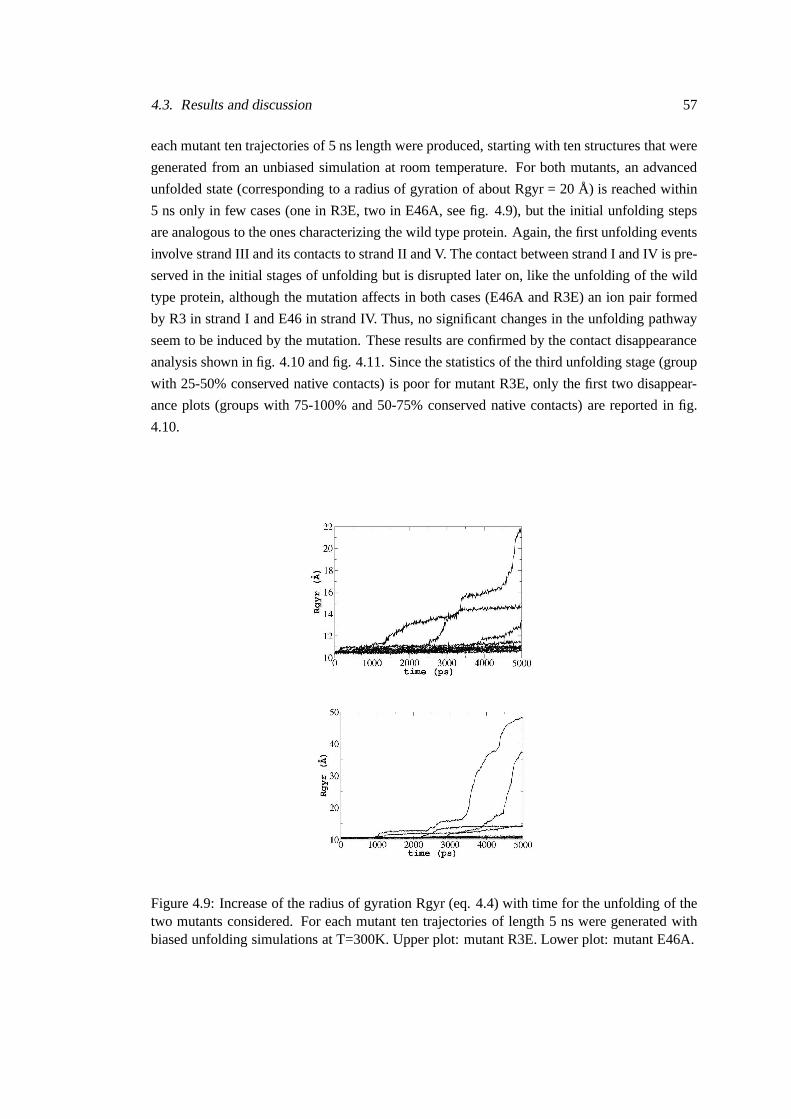
each mutant ten trajectories of 5 ns length were produced, starting with ten structures that were
generated from an unbiased simulation at room temperature.For both mutants, an advanced
unfolded state (corresponding to a radius of gyration of about Rgyr = 20 Å) is reached within
5 ns only in few cases (one in R3E, two in E46A, see fig. 4.9), butthe initial unfolding steps
are analogous to the ones characterizing the wild type protein. Again, the first unfolding events
involve strand III and its contacts to strand II and V. The contact between strand I and IV is pre-
served in the initial stages of unfolding but is disrupted later on, like the unfolding of the wild
type protein, although the mutation affects in both cases (E46A and R3E) an ion pair formed
by R3 in strand I and E46 in strand IV. Thus, no significant changes in the unfolding pathway
seem to be induced by the mutation. These results are confirmed by the contact disappearance
analysis shown in fig. 4.10 and fig. 4.11. Since the statisticsof the third unfolding stage (group
with 25-50% conserved native contacts) is poor for mutant R3E, only the first two disappear-
ance plots (groups with 75-100% and 50-75% conserved nativecontacts) are reported in fig.
4.10.
Figure 4.9: Increase of the radius of gyration Rgyr (eq. 4.4)with time for the unfolding of thetwo mutants considered. For each mutant ten trajectories oflength 5 ns were generated withbiased unfolding simulations at T=300K. Upper plot: mutantR3E. Lower plot: mutant E46A.

58 Chapter 4. Unfolding CspB by means of biased molecular dynamics
0 10 20 30 40 50 60 700
10
20
30
40
50
60
70
0-50%51-70%>70%
0 10 20 30 40 50 60 700
10
20
30
40
50
60
70
0-50%51-70%>70%
Figure 4.10: Contact disappearance plots of simulations with bias potential for mutant R3E atT=300K. Left, occupancy in the group containing more than 75% conserved native contacts;right, between 50% and 75% conserved contacts.
0 10 20 30 40 50 60 700
10
20
30
40
50
60
70
0-50%51-70%>70%
0 10 20 30 40 50 60 700
10
20
30
40
50
60
70
0-50%51-70%>70%
0 10 20 30 40 50 60 700
10
20
30
40
50
60
70
0-50%51-70%>70%
Figure 4.11: Contact disappearance plots of simulations with bias potential for mutant E46Aat T=300K. Left, occupancy in the group containing more than75% conserved native contacts;center, between 50% and 75% conserved contacts; right, lessthan 50% conserved contacts.
4.3.4 Energetics of unfolding for the wild type and mutant proteins
Several contributions to the total energy of the wild type protein and of the two mutants were
recorded and analyzed during unfolding with a bias potential. The total energy is evaluated
as the sum of all terms of the CHARMM energy function representing electrostatic, Van der
Waals, all bonded energy terms and the solvation free energyaccounting for solvent effects in
the frame of the EEF1 solvent model [65], but excluding contributions from the bias potential.
For each protein the ten initial trajectories of 5 ns length were analyzed. The total energy
was evaluated in steps of one picosecond yielding a total of 50000 energy values for the ten
trajectories from each of the three considered proteins (the native and the two mutants). The
50000 energy values were first ordered according to the corresponding value of the reaction
coordinateρ , eq. 4.3, that characterizes the degree of unfolding of the protein. From these data
a histogram with bin size 0.1 Å was created, which describes the sampling of the coordinate

4.3. Results and discussion 59
space explored by the unfolding simulations with bias potential, as a function of the reaction
coordinateρ . In order to obtain the dependence of the total energy versusρ, averages of the
energies were calculated within each bin of the histogram. Results are shown in fig. 4.12. By
comparing the total energies of the three proteins near to the native state (small values ofρ),
it turns out that the mutant E46A does not differ significantly from the wild type, whereas the
mutant R3E exhibits higher energy values. The calculated variation in energy for the individual
bins of the histogram, not shown in the plots, is on average below 20 kcal/mol for the total
energy, and about 10 kcal/mol for the single energy contributions, for all three molecules. The
energy difference between mutant R3E and wild type is mainlydue to the electrostatic term,
as shown in fig.4.12 , whereas the differences in Van der Waalsand solvation energies are less
pronounced. This result agrees qualitatively well with theexperimental data in ref. [106],
where it is stated that the mutation R3E significantly reduces the stability of Bc-Csp, mainly
because of electrostatic repulsion, whereas under the sameconditions the mutation E46A leads
only to a minor destabilization of the protein. This is another confirmation that the ion pair
R3-E46 does not yield a significant stabilizing contribution to the wild type protein.
14 15 16 17 18 19 20ρ (Angstroms)
-1580
-1560
-1540
-1520
-1500
-1480
ener
gy (
Kca
l/mol
)
wild typeE46AR3E
Total effective energy
14 15 16 17 18 19 20ρ (Angstroms)
-1080
-1060
-1040
-1020
-1000
ener
gy (
Kca
l/mol
)
wild typeE46AR3E
Electrostatic energy
14 15 16 17 18 19 20ρ (Angstroms)
-460
-440
-420
-400
-380
-360
ener
gy (
Kca
l/mol
)
wild typeE46AR3E
Van der Waals energy
14 15 16 17 18 19 20ρ (Angstroms)
-740
-720
-700
-680
-660
-640
ener
gy (
Kca
l/mol
)
wild typeE46AR3E
Solvation energy
Figure 4.12: Upper left: Total effective energy (average enthalpy plus free energy of solvation)as a function of the reaction coordinateρ during biased unfolding at room temperature for thewild type protein and for the mutants R3E and E46A. Upper right: Average electrostatic energyof the three molecules. Lower left: average Van der Waals energy. Lower right: average freeenergy of solvation.

60 Chapter 4. Unfolding CspB by means of biased molecular dynamics
4.4 Analysis of unfolding kinetics and energy barriers
The set of 50000 snapshots, produced as described in the previous section, was also ordered
according to the corresponding value assumed byρmax (see section 4.2.1). This analysis aims
at finding the free energy barriers in a one-dimensional description of the phase space given
by the reaction coordinate of unfoldingρ as explained in the following. If at a certain value
of ρmax a larger number of structures is sampled, it means that the protein has to wait before it
can pass beyondρmax to reach larger values ofρ. This is due to a free energy barrier, which the
protein has to overcome before it can continue to unfold. If the slope of the barrier becomes
less steep, the protein will expand faster, which allows a faster update ofρmax and thus reduces
the number of sampled structures at these values ofρmax. Once the protein has reached the top
of the barrier, with the help of the bias potential, it can expand freely and fast towards larger
values ofρmax. The trajectory will sample only a small number of conformations after reaching
the top of the barrier. Hence, the minima appearing in theρmax histogram of sampled structures
correspond to a descending part of a free energy of unfoldingand each maximum represents
an ascending part of the free energy barrier. If this is true,a large value of the bias potential
should be recorded at the peaks of theρmax histogram, which can indeed be observed. In fig.
4.13, theρmax histogram is combined with a plot of the average bias potential. The threeρmax
histograms for the two mutants and the native protein present a large peak in the vicinity of the
phase space basin of the native structure, where for all trajectories the protein is waiting a long
time before it continues to unfold. Since the average value of the bias potential is large in this
region, we expect that the first and largest free energy barrier is located aroundρmax=14.5 Å.
This corresponds to structures with a radius of gyration of about 11.2 Å close to the value of
10.5 Å of the crystal structure. At increasingρ values, a second barrier is visible for the wild
type protein (atρmax = 15.6 Å, corresponding to a radius of gyration around 11.7 Å)and for the
mutant E46A (ρmax= 15.7 Å). This barrier seems to be absent in the mutant R3E. For the wild
type protein, we checked the structures sampled in the bins of the ρmax histogram aroundρmax
= 15.6 Å corresponding to the second barrier. It turned out that in this region the contacts made
by strand III with strand II and with strand V are about to be disrupted. This corroborates the
previous findings that the first important structural changeduring unfolding of CspB involves
strand III.
4.5 Conclusions
The protein unfolding simulations with the bias potential can reveal interesting aspects of CspB
unfolding, since the structural properties of the first unfolding steps were found to be gener-
ally conserved for trajectories with different initial structures, and even for different mutants.
The region of interest in the early stages of the CspB unfolding process is always the three-
stranded beta-sheet, whose third strand (III) becomes moreflexible and often moves apart from
the rest. During this early phase of unfolding the rest of theprotein is only slightly modified

4.5. Conclusions 61
14 15 16 17 18 19ρ max (Angstroms)
0
1000
2000
3000
4000
5000
6000
7000nu
mbe
r of
str
uctu
res
Wild type
14 15 16 17 18 190
1
2
3
4
5
6
7
8
9
10
aver
age
bias
ene
rgy
(Kca
l/mol
)
14 15 16 17 18 19 20ρ max (Angstroms)
0
2000
4000
6000
8000
num
ber
of s
truc
ture
s
14 15 16 17 18 19 200
1
2
3
4
5
6
7
8
9
10
aver
age
bias
ene
rgy
(Kca
l/mol
)
E46A
14 15 16 17 18 19ρ max (Angstroms)
0
2000
4000
6000
8000
num
ber
of s
truc
ture
s
0
1
2
3
4
5
6
7
8
9
10
aver
age
bias
ene
rgy
(Kca
l/mol
)
R3E
Figure 4.13: Wild type CspB protein and mutants. For each molecule a set of 50000 structureswere generated with biased simulation. These data were usedto create a histogram inρmax,that is the equilibrium value of the reaction coordinateρ (black bars, scale on left side). Withineach bin of the histogram the average value of the applied bias is calculated and drawn an opencircle (scale on right side).
in its structure and in its overall compactness. Since the unbiased trajectories at T = 400K
exhibit the same features of unfolding, we conclude that this still native-like activated state is
relevant and represents the first step towards a complete unfolded state. This is confirmed in
the analysis of the structures sampled with biased unfolding simulations, described in the last
part of the previous section. That the three-stranded beta sheet may be involved in the first
unfolding steps of the cold shock protein was also recently observed in a native state hydrogen
exchange experiment on another member of the cold shock family, namely CspA fromEs-
cherichia coli [111]. Nevertheless, there is a disagreement between theseexperimental results
and our proposed model in defining which strands are involved(I and II in [111], II and III in
our simulation). Since our model was confirmed by purely thermal unfolding simulations, we
can exclude distortion effects due to the bias. The disagreement might instead originate from
sequence differences between CspA and Bc-Csp. Bc-Csp namely contains a larger number
of charged residues located on strands I and II which are possibly involved in ionic bridges
(K5 and K7 with E19 and D24) and may improve the stability of this substructure. The other

62 Chapter 4. Unfolding CspB by means of biased molecular dynamics
interesting step that is evidenced in the biased but not in the thermal unfolding simulations is
the disruption of non-local contacts between strands I and IV (also observed experimentally in
[111] for CspA). This is the most dramatic change during biased unfolding, since it leads to a
strong and rapid expansion of the polypeptide backbone structure. This event is preceeded by
smaller changes, which are less effective in increasing theradius of gyration. During that time
the protein waits to accumulate bias energy, which is neededto break contacts. This leads us
to the conclusion that the contacts between strands I and IV are indeed quite robust and that
their disruption is crucial for the protein to reach the moreextended conformations of the phase
space basin of unfolded states. The region of the protein corresponding to strands I, IV and
V has been intensively investigated [107, 106], because some residues present in that area, in
particular R3 (strand I) and L66 (strand V), are considered to be responsible for the enhanced
stability of the thermophilic Bc-Csp with respect to the corresponding mesophilic protein Bs-
Csp. Recently, it has been experimentally shown that the contact between R3 (strand I) and
E46 (strand IV) is already present in the transition state during the folding reaction of the pro-
tein [112]. Our results corroborate these findings, since weshow that in the large majority
of cases the transition between the native-like ensemble ofconformations and non-native like
extended conformations occurs primarily through the disruption of these contacts, in the wild
type protein and in the mutants. This would mean that the transition state is located before
the point where this contact is disrupted, what is in agreement with the experimental observa-
tion that the transition state is compact and native-like [101, 108]. The energetics of biased
unfolding, analyzed in the last section for wild type Bc-Cspand for the mutants, suggested
that the transition state for unfolding is located around the radius of gyration of 11.7 Å for the
wild type protein and similarly for the mutant E46A, which isin a native-like region of phase
space. We also found in agreement with the experimental results [112] that the mutant R3E
might have a lower unfolding barrier. The robustness of the two-strandedβ-sheet (residues 44
to 66, strands IV and V) found in our biased simulations suggests that this substructure is the
most stable one and is disrupted very late in the unfolding process. It may also suggest that
this substructure forms very early in the folding process. This observation can be seen in the
light of recent mutation studies of Perl and coworkers [112]based on aΦ-values analysis. The
measure of theΦF values, introduced by Fersht and coworkers [16] and presented in chapter 1,
is a powerful tool for investigating the folding steps of a protein, since it provides information
on single residues involved in native-like interactions atthe transition state. The experimental
ΦF values can then be used within theoretical models, leading to better insight into the folding
process [113, 22, 114, 115]. Perl and coworkers concluded from theirΦ-value analysis on Bc-
csp that the contact between residue 66 (strand V) and residue 3 (strand I) has not yet formed
in the transition state, and it would appear in the very last folding steps. Since strand IV, which
belongs to the same beta-sheet, is indeed in contact with residue 3 in the transition state, this
means that strand V is not aligned yet with strand IV at that point. Their analysis is based on
the hypothesis that the free energy of the unfolded state does not change upon residue mutation,

4.5. Conclusions 63
since no contacts are present in that state. However, this hypothesis does not consider that the
beta-sheet might be formed rather early in the folding process, when the protein is still largely
unfolded. In any case, even if one does not consider that the folding process does occur exactly
in the opposite order as the unfolding process monitored in our biased simulations, it seems at
least that a disruption of the two-stranded beta-sheet consisting of strand IV and strand V is not
directly involved in the transition state of the protein, and its folding and unfolding may occur
independently from the other events.