Unfitness to Plead: Appendix A - Amazon S3€¦ · Unfitness to Plead: Appendix A ... Carlisle 3 .2...
31
Unfitness to Plead: Appendix A Unfitness to Plead – Data on Formal Findings from 2002 to 2014 13 January 2016
Transcript of Unfitness to Plead: Appendix A - Amazon S3€¦ · Unfitness to Plead: Appendix A ... Carlisle 3 .2...

Unfitness to Plead: Appendix A Unfitness to Plead – Data on Formal Findings from 2002 to 2014
13 January 2016

1
Unfitness to Plead – Data on Formal Findings from 2002 to 2014
By R.D. Mackay
Professor of Criminal Policy and Mental Health, Leicester De Montfort Law School, De Montfort University.
Introduction
In October 2010 the Law Commission published its Consultation Paper (CP) on Unfitness to
Plead. Included within it was my empirical study entitled “Unfitness to Plead – Data on
Formal Findings from 2002 to 2008”.1 The conclusion to that study confirmed that the
number of findings of unfitness to plead (UTP) had continued to rise from a maximum of 80
findings in 1999 to a peak of 118 findings in 2005. Although hospital disposals continued to
predominate (65.2%), with 36.2 per cent being imposed with restrictions, the percentage of
restriction orders had fallen from 38.9 per cent. In addition, although the percentage of
supervision (and treatment) orders had fallen from 17.9 per cent to 15.7 per cent there had
been a marked increase in the use of absolute discharges from 3.6 per cent to 6.3 per cent.
Overall, however, the percentage of non-hospital disposals had fallen from 27.6 per cent to
25.6 per cent.
The study which follows is an update of the Law Commission CP study and includes an
additional six years from 2009 to 2014. This updated study therefore covers the thirteen year
period 2002 to 2014. Once again, however, the limitations to this current study need to be
emphasised for just as in my Law Commission CP study - unlike my three earlier empirical
studies of UTP2 - on this occasion access to court files, and in particular relevant psychiatric 1 Law Commission, Unfitness to Plead, Consultation Paper No 197 at Appendix C.
2 See RD Mackay ‘The Decline of Disability in Relation to the Trial’ [1991] Criminal Law Review 87; RD Mackay and Gerry Kearns ‘An Upturn in Unfitness to Plead ‐ More Disability in Relation to the Trial under the 1991 Act’ [2000] Criminal Law Review 532; RD Mackay, Barry Mitchell and Leonie Howe ‘A continued upturn in unfitness to plead ‐ More disability in relation to the trial under the 1991 Act’ [2007] Criminal Law Review 530.

2
reports, was unavailable. Despite this, however, it is hoped that the following research will
give an up to date picture relating to unfitness to plead findings in England and Wales. In
addition, although the Statistics on Restricted Patients continue to give the number of
unfitness to plead cases annually in relation to such patients,3 no official statistics are
published on the use of unfitness to plead where other disposals are given. A final caveat,
therefore, relates to the consistency of the data which were collected for this study using two
statistical returns from the Ministry of Justice. Inevitably, although some disparity has been
found in relation to these two sources as complete a picture as seems possible of UTP
findings has emerged for the purpose of this research for which grateful thanks is
acknowledged to the agencies and personnel involved for all the assistance given.
3 See Restricted Patients 2014, Ministry of Justice Statistics Bulletin, 29 April 2015 Table 7 of which gives the
figures for the years 2003 to 2014 and Ministry of Justice Offender Management Caseload Statistics 2012 at
Table 6.5 for the figure for the year 2002. It should also be noted that the Ministry of Justice figures are based
on the date of the hospital warrant rather than the date of the finding. This may have led to some
inconsistency in relation to the actual number of annual findings. Thus the total number of UTP findings which
resulted in hospital orders with restrictions recorded by the Ministry of Justice for the thirteen year period
2002 to 2014 is 465 while the number contained in this study for the same period is 417. It is likely that an
additional explanation for this inconsistency results from the fact that some UTP findings which resulted in
restriction orders may have been mistakenly entered on the MOJ database used in this study as ordinary
(unrestricted) hospital orders.

3
Table 1‐ Findings of UTP by 5 Year Periods from 1987‐2011
The research findings
The Number of UTP findings
Table 1 above gives the annual number of findings of UTP for the final 5 years of the operation of the
original Criminal Procedure (Insanity) Act 1964, the first 5 years, the second 5 years and the third and
fourth 5 years of the Criminal Procedure (Insanity and Unfitness to Plead) Act 1991 which introduced
both flexibility of disposal and the “trial of the facts”. Until the third five year period of the 1991 Act
the picture was of a continuing but steady rise in the number of UTP findings. However, in the fourth
5 year period there has been a decline. Thus, in the fourth 5 years there was an annual average of 97.6
UTP findings compared with an average of 103.8 in the third five year period while in the second 5
years there was an annual average of 65.8 UTP findings and 24.6 findings in first five year period.
la 1964 Act
Final 5 years
1b1991 Act
1st 5 years
1c 1991 Act
2nd 5 years
1d 1991 Act
3rd 5 Years
1e 1991Act
4th 5 years
Year Number Year Number Year Number Year Number Year Number
1987 16 1992 11 1997 50 2002 115 2007 100
1988 13 1993 13 1998 53 2003 92 2008 114
1989 11 1994 31 1999 80 2004 85 2009 82
1990 13 1995 35 2000 70 2005 118 2010 91
1991 10 1996 33 2001 76 2006 109 2011 101
Total 63 Total 123 Total 329 Total 519 Total 488

4
This compares to an average of 12.6 from 1987-91 (although in the previous 11 years from 1976-1986
the average was 19.8) with an overall total of 1,459 UTP findings for the first twenty years of the
1991 Act, giving an annual average of 73 findings.
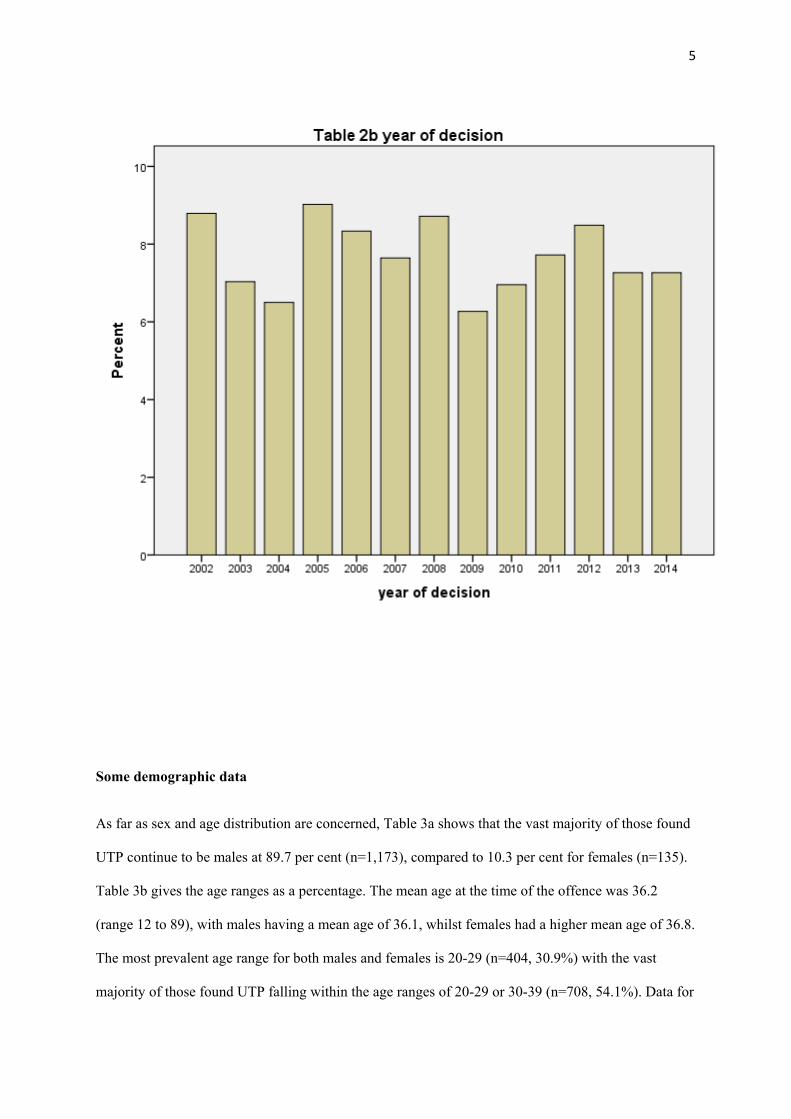
Table 2a below gives the annual number of findings of UTP for the research period for this study,
namely the thirteen years from 2002 to 2014.4 The total of UTP findings during this period was 1,308
giving an annual average of 100.6. Table 2b shows the annual percentage of UTP findings.
Table 2a- Findings of UTP 2002-2014
Frequency Percent
Cumulative
Percent
2002 115 8.8 8.8
2003 92 7.0 15.8
2004 85 6.5 22.3
2005 118 9.0 31.3
2006 109 8.3 39.7
2007 100 7.6 47.3
2008 114 8.7 56.0
2009 82 6.3 62.3
2010 91 7.0 69.3
2011 101 7.7 77.0
2012 111 8.5 85.5
2013 95 7.3 92.7
2014 95 7.3 100.0
Total 1308 100.0
4 All subsequent tables relate to the period of the research study, namely 2002 to 2014.
5
Some demographic data
As far as sex and age distribution are concerned, Table 3a shows that the vast majority of those found
UTP continue to be males at 89.7 per cent (n=1,173), compared to 10.3 per cent for females (n=135).
Table 3b gives the age ranges as a percentage. The mean age at the time of the offence was 36.2
(range 12 to 89), with males having a mean age of 36.1, whilst females had a higher mean age of 36.8.
The most prevalent age range for both males and females is 20-29 (n=404, 30.9%) with the vast
majority of those found UTP falling within the age ranges of 20-29 or 30-39 (n=708, 54.1%). Data for

6
ethnicity was too limited to be reliable as in the majority of cases it was either unavailable or not
recorded. Neither was any information available on criminal records, psychiatric history or psychiatric
diagnoses.5
Table 3a Sex/age distribution
sex of accused
Total male female
age range of accused up to 15 15 1 16
15-19 114 9 123
20-29 367 37 404
30-39 274 30 304
40-49 183 41 224
50-59 100 9 109
60-69 61 7 68
70-79 43 1 44
80-89 14 0 14
not known 2 0 2
Total 1173 135 1308
5 For data relating to these issues see my earlier studies referred to above at note 2.

7
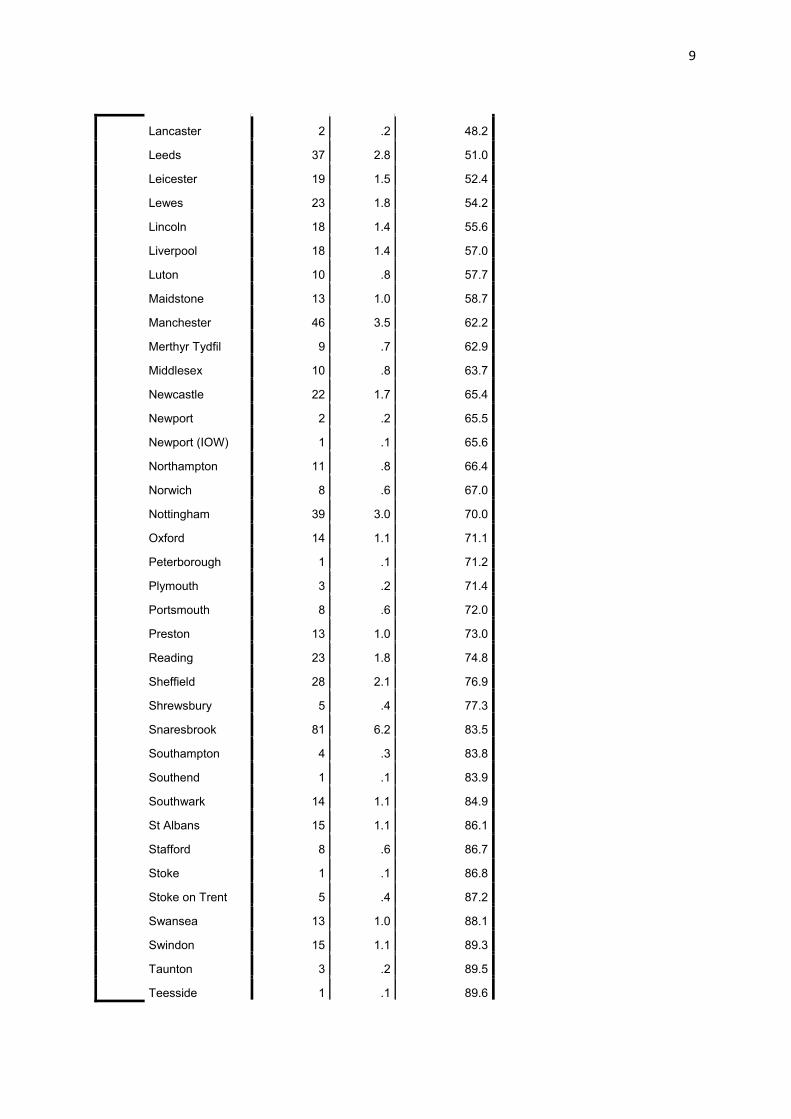
The courts involved in UTP proceedings
Table 4 below gives a breakdown of the Crown courts which were involved in the UTP proceedings.
It can be seen from this that there was a wide geographical distribution with Snaresbrook being the
most frequent venue with 81 cases (6.2%), followed by Birmingham with 78 cases (6.0%).
Table 4 Crown court
Frequency Percent
Cumulative
Percent
Not known 109 8.3 8.3
Aylesbury 10 .8 9.1

8
Barnstaple 1 .1 9.2
Basildon 19 1.5 10.6
Birmingham 78 6.0 16.6
Blackfriars 26 2.0 18.6
Blackfriars 1 .1 18.7
Bolton 19 1.5 20.1
Bournemouth 3 .2 20.3
Bradford 27 2.1 22.4
Bristol 13 1.0 23.4
Burnley 8 .6 24.0
Cambridge 5 .4 24.4
Canterbury 15 1.1 25.5
Cardiff 25 1.9 27.4
Carlisle 3 .2 27.7
CCC 30 2.3 30.0
Chelmsford 11 .8 30.8
Chester 7 .5 31.3
Chichester 1 .1 31.4
Coventry 4 .3 31.7
Croydon 27 2.1 33.8
Derby 11 .8 34.6
Doncaster 5 .4 35.0
Durham 6 .5 35.5
Exeter 8 .6 36.1
Gloucester 13 1.0 37.1
Great Grimsby 2 .2 37.2
Grimsby 1 .1 37.3
Guildford 2 .2 37.5
Guilford 6 .5 37.9
Harrow 21 1.6 39.5
Haverford West 1 .1 39.6
Hull 9 .7 40.3
Inner London 28 2.1 42.4
Ipswich 5 .4 42.8
Isleworth 29 2.2 45.0
Kingston 36 2.8 47.8
Knutsford 3 .2 48.0
9
Lancaster 2 .2 48.2
Leeds 37 2.8 51.0
Leicester 19 1.5 52.4
Lewes 23 1.8 54.2
Lincoln 18 1.4 55.6
Liverpool 18 1.4 57.0
Luton 10 .8 57.7
Maidstone 13 1.0 58.7
Manchester 46 3.5 62.2
Merthyr Tydfil 9 .7 62.9
Middlesex 10 .8 63.7
Newcastle 22 1.7 65.4
Newport 2 .2 65.5
Newport (IOW) 1 .1 65.6
Northampton 11 .8 66.4
Norwich 8 .6 67.0
Nottingham 39 3.0 70.0
Oxford 14 1.1 71.1
Peterborough 1 .1 71.2
Plymouth 3 .2 71.4
Portsmouth 8 .6 72.0
Preston 13 1.0 73.0
Reading 23 1.8 74.8
Sheffield 28 2.1 76.9
Shrewsbury 5 .4 77.3
Snaresbrook 81 6.2 83.5
Southampton 4 .3 83.8
Southend 1 .1 83.9
Southwark 14 1.1 84.9
St Albans 15 1.1 86.1
Stafford 8 .6 86.7
Stoke 1 .1 86.8
Stoke on Trent 5 .4 87.2
Swansea 13 1.0 88.1
Swindon 15 1.1 89.3
Taunton 3 .2 89.5
Teesside 1 .1 89.6

10
Teesside 17 1.3 90.9
Truro 3 .2 91.1
Warrington 3 .2 91.4
Warwick 11 .8 92.2
Weymouth 2 .2 92.4
Winchester 8 .6 93.0
Wolverhampton 36 2.8 95.7
Wood Green 18 1.4 97.1
Woolwich 13 1.0 98.1
Worcester 11 .8 98.9
York 14 1.1 100.0
Total 1308 100.0
The offences charged
Table 5 gives the main offence charged which in each case led to a finding of UTP. It can be
seen from this that although there was a wide spread of offences, the most prevalent
continues to be indecent/sexual assault (n=247, 18.9%), followed by grievous bodily harm
(GBH, n=149, 11.4%), and actual bodily harm (ABH, n=143, 10.9%). Table 6 gives a
breakdown of the broad types of offence.
Table 5 main offence charged
Frequency Percent
Cumulative
Percent
murder 55 4.2 4.2
attempted murder 28 2.1 6.3
manslaughter 10 .8 7.1
GBH 149 11.4 18.5
ABH 143 10.9 29.4
arson 115 8.8 38.2
criminal damage 16 1.2 39.4
robbery 89 6.8 46.3
burglary 53 4.1 50.3
rape 63 4.8 55.1
indecent/sexual assault 247 18.9 74.0

11
threats to kill 23 1.8 75.8
kidnap/child abduction 13 1.0 76.8
(death by)dangerous driving 17 1.3 78.1
possession/
importation/supply of drugs 17 1.3 79.4
threatening words/behaviour 5 .4 79.7
possession of firearm with
intent 17 1.3 81.0
make explosive substance
with intent 1 .1 81.1
breach restraining order 11 .8 82.0
affray 40 3.1 85.0
false imprisonment 6 .5 85.5
having article with blade 33 2.5 88.0
theft 22 1.7 89.7
obstruct engine on railway 1 .1 89.8
immigration offence 6 .5 90.2
racially aggravated assault 9 .7 90.9
bomb hoax 4 .3 91.2
Possess weapons designed
for discharge of noxious
liquid etc.
2 .2 91.4
child cruelty 3 .2 91.6
pervert course of justice 6 .5 92.0
make indecent photos of
child 13 1.0 93.0
possession offensive
weapon 7 .5 93.6
putting people in fear of
violence 14 1.1 94.6
false accounting 4 .3 95.0
Cause/incite child
prostitution 1 .1 95.0
obtain property/money
transfer by deception 7 .5 95.6
forgery 2 .2 95.7
indecent exposure 14 1.1 96.8
conspiracy to cheat public
revenue 2 .2 96.9

12
blackmail 1 .1 97.0
Disqualified person
managing company 1 .1 97.1
breach ASBO 3 .2 97.3
breach sex offence
prevention order 2 .2 97.5
trespass w/i to commit sex
offence 1 .1 97.6
harassment 2 .2 97.7
handling stolen goods 4 .3 98.0
possession false documents 4 .3 98.3
not known 2 .2 98.5
Conspiracy to defraud 2 .2 98.6
voyeurism 2 .2 98.8
act outraging public decency 2 .2 98.9
fraud 7 .5 99.5
money laundering 3 .2 99.7
cheat the public revenue 1 .1 99.8
kidnap w/i to commit sex
offence 1 .1 99.8
dangerous dog offence 1 .1 99.9
stalking 1 .1 100.0
Total 1308 100.0

13
Table 7 gives a breakdown of the main offence charged cross tabulated with the broad types
of offences involved. As in previous studies, offences against the person (including robbery,
kidnap/child abduction, false imprisonment and child cruelty) remain the most common type
of offence with a total of 440 (33.6%), (n=503, 38.5% including rape), non-fatal and 65
(5.0%) fatal offences followed by sexual offences (n=344, 26.3%).

14
Table 7 main offence charged * type of offence Crosstabulation
type of offence
Total
fatal
assault
non-
fatal
assault
damage
to
property
offence of
dishonesty
sexual
offence
driving
offence
drugs
offence
threatening
behavior other
main
offence
charged
murder 55 0 0 0 0 0 0 0 0 55
attempted murder 0 28 0 0 0 0 0 0 0 28
manslaughter 10 0 0 0 0 0 0 0 0 10
GBH 0 149 0 0 0 0 0 0 0 149
ABH 0 143 0 0 0 0 0 0 0 143
arson 0 0 115 0 0 0 0 0 0 115
criminal damage 0 0 16 0 0 0 0 0 0 16
robbery 0 89 0 0 0 0 0 0 0 89
burglary 0 0 0 53 0 0 0 0 0 53
rape 0 0 0 0 63 0 0 0 0 63
indecent/sexual
assault 0 0 0 0 247 0 0 0 0 247
threats to kill 0 0 0 0 0 0 0 23 0 23
kidnap/child
abduction 0 13 0 0 0 0 0 0 0 13
(death
by)dangerous
driving
0 0 0 0 0 17 0 0 0 17
possession/
importation/supply
of drugs
0 0 0 0 0 0 17 0 0 17
threatening
words/behaviour 0 0 0 0 0 0 0 5 0 5
possession of
firearm with intent 0 0 0 0 0 0 0 17 0 17
make explosive
substance with
intent
0 0 0 0 0 0 0 1 0 1
breach restraining
order 0 0 0 0 0 0 0 11 0 11
affray 0 0 0 0 0 0 0 40 0 40
false
imprisonment 0 6 0 0 0 0 0 0 0 6

15
having article with
blade 0 0 0 0 0 0 0 33 0 33
theft 0 0 0 22 0 0 0 0 0 22
obstruct engine
on railway 0 0 0 0 0 0 0 1 0 1
immigration
offence 0 0 0 0 0 0 0 0 6 6
racially
aggravated
assault
0 9 0 0 0 0 0 0 0 9
bomb hoax 0 0 0 0 0 0 0 4 0 4
Possess weapons
designed for
discharge of
noxious liquid etc.
0 0 0 0 0 0 0 2 0 2
child cruelty 0 3 0 0 0 0 0 0 0 3
pervert course of
justice 0 0 0 0 0 0 0 0 6 6
make indecent
photos of child 0 0 0 0 13 0 0 0 0 13
possession
offensive weapon 0 0 0 0 0 0 0 7 0 7
putting people in
fear of violence 0 0 0 0 0 0 0 14 0 14
false accounting 0 0 0 4 0 0 0 0 0 4
Cause/incite child
prostitution 0 0 0 0 1 0 0 0 0 1
obtain
property/money
transfer by
deception
0 0 0 7 0 0 0 0 0 7
forgery 0 0 0 2 0 0 0 0 0 2
indecent
exposure 0 0 0 0 14 0 0 0 0 14
conspiracy to
cheat public
revenue
0 0 0 2 0 0 0 0 0 2
blackmail 0 0 0 0 0 0 0 1 0 1

16
Disqualified
person managing
company
0 0 0 1 0 0 0 0 0 1
breach ASBO 0 0 0 0 0 0 0 0 3 3
breach sex
offence
prevention order
0 0 0 0 2 0 0 0 0 2
trespass w/i to
commit sex
offence
0 0 0 0 1 0 0 0 0 1
harassment 0 0 0 0 0 0 0 2 0 2
handling stolen
goods 0 0 0 4 0 0 0 0 0 4
possession false
documents 0 0 0 0 0 0 0 0 4 4
not known 0 0 0 0 0 0 0 0 2 2
Conspiracy to
defraud 0 0 0 2 0 0 0 0 0 2
voyeurism 0 0 0 0 2 0 0 0 0 2
act outraging
public decency 0 0 0 0 0 0 0 0 2 2
fraud 0 0 0 7 0 0 0 0 0 7
money laundering 0 0 0 3 0 0 0 0 0 3
cheat the public
revenue 0 0 0 1 0 0 0 0 0 1
kidnap w/i to
commit sex
offence
0 0 0 0 1 0 0 0 0 1
dangerous dog
offence 0 0 0 0 0 0 0 0 1 1
stalking 0 0 0 0 0 0 0 1 0 1
Total 65 440 131 108 344 17 17 162 24 1308

17
The ‘Trial of the Facts'
The ‘trial of the facts’ (TOF) follows the trial of the issue of UTP and is mandatory once the
accused has been found UTP in relation to the offence(s) charged. The result of the TOF is
given below in Table 8a, although in 290 (22.2%) cases the result is coded as ‘uncertain’ as
there was no information on this issue. As in my earlier study of UTP cases from 1997-2001,
there were some cases where no TOF took place. The reasons were as follows. In 17 cases
the prosecution offered no evidence. In 13 cases the judge ordered the indictment to remain
on file or stayed the proceedings (no further details are available as to why this was done). In
one case a nolle prosequi was issued, in two cases the accused was certified insane prior to
arraignment, and in a single case the indictment was quashed. In total, therefore, there were
34 cases where no TOF took place. In the vast majority of cases where some information
about the TOF was available the accused was found to have done the act on all the charges
(n=899, 68.7%). In only 32 cases was it clear that the accused had done the act on one or
more offence but had been acquitted on other(s). In 34 cases (2.6%) the accused was
acquitted of all offences. Table 8b below gives the main offence charged cross-tabulated
with the TOF result. It can be seen from this that 12 of the 34 acquittals were in respect of
indecent/sexual assault, which as mentioned above continues to be the most prevalent single
offence. It is also of note, however, that there are five acquittals for burglary, two for murder
and two for rape. There are also single acquittals for attempted murder, GBH, ABH, arson
and robbery. It seems clear, therefore, that acquittals are continuing to take place for some
serious offences.

18
Table 8a result of trial of facts
Frequency Percent
Cumulative
Percent
D did the act on all 899 68.7 68.7
did the act on some,
acquitted on others 32 2.4 71.2
acquitted on all 34 2.6 73.8
TOF did not take place as no
evidence offered 17 1.3 75.1
uncertain 290 22.2 97.2
indictment to remain on
file/stayed 13 1.0 98.2
nolle prosequi 1 .1 98.3
D discharged 19 1.5 99.8
no TOF as certified insane
before arraignment 2 .2 99.9
indictment quashed 1 .1 100.0
Total 1308 100.0

19
Table 8b main offence charged * result of trial of facts Crosstabulation
result of trial of facts
Total
D
did
the
act
on
all
did the
act on
some,
acquitted
on
others
acquitted
on all
TOF did
not take
place as
no
evidence
offered uncertain
indictment
to remain
on
file/stayed
nolle
prosequi
D
discharged
no TOF as
certified
insane before
arraignment
indictment
quashed
main
offence
charged
murder 39 1 2 0 13 0 0 0 0 0 55
attempted murder 16 0 1 0 10 1 0 0 0 0 28
manslaughter 7 0 0 0 3 0 0 0 0 0 10
GBH 106 0 1 3 36 1 0 2 0 0 149
ABH 107 3 1 3 25 0 0 3 1 0 143
arson 72 3 1 3 32 1 0 2 1 0 115
criminal damage 12 0 0 0 4 0 0 0 0 0 16
robbery 66 1 1 0 17 1 0 3 0 0 89
burglary 32 0 5 0 15 1 0 0 0 0 53
rape 28 4 2 1 22 1 1 4 0 0 63
indecent/sexual
assault 166 9 12 2 52 4 0 2 0 0 247
threats to kill 19 0 0 0 4 0 0 0 0 0 23
kidnap/child
abduction 8 0 0 0 5 0 0 0 0 0 13
(death
by)dangerous
driving
15 0 0 0 2 0 0 0 0 0 17
possession/
importation/supply
of drugs
9 1 1 2 4 0 0 0 0 0 17
threatening
words/behaviour 2 1 0 0 2 0 0 0 0 0 5
possession of
firearm with intent 14 0 1 0 2 0 0 0 0 0 17
make explosive
substance with
intent
1 0 0 0 0 0 0 0 0 0 1
breach restraining
order 8 1 0 0 2 0 0 0 0 0 11
affray 27 2 0 0 10 0 0 1 0 0 40
false imprisonment 4 0 0 0 1 0 0 1 0 0 6
having article with
blade 26 1 0 0 6 0 0 0 0 0 33

20
theft 18 0 1 0 3 0 0 0 0 0 22
obstruct engine on
railway 0 1 0 0 0 0 0 0 0 0 1
immigration
offence 4 0 0 1 1 0 0 0 0 0 6
racially aggravated
assault 7 1 0 0 1 0 0 0 0 0 9
bomb hoax 3 0 0 1 0 0 0 0 0 0 4
Possess weapons
designed for
discharge of
noxious liquid etc.
1 0 1 0 0 0 0 0 0 0 2
child cruelty 2 0 1 0 0 0 0 0 0 0 3
pervert course of
justice 6 0 0 0 0 0 0 0 0 0 6
make indecent
photos of child 9 1 0 0 3 0 0 0 0 0 13
possession
offensive weapon 5 0 0 0 2 0 0 0 0 0 7
putting people in
fear of violence 11 1 0 0 2 0 0 0 0 0 14
false accounting 4 0 0 0 0 0 0 0 0 0 4
Cause/incite child
prostitution 1 0 0 0 0 0 0 0 0 0 1
obtain
property/money
transfer by
deception
4 0 0 1 1 0 0 0 0 1 7
forgery 2 0 0 0 0 0 0 0 0 0 2
indecent exposure 11 0 0 0 3 0 0 0 0 0 14
conspiracy to
cheat public
revenue
1 0 0 0 0 1 0 0 0 0 2
blackmail 0 0 0 0 1 0 0 0 0 0 1
Disqualified
person managing
company
0 0 0 0 1 0 0 0 0 0 1
breach ASBO 2 0 0 0 1 0 0 0 0 0 3
breach sex offence
prevention order 2 0 0 0 0 0 0 0 0 0 2

21
trespass w/i to
commit sex
offence
1 0 0 0 0 0 0 0 0 0 1
harassment 2 0 0 0 0 0 0 0 0 0 2
handling stolen
goods 4 0 0 0 0 0 0 0 0 0 4
possession false
documents 2 0 0 0 1 1 0 0 0 0 4
not known 0 0 0 0 2 0 0 0 0 0 2
Conspiracy to
defraud 0 0 1 0 0 0 0 1 0 0 2
voyeurism 1 1 0 0 0 0 0 0 0 0 2
act outraging
public decency 2 0 0 0 0 0 0 0 0 0 2
fraud 6 0 0 0 0 1 0 0 0 0 7
money laundering 1 0 1 0 1 0 0 0 0 0 3
cheat the public
revenue 1 0 0 0 0 0 0 0 0 0 1
kidnap w/i to
commit sex
offence
0 0 1 0 0 0 0 0 0 0 1
dangerous dog
offence 1 0 0 0 0 0 0 0 0 0 1
stalking 1 0 0 0 0 0 0 0 0 0 1
Total 899 32 34 17 290 13 1 19 2 1 1308
22
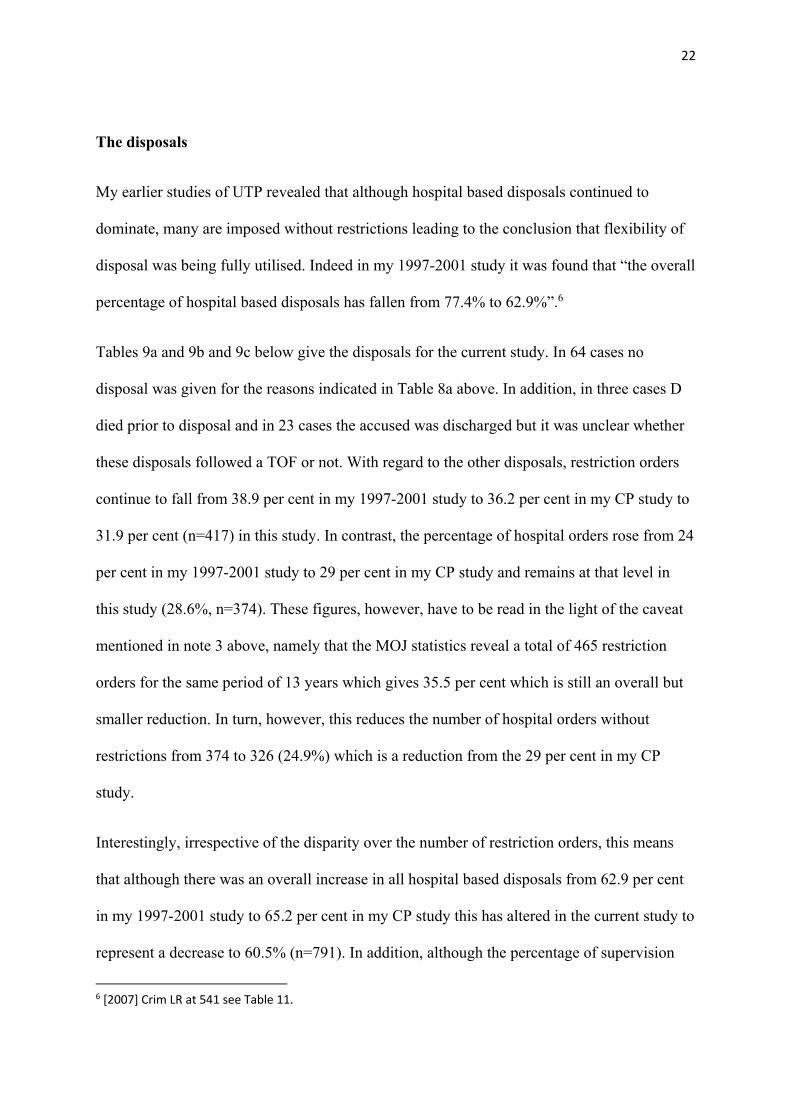
The disposals
My earlier studies of UTP revealed that although hospital based disposals continued to
dominate, many are imposed without restrictions leading to the conclusion that flexibility of
disposal was being fully utilised. Indeed in my 1997-2001 study it was found that “the overall
percentage of hospital based disposals has fallen from 77.4% to 62.9%”.6
Tables 9a and 9b and 9c below give the disposals for the current study. In 64 cases no
disposal was given for the reasons indicated in Table 8a above. In addition, in three cases D
died prior to disposal and in 23 cases the accused was discharged but it was unclear whether
these disposals followed a TOF or not. With regard to the other disposals, restriction orders
continue to fall from 38.9 per cent in my 1997-2001 study to 36.2 per cent in my CP study to
31.9 per cent (n=417) in this study. In contrast, the percentage of hospital orders rose from 24
per cent in my 1997-2001 study to 29 per cent in my CP study and remains at that level in
this study (28.6%, n=374). These figures, however, have to be read in the light of the caveat
mentioned in note 3 above, namely that the MOJ statistics reveal a total of 465 restriction
orders for the same period of 13 years which gives 35.5 per cent which is still an overall but
smaller reduction. In turn, however, this reduces the number of hospital orders without
restrictions from 374 to 326 (24.9%) which is a reduction from the 29 per cent in my CP
study.
Interestingly, irrespective of the disparity over the number of restriction orders, this means
that although there was an overall increase in all hospital based disposals from 62.9 per cent
in my 1997-2001 study to 65.2 per cent in my CP study this has altered in the current study to
represent a decrease to 60.5% (n=791). In addition, although the percentage of supervision
6 [2007] Crim LR at 541 see Table 11.

23
(and treatment) orders fell from 17.9 per cent in my 1997-2001 study to 15.7 per cent in my
CP study there has been an increase in the current study to 19.7 per cent (n=257) together
with an increase in the use of absolute discharges from 3.6 per cent in my 1997-2001 study to
6.3 per cent in my CP study and now 7.5 per cent (n=98). Overall, therefore, the percentage
of non-hospital disposals has risen from 27.6 per cent in my 1997-2001 study, 25.6 per cent
in my CP study to 28.7 per cent, n=375, in this study (30.4%, n=398 if the defendants who
were discharged are included). Further, Table 10 below shows that both supervision (and
treatment) orders and absolute discharges continue to be given for serious offences such as
GBH (n=17), arson (n=11, although there are also 4 guardianship orders give for arson) and
robbery (n=20). Finally, the percentage of guardianship orders has fallen from 6.1 per cent to
1.5 per cent (n=20) which is hardly surprising in view of the fact that this form of disposal
was abolished by the Domestic Violence, Crime and Victims Act 2004. The 2004 Act was
implemented on March 31, 2005. Apart from abolishing the role of the jury in relation to the
trial of the issue, the Act reduced UTP disposals to three, namely:
a hospital order (with or without a restriction order);7
a supervision order;
an order for an absolute discharge.
With regard to the present study which spans a period of thirteen years, 39 (25%) months of
the research period were prior to the implementation of the 2004 Act and 117 (75%) months
post implementation.8
7 The hospital order is now identical to one made under the Mental Health Act 1983 and where the unfit to
plead accused is charged with murder and the court has the power to make such an order, it must impose
restrictions.

24
Table 9a- disposals
Frequency Percent
Cumulative
Percent
none given 64 4.9 4.9
restriction order without limit
of time 411 31.4 36.3
restriction order with limit of
time 6 .5 36.8
hospital order 374 28.6 65.4
guardianship order 20 1.5 66.9
supervision (& treatment)
order - 2 years 214 16.4 83.3
supervision (& treatment)
order -under 2 years 43 3.3 86.5
absolute discharge 98 7.5 94.0
D died prior to disposal 3 .2 94.3
not known 52 4.0 98.2
defendant discharged 23 1.8 100.0
Total 1308 100.0
8 Only those defendants arraigned on or after March 31, 2005 are subject to the new disposal regime See R v
Hussein [2005] EWCA Crim 3556 at para 14, ‘The fact that the appellant was committed or sent to the Crown
Court long before 31st March 2005 is nothing to the point.’

25

26
Table 9c disposals * year of decision Crosstabulation
year of decision
Total2002 2003 2004 2005 2006 2007 2008 2009 2010 2011 2012 2013 2014
disposals none given 5 5 1 17 9 1 6 1 4 1 5 6 3 64
restriction order
without limit of
time
44 38 44 38 36 34 25 26 25 42 23 20 16 411
restriction order
with limit of time 2 1 0 0 1 0 1 0 0 0 0 0 1 6
hospital order 33 27 26 25 26 36 40 26 28 25 28 29 25 374
guardianship
order 4 7 0 8 1 0 0 0 0 0 0 0 0 20
supervision (&
treatment) order
- 2 years
11 7 9 15 18 16 25 15 15 14 26 19 24 214
supervision (&
treatment) order
-under 2 years
1 2 1 3 1 3 7 3 3 2 5 2 10 43
absolute
discharge 7 5 4 8 11 5 6 5 8 6 12 11 10 98
D died prior to
disposal 0 0 0 1 1 1 0 0 0 0 0 0 0 3
not known 7 0 0 1 3 4 4 4 5 7 5 8 4 52
defendant
discharged 1 0 0 2 2 0 0 2 3 4 7 0 2 23
Total 115 92 85 118 109 100 114 82 91 101 111 95 95 1308

27
Table 10 main offence charged * disposals Crosstabulation
disposals
Total
none
given
restriction
order
without
limitof
time
restriction
order
withlimit
oftime
hospital
order
guardianship
order
supervision
(&
treatment)
order‐2
years
supervision
(&
treatment)
order‐
under2
years
absolute
discharge
Ddied
priorto
disposal
not
known
defendant
discharged
main
offence
charged
murder 2 53 0 0 0 0 0 0 0 0 0 55
attemptedmurder 2 23 0 3 0 0 0 0 0 0 0 28
manslaughter 0 4 0 3 0 3 0 0 0 0 0 10
GBH 3 85 0 35 0 7 1 9 0 5 4 149
ABH 5 45 2 42 2 19 5 14 1 5 3 143
arson 6 48 0 44 4 8 1 2 0 0 2 115
criminaldamage 0 5 0 8 0 1 1 1 0 0 0 16
robbery 2 24 1 35 0 18 0 2 0 4 3 89
burglary 6 9 0 25 0 7 0 2 0 4 0 53
rape 4 21 1 11 1 13 1 2 1 3 5 63
indecent/sexual
assault18 50 1 62 9 56 19 15 1 14 2 247
threatstokill 0 9 0 10 0 3 0 1 0 0 0 23
kidnap/child
abduction0 5 0 2 1 1 0 1 0 3 0 13
(death
by)dangerous
driving
0 0 0 4 0 6 1 6 0 0 0 17
possession/
importation/supply
ofdrugs
3 2 0 5 0 4 0 1 0 2 0 17
threatening
words/behaviour0 0 0 3 0 2 0 0 0 0 0 5
possessionof
firearmwithintent1 5 1 2 1 5 0 1 0 1 0 17
makeexplosive
substancewith
intent
0 1 0 0 0 0 0 0 0 0 0 1
breachrestraining
order0 3 0 6 0 1 1 0 0 0 0 11

28
affray 0 9 0 10 0 10 1 6 0 3 1 40
falseimprisonment 0 0 0 3 0 2 0 0 0 0 1 6
havingarticlewith
blade0 4 0 15 0 4 2 4 0 4 0 33
theft 1 1 0 7 1 6 2 4 0 0 0 22
obstructengineon
railway0 0 0 1 0 0 0 0 0 0 0 1
immigration
offence1 0 0 4 0 1 0 0 0 0 0 6
raciallyaggravated
assault0 0 0 4 0 3 0 1 0 1 0 9
bombhoax 1 1 0 1 0 0 0 1 0 0 0 4
Possessweapons
designedfor
dischargeof
noxiousliquidetc.
1 0 0 0 0 0 0 1 0 0 0 2
childcruelty 1 0 0 0 0 2 0 0 0 0 0 3
pervertcourseof
justice0 0 0 2 1 1 1 1 0 0 0 6
makeindecent
photosofchild0 1 0 1 0 6 0 4 0 1 0 13
possession
offensiveweapon0 0 0 2 0 4 0 0 0 1 0 7
puttingpeoplein
fearofviolence0 1 0 6 0 5 0 2 0 0 0 14
falseaccounting 0 0 0 0 0 3 0 1 0 0 0 4
Cause/incitechild
prostitution0 0 0 0 0 0 1 0 0 0 0 1
obtain
property/money
transferby
deception
1 0 0 1 0 2 1 1 0 0 1 7
forgery 0 0 0 1 0 0 0 1 0 0 0 2
indecentexposure 0 1 0 8 0 2 0 3 0 0 0 14
conspiracytocheat
publicrevenue1 0 0 0 0 0 0 1 0 0 0 2
blackmail 0 1 0 0 0 0 0 0 0 0 0 1
Disqualifiedperson
managingcompany0 0 0 0 0 0 0 1 0 0 0 1

29
Concluding Remarks
My CP study reported an increase from a maximum of 80 findings in 1999 to a peak of 118
findings in 2005 which it was stated “strongly suggests that the legislative changes contained
in the 1991 and 2004 Acts are having an ongoing effect”.9 However, the total number of
9 Ibid at p. 232.
breachASBO 0 0 0 1 0 0 1 1 0 0 0 3
breachsexoffence
preventionorder0 0 0 1 0 1 0 0 0 0 0 2
trespassw/ito
commitsexoffence0 0 0 0 0 1 0 0 0 0 0 1
harassment 0 0 0 1 0 0 0 1 0 0 0 2
handlingstolen
goods0 0 0 1 0 1 0 2 0 0 0 4
possessionfalse
documents1 0 0 0 0 1 2 0 0 0 0 4
notknown 0 0 0 1 0 0 0 1 0 0 0 2
Conspiracyto
defraud1 0 0 0 0 0 0 0 0 0 1 2
voyeurism 0 0 0 1 0 1 0 0 0 0 0 2
actoutragingpublic
decency0 0 0 1 0 0 0 1 0 0 0 2
fraud 1 0 0 0 0 2 2 2 0 0 0 7
moneylaundering 1 0 0 0 0 0 0 1 0 1 0 3
cheatthepublic
revenue0 0 0 0 0 1 0 0 0 0 0 1
kidnapw/ito
commitsexoffence1 0 0 0 0 0 0 0 0 0 0 1
dangerousdog
offence0 0 0 0 0 1 0 0 0 0 0 1
stalking 0 0 0 1 0 0 0 0 0 0 0 1
Total 64 411 6 374 20 214 43 98 3 52 23 1308

30
findings for the five-year period 2007 to 2011 shows a decrease to 488 from 519 in the
previous five-year period of 2002 to 2006. It is possible, therefore, that the number of UTP
findings may have reached a plateau.
For the thirteen year period of this research study, although hospital based disposals still
predominate in UTP (60.5%, n=791) with 31.9 per cent (n= 417) being imposed with
restrictions, the percentage of restriction orders has fallen from 36.2 per cent in my CP study
to 31.9 per cent (35.5%, n=465 using the MOJ statistics). Further, irrespective of the
disparity over the number of restriction orders, this means that although there was an overall
increase in all hospital based disposals from 62.9 per cent in my 1997-2001 study to 65.2 per
cent in my CP study, this has altered in the current study to represent a decrease to 60.5%
(n=791). In addition, although the percentage of supervision (and treatment) orders fell from
17.9 per cent in my 1997-2001 study to 15.7 per cent in my CP study, there has been an
increase in the current study to 19.6 per cent (n=257) together with an increase in the use of
absolute discharges from 3.6 per cent in my 1997-2001 study to 6.3 per cent in my CP study
and now 7.5%, (n=98). Overall, therefore, the percentage of non-hospital disposals has risen
from 27.6 per cent in my 1997-2001 study, 25.6 per cent in my CP study to 28.7 per cent,
n=375 (30.4%, n=398 if the defendants who were discharged are included).
Finally, although these disposal figures indicate the continued importance and use of disposal
flexibility, it does seem probable that without meaningful reform of the Pritchard test the
annual number of findings of UTP is unlikely to increase beyond present levels.