
Uneven Reopening Ahead
53
Joseph Zidle Chief Investment Strategist Byron R. Wien Vice Chairman To receive future market commentary publications, please email [email protected] JULY 2021 Uneven Reopening Ahead
Transcript of Uneven Reopening Ahead
Blackstone Investment Strategy
Blackstone Investment Strategy
Joseph Zidle
Chief Investment Strategist
Byron R. Wien
Vice Chairman
To receive future market commentary publications, please email [email protected]
JULY 2021
Uneven Reopening Ahead
Blackstone |Blackstone Investment Strategy
INTRODUCTION
Note: As detailed in the “Disclaimers” section, the above and all subsequent commentary in this presentation reflect the personal views of Joseph Zidle, Managing Director and Byron Wien, Vice Chairman
in the Private Wealth Solutions Group, and do not necessarily reflect the view of Blackstone.
1
Last quarter, we highlighted that the U.S. economy was gearing up for a period of robust, synchronized growth. The animal spirits have
been unleashed. U.S. real GDP is less than 1% away from its prior high and will have surged well past it in 2Q21. Households are in
remarkably strong shape, with consumer spending at record highs and surpassing its pre-COVID growth path. All of this is while
households still have trillions of dollars of excess savings left on their balance sheets. U.S. businesses are also demonstrating remarkable
signs of growth, with after-tax corporate profits at record highs and consensus estimates for S&P 500 earnings in 2021 showing nearly
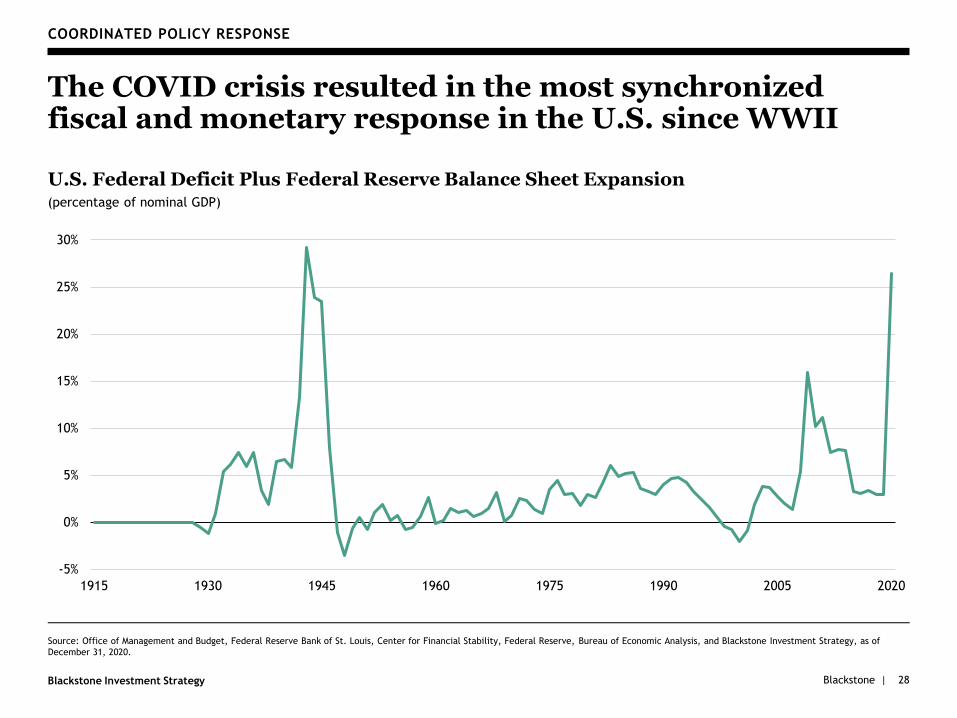
20% growth vs. 2019—an estimate we consider to be on the conservative side. That the economy has recovered so quickly is thanks to
the unprecedented coordination of fiscal and monetary policies. The size of the federal deficit and the Federal Reserve’s balance sheet
expansion equate to over one quarter of total economic output, a level exceeded only during the height of World War II.
It was always going to be impossible to forecast exactly how the economy would respond to being woken up after its sudden, forced
lethargy last spring. But one thing has become clear: the breakneck pace of growth has brought its own challenges with it. Labor
markets remain extraordinarily tight, with record-high job openings—despite millions still out of work—and record voluntary quit rates.
Many firms are having trouble meeting pent-up demand without the workers they need. As a result, wages are rising, as are prices.
Other drivers of inflation include the supply chain issues that are plaguing many companies. As the economy ramps up, demand has
outpaced supply for many goods and services, leading to record backlogs and delays and record-low inventories. Much of the current
inflationary impulse can be attributed to “reopening” sectors of the economy and those related to supply chain issues, recreation
services, and transportation, respectively. These will be resolved as more capacity comes online. But the bottlenecks will also take
some time to work through, which is one reason we are concerned that inflation could be more persistent than some expect. More
importantly, we are watching shelter price and wage growth, which tend to be “sticky” components of inflation.
We maintain our strong conviction in the strength of this recovery, but we are also clear-eyed about the potential risks. First, we are
more concerned than consensus about the potential for higher inflation on a sustained basis. Second, we think “peak liquidity” is fast
approaching, with elevated rates of federal deficit spending on the decline and the Fed beginning discussions in the coming months to
end quantitative easing. A third risk, related to the first two, is that the 10-year Treasury yield could go as high as 2.5%-3.0% in the
coming quarters if higher inflation and tighter monetary policy are realized, and real rates could turn positive. These are likely to lead
to a challenging operating environment for many kinds of companies, which is the fourth risk, although cyclicals, financials, and
companies with pricing power can perform well amid such a background. As the economy exits its early recovery stage and settles into
the next new normal, we expect a transition from policy to fundamentals. In this presentation, we hope to arm you with the tools to
understand what can outperform in this post-“peak liquidity” world.
Joseph ZidleChief Investment Strategist
Byron R. WienVice Chairman
Blackstone |
TABLE OF CONTENTS
Blackstone Investment Strategy 2
Economic Growth 3I.
Consumers and Households 8II.
Inflation 14III.
Labor Markets 19A.
Supply Chains 26B.
Policy Outlook 33IV.
Corporate Profits 38V.
Credit Markets 44VI.
Equity Markets 50VII.
Long-Term Trends 56VIII.

Blackstone |Blackstone Investment Strategy 3
I. Economic Growth
Blackstone |Blackstone Investment Strategy 4
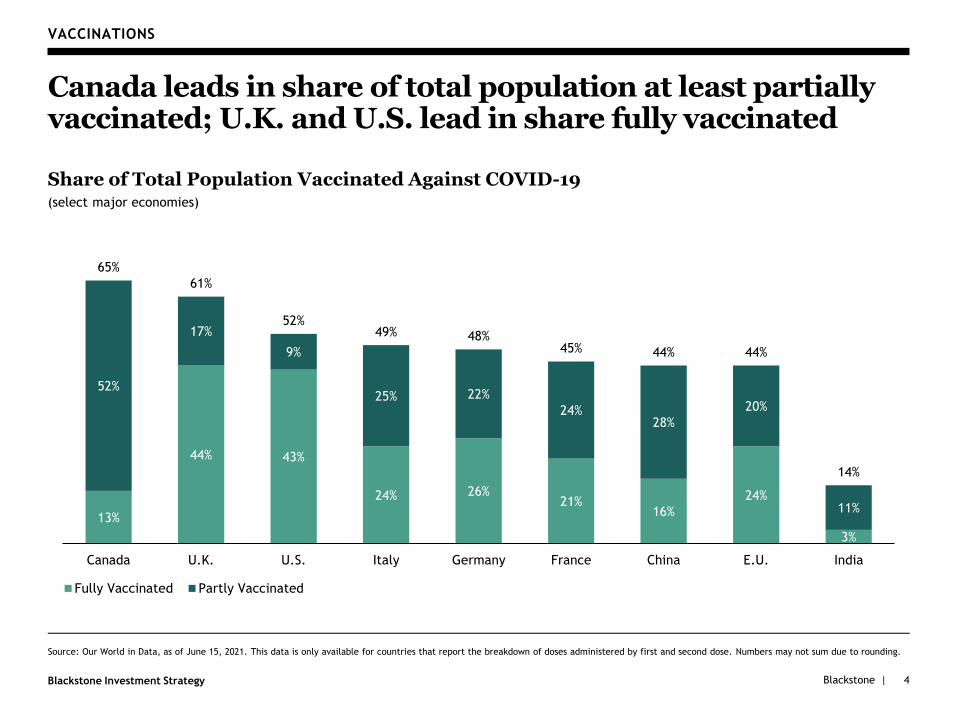
VACCINATIONS
Canada leads in share of total population at least partially vaccinated; U.K. and U.S. lead in share fully vaccinated
Share of Total Population Vaccinated Against COVID-19(select major economies)
Source: Our World in Data, as of June 15, 2021. This data is only available for countries that report the breakdown of doses administered by first and second dose. Numbers may not sum due to rounding.
13%
44% 43%
24% 26%21%
16%
24%
3%
52%
17%
9%
25% 22%
24%28%
20%
11%
65%
61%
52%49% 48%
45% 44% 44%
14%
Canada U.K. U.S. Italy Germany France China E.U. India
Fully Vaccinated Partly Vaccinated
Blackstone |Blackstone Investment Strategy
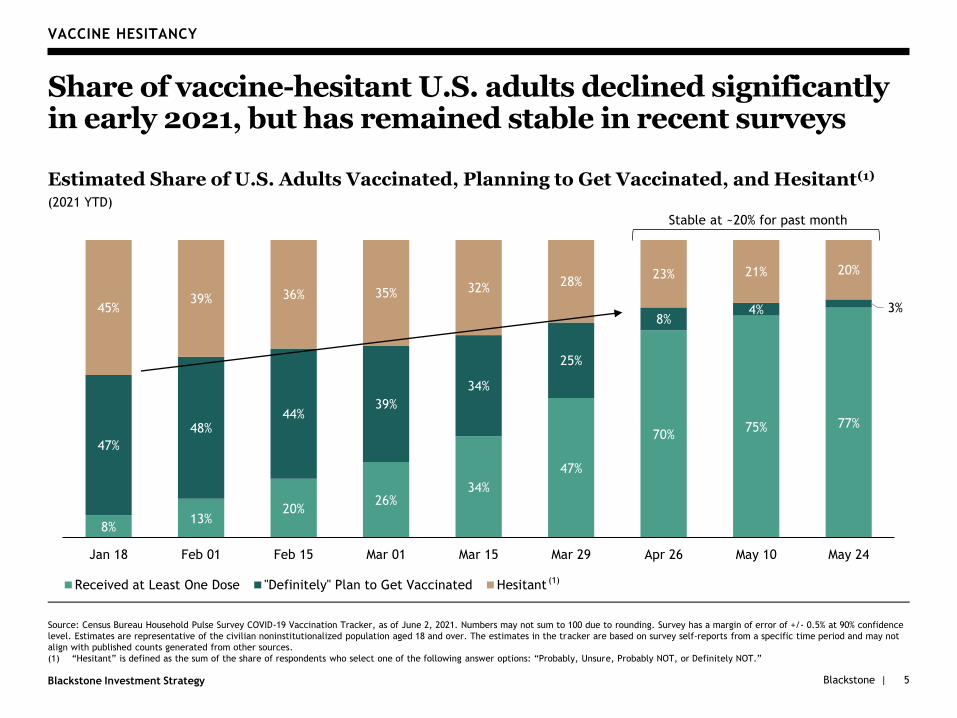
8%13%
20%26%
34%
47%
70%75% 77%
47%
48%44%
39%
34%
25%
8%4% 3%45%
39% 36% 35% 32%28%
23% 21% 20%
Jan 18 Feb 01 Feb 15 Mar 01 Mar 15 Mar 29 Apr 26 May 10 May 24
Received at Least One Dose "Definitely" Plan to Get Vaccinated Hesitant
5
VACCINE HESITANCY
Share of vaccine-hesitant U.S. adults declined significantly in early 2021, but has remained stable in recent surveys
Estimated Share of U.S. Adults Vaccinated, Planning to Get Vaccinated, and Hesitant(1)
(2021 YTD)
Source: Census Bureau Household Pulse Survey COVID-19 Vaccination Tracker, as of June 2, 2021. Numbers may not sum to 100 due to rounding. Survey has a margin of error of +/- 0.5% at 90% confidence
level. Estimates are representative of the civilian noninstitutionalized population aged 18 and over. The estimates in the tracker are based on survey self-reports from a specific time period and may not
align with published counts generated from other sources.
(1) “Hesitant” is defined as the sum of the share of respondents who select one of the following answer options: “Probably, Unsure, Probably NOT, or Definitely NOT.”
Stable at ~20% for past month
(1)
Blackstone |Blackstone Investment Strategy
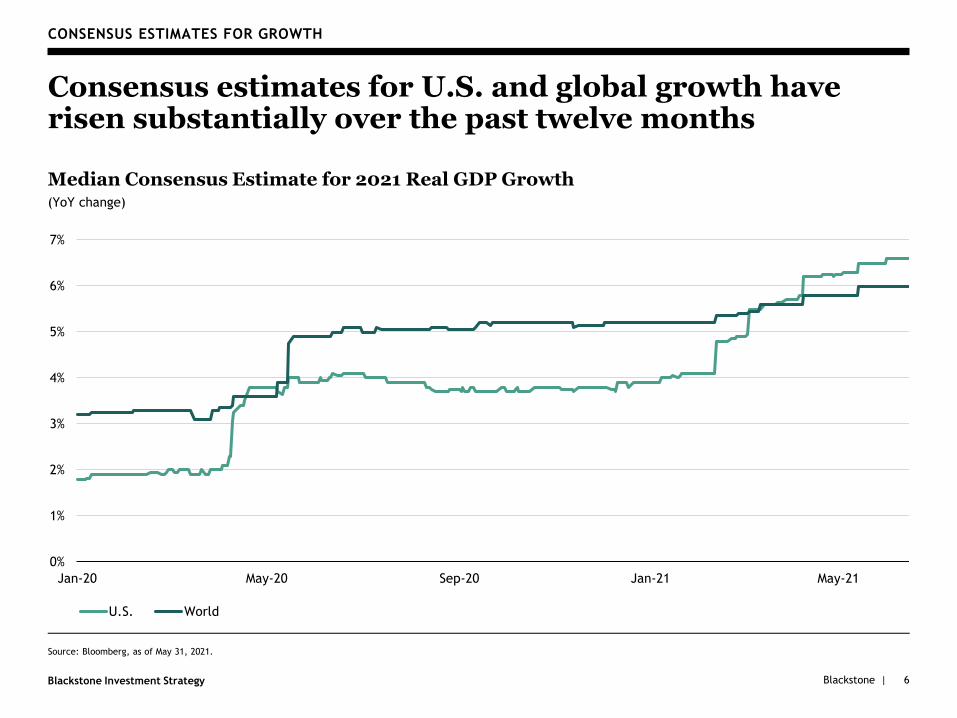
CONSENSUS ESTIMATES FOR GROWTH
Consensus estimates for U.S. and global growth have risen substantially over the past twelve months
Median Consensus Estimate for 2021 Real GDP Growth(YoY change)
Source: Bloomberg, as of May 31, 2021.
6
0%
1%
2%
3%
4%
5%
6%
7%
Jan-20 May-20 Sep-20 Jan-21 May-21
U.S. World
Blackstone |Blackstone Investment Strategy 7
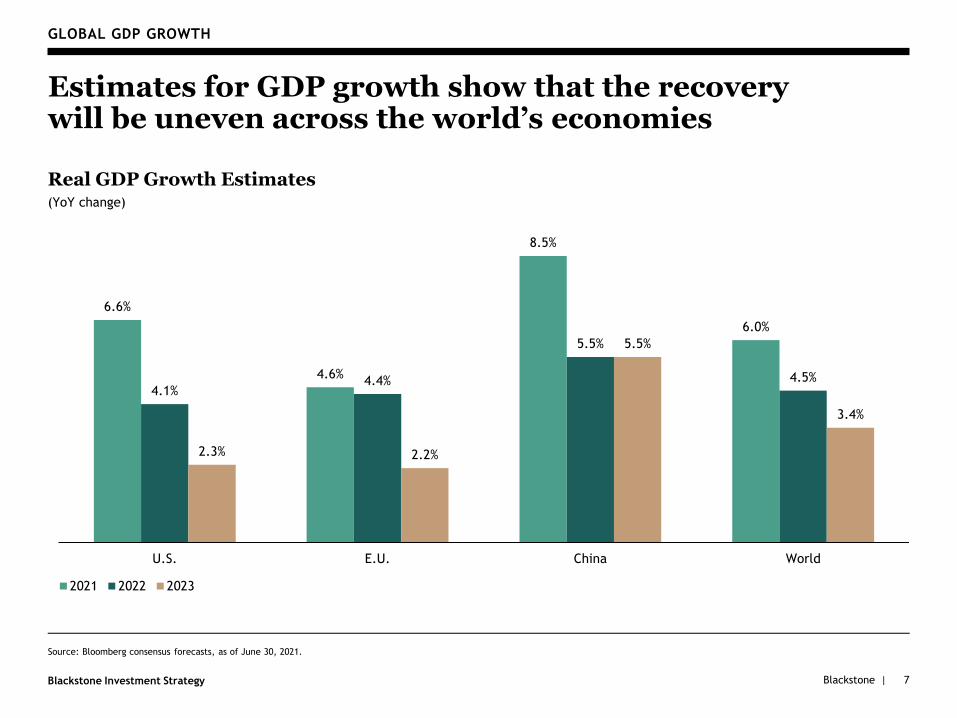
GLOBAL GDP GROWTH
Estimates for GDP growth show that the recovery will be uneven across the world’s economies
Real GDP Growth Estimates(YoY change)
Source: Bloomberg consensus forecasts, as of June 30, 2021.
6.6%
4.6%
8.5%
6.0%
4.1%4.4%
5.5%
4.5%
2.3% 2.2%
5.5%
3.4%
U.S. E.U. China World
2021 2022 2023
Blackstone |Blackstone Investment Strategy
II. Consumers and Households
8
Blackstone |Blackstone Investment Strategy
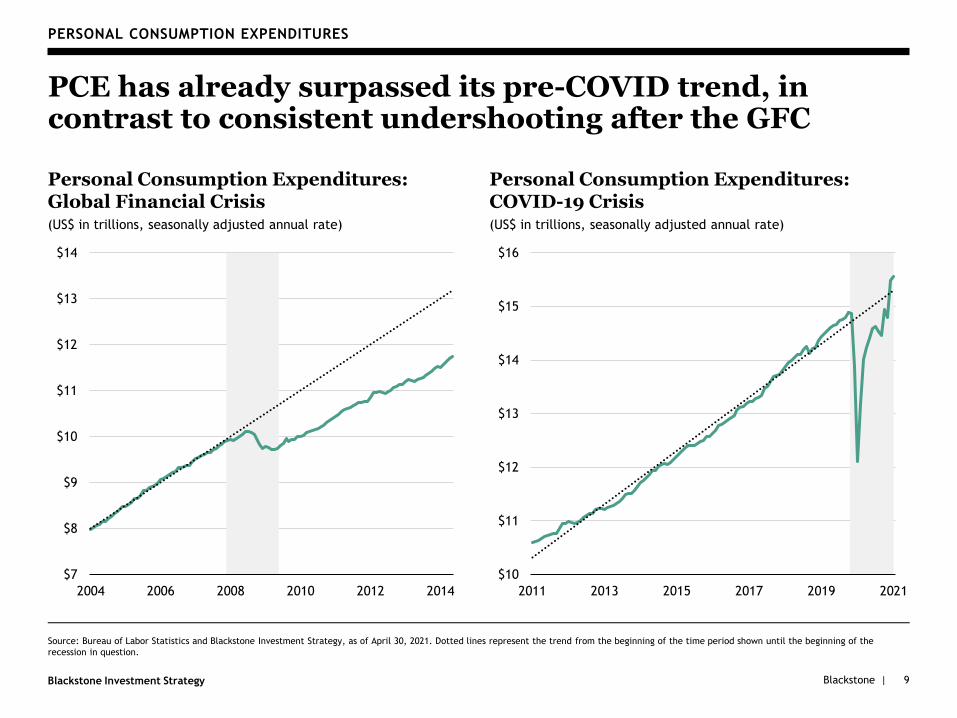
PERSONAL CONSUMPTION EXPENDITURES
PCE has already surpassed its pre-COVID trend, in contrast to consistent undershooting after the GFC
Personal Consumption Expenditures:Global Financial Crisis(US$ in trillions, seasonally adjusted annual rate)
Personal Consumption Expenditures: COVID-19 Crisis(US$ in trillions, seasonally adjusted annual rate)
9
$7
$8
$9
$10
$11
$12
$13
$14
2004 2006 2008 2010 2012 2014
$10
$11
$12
$13
$14
$15
$16
2011 2013 2015 2017 2019 2021
Source: Bureau of Labor Statistics and Blackstone Investment Strategy, as of April 30, 2021. Dotted lines represent the trend from the beginning of the time period shown until the beginning of the
recession in question.
Blackstone |Blackstone Investment Strategy
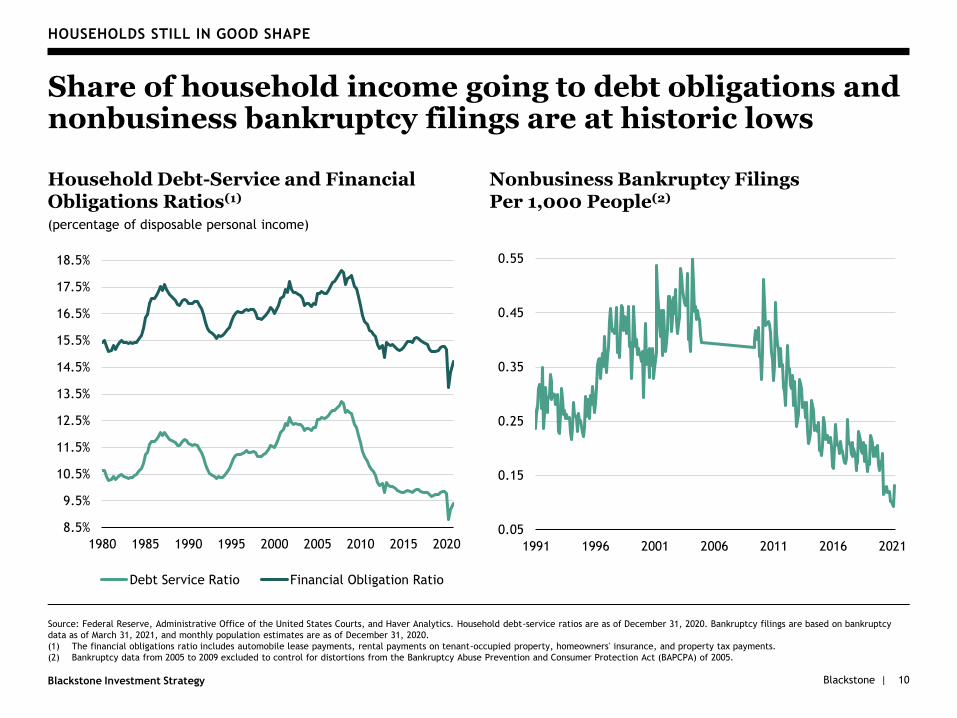
HOUSEHOLDS STILL IN GOOD SHAPE
Share of household income going to debt obligations and nonbusiness bankruptcy filings are at historic lows
Household Debt-Service and Financial Obligations Ratios(1)
(percentage of disposable personal income)
8.5%
9.5%
10.5%
11.5%
12.5%
13.5%
14.5%
15.5%
16.5%
17.5%
18.5%
1980 1985 1990 1995 2000 2005 2010 2015 2020
Debt Service Ratio Financial Obligation Ratio
Nonbusiness Bankruptcy Filings Per 1,000 People(2)
0.05
0.15
0.25
0.35
0.45
0.55
1991 1996 2001 2006 2011 2016 2021
Source: Federal Reserve, Administrative Office of the United States Courts, and Haver Analytics. Household debt-service ratios are as of December 31, 2020. Bankruptcy filings are based on bankruptcy
data as of March 31, 2021, and monthly population estimates are as of December 31, 2020.
(1) The financial obligations ratio includes automobile lease payments, rental payments on tenant-occupied property, homeowners' insurance, and property tax payments.
(2) Bankruptcy data from 2005 to 2009 excluded to control for distortions from the Bankruptcy Abuse Prevention and Consumer Protection Act (BAPCPA) of 2005.
10
Blackstone |Blackstone Investment Strategy
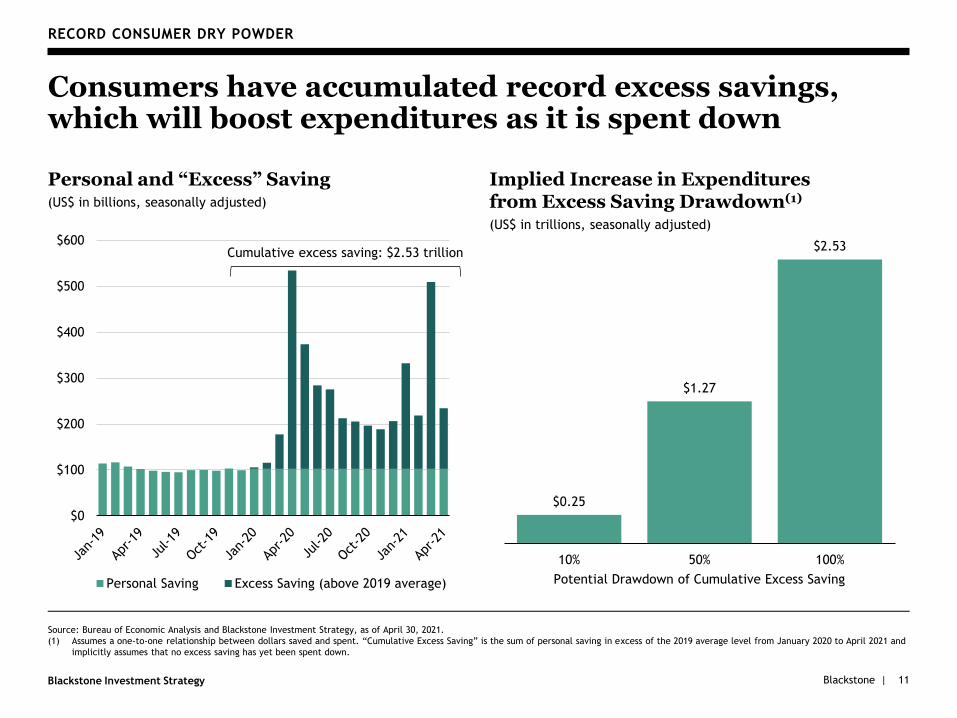
Source: Bureau of Economic Analysis and Blackstone Investment Strategy, as of April 30, 2021.
(1) Assumes a one-to-one relationship between dollars saved and spent. “Cumulative Excess Saving” is the sum of personal saving in excess of the 2019 average level from January 2020 to April 2021 and
implicitly assumes that no excess saving has yet been spent down.
RECORD CONSUMER DRY POWDER
Consumers have accumulated record excess savings, which will boost expenditures as it is spent down
Personal and “Excess” Saving(US$ in billions, seasonally adjusted)
Implied Increase in Expenditures from Excess Saving Drawdown(1)
(US$ in trillions, seasonally adjusted)
11
$0
$100
$200
$300
$400
$500
$600
Personal Saving Excess Saving (above 2019 average)
Cumulative excess saving: $2.53 trillion
$0.25
$1.27
$2.53
10% 50% 100%
Potential Drawdown of Cumulative Excess Saving
Blackstone |Blackstone Investment Strategy 12
III. Inflation
Blackstone |Blackstone Investment Strategy
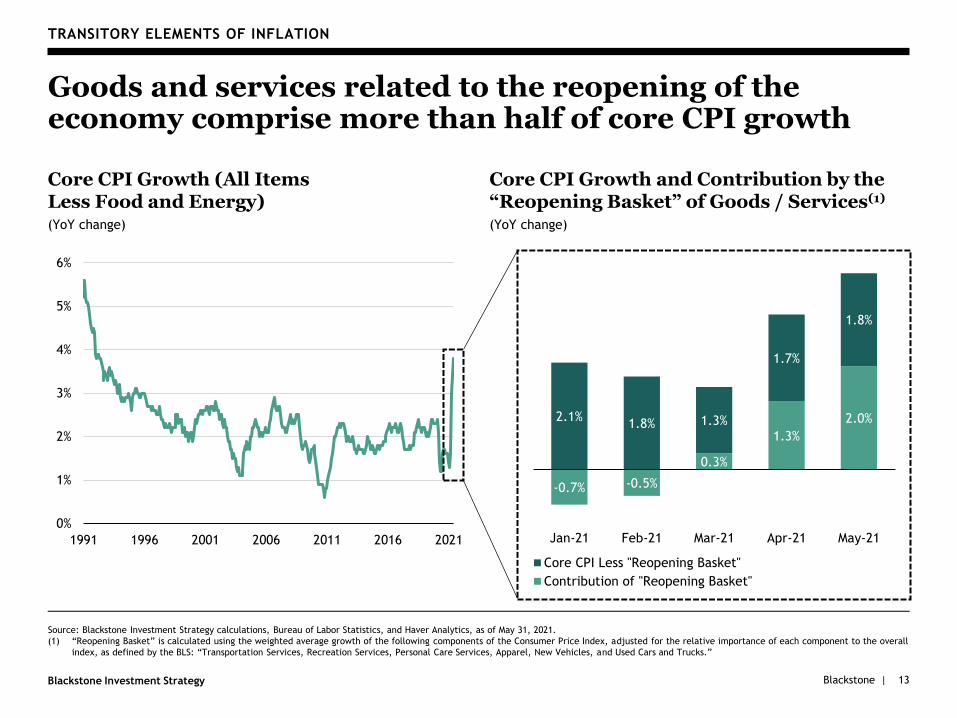
-0.7% -0.5%
0.3%
1.3%
2.0%2.1%1.8% 1.3%
1.7%
1.8%
Jan-21 Feb-21 Mar-21 Apr-21 May-21
Core CPI Less "Reopening Basket"
Contribution of "Reopening Basket"
13
TRANSITORY ELEMENTS OF INFLATION
Goods and services related to the reopening of the economy comprise more than half of core CPI growth
Core CPI Growth (All Items Less Food and Energy)(YoY change)
Core CPI Growth and Contribution by the “Reopening Basket” of Goods / Services(1)
(YoY change)
Source: Blackstone Investment Strategy calculations, Bureau of Labor Statistics, and Haver Analytics, as of May 31, 2021.
(1) “Reopening Basket” is calculated using the weighted average growth of the following components of the Consumer Price Index, adjusted for the relative importance of each component to the overall
index, as defined by the BLS: “Transportation Services, Recreation Services, Personal Care Services, Apparel, New Vehicles, and Used Cars and Trucks.”
0%
1%
2%
3%
4%
5%
6%
1991 1996 2001 2006 2011 2016 2021
Blackstone |Blackstone Investment Strategy
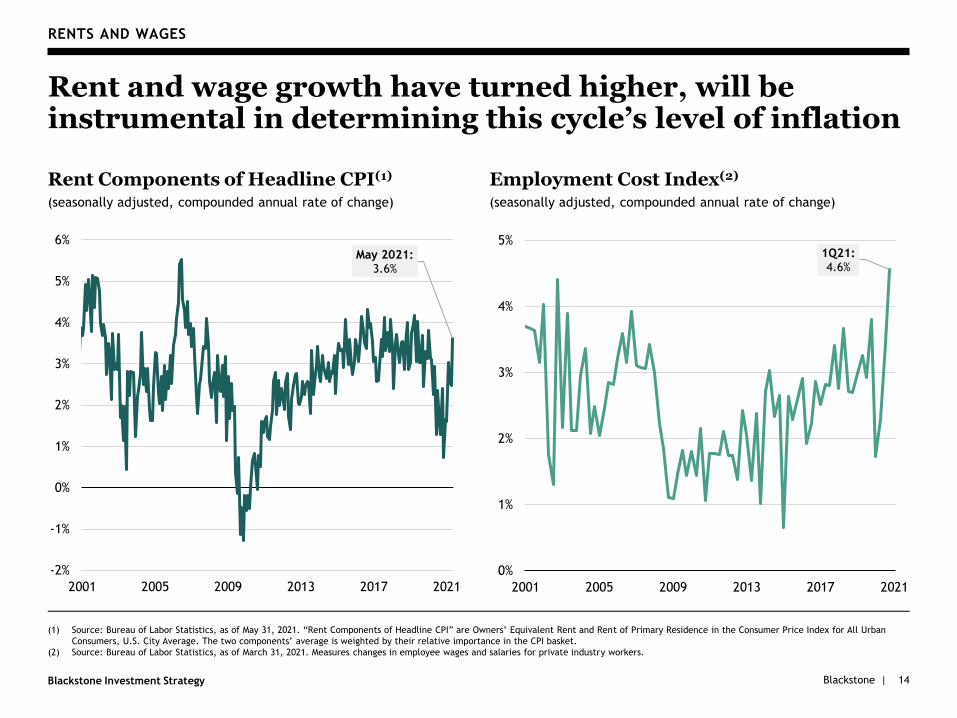
(1) Source: Bureau of Labor Statistics, as of May 31, 2021. “Rent Components of Headline CPI” are Owners’ Equivalent Rent and Rent of Primary Residence in the Consumer Price Index for All Urban
Consumers, U.S. City Average. The two components’ average is weighted by their relative importance in the CPI basket.
(2) Source: Bureau of Labor Statistics, as of March 31, 2021. Measures changes in employee wages and salaries for private industry workers.
RENTS AND WAGES
Rent and wage growth have turned higher, will be instrumental in determining this cycle’s level of inflation
Rent Components of Headline CPI(1)
(seasonally adjusted, compounded annual rate of change)
14
Employment Cost Index(2)
(seasonally adjusted, compounded annual rate of change)
1Q21:4.6%
0%
1%
2%
3%
4%
5%
2001 2005 2009 2013 2017 2021
May 2021:3.6%
-2%
-1%
0%
1%
2%
3%
4%
5%
6%
2001 2005 2009 2013 2017 2021
Blackstone |Blackstone Investment Strategy
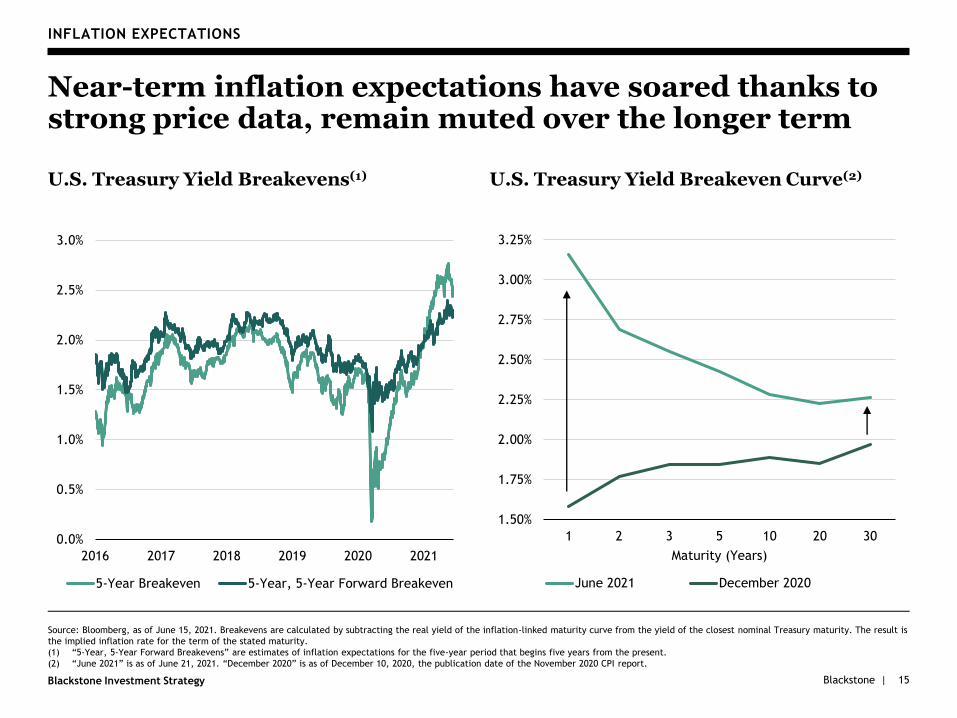
1.50%
1.75%
2.00%
2.25%
2.50%
2.75%
3.00%
3.25%
1 2 3 5 10 20 30
Maturity (Years)
June 2021 December 2020
15
INFLATION EXPECTATIONS
Near-term inflation expectations have soared thanks to strong price data, remain muted over the longer term
U.S. Treasury Yield Breakevens(1) U.S. Treasury Yield Breakeven Curve(2)
Source: Bloomberg, as of June 15, 2021. Breakevens are calculated by subtracting the real yield of the inflation-linked maturity curve from the yield of the closest nominal Treasury maturity. The result is
the implied inflation rate for the term of the stated maturity.
(1) “5-Year, 5-Year Forward Breakevens” are estimates of inflation expectations for the five-year period that begins five years from the present.
(2) “June 2021” is as of June 21, 2021. “December 2020” is as of December 10, 2020, the publication date of the November 2020 CPI report.
0.0%
0.5%
1.0%
1.5%
2.0%
2.5%
3.0%
2016 2017 2018 2019 2020 2021
5-Year Breakeven 5-Year, 5-Year Forward Breakeven

Blackstone |Blackstone Investment Strategy 16
A. Labor Markets
Blackstone |Blackstone Investment Strategy
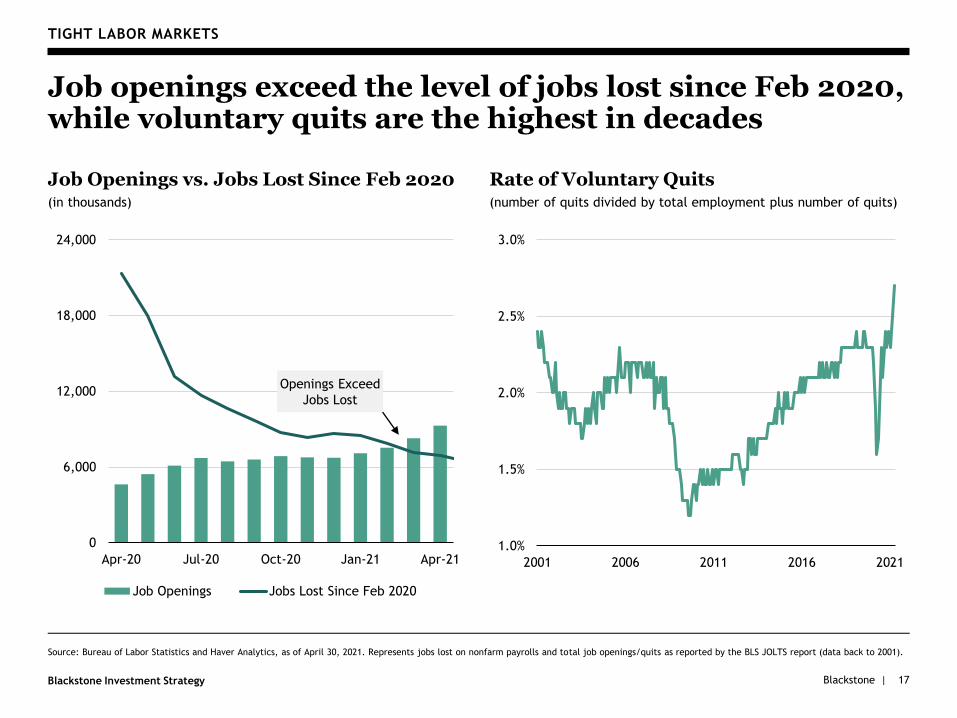
0
6,000
12,000
18,000
24,000
Apr-20 Jul-20 Oct-20 Jan-21 Apr-21
Job Openings Jobs Lost Since Feb 2020
TIGHT LABOR MARKETS
Job openings exceed the level of jobs lost since Feb 2020, while voluntary quits are the highest in decades
Job Openings vs. Jobs Lost Since Feb 2020(in thousands)
Rate of Voluntary Quits(number of quits divided by total employment plus number of quits)
1.0%
1.5%
2.0%
2.5%
3.0%
2001 2006 2011 2016 2021
Source: Bureau of Labor Statistics and Haver Analytics, as of April 30, 2021. Represents jobs lost on nonfarm payrolls and total job openings/quits as reported by the BLS JOLTS report (data back to 2001).
17
Openings Exceed
Jobs Lost
Blackstone |Blackstone Investment Strategy
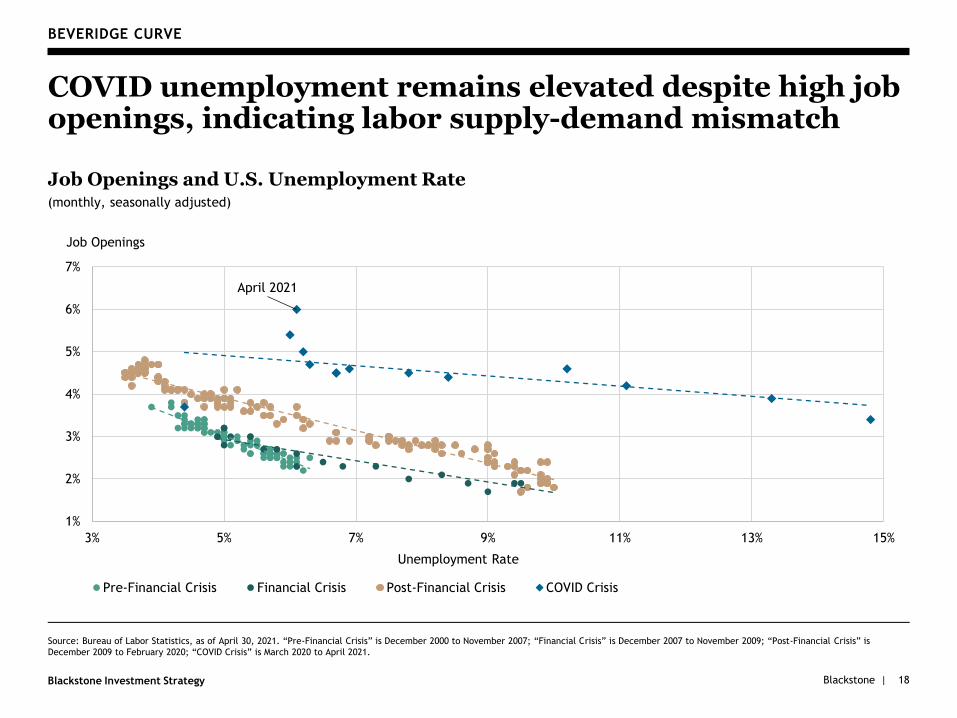
BEVERIDGE CURVE
COVID unemployment remains elevated despite high job openings, indicating labor supply-demand mismatch
Job Openings and U.S. Unemployment Rate(monthly, seasonally adjusted)
Source: Bureau of Labor Statistics, as of April 30, 2021. “Pre-Financial Crisis” is December 2000 to November 2007; “Financial Crisis” is December 2007 to November 2009; “Post-Financial Crisis” is
December 2009 to February 2020; “COVID Crisis” is March 2020 to April 2021.
18
April 2021
1%
2%
3%
4%
5%
6%
7%
3% 5% 7% 9% 11% 13% 15%
Job Openings
Unemployment Rate
Pre-Financial Crisis Financial Crisis Post-Financial Crisis COVID Crisis
Blackstone |Blackstone Investment Strategy
Mining & Logging
Manufacturing
RetailTransportation, Warehousing, Utilities
Information
Financial Activities
Professional & Business Services
Education
Healthcare & Social
Arts, Entertainment,
Recreation
Accommodation & Food Services
0%
5%
10%
15%
20%
25%
30%
3% 4% 5% 6% 7% 8% 9% 10%
(Number of Job Openings, Percent of Feb 2020 Payrolls)
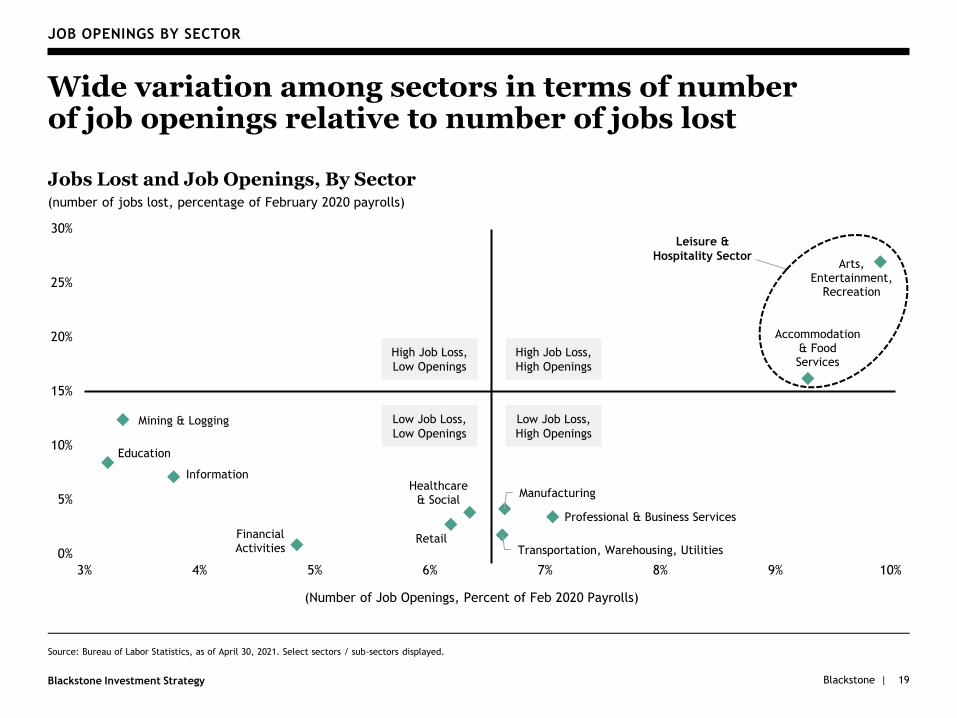
JOB OPENINGS BY SECTOR
Wide variation among sectors in terms of number of job openings relative to number of jobs lost
Jobs Lost and Job Openings, By Sector(number of jobs lost, percentage of February 2020 payrolls)
Source: Bureau of Labor Statistics, as of April 30, 2021. Select sectors / sub-sectors displayed.
19
High Job Loss,
Low Openings
High Job Loss,
High Openings
Low Job Loss,
Low Openings
Low Job Loss,
High Openings
Leisure &
Hospitality Sector
Blackstone |Blackstone Investment Strategy
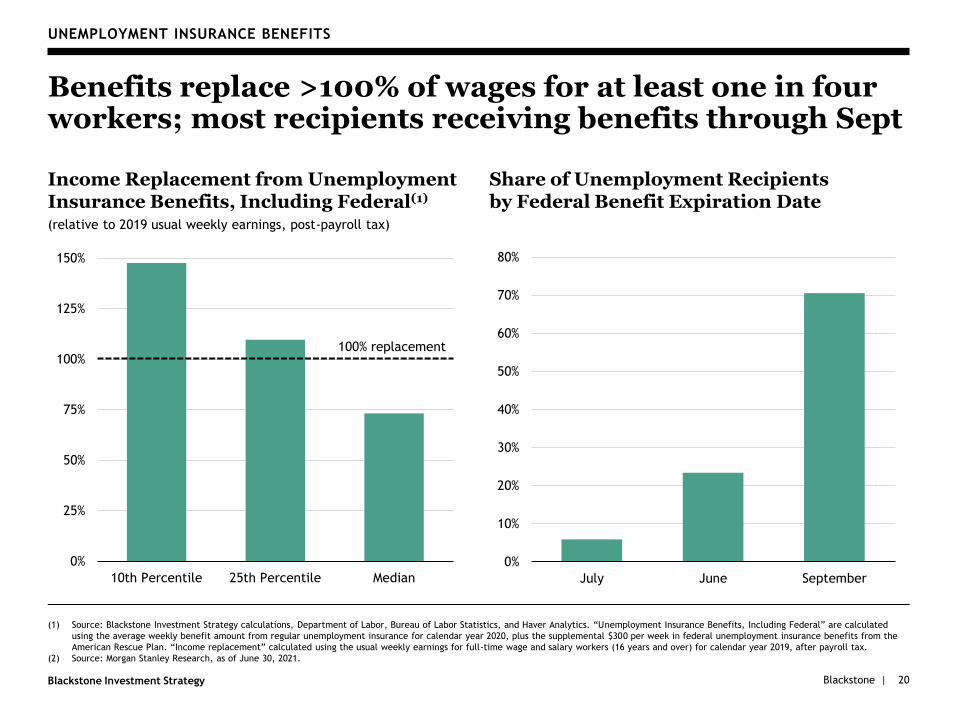
(1) Source: Blackstone Investment Strategy calculations, Department of Labor, Bureau of Labor Statistics, and Haver Analytics. “Unemployment Insurance Benefits, Including Federal” are calculated
using the average weekly benefit amount from regular unemployment insurance for calendar year 2020, plus the supplemental $300 per week in federal unemployment insurance benefits from the
American Rescue Plan. “Income replacement” calculated using the usual weekly earnings for full-time wage and salary workers (16 years and over) for calendar year 2019, after payroll tax.
(2) Source: Morgan Stanley Research, as of June 30, 2021.
20
UNEMPLOYMENT INSURANCE BENEFITS
Benefits replace >100% of wages for at least one in four workers; most recipients receiving benefits through Sept
Income Replacement from Unemployment Insurance Benefits, Including Federal(1)
(relative to 2019 usual weekly earnings, post-payroll tax)
Share of Unemployment Recipients by Federal Benefit Expiration Date
0%
25%
50%
75%
100%
125%
150%
10th Percentile 25th Percentile Median
100% replacement
0%
10%
20%
30%
40%
50%
60%
70%
80%
July June September

Blackstone |Blackstone Investment Strategy
B. Supply Chains
21
Blackstone |Blackstone Investment Strategy
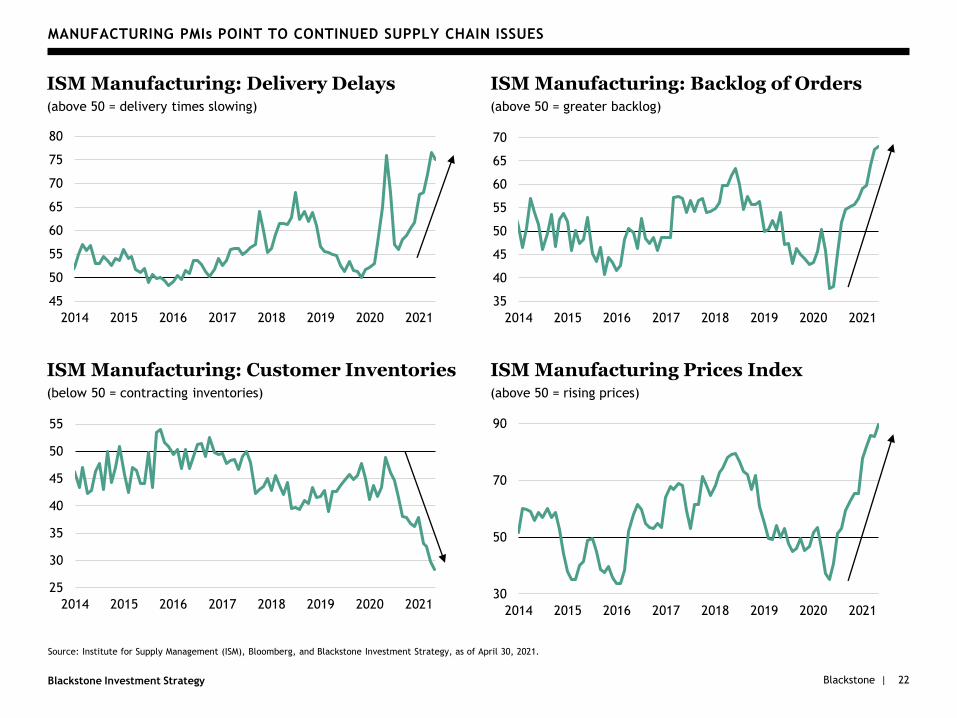
Source: Institute for Supply Management (ISM), Bloomberg, and Blackstone Investment Strategy, as of April 30, 2021.
25
30
35
40
45
50
55
2014 2015 2016 2017 2018 2019 2020 2021
35
40
45
50
55
60
65
70
2014 2015 2016 2017 2018 2019 2020 2021
45
50
55
60
65
70
75
80
2014 2015 2016 2017 2018 2019 2020 2021
30
50
70
90
2014 2015 2016 2017 2018 2019 2020 2021
MANUFACTURING PMIs POINT TO CONTINUED SUPPLY CHAIN ISSUES
ISM Manufacturing: Delivery Delays(above 50 = delivery times slowing)
ISM Manufacturing: Backlog of Orders(above 50 = greater backlog)
ISM Manufacturing: Customer Inventories(below 50 = contracting inventories)
ISM Manufacturing Prices Index(above 50 = rising prices)
22
Blackstone |Blackstone Investment Strategy
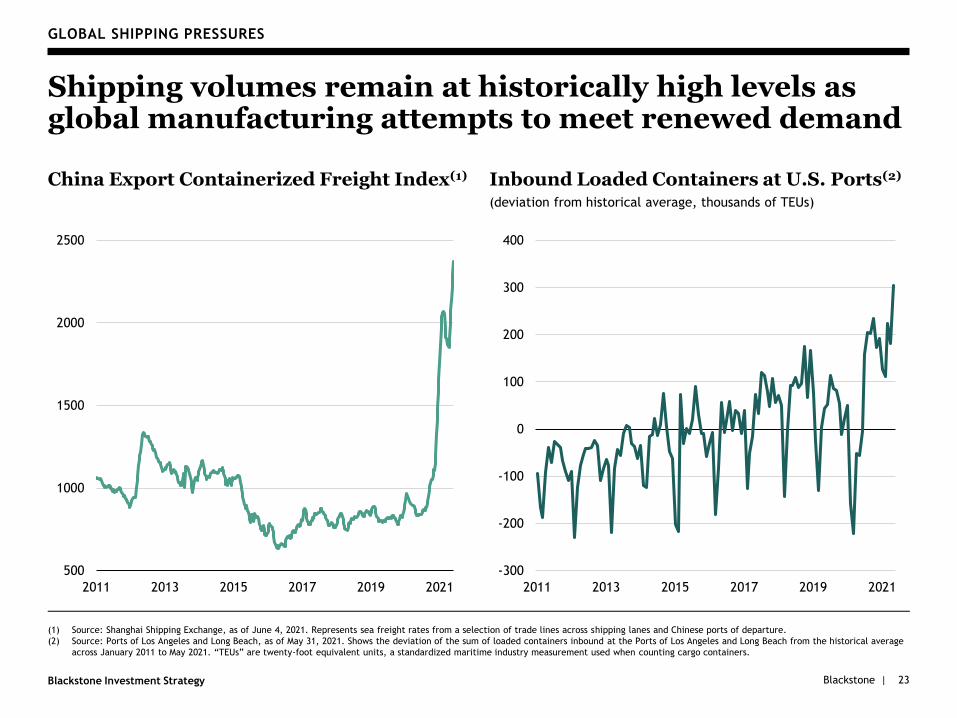
GLOBAL SHIPPING PRESSURES
Shipping volumes remain at historically high levels as global manufacturing attempts to meet renewed demand
China Export Containerized Freight Index(1)
23
Inbound Loaded Containers at U.S. Ports(2)
(deviation from historical average, thousands of TEUs)
(1) Source: Shanghai Shipping Exchange, as of June 4, 2021. Represents sea freight rates from a selection of trade lines across shipping lanes and Chinese ports of departure.
(2) Source: Ports of Los Angeles and Long Beach, as of May 31, 2021. Shows the deviation of the sum of loaded containers inbound at the Ports of Los Angeles and Long Beach from the historical average
across January 2011 to May 2021. “TEUs” are twenty-foot equivalent units, a standardized maritime industry measurement used when counting cargo containers.
500
1000
1500
2000
2500
2011 2013 2015 2017 2019 2021
-300
-200
-100
0
100
200
300
400
2011 2013 2015 2017 2019 2021
Blackstone |Blackstone Investment Strategy
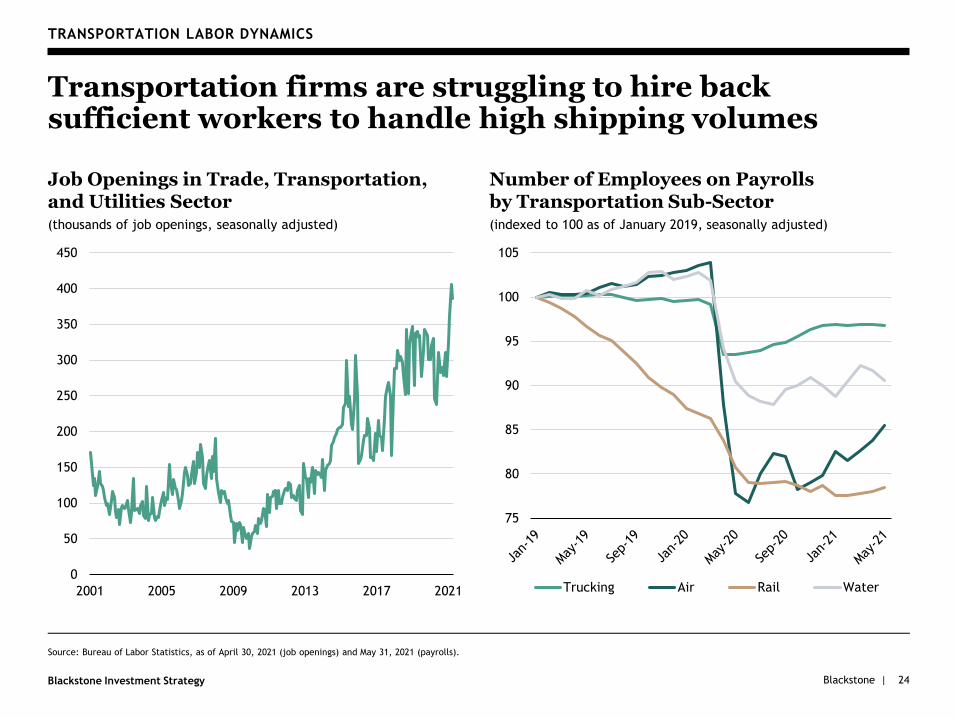
TRANSPORTATION LABOR DYNAMICS
Transportation firms are struggling to hire back sufficient workers to handle high shipping volumes
Job Openings in Trade, Transportation, and Utilities Sector(thousands of job openings, seasonally adjusted)
24
Number of Employees on Payrolls by Transportation Sub-Sector(indexed to 100 as of January 2019, seasonally adjusted)
0
50
100
150
200
250
300
350
400
450
2001 2005 2009 2013 2017 2021
75
80
85
90
95
100
105
Trucking Air Rail Water
Source: Bureau of Labor Statistics, as of April 30, 2021 (job openings) and May 31, 2021 (payrolls).
Blackstone |Blackstone Investment Strategy
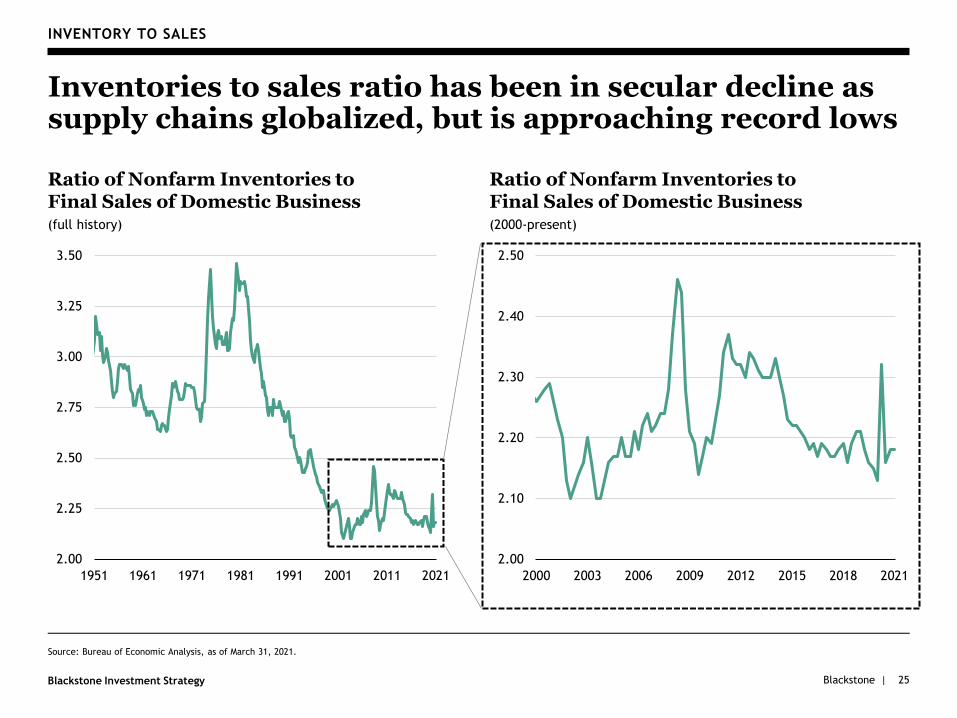
Source: Bureau of Economic Analysis, as of March 31, 2021.
25
INVENTORY TO SALES
Inventories to sales ratio has been in secular decline as supply chains globalized, but is approaching record lows
Ratio of Nonfarm Inventories to Final Sales of Domestic Business (full history)
2.00
2.25
2.50
2.75
3.00
3.25
3.50
1951 1961 1971 1981 1991 2001 2011 2021
Ratio of Nonfarm Inventories to Final Sales of Domestic Business (2000-present)
2.00
2.10
2.20
2.30
2.40
2.50
2000 2003 2006 2009 2012 2015 2018 2021
Blackstone |Blackstone Investment Strategy
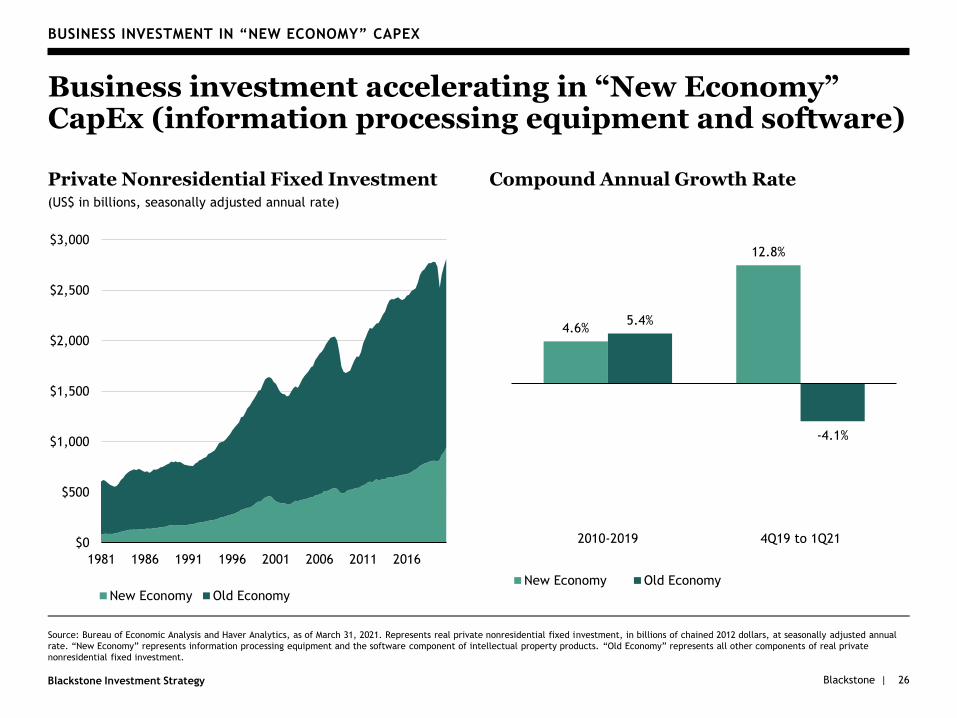
BUSINESS INVESTMENT IN “NEW ECONOMY” CAPEX
Business investment accelerating in “New Economy” CapEx (information processing equipment and software)
Private Nonresidential Fixed Investment(US$ in billions, seasonally adjusted annual rate)
$0
$500
$1,000
$1,500
$2,000
$2,500
$3,000
1981 1986 1991 1996 2001 2006 2011 2016
New Economy Old Economy
Compound Annual Growth Rate
Source: Bureau of Economic Analysis and Haver Analytics, as of March 31, 2021. Represents real private nonresidential fixed investment, in billions of chained 2012 dollars, at seasonally adjusted annual
rate. “New Economy” represents information processing equipment and the software component of intellectual property products. “Old Economy” represents all other components of real private
nonresidential fixed investment.
26
4.6%
12.8%
5.4%
-4.1%
2010-2019 4Q19 to 1Q21
New Economy Old Economy

Blackstone |Blackstone Investment Strategy
IV. Policy Outlook
27
Blackstone |Blackstone Investment Strategy
Source: Office of Management and Budget, Federal Reserve Bank of St. Louis, Center for Financial Stability, Federal Reserve, Bureau of Economic Analysis, and Blackstone Investment Strategy, as of
December 31, 2020.
COORDINATED POLICY RESPONSE
The COVID crisis resulted in the most synchronized fiscal and monetary response in the U.S. since WWII
U.S. Federal Deficit Plus Federal Reserve Balance Sheet Expansion(percentage of nominal GDP)
-5%
0%
5%
10%
15%
20%
25%
30%
1915 1930 1945 1960 1975 1990 2005 2020
28
Blackstone |Blackstone Investment Strategy 29
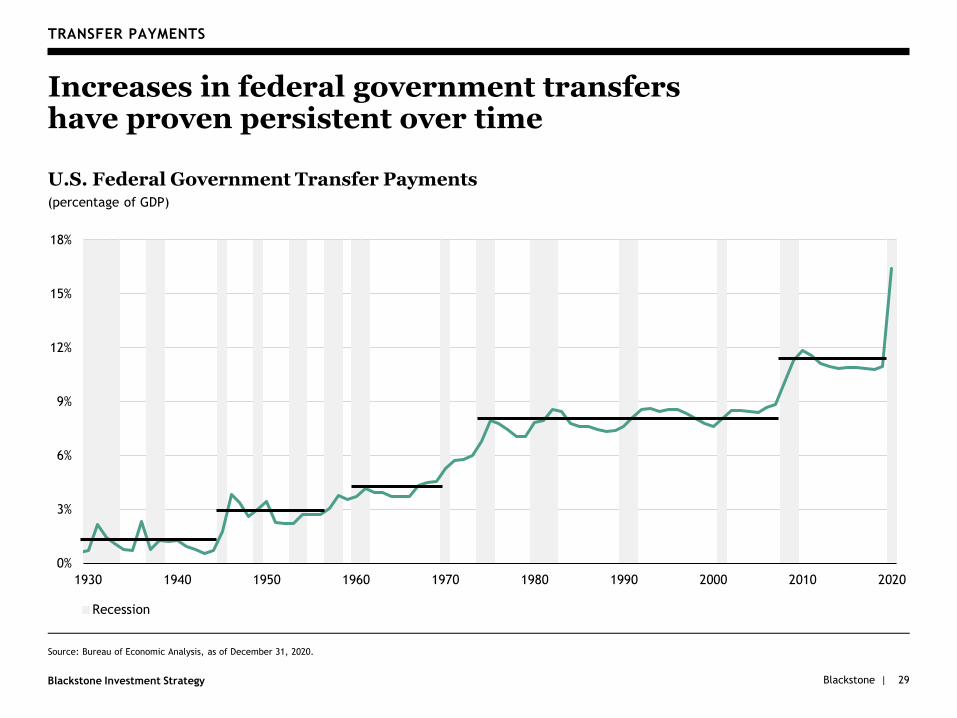
TRANSFER PAYMENTS
Increases in federal government transfers have proven persistent over time
U.S. Federal Government Transfer Payments (percentage of GDP)
Source: Bureau of Economic Analysis, as of December 31, 2020.
0%
3%
6%
9%
12%
15%
18%
1930 1940 1950 1960 1970 1980 1990 2000 2010 2020
Recession
Blackstone |Blackstone Investment Strategy
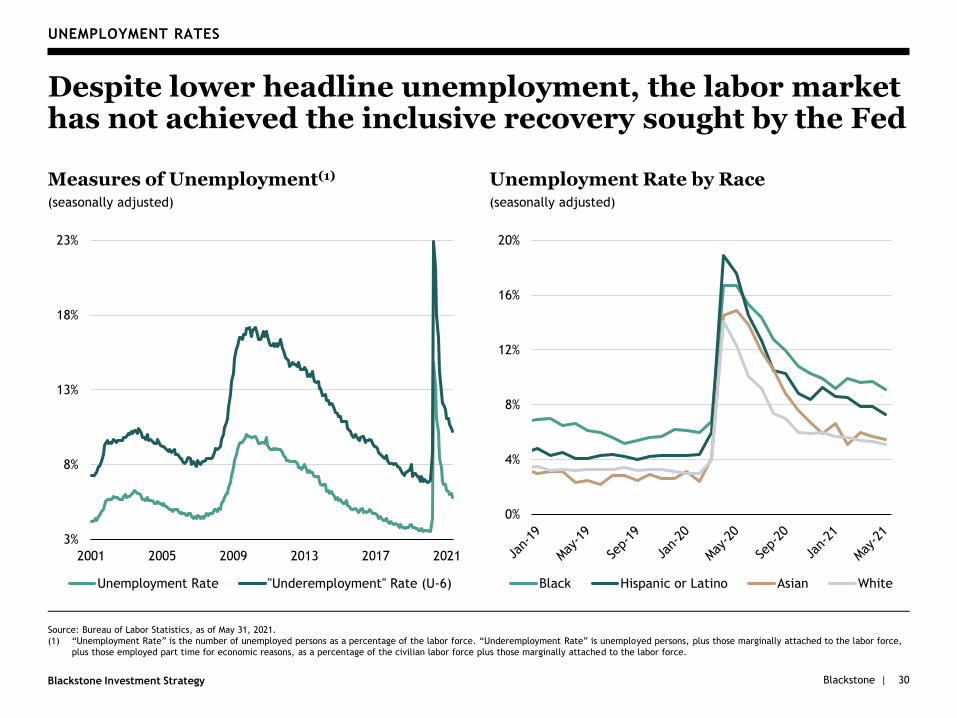
UNEMPLOYMENT RATES
Despite lower headline unemployment, the labor market has not achieved the inclusive recovery sought by the Fed
Measures of Unemployment(1)
(seasonally adjusted)
30
Unemployment Rate by Race(seasonally adjusted)
3%
8%
13%
18%
23%
2001 2005 2009 2013 2017 2021
Unemployment Rate "Underemployment" Rate (U-6)
0%
4%
8%
12%
16%
20%
Black Hispanic or Latino Asian White
Source: Bureau of Labor Statistics, as of May 31, 2021.
(1) “Unemployment Rate” is the number of unemployed persons as a percentage of the labor force. “Underemployment Rate” is unemployed persons, plus those marginally attached to the labor force,
plus those employed part time for economic reasons, as a percentage of the civilian labor force plus those marginally attached to the labor force.
Blackstone |Blackstone Investment Strategy 31
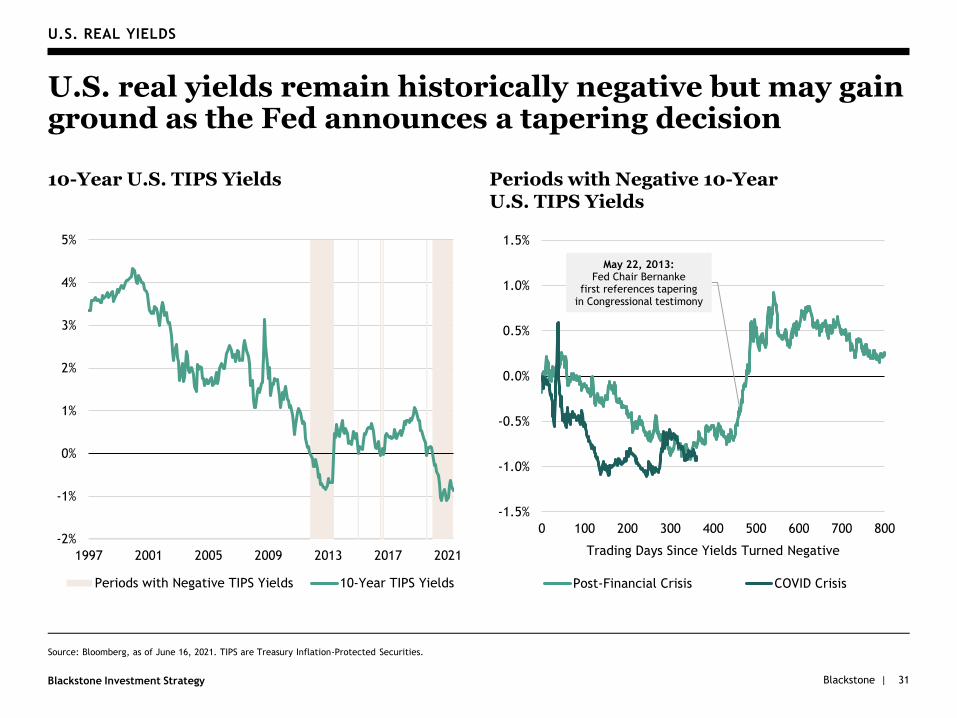
U.S. REAL YIELDS
U.S. real yields remain historically negative but may gain ground as the Fed announces a tapering decision
10-Year U.S. TIPS Yields
Source: Bloomberg, as of June 16, 2021. TIPS are Treasury Inflation-Protected Securities.
Periods with Negative 10-Year U.S. TIPS Yields
May 22, 2013:Fed Chair Bernanke
first references taperingin Congressional testimony
-1.5%
-1.0%
-0.5%
0.0%
0.5%
1.0%
1.5%
8007006005004003002001000
Trading Days Since Yields Turned Negative
Post-Financial Crisis COVID Crisis
-2%
-1%
0%
1%
2%
3%
4%
5%
1997 2001 2005 2009 2013 2017 2021
Periods with Negative TIPS Yields 10-Year TIPS Yields

Blackstone |Blackstone Investment Strategy
V. Corporate Profits
32
Blackstone |Blackstone Investment Strategy
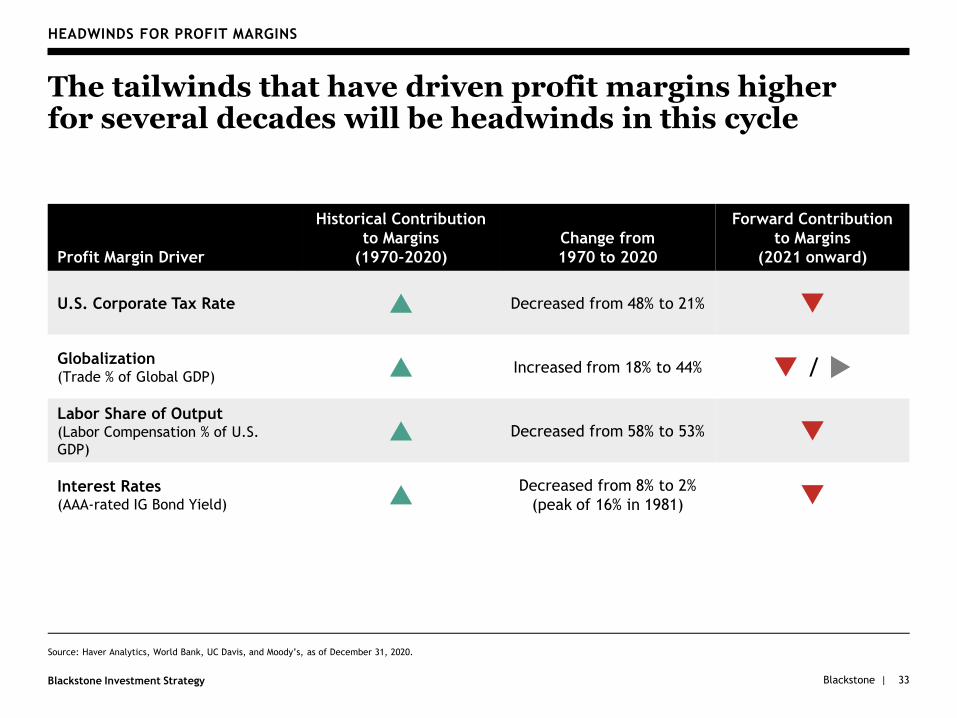
HEADWINDS FOR PROFIT MARGINS
The tailwinds that have driven profit margins higher for several decades will be headwinds in this cycle
Source: Haver Analytics, World Bank, UC Davis, and Moody’s, as of December 31, 2020.
33
Profit Margin Driver
Historical Contribution
to Margins
(1970-2020)
Change from
1970 to 2020
Forward Contribution
to Margins
(2021 onward)
U.S. Corporate Tax Rate Decreased from 48% to 21%
Globalization (Trade % of Global GDP) Increased from 18% to 44% /
Labor Share of Output(Labor Compensation % of U.S.
GDP) Decreased from 58% to 53%
Interest Rates (AAA-rated IG Bond Yield)
Decreased from 8% to 2%
(peak of 16% in 1981)
Blackstone |Blackstone Investment Strategy
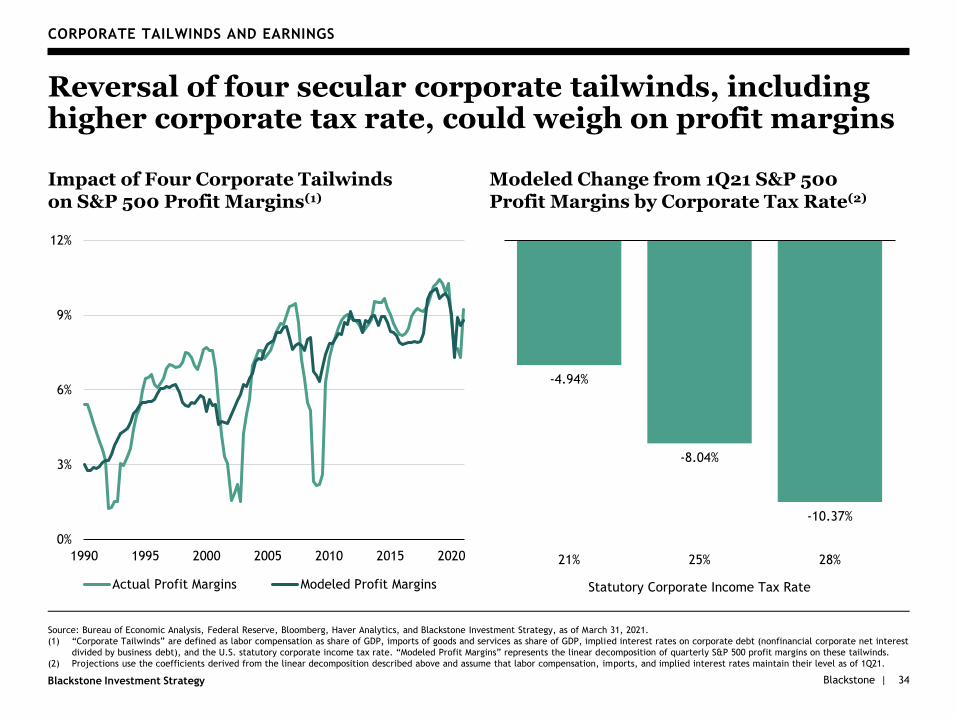
CORPORATE TAILWINDS AND EARNINGS
Impact of Four Corporate Tailwinds on S&P 500 Profit Margins(1)
34
Modeled Change from 1Q21 S&P 500 Profit Margins by Corporate Tax Rate(2)
Source: Bureau of Economic Analysis, Federal Reserve, Bloomberg, Haver Analytics, and Blackstone Investment Strategy, as of March 31, 2021.
(1) “Corporate Tailwinds” are defined as labor compensation as share of GDP, imports of goods and services as share of GDP, implied interest rates on corporate debt (nonfinancial corporate net interest
divided by business debt), and the U.S. statutory corporate income tax rate. “Modeled Profit Margins” represents the linear decomposition of quarterly S&P 500 profit margins on these tailwinds.
(2) Projections use the coefficients derived from the linear decomposition described above and assume that labor compensation, imports, and implied interest rates maintain their level as of 1Q21.
Reversal of four secular corporate tailwinds, including higher corporate tax rate, could weigh on profit margins
-4.94%
-8.04%
-10.37%
21% 25% 28%
Statutory Corporate Income Tax Rate
0%
3%
6%
9%
12%
1990 1995 2000 2005 2010 2015 2020
Actual Profit Margins Modeled Profit Margins
Blackstone |Blackstone Investment Strategy 35
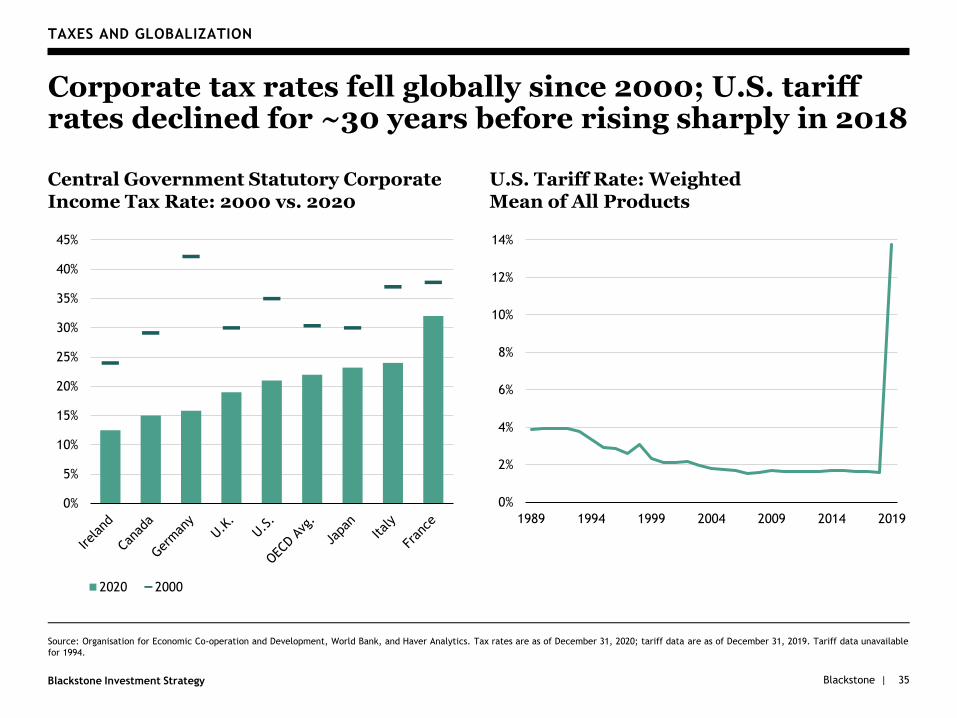
TAXES AND GLOBALIZATION
Corporate tax rates fell globally since 2000; U.S. tariff rates declined for ~30 years before rising sharply in 2018
Central Government Statutory Corporate Income Tax Rate: 2000 vs. 2020
U.S. Tariff Rate: Weighted Mean of All Products
0%
2%
4%
6%
8%
10%
12%
14%
1989 1994 1999 2004 2009 2014 2019
Source: Organisation for Economic Co-operation and Development, World Bank, and Haver Analytics. Tax rates are as of December 31, 2020; tariff data are as of December 31, 2019. Tariff data unavailable
for 1994.
0%
5%
10%
15%
20%
25%
30%
35%
40%
45%
2020 2000
Blackstone |Blackstone Investment Strategy 36
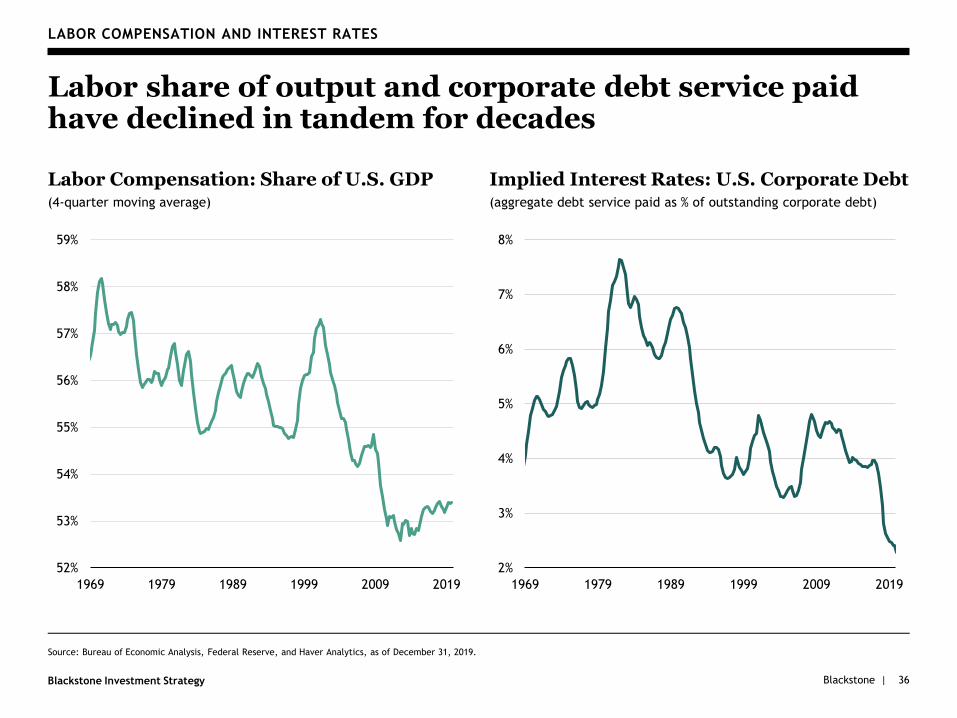
LABOR COMPENSATION AND INTEREST RATES
Labor share of output and corporate debt service paid have declined in tandem for decades
Labor Compensation: Share of U.S. GDP(4-quarter moving average)
52%
53%
54%
55%
56%
57%
58%
59%
1969 1979 1989 1999 2009 2019
Implied Interest Rates: U.S. Corporate Debt(aggregate debt service paid as % of outstanding corporate debt)
2%
3%
4%
5%
6%
7%
8%
1969 1979 1989 1999 2009 2019
Source: Bureau of Economic Analysis, Federal Reserve, and Haver Analytics, as of December 31, 2019.
Blackstone |Blackstone Investment Strategy
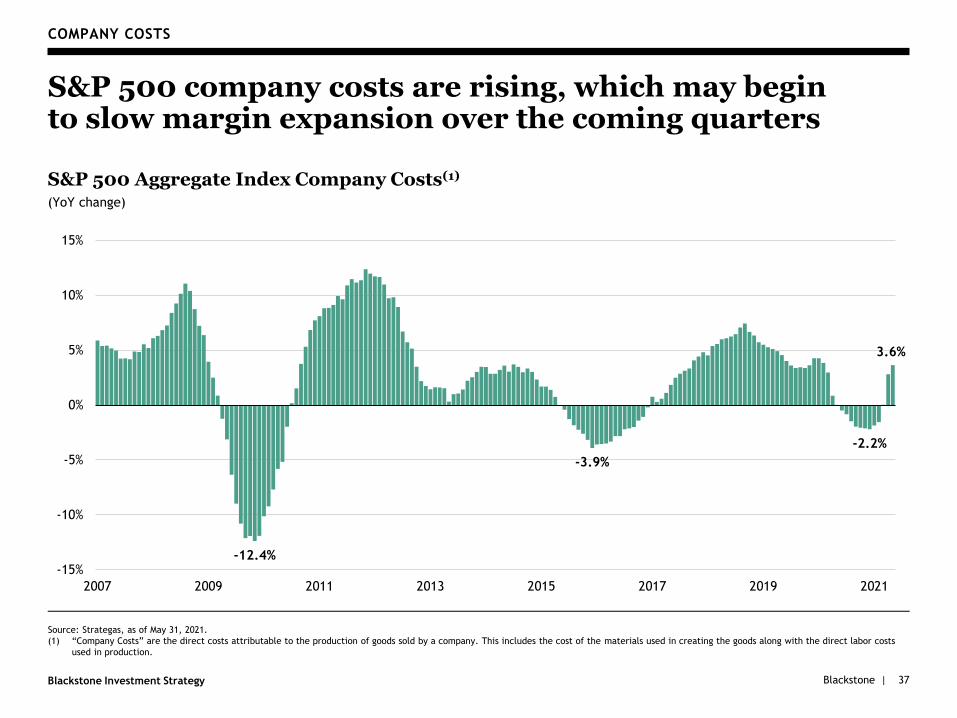
Source: Strategas, as of May 31, 2021.
(1) “Company Costs” are the direct costs attributable to the production of goods sold by a company. This includes the cost of the materials used in creating the goods along with the direct labor costs
used in production.
COMPANY COSTS
S&P 500 company costs are rising, which may begin to slow margin expansion over the coming quarters
37
S&P 500 Aggregate Index Company Costs(1)
(YoY change)
-12.4%
-3.9%
-2.2%
3.6%
-15%
-10%
-5%
0%
5%
10%
15%
2007 2009 2011 2013 2015 2017 2019 2021

Blackstone |Blackstone Investment Strategy
VI. Credit Markets
38
Blackstone |Blackstone Investment Strategy
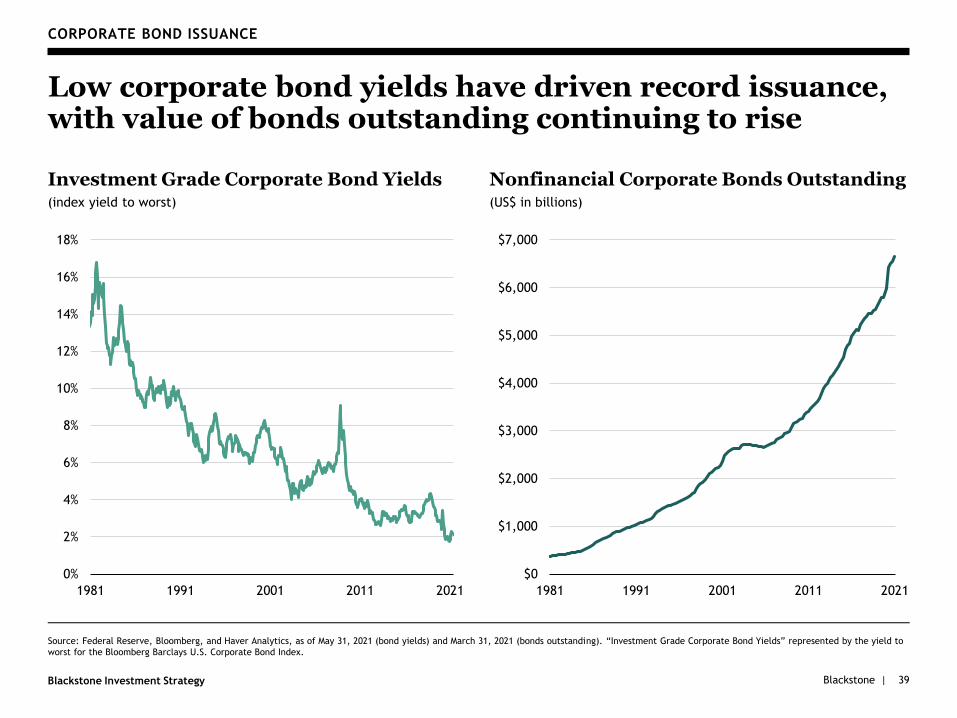
CORPORATE BOND ISSUANCE
Low corporate bond yields have driven record issuance, with value of bonds outstanding continuing to rise
Investment Grade Corporate Bond Yields(index yield to worst)
0%
2%
4%
6%
8%
10%
12%
14%
16%
18%
1981 1991 2001 2011 2021
Nonfinancial Corporate Bonds Outstanding(US$ in billions)
$0
$1,000
$2,000
$3,000
$4,000
$5,000
$6,000
$7,000
1981 1991 2001 2011 2021
Source: Federal Reserve, Bloomberg, and Haver Analytics, as of May 31, 2021 (bond yields) and March 31, 2021 (bonds outstanding). “Investment Grade Corporate Bond Yields” represented by the yield to
worst for the Bloomberg Barclays U.S. Corporate Bond Index.
39
Blackstone |Blackstone Investment Strategy
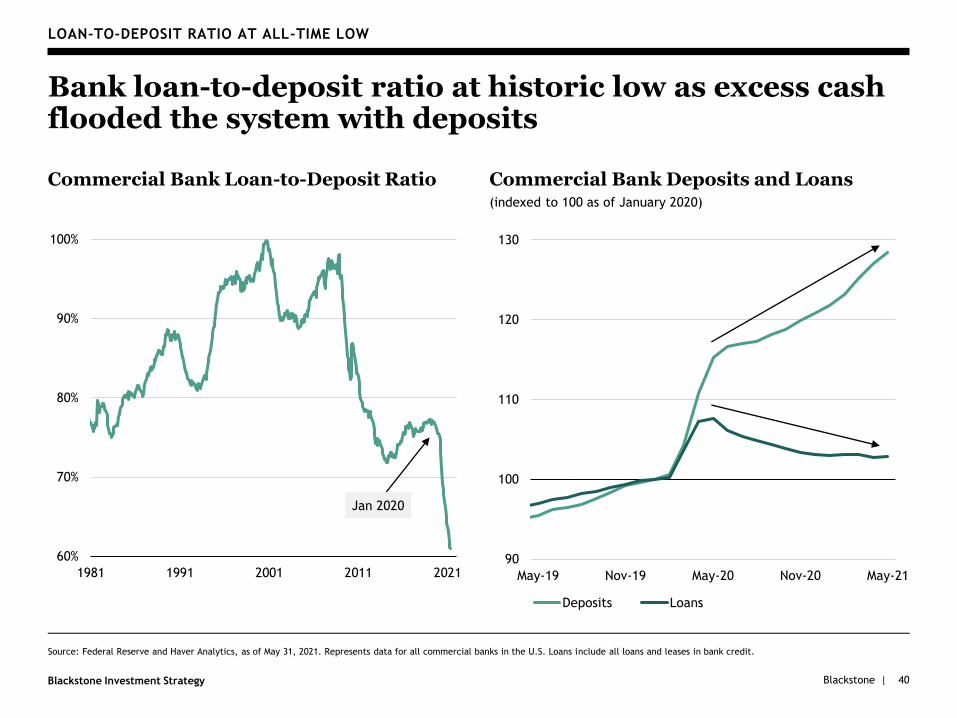
LOAN-TO-DEPOSIT RATIO AT ALL-TIME LOW
Bank loan-to-deposit ratio at historic low as excess cash flooded the system with deposits
Commercial Bank Loan-to-Deposit Ratio
60%
70%
80%
90%
100%
1981 1991 2001 2011 2021
Commercial Bank Deposits and Loans(indexed to 100 as of January 2020)
Source: Federal Reserve and Haver Analytics, as of May 31, 2021. Represents data for all commercial banks in the U.S. Loans include all loans and leases in bank credit.
40
Jan 2020
90
100
110
120
130
May-19 Nov-19 May-20 Nov-20 May-21
Deposits Loans
Blackstone |Blackstone Investment Strategy
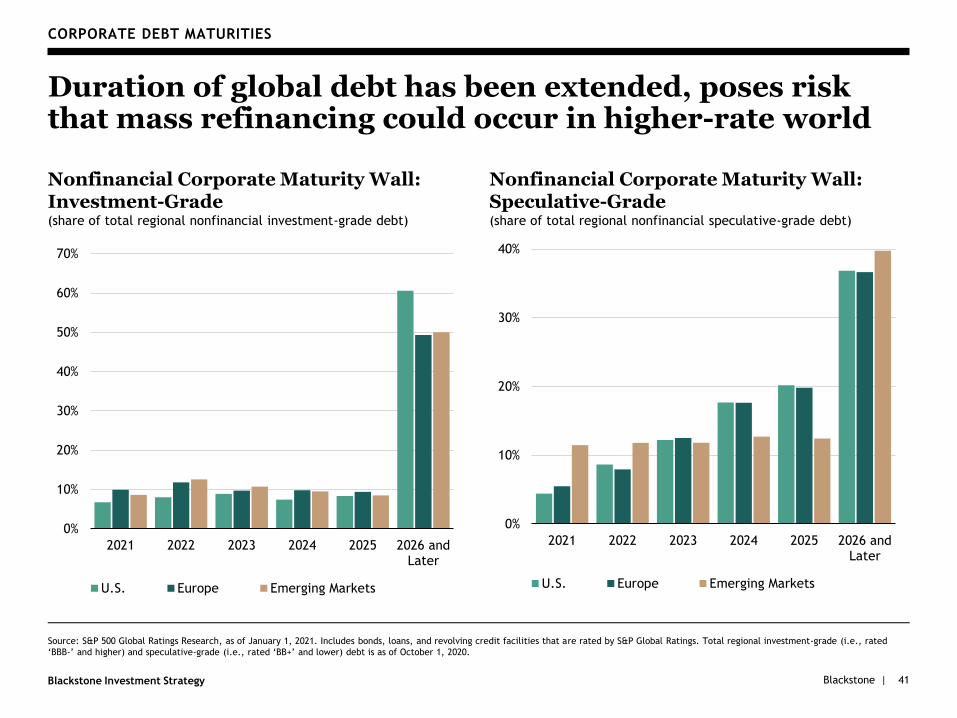
CORPORATE DEBT MATURITIES
Duration of global debt has been extended, poses risk that mass refinancing could occur in higher-rate world
Nonfinancial Corporate Maturity Wall: Investment-Grade(share of total regional nonfinancial investment-grade debt)
41
Nonfinancial Corporate Maturity Wall: Speculative-Grade(share of total regional nonfinancial speculative-grade debt)
Source: S&P 500 Global Ratings Research, as of January 1, 2021. Includes bonds, loans, and revolving credit facilities that are rated by S&P Global Ratings. Total regional investment-grade (i.e., rated
‘BBB-’ and higher) and speculative-grade (i.e., rated ‘BB+’ and lower) debt is as of October 1, 2020.
0%
10%
20%
30%
40%
50%
60%
70%
2021 2022 2023 2024 2025 2026 andLater
U.S. Europe Emerging Markets
0%
10%
20%
30%
40%
2021 2022 2023 2024 2025 2026 andLater
U.S. Europe Emerging Markets

Blackstone |Blackstone Investment Strategy 42
VII. Equity Markets
Blackstone |Blackstone Investment Strategy
2,000
2,500
3,000
3,500
4,000
4,500
2019 2020 2021
43
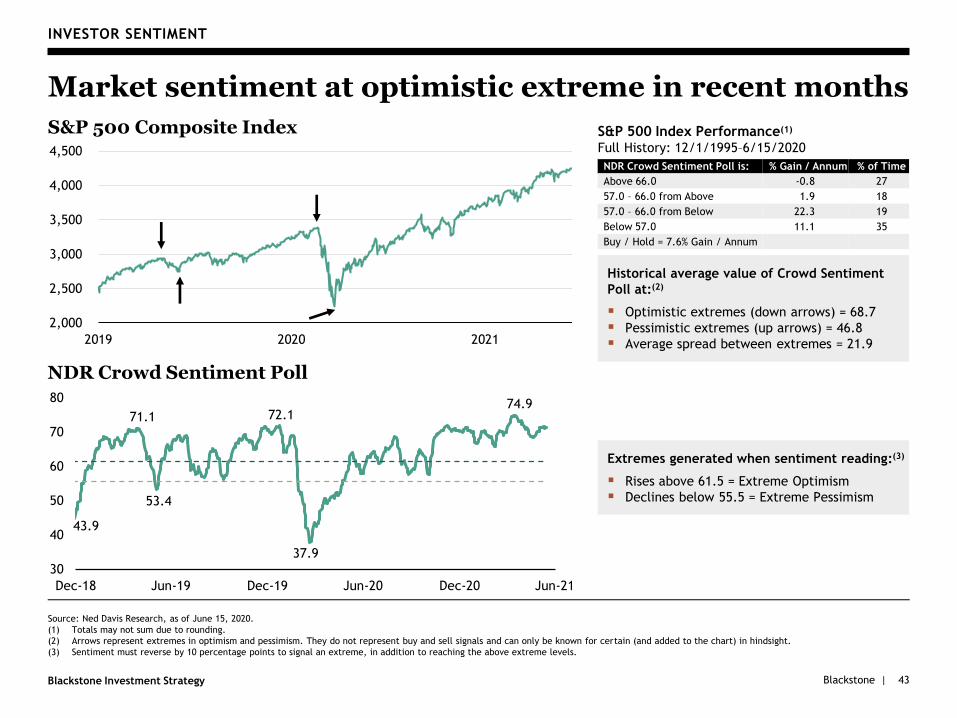
INVESTOR SENTIMENT
Market sentiment at optimistic extreme in recent months
Source: Ned Davis Research, as of June 15, 2020.
(1) Totals may not sum due to rounding.
(2) Arrows represent extremes in optimism and pessimism. They do not represent buy and sell signals and can only be known for certain (and added to the chart) in hindsight.
(3) Sentiment must reverse by 10 percentage points to signal an extreme, in addition to reaching the above extreme levels.
Extremes generated when sentiment reading:(3)
▪ Rises above 61.5 = Extreme Optimism
▪ Declines below 55.5 = Extreme Pessimism
Historical average value of Crowd Sentiment
Poll at:(2)
▪ Optimistic extremes (down arrows) = 68.7
▪ Pessimistic extremes (up arrows) = 46.8
▪ Average spread between extremes = 21.9
S&P 500 Composite Index
NDR Crowd Sentiment Poll
NDR Crowd Sentiment Poll is: % Gain / Annum % of Time
Above 66.0 -0.8 27
57.0 – 66.0 from Above 1.9 18
57.0 – 66.0 from Below 22.3 19
Below 57.0 11.1 35
Buy / Hold = 7.6% Gain / Annum
S&P 500 Index Performance(1)
Full History: 12/1/1995–6/15/2020
43.9
71.1
53.4
72.1
37.9
74.9
30
40
50
60
70
80
Dec-18 Jun-19 Dec-19 Jun-20 Dec-20 Jun-21
Blackstone |Blackstone Investment Strategy 44
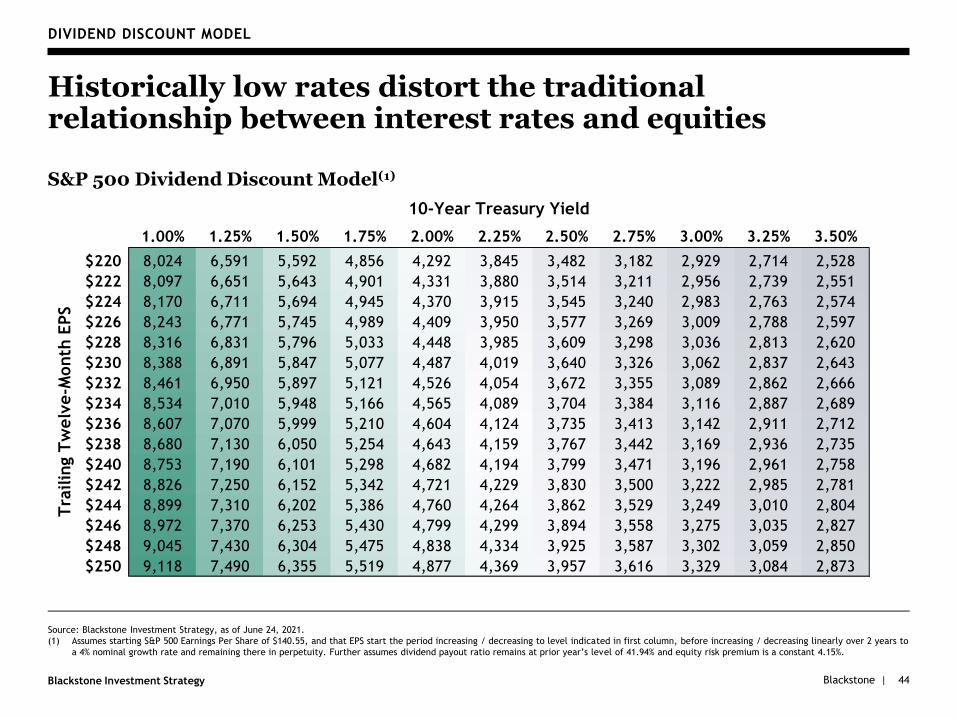
DIVIDEND DISCOUNT MODEL
Historically low rates distort the traditional relationship between interest rates and equities
S&P 500 Dividend Discount Model(1)
Source: Blackstone Investment Strategy, as of June 24, 2021.
(1) Assumes starting S&P 500 Earnings Per Share of $140.55, and that EPS start the period increasing / decreasing to level indicated in first column, before increasing / decreasing linearly over 2 years to
a 4% nominal growth rate and remaining there in perpetuity. Further assumes dividend payout ratio remains at prior year’s level of 41.94% and equity risk premium is a constant 4.15%.
1.00% 1.25% 1.50% 1.75% 2.00% 2.25% 2.50% 2.75% 3.00% 3.25% 3.50%
$220 8,024 6,591 5,592 4,856 4,292 3,845 3,482 3,182 2,929 2,714 2,528
$222 8,097 6,651 5,643 4,901 4,331 3,880 3,514 3,211 2,956 2,739 2,551
$224 8,170 6,711 5,694 4,945 4,370 3,915 3,545 3,240 2,983 2,763 2,574
$226 8,243 6,771 5,745 4,989 4,409 3,950 3,577 3,269 3,009 2,788 2,597
$228 8,316 6,831 5,796 5,033 4,448 3,985 3,609 3,298 3,036 2,813 2,620
$230 8,388 6,891 5,847 5,077 4,487 4,019 3,640 3,326 3,062 2,837 2,643
$232 8,461 6,950 5,897 5,121 4,526 4,054 3,672 3,355 3,089 2,862 2,666
$234 8,534 7,010 5,948 5,166 4,565 4,089 3,704 3,384 3,116 2,887 2,689
$236 8,607 7,070 5,999 5,210 4,604 4,124 3,735 3,413 3,142 2,911 2,712
$238 8,680 7,130 6,050 5,254 4,643 4,159 3,767 3,442 3,169 2,936 2,735
$240 8,753 7,190 6,101 5,298 4,682 4,194 3,799 3,471 3,196 2,961 2,758
$242 8,826 7,250 6,152 5,342 4,721 4,229 3,830 3,500 3,222 2,985 2,781
$244 8,899 7,310 6,202 5,386 4,760 4,264 3,862 3,529 3,249 3,010 2,804
$246 8,972 7,370 6,253 5,430 4,799 4,299 3,894 3,558 3,275 3,035 2,827
$248 9,045 7,430 6,304 5,475 4,838 4,334 3,925 3,587 3,302 3,059 2,850
$250 9,118 7,490 6,355 5,519 4,877 4,369 3,957 3,616 3,329 3,084 2,873
Tra
ilin
g T
welv
e-M
onth
EPS
10-Year Treasury Yield
Blackstone |Blackstone Investment Strategy
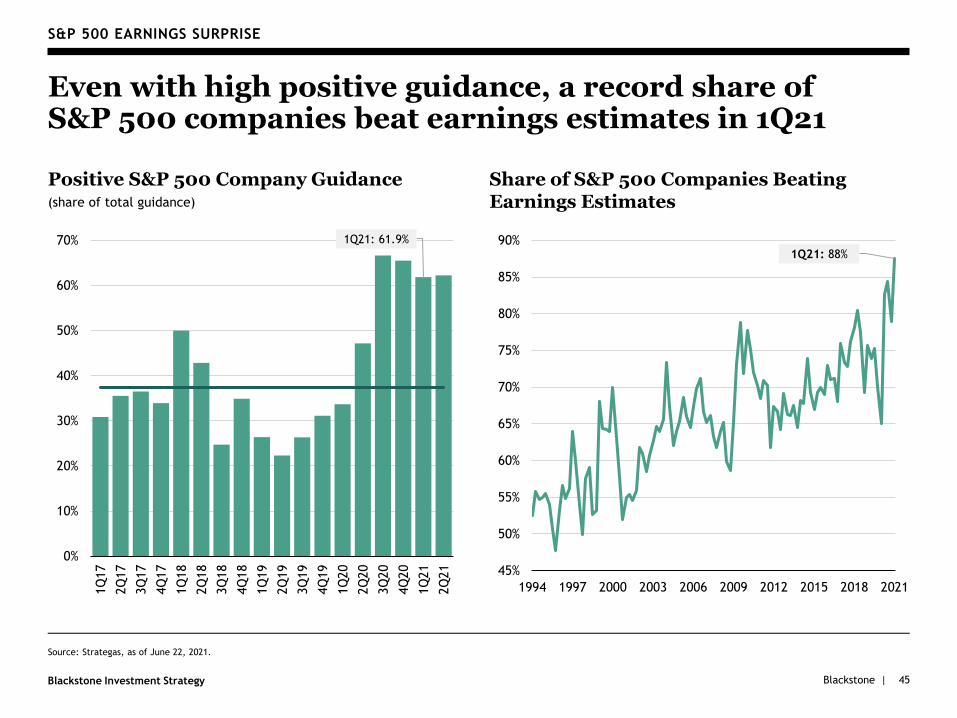
Source: Strategas, as of June 22, 2021.
S&P 500 EARNINGS SURPRISE
Even with high positive guidance, a record share of S&P 500 companies beat earnings estimates in 1Q21
Share of S&P 500 Companies Beating Earnings Estimates
45
1Q21: 88%
45%
50%
55%
60%
65%
70%
75%
80%
85%
90%
1994 1997 2000 2003 2006 2009 2012 2015 2018 2021
1Q21: 61.9%
0%
10%
20%
30%
40%
50%
60%
70%
1Q
17
2Q
17
3Q
17
4Q
17
1Q
18
2Q
18
3Q
18
4Q
18
1Q
19
2Q
19
3Q
19
4Q
19
1Q
20
2Q
20
3Q
20
4Q
20
1Q
21
2Q
21
Positive S&P 500 Company Guidance(share of total guidance)
Blackstone |Blackstone Investment Strategy
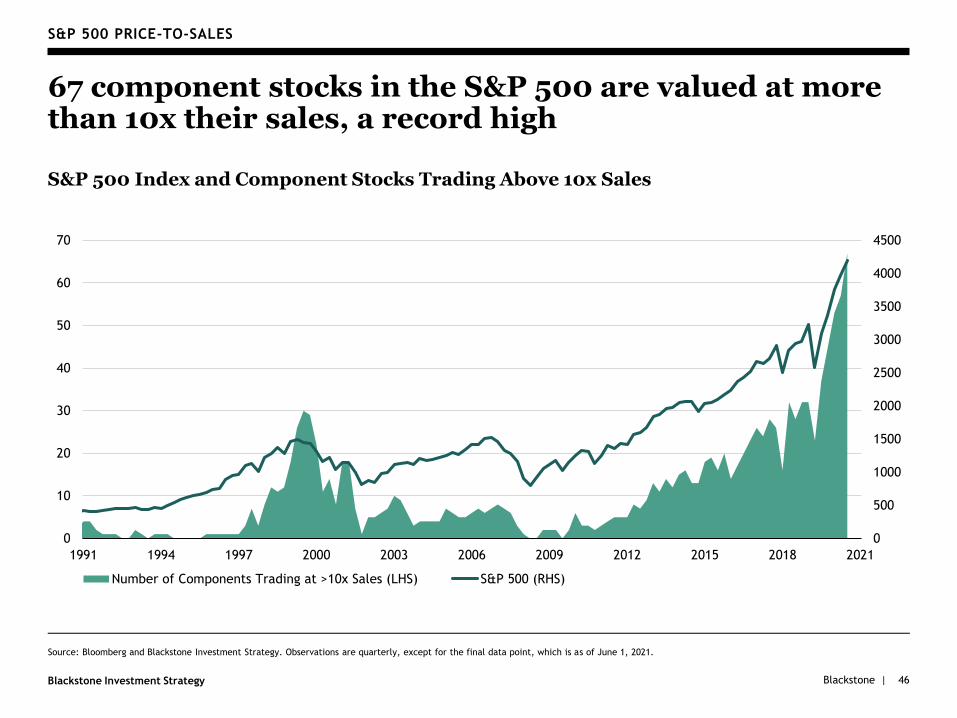
S&P 500 PRICE-TO-SALES
67 component stocks in the S&P 500 are valued at more than 10x their sales, a record high
S&P 500 Index and Component Stocks Trading Above 10x Sales
46
0
500
1000
1500
2000
2500
3000
3500
4000
4500
0
10
20
30
40
50
60
70
1991 1994 1997 2000 2003 2006 2009 2012 2015 2018 2021
Number of Components Trading at >10x Sales (LHS) S&P 500 (RHS)
Source: Bloomberg and Blackstone Investment Strategy. Observations are quarterly, except for the final data point, which is as of June 1, 2021.
Blackstone |Blackstone Investment Strategy 47
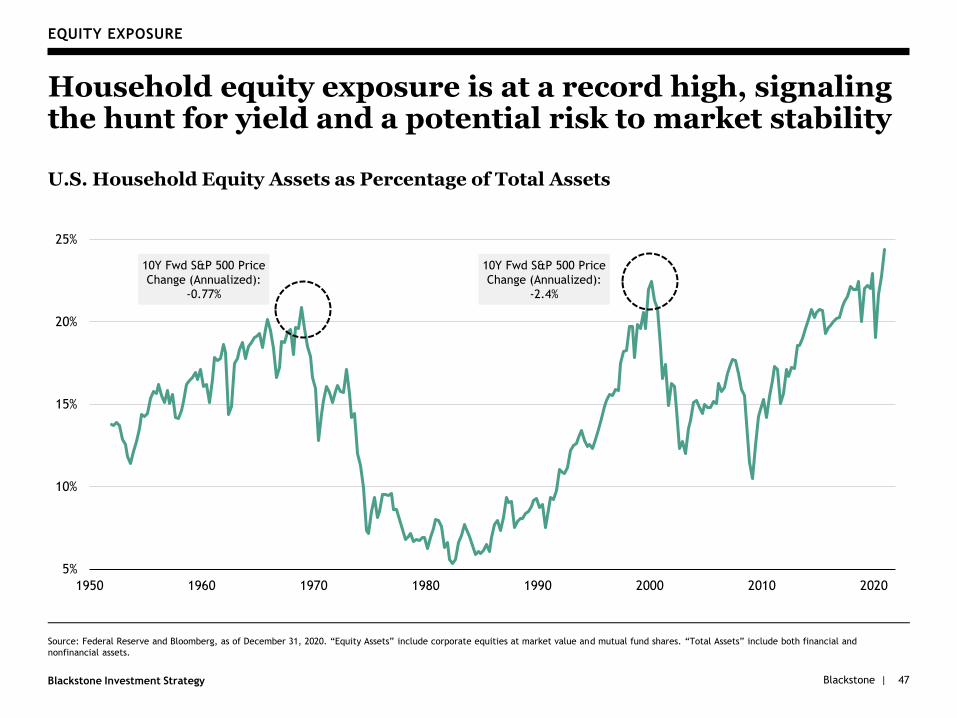
EQUITY EXPOSURE
Household equity exposure is at a record high, signaling the hunt for yield and a potential risk to market stability
U.S. Household Equity Assets as Percentage of Total Assets
5%
10%
15%
20%
25%
1950 1960 1970 1980 1990 2000 2010 2020
Source: Federal Reserve and Bloomberg, as of December 31, 2020. “Equity Assets” include corporate equities at market value and mutual fund shares. “Total Assets” include both financial and
nonfinancial assets.
10Y Fwd S&P 500 Price
Change (Annualized):
-0.77%
10Y Fwd S&P 500 Price
Change (Annualized):
-2.4%
Blackstone |Blackstone Investment Strategy 48
VIII. Long-Term Trends
Blackstone |Blackstone Investment Strategy
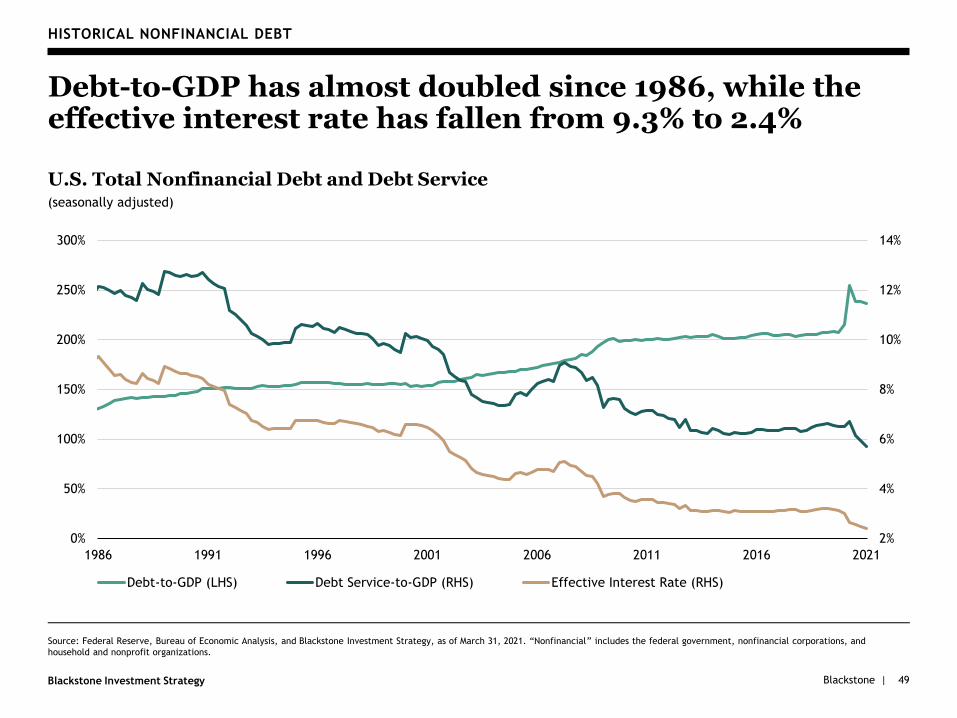
HISTORICAL NONFINANCIAL DEBT
Debt-to-GDP has almost doubled since 1986, while the effective interest rate has fallen from 9.3% to 2.4%
U.S. Total Nonfinancial Debt and Debt Service(seasonally adjusted)
49
Source: Federal Reserve, Bureau of Economic Analysis, and Blackstone Investment Strategy, as of March 31, 2021. “Nonfinancial” includes the federal government, nonfinancial corporations, and
household and nonprofit organizations.
2%
4%
6%
8%
10%
12%
14%
0%
50%
100%
150%
200%
250%
300%
1986 1991 1996 2001 2006 2011 2016 2021
Debt-to-GDP (LHS) Debt Service-to-GDP (RHS) Effective Interest Rate (RHS)
Blackstone |Blackstone Investment Strategy 50
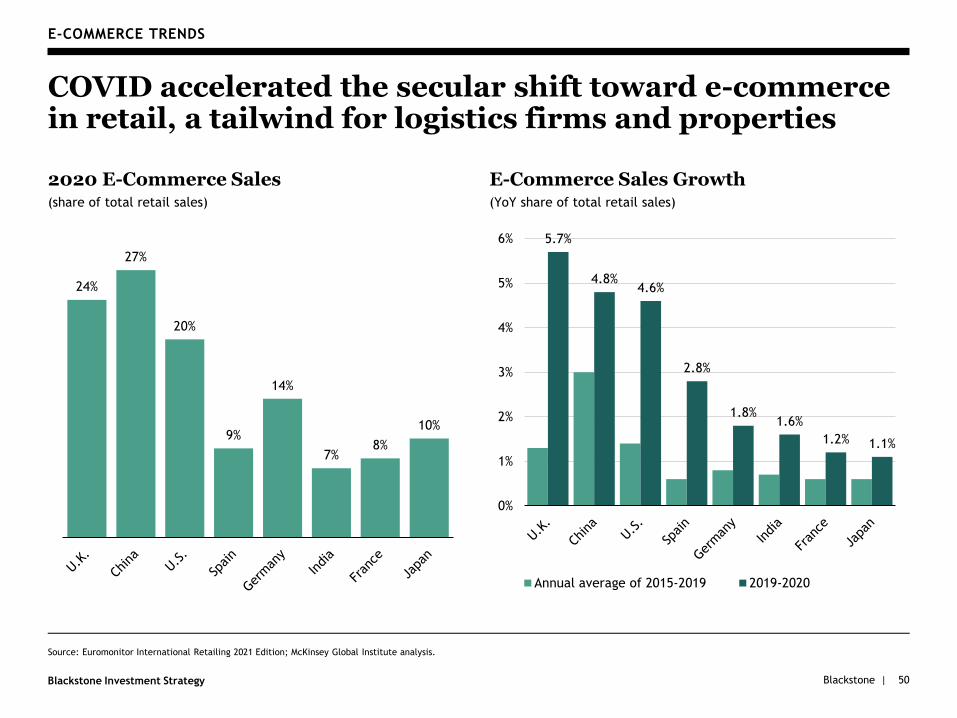
E-COMMERCE TRENDS
COVID accelerated the secular shift toward e-commerce in retail, a tailwind for logistics firms and properties
E-Commerce Sales Growth(YoY share of total retail sales)
2020 E-Commerce Sales(share of total retail sales)
Source: Euromonitor International Retailing 2021 Edition; McKinsey Global Institute analysis.
24%
27%
20%
9%
14%
7%8%
10%
5.7%
4.8%4.6%
2.8%
1.8%1.6%
1.2% 1.1%
0%
1%
2%
3%
4%
5%
6%
Annual average of 2015-2019 2019-2020
Blackstone |Blackstone Investment Strategy
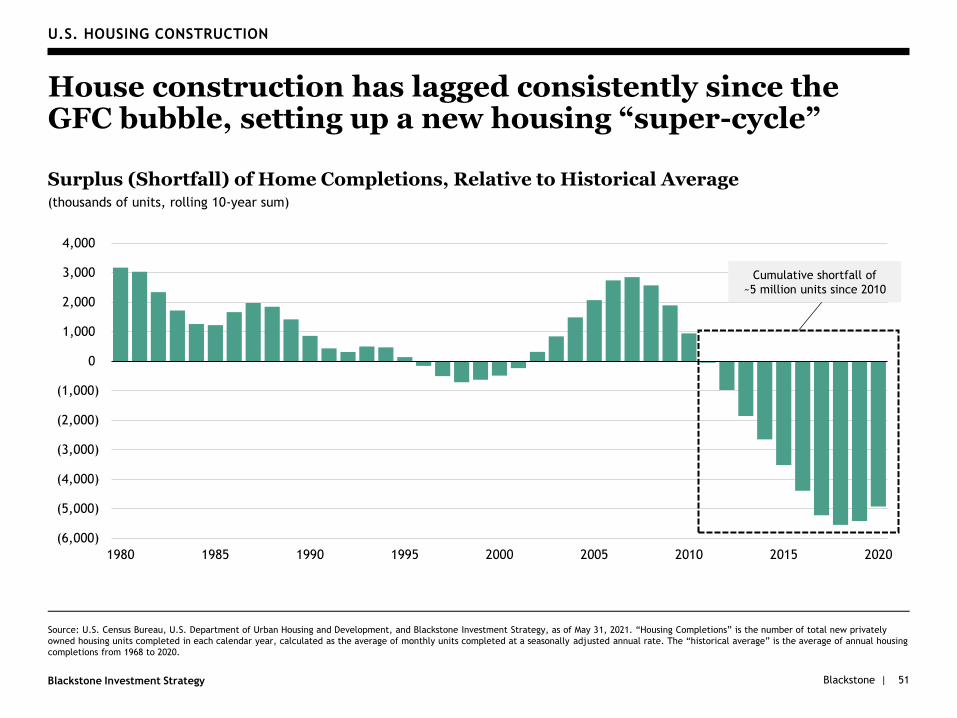
Source: U.S. Census Bureau, U.S. Department of Urban Housing and Development, and Blackstone Investment Strategy, as of May 31, 2021. “Housing Completions” is the number of total new privately
owned housing units completed in each calendar year, calculated as the average of monthly units completed at a seasonally adjusted annual rate. The “historical average” is the average of annual housing
completions from 1968 to 2020.
U.S. HOUSING CONSTRUCTION
House construction has lagged consistently since the GFC bubble, setting up a new housing “super-cycle”
Surplus (Shortfall) of Home Completions, Relative to Historical Average(thousands of units, rolling 10-year sum)
51
(6,000)
(5,000)
(4,000)
(3,000)
(2,000)
(1,000)
0
1,000
2,000
3,000
4,000
1980 1985 1990 1995 2000 2005 2010 2015 2020
Cumulative shortfall of
~5 million units since 2010

Blackstone |Blackstone Investment Strategy 52
DISCLAIMERS
The views expressed in this commentary are the personal views of Joseph Zidle, Managing Director and Byron Wien, Vice Chairman in the Private Wealth Solutions Group and do not
necessarily reflect the views of The Blackstone Group Inc. (together with its affiliates, "Blackstone"). This commentary discusses broad market, industry or sector trends, or other general
economic, market or political conditions and has not been provided in a fiduciary capacity under ERISA and should not be construed as research, investment advice, or any investment
recommendation.
Neither Mr. Zidle, Mr. Wien nor Blackstone undertakes to advise you of any changes in the views expressed herein. No representation or warranty is made concerning the accuracy of any data
compiled herein. The views expressed herein may change at any time subsequent to the date of issue hereof.
These materials are provided for informational purposes only, and under no circumstances may any information contained herein construed as investment advice or an offer to sell or a
solicitation of an offer to purchase (or any marketing in connection thereof) any interest in any investment vehicles managed by Blackstone.
Blackstone and others associated with it may have positions in and effect transactions in securities of companies mentioned or indirectly referenced in this commentary and may also perform
or seek to perform investment banking services for those companies. Blackstone and/or its employees have or may have a long or short position or holding in the securities, options on
securities, or other related investments of those companies. Blackstone and others associated with it may also offer strategies to third parties for compensation within those asset classes
mentioned or described in this commentary.
Investment concepts mentioned in this commentary may be unsuitable for investors depending on their specific investment objectives and financial position.
Tax considerations, margin requirements, commissions and other transaction costs may significantly affect the economic consequences of any transaction concepts referenced in this
commentary and should be reviewed carefully with one’s investment and tax advisors. All information in this commentary is believed to be reliable as of the date on which this commentary
was issued and has been obtained from public sources believed to be reliable. No representation or warranty, either express or implied, is provided in relation to the accuracy or
completeness of the information contained herein. Certain assumptions may have been made in this commentary as a basis for any indicated returns. Past performance is not necessarily
indicative of future performance. This commentary does not constitute an offer to sell any security or the solicitation of an offer to purchase any security.
This communication is issued in the United Kingdom by The Blackstone Group International Partners LLP ("BGIP"), which is authorized and regulated by the Financial Conduct Authority (firm
reference number 520839) in the United Kingdom, and is directed only at persons: (a) who are "Professional Clients" as defined in the Glossary to the UK Financial Conduct Authority
Handbook; or (b) to whom it may otherwise lawfully be communicated. It is intended only for the person to whom it has been sent, is strictly confidential and must not be distributed onward.
So far as relevant, the only clients of BGIP are its affiliates. No investor or prospective investor is a client of BGIP and BGIP is not responsible for providing them with the protections afforded
to clients. Investors and prospective investors should take their own independent investment, tax and legal advice as they think fit. No person representing BGIP is entitled to lead investors to
believe otherwise.
In Switzerland, this material is for the exclusive use of qualified investors as defined in article 10(3) Swiss Collective Investment Schemes Act ("CISA").
If communicated in Belgium, Denmark, Finland, the Republic of Ireland, Lichtenstein or Norway, to per se Professional Clients or Eligible Counterparties for the purposes of the European
Union Markets in Financial Instruments Directive (Directive 2014/65/EU), this communication is made by BGIP of 40 Berkeley Square, London, W1J 5AL (registration number OC352581), which
is authorised and regulated by the Financial Conduct Authority (firm reference number 520839) in the United Kingdom and which maintains appropriate licences in other relevant jurisdictions.
If communicated in any other state of the European Economic Area or to elective Professional Clients for the purposes of the European Union Markets in Financial Instruments Directive
(Directive 2014/65/EU), this communication is made by Blackstone Europe Fund Management S.à r.l. ("BEFM") of 2-4 Rue Eugène Ruppert, L-2453, Luxembourg (registration number B212124),
which is authorized by the Luxembourg Commission de Surveillance du Secteur Financier (reference number A00001974).
This commentary is disseminated in Japan by The Blackstone Group Japan Co., Ltd. and in Hong Kong by The Blackstone Group (HK) Limited.
This commentary is disseminated in Australia by The Blackstone Group (Australia) Pty Limited ACN 149 142 058 / Blackstone Real Estate Australia Pty Limited ACN 604 167 651. To the extent
that this document contains financial product advice, that advice is provided by, or on behalf of, The Blackstone Group (Australia) Pty Limited ACN 149 142 058 / Blackstone Real Estate
Australia Pty Limited ACN 604 167 651. The Blackstone Group (Australia) Pty Limited / Blackstone Real Estate Australia Pty Limited holds an Australian financial services license authorizing it
to provide financial services in Australia (AFSL 408376)/(AFSL 485716).
This commentary is disseminated in Singapore by Blackstone Singapore Pte. Ltd. ("Blackstone Singapore"), a capital markets services license holder for fund management and dealing in securities
and an exempt financial adviser (in relation to the marketing of collective investment schemes and advising others, directly or through publications or writings, and whether in electronic, print or
other form, concerning securities and collective investment schemes) regulated by the Monetary Authority of Singapore.