psugeo.org UNEP Atlas/Africa... · 251 Number of reported malaria 5 087 865cases in Mozambique in...
124
251 Number of reported malaria cases in Mozambique in 2003 5 087 865 Levels of access to potable water and adequate sanitation facilities in Mozambique are among the lowest in Africa, although the situation has improved somewhat. The problem is most widespread among rural residents, which account for nearly three- quarters of the total population. Access is also lacking in urban slums, which account for 94 per cent of all city dwellers (UN 2007). Natural disasters such as droughts, floods, and cyclones frequently strike Mozambique, exacerbating water and sanitation problems, destroying crops, and threatening food security and human health. In 2000, the worst floods in over 50 years destroyed 140 000 hectares of crops and affected millions of people (UN 2000). Water Access and Natural Disasters Mozambique has immense agricultural potential, with 36 million hectares of arable land, equivalent to almost half of the total country area. Fewer than five million hectares are currently being utilized, however, predominantly by poor, smallholder farmers using minimal chemical inputs, irrigation, and machinery (FAO 2005). As a result, land degradation is not as severe in Mozambique as in other African countries, although continued population growth could alter this trend. Land Use Civil war during the 1970s and 1980s disrupted conservation efforts in Mozambique, taking a heavy toll on the nation’s wildlife. Although still among the poorest countries in the world, Mozambique is now expanding its protected areas. It shares a section of the Great Limpopo Tranfrontier Park—Africa’s largest wildlife refuge that spans 35 000 km 2 —with South Africa and Zimbabwe. Wildfires remain a significant threat to Mozambique’s forests and wildlife. Every year, approximately 40 per cent of the country is burned by fire, of which 80 per cent is forest. Human activities, and particularly slash-and-burn agriculture, are suspected to be responsible for 90 per cent of all fires (Saket 2001). Protecting Wildlife and Forests Jeff Slatter/Flickr.com Christopher van Belle/Flickr.com Fact: rbm.who.int (2005) Millions of People Affected People Affected by Floods Year of Flood 0 1 2 3 4 5 1971 1975 1981 1985 2000 2001 2003 2007 Kilograms Per Hectare Fertilizer Use Intensity 0 5 10 15 20 1962 1972 1982 1992 2002 Mozambique Sub-Saharan Africa Number Threatened Threatened Species 0 10 20 30 40 50 Reptiles Amphibians Mammals Birds Fishes Plants Source: EM-DAT Disaster Database Source: FAOSTAT Source: IUCN Red List
Transcript of psugeo.org UNEP Atlas/Africa... · 251 Number of reported malaria 5 087 865cases in Mozambique in...

251�
Number of reported malaria
cases in Mozambique in 2003
5 087 865
Levels of access to potable water and adequate sanitation facilities in Mozambique are among the lowest in Africa, although the situation has improved somewhat. The problem is most widespread among rural residents, which account for nearly three-quarters of the total population. Access is also lacking in urban slums, which account for 94 per cent of all city dwellers (UN 2007).
Natural disasters such as droughts, fl oods, and cyclones frequently strike Mozambique, exacerbating water and sanitation problems, destroying crops, and threatening food security and human health. In 2000, the worst fl oods in over 50 years destroyed
140 000 hectares of crops and affected millions of people (UN 2000).
Water Access and Natural Disasters
Mozambique has immense agricultural potential, with 36 million hectares of arable land, equivalent to almost half of the total country area. Fewer than fi ve million hectares are currently being utilized, however, predominantly by poor, smallholder farmers using minimal chemical inputs, irrigation, and machinery (FAO 2005). As a result, land degradation is not as severe in Mozambique as in other African countries, although continued population growth could alter this trend.
Land Use
Civil war during the 1970s and 1980s disrupted conservation efforts in Mozambique, taking a heavy toll on the nation’s wildlife. Although still among the poorest countries in the world, Mozambique is now expanding its protected areas. It shares a section of the Great Limpopo Tranfrontier Park—Africa’s largest wildlife refuge that spans 35 000 km2—with South Africa and Zimbabwe.
Wildfi res remain a signifi cant threat to Mozambique’s forests and wildlife. Every year, approximately 40 per cent of the country is burned by fi re, of which 80 per cent is forest. Human activities,
and particularly slash-and-burn agriculture, are suspected to be responsible for 90 per cent of all fi res (Saket 2001).
Protecting Wildlife and Forests Je
ff S
latt
er/
Flic
kr.
com
Ch
rist
op
he
r v
an
Be
lle/F
lick
r.co
m
Fact
: rb
m.w
ho
.int
(20
05
)
Mill
ions
of P
eopl
e A
ffect
ed
People Affected by Floods
Year of Flood
0
1
2
3
4
5
1971 1975 1981 1985 2000 2001 2003 2007
Kilo
gram
s P
er H
ecta
re
Fertilizer Use Intensity
0
5
10
15
20
1962 1972 1982 1992 2002Mozambique Sub-Saharan Africa
Number Threatened
Threatened Species
0 10 20 30 40 50
Reptiles
Amphibians
Mammals
Birds
Fishes
Plants
Source: EM-DAT Disaster Database
Source: FAOSTAT
Source: IUCN Red List

252 �
Cahora Bassa Dam: Zambezi River, MozambiqueThe Zambezi River drains an area of roughly 1.5 million km2 from Angola to Mozambique. In 1974, the Cahora Bassa Dam was completed about 300 km upstream from where the Zambezi River empties into the Indian Ocean. The dam created Lake Cahora Bassa, the second largest human-made lake in southern Africa. Prior to the dam’s construction, surrounding natural ecosystems and traditional agriculture were shaped by annual fl oods.
As the dam neared completion, experts recommended that Lake Cahora Bassa be fi lled slowly, over a period of at least two years. Furthermore, they recommended that a minimum fl ow ©
Pe
rmis
sio
n P
en
din
g/F
lick
r.co
m

253�
be maintained, with extra releases to simulate natural fl ooding, and that the fi lling of the reservoir should not begin until after the 1975 fl ooding season. These recommendations were not followed.
The 1972 image shows a 250-km stretch of the Zambezi River prior to the construction of the Cahora Bassa Dam. The same stretch was fl ooded, in a single year, following the dam’s completion in 1974. In the ensuing years, fl ooding of the lower Zambezi has been notoriously mistimed. These erratic water releases have negatively impacted hundreds of thousands of downstream residents and decimated the ecosystem of the Zambezi River delta. The 2006 image shows the current extent of the reservoir. Strategies to better manage Cahora Bassa Dam are being explored in order to restore damaged ecosystems and some traditional land use.
2 image mosaic
2 image mosaic

254 �
Fire Scars: Beira, MozambiqueDuring Mozambique’s dry season—May to October—fi res leave burn scars on the landscape. Over one-third of the country is affected by fi re each year. NASA’s Earth Observatory recorded an especially large number of fi res in August 2006. The widespread nature of the fi res suggests that they may have been intentionally set. Population growth in Mozambique has drastically intensifi ed the need for agricultural land as well as for forestry and wildlife products, thus putting increased pressure on limited resources. Fires have become a primary means of clearing land for cultivation.A
lex
Qu
istb
erg
/Flic
kr.
com

255�
The 21 May 2006 satellite image was acquired at the beginning of the 2006 dry season, before many fi res had left their mark. The 9 August 2006 image shows the same area roughly 2.5 months later. Pink, dark red, and black fi re scars cover much of the landscape.
Many plants in Mozambique are adapted to periodic fi re. However, the increasing frequency of fi res affects the natural regeneration of vegetation and is believed to be reducing species diversity in Mozambique’s forests. Frequent fi res can also increase soil erosion and negatively impact hydrology.

256 �
Progress Towards Environmental SustainabilityAs defi ned by the United Nations Millennium Development Goal 7 Indicators
Land area covered by forest, percentageCarbon dioxide (CO
2) emissions,
metric tonnes per capita
Protected area to total surface
area, percentage
Proportion of total population using improved drinking
water sources and sanitation facilities, percentage
Water Sanitation
Slum population as percentage
of urban
Republic of
Namibia
At 55 million years, Namib is the world’s oldest desert.
Namibia is the most arid country
south of the Sahara Desert,
receiving an average of only
258 mm of rain per year (FAO
2007). With only 2.5 people
per square kilometre, it is also
among the least populated countries in the world (UNESA
2005). Namibia is divided into three topographical regions. A
coastal desert strip, which includes the Namib Desert, follows
the country’s entire Atlantic coast. Stretching from north to
south, an inland plateau covers more than half of the country
and is home to the majority of the population. Finally, the
Kalahari (Kgalagadi) Desert to the east and south of the
inland plateau contains a variety of localised ecosystems.
Important Environmental Issues• Land Degradation and Desertifi cation
• Aridity and Water Scarcity
• Threats to Biodiverstiy
Total Surface Area: 824 292 km2
Estimated Population in 2006: 2 052 000
Although Namibia has seen an increase of 30 per cent between 1990 and 2004 in the access of its people to improved water sources, the country’s primary environmental concerns remain water pollution and insuffi cient water resources for its growing population. Deforestation and soil erosion also threaten Namibia’s land. The percentage of protected land area remained constant between 1990 and 2005.
★ Indicates progress
Cre
dit
: © F
lag
art
.co
m
10.6
9.89.3
0
2
4
6
8
10
12
1990 20052000
0.0052
0.9305
1.2394
0
0.2
0.4
0.6
0.8
1
1.2
1.4
1.6
1.8
2
1990 20042000
14.6 14.6 14.6
0
2
4
6
8
10
12
14
16
1990 20052000
57
87
24 25
0
10
20
30
40
50
60
70
80
90
100
1990 20042004 1990
42.3
37.9
0
5
10
15
20
25
30
35
40
45
20011990
★ ★ ★
wo
rld
wild
life
.org
(2
00
1)

257�
Desertifi cation is the foremost environmental problem in Namibia—an estimated 99 per cent of lands are at high risk (FAO AGL 2003). Despite the scarcity of arable land, almost half of the population is involved in agriculture (FAO 2007b), which is characterized by low-input, continuous cultivation of naturally poor soils. Overgrazing is the largest threat since cattle, which outnumber people in Namibia, have surpassed the carrying capacity of the land. Current evidence of desertifi cation includes declining groundwater levels, soil erosion, reduced soil fertility, increased salt content in soils, and loss of woody vegetation.
Land Degradation and Desertifi cation
Water availability is the single greatest factor limiting development in Namibia. Extreme temporal variability and uneven spatial distribution of water resources constrain livelihoods, particularly for the 64 per cent of the population that live in rural areas (UNESA 2006). There are limited perennial surface water resources located primarily along the northern and southern borders, but all of these
sources suffer from signifi cant population pressure and degradation. Groundwater accounts for roughly half of all water consumption (Namibia Ministry of Environment and Tourism 2001), but only one per cent of Namibia’s meager rainfall goes towards recharging groundwater (FAO 2005), making over-extraction a growing concern.
Aridity and Water Scarcity
Namibia is home to abundant biodiversity, including unique desert-adapted ecological communities, charismatic megafauna, and productive coastal fi sheries. The Succulent Karoo of the Namib Desert is one of the few arid biodiversity hotspots in the world. It contains the richest collection of succulent fl ora on Earth and an estimated 2 439 endemic plant species (CI 2007). Threats to this region include grazing, agriculture, and mining, although low population densities have allowed for enhanced preservation.
Namibia also has one of the largest remaining populations of black rhinos, a highly endangered species threatened primarily by poaching. Roughly three-quarters of the national rhino population can be found in Etosha National Park (WWF 2006) where poaching has been virtually eliminated, making it a conservation success story in a country where illegal poaching was once rampant.
Namibia’s fi sheries are some of the most productive in the world, thanks to nutrient-rich upwelling from the Benguela Current System. Prior to independence in 1990, overfi shing by European fl eets threatened several fi sh stocks with collapse. Over the past decade, national fi sheries management has improved dramatically, and most major commercially exploited species are regulated under a Total Allowable Catch system (Nichols 2003).
Threats to Biodiversity
Length of ”Fish
River” the largest
canyon in Africa 160Fl
ick
r.co
m
Fact
: a
fric
ag
uid
e.c
om
(2
00
8)
Flic
kr.
com
km
Mill
ion
Hea
d
Cattle Stocks
0
1
2
3
4
1965 1975 1985 1995 2005
Per cent of Known Species That Are Threatened
Threatened Species
0% 5% 10% 15% 20%
Plants
Reptiles
Amphibians
Mammals
Birds
Fishes
Source: FAOSTAT
Source: IUCN Red List
258 �
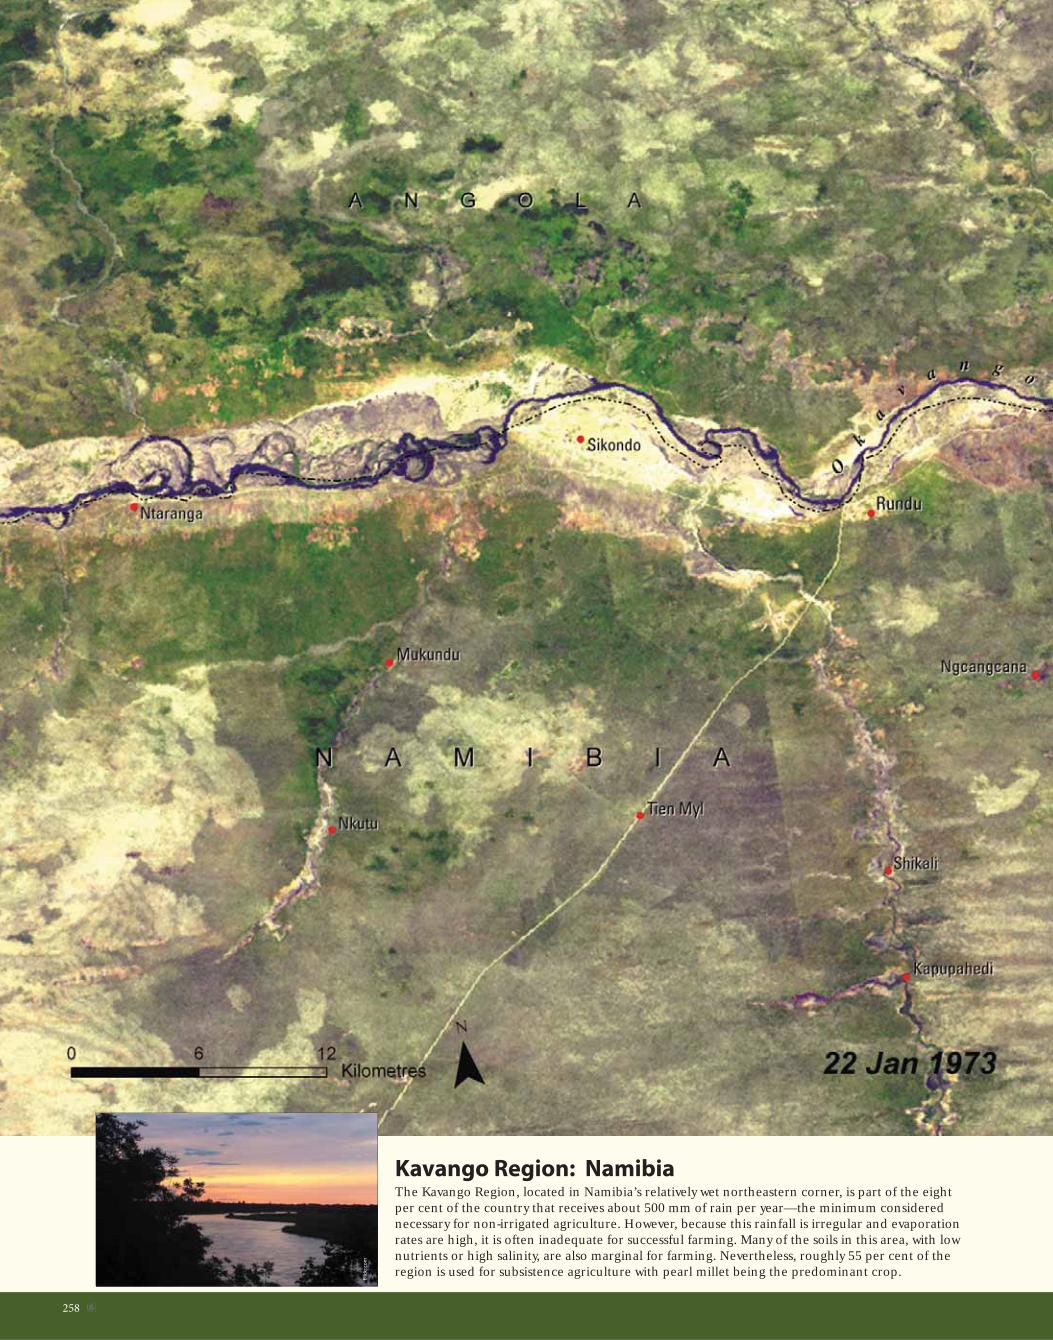
Kavango Region: NamibiaThe Kavango Region, located in Namibia’s relatively wet northeastern corner, is part of the eight per cent of the country that receives about 500 mm of rain per year—the minimum considered necessary for non-irrigated agriculture. However, because this rainfall is irregular and evaporation rates are high, it is often inadequate for successful farming. Many of the soils in this area, with low nutrients or high salinity, are also marginal for farming. Nevertheless, roughly 55 per cent of the region is used for subsistence agriculture with pearl millet being the predominant crop.
Flic
kr.
com

259�
Savannah woodlands are the natural vegetation in the sandy soils surrounding Rundu, near the Okavango River. Many of the woodlands along the river were cleared for agriculture long ago. More recently, government-dug wells have enabled settlement and farming further from the river, leading to further deforestation, particularly in the dry river beds (omurambas), where the soils are better for farming.
The Namibian government considers this area an important focus of economic activity and supports many water and agricultural projects. Along with rapid development, the population of Rundu is growing at a staggering pace—911 per cent between 1981 and 1991. These images, from 1973 and 2007, show the dramatic increase in the land area cleared for agriculture (light yellow patches) around Rundu and elsewhere along the river.

260 �
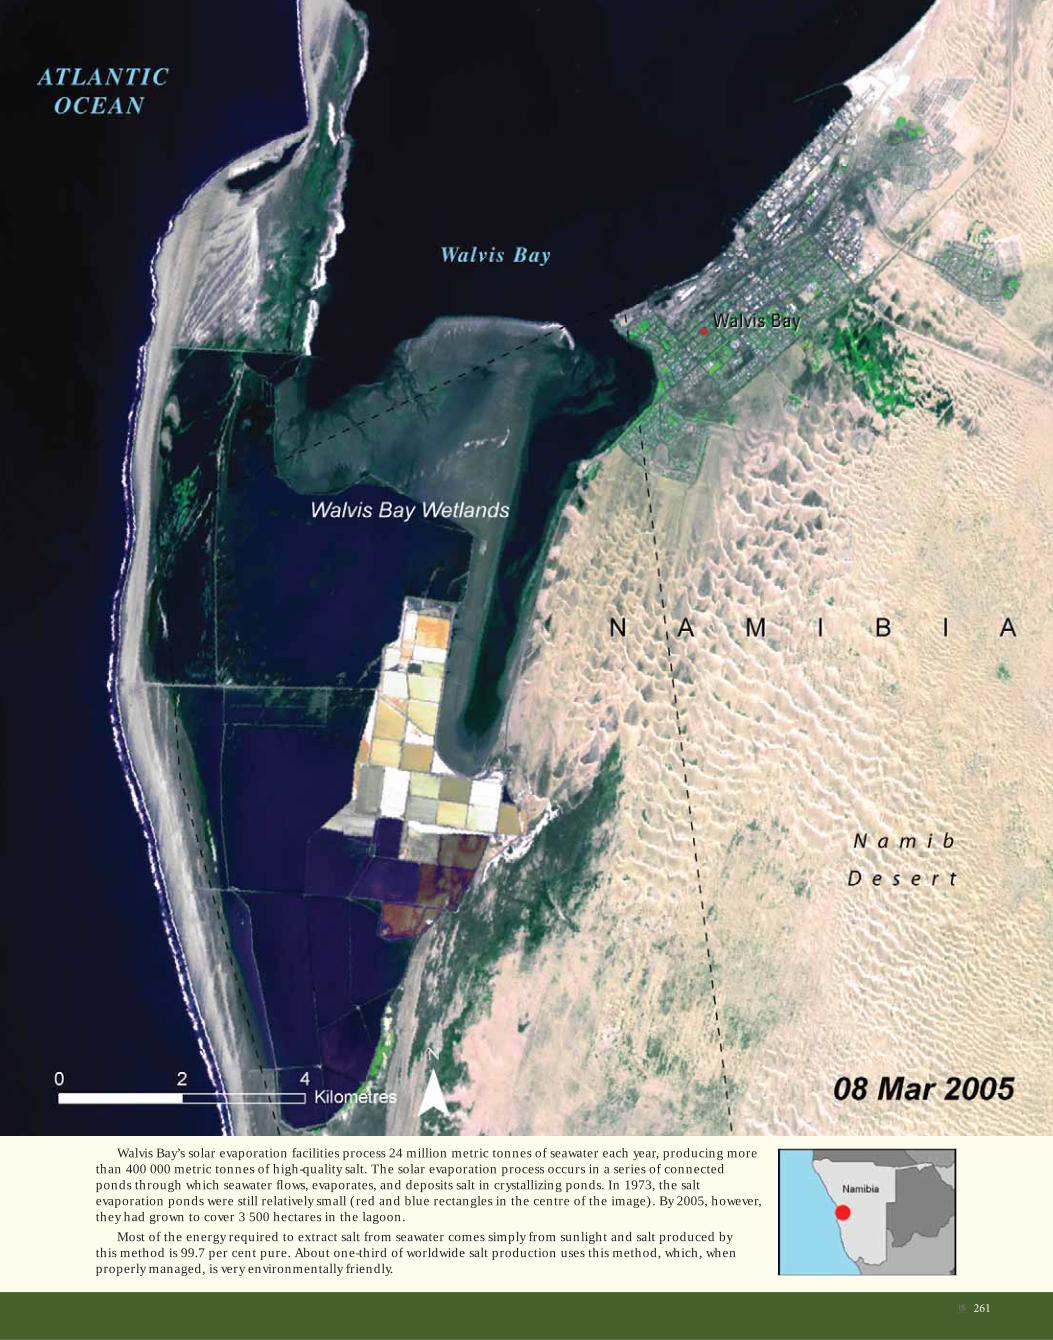
Salt Production and Wetlands: Walvis Bay, Namibia Walvis Bay is an economic and environmental hotspot in Namibia. It has been designated as a free-trade area and placed on the Ramsar List of Wetlands of International Importance. The Walvis Bay lagoon, the largest area of shallow, sheltered water on the Namibian coast, supports a wide range of birdlife. Walvis Bay’s tidal channels, mudfl ats, and sandbanks support roughly 150 000 birds, including the African black oystercatcher, lesser and greater fl amingo, chestnut banded plover, and blacknecked grebe.
Flic
kr.
com
261�
Walvis Bay’s solar evaporation facilities process 24 million metric tonnes of seawater each year, producing more than 400 000 metric tonnes of high-quality salt. The solar evaporation process occurs in a series of connected ponds through which seawater fl ows, evaporates, and deposits salt in crystallizing ponds. In 1973, the salt evaporation ponds were still relatively small (red and blue rectangles in the centre of the image). By 2005, however, they had grown to cover 3 500 hectares in the lagoon.
Most of the energy required to extract salt from seawater comes simply from sunlight and salt produced by this method is 99.7 per cent pure. About one-third of worldwide salt production uses this method, which, when properly managed, is very environmentally friendly.
262 �
Progress Towards Environmental SustainabilityAs defi ned by the United Nations Millennium Development Goal 7 Indicators
Land area covered by forest, percentageCarbon dioxide (CO
2) emissions,
metric tonnes per capita
Protected area to total surface
area, percentage
Proportion of total population using improved drinking
water sources and sanitation facilities, percentage
Water Sanitation
Slum population as percentage
of urban
Niger is one of the hottest countries in the world, with four-fi fths
of its territory lying in the Sahara desert.
Republic of the
Niger
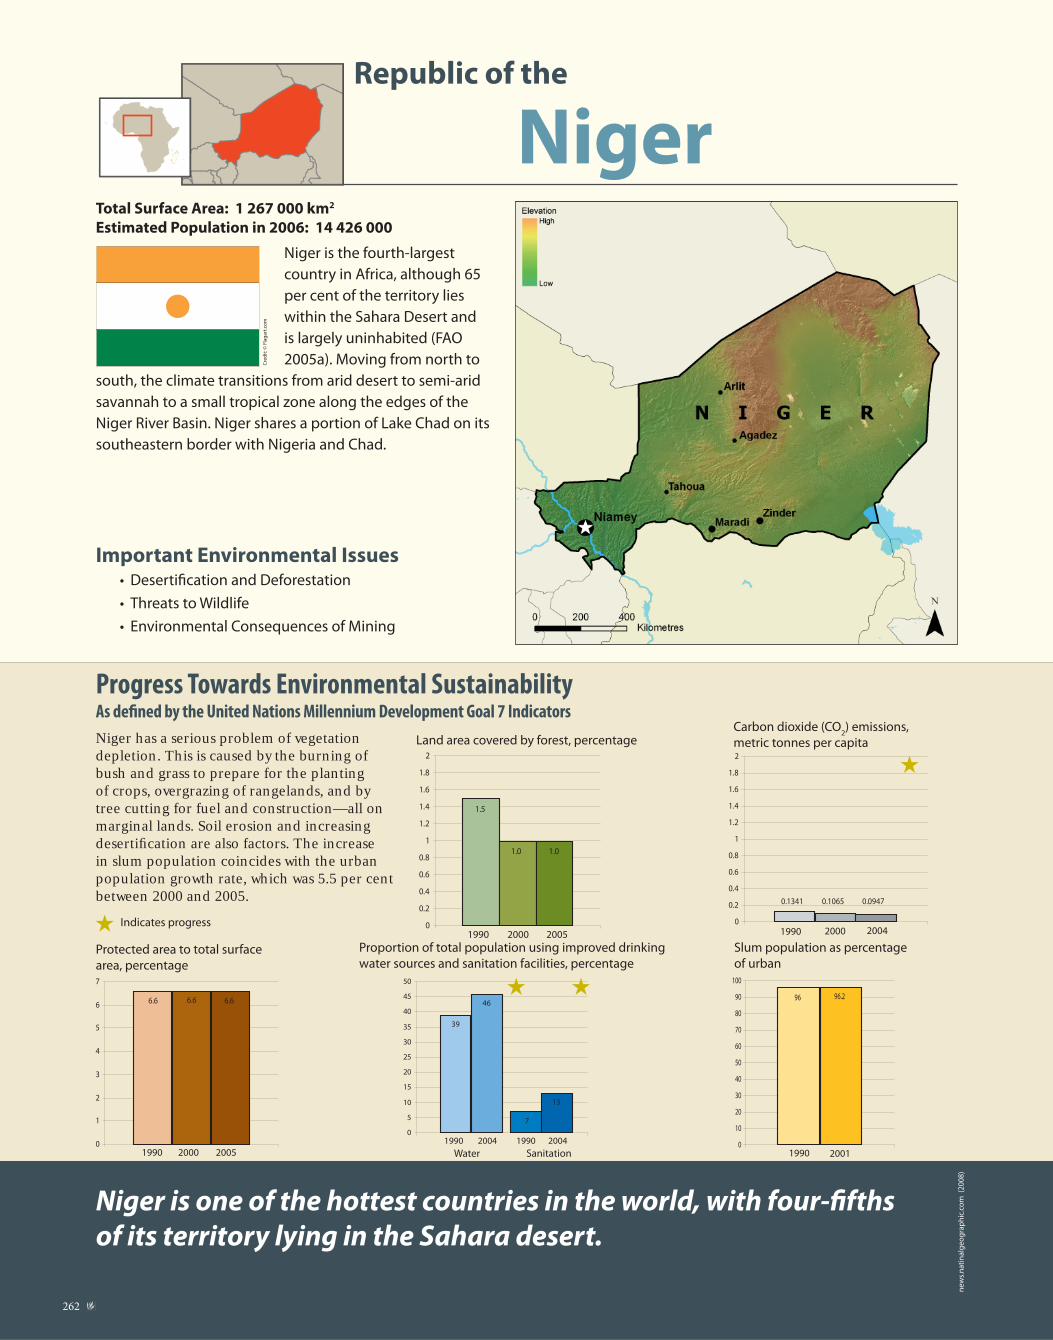
Niger is the fourth-largest
country in Africa, although 65
per cent of the territory lies
within the Sahara Desert and
is largely uninhabited (FAO
2005a). Moving from north to
south, the climate transitions from arid desert to semi-arid
savannah to a small tropical zone along the edges of the
Niger River Basin. Niger shares a portion of Lake Chad on its
southeastern border with Nigeria and Chad.
Important Environmental Issues• Desertifi cation and Deforestation
• Threats to Wildlife
• Environmental Consequences of Mining
Total Surface Area: 1 267 000 km2
Estimated Population in 2006: 14 426 000
★ Indicates progress
Niger has a serious problem of vegetation depletion. This is caused by the burning of bush and grass to prepare for the planting of crops, overgrazing of rangelands, and by tree cutting for fuel and construction—all on marginal lands. Soil erosion and increasing desertifi cation are also factors. The increase in slum population coincides with the urban population growth rate, which was 5.5 per cent between 2000 and 2005.
Cre
dit
: © F
lag
art
.co
m
1.5
1.0 1.0
0
0.2
0.4
0.6
0.8
1
1.2
1.4
1.6
1.8
2
1990 20052000
0.1341 0.1065 0.0947
0
0.2
0.4
0.6
0.8
1
1.2
1.4
1.6
1.8
2
1990 20042000
6.6 6.6 6.6
0
1
2
3
4
5
6
7
1990 20052000
39
46
7
13
0
5
10
15
20
25
30
35
40
45
50
1990 20042004 1990
96 96.2
0
10
20
30
40
50
60
70
80
90
100
20011990
★ ★
★
ne
ws.
na
tin
alg
eo
gra
ph
ic.c
om
(2
00
8)

263�
Percentage of Niger’s
labour force employed
in agriculture 90%
It is estimated that the desert in the Republic of Niger is expanding by approximately 200 000 hectares per year (Mongabay 2006), overtaking degraded agricultural land and encroaching on human settlements. Government efforts to combat desertifi cation through reforestation have been promising, but recurrent drought and poor cultivation practices continue to pressure vulnerable lands.
Niger’s forests are its most important buffer against desertifi cation, but they are threatened by a rising demand for agricultural land and fuelwood, driven by the fourth-highest population growth rate
in Africa (UNESA 2005). Niger has lost one-third of its forest cover since 1990, and now only one per cent of the land is forested (UN 2007).
Desertifi cation and Deforestation
Niger is remarkably rich in plant and animal life, especially considering that three-quarters of the country is desert. Although hunting is banned
nationwide, poaching and habitat loss are taking a heavy toll on biodiversity; wildlife populations are less than one-tenth of the size they were in the 1960s (CBD 2004). Competition with domestic animals over resources and confl ict with farmers are particularly problematic in the densely populated southern regions.
The last remaining giraffes in West Africa are found in Niger only 60 km from the country’s capital, Niamey. Thanks to conservation measures, the giraffe population has slightly recovered from a low of only 40 individuals in the 1990s; a few decades ago there were over 3 000 (UN 2001).
Threats to Wildlife
Niger is the world’s third-largest producer of uranium, generating over 3 000 metric tonnes in 2005 (Omarya 2006). The government announced intentions to increase production to 10 500 metric tonnes in 2007, eliciting concerns regarding the environmental and human health consequences of further exploration. In addition to the environmental degradation that occurs at uranium extraction sites, the cities and towns that spring up near mining activities increase human pressure on natural resources such as wildlife and timber. There are also concerns that phosphorus and iron mining in “W” National Park, which is a haven for 80 per cent of the country’s biodiversity, may threaten the ecological integrity of the area.
Environmental Consequences of Mining
Flic
kr.
com
Fa
ct:
fao
.org
(2
00
5b
)
Flic
kr.
com
Mill
ion
Hec
tare
s
Cereal Production, Area vs Yield
Kilo
gram
s P
er H
ecta
re
0
2
4
6
8
10
1965 1975 1985 1995 20050100200300400500600700
area harvested yield
Number Threatened
Threatened Species
0 2 4 6 8 10 12 14
Reptiles
Fishes
Birds
Plants
Mammals
Tonn
es
Uranium Production
2 700
2 800
2 900
3 000
3 100
3 200
3 300
3 400
2000 2001 2002 2003 2004 2005
Source: FAOSTAT
Source: IUCN Red List
Source: USGS International Mineral Statistics and Information

264 �
Forest Degradation: Baban Rafi Forest, NigerAlong the southern border of Niger in the Department of Maradi, population has increased by roughly 400 per cent over the past 40 years. The area under agriculture in the department as a whole grew by 26 per cent between 1975 and 1996. In the south of the district, this expansion of population and agriculture has meant the loss of a large portion of the Baban Rafi Forest to agriculture. The remaining woodlands are being degraded by overexploitation for fuelwood and non-wood forest products.
Gra
y Ta
pp
an
/US
GS

265�
Baban Rafi Forest is the most signifi cant area of woodland in the Maradi Department. Located at the southern extreme of the Sahel, it has areas of both savannah and Sahelian vegetation. In the savannah areas, the balance of trees, grasses, and shrubs varies. The wooded areas are dominated by just four species of trees—Guiera senegalensis, Combretum micranthum, Combretum nigricans, and Acacia macrostachya—likely as a result of selective exploitation and some combination of drought and disease.
These satellite images show the loss of a signifi cant fraction of the natural landscape (darker green areas) of Baban Rafi Forest to agriculture between 1976 and 2007. The intensity of demand for agricultural land has also led to near continuous use of farmland in the area, with shortened or no fallow period for it to recover fertility. Continuing population growth will put further demands on this already dramatically changed landscape.
This May 2007 Quickbird image shows the edge of the Baban Rafi Forest. This open savannah is a grazing area that is being lost as the rapidly growing population converts land to agriculture. Trees scattered throughout the farm fi elds help maintain farmland productivity. More dense concentrations of grass and trees can be seen in some of the moister low areas [depressions].
©D
igit
alG
lob
e
See Inset
Inset

266 �
Revitalised Land: Tahoua Province, Niger A band across the southern third of Niger receives enough rain (250-750 mm) to sustain most of the country’s rain-fed agriculture and pastoralism. This stretch of semi-arid Sahel is also where most of Niger’s rapidly growing population lives. However, the Sahelian climate is quite variable and in this ecologically frail region this poses serious problems for traditional livelihoods.
In recent decades, Niger’s climate and its demographic problems have negatively impacted its agricultural land by forcing agriculture onto land that had been historically used for livestock—
Flic
kr.
com

267�
land receiving less than 350 mm of rain per year. This intense pressure on fragile lands led to acute environmental degradation (1975 image).
More recently, a combination of various projects and farmer initiatives has led to signifi cant revitalization of the land in large part by the planting and protection of trees. Farmers no longer clear tree saplings from their fi elds before planting crops. Instead they protect and nurture the trees, carefully plowing around them when sowing millet, sorghum, peanuts, and beans. A recent study revealed 10 to 20 times the number of trees across three of Niger’s southern provinces than there were in the 1970s (2005 image). This transformation of the land has reduced drought vulnerability and will help people diversify their livelihoods so as not to rely solely on rain-fed crops.

268 �
Progress Towards Environmental SustainabilityAs defi ned by the United Nations Millennium Development Goal 7 Indicators
Land area covered by forest, percentageCarbon dioxide (CO
2) emissions,
metric tonnes per capita
Protected area to total surface
area, percentage
Proportion of total population using improved drinking
water sources and sanitation facilities, percentage
Water Sanitation
Slum population as percentage
of urban
Federal Republic of
Nigeria
Nigeria is the largest producer of oil in Africa and the eleventh
largest producer of crude oil in the world.
Nigeria is the most
populous country in
Africa with over 134
million inhabitants,
or approximately
one-seventh of the
continent’s total population (UNESA 2005). The climate
is generally tropical and natural resources are plentiful,
including dense coastal mangroves, abundant ground and
surface water resources, a high proportion of arable land,
and vast oil reserves. The Niger River Delta region covers
75 000 km2 of the Nigerian coast, making it the third-largest
wetland in the world (UNDP 2006).
Important Environmental Issues• Desertifi cation
• Deforestation and Threats to Biodiversity
• Oil Pollution
Total Surface Area: 923 768 km2
Estimated Population in 2006: 134 375 000
Cre
dit
: © F
lag
art
.co
m
In the early 1990s, Nigeria was among the world’s top 50 emitters of carbon dioxide, and this upward trend continued through 2004. Nigeria has the highest deforestation rate of natural forest on the planet, including old-growth forests, which are its most biodiverse ecosystems. Between 1990 and 2005, the country lost 79 per cent of its old-growth forests.
★ Indicates progress
18.9
14.4
12.2
0
2
4
6
8
10
12
14
16
18
20
1990 20052000
0.4803
0.7185
0.8263
0
0.1
0.2
0.3
0.4
0.5
0.6
0.7
0.8
0.9
1990 20042000
3.7
6.1 6.1
0
1
2
3
4
5
6
7
1990 20052000
49 48
39
44
0
10
20
30
40
50
60
1990 20042004 1990
8079.2
50
55
60
65
70
75
80
85
20011990
★ ★★
eia
.do
e.o
rg (
20
07
)
269�
Arable land as a
proportion of the
total land area 33%
Desertifi cation affects Nigeria’s semi-arid northeast region, where extensive agriculture, river damming, and periodic droughts have resulted in signifi cant land degradation. The Sahara Desert is thought to be expanding southward by one kilometre every year (FAO 2001), accounting for nearly three-quarters of the total cost of all environmental degradation in the country, which is estimated at US$ 5 110 million per year (UNESCO 2000).
Desertifi cation is just one of the threats facing Nigeria’s 7 856 plant species and 22 000 vertebrate and invertebrate species (CBD 2007). Other forms of land use change and ecosystem degradation
resulting from agriculture, urbanisation, and direct exploitation of biological resources threaten at least 250 species with extinction (IUCN 2007).
Desertifi cation
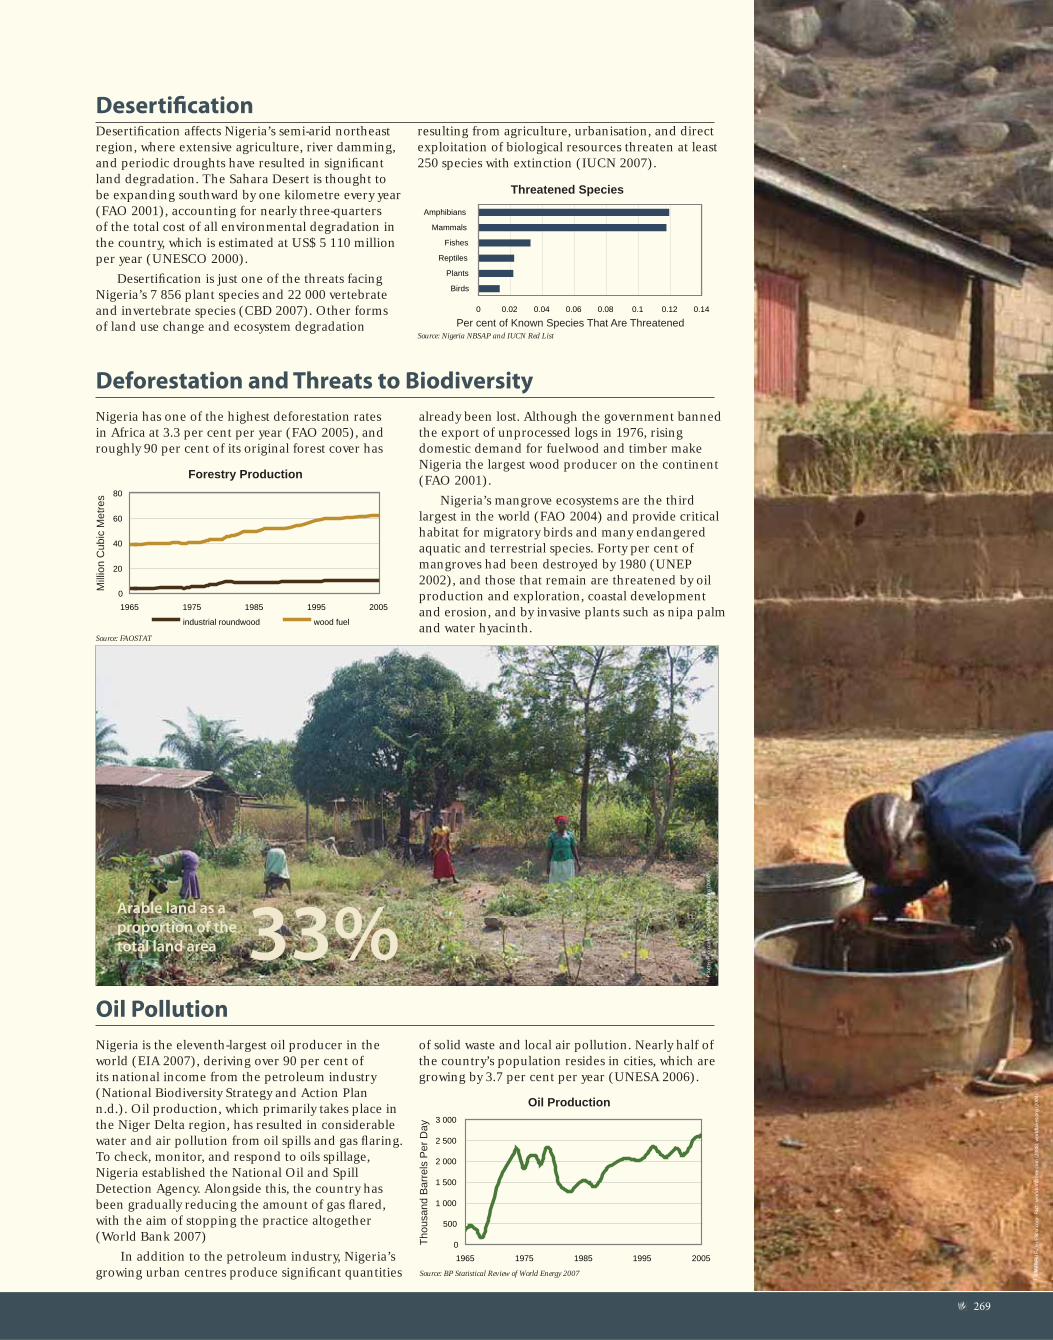
Nigeria has one of the highest deforestation rates in Africa at 3.3 per cent per year (FAO 2005), and roughly 90 per cent of its original forest cover has
already been lost. Although the government banned the export of unprocessed logs in 1976, rising domestic demand for fuelwood and timber make Nigeria the largest wood producer on the continent (FAO 2001).
Nigeria’s mangrove ecosystems are the third largest in the world (FAO 2004) and provide critical habitat for migratory birds and many endangered aquatic and terrestrial species. Forty per cent of mangroves had been destroyed by 1980 (UNEP 2002), and those that remain are threatened by oil production and exploration, coastal development and erosion, and by invasive plants such as nipa palm and water hyacinth.
Deforestation and Threats to Biodiversity
Nigeria is the eleventh-largest oil producer in the world (EIA 2007), deriving over 90 per cent of its national income from the petroleum industry (National Biodiversity Strategy and Action Plan n.d.). Oil production, which primarily takes place in the Niger Delta region, has resulted in considerable water and air pollution from oil spills and gas fl aring. To check, monitor, and respond to oils spillage, Nigeria established the National Oil and Spill Detection Agency. Alongside this, the country has been gradually reducing the amount of gas fl ared, with the aim of stopping the practice altogether (World Bank 2007)
In addition to the petroleum industry, Nigeria’s growing urban centres produce signifi cant quantities
of solid waste and local air pollution. Nearly half of the country’s population resides in cities, which are growing by 3.7 per cent per year (UNESA 2006).
Oil Pollution
P.Jo
tte
r/Fl
ick
r.co
m
Fact
: fa
ost
at.
fao
.org
(2
00
8)
Flic
kr.
com
Per cent of Known Species That Are Threatened
Threatened Species
0 0.02 0.04 0.06 0.08 0.1 0.12 0.14
Birds
Plants
Reptiles
Fishes
Mammals
Amphibians
Mill
ion
Cub
ic M
etre
s
Forestry Production
0
20
40
60
80
1965 1975 1985 1995 2005
industrial roundwood wood fuel
Thou
sand
Bar
rels
Per
Day
Oil Production
0
500
1 000
1 500
2 000
2 500
3 000
1965 1975 1985 1995 2005
©M
ich
ea
l Fu
ller/
Flic
kr.
com
Fa
ct:
wo
rld
info
zon
e.c
om
(2
00
8);
wo
rld
lake
s.o
rg (
20
04
)
Source: Nigeria NBSAP and IUCN Red List
Source: FAOSTAT
Source: BP Statistical Review of World Energy 2007

270 �
Impacts of Challawa Dam: NigeriaThe Challawa Dam in Kano State, Nigeria, was built to control fl ooding caused by seasonal and variable rainfall and to support irrigation. It also supplies water to Kano, Nigeria’s third-largest city with a population of seven million. The Challawa River feeds into the Hadejia River, which then fl ows into the Hadejia-Nguru wetlands. Local rainfall peaks in August, with a subsequent dry season lasting from November to April. This rainfall pattern makes water levels in the Hadejia-Nguru wetlands highly seasonal.
Sa
ni D
awa
ki U
sma
n,/
Fed
era
l Min
istr
y o
f E
nv
iro
nm
en
t , H
ou
sin
g
& U
rba
n D
eve
lop
me
nt

271�
The Challawa Dam has tamed highly seasonal downstream fl ooding at the expense of the Hadejia-Nguru wetlands. The combined effect of drought and the dam reduced the extent of seasonally fl ooded land from 300 000 hectares in the 1960s to between 70 000 and 100 000 hectares in recent years. Such severe reduction of the annual fl ooding extent has put the wetlands at risk and reduced the economic and environmental benefi ts they provide, including agriculture, cattle, fuelwood, fi sh, shallow aquifer recharge, and habitat for migratory and local bird species.
The economic impact of the Challawa Dam (and the Tiga Dam further upstream) has also been negative, eventually incurring millions of dollars more in losses than were yielded in benefi ts. In addition, while fl ood control was among the intended benefi ts of the dam, heavy rains often cause serious fl ooding above the dam.

272 �
Oil Development: Niger River Delta, NigeriaThe Niger River Delta spans the coast of Nigeria from the Benin River in the west to the Imo River in the east. The delta supports the world’s third-largest mangrove forest, and is home to over 150 species of fi sh, West African manatees, hippopotamuses, spot-necked swamp otters, and rare pygmy hippos.
Since the discovery of oil in the delta in the 1950s, the promise of improved lives through a share of the oil wealth has eluded area residents. Instead, they have found their traditional livelihoods increasingly undermined by environmental degradation. Fl
ick
r.co
m

273�
The 1984 image shows the delta 20 years after oil operations began in the early 1960s. The 2003 image shows concentrations of oil wells (small yellow arrows) as well as pipelines connecting them. Also visible are a large storage facility, liquifi ed natural gas plant and terminal station on Bonny Island in the lower right corner of the image (large yellow arrow).
Currently, about 66 gas fi elds and over 500 oil wells are located in the delta area. Between 1976 and 1996 there were more than 4 640 oil spills totalling three million barrels of oil. In addition, between 70 and 90 per cent of the natural gas from these oil fi elds is fl ared (burned as waste), releasing massive amounts of carbon dioxide into the atmosphere, causing local air pollution and acid rain, and wasting roughly US$300 million per day worth of energy.
Sa
ni D
awa
ki U
sma
n,/
Fed
era
l Min
istr
y o
f E
nv
iro
nm
en
t , H
ou
sin
g
& U
rba
n D
eve
lop
me
nt

274 �
Progress Towards Environmental SustainabilityAs defi ned by the United Nations Millennium Development Goal 7 Indicators
Land area covered by forest, percentageCarbon dioxide (CO
2) emissions,
metric tonnes per capita
Protected area to total surface
area, percentage
Proportion of total population using improved drinking
water sources and sanitation facilities, percentage
Water Sanitation
Slum population as percentage
of urban
Republic of
Rwanda
Nyungwe National Park is the largest block of montane forest in
East and Central Africa, and among the largest on the continent.
Rwanda is a small,
mountainous country
located only a few
degrees south of the
equator, but its high
elevation provides
for a tropical temperate climate with two rainy and two
dry seasons. Terrain is dominated by the hills and valleys
of the central plateau, which are bordered to the east by
marshy lowlands, to the north by a chain of volcanoes, and
to the west by a mountain system that forms the boundary
between the watersheds of the Nile and Congo River
Basins. Surface water is relatively abundant in Rwanda,
covering over eight per cent of the country (FAO 2005).
Important Environmental Issues• Population Pressure on Land
• Soil Erosion and Sedimentation
• Deforestation and Threats to Biodiversity
Total Surface Area: 26 338 km2
Estimated Population in 2006: 9 230 000
Cre
dit
: © F
lag
art
.co
m
★ Indicates progress
The slum population in Rwanda has seen an increase between 1990 and 2001, alongside an urban population growth rate of 4.2 per cent from 2000 to 2005. Rwanda is the most densely populated country in mainland Africa. Rwanda’s protected area increased by 3.7 per cent between 1990 and 2005. Volcano National Park is one of the last existing habitats of the mountain gorilla.
12.913.9
19.5
0
5
10
15
20
25
1990 20052000
0.0724 0.0700 0.0632
0
0.2
0.4
0.6
0.8
1
1990 20042000
3.9 3.9
7.6
0
1
2
3
4
5
6
7
8
1990 20052000
59
74
3742
0
10
20
30
40
50
60
70
80
1990 20042004 1990
82.287.9
0
10
20
30
40
50
60
70
80
90
100
20041990
★ ★
★★★
rwa
nd
a-n
yun
gw
e-f
ore
st.c
om
(2
00
7)

275�
Rwanda is the most densely populated country in mainland Africa. Rwanda’s current population density is 382 people per square kilometre (Earth Trends 2006, FAO 2005a). Approximately 80 per cent of the population is rural and engaged in agriculture, placing signifi cant pressure on land resources and biodiversity. Modifi cation and destruction of natural ecosystems for agriculture, and particularly the drainage and reclamation of wetlands, has resulted in the loss of many plant and animal species. An estimated 115 different plant species are threatened with extinction (CBD 2003).
As a result of a declining availability of arable land, the urban population is increasing by nearly
12 per cent per year, the highest urbanisation rate in Africa (UNESA 2006). Nearly nine out of ten urban residents in Rwanda are slum dwellers, where access to improved sanitation facilities barely exceeds 50 per cent (UN 2007).
Population Pressure on Land
In 2007, Rwanda had the
highest population density
in mainland Africa at
394Rwanda’s rich volcanic soils are historically fertile, but population pressure has resulted in over-cultivation and expansion onto marginal lands and steep slopes. As of 2003, arable land accounted for over half of the country’s surface area and approximately 98 per cent of all potentially cultivatable land in the country (FAO 2005b). An estimated 71 per cent of land is considered to be severely degraded (FAO AGL 2003) and approximately 500 metric tonnes of soil are lost to erosion each year, an amount that could support crops to feed 40 000 people (USAID 2004). Excessive siltation resulting from erosion constitutes a major threat to many of Rwanda’s lakes and wetlands.
Soil Erosion and Sedimentation
Forests were once extensive throughout Rwanda, but they are now concentrated primarily in the western mountains. The swampy gallery forests that historically characterized the eastern lowlands now exist only in small stands. Despite recording a net increase in overall forest cover since 1990 (UN 2007), natural forests remain threatened by human encroachment and high dependence on fuelwood and charcoal.
Nyungwe National Park is the largest tropical montane forest in Africa, covering over 1 000 km2
of rain forest, bamboo, grassland, swamps, and bogs. It harbours 13 different primate species, 62 Albertine Rift endemic species, and one of the
largest surviving populations of chimpanzees (WCS 2007). Buffalo and elephants have been extirpated due to human encroachment and illegal poaching, and fi res started by honey collectors have damaged large tracts of forest.
Deforestation and Threats to Biodiversity Fl
ick
r.co
m
Joh
n &
me
lan
ie K
ots
op
ou
los/
Flic
kr.
com
Fa
ct:
ge
od
ata
.gri
d.u
ne
p.c
h (
20
06
)
Mill
ions
of P
eopl
e
Population Growth and Urbanisation
0
5
10
15
1950 1970 1990 2010 2030rural urban
Per
cen
t of C
ount
ry
Actual Versus Potential Cultivatable Land
0%
20%
40%
60%
80%
1963 1973 1983 1993 2003potential actual
Mill
ion
Cub
ic M
etre
s
Fuelwood Production
0
2
4
6
8
1965 1975 1985 1995 2005
people per km2
Source: UN Population Division, World Urbanization Prospects 2005 Revision
Source: FAOSTAT and AQUASTAT
Source: FAOSTAT

276 �
Fire Scars: Akagera National Park, RwandaAkagera National Park in northeastern Rwanda is considered to be among the most complex savannah ecosystems in eastern Africa. Across its landscape are areas of tangled acacia trees interspersed with patches of open grassland, patches of gallery forest in the north, and wetlands and lakes along the course of the Akagera River.
Fire is common in the savannah portions of the park. Fire tends to maintain the savannah’s vegetation structure, composition, nutrient cycling, and distribution. Satellite images from July
FJe
an
Ma
rie
Via
nn
ey
Min
an
i, R
wa
nd
a E
nv
iro
nm
en
t M
an
ag
em
en
t A
uth
ori
ty

277�
1980, June 1984, and July 2004 show the area surrounding Akagera National Park with large fi re scars (dark purple patches). In 1980, fi res left a scar 35 km wide and well over 100 km long. In 2004, fi res burned nearly one-third of the park; they are believed to have been set by poachers. In contrast to these dry season images, the December 1999 image shows the region during the rainy season, when fi res occur infrequently.
The size of Akagera National Park was reduced by approximately two-thirds in 1997 to allow for the resettlement of large numbers of refugees. Heavy grazing pressure, agricultural encroachment, charcoal production, the felling of trees for fuelwood and construction, and deliberately set fi res have seriously fragmented the ecosystem. Wildlife populations are now concentrated in scattered enclaves.

278 �
Dramatic Deforestation: Gishwati Forest, RwandaGishwati Forest Reserve in northwestern Rwanda is one of the most severely deforested areas in the country. Exploitation of the forests for commercial products such as charcoal, timber, medicine, and food has been the main driver of this deforestation. The 1978 satellite image shows the Gishwati Forest Reserve as a dark-green carpet of dense forest nearly covering the entire protected area. The 2006 image shows that most of the forest has been cleared; the
FJe
an
Ma
rie
Via
nn
ey
Min
an
i, R
wa
nd
a E
nv
iro
nm
en
t M
an
ag
em
en
t A
uth
ori
ty

279�
dark-green areas have been replaced by patches of pink and light green where the vegetation has been largely removed. Only a fraction of the forest that was intact in 1978 remains; what is left is in degraded condition.
On a positive note, reforestation efforts in parts of the region, using agroforestry techniques such as radical terracing, progressive terracing, and live mulches, are currently being researched and implemented. Seedlings of species such as Calliandra calothyrsus and Leucaena diversifolia are being planted in several provinces of the country with collaboration from stakeholders and the local community. If such efforts continue and are successful, the Gishwati Forest Reserve may experience considerable regeneration within the next fi ve to ten years.
FJe
an
Ma
rie
Via
nn
ey
Min
an
i, R
wa
nd
a E
nv
iro
nm
en
t M
an
ag
em
en
t A
uth
ori
ty
2 image mosaic

280 �
The geographic isolation of São Tomé and
Príncipe has resulted in high levels of endemism,
notably among plants.
Democratic Republic of
São Tomé & Príncipe
The two major
islands of São
Tomé and Príncipe,
together with a
number of smaller
islands and islets, form one of the smallest
nations in Africa in terms of both population
and total surface area. The islands are of volcanic
origin and quite mountainous, and their irregular
relief contributes to dramatic variations in rainfall,
temperature, and vegetation. These islands are
among the most densely populated countries
in Africa with almost 171 inhabitants per square
kilometre (Earth Trends 2006 and FAO 2007).
Important Environmental Issues• Degradation of Forest Ecosystems
• Threats to Biodiversity
Total Surface Area: 964 km2
Estimated Population in 2006: 160 000
Cre
dit
: © F
lag
art
.co
m
★ Indicates progress
São Tomé and Príncipe have three forest types: low altitude moist closed forest, moist submontane evergreen forest, and closed cloud forest. While total forest cover has held steady over the past several decades, much of the island’s primary forests have been cut and many tree species remain threatened. This is particularly true of the low altitude forests, which were almost completely cleared to make way for expanding cocoa farming, the nation’s most important cash crop (FAO 2000). As a consequence of deforestation, erosion has substantially reduced the islands’ soil fertility.
Degradation of Forest Ecosystems
Water and land pollution are the most signifi cant problems in São Tomé and Príncipe. Soil erosion and soil exhaustion are other major environmental challenges.
★ Indicates progress
Protected Area to Total Surface
Area in per cent
Land Area Covered by Forest, percentage
Carbon Dioxide (CO2) Emissions,
Metric Tonnes per Capita (CDIAC)
Access to Improved Water Source and
Sanitation (per cent of total population)
Water Sanitation
Slum Population as per cent of
Urban Population
São Tomé and Príncipe’s biodiversity is characterised by exceptionally high rates of endemism, meaning that many of the islands’ species are found nowhere else in the world. Several of these native species display unusual evolutionary features such as gigantism (for example, the São Tomé giant sunbird) and dwarfi sm (for example, the dwarf olive ibis). The threats to biodiversity are numerous, including coastal erosion, pollution, deforestation, hunting, and the introduction of exotic species. As a result, 93 plant and animal species are threatened with extinction (IUCN 2007).
Threats to Biodiversity
28.4 28.4 28.4
0
5
10
15
20
25
30
1990 20052000
0.56830.6279 0.6106
0
0.2
0.4
0.6
0.8
1
1990 20042000
0
0.2
0.4
0.6
0.8
1
N/A N/A N/A
1990 20052000
79
25
0
10
20
30
40
50
60
70
80
90
N/A N/A
1990 20042004 1990
0
0.2
0.4
0.6
0.8
1
N/A N/A
20011990
Progress Towards Environmental SustainabilityAs defi ned by the United Nations Millennium
Development Goals 7 Indicators
No
Data
Available
No
Data
Available
Per
cen
t of C
ount
ry A
rea
Cultivated Land
0%
10%
20%
30%
40%
50%
60%
1967 1973 1979 1985 1991 1997 2003
Per cent of Known Species That Are Endemic
Species Endemism
0% 20% 40% 60% 80% 100%
Vascular Plants
Mammals
Birds
Reptiles
Amphibians
na
tio
nse
ncy
clo
pe
dia
.co
m (
20
07
);
rain
fore
sts.
mo
ng
ab
ay.c
om
(2
00
7
Source: National Report on the Status of Biodiversity
280 �

281�
Urban Expansion: São Tomé Island, São Tome and PríncipeSão Tomé is the capital city of the island that shares its name. Located in the island’s Agua Grande district, the population of São Tomé increased from a mere 8 431 in 1940 to 51 886 in 2001.
The satellite image shows how settlements, especially along roads, have expanded inland from the city. While much of the island still retained its natural vegetation in 2007, vegetation loss is obvious near the capital city and surrounding settlements, where forests have been converted to croplands. Substantial oil reserves have recently been discovered off the island of São Tomé, which will most likely fuel increased development.
282 �
Progress Towards Environmental SustainabilityAs defi ned by the United Nations Millennium Development Goal 7 Indicators
Land area covered by forest, percentageCarbon dioxide (CO
2) emissions,
metric tonnes per capita
Protected area to total surface
area, percentage
Proportion of total population using improved drinking
water sources and sanitation facilities, percentage
Water Sanitation
Slum population as percentage
of urban
Republic of
Senegal
Senegal is one of the world’s most famous migratory
bird sanctuaries.
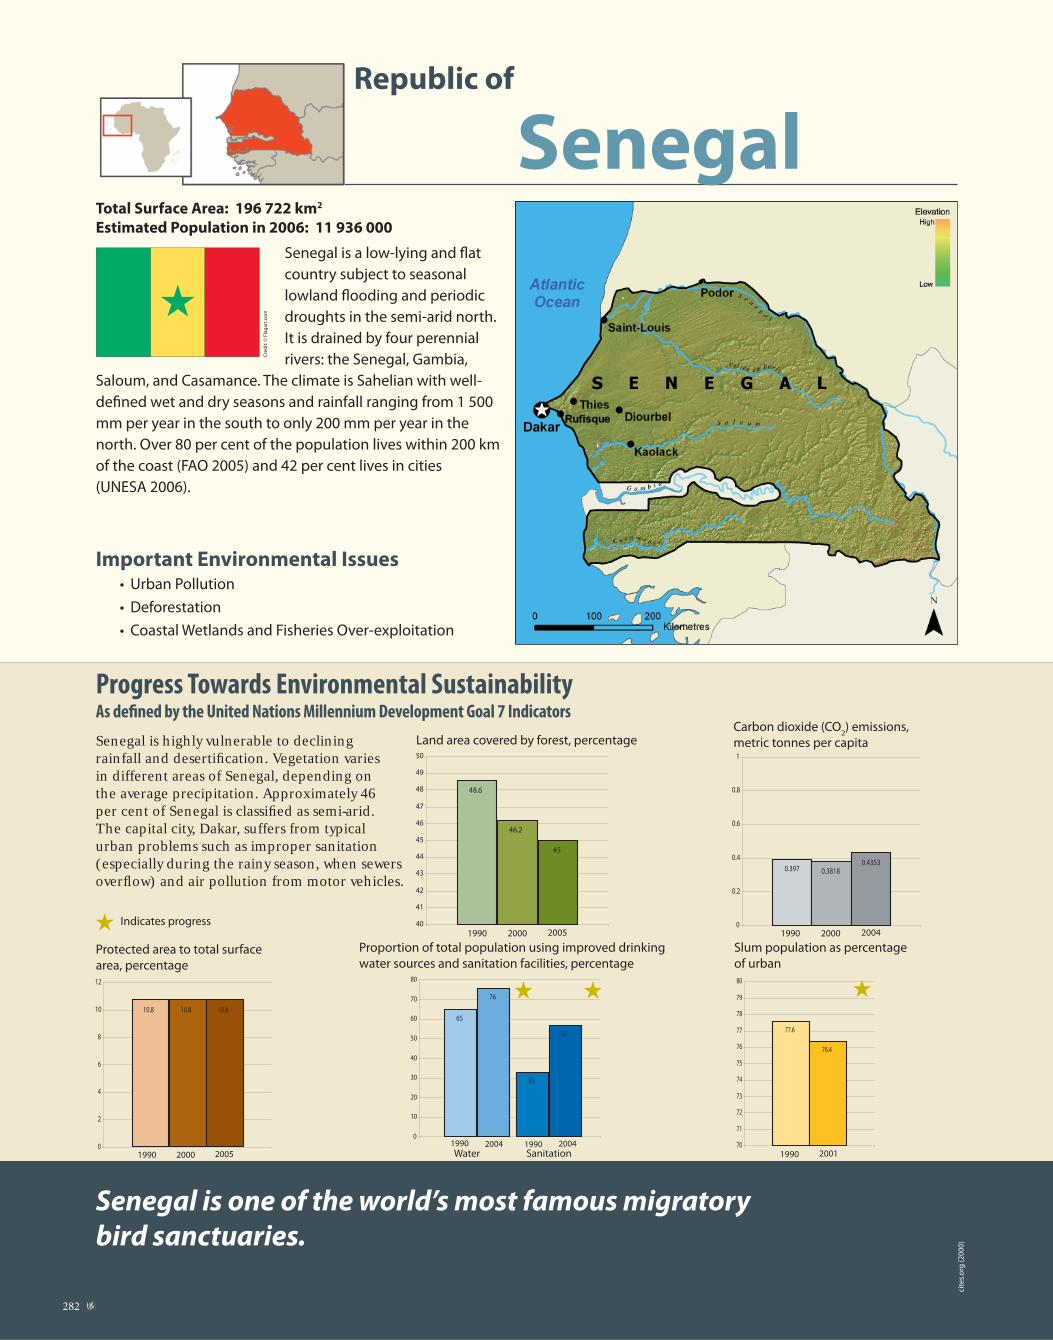
Senegal is a low-lying and fl at
country subject to seasonal
lowland fl ooding and periodic
droughts in the semi-arid north.
It is drained by four perennial
rivers: the Senegal, Gambia,
Saloum, and Casamance. The climate is Sahelian with well-
defi ned wet and dry seasons and rainfall ranging from 1 500
mm per year in the south to only 200 mm per year in the
north. Over 80 per cent of the population lives within 200 km
of the coast (FAO 2005) and 42 per cent lives in cities
(UNESA 2006).
Important Environmental Issues• Urban Pollution
• Deforestation
• Coastal Wetlands and Fisheries Over-exploitation
Total Surface Area: 196 722 km2
Estimated Population in 2006: 11 936 000
Senegal is highly vulnerable to declining rainfall and desertifi cation. Vegetation varies in different areas of Senegal, depending on the average precipitation. Approximately 46 per cent of Senegal is classifi ed as semi-arid. The capital city, Dakar, suffers from typical urban problems such as improper sanitation (especially during the rainy season, when sewers overfl ow) and air pollution from motor vehicles.
★ Indicates progress
Cre
dit
: © F
lag
art
.co
m
48.6
46.2
45
40
41
42
43
44
45
46
47
48
49
50
1990 20052000
0.397 0.38180.4353
0
0.2
0.4
0.6
0.8
1
1990 20042000
10.8 10.8 10.8
0
2
4
6
8
10
12
1990 20052000
65
76
33
57
0
10
20
30
40
50
60
70
80
1990 20042004 1990
77.6
76.4
70
71
72
73
74
75
76
77
78
79
80
20011990
★ ★ ★
cite
s.o
rg (
20
00
)

283�
Number of
threatened
plant species 58
One out of four Senegalese people (approximately 55 per cent of the urban population) lives in the coastal capital city Dakar (FAO 2005). The urban growth rate is 3.6 per cent per year, compared to 2.3 per cent for the country as a whole (UNESA 2006). Due to rapid population growth and poor urban planning, road traffi c and congestion have increased signifi cantly. As a result, air pollution is estimated to result in health costs equivalent to fi ve per cent of the GDP (UNEP 2002). Recent investments in urban transport infrastructure are expected to
relieve traffi c congestion, but probably at the cost of increased carbon dioxide emissions.
Urban Pollution
Forests cover nearly half of Senegal’s land surface, although this forest cover is steadily declining (UN 2007a). Agriculture claims more than 80 000 hectares of forest each year, and wildfi res, which are used for land clearing and hunting, degrade an additional 350 000 hectares annually. On the coast,
approximately 50 per cent of mangroves have been degraded as a result of over-exploitation and drought. Overall, deforestation has been blamed for recent increases in soil erosion, desertifi cation, and fl ooding.
Deforestation
Senegal’s biologically important wetlands are threatened by invasive plant species, mangrove degradation, and coastal development and erosion. The Djoudj National Bird Sanctuary is a large wetland on the fl oodplain of the Senegal River delta, covering 16 000 hectares of seasonally fl ooded lakes, ponds, and streams. It provides a haven for over three million migrant birds as well as large breeding populations of fl amingos, pelicans, and other species.
Fish account for three-quarters of local protein consumption and fi shing accounts for 17 per cent of employment in Senegal (FAO 2000-2007). However, overfi shing by European vessels and the
degradation of coastal ecosystems have threatened fi sh stocks, leading to decreased catches for local fi shermen.
Coastal Wetlands and Fisheries Over-exploitation
Flic
kr.
com
Fa
ct:
UN
(2
00
7b
)
Flic
kr.
com
Thou
sand
Ton
nes
Nitrogen Oxide Emissions
0
25
50
75
100
125
1990 1995 2000
Tonn
es
Marine Fisheries Production
050 000
100 000150 000200 000250 000300 000350 000400 000450 000500 000
1955 1965 1975 1985 1995 2005
Source: EDGAR, Netherlands Environment Assessment Agency
Source: FISHSTAT

284 �
Urbanisation of Cap Vert Peninsula: Dakar, Senegal Like many West African cities, Senegal’s capital city of Dakar has grown dramatically over the past several decades. Growth is expected to continue. While birth rates have begun to decline, natural growth still accounts for much of Dakar’s expansion. In addition, Dakar experienced a large rural-to-urban migration beginning in the 1960s, when Senegal suffered from declining precipitation and periods of extreme drought. By 2005, Senegal’s urban population exceeded its rural population. By 2030, two-thirds of the country’s population is expected to be urban.
Gra
y Ta
pp
an
/SA
IC/U
SG
S

285�
Roughly half of Senegal’s urban population lives in the greater Dakar metropolitan area. Urban population growth has turned the Cap Vert Peninsula into a sprawling metropolis, where settlements reach ever-further inland and onto the prime farmland that has historically supported the city. Pikine, initially begun as a resettlement of urban slum dwellers 15 km east of Dakar, has grown to over one million people. Its location in the fertile Niayes region displaced large areas of urban and peri-urban agriculture that once provided livelihoods for a substantial portion of the population.
In the aerial photo mosaic from 1942, Dakar is concentrated at the southern tip of the peninsula, with only the airport and a few scattered roads and settlements to the north. The 2006/2007 image shows only a portion of the greater Dakar area, which currently stretches another 14 km to the city of Rufi sque (not shown).
2 image mosaic

286 �
Riverine Forest Degradation: Leboudou Doue, Senegal In the black and white image, the darker areas of the land enclosed by this great loop on the Senegal River show the extent of the riverine forest in 1966. The 2006 image shows very little of that forest remains.
Similar deforestation has occurred in the fertile fl oodplains along hundreds of kilometres of the Senegal River. Much of the forest was cleared by local people to make way for subsistence agriculture. The most common riverine tree species, Acacia nilotica, is also the preferred source of
Gra
y Ta
pp
an
/SA
IC/U
SG
S

287�
wood for fuel and construction, and for charcoal production. Production of charcoal for sale as far away as Dakar and Saint Louis has further increased the pressure on what remains of these woodlands. Acacia nilotica woodlands that covered 39 000 hectares along the Senegal River in 1966 had been reduced to 9 000 hectares by 1992—a reduction of 77 per cent.
These pressures were compounded by two developments in the late 1980s. In 1988, the Manantali Dam was built upstream in Mali. The dam controls roughly half of the Senegal River’s discharge. While controlled releases of water from the dam can recreate natural fl ooding, below-normal fl ood levels may be contributing to loss of Acacia nilotica stands. The area’s population has also grown dramatically over the past several decades, including the infl ux of some 120 000 Mauritanian refugees and Senegalese expatriates following an ethnic confl ict in 1989.

288 �
Republic of
Seychelles
The smallest country in Africa made up of 115
islands in the Indian Ocean, Seychelles also has
the smallest population.
Seychelles is a large
archipelago of 115
islands located north
of Madagascar in the
western Indian Ocean.
Forty-two of the islands are classifi ed as “micro-
continental,” having been left behind by the
Indian subcontinent during its northward drift
towards Asia. The remaining 73 islands are coral
atolls and sandbanks that formed in the region’s
shallow waters. Lying only four degrees south of
the equator, Seychelles has a tropical wet climate
dominated by patterns of monsoons.
Important Environmental Issues• Severe Weather and Coastal Erosion
• Loss of Mangrove Forests and Protection of
Coral Reefs
Total Surface Area: 455 km2
Estimated Population in 2006: 83 000
Cre
dit
: © F
lag
art
.co
m
Seychelles does not have the resources to maintain a comprehensive program of environmental regulation, evident in the MDG graphs. The monitoring of the environment is complicated by the fact that the nation consists of 15 islands distributed over a 1.3 million km2 area.
★ Indicates progress
Protected Area to Total Surface
Area in per cent
Land Area Covered by Forest, percentage
Carbon Dioxide (CO2) Emissions,
Metric Tonnes per Capita (CDIAC)
Access to Improved Water Source and
Sanitation (per cent of total population)
Water Sanitation
Slum Population as per cent of
Urban Population
While Seychelles lies beyond the western Indian Ocean’s main cyclone belt, its islands have experienced increasingly frequent and intense storms over the past decade (UNEP 2006), resulting in millions of dollars in damage. Global climate change is expected to contribute to rising sea levels and even more extreme weather events, which is particularly threatening in light of increased coastal erosion. Stabilisation efforts and a national beach monitoring program were initiated in 2003 to address this problem.
Severe Weather and Coastal Erosion
Mangroves provide important habitat for fi sh and birds and protect coral reefs by capturing sediments before they enter ocean waters. Mangroves are found mainly on the granite islands. As a result of wetlands reclamation and coastal development, one-third of Seychelles’ mangroves have been lost since 1960 (Wilkie and Fortuna 2003).
Aldabra atoll in the western Seychelles is a UNESCO World Heritage Site and one of the most exceptional examples of the country’s coral reefs, which span 1 690 km2 (UNEP-WCMC 2001). Aldabra is home to 152 000 giant tortoises, the largest population of this reptile in the world (UNESCO 2007).
Loss of Mangrove Forests and Protection of Coral Reefs
88.9 88.9 88.9
0
10
20
30
40
50
60
70
80
90
100
1990 20052000
1.5783
6.9594
6.4395
0
1
2
3
4
5
6
7
8
1990 20042000
1.0 1.0 1.0
0
0.2
0.4
0.6
0.8
1
1.2
1990 20052000
88 88
0
10
20
30
40
50
60
70
80
90
100
N/A N/A
1990 20042004 1990
0
0.1
0.2
0.3
0.4
0.5
0.6
0.7
0.8
0.9
1
N/A N/A
20011990
Progress Towards Environmental SustainabilityAs defi ned by the United Nations Millennium
Development Goals 7 Indicators
No
Data
Available
Hec
tare
s
Mangrove Forest Extent
0
500
1 000
1 500
2 000
2 500
3 000
1960 1980 1990 2000
Tonn
es
Fisheries Production
0
30 000
60 000
90 000
120 000
1955 1965 1975 1985 1995 2005
UN
(2
00
7)
Source: FISHSTAT
Source: Status and Trends in Mangrove Area Extent Worldwide
288 �

289�
Land Reclamation: Mahe Island, Seychelles The east coast of Seychelles’ Mahe Island has undergone major environmental change during the last 30 years, primarily due to land reclamation projects. In 1973, land was reclaimed to create a site for the Seychelles International Airport, and in 1986, for a new port facility. Two further phases of reclamation were completed in the early 2000s, parts of which can be seen in the 2007 image above (yellow arrows).
These reclamation projects have impacted both marine and coastal environments. Several new wetland areas have been created, some of them colonized by mangroves, which provide valuable bird habitat and nursery areas for marine species. However, sedimentation from reclamation projects has killed some of the coral along Mahe’s eastern coast as well.
Reclamation has created land for Seychelles International
Airport, a new port facility, and luxury residential
developments such as Eden Island pictured here.
Just
in P
au
l Nic
ho
las
Pro
spe
r/D
ep
art
me
nt
of
En
vir
on
me
nt,
Se
ych
elle
s

290 �
Progress Towards Environmental SustainabilityAs defi ned by the United Nations Millennium Development Goal 7 Indicators
Land area covered by forest, percentageCarbon dioxide (CO
2) emissions,
metric tonnes per capita
Protected area to total surface
area, percentage
Proportion of total population using improved drinking
water sources and sanitation facilities, percentage
Water Sanitation
Slum population as percentage
of urban
Republic of
Sierra Leone
Sierra Leone had the second highest population growth rate in
Africa between 2000 and 2005—4.2 per cent per year.
Sierra Leone has a humid
tropical climate, with the
highest average rainfall on
the African continent—over
2 500 mm of rain per year
(FAO 2007). There are four
main topographical regions:
coastal plains, low inland plains, an upland plateau, and
small mountain ranges in the north and east. The country
is rich in natural resources including minerals, fi sh, forests,
and wetlands.
Important Environmental Issues• Deforestation
• Land Degradation
• Overfi shing
Total Surface Area: 71 740 km2
Estimated Population in 2006: 5 679 000
★ Indicates progress
Water pollution is a signifi cant problem in Sierra Leone due to mining by-products and sewage. An increase in slum population can be attributed to population pressure that has led to an intensifi cation of agriculture result-ing in soil depletion. Logging, cattle grazing, and slash-and-burn farming have decimated the primary forest. The mining sector offi cially accounts for over 90 per cent of the country’s export earnings.
Cre
dit
: © F
lag
art
.co
m
42.539.8
38.5
0
5
10
15
20
25
30
35
40
45
1990 20052000
0.08160.1184
0.1843
0
0.2
0.4
0.6
0.8
1
1990 20042000
3.9 3.9 3.9
0
1
2
3
4
5
1990 20052000
57
39
0
10
20
30
40
50
60
N/A N/A
1990 20042004 1990
90.995.8
0
10
20
30
40
50
60
70
80
90
100
20011990
ge
od
ata
.gri
d.u
ne
p.c
h (
20
06
)

291�
Sierra Leone’s forests are rich in biodiversity, including over 2 000 plant species, 74 of which are found nowhere else in the world (CBD n.d.). It is estimated that dense tropical forests once covered 65 per cent of the country; these have been reduced to only fi ve per cent today (UNCCD 2004). There are many human pressures on the forest, including logging (both legal and illegal), slash-and-burn agriculture, mining, and dependence on fuelwood by 85 per cent of the population (CBD n.d.).
Deforestation
of the diamonds exported from
Sierra Leone are extracted by
small scale artisanal miners 90%
Sierra Leone’s population and economy depend heavily on agriculture. Population pressure has reduced fallow periods to less than fi ve years and encouraged clearing of forests for cultivation (CBD n.d.), resulting in soil erosion and nutrient leaching. Land degradation very likely has reduced yields of major crops such as rice.
Mining is a signifi cant source of localised land degradation. Diamonds are Sierra Leone’s primary export commodity and are mined by both large international companies as well as small artisanal operations. Both have brought about signifi cant environmental degradation including deforestation,
soil erosion, pollution, and siltation of water resources; plans for rehabilitation are lacking.
Land Degradation
Sierra Leone’s marine and inland fi sheries are biologically rich. Although production signifi cantly declined during the decade-long civil war that ended in 2002, the sector is again on the rise. Widespread illegal fi shing is increasing concerns about overexploitation. Although not yet believed to be overexploited, several fi sh stocks may be in decline, although reliable data is lacking (Blinker 2006).
Overfi shing
Flic
kr.
com
Fa
ct:
min
era
ls.u
sgs.
go
v(2
00
5)
Flic
kr.
com
Mill
ion
Cub
ic M
etre
s
Fuelwood Production
0
1
2
3
4
5
6
1965 1975 1985 1995 2005
Car
ats
Diamond Production
0
200 000
400 000
600 000
800 000
2001 2002 2003 2004 2005
Tonn
es
Marine Fisheries Production
0
30 000
60 000
90 000
120 000
150 000
1955 1965 1975 1985 1995 2005
Source: FAOSTAT
Source: USGS International Mineral Statistics and Information
Source: FISHSTAT

292 �
Rutile Mining: Moyamba District, Sierra Leone Sierra Leone is mineral rich; titanium minerals such as rutile and ilmenite are its principle mineral exports. Before war erupted in 1991, mining represented 90 per cent of Sierra Leone’s registered exports and roughly 20 per cent of its GDP—rutile accounted for well over half of that. The Moyamba District, which borders the Atlantic Ocean in the west and Bonthe to the south, is the most active rutile mining area in the country. Although mining companies left during the war, they returned when the war ended in 2002.
Pe
rmis
sio
n P
en
din
g/P
ho
tosh
are

293�
Rutile is mined by creating large artifi cial lakes which are then dredged, leaving behind large water-fi lled pits up to 600 m long. In Sierra Leone, these activities have left vast areas of land deforested and degraded. It is estimated that between 80 000 and 120 000 hectares of land have been mined out in different parts of the country with minimal efforts at restoration.
In the 1974 image, one small mining operation is visible (centre); however, much of the Moyamba District was still covered with relatively intact forests at that time. By 2003, mining activities had replaced large portions of forest with water-fi lled pits. These mining sites have extremely poor health and sanitary conditions; the pits teem with mosquitoes and bacteria that are linked to a high incidence of malaria, cholera, and diarrhoea.

294 �
Western Area Forest Reserve: Freetown, Sierra Leone Freetown, Sierra Leone’s capital city, shares a peninsula with the Western Area Forest Reserve—a small remnant of the Guinean Forests that historically stretched from Guinea to Cameroon. The century-old reserve covers a chain of forested hills that are home to approximately 300 species of birds and a small population of chimpanzees.
Intense population growth began in Freetown in the 1970s. However, a buffer of forested land remained between the Reserve and the edge of the city. By the mid-1980s, however, the growing
Wik
ipe
dia

295�
The urban expansion of Freetown is encroaching on the forest and at many places into the Western Area Reserve. Image courtesy of DigitalGlobe Quickbird.
city had expanded into the buffer zone and much closer to Reserve borders (1986 image). Between 1991 and 2002, as many as one million people fl ed to Freetown as a result of war in Sierra Leone. Many of these refugees moved into the hills of the Reserve, where they relied on its resources to survive. Deforestation and land degradation of these valuable protected lands was the result. By 2003, the border of the Reserve had been breached in many places (2003 image), with urban populations encroaching from several directions.
The Reserve is now recognized as vital, not only to the biodiversity and natural systems it supports, but to the people of Freetown as well. The forest is crucial for recharging of Freetown’s reservoirs, which are already struggling to meet the city’s water needs.

296 �
Progress Towards Environmental SustainabilityAs defi ned by the United Nations Millennium Development Goal 7 Indicators
Land area covered by forest, percentageCarbon dioxide (CO
2) emissions,
metric tonnes per capita
Protected area to total surface
area, percentage
Proportion of total population using improved drinking
water sources and sanitation facilities, percentage
Water Sanitation
Slum population as percentage
of urban
Somali Republic
Northern Somalia is the world’s largest source of myrrh and
other incense.
Somalia is a large, relatively fl at
country located on the Horn of
Africa. Its coast is the longest
in Africa and borders the Gulf
of Aden to the north and the
Indian Ocean to the east. The
climate is highly arid and hot year-round with seasonal
monsoon winds and low, sporadic rainfall arriving in two
rainy seasons. Average annual rainfall is estimated at less
than 280 mm.
Important Environmental Issues• Threats to Biodiversity
• Desertifi cation, Overgrazing, and Deforestation
• Water Scarcity and Drought
Total Surface Area: 637 657 km2
Estimated Population in 2006: 8 496 000
The increasing aridity of Somalia climate, coupled with excessive timber cutting and overgrazing, has led to deforestation and expansion of the desert area. The Indian Ocean tsunami of December 2004 affected stretches of coast. Ongoing internal confl ict, which began in the 1980s, has severely hindered sustainable management of natural resources.
Indicates progress★
Cre
dit
: © F
lag
art
.co
m
13.2
1211.4
0
2
4
6
8
10
12
14
1990 20052000 1990 20042000
0.0027
0
0.0005
0.001
0.0015
0.002
0.0025
0.003
N/A N/A
0.7 0.7 0.7
0
0.1
0.2
0.3
0.4
0.5
0.6
0.7
0.8
1990 20052000
29
26
0
5
10
15
20
25
30
35
1990 20042004 1990
N/A N/A
96.3
97.1
90
91
92
93
94
95
96
97
98
99
100
20011990
un
eca
.org
(20
02
)

297�
Somalia has the longest
coastline in Africa
3 330
Seventeen per cent of all identifi ed plant species in Somalia are endemic, which is the second-highest level of fl oral endemism in continental Africa (UNEP 2005). The coastal region is home to extensive coral reefs, mangrove forests, seabird colonies, and turtle nesting beaches that are currently unprotected and suffer from heavy exploitation. Although the state of most fi sh stocks is unknown, sharks, lobsters, and certain fi sh species are thought to be over-exploited. Although Somalis do not traditionally consume much fi sh, fi sh exports are important to the economy and illegal fi shing by foreign fl eets is common.
Somalia wildlife has also been severely over-exploited and many species, including the black rhino and elephant, are approaching national extirpation. Lack of offi cial protection and loss of
habitat due to agriculture-related land degradation are major threats.
Threats to Biodiversity
Due to overall aridity and drought frequency, 100 per cent of land is at high risk of desertifi cation (FAO AGL 2003). Despite water and feed constraints, however, Somalia has the highest
proportion of pastoralists in Africa; livestock accounts for 40 per cent of the GDP product (UNEP 2005). Overstocking and overgrazing have resulted in declining fertility of pastureland, which accounts for nearly 70 per cent of Somali Republic’s total land area (WRI 2007).
Deforestation is another leading driver of land degradation and desertifi cation. Charcoal, produced primarily from slow-growing acacia trees, is an important domestic energy source, although its production in Somalia is largely driven by foreign demand. In 2006, a ban on charcoal exports was imposed in an attempt to curb uncontrolled deforestation of acacia forests, which are also under heavy grazing pressure.
Desertifi cation, Overgrazing, and Deforestation
In the Somalia’s arid north and east, sub-surface water resources are generally saline; deep boreholes are the only permanent source of freshwater. In the south, two perennial rivers, the Juba and Shabelle, play a major role in water access. Due to prolonged civil confl ict, lack of water management, and erratic rainfall, Somalia has the second-lowest level of access to safe water in Africa, at only 29 per cent of the total population (UN 2007). In the tsunami-impacted regions, where many wells were clogged or buried, the situation is particularly severe.
Natural rainfall variation, exacerbated by climate change, contributes to regular droughts every two to three years that are often followed by severe fl oods. In 2002, water shortages caused
losses of up to 40 per cent of cattle and 10 to 15 per cent of goats and sheep (FAO 2005).
Water Scarcity and Drought
Flic
kr.
com
Fa
ct:
fao
.org
(2
00
8)
Flic
kr.
com
km
Kilo
gram
s P
er B
oat T
rip
Fishery Productivity in Somalia
0
100
200
300
400
500
600
700
1995 2000 2005
Fish Lobster Shark
Mill
ion
Tonn
es
Charcoal Production
00.10.20.30.40.50.60.70.80.9
1965 1975 1985 1995 2005
Mill
ions
of P
eopl
e
People Affected by Flood and Drought
Year of Drought/Flood
0
0.25
0.5
0.75
1
1.25
1964 1977 1987 1989 1997 2001 2004 2006
Drought Flood
Source: UNEP 2005 State of the Environment in Somalia: A Desk Study
Source: FAOSTAT
Source: EM-DAT Disaster Database
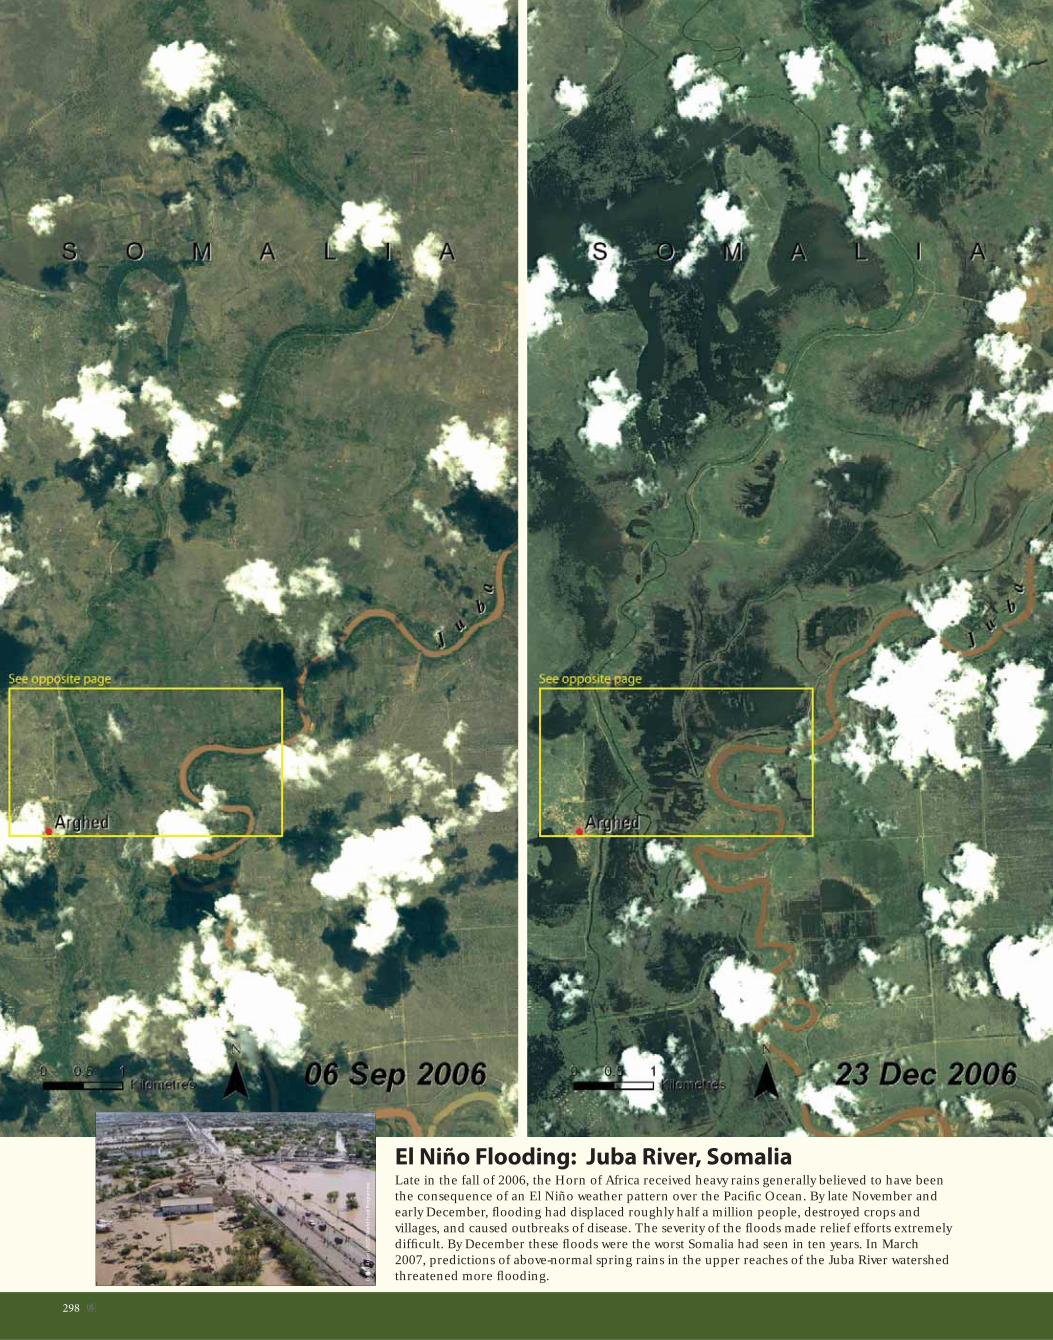
298 �
El Niño Flooding: Juba River, SomaliaLate in the fall of 2006, the Horn of Africa received heavy rains generally believed to have been the consequence of an El Niño weather pattern over the Pacifi c Ocean. By late November and early December, fl ooding had displaced roughly half a million people, destroyed crops and villages, and caused outbreaks of disease. The severity of the fl oods made relief efforts extremely diffi cult. By December these fl oods were the worst Somalia had seen in ten years. In March 2007, predictions of above-normal spring rains in the upper reaches of the Juba River watershed threatened more fl ooding.G
ule
id A
rta
n (
US
GS
)/W
orl
d F
oo
d P
rog
ram
me

299�
On the left page, September 2006 and December 2006 images show a portion of the Juba River before and after the rains came, respectively. Flooded areas appear as dark-green to black. Small portions of these images (yellow rectangles) are shown above in greater detail.
In spite of profound negative impacts of the fl ooding in the Juba River region, two consecutive seasons of heavy precipitation may have benefi ted cereal grain production and improved pastoral conditions in the region, substantially reducing the need for humanitarian assistance.

300 �
Progress Towards Environmental SustainabilityAs defi ned by the United Nations Millennium Development Goal 7 Indicators
Land area covered by forest, percentageCarbon dioxide (CO
2) emissions,
metric tonnes per capita
Protected area to total surface
area, percentage
Proportion of total population using improved drinking
water sources and sanitation facilities, percentage
Water Sanitation
Slum population as percentage
of urban
Republic of
South Africa
The South African Fynbos, with 8 500 species of vascular plants,
is one of the six botanical kingdoms of the world and has a richer
fl ora than any other comparable sized area in Africa.
South Africa is the southern-
most country in Africa, with
a long coast spanning across
both the Atlantic and Indian
Oceans. Although the climate
is generally temperate, at least
65 per cent of the country is too arid to support rain-fed
agriculture (FAO 2005). The Great Escarpment, a stretch of
rugged and scenic terrain running from the northeast to the
southwest of the country, separates a wide central plateau
from a narrow coastal plain. The mineral riches beneath
these lands make South Africa the world’s largest producer
of platinum, gold, and chromium (CIA 2007).
Important Environmental Issues• Water Availability and Quality
• Land Degradation
• Threats to Biodiversity
Total Surface Area: 1 221 037 km2
Estimated Population in 2006: 47 594 000
★ Indicates progress
South Africa’s limited water resources have been impaired by mineralization, eutrophication, and acidic mine drainage. In 2002, 74 per cent of total energy consumption in South Africa came from coal. Because coal is a highly carbon-intensive fossil fuel, overreliance on it for energy needs can have negative environmental impacts, including air pollution due to coal combustion, groundwater pollution, and disruption of ecosystems due to mining.
Cre
dit
: © F
lag
art
.co
m
7.6 7.6 7.6
0
2
4
6
8
10
1990 20052000
5.66.0 6.1
0
2
4
6
8
1990 20052000
46.2
33.2
0
5
10
15
20
25
30
35
40
45
50
20011990
8388
6965
0
10
20
30
40
50
60
70
80
90
100
1990 20042004 1990
★★ ★
9.0777
8.7468
9.1927
0
2
4
6
8
10
1990 20042000
pa
nd
a.o
rg (
20
06
)

301�
Surface area of
Lake St Lucia — the
largest marine lake
in Africa 368
South Africa is a semi-arid country with unevenly distributed rainfall. In northern regions in particular, freshwater resources are nearly fully-utilised and many are under stress. Population and economic growth are anticipated to increase water demand by 52 per cent between 2000 and 2030 (SoE 1999), making freshwater availability one of the primary constraints on development.
There are over 320 large dams in South Africa, with a total capacity of 32 400 million cubic metres (SoE 2006). Sedimentation has reduced the capacity of some dams by as much as 25 per cent (SoE 1999). Of the 30 dams in Africa with the highest levels of sedimentation, 18 are in South Africa (FAO 2007a). Furthermore, the spread of alien invasive plant
species has decreased the national mean annual run-off by three per cent (SoE 2006). Finally, pollution from industrial and domestic effl uents has reduced the quality of groundwater and surface water resources, especially near urban areas.
Water Availability and Quality
An estimated 67 per cent of South Africa’s total land area is severely degraded (FAO 2007b). The primary drivers are wind and water erosion, spurred
by overgrazing and cultivation of land unsuitable for agriculture specifi cally on the steep slopes of enscarptments in the Limpopo, KwaZulu Natal, and Eastern Cape (SoE 2006). Declining soil fertility has affected many farmers, with an average of 2.5 metric tonnes of topsoil lost per hectare per year, which is approximately eight times the rate of natural soil formation (SoE 1999).
Mining is another signifi cant contributor to land degradation in the form of acid mine drainage, water pollution, and the drastic alteration of landscapes. The Witwatersrand region near Johannesburg, South Africa, has the richest concentration of mineral resources in southern Africa. Mine wastes cover over 200 000 hectares in South Africa (SoE 2006).
Land Degradation
South Africa is one of the most biodiverse countries in the world, with almost ten per cent of the world’s plant species, six per cent of its mammal species, 16 per cent of its marine fi sh species, and eight per cent of the world’s bird species (CBD 2005). The country also has the fi fth-highest level of endemism on the African continent.
Many species are threatened due to agricultural activities, urban development, mining, the spread of invasive alien species, and over-harvesting. An estimated 34 per cent of terrestrial ecosystems and 82 per cent of river ecosystems are considered threatened, and approximately half of all wetlands have been lost (CBD 2005). Marine ecosystems
are especially endangered due to rapid coastal development, pollution, and reduced freshwater infl ow from estuaries. Approximately 1.3 million m3 of sewage and industrial effl uent are discharged into the sea daily (SoE 2006).
Threats to Biodiversity
Flic
kr.
com
Fa
ct:
un
ep
-wcm
c.o
rg (
n.d
); W
hit
fi e
ld (
19
94
).
Flic
kr.
com
km2
Cub
ic M
etre
s
Renewable Water Resources Per Capita
0
500
1 000
1 500
2 000
2 500
1965 1975 1985 1995 2005actual water scarcity threshold
Mill
ion
Hec
tare
s
Potential Versus Actual Cultivated Land
10
12
14
16
18
1963 1973 1983 1993 2003
actual potential
Number Threatened
Threatened Species
0 20 40 60 80
Reptiles
Amphibians
Mammals
Birds
Fishes
Plants
Source: AQUASTAT
Source: AQUASTAT and FAOSTAT
Source: IUCN Red List

302 �
Indigenous Forests: Amatole Mistbelt, South AfricaWhile forests are not believed to have ever covered a large part of South Africa, logging, clearing for agriculture, and forest plantations have much reduced their original extent. Indigenous forests now cover only 0.33 per cent of South Africa’s land area.
South Africa’s Amatole Mistbelt Forests are part of the southernmost areas of Afromontane forest in Africa. They contain some small remaining patches of indigenous forest. These forests fall within the Maputaland-Pondoland-Albany biodiversity hotspot and are home to variety of unique plant and animal species, including several endemic species such as the endangered
Flic
kr.
com

303�
giant golden mole (Chrysospalax trevelyani). They are also important resources for local people who rely on them for wood and non-wood products. Some of the characteristic tree species are yellowwood (Podocarpus falcatus), (see photo), red currant (Rhus chirindensis), and black ironwood (Olea capensis).
South Africa’s Department of Water Affairs and Forestry defi ned the areas of Isidenge and Pirie as “irreplaceable” patches of indigenous forest. While nearly half of the forests in the Amatole Mistbelt Forests are under state management, less than 1.5 per cent are under strict protection. Comparison of these 1972 and 2001 images shows some new areas of tree cover, (yellow arrows); however, these are primarily plantation forests of pine and eucalyptus, which threaten to alter the hydrology and reduce the biodiversity of these ecosystems.
Pri
scill
a B
urg
oyn
e/
So
uth
Afr
ica
n N
ati
on
al B
iod
ive
rsit
y In
stit
ute
The Yellowwood (Podocarpus falcatus)is an important native species in this ecosystem, but is also harvested for wood and non-wood products.
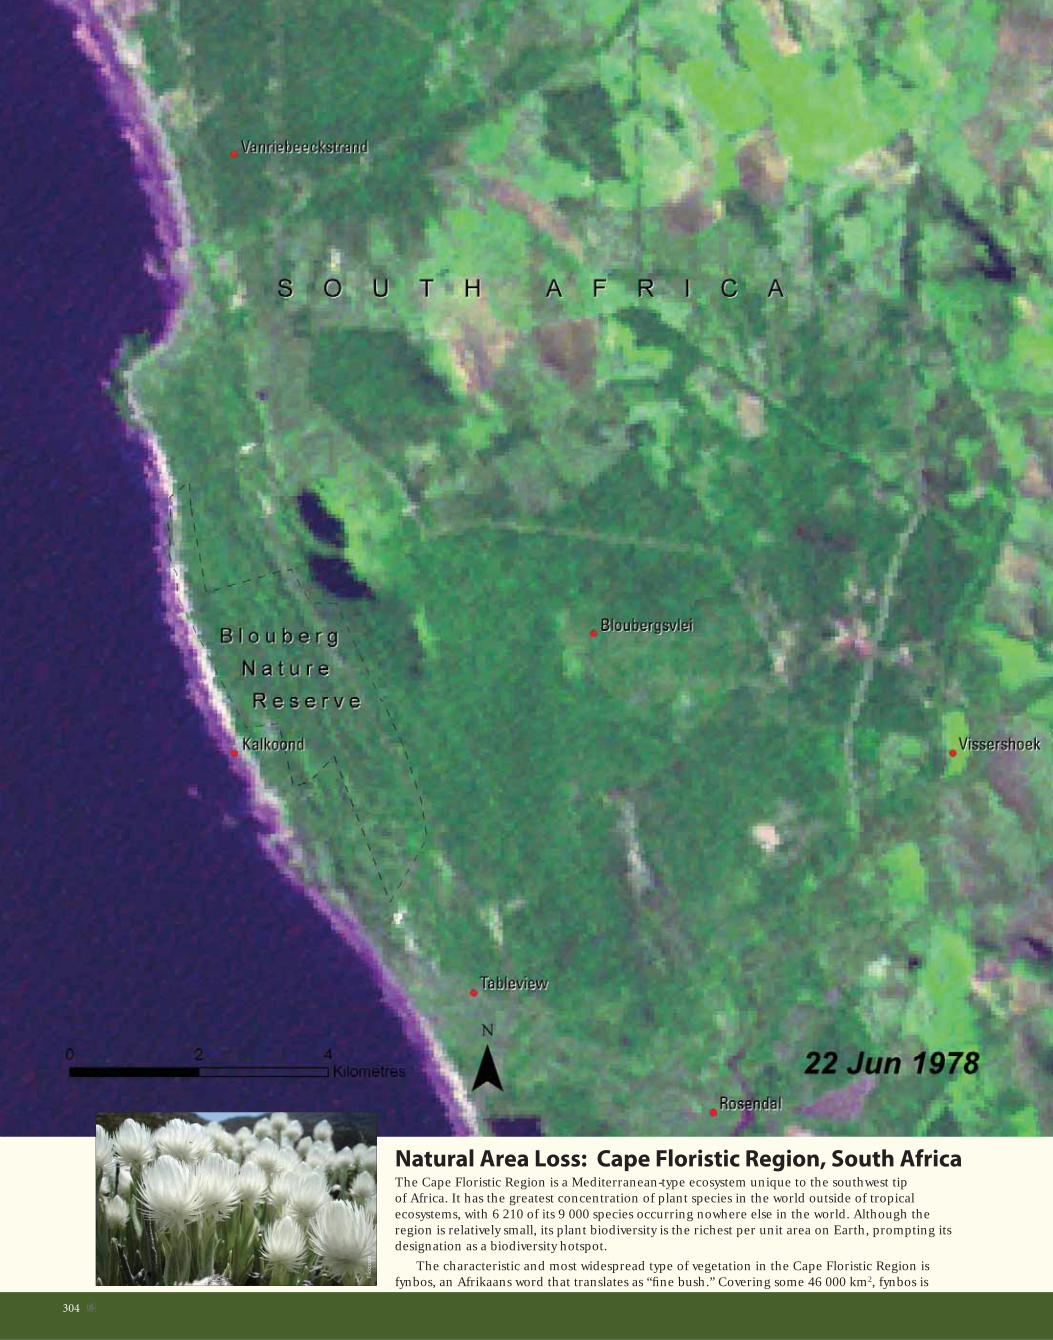
304 �
Natural Area Loss: Cape Floristic Region, South Africa The Cape Floristic Region is a Mediterranean-type ecosystem unique to the southwest tip of Africa. It has the greatest concentration of plant species in the world outside of tropical ecosystems, with 6 210 of its 9 000 species occurring nowhere else in the world. Although the region is relatively small, its plant biodiversity is the richest per unit area on Earth, prompting its designation as a biodiversity hotspot.
The characteristic and most widespread type of vegetation in the Cape Floristic Region is fynbos, an Afrikaans word that translates as “fi ne bush.” Covering some 46 000 km2, fynbos is
Flic
kr.
com

305�
a shrubland comprising hard-leafed, evergreen, fi re-adapted shrubs. Fynbos covers half of the surface area and accounts for 80 per cent of the plant varieties of the Cape Floristic Region.
The 1978 image shows large, relatively intact areas of native fynbos vegetation. Over subsequent decades, however, large tracts of fynbos have been cleared for agriculture or lost to urban expansion around Cape Town. The 2007 image shows how roads, urban development, and agriculture have overtaken much of the area.
Fynbos areas are also threatened by invasive alien species, particularly wattle and acacia species from Australia, as well as pine plantations. Many fynbos species have gone extinct, and more than 1 000 are endangered. Their conservation is a priority, and reserves have been established in many areas.
See Inset
Inset

306 �
Progress Towards Environmental SustainabilityAs defi ned by the United Nations Millennium Development Goal 7 Indicators
Land area covered by forest, percentageCarbon dioxide (CO
2) emissions,
metric tonnes per capita
Protected area to total surface
area, percentage
Proportion of total population using improved drinking
water sources and sanitation facilities, percentage
Water Sanitation
Slum population as percentage
of urban
Republic of the
Sudan
Sudan is the largest country on the African continent; likewise, its
Sudd Wetland—one of the largest tropical wetlands in the world—is
Africa’s largest.
As the largest African
country, Sudan extends
over three major climatic
zones: the Saharan north,
the Sahelian centre, and
the equatorial south. The population is concentrated
largely along the Nile River and its tributaries, where soil
fertility and agricultural productivity are high. Rainfall is
widely variable throughout the country, ranging from only
25 mm per year in the dry arid north to over 1 600 mm per
year in the tropical rain forests of the south (FAO 2005a).
Important Environmental Issues• Soil Erosion and Land Degradation
• Poaching and the Ivory Trade
• Forests and Fisheries
Total Surface Area: 2 505 813 km2
Estimated Population in 2006: 36 992 000
★ Indicates progress
Sudan faces a number of critical environmental challenges, including land degradation, deforestation, and the impacts of climate change. There has been a southward shift—ranging from 50 to 200 km—of the boundary between semi-desert and desert since rainfall and vegetation records were fi rst kept in the 1930s. This boundary is expected to continue to move southwards due to declining precipitation.
Cre
dit
: © F
lag
art
.co
m
32.1
29.7
28.4
20
22
24
26
28
30
32
34
1990 20052000 1990 20042000
0.20770.1659
0.2870
0
0.1
0.2
0.3
0.4
0.5
0.6
0.7
0.8
0.9
1
64
70
33 34
0
10
20
30
40
50
60
70
80
1990 20042004 1990
4.7 4.7 4.7
0
0.5
1
1.5
2
2.5
3
3.5
4
4.5
5
1990 20052000
86.4
85.7
80
81
82
83
84
85
86
87
88
20011990
★ ★ ★
ram
sar.
org
(2
00
6)
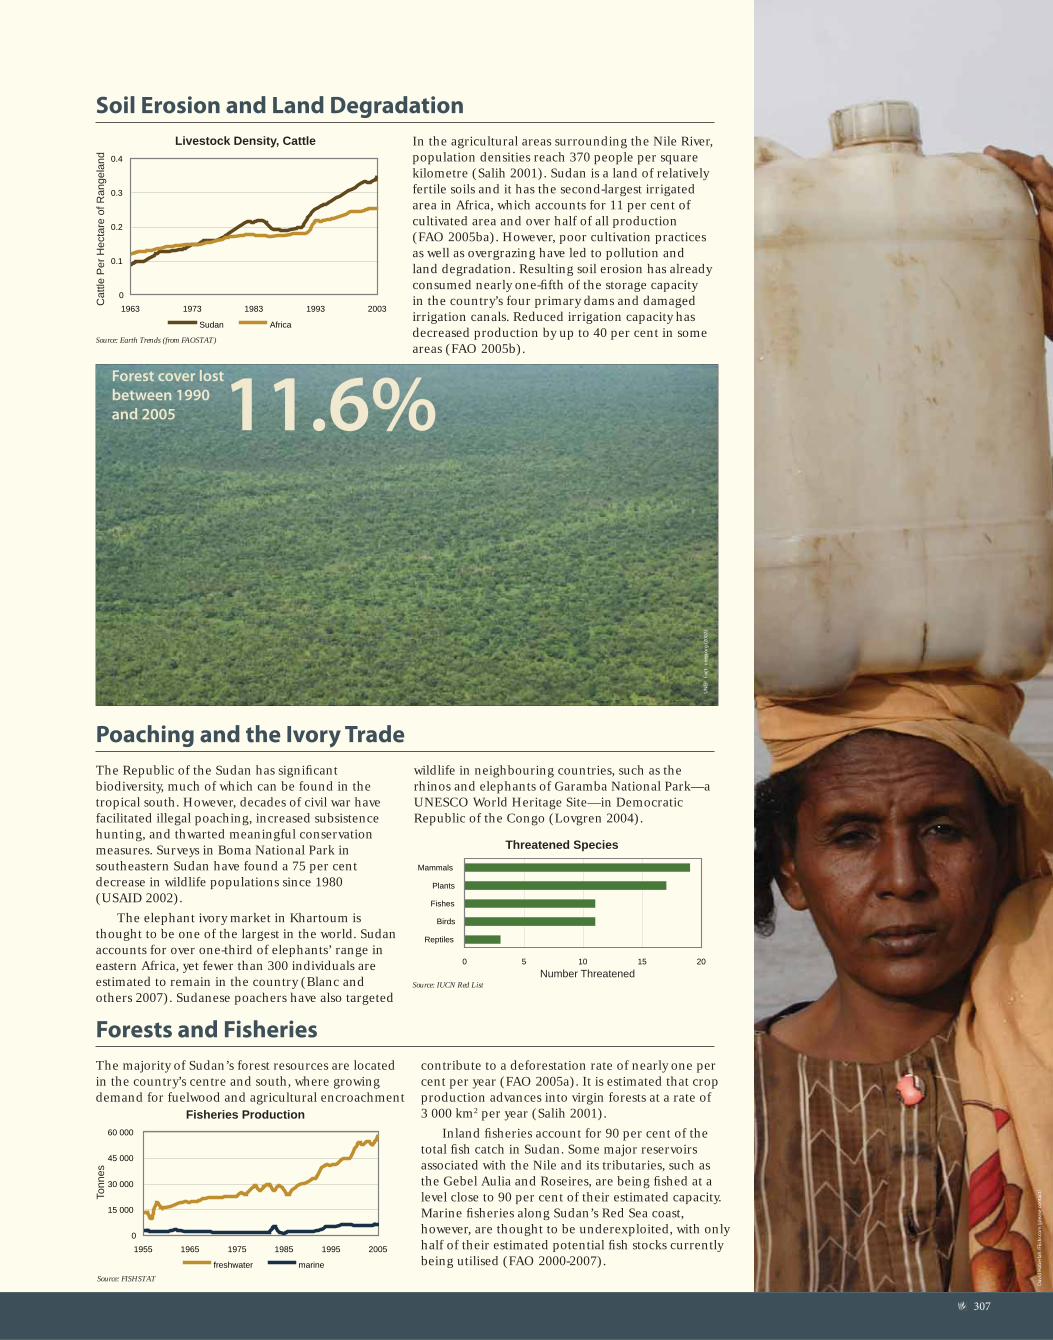
307�
Forest cover lost
between 1990
and 2005 11.6%
UN
EP
Fa
ct:
un
ep
.org
(2
00
7)
Dav
id H
ab
erl
ah
/Fl
ick
r.co
m (
ple
ase
co
nta
ct)
In the agricultural areas surrounding the Nile River, population densities reach 370 people per square kilometre (Salih 2001). Sudan is a land of relatively fertile soils and it has the second-largest irrigated area in Africa, which accounts for 11 per cent of cultivated area and over half of all production (FAO 2005ba). However, poor cultivation practices as well as overgrazing have led to pollution and land degradation. Resulting soil erosion has already consumed nearly one-fi fth of the storage capacity in the country’s four primary dams and damaged irrigation canals. Reduced irrigation capacity has decreased production by up to 40 per cent in some areas (FAO 2005b).
Soil Erosion and Land Degradation
The Republic of the Sudan has signifi cant biodiversity, much of which can be found in the tropical south. However, decades of civil war have facilitated illegal poaching, increased subsistence hunting, and thwarted meaningful conservation measures. Surveys in Boma National Park in southeastern Sudan have found a 75 per cent decrease in wildlife populations since 1980 (USAID 2002).
The elephant ivory market in Khartoum is thought to be one of the largest in the world. Sudan accounts for over one-third of elephants’ range in eastern Africa, yet fewer than 300 individuals are estimated to remain in the country (Blanc and others 2007). Sudanese poachers have also targeted
wildlife in neighbouring countries, such as the rhinos and elephants of Garamba National Park—a UNESCO World Heritage Site—in Democratic Republic of the Congo (Lovgren 2004).
Poaching and the Ivory Trade
The majority of Sudan’s forest resources are located in the country’s centre and south, where growing demand for fuelwood and agricultural encroachment
contribute to a deforestation rate of nearly one per cent per year (FAO 2005a). It is estimated that crop production advances into virgin forests at a rate of 3 000 km2 per year (Salih 2001).
Inland fi sheries account for 90 per cent of the total fi sh catch in Sudan. Some major reservoirs associated with the Nile and its tributaries, such as the Gebel Aulia and Roseires, are being fi shed at a level close to 90 per cent of their estimated capacity. Marine fi sheries along Sudan’s Red Sea coast, however, are thought to be underexploited, with only half of their estimated potential fi sh stocks currently being utilised (FAO 2000-2007).
Forests and Fisheries
Cat
tle P
er H
ecta
re o
f Ran
gela
nd
Livestock Density, Cattle
0
0.1
0.2
0.3
0.4
1963 1973 1983 1993 2003
Sudan Africa
Number Threatened
Threatened Species
0 5 10 15 20
Reptiles
Birds
Fishes
Plants
Mammals
Tonn
es
Fisheries Production
0
15 000
30 000
45 000
60 000
1955 1965 1975 1985 1995 2005
freshwater marine
Source: IUCN Red List
Source: Earth Trends (from FAOSTAT)
Source: FISHSTAT

308 �
Tree Loss in the Foothills: Jebel Marra, SudanThe Jebel Marra Massif is a region of high, jagged peaks and fertile valleys in western Sudan. The southern foothills of the Jebel Marra receive an average of 600 to 800 mm of precipitation annually, just above the minimum needed to support rain-fed agriculture. Crops include sorghum, millet, groundnuts, and cowpeas that are raised along watercourses and adjacent areas. Pastoralists seasonally graze their cattle on the natural vegetation in the region; the number of grazing herds has increased in recent decades as droughts have made water and pasture scarce further north.Fl
ick
r.co
m

309�
Population growth , especially in the latter half of the 20th century, coupled with an infl ux of refugees from drought and confl ict in Northern Darfur have put increasing pressure on this fragile ecosystem. Human activities have greatly altered the natural open-savannah woodlands.
The 1972 image shows substantial tree cover across much of the lower left half of the image. The 2006 image shows the degree to which vegetation has been reduced, particularly in the less hilly areas and away from croplands concentrated along the watercourses. The loss of trees and shrubs in this fragile environment is leading to land degradation and reduced capacity to support the area’s ever-increasing population.

310 �
Flooding and the Jonglei Canal: Sudd Swamp, SudanThe Sudd is a vast wetland ecosystem in southern Sudan where the Nile River meanders for nearly 645 km through the landscape. During the dry season (February 2005 image), the wetlands contract to approximately 8 300 km2 of permanent swamp. During the wet season (July/August 2005 image), the Sudd fl oods, expanding to cover 80 000 km2. This annual pattern of water rising and receding shapes the entire ecosystem and is crucial to the survival of the wetlands’ plants and animals and to the nomadic lifestyle of the Nuer, Dinka, and Shilluk people who live in the region.U
NE
P

311�
The Jonglei Canal project (yellow arrow), begun in 1978, was designed to speed the movement of Nile water around the Sudd wetlands, reducing evaporation and making more water available downstream. Despite the possible downstream benefi ts, the proposed 360-km canal could have a devastating effect on the wetlands of the Sudd. Recent studies also show that the project could impact the regions’s climate, groundwater recharging, and water quality as well.
Construction of the canal stopped in 1983 because of armed confl icts in the area during the second Sudanese civil war. This confl ict has now ended and plans to resume the canal’s construction are being evaluated. Efforts to preserve the wetlands received a major boost in 2006 when the Sudd was added to the Ramsar List of Wetlands of International Importance.
2 image mosaic

312 �
Progress Towards Environmental SustainabilityAs defi ned by the United Nations Millennium Development Goal 7 Indicators
Land area covered by forest, percentageCarbon dioxide (CO
2) emissions,
metric tonnes per capita
Protected area to total surface
area, percentage
Proportion of total population using improved drinking
water sources and sanitation facilities, percentage
Water Sanitation
Slum population as percentage
of urban
Swaziland has 1 400 km2 of forest plantations, which cover
8.1 per cent of the country’s total land area.
Kingdom of
SwazilandSwaziland is a small, land-locked
country surrounded by South
Africa on three sides and by
Mozambique to the east. The
population is three-quarters
rural, with the majority of the
residents engaged in subsistence agriculture (FAO 2005).
Swaziland has a unique system of land tenure, with
46 per cent of the country owned by private individuals and
the remainder occupied by communal lands managed by the
government (FAO 2005).
Important Environmental Issues• Population Encroachment and Land Degradation
• Irrigation and Soil Degradation
• Threats to Biodiversity and Invasive Alien Species
Total Surface Area: 17 364 km2
Estimated Population in 2006: 1 029 000
★ Indicates progress
Swaziland’s major environmental problems are soil erosion and land degradation, particularly because of overgrazing. Air pollution from transportation vehicles and emissions from other countries in the area is another signifi cant environmental concern. Grassland, savannah, mixed bush, and scrub cover most of Swaziland. There are some forests in the highlands, which have seen a small but steady increase since 1990.
Cre
dit
: © F
lag
art
.co
m
27.430.1 31.5
0
5
10
15
20
25
30
35
1990 20052000
0.4917
0.94930.8589
0
0.2
0.4
0.6
0.8
1
1990 20042000
3.5 3.5 3.5
0
0.5
1
1.5
2
2.5
3
3.5
4
1990 20052000
62
48
0
10
20
30
40
50
60
70
N/A N/A
1990 20042004 1990 0
0.2
0.4
0.6
0.8
1
N/A N/A
20011990
★
No
Data
Available
fao
.org
(2
00
3)

313�
Agriculture accounts for 80 per cent of total land use in Swaziland and is the principal driver of land degradation. Overgrazing is a dominant factor, particularly on communal lands, where more than half of soils are seriously affected by soil erosion (SoE 2001). Rapid population growth has also added to the land degradation problem by putting increased pressure on land resources for shelter and food production. The population density in Swaziland has nearly quadrupled since 1950 (UNESA 2005) and sugar plantations have subsequently claimed an additional 520 km2 of virgin savannah ecosystems (SoE 2001).
Population Encroachment and Land Degradation
Percentage of water
resources used for
farming in Swaziland 96%
Irrigation accounts for over 95 per cent of total water use in Swaziland, and irrigated cropland for roughly one-quarter of the total cultivated area (FAO 2005). While irrigation generally increases production levels, the use of poor quality or excessive amounts of water has also led to increased soil salinity and water-logging. In one large sugar plantation alone, more than 2 500 hectares of cropland have been abandoned due to these problems (SoE 2001). To provide for irrigation, Swaziland has already constructed seven large dams and has plans to build more (FAO 2005).
Irrigation and Soil Degradation
Swaziland is topographically and climatically diverse and supports a wide array of unique species and ecosystems of global signifi cance. The eastern region forms part of the Maputaland Centre of Plant Diversity, known for its fl oral and faunal species richness and endemism. To the west, lies the Drakensberg Escarpment Endemic Bird Area.
Land degradation and pollution due to agriculture and the recent explosion of invasive
non-native plants such as eucalyptus and triffi d weed are the greatest threats to Swaziland’s biodiversity. Non-native plant species have crowded out indigenous competitors, reducing biodiversity and even impacting agricultural productivity. In 2005, the Swazi government declared invasive alien species a national disaster and committed US$1.4 million to their eradication.
Threats to Biodiversity and Invasive Alien Species Fl
ick
r.co
m
Flic
kr.
com
F
act
: e
art
htr
en
ds.
wri
.org
(2
00
7)
Thou
sand
Hec
tare
s
Sugar Production, Area Harvested
0
10
20
30
40
50
1963 1973 1983 1993 2003
Irrigated Agriculture (%)
Source: FAOSTAT
Source: AQUASTAT
0%
10%
20%
30%
40%
1963 1973 1983 1993 2003Sub-Saharan Africa Swaziland
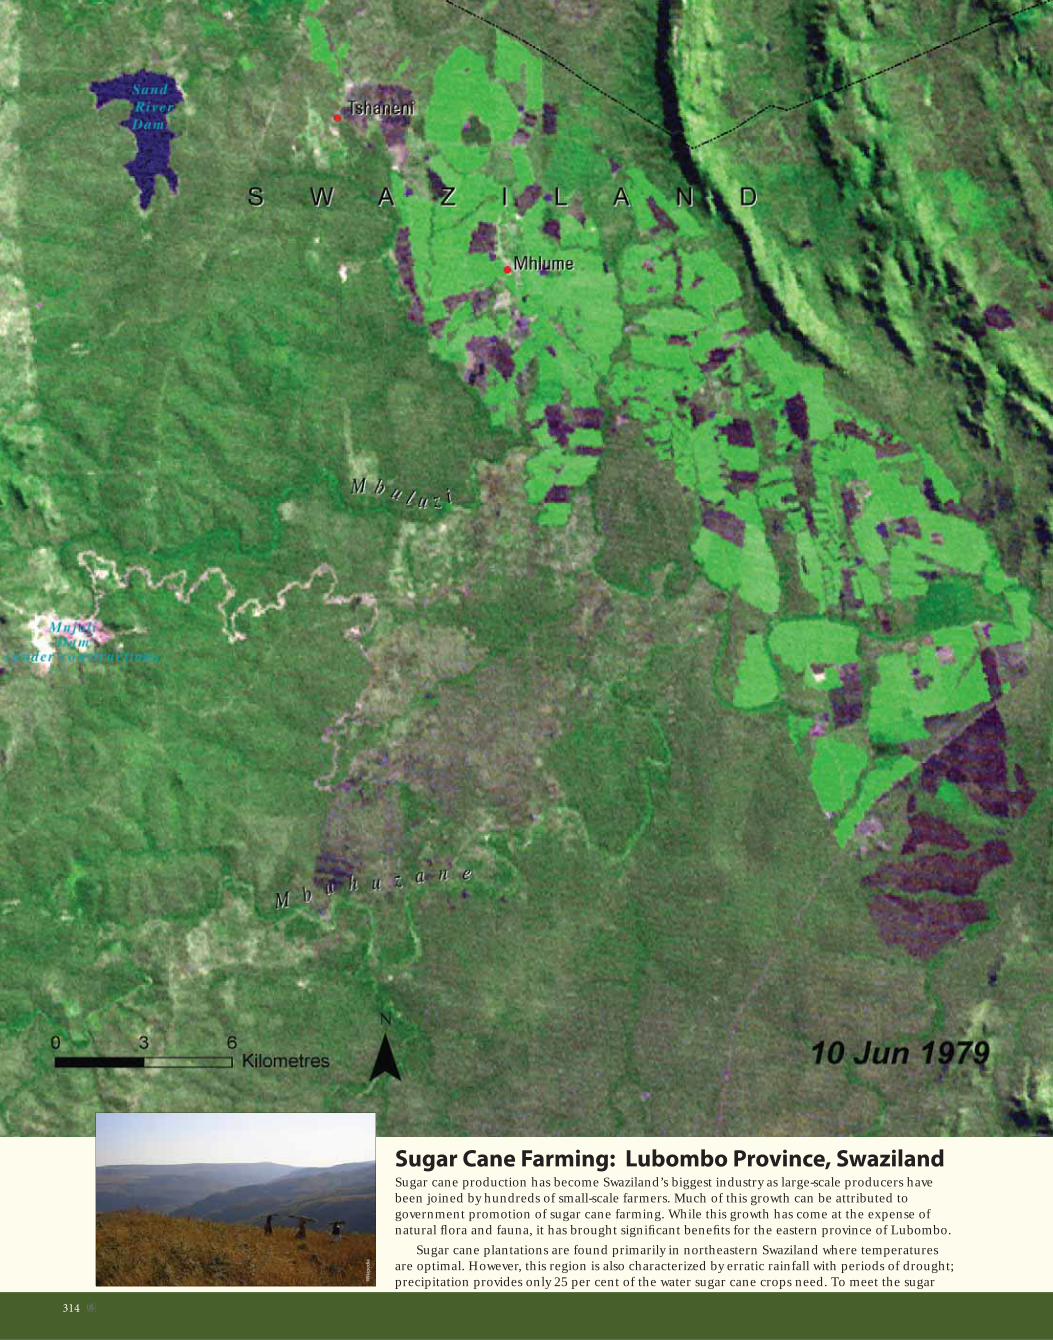
314 �
Sugar Cane Farming: Lubombo Province, SwazilandSugar cane production has become Swaziland’s biggest industry as large-scale producers have been joined by hundreds of small-scale farmers. Much of this growth can be attributed to government promotion of sugar cane farming. While this growth has come at the expense of natural fl ora and fauna, it has brought signifi cant benefi ts for the eastern province of Lubombo.
Sugar cane plantations are found primarily in northeastern Swaziland where temperatures are optimal. However, this region is also characterized by erratic rainfall with periods of drought; precipitation provides only 25 per cent of the water sugar cane crops need. To meet the sugar W
ikip
ed
ia

315�
cane industry’s remaining water requirements, several dams have been constructed along major rivers, including the Sand River and Mnjoli Dams. These satellite images, from 1979 and 2006, show the dams and how the area devoted to sugar cane plantations has increased over time.
Sugar cane exports bring in roughly US$1 500 million annually to Swaziland. Lubombo Province, in particular, relies heavily on income from sugar cane as well as social services that the industry provides, including medical care, education, housing, and access to clean water. Yet fl uctuating sugar prices have prompted the Swazi government to promote the production of other crops. Such a transition, however, is far easier for small-scale farmers than for large-scale producers with extensive plantations.
2 image mosaic

316 �
Progress Towards Environmental SustainabilityAs defi ned by the United Nations Millennium Development Goal 7 Indicators
Land area covered by forest, percentageCarbon dioxide (CO
2) emissions,
metric tonnes per capita
Protected area to total surface
area, percentage
Proportion of total population using improved drinking
water sources and sanitation facilities, percentage
Water Sanitation
Slum population as percentage
of urban
United Republic of Tanzania is
named after its two principal
regions—the large mainland
section of Tanganyika and the
Zanzibar islands located off its
coast. The country is surrounded
by several large bodies of water, including 1 300 km of coastline
on the Indian Ocean and 2 375 km of shoreline along Africa’s
three largest lakes; Tanganyika, Victoria, and Malawi (Nyasa)
(FAO 2005). Lake Tanganyika, which spans United Republic of
Tanzania’s western border with Democratic Republic of the
Congo, is the deepest lake in Africa (Tanzania National Bureau of
Statistics 2005).
United Republic of
Tanzania
With large numbers of zebra and gazelle and millions of wildebeest,
Serengeti National Park is unequalled for its natural beauty and
scientifi c value.
Important Environmental Issues
• Water Pollution and Aquatic Ecosystems
• Land Degradation and Deforestation
• Threats to Biodiversity and Ecosystems
Total Surface Area: 945 087 km2
Estimated Population in 2006: 39 025 000
Even though United Republic of Tanzania lost 14.4 per cent of its forest and woodland area between 1983 and 1993, the country is now ex-periencing a remarkable increase in its forested area. Much of United Republic of Tanzania’s environment is protected by a system of national parks. Four of these—Serengeti National Park, Ngorongoro Conservation Area, Kilimanjaro National Park, and Selous Game Reserve —are World Heritage Sites.
Indicates progress★
★ ★★
1990 20052000
46.9
42.2
39.9
30
32
34
36
38
40
42
44
46
48
1990 20042004 1990
46
62
47 47
0
10
20
30
40
50
60
70
99.1
92.1
88
90
92
94
96
98
100
20011990
glc
om
.co
m (
n.d
)
1990 20042000
0.0916
0.0783
0.1160
0
0.02
0.04
0.06
0.08
0.1
0.12
0.14
0.16
0.18
0.2
1990 20052000
38
38.4 38.4
37.8
37.9
38
38.1
38.2
38.3
38.4
38.5
Cre
dit
: © F
lag
art
.co
m

317�
An
na
Pe
tts
/Flic
kr.
com
5 895Uhuru Point in Mount
Kilimanjaro is Africa’s
highest point at
The three largest lakes in Africa—Lake Victoria, Lake Tanganyika, and Lake Malawi (Nyasa)—cover roughly 5.7 per cent of United Republic of Tanzania’s total surface area (FAO 2005). Incredibly rich in biodiversity, the lakes are estimated to contain a total of 1 100 endemic fi sh species (Froese and Pauly 2007). However, pollution from agriculture, industry, mining, and households is threatening the country’s water resources. Although the level of industrialisation is low in United Republic of Tanzania,untreated industrial waste causes signifi cant levels of localised pollution. About 80 per cent of the industries, including agro-chemical and chemical industries, breweries and steel manufacturing industries, are located in the coastal Dar es Salaam. It has been estimated
that almost 70 per cent of the industries directly or indirectly pollute the Indian Ocean (Mgana and Mahongo 2002). Besides damaging aquatic ecosystems, this pollution also leads to higher incidence of water-borne diseases.
Water Pollution and Aquatic Ecosystems
Flic
kr.
com
F
act
: u
ne
p-w
cmc.
org
(n
.d)
Currently, 25 per cent of land in United Republic of Tanzania is considered severely degraded (FAO
AGL 2003), and unsustainable farming practices, overgrazing, and deforestation continue to remove vegetation and sap soil fertility. Despite the creation of large tracts of protected lands and innovative community-based forest conservation projects, United Republic of Tanzania had the third-largest net loss of forest area in Africa (and the sixth largest in the world) between 2000 and 2005 (FAO 2005b). Primary drivers of deforestation include logging for domestic use and export, agricultural conversion, and demand for fuelwood (Tanzania National Bureau of Statistics 2005).
Land Degradation and Deforestation
Serengeti National Park is the fl agship of United Republic of Tanzania’s tourism industry and its ecological and cultural distinction has been recognized by both the World Heritage Commission and the Man and the Biosphere Program. Covering 1.5 million hectares of savannah (UNESCO 2007), the park is famous for the vast herds of wildebeest, gazelles, and zebras that undertake a long and arduous migration to fresh grazing lands each year.
In addition to its terrestrial biodiversity, United Republic of Tanzania’s coral reefs are the second largest in Africa, occupying 3 580 km2 (Spalding and others 2001) along its coast and nearby islands. The reefs are estimated to contain over 150 coral species (CORDIO 2005), which provide habitat
for a host of other aquatic organisms. This rich ecosystem is endangered by over-fi shing and anchor damage, increased sedimentation from agriculture and deforestation, and water pollution.
Threats to Biodiversity and Ecosystems
metres
Kilo
gram
s of
Org
anic
P
ollu
tion
Per
Day
Industrial Water Pollution
0
10 000
20 000
30 000
40 000
1980 1985 1990 1995
Mill
ion
Cub
ic M
etre
s
Forestry Production
0
6
12
18
24
1965 1975 1985 1995 2005industrial roundwood wood fuel
Per
cen
t of C
ount
ry A
rea
Protected Area
0%5%
10%15%20%25%30%35%40%45%
1990 1995 2000 2005Tanzania Sub-Saharan Africa
Source: Earth Trends (from World Development Indicators)
Source: FAOSTAT
Source: MDG Indicators

318 �
Invasive Plants: Lake Jipe, United Republic of TanzaniaLake Jipe, along United Republic of Tanzania’s border with Kenya, is an important source of the Pangani River. As much of 75 per cent of the lake is infested by invasive aquatic plants, particularly cattails (Typha domingensis) and papyrus, or bulrush (Cyperus papyrus).
The bright green areas at the waters edge in the 1975 and 2005 images show these invasive plants covering parts of Lake Jipe. Coverage in 2005 is notably more extensive, especially at the northern end of the lake. The greyish patch there is evidence that the lake is actually drying up. Research in-dicates that if current conditions continue, the lake may dry up completely within the next ten years. W
ikip
ed
ia

319�
The situation in Lake Jipe is the result of a vicious cycle. Drought reduces water levels in the lake, creating conditions in which the invasive plants fl ourish. The plants, in turn, encourage siltation and help draw down water levels even further.
The Pangani River Basin provides water for hydroelectric power plants at Nyumba ya Mungu and Pangani Falls, which provide at least 20 per cent of United Republic of Tanzania’s electricity. Increasingly low water levels in Lake Jipe and elsewhere have the potential to reduce power production. Low water levels have already affected the local fi shing industry, forcing fi shermen to move south to the Nyumba ya Mungu Dam. Projected water scarcity may also impact wildlife in Kenya’s Tsavo National Park.

320 �
Mount Kilimanjaro: United Republic of TanzaniaGlaciers on the summit of Mount Kilimanjaro have decreased in area by 80 per cent since the early 20th century. While glacial retreat globally has been linked with rising air temperatures, there is evidence that the decline of Kilimanjaro’s glaciers (see inset, above right), along with changes in the boundaries of vegetation zones on the mountain, may be due in large part to a more local trend of decreasing precipitation that began in the 1880s.
Luk
as
Ro
hr/
Flic
kr.
com

321�
It has also been found that water from the melting of Mount Kilimanjaro’s glaciers provide little, if any, water to lower elevation streams, as most ice is lost through sublimation; water from the small amount of melting evaporates very quickly. A greater impact on the mountain’s hydrology may result from increased burning under the drier conditions since 1880. The upper limit of the forest zone has descended signifi cantly, as nearly 15 per cent of Kilimanjaro’s forest cover has been destroyed by fi re since 1976. In the 1976 image above, the upper limit of the Erica excelsa forest is shown in yellow. By 2000 the upper limit had moved noticeably downslope (red line) as a result of frequent fi res. Changes in the hydrological and ecological functioning of Kilimanjaro impact a growing population living on and around the mountain.
See Inset
Inset
2 image mosaic

322 �
Progress Towards Environmental SustainabilityAs defi ned by the United Nations Millennium Development Goal 7 Indicators
Land area covered by forest, percentageCarbon dioxide (CO
2) emissions,
metric tonnes per capita
Protected area to total surface
area, percentage
Proportion of total population using improved drinking
water sources and sanitation facilities, percentage
Water Sanitation
Slum population as percentage
of urban
Nearly half of Togo’s land is considered arable, making it one of
only two countries in Africa with more than 40 per cent of its land
suitable for farming.
Togolese RepublicTogo is a relatively small
country, but its long, narrow
shape allows it to span
several unique geographic
and climatic zones. Half
of the population lives
in the coastal region, where the climate is tropical and
the landscape is dominated by extensive lagoons and
marshes. The semi-arid north is characterised by savannah
vegetation and is vulnerable to drought.
Important Environmental Issues• Land Degradation and Deforestation
• Threats to Aquatic Ecosystems
• Threats to Biodiversity
Total Surface Area: 56 785 km2
Estimated Population in 2006: 6 306 000
Although much of the Togo once was forested, slash-and-burn agriculture and the cutting of wood for fuel have depleted the forest, resulting in the country now having to import wood. Soil and water are threatened by pesticides and fertilizers. The government has taken steps to protect the nation’s environment, however, through a comprehensive legislative package.
★ Indicates progress
Cre
dit
: © F
lag
art
.co
m
12.6
8.9
7.1
0
2
4
6
8
10
12
14
1990 20052000
0.1898
0.3013
0.3805
0
0.2
0.4
0.6
0.8
1
1990 20042000
11.2 11.2 11.2
0
2
4
6
8
10
12
1990 20052000
5052
3735
0
10
20
30
40
50
60
1990 20042004 1990
80.9 80.6
0
10
20
30
40
50
60
70
80
90
100
20011990
★ ★
fao
.org
(2
00
6)

323�
Over half of the total land area in Togo is heavily degraded (FAO AGL 2003). Causes include reductions in fallowing intervals, intensive harvesting of forest resources, and overgrazing. These trends are exacerbated by the country’s high population density and the fact that nearly 80 per cent of potentially arable land is already being utilised (FAO 2005).
Forests once covered large areas of Togo, but they now occupy only seven per cent of the country (UN 2007). Forests continue to disappear at a high rate in Africa, causing remaining forest cover to decline by nearly 50 per cent between 1990 and 2005 (UN 2007). Slash-and-burn agriculture and
the use of forest products for fuel are the major drivers of deforestation.
Land Degradation and Deforestation
million metric tonnes of phosphate
are produced in Togo annually,
making it the fi fth-largest producer
in the world3.5
Naturally poor soils and agricultural mismanagement have necessitated intensive use of fertilizers, pesticides, and other chemical inputs on farms. Resulting pollution threatens Togo’s aquatic environments, which include rivers, lakes, and ocean ecosystems, which harbour over 1 000 aquatic animal species (CBD 2003). Overfi shing is another threat to aquatic biodiversity, particularly in the marine sector. Evidence of over-exploitation includes reduced yields and the disappearance of certain species.
Threats to Aquatic Ecosystems
Togo is one of the smallest countries in West Africa, but its diverse ecosystems create a land rich in biodiversity. Some 3 472 animal species inhabit the country, including the African elephant, Diana monkey, and West African manatee (CBD 2003).
Protected areas comprise 11.2 per cent of total land area (UN 2007) but are under constant threat from agriculture, poaching, and insuffi cient institutional and legal enforcement. To address these problems, reserves such as the Missahoè Forest have sought local community involvement to restore and sustainably manage protected lands.
Threats to Biodiversity
Flic
kr.
com
Fa
ct:
Gn
an
di a
nd
oth
ers
(2
00
6)
Flic
kr.
com
Per
cen
t of P
oten
tially
C
ultiv
atab
le L
and
Cultivated Land
0%
20%
40%
60%
80%
1963 1973 1983 1993 2003
Tonn
es
Fisheries Production
0
5 000
10 000
15 000
20 000
25 000
1955 1965 1975 1985 1995 2005freshwater marine
Number Threatened
Threatened Species
0 5 10 15 20
Birds
Reptiles
Amphibians
Mammals
Plants
Fishes
Source: AQUASTAT and FAOSTAT
Source: FISHSTAT
Source: IUCN Red List

324 �
Nangbéto Hydroelectric Dam: Togolese RepublicA feasibility study in the 1960s identifi ed the Nangbéto region as the best location for hydroelectric power development in Togo. The site—160 km upstream from the coast—is the only place where a dam of suffi cient volume to regulate the fl ow of the Mono River was possible. As demand for electricity grew, the decision was made in the 1980s to proceed with the Nangbéto Hydroelectric Dam.
Satellite images from 1986 and 2001 show the region before and after the dam’s construction. The completed dam created a reservoir with a surface area of approximately 180 W
ikip
ed
ia

325�
km2 and a volume of 1 465 million m3. In addition to generating electricity for domestic and commercial use, the dam also provides water for agricultural irrigation and is a source of commercial fi shing and tourism. However, these benefi ts have been offset by environmental costs.
Construction of the dam, creation of the reservoir, and installation of transmission lines resulted in the loss of nearly 150 km2 of savannahs and gallery-forests that provided habitat for rare local fauna. The reservoir submerged 1 285 households and 5 500 hectares of agricultural land. Loss of the natural vegetation in the region has altered the climate enough to have had a negative impact on nearly 350 hectares of banana plantations. The creation of the reservoir has also increased the population of two species of aquatic snails that serve as intermediate hosts of the parasite that causes the disease bilharzia.

326 �
Progress Towards Environmental SustainabilityAs defi ned by the United Nations Millennium Development Goal 7 Indicators
Land area covered by forest, percentageCarbon dioxide (CO
2) emissions,
metric tonnes per capita
Protected area to total surface
area, percentage
Proportion of total population using improved drinking
water sources and sanitation facilities, percentage
Water Sanitation
Slum population as percentage
of urban
Republic of
Tunisia
Tunisia’s Cape Blanc (Ra’s al Abyad) is the northernmost
tip of Africa.
Tunisia is a small country with
a relatively long coast sculpted
by many natural harbours
and inlets. The Atlas Mountain
range extends into northern
Tunisia and reaches altitudes of
1 500 m. The temperate and hilly regions surrounding these
mountains have fertile soils, although irregular rainfall leads
to periodic drought. The semi-arid central region merges into
the Sahara Desert at the southern tip of the country.
Important Environmental Issues• Land Degradation and Desertifi cation
• Water Scarcity
• Air and Water Pollution
Total Surface Area: 163 610 km2
Estimated Population in 2006: 10 210 000
Cre
dit
: © F
lag
art
.co
m
★ Indicates progress
Loss of agricultural land to erosion, which threatens 76 per cent of Tunisia’s land area, and degradation of range and forest lands because of overgrazing or overcutting of timber for fuel, are major concerns. Also, pollution from industry and farming activities threatens the nation’s limited water supply. Forested lands cover about 510 000 hectares, a large proportion of which is state owned. This may be the reason for a gradual increase in forested area.
4.1
6.2
6.8
0
1
2
3
4
5
6
7
8
1990 20052000
1.6144
2.06212.2895
0
1
2
3
4
5
1990 20042000
1.21.3 1.3
0
0.2
0.4
0.6
0.8
1
1.2
1.4
1.6
1.8
2
1990 20052000
81
93
75
85
0
10
20
30
40
50
60
70
80
90
100
1990 20042004 1990
9.0
3.7
0.0
1.0
2.0
3.0
4.0
5.0
6.0
7.0
8.0
9.0
10.0
20011990
★
★ ★ ★★
fao
.org
/ge
on
etw
ork
(n
.d)
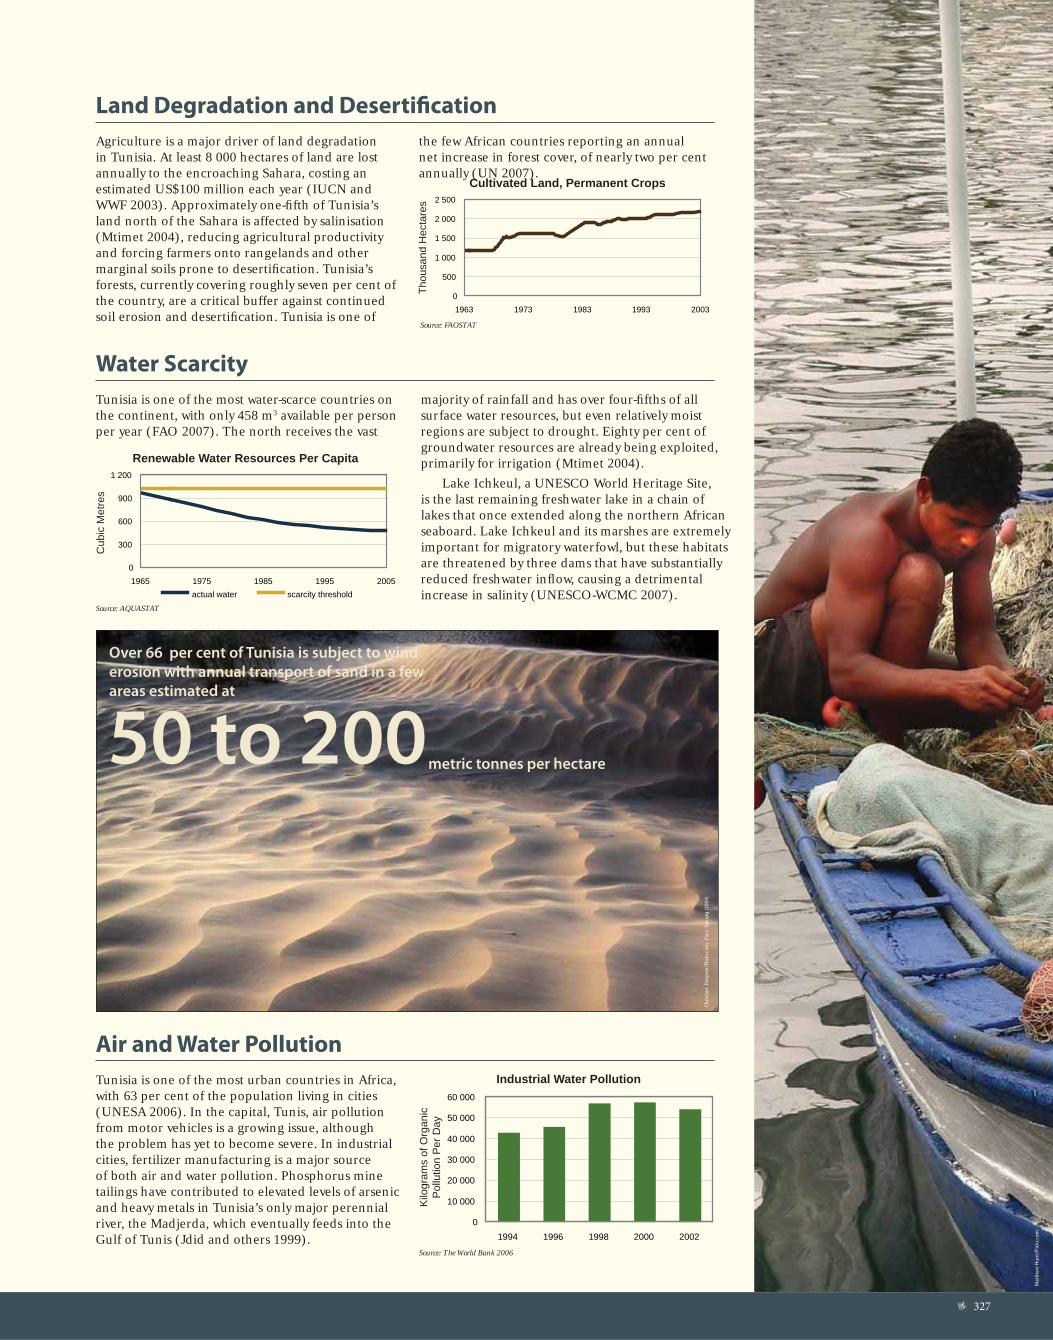
327�
Over 66 per cent of Tunisia is subject to wind
erosion with annual transport of sand in a few
areas estimated at
50 to 200C
hri
stia
n D
esy
ne
r/Fl
ick
r.co
m
Fact
: fa
o.o
rg (
20
04
)
Mat
the
w H
un
t/Fl
ick
r.co
m
Agriculture is a major driver of land degradation in Tunisia. At least 8 000 hectares of land are lost annually to the encroaching Sahara, costing an estimated US$100 million each year (IUCN and WWF 2003). Approximately one-fi fth of Tunisia’s land north of the Sahara is affected by salinisation (Mtimet 2004), reducing agricultural productivity and forcing farmers onto rangelands and other marginal soils prone to desertifi cation. Tunisia’s forests, currently covering roughly seven per cent of the country, are a critical buffer against continued soil erosion and desertifi cation. Tunisia is one of
the few African countries reporting an annual net increase in forest cover, of nearly two per cent annually (UN 2007).
Land Degradation and Desertifi cation
Tunisia is one of the most water-scarce countries on the continent, with only 458 m3 available per person per year (FAO 2007). The north receives the vast
majority of rainfall and has over four-fi fths of all surface water resources, but even relatively moist regions are subject to drought. Eighty per cent of groundwater resources are already being exploited, primarily for irrigation (Mtimet 2004).
Lake Ichkeul, a UNESCO World Heritage Site, is the last remaining freshwater lake in a chain of lakes that once extended along the northern African seaboard. Lake Ichkeul and its marshes are extremely important for migratory waterfowl, but these habitats are threatened by three dams that have substantially reduced freshwater infl ow, causing a detrimental increase in salinity (UNESCO-WCMC 2007).
Water Scarcity
Tunisia is one of the most urban countries in Africa, with 63 per cent of the population living in cities (UNESA 2006). In the capital, Tunis, air pollution from motor vehicles is a growing issue, although the problem has yet to become severe. In industrial cities, fertilizer manufacturing is a major source of both air and water pollution. Phosphorus mine tailings have contributed to elevated levels of arsenic and heavy metals in Tunisia’s only major perennial river, the Madjerda, which eventually feeds into the Gulf of Tunis (Jdid and others 1999).
Air and Water Pollution
Thou
sand
Hec
tare
s
Cultivated Land, Permanent Crops
0
500
1 000
1 500
2 000
2 500
1963 1973 1983 1993 2003
Cub
ic M
etre
s
Renewable Water Resources Per Capita
0
300
600
900
1 200
1965 1975 1985 1995 2005actual water scarcity threshold
Kilo
gram
s of
Org
anic
P
ollu
tion
Per
Day
Industrial Water Pollution
0
10 000
20 000
30 000
40 000
50 000
60 000
1994 1996 1998 2000 2002
metric tonnes per hectare
Source: FAOSTAT
Source: AQUASTAT
Source: The World Bank 2006

328 �
Changes in Lake Ichkeul: TunisiaIchkeul National Park includes Lake Ichkeul and surrounding wetlands that form an important wintering and breeding area for migratory birds. It has been designated as a UNESCO Biosphere Reserve and a Ramsar Wetland of International Importance. Lake Ichkeul is fed by seven small rivers but is considered a lagoon because of its connection with the sea via Lake Bizerte (1987 image). During the wet season, Ichkeul fi lls with fresh water from these rivers. During the dry season, the lake’s water level falls, allowing an infl ux of saltwater from Lake Bizerte. These
Wik
ipe
dia

329�
alternating conditions create an ideal environment for Potamogeton pectinatus (yellow arrows)—a pondweed and principal food source of migratory birds and waterfowl.
Construction of three dams along rivers that feed Lake Ichkeul modifi ed this fragile ecosystem by decreasing freshwater infl ow and increasing salinity during the dry seasons of 1977, 2001, and 2002. Two periods of drought (1993-1995 and 2001-2002) aggravated this trend, leading to a total disappearance of Potamogeton pectinatus from 1994 to 2002. In 2002, a mere 10 000 migratory birds came to Lake Ichkeul, the lowest numbers ever recorded.
The Tunisian government responded by increasing water releases from the dams. Helped by favorable rainfall conditions, the Potamogeton pectinatus started to recover in 2003, reaching 70 km2 in 2006 (2005 and 2007 images). Concurrently, migratory birds began returning. In 2004/2005 their numbers had climbed to 30 000.

330 �
Habitat Regeneration: Sidi Toui National Park, Tunisia The semi-arid Sahelian grassland and scrub of southern Tunisia has been profoundly altered by human activities during the last century. Located on the northern fringe of the Sahara Desert, this ecosystem is susceptible to erosion and desertifi cation brought on by droughts, overgrazing, and agriculture. In 1993, Sidi Toui National Park was established. Within the bounds of this protected area, natural vegetation began to return. The 1987 image shows the barren condition of the region before the park was created. In the 2006, image the outline of the park, which is protected from
Jud
ith
An
en
be
rg

331�
the effects of grazing cattle, contrasts markedly with the surrounding landscape. Protection substantially increased the vegetation density and species diversity, particularly of the grasses.
The Scimitar-horned oryx (Oryx dammah) and fi ve other species of gazelles and antelope native to this area had been brought to near extinction by lack of habitat and overhunting throughout the 20th century. Classifi ed as criti-cally endangered in 1996, a small population of Scimitar-horned oryx was introduced into Sidi Toui Park in 1999. If the population inside the park thrives, it may enable future reintroductions of Scimitar-horned oryx elsewhere, Sidi Toui also provides habitat for several native species of antelope, as well as a variety of birds species.

“Os ea con ute ex euguer si. Ugue commy nulla faccum zzrit
vulluptat. Ut alismod modo do eros amcommy nis nim ipisciduis
dolut acinciduis nullandit dolum quatis.”332 �
Progress Towards Environmental SustainabilityAs defi ned by the United Nations Millennium Development Goal 7 Indicators
Land area covered by forest, percentage
Protected area to total surface
area, percentage
Proportion of total population using improved drinking
water sources and sanitation facilities, percentage
Water Sanitation
Uganda is home to over half of the World’s 720 remaining Mountain
Gorilla’s (Gorilla beringei beringei). Most of them live in Uganda’s
Bwindi Impenetrable National Park.
332 �
About half of the forested area in Uganda is savannah woodland. Uganda’s economy is predominantly agrarian and one-third of the land area is under cultivation. Even wetlands are being drained for agricultural use. Major environmental problems in Uganda include overgrazing, deforestation, and agricultural expansion, all of which lead to soil erosion.
★ ★★
★ Indicates progress
Uganda is a land-locked country that
borders Lake Victoria, the second-
largest freshwater lake in the world.
Most of the country is fertile and
well-watered, with many natural lakes
and rivers. Generally, the climate is tropical with one to two
thousand millimetre of rain falling annually in two rainy
seasons, although roughly seven per cent of the country is
classifi ed as arid or semi-arid.
Important Environmental Issues• Land Degradation and Deforestation
• Habitat Degradation and Threats to Biodiversity
• Water Availability and Pollution
Total Surface Area: 241 038 km2
Estimated Population in 2006: 29 857 000
Republic of
Uganda
★
scie
nce
da
ily.c
om
(2
00
7)
Cre
dit
: © F
lag
art
.co
m
25
20.618.4
0
5
10
15
20
25
30
1990 20052000
0.0456
0.0618 0.0651
0
0.01
0.02
0.03
0.04
0.05
0.06
0.07
1990 20042000
Carbon dioxide emissions (CO2),
metric tonnes per capita
1990 20052000
25.626.3 26.3
20
21
22
23
24
25
26
27
28
44
60
0
10
20
30
40
50
60
70
1990 20042004 1990
42 43
1990 2001
93.8
93
90
91
92
93
94
95
96
Slum population as percentage
of urban

Uganda is home to diverse plant and animal species, refl ecting its high variability of landscapes and ecosystems. Threats to biodiversity include poaching, deforestation, conversion and pollution of wetlands, and invasive species.
Bwindi Impenetrable National Park, a UNESCO World Heritage Site, is one of the largest and most biologically rich natural forests in East Africa. Covering 33 000 hectares, it contains over 350 species of birds, 120 species of mammals (including 14 primate species), 200 species of butterfl ies, and half of the world’s remaining 700 mountain gorillas (UNESCO 2007).
Flic
kr.
com
13%Proportion of
Uganda covered
by wetlands
Flic
kr.
com
Fa
ct:
un
esc
o.o
rg (
n.d
)
333�
Seventy-one per cent of Uganda’s land area is potentially arable, the largest proportion of any East African country. However, rapid rural population growth, lack of access to improved inputs, overgrazing, and conversion of forests for agriculture have resulted in signifi cant land degradation. Forests are also threatened by harvesting of wood for fuel; over 95 per cent of the population relies on fuelwood as a primary source of energy (WHO 2006). Resulting soil erosion now accounts for over 80 per cent of the total cost of all environmental degradation in Uganda (SoE 2000/2001). In the worst affected districts, over 80 per cent of soil is considered to be severely degraded.
Land Degradation and Deforestation
Habitat Degradation and Threats to Biodiversity
Fresh water accounts for over 15 per cent of Uganda’s surface area (FAO 2005). However, rapidly rising demand, uneven distribution of water resources, and pollution have placed Uganda in a state of water stress, with less than 1 500 m3 of water available per person per year (FAO 2007). Water from available sources principally affected by pollution from residential, industrial, and agricultural discharges into open water bodies is also an area of concern.
Water Availability and Pollution
1960 1995/98 % Loss
Antelope 141 300 41 300 70%
Elephant 25 000 1 900 92%
Rhinocerous 600 0 100%
Hippopotamus 26 000 4 000 85%
Rothschild’s giraff e 2 500 200 92%
Buff alo 60 000 18 000 70%
Source: State of Environment Report for Uganda 2000/2001
Hec
tare
sArable Land Per Capita
0
0.1
0.2
0.3
0.4
0.5
0.6
1963 1973 1983 1993 2003
Cub
ic M
etre
s
Renewable Water Resources Per Capita
0
1 000
2 000
3 000
4 000
5 000
1965 1975 1985 1995 2005actual water scarcity threshold
Source: FAOSTAT
Source: AQUASTAT
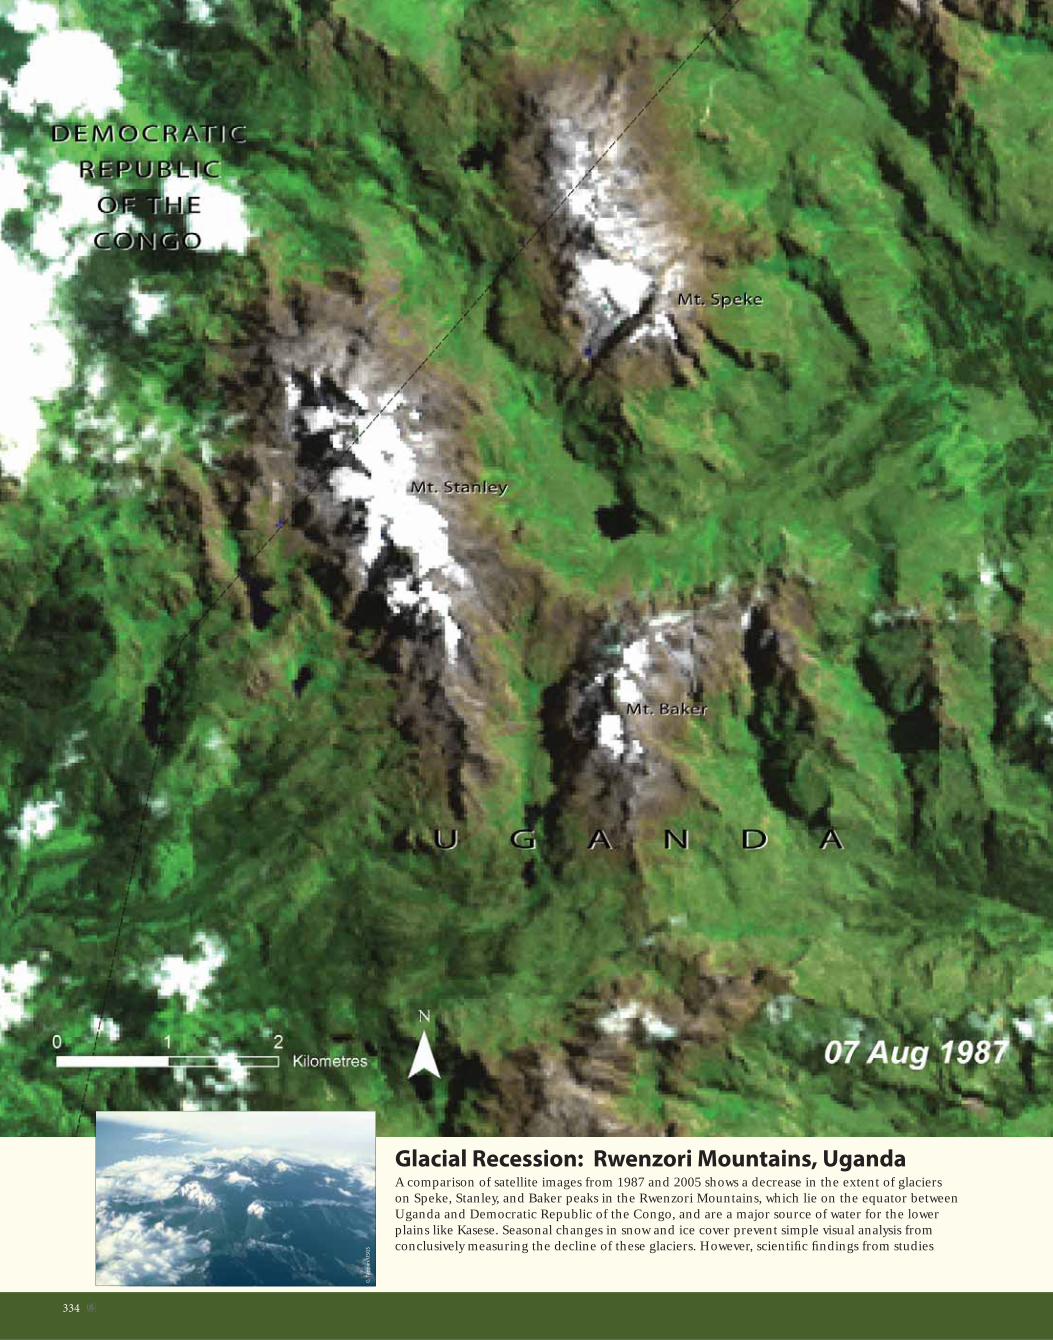
334 �
Glacial Recession: Rwenzori Mountains, UgandaA comparison of satellite images from 1987 and 2005 shows a decrease in the extent of glaciers on Speke, Stanley, and Baker peaks in the Rwenzori Mountains, which lie on the equator between Uganda and Democratic Republic of the Congo, and are a major source of water for the lower plains like Kasese. Seasonal changes in snow and ice cover prevent simple visual analysis from conclusively measuring the decline of these glaciers. However, scientifi c fi ndings from studies
G. T
ap
pa
n/U
SG
S

335�
in 2003 and 2006 show that the glaciers at the tops of the Rwenzori Mountains are rapidly receding. The glaciers declined by 50 per cent between 1987 and 2003.
This glacial recession is generally attributed to increased air temperature and decreased snow accumulation during the 20th century. It has recently been suggested that decreasing cloud cover during that same time period has contributed to a higher rate of sublimation (vaporisation of ice without melting) of these glaciers as well.
A century ago the glaciers of the Rwenzori Mountains covered nearly 6.5 km2. If the glaciers continue to recede, as they have since 1906, researchers estimate they will be gone in the next 20 years.

336 �
Secondary Forest Growth: Mabira Forest, UgandaMabira Forest, located in one of the Uganda’s most densely populated districts, is the country’s only protected area of medium-altitude, moist, semi-deciduous forest. The forest contains a wealth of biodiversity, provides a variety of services to local inhabitants, and is important to the area’s hydrology. The forest is under intense pressure from timber harvesting, charcoal produc-tion, fuelwood collection, and agricultural encroachment.
A 1989 study estimated that 29 per cent of Mabira Forest was lost between 1973 and 1988. The report also noted a signifi cant increase in ecological disturbance in the areas of forest that ©
Ma
tth
ew
Be
rry
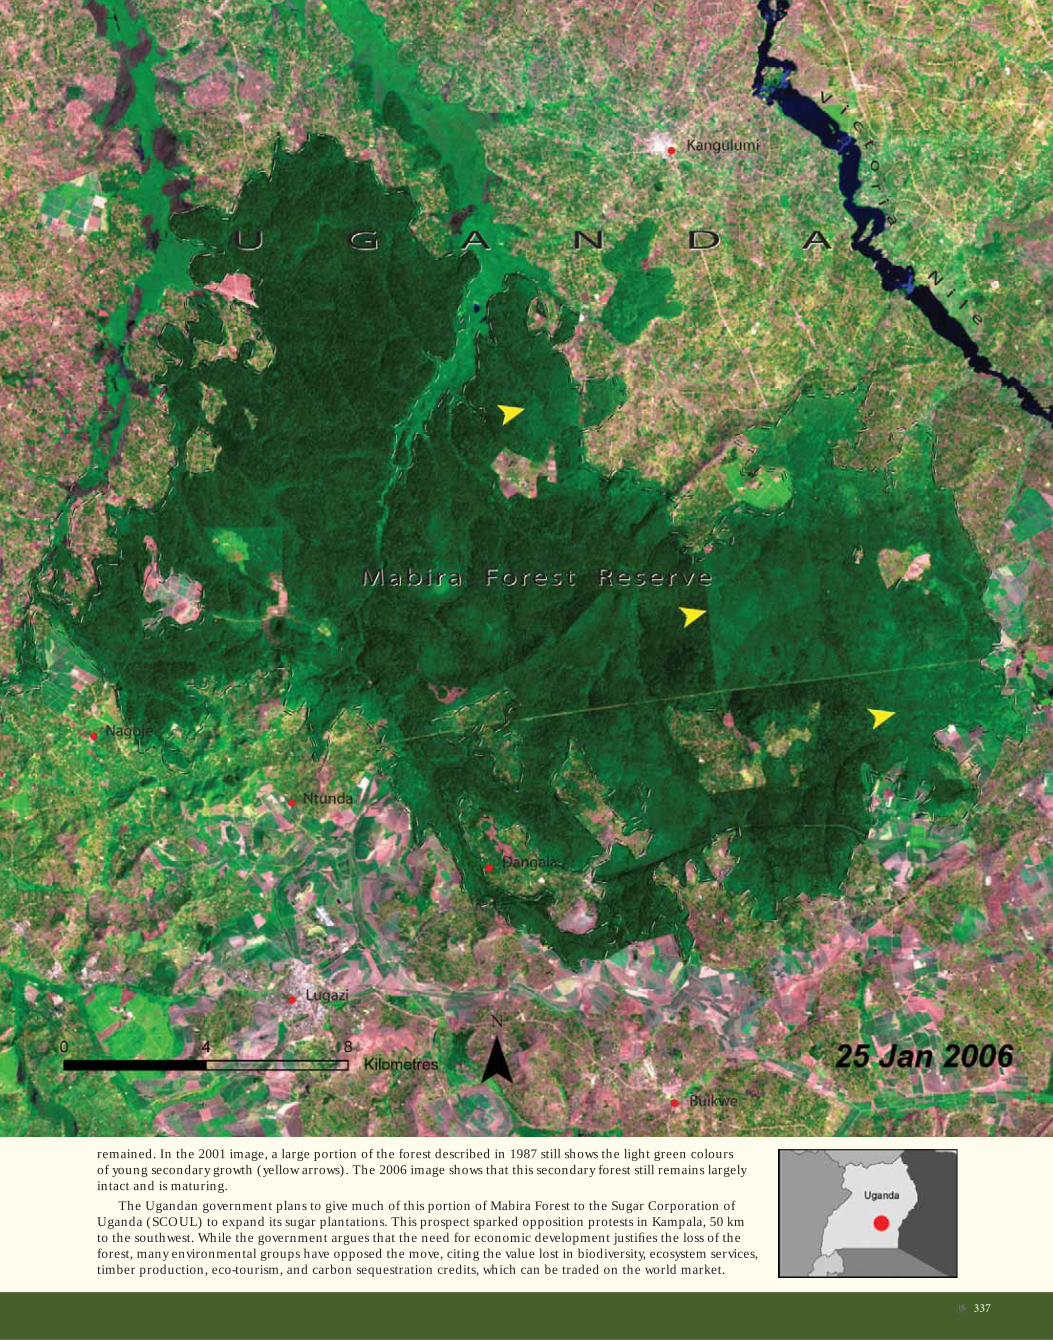
337�
remained. In the 2001 image, a large portion of the forest described in 1987 still shows the light green colours of young secondary growth (yellow arrows). The 2006 image shows that this secondary forest still remains largely intact and is maturing.
The Ugandan government plans to give much of this portion of Mabira Forest to the Sugar Corporation of Uganda (SCOUL) to expand its sugar plantations. This prospect sparked opposition protests in Kampala, 50 km to the southwest. While the government argues that the need for economic development justifi es the loss of the forest, many environmental groups have opposed the move, citing the value lost in biodiversity, ecosystem services, timber production, eco-tourism, and carbon sequestration credits, which can be traded on the world market.

338 �
Progress Towards Environmental SustainabilityAs defi ned by the United Nations Millennium Development Goal 7 Indicators
Land area covered by forest, percentageCarbon dioxide (CO
2) emissions,
metric tonnes per capita
Protected area to total surface
area, percentage
Proportion of total population using improved drinking
water sources and sanitation facilities, percentage
Water Sanitation
Slum population as percentage
of urban
Non-Self-Governing Territory of
Western Sahara
Western Sahara contains one of world’s richest phosphate
deposits. Saharan phosphate is mineral rich and is of great
importance for use as fertilizer.
Western Sahara, a non-self-governing territory in Africa,
is highly arid with a long Atlantic coastline. The terrain is
mostly low, fl at desert with a few small mountains rising
in the south and northeast. The territory as a whole is
one of the least densely populated areas in Africa with
less than two inhabitants per square kilometre. Over
90 per cent of the population is concentrated in urban
areas (UNESA 2006). Natural resources on land are
limited to phosphate and iron-ore deposits but there
are rich off shore fi sheries.
★ Indicates progress
As in all semi-arid and arid regions, annual rain-fall in Western Sahara is highly variable, with av-erage rainfall ranging from about 20 mm to just over 50 mm per year. Sparse water and lack of ar-able land largely limits crops in Western Sahara to fruits and vegetables that can be grown in the territory’s few oases. Ninety-four per cent of the population lives in urban areas. Western Sahara has one of the continent’s highest urbanisation rates, at 96 per cent.
3.8 3.8 3.8
0
0.5
1
1.5
2
2.5
3
3.5
4
1990 20052000
0.8967
0.7558
0.5726
0
0.1
0.2
0.3
0.4
0.5
0.6
0.7
0.8
0.9
1
1990 20052000
7.1 7.1 7.1
0
1
2
3
4
5
6
7
8
1990 20052000
0
0.1
0.2
0.3
0.4
0.5
0.6
0.7
0.8
0.9
1
N/A N/A N/A N/A
1990 20052000 1990 0
0.1
0.2
0.3
0.4
0.5
0.6
0.7
0.8
0.9
1
N/A N/A
20052000
Important Environmental Issues• Land Use and Food Production
• Water Resources
• Marine Fisheries
Total Surface Area: 266 000 km2
Estimated Population in 2006: 356 000
★
No
Data
Available
No
Data
Available
rich
ard
kn
igh
t.h
om
est
ea
d.c
om
revo
luti
on
ary
de
mo
cra
cy.o
rg

339�
Western Sahara has a hyper-arid climate and lacks suffi cient and reliable rainfall for agriculture. Crops occupy only 5 000 hectares of land, which is less than half of one per cent of the total surface area (FAO 2006). As a result, most food must be imported to meet the needs of the population.
Land Use and Food Production
The climatic conditions in Western Sahara are harsh and water infrastructure is underdeveloped. Although offi cial statistics are lacking, access to water and sanitation in Western Sahara is thought to be lower than in neighbouring countries. Occasional fl ooding brought on by rare, torrential rains disrupts livelihoods, although these temporary fl oods are important for the territory’s fragile desert ecosystems.
Water Resources
100Western Sahara has the
world’s longest belt conveyor
system, which is about
The waters off the coast of Western Sahara are rich in fi sh and other marine life. These resources are currently exploited by European fi shing fl eets through an agreement between the European Union and Morocco. Fish caught in Western Saharan waters are thought to account for over
half of Morocco’s annual fi sheries yield of nearly one million metric tonnes. On the other hand, the amount of fi sh caught by the people of Western Sahara is estimated to be less than 0.5 metric tonnes per year (FAO 2007).
Marine Fisheries
Nic
k B
roo
ks/F
lick
r.co
m
Fact
: w
srw
.org
(2
00
7)
Flic
kr.
com
km
Thou
sand
Hec
tare
s
Cultivated Area
0
1
2
3
4
5
6
1963 1973 1983 1993 2003
Thou
sand
s of
Peo
ple
Population Growth and Urbanisation
0
200
400
600
1950 1970 1990 2010 2030rural urban
Source: FAOSTAT
Source: UN Population Division, World Urbanization Prospects 2005 revision

340 �
Phosphate Mining: Bou Craa, Western Sahara The Bou Craa phosphate mine is located 100 km inland from the capital city of El Aaiun. The Bou Craa area’s phosphate resources were discovered by the Spanish in 1947; phosphate deposits are near the surface and are very pure. Phosphate mining, however, did not begin until the 1960s. Since 1974, the Bou Craa mining operation has been growing steadily. In 2000, the mine covered more than 1 225 hectares. In 2001, its output was approximately 1.5 million metric tonnes of phosphate.
NPJ
B/F
lick
r.co
m

341�
Morocco controls the area of Western Sahara where the mine is located and jointly operates the mine with Spanish interests. While the mine amounts to only two or three per cent of Morocco’s phosphate production, the reserves are valuable because of the uranium that can be extracted from them.
The phosphate-containing rock is transported from the Bou Craa mine to the port at El Aaiun via a 100-km-long conveyor belt, which can move 2 000 metric tonnes of rock per hour. The conveyor belt is visible as a straight line from the upper left corner toward the centre of the 1987 and 2007 images above. Below these images are two long, horizontal images, captured in 1972/1973 and 2000. The conveyor belt is visible in the 2000 image running from the mine to the coast. Note the fringe of drifting sand spreading downward from the belt’s path (yellow arrows).

342 �
Progress Towards Environmental SustainabilityAs defi ned by the United Nations Millennium Development Goal 7 Indicators
Land area covered by forest, percentageCarbon dioxide (CO
2) emissions,
metric tonnes per capita
Protected area to total surface
area, percentage
Proportion of total population using improved drinking
water sources and sanitation facilities, percentage
Water Sanitation
Slum population as percentage
of urban
Zambia rests upon a high
plateau with a subtropical
climate characterised by a
single rainy season, a cool,
dry winter, and a hot, dry
summer. Savannah is the
dominant ecosystem and covers the centre of the country,
separating the rain forest in the northwest from the semi-
desert region in the southwest. Along Zambia’s border
with Zimbabwe, the Zambezi River fl ows over the famous
Victoria Falls. Both countries also share the Kariba Dam
built to generate hydro electric power and is also now a
major recreation and fi sheries area.
Kafue is Zambia’s oldest park and largest park, spreading
over 22 400 km2.
Republic of
Zambia
Cre
dit
: © F
lag
art
.co
m
★
★In Zambia, traditional and modern farming methods involve clearing large areas of forest. Home to Africa’s largest (and the world’s second largest) open-cast mine (Nchanga), Zambia is plagued with water pollution arising from contamination by sewage and toxic industrial chemicals. Yet the country shows progress in access to improved water sources and sanitation.
Indicates progress★ 1990 20052000
66.1
60.1
57.1
50
52
54
56
58
60
62
64
66
68
70
1990 20042000
0.3011
0.174 0.203
0
0.1
0.2
0.3
0.4
0.5
0.6
0.7
0.8
0.9
1
50
58
44
55
0
10
20
30
40
50
60
1990 20042004 1990
72
74
70
71
72
73
74
1990 2001
★
Important Environmental Issues• Copper Mining and Water and Air Pollution
• Deforestation and Wildlife Depletion
• Urbanisation
Total Surface Area: 752 618 km2
Estimated Population in 2006: 11 861 000
★
40.600
41.500 41.500
38
39
40
41
42
1990 20052000
zam
bia
tou
rism
.co
m (
n.d
)

343�
Africa is the fastest urbanising region in the world and Zambia is the third most highly urbanised country in Sub-Saharan Africa. Zambia experienced high levels of rural-urban migration, as citizens sought to benefi t from urban-based employment opportunities and subsidized food and infrastructure. Lusaka, the capital city, was—and continues to be - the main destination for rural migrants, closely followed by the Copperbelt
province (World Bank 2002). Lusaka and Copperbelt account for 69 per cent of the total urban population (UN-HABITAT 2007). The major urban areas are faced with serious environmental problems such as soil erosion, loss of soil fertility, and changes to the microclimate resulting from rampant illegal quarrying, illegal development, deforestation, and the over-exploitation of forest resources (UN-HABITAT 2007).
Urbanisation
Zambia is home to 8 017 different plant and animal species, of which 316 are endemic (UN 2007), 174 are rare, and 38 are endangered or vulnerable (IUCN 2006). The Miombo Savannah woodlands constitute the most biodiverse region in the country, containing elephants, Lichtenstein’s hartebeest, lions, and spotted hyenas.
Zambia’s wildlife is threatened by illegal hunting and other exploitation, land-use change, dam development, and other human pressures. Between 2000 and 2005, Zambia lost 2.67 million hectares of forest—the second-highest total in Africa and the fi fth-highest in the world (FAO 2005). Agriculture is the principal driver of deforestation, but it is also
exacerbated by the collection of wood for fuel, the consumption of which is expected to increase by 35 per cent between 2000 and 2020 (FAO 2003).
Deforestation and Wildlife Depletion
Zambia’s large copper reserves in the north-central “Copperbelt” region have made it a world leader in copper production. The industry has played a signifi cant role in the national economy since mining began in the late 1920s. Copper mining involves environmentally damaging activities, including open-pit and underground digging, pumping and disposal of large volumes of waste water, and smelting operations that emit sulphur dioxide. Lack of effective environmental regulation of the industry has led to widespread air, soil, and water pollution (World Bank 2002).
Copper Mining and Water and Air Pollution
Percentage
of Zambia’s
population that
lives in urban areas45%
©M
ich
ea
l Fu
ller/
Flic
kr.
com
Thou
sand
s To
nnes
Copper Mine Production
0
100
200
300
400
500
1990 1995 2000 2005
Mill
ion
Cub
ic M
etre
s
Fuelwood Production
0
2
4
6
8
1965 1975 1985 1995 2005
Joe
Ro
ss/F
lick
r.co
m
Fact
: G
TZ
(2
00
4
Source: USGS Mineral Commodity Summaries
Source: FAOSTAT

344 �
Natural and Managed Flooding: Kafue Flats, ZambiaIn southern Zambia, the Kafue River crosses a broad fl oodplain roughly 255 km long. Before the Itezhi-tezhi Dam was built on the river in 1978, fl ooding beginning in December would cover much of the plain well into the dry season. Although the dam was built to allow the release of suffi cient water to cause seasonal fl ooding, this mimicking of the natural fl oods has in general not been practised.
The Kafue Flats fl oodplain provides important habitat for rare and endemic species, including the Kafue lechwe (antelope) and wattled crane, and supports local livelihoods, especially cattle-W
ikip
ed
ia

345�
raising and fi shing. Limited seasonal fl ooding following the construction of the dam has been linked to a decline in fi sh production and in the Kafue lechwe population. The number of lechwe fell from around 90 000 before the dam was built to around 37 000 in 1998. In 2004, a partnership between World Wildlife Fund, the Zambian Ministry of Energy and Water Development, and the Zambian Electricity Supply Company put new rules in place for water releases from the dam to mimic natural fl ooding patterns more successfully.
The 1970s image shows Kafue Flats in the dry season, with water levels retreating. The Kafue Gorge Dam can be seen in the lower right corner of the image (yellow arrow). Itezhi-tezhi Dam was built a few years later to provide more storage capacity for electricity generation at the Kafue Gorge Dam. The 2007 image shows the Kafue Flats during wet season fl oods, helped for the fi rst time by the release of adequate water from the Itezhi-tezhi Dam.
Water use across the Kafue Flats is a critical issue. Nearly 1 000 000 m3 of water is extracted from the Kafue River for commercial agriculture, and most of it goes to the 13 413-hectare Nakambala Sugar Estate.
3 image mosaic
2 image mosaic

346 �
Copper Mines: Copperbelt Province, Zambia Large-scale copper mining began in north-central Zambia’s Copperbelt Province during the 1930s, attracting workers and turning this biologically rich savannah woodland into a heavily populated area with several large cities. Until the 1960s, the mining industry used wood from surrounding lands to generate power for the copper mines; this resulted in the clear-cutting of approximately 127 000 hectares between 1947 and 1956 and selective harvesting of trees in an area of similar size. The mining industry converted to hydroelectric power in the early 1960s, but the growing population continued to rely on wood for fuel.W
ikip
ed
ia
2 image mosaic

347�
Copper mining began to decline in the 1970s when oil prices rose and copper prices dropped. By the 1990s, the industry had collapsed, leaving large numbers of workers unemployed. Many of these unemployed miners turned to small-scale agriculture and charcoal production to make a living, putting additional pressure on the surrounding woodlands.
Large urban centres, open-pit mines, and areas of deforestation are already apparent in the 1972 image. These urban areas continued their rapid growth, resulting in the much larger areas of degraded and deforested woodlands visible in the 2006 image. Record copper prices in recent years have revived the area’s copper industry. Copper accounted for an average of 67 per cent of Zambia’s annual total export receipts between 2002 and 2005.

348 �
Progress Towards Environmental SustainabilityAs defi ned by the United Nations Millennium Development Goal 7 Indicators
Land area covered by forest, percentageCarbon dioxide (CO
2) emissions,
metric tonnes per capita
Protected area to total surface
area, percentage
Proportion of total population using improved drinking
water sources and sanitation facilities, percentage
Water Sanitation
Slum population as percentage
of urban
Republic of
Zimbabwe
Zimbabwe’s population of the critically endangered
black rhinoceros has grown from 370 in 1993 to around
500 now.
Zimbabwe is a
land-locked country
bordered by the Limpopo
River to the south and
the Zambezi River to
the north. A high plateau stretches across most of the
country, with a sub-tropical climate in an otherwise tropical
location. The famous Victoria Falls is located on the border
with Zambia, midway along the course of the Zambezi
River. During its highest fl ood stage, the river widens to
over 1.6 km directly above the falls before plunging 110 m
into the gorge below, forming the largest curtain of falling
water in the world (UNEP-WCMC n.d.).
Important Environmental Issues• Land Degradation and Deforestation
• Water Access and Drought
• Wildlife Poaching and the Black Rhinoceros
Total Surface Area: 390 757 km2
Estimated Population in 2006: 13 085 000
Cre
dit
: © F
lag
art
.co
m
★ Indicates progress
Among the most serious of Zimbabwe’s environmental problems are erosion of its agricultural lands and deforestation. Zimbabwe’s air is polluted by vehicle and industrial emissions, while water pollution results from mining and the use of fertilizers.
57.5
49.4
45.3
0
10
20
30
40
50
60
70
1990 20052000
1.5882
1.1703
0.8106
0
0.2
0.4
0.6
0.8
1
1.2
1.4
1.6
1.8
2
1990 20042000
14.7 14.7 14.7
0
2
4
6
8
10
12
14
16
1990 20052000
7881
5053
0
10
20
30
40
50
60
70
80
90
1990 20042004 1990
4
3.4
3.1
3.2
3.3
3.4
3.5
3.6
3.7
3.8
3.9
4
4.1
20011990
★
★
★★
rhin
os-
irf.o
rg (
n.d
)

349�
Nearly 40 per cent of Zimbabwe’s land is categorized as moderately degraded. The regions of greatest concern are in the north and east, where topsoil losses of more than 100 metric tonnes per hectare have been recorded (FAO 2004). The major drivers of land degradation are overgrazing (particularly on communally managed rangelands) and deforestation.
Between 2000 and 2005, Zimbabwe had the sixth highest rate of deforestation in Africa, averaging 3 130 km2 per year (FAO 2005). Agriculture is estimated to be responsible for approximately 700 km2 (roughly one-quarter) of this annual loss
(CBD 1998), while heavy dependence on wood for fuel and commercial logging account for the rest.
Land Degradation and Deforestation
Proportion
of Zimbabwe
covered by forest 45.3%
Zimbabwe has few perennial rivers and no natural lakes, so a network of over 8 000 dams makes up the
most signifi cant surface water resource. However, siltation has reduced dam capacity and poor infrastructure prevents many people from accessing the water they need. In the major cities of Harare and Bulawayo, residents have gone without water for as long as two weeks during recent years (UN 2006).
In rural areas, highly variable rainfall and drought are a constant threat to social and environmental stability. Between 1991 and 1997 alone, Zimbabwe experienced three major droughts that necessitated the importation of food in order to avert shortages (FAO 2004).
Water Access and Drought
Zimbabwe is home to charismatic megafauna such as the elephant, leopard, black rhinoceros, and giraffe. The black rhinoceros population in Africa declined by over 90 per cent in the last 60 years, reaching a low of 2 410 individuals worldwide in 1995 (IUCN 2007). During the 1980s, Zimbabwe lost over 1 500 black rhinos due to heavy poaching, but enhanced conservation measures have increased the population to an estimated 800 individuals today, making Zimbabwe an important stronghold for this critically endangered species. However, a recent severe economic crisis has reintroduced the threat of poaching, and at least 40 black rhinos have been killed in the past three years alone (Reuters 2007).
Wildlife Poaching and the Black Rhinoceros A
nd
rea
s K
olle
gg
er/
Flic
kr.
com
Mic
ah
La
ake
r/Fl
ick
r.co
m
Fact
: U
N (
20
07
)
Mill
ion
Cub
ic M
etre
s
Forestry Production
0
3
6
9
1965 1975 1985 1995 2005industrial roundwood wood fuel
Kilo
gram
s P
er H
ecta
re
Cereal Production, Yield
0
500
1 000
1 500
2 000
1965 1975 1985 1995 2005Sub-Saharan Africa Zimbabwe
Southern-Central Black RhinocerosDistribution, 2003
South Africa
Zimbabwe
All other countries
Source: FAOSTAT
Source: FAOSTAT
Source: International Rhino Foundation

350 �
Invasive Plants: Lake Chivero, ZimbabweIn 1952, the Manyame River was dammed 40 km southwest of Harare, creating Lake Chivero. The Lake was intended primarily as a water supply for Harare, but it is also a source of water for irrigation and industry and serves as a local fi shery.
One year after Lake Chivero was created, water hyacinth, an invasive wetland plant, made its fi rst appearance, as a result of the infl ux of nutrients from nearby agricultural lands and municipal and industrial wastes from Harare. In 1955/1956, the fi rst serious water hyacinth outbreak occurred and was successfully treated with chemical herbicides. The next outbreak P
erm
issi
on
Pe
nd
ing
/Flic
kr.
com

351�
in 1971/1972 covered approximately 25 per cent of the lake. Attempts to end a third outbreak in 1986 used mechanical and chemical controls until public concern about the chemicals brought an end to their use. By 1989, water hyacinth covered 20 per cent of the lake’s surface (1989 image, yellow arrows); by 1990, it covered 35 per cent. Weevils that feed on water hyacinth were released as a biological control; mechanical and new chemical controls continued. By 1997, it appeared that water hyacinth had been brought under control (2000 image, yellow arrows). By 2005, however, the invasive plants had returned again, reportedly covering as much as 40 per cent of the lake. In addition to water hyacinth, this most recent infestation includes massive amounts of another invasive plant, spaghetti weed (Hydrocotyle ranunculoides).

352 �
Agriculture Changes: Mashonaland, Zimbabwe Located in Northern Zimbabwe, Mashonaland Central is a province with a growing population of over one million people. It is in one of the most productive agricultural areas in the country, with maize, a staple in Zimbabwe, as a major crop.
Four different land tenure systems exist in Zimbabwe: communal areas, resettlement areas, large-scale commercial farms, and small-scale commercial farms. In the last decade, the Government of Zimbabwe embarked on an ambitious land reform process that was aimed at redistribution of land, particularly the large scale commercial farms, to previously landless W
ikip
ed
ia

353�
citizens living in communal areas. This land redistribution effort has had the effect of subdividing previously large commercial parcels into much smaller parcels predominated by subsistence agriculture. This subdivision, coupled with adverse weather conditions, constrained capacities for input acquisition (seeds and fertilizers), and lack of appropriate machinery, is blamed for a drop in food production in Zimbabwe.
The satellite images above show the subdivision of several large commercial farms into smaller farms in a region of Mashonaland Central Province. In the August 2001 image, many large farm fi elds can be seen as large blocks of bright green. By August 2005, many of these same farms have been broken into smaller fi elds (yellow arrows).
Small farms have seen infl ation and a short-age of necessary inputs for their land. Image courtesy of DigitalGlobe Quickbird.
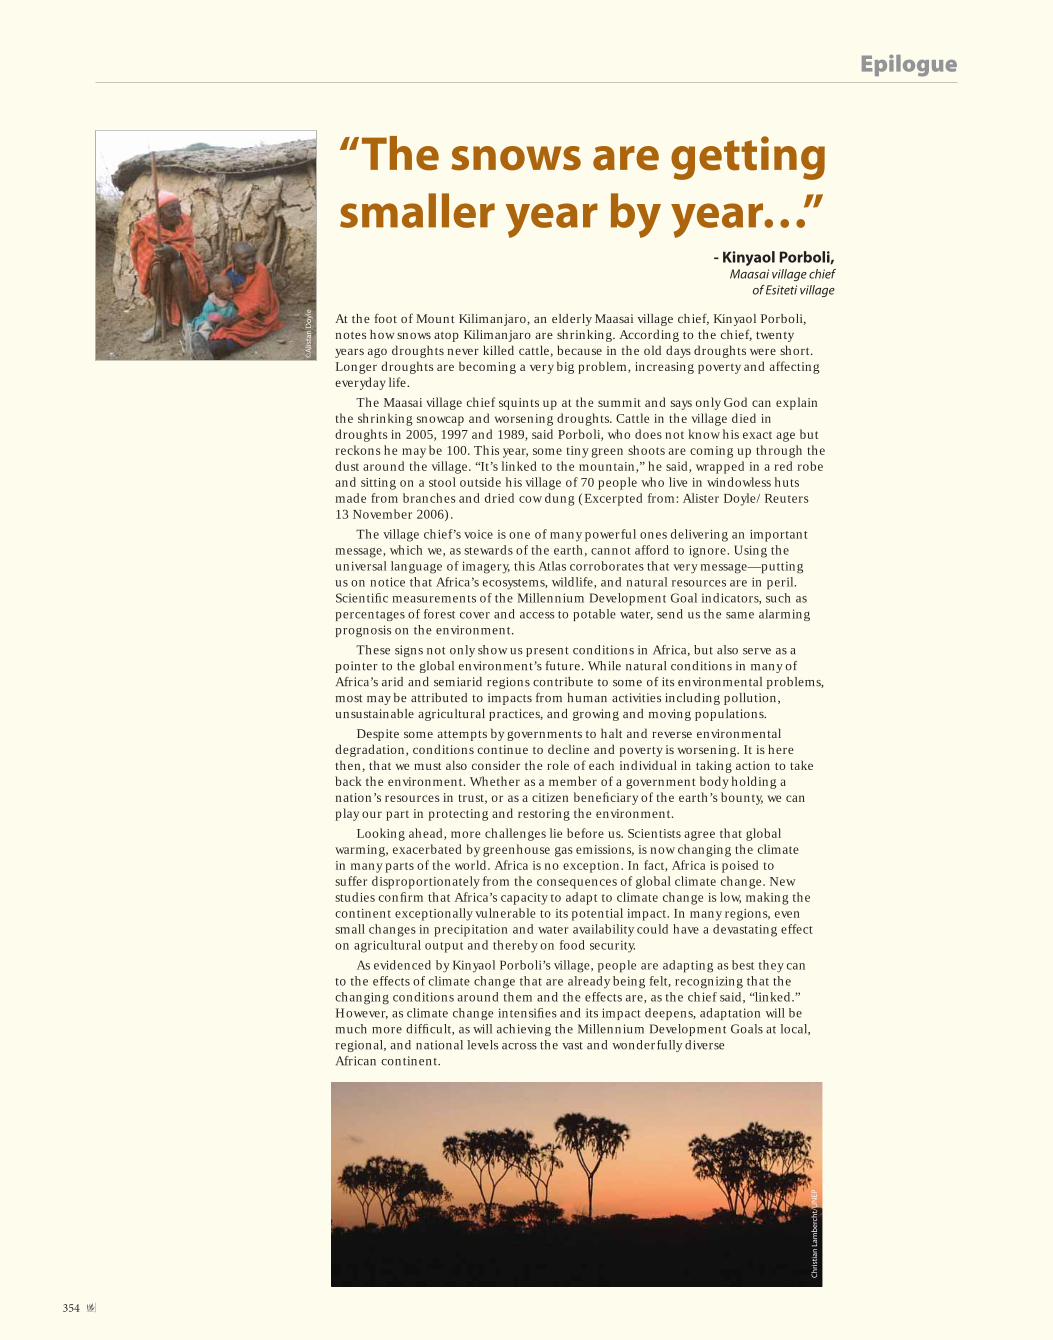
354 �
Epilogue
“The snows are getting
smaller year by year…” - Kinyaol Porboli,
Maasai village chief
of Esiteti village
At the foot of Mount Kilimanjaro, an elderly Maasai village chief, Kinyaol Porboli, notes how snows atop Kilimanjaro are shrinking. According to the chief, twenty years ago droughts never killed cattle, because in the old days droughts were short. Longer droughts are becoming a very big problem, increasing poverty and affecting everyday life.
The Maasai village chief squints up at the summit and says only God can explain the shrinking snowcap and worsening droughts. Cattle in the village died in droughts in 2005, 1997 and 1989, said Porboli, who does not know his exact age but reckons he may be 100. This year, some tiny green shoots are coming up through the dust around the village. “It’s linked to the mountain,” he said, wrapped in a red robe and sitting on a stool outside his village of 70 people who live in windowless huts made from branches and dried cow dung (Excerpted from: Alister Doyle/Reuters 13 November 2006).
The village chief’s voice is one of many powerful ones delivering an important message, which we, as stewards of the earth, cannot afford to ignore. Using the universal language of imagery, this Atlas corroborates that very message—putting us on notice that Africa’s ecosystems, wildlife, and natural resources are in peril. Scientifi c measurements of the Millennium Development Goal indicators, such as percentages of forest cover and access to potable water, send us the same alarming prognosis on the environment.
These signs not only show us present conditions in Africa, but also serve as a pointer to the global environment’s future. While natural conditions in many of Africa’s arid and semiarid regions contribute to some of its environmental problems, most may be attributed to impacts from human activities including pollution, unsustainable agricultural practices, and growing and moving populations.
Despite some attempts by governments to halt and reverse environmental degradation, conditions continue to decline and poverty is worsening. It is here then, that we must also consider the role of each individual in taking action to take back the environment. Whether as a member of a government body holding a nation’s resources in trust, or as a citizen benefi ciary of the earth’s bounty, we can play our part in protecting and restoring the environment.
Looking ahead, more challenges lie before us. Scientists agree that global warming, exacerbated by greenhouse gas emissions, is now changing the climate in many parts of the world. Africa is no exception. In fact, Africa is poised to suffer disproportionately from the consequences of global climate change. New studies confi rm that Africa’s capacity to adapt to climate change is low, making the continent exceptionally vulnerable to its potential impact. In many regions, even small changes in precipitation and water availability could have a devastating effect on agricultural output and thereby on food security.
As evidenced by Kinyaol Porboli’s village, people are adapting as best they can to the effects of climate change that are already being felt, recognizing that the changing conditions around them and the effects are, as the chief said, “linked.” However, as climate change intensifi es and its impact deepens, adaptation will be much more diffi cult, as will achieving the Millennium Development Goals at local, regional, and national levels across the vast and wonderfully diverse African continent.
©A
lista
n D
oyl
e
Ch
rist
ian
La
mb
erc
ht/
UN
EP

355�
References for the United Nations Millennium Development Goals:
UN (2007a). Africa and the Millennium Development Goals 2007 update. http://www.un.org/millenniumgoals/docs/MDGafrica07.pdf (Accessed September 18, 2007)
UN (2007b). UN Millennium Development Goals. http://www.un.org/millenniumgoals/# (Accessed September 18, 2007)
UN (2007c). The Millennium Development Goals Report 2007. http://www.un.org/millenniumgoals/pdf/mdg2007.pdf (Accessed September 18, 2007)
ALGERIA
DoE (2007). US Department of Energy. Country Analysis Briefs: Algeria. Energy Information Administration. http://www.eia.doe.gov/emeu/cabs/contents.html (Accessed on January 7, 2008)
Energy Information Administration (2007). Angola. http://www.eia.doe.gov/cabs/Algeria/Background.html (Accessed on February 6, 2008)
FAO (2005). Irrigation in Africa fi gures – AQUASTAT Survey 2005. http://www.fao.org/nr/water/aquastat/countries/algeria/algeria_cp.pdf (Accessed on January 7, 2008)
FAO (2007a). FAOSTAT statistical databases. http://faostat.fao.org/default.aspx (Accessed on January 18, 2008)
FAO (2007b). Land and Water Development Division. AQUASTAT Information System on Water and Agriculture: Online database. http://www.fao.org/nr/water/aquastat/data/query/index.html (Accessed on January 7, 2008)
METAP (n.d.). World Bank Mediterranean Environmental Technical Assistance Program (METAP). http://lnweb18.worldbank.org/mna/mena.nsf/Attachments/WQM+Algeria+A4/$File/WQM+Algeria+A4.pdf (Accessed on January 7, 2008)
National Geographic (2008). People and Places. Algeria. http://www3.nationalgeographic.com/places/countries/country_algeria.html (Accessed on February 6, 2008)
Nedraoui, D. (2001). Country Pasture/Forage Resource Profi les: Algeria. FAO Crop and Grassland Service. http://www.fao.org/ag/AGP/AGPC/doc/Counprof/Algeria.htm#5.%20THE%20PASTURE%20RESOURCE (Accessed on January 7, 2008)
Racelma, K. (2006). CHALLENGES 2006-2007: Keeping the Sahara in Check. Inter Press Service News Agency. http://ipsnews.net/news.asp?idnews=36019 (Accessed on January 7, 2008)
UNCCD (2004). United Nations Convention to Combat Desertifi cation. Programme d’Action National sur la lutte contre la Désertifi cation. République Algérienne Démocratique et Populaire, Minstère de l’Agriculture et du Développement Rural Direction Générale des Forêts. http://www.unccd.int/actionprogrammes/africa/national/2004/algeria-fre.pdf. (Accessed on March 20, 2008)
Gas Fields Across the Desert at Hassi R’ Mel
Bencherif, D. (2003). Giant Hassi R’Mel Gas Field. AAPG HEDBERG CONFERENCE “Paleozoic And Triassic Petroleum Systems In North Africa” February 18-20, 2003, Algiers, Algeria
Beyond oil and gas, Algeria aims to tap vast sunbelt to export solar energy to Europe. (2007). http://www.iht.com/articles/ap/2007/08/10/africa/AF-FEA-GEN-Algeria-Solar-Sahara.php (Accessed on January 4, 2008)
HAMEL A., MOKADDEM O. and BENLACHEHEB M. (2003). Hassi R’Mel Triassic Reservoirs-Tectonic and differential Subsidence Control on Sand Body Architecture. AAPG HEDBERG CONFERENCE “Paleozoic And Triassic Petroleum Systems In North Africa” February 18-20, 2003, Algiers, Algeria
Landsat-1 MSS, 13 November 1972, bands 2, 4 and 1
Landsat-7 ETM+, 06 April 2000, bands 7, 4 and 2
Modern Irrigation at Ouargla Oasis
Achi, K. (1972). Salinization and Water Problems in the Algerian Northeast Sahara in The Careless Technology – Ecology and International Development edited by M.T. Farvar & J.P. Milton. Natural History Press, Garden City, New York, 1972.
Columbia Encyclopedia (2007). Ouargla, Columbia Encyclopedia, Sixth Edition. Columbia University Press, 2007.
GEF (2002) Protection of the North West Sahara Aquifer System (NWSAS) and related humid zones – Medium-Sized Project Brief. http://www.iwlearn.net/iw-projects/Msp_112799492025/nw-sahara-aquifer-project-brief.pdf (Accessed on July 9, 2007)
Ramsar (n.d.). What’s New @ Ramsar - Algeria Reaches 42 Wetlands of International Importance. http://www.ramsar.org/wn/w.n.algeria_16.htm (Accessed on July 9, 2007)
ASTER-VNIR, 8 March 2006, bands 2, 3 and 1
Landsat-2 MSS, 16 January 1976, bands 2, 4 and 1
ANGOLA
Africa Research Bulletin (2007). Blackwell Publishing Ltd. Volume 43 Number 12. 2007 (Accessed on March 13, 2008)
BP (2007). Statistical Review of World Energy 2007. BP p.I.C. http://www.bp.com/productlanding.do?categoryId=6848&contentId=7033471 (Accessed on January 3, 2008)
CDB (2006). Angola Ministry of Urban Affairs and Environment and Convention on Biological Diversity: National Biodiversity Strategy Action Plan, Project 00011125, 2006. Luanda: Republic of Angola. http://www.cbd.int/doc/world/ao/ao-nbsap-01-en.pdf (Accessed on January 3, 2008)
FAO (2007). Land and Water Development Division. AQUASTAT Information System on Water and Agriculture: Online database. http://www.fao.org/nr/water/aquastat/data/query/index.html (Accessed on January 3, 2008)
MONGABAY.COM (2006). Angola. http://rainforests.mongabay.com/20angola.htm (Accessed on February 6, 2008)
Thompson, C. (2006). Ivory Trade Hub (Angola). Save the Elephants. http://www.save-the-elephants.org/news.asp?linkID=35&articleID=1547&rYear (Accessed on January 3, 2008)
UN (2007). Millennium Development Goals Indicators. http://mdgs.un.org/unsd/mdg/Default.aspx (Accessed on January 7, 2008)
UNICEF (2006). United Nations Children’s Fund: The State of the World’s Children 2007: The Double Dividend of Gender Equality. Tables 1 and 10. New York: UNICEF. http://www.unicef.org/sowc07/ (Accessed on January 7, 2008)
Catoca Diamond Mine
Cilliers, J., Dietrich, C. eds. (2000). Angola’s war economy: The role of Oil and Diamonds. Institute for security studies, South Africa.
Gordon, C., Ahmimed, C., Ngolo, D.G., eds. (2004). Diamond Industry Annual Review. http://www.diamondintelligenceonline.com/download/magazine/1450angola_e.pdf (Accessed on June 20, 2007)
Aster-VNIR, 23 September 2006, bands 2, 3 and 1
Landsat-5 TM, 14 May 1990, bands 7, 4 and 2
Land Degradation in Huambo Province
Birkeland, N.M. (2003). Last time I fl ed because of war, this time because of hunger. in N. Shanmugaratnam, Ragnhild Lund & Kristianne Stølen. (eds.) In the Maze of Displacement. Confl ict, Migration and Change, Høyskoleforlaget, Kristiansand.
Chianga Proplanalto. (2006). Revitalization of Agriculture, Investigation and Development in the Central Highlands of Angola – Final Evaluation Report. Marc Lacharme & Adriano Muiocoto Andre for World Vision.
Landsat-1 MSS, 29 August 1973, bands 2, 4 and 1
Landsat-7 ETM+, 05 September 2006, bands 7, 4 and 2
BENIN
Brottem, L. (2005). The Limits of Cotton: White Gold Shows its Dark Side in Benin. Silver City, NM & Washington, DC: Foreign Policy In Focus (June 30, 2005).
NBSAP (2002). Benin Ministry of Environment, Habitat and Urban Planning: National Biodiversity Strategy Action Plan. Cotonou, Benin: Republic of Benin. http://www.fpif.org/fpiftxt/160 (Accessed on January 7, 2007)
CBD (2002). Benin Ministry of Environment, Habitat and Urban Planning: National Biodiversity Strategy Action Plan. Cotonou, Benin. http://bch-cbd.naturalsciences.be/benin/implementation/documents/strategie/strat_brute.pdf (Accessed on January 7, 2008)
FAO (2008) .FAOSTAT Online Statistical Service. http://faostat.fao.org/site/567/DesktopDefault.aspx?PageID=567 (Accessed on March 28, 2008)
UN (2007). Millennium Development Goals Indicators. http://mdgs.un.org/unsd/mdg/Default.aspx (Accessed on January 7, 2008)
U.S Department of State (2008). Benin. http://www.state.gov/r/pa/ei/bgn/6761.htm (Accessed on February 6, 2008)
WHO (2006). World Health Organization: Global Health Atlas: World Health Statistics. Geneva: WHO. http://www.who.int/whosis/en/ (Accessed on January 17, 2008)
WHO and UNICEF (2000). Global Water Supply and Sanitation Assessment, 2000 Report. World Health Organisation, UNICEF and Water Supply and Collaborative Council, Geneva. http://www.un.org/special-rep/ohrlls/ohrlls/Waterissuesreport.pdf (Accessed on October 1, 2007)
Deforestation in the Ouemé Floodplain
Global Environment Facility (GEF). (2003). Community-Based Coastal and Marine Biodiversity Management Project (CBCBM) of Benin. Project Number: P071579. http://www.gefweb.org/Documents/Work_Programs/wp_Jul03/Project_Brief.doc (Accessed on January 7, 2008)
Pazou, E.Y.A., Laléyé, P., Boko, M., van Gestel, C.A.M., Ahissou, H., Akpona, S., van Hattum, B., Swart, K., and van Straalen, N.M. (2006) Contamination of fi sh by organochlorine pesticide residues in the Ouémé River catchment in the Republic of Bénin. Environment International 32:594-599.
UNESCO (2004). Upper Oueme: Environmental issues-selective logging. http://portal.unesco.org/sc_nat/ev.php?URL_ID=3754&URL_DO=DO_PRINTPAGE&URL_SECTION=201&reload=1169716644
World Heritage Biodiversity Filling Critical Gaps and Promoting Multi-Site Approaches to New Nominations of Tropical Coastal, Marine and Small Island Ecosystems. (n.d.). http://international.nos.noaa.gov/heritage/pdfs/wes_africa.pdf (Accessed on January 7, 2008)
WHO and UNICEF (2000). Global Water Supply and Sanitation Assessment, 2000 Report. World Health Organisation, UNICEF and Water Supply and Collaborative Council, Geneva. http://www.un.org/special-rep/ohrlls/ohrlls/Waterissuesreport.pdf (Accessed on October 1, 2007)
Landsat-5 TM, 22 January 1986, bands 7, 4 and 2
Landsat-7 ETM+, 06 February 2000, bands 7, 4 and 2
BOTSWANA
FAO (2005). Irrigation in Africa fi gures – AQUASTAT Survey 2005. http://www.fao.org/nr/water/aquastat/countries/ethiopia/ethiopia_cp.pdf (Accessed on January 7, 2008)
National Geographic Magazine (2005). Okavango Africa’s Miracle Delta. http://ngm.nationalgeographic.com/ngm/0412/feature3/index.html (Accessed on February 6, 2008)
IUCN (n.d.). http://intranet.iucn.org/webfi les/doc/SSC/CoP14/AnalysesEN/cites_prop_5.pdf (Accessed on July 6, 2007)
UNCCD (2004). Botswana Ministry of Environment, Wildlife and Tourism. (2004). Botswana National Report on the Implemenation of the United Nations Convention to Combat Desertifi cation. Gaborone, Botswana. http://www.unccd.int/cop/reports/africa/national/2004/botswana-eng.pdf (Accessed on January 7, 2008)
UNESA (2006). Population Division of the Department of Economic and Social Affairs. World Urbanization Prospects: The 2005 Revision. Dataset on CD-ROM. New York.
U.S Department of State (2008). Botswana. http://www.state.gov/r/pa/ei/bgn/6761.htm (Accessed on February 6, 2008)
UN (2007). World Statistics Pocketbook. United Nations Statistics Division. Department of Economics and Social Affairs, New York.
Jwaneng Diamond Mine
Debswana Diamond Company (Pty) Ltd. (n.d.). http://www.debswana.com/debswana.web/ (Accessed on January 7, 2008)
Diamond Mines of the World (n.d.). http://www.khulsey.com/jewelry/kh_jewelry_diamond_mines_pg2.html (Accessed on January 7, 2008)
MBendi Information Services (Pty) Ltd. (n.d.). http://www.mbendi.co.za/indy/ming/dmnd/af/bo/p0005.htm (Accessed on January 8, 2008)
ASTER-VNIR, 22 February 2006, bands 2, 3 and 1
Landsat-1 MSS, 17 January 1973, bands 2, 4 and 1
The Threatened Waters of the Okavango Delta
Hitchcock, R.K. (n.d.). The Kavango Basin: A Case Study. African Water Page/Water Policy International. http://www.africanwater.org/okavango_case_study.htm (Accessed on June 15, 2007)
Hamandawana, H., Eckardt, F. and Chanda, R. (2005). Linking Archival and Remotely Sensed Data for Long-term Environmental Monitoring. International Journal of Applied Earth Observation and Geoinformation 7(4):248-298
International Rivers Network (2000). Destructive Dam Considered for Okavango. http://www.irn.org/programs/okavango/index.php?id=001005destructive.html (Accessed on January 7, 2008)
Kgathi D.L., Mmopelwa G., Mosepele K. (2005). Natural resources assessment in the Okavango Delta, Botswana: Case studies of some key resources Natural Resources Forum 29 (1), 70–81. doi:10.1111/j.1477-8947.2005.00113.x
Lake Ngami (Important Birds Areas of Botswana). (n.d.). http://www.birdlife.org/datazone/sites/index.html?action=SitHTMDetails.asp&sid=6048&m=0 (Accessed on January 7, 2008)
Paul Shaw. (1985). The Desiccation of Lake Ngami: An Historical Perspective. The Geographical Journal, Vol. 151, No. 3 (Nov., 1985), pp. 318-326 doi: 10.2307/633012
ASTER-VNIR, 03 September 2003, bands 2, 3 and 1
Landsat-7 ETM+, 01 January 2000, 10 April 2000, 28 March 2001, 03 January 2002, bands 7, 4 and 2
Landsat-2 MSS, 08 June 1979, bands 2, 4 and 1
BURKINA FASO
ADB (2006). African Development Bank Group: Ougadougou Drinking Water Project (Ziga Dam). http://www.afdb.org/portal/page?_pageid=293,962607&_dad=portal&_schema=PORTAL&thing_id=1012241 (Accessed on January 7, 2008)
FAO (2003). Forestry Division: Forestry Outlook Study for Africa: Subregional Report – West Africa. ftp://ftp.fao.org/docrep/fao/005/y8732e/y8732e00.pdf (Accessed on January 7, 2008)
FAO (2005). Irrigation in Africa fi gures – AQUASTAT Survey 2005. http://www.fao.org/nr/water/aquastat/countries/burkina_faso/indexfra.stm (Accessed on January 18, 2008)
References

356 �
FAO (2007). Land and Water Development Division: AQUASTAT Information System on Water and Agriculture: Online database. http://www.fao.org/nr/water/aquastat/data/query/index.html (Accessed on January 7, 2008) and FAOSTAT statistical databases. FAO: Rome. Rome. http://faostat.fao.org/default.aspx (Accessed on January 18, 2008)
FAO AGL (2003). Land Degradation Severity. Terrastat online database. http://www.fao.org/ag/agl/agll/terrastat/#terrastatdb (Accessed on January 7, 2008)
International Small-Hydro Atlas (n.d.). Burkina Faso Country Brief. http://www.small-hydro.com/index.cfm?Fuseaction=countries.country&Country_ID=120 (Accessed on January 7, 2008)
National Geographic (2008). People and Places. Burkina Faso. http://www3.nationalgeographic.com/places/countries/country_burkinafaso.html (Accessed on February 6, 2008)
UN (2003). UN Offi ce for the Coordination of Humanitarian Affairs. (2003). BURKINA FASO: Water shortage becomes more accute in capital. IRIN News Service. http://www.irinnews.org/report.aspx?reportid=43897 (Accessed on January 7, 2008)
United Nations (2007). United Nations Statistics Division. Burkina Faso. http://unstats.un.org/unsd/ENVIRONMENT/envpdf/Country%20Snapshots_apr2007/Burkina%20Faso.pdf (Accessed on February 6, 2008)
UN (2007). United Nations: Millennium Development Goals Indicators. http://mdgs.un.org/unsd/mdg/Default.aspx (Accessed on January 7, 2008)
UNCCD (2000). Burkina Faso Ministry of Environment and Water: National Action Program to Fight Desertifi cation. Ougadougou: Republic of Burkina Faso. http://www.unccd.int/actionprogrammes/africa/national/2000/burkina_faso-fre.pdf (Accessed on January 7, 2008)
The Rapid Growth and Unplanned Settlement of Ouagadougou
Manu, A., Twumasi, Y.A. Coleman, T.L. and Jean-Baptiste, T.S. (2003). Investigation of the Impact of Urban sprawl in Three Sahelian Cities Using Remotely-Sensed Information. Geoscience and Remote Sensing Symposium, 2003. IGARSS apos;03.
Prat, A. (1996). Ouagadougou, capitale sahelienne: croissance urbaine et enjeu foncier. Mappemonde 96(1) :18-24.
Proceedings. 2003 IEEE International Volume 2, Issue , 21-25 July 2003 Page(s): 988 - 990 vol.2
Vallée J., Harang M., Pirot F., Salem G., Fournet F. and Meyer P. (2006). Stratifi cation de la ville de Ouagadougou (Burkina Faso) à partir d’une image panchromatique Spot 5: Une première étape à la mise en place d’une enquête de santé. Espace-Populations-Societes no.2-3 (2006) p. 393-401.
UN World Urbanization Prospects; the 2003 Revision, in: Balbo, M. (n.d.). Urban growth, migration and development perspectives in Sub-Saharan Africa. Dipartimento di Pianifi cazione, Università IUAV di Venezia
ASTER-VNIR, 20 June 2004, bands 2, 3 and 1
Landsat-5 TM, 18 November 1986, bands 7, 4 and 2
Population and Protection at “W” National Park
Magha, M.I., Kambou, J.B. and Koudenoukpo, J. (2001). Beyond Boundaries: Transboundary Natural Resource Management in “W” Park. Biodiversity Support Program (BSP). http://www.worldwildlife.org/bsp/publications/africa/108/190/titlepage.HTML (Accessed on May 22, 2007)
OECD (2005). W Park: Benin, Burkina Faso, Niger, 1 Park, 3 Countries. Cross Border Diaries, September 2005 1/2 pg. 17-32. Organisation for Economic Co-operation and Development. http://www.oecd.org/LongAbstract/0,2546,en_2649_37429_35611030_119693_1_1_37429,00.html (Accessed on May 22, 2007)
Thiollay, J.M. (2006). Large bird declines with increasing human pressure in savanna woodlands (Burkina Faso). Biodiversity and Conservation.15:2085-2108.
UNDP/ GEF (2005). Enhancing the effectiveness and catalyzing the sustainability of the W-Arly-Pendjari (WAP) protected area system. UNEP Project document PIMS 1617. http://www.gefweb.org/Documents/work_programs/IWP%20July05/2%20-%20BD%20-%20Regional-Enhancing%20Effectiveness-W-Arly-Pendjari-%20Projdoc.pdf (Accessed on May 22, 2007)
Landsat-1 MSS, 10 November 1972 and 06 October 1973, bands 2, 4 and 1
Landsat-7 ETM+, 31 October 2005, bands 7, 4 and 2
BURUNDI
FAO (n.d.). Ichthyology Web Resources: http://www2.biology.ualberta.ca/jackson.hp/IWR/Regions/Africa/Lake_Tanganyika.php and FAO: http://www.fao.org/fi /ltr/FISH.HTM (Accessed on December 27, 2008)
FAO (2005). Global Forest Resources Assessment. www.fao.org/forestry/fra (Accessed on January 18, 2008)
FAO (2006a). FAOSTAT Online Statistical Service. http://faostat.fao.org (Accessed on December 27, 2007)
FAO (2006b). EarthTrends calculation using data from: Food and Agriculture Organization of the United Nations (FAO). 2006. FAOSTAT (2007). Online Statistical Service. http://faostat.fao.org (Accessed on December 27, 2007)
FAO (2007). State of the World’s Forests 2007. ftp://ftp.fao.org/docrep/fao/009/a0773e/a0773e10.pdf (Accessed on February 6, 2008)
FAO AGL (2003). Land Degradation Severity. Terrastat online database. http://www.fao.org/ag/agl/agll/terrastat/#terrastatdb (Accessed on December 27, 2007)
Jorgensen, S. E.; Ntakimazi, G.; Kayombo, S. (2005). Lake Tanganyika: Experience and Lessons Learned Brief. Lake Basin Management Initiative. http://www.iwlearn.net/publications/ll/laketanganyika_2005.pdf/view (Accessed on December 27, 2007)
National Park Service U.S Department of the Interior (n.d). http://www.nps.gov/archive/crla/brochures/deeplakes.htm (Accessed on February 6, 2008)
UN (2007). United Nations: Millennium Development Goals Indicators. http://mdgs.un.org/unsd/mdg/Default.aspx (Accessed on December 27, 2007)
UNESA (2005). Population Division of the Department of Economic and Social Affairs of the United Nations Secretariat: World Population Prospects: The 2004 Revision. Dataset on CD-ROM. New York.
UNESA (2006). Population Division of the Department of Economic and Social Affairs of the United Nations Secretariat: World Urbanization Prospects: The 2005 Revision. Dataset on CD-ROM. New York.
World Bank (2007). Development Data Group: 2007 World Development Indicators Online. Washington, DC: The World Bank. http://go.worldbank.org/3JU2HA60D0 (Accessed on December 27, 2007)
Kibira Forest, an Island of Biodiversity
FAO (2003). Forestry Department. Sustainable Management of Tropical forests in Central Africa: Protected Areas – Kibira National Park. FAO Forestry paper, 143
Habonimana, A. (2001). The Magnifi cent Kibira Park turned into a Land of Devastation Association. Burundaise pour la Protection des Oiseaux
IUCN (2004). 2004 IUCN Red List of Threatened Species. www.iucnredlist.org. (Accessed on December 14, 2004)
Mongabay (2006). Burundi. http://rainforests.mongabay.com/20burundi.htm (Accessed on December 7, 2006)
ASTER-VNIR, 05 July 2004 and 16 June 2006, bands 2, 3 and 1
ASTER-VNIR, 05 July 2004 and 16 June 2006, bands 2, 3 and 1
DigitalGlobe-Quickbird, 25 July 2002, bands 3, 2 and 1
Landsat-5 TM, 19 July 1986, bands 7, 4 and 2
Agriculture Around a Growing Bujumbura
Drechsel, P., Gyiele, L., Kunze, K. and Cofi e, O. (2001). Population Density, Soil Nutrient Depletion, and Economic Growth in Sub-Saharan Africa. Ecological Economics 38(2):251-258.
FAO (2004). Watershed Management Case Study: Burundi. Food and Agriculture Organization of the United Nations, Rome, 2004. ftp://ftp.fao.org/docrep/fao/009/J3886E/J3886E00.pdf (Accessed on June 4, 2007)
GEF. (2004) Agricultural Rehabilitation and Sustainable Land Management Project – Project Brief. http://www.gefonline.org/ProjectDocs/Land%20Degradation/Burundi%20-%20Agricultural%20Rehab%20and%20Support%20Proj%20-%20Support%20for%20Sustainable%20Land%20Managmt/4-13-04%20Burundi%20Project%20Brief%20fi nal.pdf (Accessed on June 4, 2007)
US State Department. (2007). http://www.state.gov/r/pa/ei/bgn/2821.htm (Accessed on January 17, 2008)
World Resource Institute (WRI). (2003). EarthTrends, Population, Health, and Human Well-Being, Burundi. http://earthtrends.wri.org/pdf_library/country_profi les/pop_cou_108.pdf (Accessed on June 4, 2007)
Landsat-2 MSS, 06 June 1979, bands 2, 4 and 1
Landsat-7 ETM+, 15 June 2000, bands 7, 4 and 2
CAMEROON
CBD (1999). Republic of Cameroon and the UN Environment Programme: Biodiversity Status Strategy and Action Plan. Yaounde: Republic of Cameroon. http://www.cbd.int/countries/profi le.shtml?country=cm#status (Accessed on December 27, 2007)
CBD (2007). Secretariat of the Convention on Biological Diversity: Malawi – Description. Country Profi les. http://www.cbd.int/countries/default.shtml (Accessed on December 27, 2007)
CRES (2008). Ecology and Conservation of Goliath Frogs in Cameroon. http://cres.sandiegozoo.org/projects/sp_goliath_frogs.html (Accessed on February 6, 2008)
FAO (2003). Forestry Division: Forestry Outlook Study for Africa. http://www.fao.org/docrep/005/Y4521E/Y4521E00.HTM (Accessed on December 27, 2007)
FAO (2005). Forestry Division: Global Forest Resources Assessment 2005. http://www.fao.org/forestry/site/fra2005/en/ (Accessed on December 27, 2007)
FAO (2007). FAOSTAT statistical databases. http://faostat.fao.org/default.aspx (Accessed on January 18, 2008)
FAO AGL (2003). Land Degradation Severity. Terrastat online database. http://www.fao.org/ag/agl/agll/terrastat/#terrastatdb (Accessed on December 27, 2007)
Smithsonian National Museum of Natural History (n.d). Global Volcanism Program. Cameroon. http://www.volcano.si.edu/world/volcano.cfm?vnum=0204-01%3D (Accessed on February 6, 2008)
UN (2007). Millennium Development Goals Indicators. http://mdgs.un.org/unsd/mdg/Default.aspx (Accessed on December 27, 2007)
Deforestation and Plantations in Campo-Ma’an Rainforest
Ashley, R., Russell, D. and Swallow, B. (2006). The policy terrain in protected area landscapes: challenges for agroforestry in integrated landscape conservation. Biodiversity and Conservation. 15:663-689.
Davis, S.D., Heywood, V.H., and Hamilton, A.C. (1994). Centres of Plant Diversity. A Guide and Strategy for their Conservation WWF, IUCN.
Sunderlin, W.D., Ndoye, O., Bikié, H., Laporte, N., Mertens, B. and Pokam, J. (2000). Economic crisis, small scale agriculture, and forest cover changes in southern Cameroon, Environmental Conservation. 27(3):284-290.
Tchouto, M.G.P., Yemefack, M., DeBoer, W.F., DeWilde, J.J.F.E., Van Der Maesen, L.J.G. and Cleef, A.M. (2006). Biodiversity hotspots and conservation priorities in the Campo-Ma’an rani forests, Cameroon. Biodiversity and Conservation. 15:1219-1252.
Tchouto, M.G.P. (2004). Plant diversity in a Central African Rain Forests: Implications for biodiversity conservation in Cameroon, Tropenbos Publications: Cameroon Series 7. http://www.tropenbos.nl/fi les/Cameroon/camser7.htm (Accessed on January 29, 2007)
Landsat-1 MSS, 01 February 1973, bands 2, 4 and 1
Landsat-7 ETM+, 26 April 2001, bands 7, 4 and 2
Recent Eruptions at Mount Cameroon
Shu, C.E., Sparks, R.S.J., Fitton, J.G., Ayonghe, S.N. Annen, C., Nana, R. and Luckman, A. (2003). The 1999 and 2000 eruptions of Mount Cameroon: eruption behavior and petrochemistry of lava. Bulletin of Volcanology 65:267-281
Smithsonian Institute (2007). Smithsonian Institute Global Volcanism Program. http://www.volcano.si.edu/world/volcano.cfm?vnum=0204-01=&volpage=var&VErupt=Y&VSources=Y&VRep=Y&VWeekly=N#sean_0710 (Accessed on February 1, 2007)
Landsat-5 TM, 12 December 1986, bands 7, 4 and 2
Landsat-7 ETM+, 10 December 2000, bands 7, 4 and 2
CAPE VERDE
Encyclopedia of the Nations (2007). Africa. Cape Verde. http://www.nationsencyclopedia.com/Africa/Cape-Verde.html (Accessed on February 6, 2008)
FAO (2005). Irrigation in Africa fi gures – AQUASTAT Survey 2005. http://www.fao.org/nr/water/aquastat/countries/cape_verde/cape_verde_cp.pdf (Accessed on January 7, 2008)
UNESA (2006). Population Division of the Department of Economic and Social Affairs of the United Nations Secretariat. (2006). World Urbanization Prospects: The 2005 Revision. Dataset on CD-ROM. New York.
CBD (2007). Secretariat of the Convention on Biological Diversity. (2007). Cape Verde – Description. Country Profi les. http://www.cbd.int/countries/default.shtml (Accessed on January 7, 2008)
Living at the Base of the Volcano, Pico de Fogo
Amelung, F. and Day, S. (2002). InSAR observations of the 1995 Fogo, Cape Verde, eruption: Implications for the effects of collapse events upon island volcanos. Geophysical Research Letters, 29(12):471-474
Bulletin of the Global Volcanism Network. (1995). Fogo Monthly Report March 1995, 20:03. http://www.volcano.si.edu/world/volcano.cfm?vnum=1804-01=&volpage=var#bgvn_2004#bgvn_2004 (Accessed on August 30, 2007)
DigitalGlobe-Quickbird, 06 April 2002, bands 3, 2 and 1
CENTRAL AFRICAN REPUBLIC
Bermudez-Lugo, O (2005). The Mineral Industries of Central African Republic, Cote d’Ivoire, and Togo. USGS 2004 Minerals Yearbook. http://minerals.usgs.gov/minerals/pubs/country/africa.html#ct (Accessed on January 7, 2008)
Blanc, J.J., Barnes, R.F.W., Craig, G.C., Dublin, H.T. , Thouless, C.R. , Douglas-Hamilton, I., and Hart. J.A. (2007). African Elephant Status Report 2007: an Update from the African Elephant Database. Gland, Switzerland: IUCN. http://www.iucn.org/themes/ssc/sgs/afesg/aed/pdfs/aesr2007.pdf (Accessed on January 7, 2008)
CARPE (2005) The Forests of the Congo Basin – A Preliminary Assessment. (Accessed on January 25, 2008) http://carpe.umd.edu/products/PDF_Files/FOCB_APrelimAssess.pdf
CARPE (2006).The Forests of the Congo Basin. State of the Forest 2006. http://carpe.umd.edu/resources/Documents/THE_FORESTS_OF_THE_CONGO_BASIN_State_of_the_Forest_2006.pdf/ (Accessed on February 6, 2008)
FAO (2005). Forestry Division. Global Forest Resources Assessment 2005. http://www.fao.org/forestry/site/fra2005/en/ (Accessed on January 7, 2008)
FAO (2007). FAOSTAT statistical databases. http://faostat.fao.org/default.aspx (Accessed on January 18, 2008)
MONGABAY.COM (2007). Tropical Rainforests. Central African Republic. http://rainforests.mongabay.com/20car.htm (Accessed on February 6, 2008)

357�
UN (2007). Millennium Development Goals Indicators. http://mdgs.un.org/unsd/mdg/Default.aspx. (Accessed on January, 2007)
Bangassou Forest, Biodiversity Under Pressure
Fay, J..M. and Agnagna, M. (1991). Forest elephant populations in the Central African Republic and Congo. Pachyderm 14:3-19
Forests Monitor (2000). Part II – Country Profi les – Central African Republic: Political Social and Economic Framework. http://www.forestsmonitor.org/reports/solddownriver/car.htm (Accessed on March 6, 2007)
GEF (1995). Project Document CAF/95/G-31/1G/31 – A highly-decentralized approach to the protection and utilization of biological diversity in the Bangassou dense Forest. http://www.gefonline.org/ProjectDocs/Biodiversity/Central%20Arican%20Republic%20-%20Bangassou%20Forest%20Decentralized%20Biodiv%20Protection/CentrAfRep%20-%20Bangassou%20Forest%20Decentr.%20Proj%20Doc.pdf (Accessed on July 17, 2007)
ITTO (2005). Status of Tropical Forest Management 2005 – Central African Republic. International Tropical Timber Organization. http://www.itto.or.jp/live/Live_Server/1228/CAR.e.pdf (Accessed on July 17, 2007)
WCS (2005). Long Term System for Monitoring The Illegal Killing of Elephants – MIKE. Central African Forests: Final Report on Population Surveys (2003 – 2004) March 2005 http://www.cites.org/common/prog/mike/survey/central_africa_survey03-04.pdf (Accessed on July 17, 2007)
Williamson, L., and F. Maisels. (2004). Bangassou Forest, Central African Republic. Conservation Status of Large Mammals and Human Impact. MIKE/WCS. http://www.psychology.stir.ac.uk/staff/ewilliamson/documents/Williamsonetal2004.pdf (Accessed on July 17, 2007)
World Gazetteer (n.d.). World Gazetteer, Bangassou, 2003 Census. http://world-gazetteer.com/wg.php?x=&men=gpro&lng=en&dat=32&geo=-47&srt=npan&col=aohdq&pt=c&va=&geo=341084282 (Accessed on July 17, 2007)
Landsat-2 MSS, 12 December 1975, TerraLook simulated true color
Landsat-7 ETM+, 28 December 2006, TerraLook simulated true color
CHAD
Lakenet (2008). Lake Profi le, Chad. http://www.worldlakes.org/lakedetails.asp?lakeid=8357 (Accessed on March 13, 2008)
Coe, M.T. and Foley, J.A. (2001). Human and Natural Impacts on the Water Resources of the Lake Chad Basin. Journal of Geophysical Research 106(D4): 3349-3356
EM-DAT (2007). The OFDA/CRED International Disaster Database - www.em-dat.net - Université Catholique de Louvain - Brussels – Belgium. http://www.emdat.be/Database/CountryProfi le/countryprofi le.php (Accessed on January 18, 2008)
EIA (2007). Energy Information Administration. Chad and Cameroon. Country Analysis Briefs. US Department of Energy. http://www.eia.doe.gov/emeu/cabs/Chad_Cameroon/Oil.html (Accessed on January 8, 2008)
FAO (1997). Land and Water Development Division. Irrigation potential in Africa: A basin approach. http://www.fao.org/docrep/W4347E/w4347e00.HTM (Accessed on January 8, 2008)
UN (2006). United Nations Statistics Division. Millenium Development Goals Indicators. http://mdgs.un.org/unsd/mdg/Data.aspx (Accessed on February 6, 2008)
UNEP (2006). Africa Environment Outlook 2.Our Environment, Our Wealth. Nairobi: UNEP.
UNICEF (2006). The State of the World’s Children 2007: The Double Dividend of Gender Equality. Tables 1 and 10. New York. http://www.unicef.org/sowc07/ (Accessed on January 8, 2007)
Massive Oil Development in Doba
BBC (2006). Oil Wealth Fails Chadian Villagers, BBC News. http://news.bbc.co.uk/1/hi/world/africa/5295352.stm (Accessed on May 7, 2007)
Chadian Association for the Promotion and Defense of Human Rights. http://www.forestpeoples.org/documents/africa/chad_cameroon_proj_report_apr07_eng.pdf (Accessed on May 7, 2007)
Environmental Defense (1999). The Chad Cameroon Oil and Pipeline Project: Putting People and the Environment at Risk. Association Thadienne pour la Promotion et la Defense des Droits de L’Homme, Chad; Centre Pour L’Environnement et le Developpement, Cameroon, Environmental Defense, USA.
Environmental Defense (2002). The Chad-Cameroon Oil and Pipeline Project: A Call for Accountability, Association Thadienne pour la Promotion et la Defense des Droits de L’Homme, Chad; Centre Pour L’Environnement et le Developpement, Cameroon, Environmental Defense, USA.
Forest Peoples Org (2007). The Chad-Cameroon Oil & Pipeline Project; A Project Non-completion Report. Korinna Horta, Environmental Defense, Samuel Nguiffo, Center for Environment and Development, Delphine Djiraibe,
Leif Brottem. (2004). The World Bank’s Great Gamble in Central Africa, (Silver City, NM & Washington, DC: Foreign Policy In Focus, July 2, 2004). http://www.fpif.org/commentary/2004/0407gamble.html (Accessed on May 7, 2007)
Moody-Stuart, M. (2004) The curse of Oil? Proceedings of the Geologists’ Association 115:1-5
Moynihan, K.J., Cladwell, E.R., Sellier, U.L., Kaul, C.F., Daetwyler, N.A., Hayward, G.L. and Batterham, G. (2004). Chad Export Project: Environmental Protection Measures. Presented at the Seventh Society of Petroleum Engineers International Conference on Health, Safety, and Environment in Oil and Gas Exploration and Production, Calgary, Alberta, Canada, 29-31 March 2004.
World Bank (1997). Project Information – Cameroon-Petroleum Development and Pipeline Project; Report No. PIC2144. http://www-wds.worldbank.org/external/default/main?pagePK=64193027&piPK=64187937&theSitePK=523679&menuPK=64187510&searchMenuPK=64187283&theSitePK=523679&entityID=000009265_3971229182215&searchMenuPK=64187283&theSitePK=523679 (Accessed on May 4, 2007)
World Bank (2007). Chad Cammeroon Implementation Completion Report, pg 14
World Bank (2007). World Development Indicators database, World Bank. http://siteresources.worldbank.org/DATASTATISTICS/Resources/GNIPC.pdf (Accessed May 7, 2007)
ASTER-VNIR, 16 January 2007, bands 2, 3 and 1
DigitalGlobe-Quickbird, 22 December 2005, bands 3, 2 and 1
Landsat-2 MSS, 04 January 1976, bands 2, 4 and 1
Agriculture in the Yamba Berté Forest Reserve
Chaintreuil, I. and Conteau, C. (2000). Diagnostic des modes d’utilisation des ressources naturelles par les usagers de la forêt classée de Yamba Berte (Tchad). Centre National d’Etudes Agronomiques des Regions Chaudes, Montpellier, France.
FAO (n.d.). Khaya senegalensis Desr. Grassland Species Profi les. http://www.fao.org/ag/agP/agpc/doc/gbase/data/Pf000524.htm (Accessed on July 9, 2007)
FEWSNET (2005). Chad Livelihood Profi les – USAID FEWS NET Project. http://www.fews.net/livelihoods/fi les/td/profi ling.pdf (Accessed on July 9, 2007)
GEF (2002). GEF Project Brief – Community Based Integrated Ecosystem Management Project under PROADEL. www-wds.worldbank.org/.../18/000112742_20040818161300/Rendered/PDF/298290Chad0IEM1ject0Brief10Final004.pdf (Accessed on July 9, 2007)
Landsat-5 TM, 20 October 1986, bands 7, 4 and 2
Landsat-7 ETM+, 17 November 1999 and 21 October 2001, bands 7, 4 and 2
COMOROS
CBD (2007). Secretariat of the Convention on Biological Diversity, Comoros – Description. Country Profi les. http://www.cbd.int/countries/default.shtml (Accessed on January 7, 2008)
Encyclopedia of the Nations (2007). Africa. Comoros. http://www.nationsencyclopedia.com/Africa/Comoros-FLORA-AND-FAUNA.html (Accessed on February 6, 2008)
FAO (2007). FAOSTAT statistical databases. http://faostat.fao.org/default.aspx (Accessed on January 18, 2008)
FAO (2000-2007). Fisheries and Aquaculture Department: Comoros Fisheries and Aquaculture Country Profi le. http://www.fao.org/fi /website/FISearch.do?dom=country (Accessed on January 7, 2008)
UNEP-WCMC (2001). World Atlas of Coral Reefs. http://www.unep-wcmc.org/marine/coralatlas/index.htm (Accessed on January 8, 2008)
UNESA (2005). Population Division of the Department of Economic and Social Affairs of the United Nations Secretariat, 2005. World Population Prospects: The 2004 Revision. Dataset on CD-ROM. New York. http://www.un.org/esa/population/ordering.htm
UNESA (2006). EarthTrends calculation using population data from: Population Division of the Department of Economic and Social Affairs of the United Nations Secretariat, 2005. World Population Prospects: The 2004 Revision. Dataset on CD-ROM. New York. http://www.un.org/esa/population/ordering.htm (Accessed on January 7, 2008)
UN (2007). Millennium Development Goals Indicators. http://mdgs.un.org/unsd/mdg/Default.aspx (Accessed on January 18, 2008)
Agriculture and Erosion on Anjouan Island
FAO (2005). Comoros Country Profi le, AQUASTAT. http://www.fao.org/ag/agl/aglw/aquastat/countries/ (Accessed on July 9, 2007)
UN (n.d.). World Population Ageing 1950-2050, Population Division, DESA, United Nations. http://www.un.org/esa/population/publications/worldageing19502050/pdf/069comor.pdf (Accessed on July 9, 2007)
UNEP (2000). Report on the State of Management of Protected Marine Areas in Comoros, UNEP – Unit for Regional coordination for East African Region. April 2000
UNFCCC (2002). Initial National Communication – Union Des Comores. Initial Communication on Climate Change – United Nations Framework Convention on Climate Change. http://unfccc.int/resource/docs/natc/comnc1e.pdf (Accessed on July 9, 2007)
World Bank (1994) Federal Islamic Republic of the Comoros, Poverty and Growth in a Traditional Small Island Society. Population and Human Resources Division. www-wds.worldbank.org/.../WDSP/IB/1994/09/29/000009265_3961006184945/Rendered/PDF/multi0page.pdf (Accessed on July 9, 2007)
CONGO, REPUBLIC OF
Blanc, J.J., Barnes, R.F.W., Craig, G.C., Dublin, H.T., Thouless, C.R., Douglas-Hamilton, I., and Hart, J.A. (2007). African Elephant Status Report 2007: an Update from the African Elephant Database. Gland, Switzerland: IUCN http://www.iucn.org/themes/ssc/sgs/afesg/aed/pdfs/aesr2007.pdf (Accessed on January 7, 2008)
CARPE (2006). Forests of the Congo Basin – State of the Forest 2006. http://carpe.umd.edu/2006-state-of-the-forests-report F
EIA (2007). Congo-Brazzaville. Country Analysis Briefs. US Department of Energy. http://www.eia.doe.gov/emeu/cabs/congo.html (Accessed on January 8, 2008)
FAO (2003) Forestry Division . Forestry Outlook Study for Africa. FAO Forestry Paper 141. http://www.fao.org/docrep/005/Y4521E/Y4521E00.HTM (Accessed on January 8, 2008)
FAO (2005) Irrigation in Africa fi gures – AQUASTAT Survey 2005. http://www.fao.org/nr/water/aquastat/countries/congo_rep/congo_rep_cp.pdf (Accessed on January 8, 2008)
Laporte, N. T., Stabach, J. A., Grosch, R., Lin, T. S. and Goetz, S. J. (2007). Expansion of industrial logging in Central Africa, Science, 316 (5830)1451.
MONGABAY.COM (2007). Congo. http://rainforests.mongabay.com/20congo.htm (Accessed on February 6, 2008)
Bushmeat on the Roads at Ouesso
Hennessey, B. (1995). A Study of the Meat Trade in Ouesso, Republic of the Congo. GTZ, Brazzaville, 1995.
Reuters (2007). Congo revives timber exports via rail, sea ports © Reuters 2007 (Accessed on Aug 17, 2007)
Wilkie, D.S., Sidle, J.G., Boundzanga, G.C., Auzel, P. and Blake, S. (2001). Defaunation, Not Deforestation, Commercial Logging and Market Hunting in Northern Congo. In The Cutting Edge: Conserving Wildlife in Logged Tropical Forests. Book by Robert A. Fimbel, Alejandro Grajal, John G. Robinson; Columbia University Press, 2001
Wilkie, D.S.,Sidle,J.G., Boundzanga, G.C. (1992). Mechanized Logging, Market Hunting, and a Bank Loan in Congo. Conservation Biology, 6(4):570-580.
World Gazetter, © S. Helders (n.d.) www.world-gazetteer.com (Accessed on January 14, 2008)
Landsat-2 MSS, 20 April 1976, bands 2, 4 and 1
Landsat-7 ETM+, 15 February 2003, bands 7, 4 and 2
Logging Roads in the Rainforest
CARPE (2006). Sangha Tri-National Landscape Profi le. http://carpe.umd.edu/resources/Documents/Sangha_SOF2006.pdf (Accessed on November 15, 2007)
Roy,B. S., Walsh, P.D., and Lichstein, J. W. (2005). Can Logging in Equatorial Africa Affect Adjacent Parks? Ecology and Society 10(1): 6. http://www.ecologyandsociety.org/vol10/iss1/art6/ (Accessed on January 8, 2008)
Tiffany, S. L., Nadine, T. L., and Didier D. (2003). Impacts of Large-Scale Selective Logging on Ecosystem Services in the Northern Republic of Congo: AGU Chapman Conference on Ecosystem Interactions with Land Use Change, 14-18 June, 2003, Santa Fe, New Mexico.
WWF (2006). Climate change in the Congo River Basin. http://www.panda.org/about_wwf/where_we_work/africa/solutions_by_region/congo_basin_forests/problems/climate_change/index.cfm (Accessed on January 16, 2008)
Landsat-2 MSS, 25 February and 20 April 1976, bands 2, 4 and 1
Landsat-7 ETM+, 18 February and 16 May 2001, bands 7, 4 and 2
DEMOCRATIC REPUBLIC OF THE CONGO
Bartleby.com (2007). Columbia Encyclopedia. Congo, river, Africa. http://www.bartleby.com/65/co/Congo.html (Accessed on February 6, 2008)
Ecologist (2004). Mining Threatens Congo Gorillas. Ecologist 34(8), February 2004
FAO (2003). Forestry Division. Forestry Outlook Study for Africa. FAO Forestry Paper 141. http://www.fao.org/docrep/005/Y4521E/Y4521E00.HTM (Accessed on January 8, 2008)
FAO (2005). Forestry Division. Global Forest Resources Assessment 2005. http://www.fao.org/forestry/site/fra2005/en/ (Accessed on January 8, 2008)
Owen, J. (2006). Hippos Butchered by the Hundreds in Congo Wildlife Park. National Geographic News. http://news.nationalgeographic.com/news/2006/10/061024-hippo-congo.html (Accessed on January 8, 2008)
UNESCO (2008). World Heritage. Salonga National Park. http://whc.unesco.org/en/list/280 (Accessed February 6, 2008)
UNEP-WCMC (2004). World Conservation Monitoring Centre of the United Nations Environment Programme. Species Data (unpublished, September 2004). Web site at: http://www.unep-wcmc.org Cambridge, England: UNEP-WCMC.
Corridors of Deforestation Surrounding the Roads near Bumba
Buys, P., Deichmann, U. and Wheeler, D. (2006). Road Network Upgrading and Overland Trade Expansion in Sub-Saharan Africa. Development Research Group – World Bank. Policy Research Working Paper WPS 4097. World Bank, Washington, DC. http://www.cgdev.org/doc/event%20docs/Trans-Africa%20Network%20(Color%20Version).pdf (Accessed November 12, 2007)
Hall, J.S., Harris, D.J., Medjibe, V. and Ashton, P.M.S. (2003). The effects of selective logging on forest structure and tree species composition in a Central African forest: implications for management of conservation areas. Forest Ecology and Management 183:249-264

358 �
Laporte, N.T., Stabach, J.A., Grosch, R., Lin, T.S. and Goetz, J. (2007). Expansion of industrial Logging in Central Africa. Science 316(5830):1451.
Wilkie, D.S., Sidle, J.G., Boundzanga, G.C. (1992). Mechancized Loggin, Market Hunting and a Bank Loan in Congo. Conservation Biology 6 (4):570-580.
Landsat-2 MSS, 12 December 1975, bands 2, 4 and 1
Landsat-7 ETM+, 03 February 2003, bands 7, 4 and 2
People Close in on the Gorillas of Virunga National Park
ICCN (2004). DRC Crisis in PNVi: Encroachment of Mikeno Sector by Robert Muir. (Accessed on June 16, 2004).
IUCN (1984). Protected Areas and World Heritage Sites, Virunga National Park, Democratic Republic of the Congo. http://whc.unesco.org/en/list/63 (Accessed on November 14, 2006)
Kalpers, J., E.A. Williamson, M. Robbins, A. McNeilage, A. Nzamurambaho, N. Lola and G Mugiri. (2003). Gorillas in the crossfi re: population dynamics of the Virunga mountain gorillas over the past three decades. Oryx 37(3):326-337.
WCS (2004). Kingdom of gorillas invaded by farmers ~ Thousands of people deforest mountain gorilla habitat. http://www.wcs.org/353624/2788676 (Accessed November 14, 2006)
ASTER-VNIR, 21 February 2005, bands 2, 3 and 1
Landsat-2 MSS, 06 February 1978, bands 2, 4 and 1
COTE D’IVOIRE
CIESIN (2000). Center for International Earth Science Information Network, World Resources Institute, and International Food Policy Research Institute, Gridded Population of the World, Version 2 alpha (Columbia University, Palisades, NY, 2000). http://sedac.ciesin.org/plue/gwp
FAO (2005). Irrigation in Africa fi gures – AQUASTAT Survey 2005. http://www.fao.org/nr/water/aquastat/countries/cote_divoire/cotedivoire_cp.pdf (Accessed on January 8, 2008)
FAO (2007). FAOSTAT statistical databases. http://faostat.fao.org/default.aspx (Accessed on January 18, 2008)
Mongabay.com. (2006). Cote d’Ivoire. Tropical Rainforest Country Profi le. http://rainforests.mongabay.com/20cotedivoire.htm (Accessed on January 8, 2008)
MONGOBAY.COM (2007). Cote D’ Ivoire. http://rainforests.mongabay.com/20cotedivoire.htm (Accessed on February 6, 2008)
Ramsar (2005). Ramsar Convention Secratariat .Additional Coastal Ramsar Sites in West Africa. http://www.ramsar.org/wn/w.n.cotedivoire_5_e.htm (Accessed on January 8, 2008)
UNEP-WCMC (1989). Protected Areas and World Heritage. http://www.unep-wcmc.org/sites/wh/tai.html (Accessed on January 8, 2008)
IUCN (2007). Species Survival Commission. Summary Statistics for Globally Threatened Species. Table 5. http://www.iucnredlist.org/info/stats (Accessed on January 8, 2008)
World Cocoa Foundation (n.d). Cocoa Market. Cocoa Production Statistics. http://www.worldcocoafoundation.org/info-center/statistics.asp (Accessed February 6, 2008)
The Loss of Beki Forest Reserve
FAO (2001). L’Etude prospective du secteur forestier en Afrique: Côte d’Ivoire. Forestry Sector Outlook Studies. Document de Travail FOSA - FOSA/WP/08. http://www.fao.org/DOCREP/003/X6780F/X6780F03.htm (Accessed on June 27, 2007)
ICCO (2006). Annual Report 2004/2005, International Cocoa Organization. http://www.icco.org/pdf/An_report/ARENGLISHV4.pdf (Accessed on January 15, 2008)
Kouacou, J.M.A. (2005). La Forêt Classée de Béki dans l’Est de la Côte d’Ivoire : de l’état de nature à l’état de culture…un quart de siècle de conquête paysanne à la loupe. Interactions Nature-Société, analyse et modèles. UMR6554 LETG, La Baule 2006
Pallix, G. and Comolet, A. (1996) L’impact environnemental des Politiques Macro Economiques d’Ajustement Structurel en Côte d’Ivoire. Rapport pour la Banque mondiale et le Ministre Français de la Coopération.
Landsat-5 TM, 18 January 1986, bands 7, 4 and 2
Landsat-7 ETM+, 14 March 2003, bands 7, 4 and 2
The Survival of Taï National Park
Chatelain, C. Gautier, L, and Spichiger, R. (1996). A recent history of forest fragmentation in southwestern Ivory Coast. Biodiversity and Conservation 5:37-53
Cat Specialist Group. (1996). Panthera pardus ssp. orientalis. 2007 IUCN Red List of Threatened Species. www.iucnredlist.org. (Accessed on December 18, 2007)
Collin ,G. and Boureïma. (2006). Rapport de mission Suivi de l’état de la conservation du Parc National de Taï en Côte d’Ivoire, site de Patrimoine Mondial, 10 - 23 Juin 2006. for UICN. UNESCO. http://whc.unesco.org/archive/2007/mis195-juin2006.pdf (Accessed on December 18, 2007)
IUCN (n. d.) Protected Areas and World Heritage - Taï National Park. http://www.unep-wcmc.org/sites/wh/tai.html (Accessed on December 18, 2007)
Refi sch, J. and Koné, I. (2005). Impact of Commercial Hunting on Monkey Populations in the Taï region, Côte d’Ivoire. Biotropica 37(1)136-144
WWF (n.d.) Conservation of Taï National Park. WWF website. http://www.panda.org/about_wwf/where_we_work/africa/where/ivory_coast/index.cfm?uProjectID=CI0004 (Accessed on December 18, 2007)
Landsat-5 TM, 09 March 1988, bands 7, 4 and 2
Landsat-7 ETM+, 13 December 2002, bands 7, 4 and 2
DJIBOUTI
FAO AGL (2003). Deserts and dryland areas. Terrastat online database. http://www.fao.org/ag/agl/agll/terrastat/#terrastatdb (Accessed on January 8, 2008)
FAO (n.d.). Fisheries and Aquaculture Department. Fishery and Aquaculture Country Profi le: Djibouti. http://www.fao.org/fi /website/FISearch.do?dom=country (Accessed on January 8, 2008)
FAO (2005). Irrigation in Africa fi gures – AQUASTAT Survey 2005. http://www.fao.org/nr/water/aquastat/countries/djibouti/djibouti_cp.pdf (Accessed on January 8, 2008)
FAO. (2007a). Land and Water Development Division. AQUASTAT Information System on Water and Agriculture: Online database. Rome: FAO. http://www.fao.org/nr/water/aquastat/data/query/index.html (Accessed on January 8, 2008)
FAO (2007b). FAOSTAT Online Statistical Service. http://faostat.fao.org (Accessed on January 8, 2008)
FAO (2008). FAOSTAT Online Statistical Service. http://faostat.fao.org/site/377/DesktopDefault.aspx?PageID=377 (Accessed on March 17, 2008)
The Africa Guide. (2008). Facts & Figures. http://www.africaguide.com/facts.htm (Accessed on February 6, 2008)
UNESA (2005). Population Division of the Department of Economic and Social Affairs. World Population Prospects: The 2004 Revision. Dataset on CD-ROM. New York. http://www.un.org/esa/population/ordering.htm (Accessed on January 8, 2008)
UN (2006). United Nations Population Division. World Urbanization Prospects: The 2005 Revision. Available on CD-ROM. New York: United Nations.
USAID (2006). Djibouti. Congressional Budget Justifi cation to the Congress – Fiscal Year 2006. http://www.usaid.gov/policy/budget/cbj2006/afr/dj.html (Accessed on January 8, 2008)
World Bank (2006). Djibouti at a Glance. Country Environment Fact Sheets. http://devdata.worldbank.org/AAG/dji_aag.pdf (Accessed on January 8, 2008)
Rapid Population Growth in Djibouti City
FAO (1997). Irrigation in the near east region in fi gures. FAO Water reports W4356/E. http://www.fao.org/docrep/W4356E/w4356e0b.htm (Accessed July 18, 2007)
FAO (2005). Djibouti – FAO Aquastat Country Profi le. http://www.fao.org/ag/agl/aglw/aquastat/countries/djibouti/indexfra.stm (Accessed on July 18, 2007)
FEWSNET (2004). Djibouti Livelihood Profi les – October 2004. FEWSNET – USAID FEWS NET Project. http://www.fews.net/livelihoods/fi les/dj/national.pdf (Accessed on July 18, 2007)
Karl, K. (1999). Cooperation in focus: Quenching a nation’s Thirst. The Courier ACP-EU 174, March-April 1999. http://ec.europa.eu/development/body/publications/courier/courier174/en/035_en.pdf#zoom=100 (Accessed on July 18, 2007)
UNICEF (2007). The European Union, UNICEF and the Djibouti gove4rnment provide clean water to thousands of rural residents.
UNICEF Media (2007). The European Union, UNICEF and the Djibouti government provide clean water to thousands of rural residents. http://www.unicef.org/media/media_40167.html (Accessed July 18, 2007)
WRI-Earthtrends (2003). Population, Health, and Human Well-Being—Djibouti. EarthTrends Country Profi les. http://earthtrends.wri.org/pdf_library/country_profi les/pop_cou_262.pdf (Accessed on July 18, 2007)
ASTER-VNIR, 12 April 2006, bands 2, 3 and 1
Landsat-5 TM, 13 June 1985, bands 7, 4 and 2
EGYPT
SoE (2006). Egypt State of the Environment Report. Ministry of State for Environmental Affairs, Cairo: Arab Republic of Egypt.
FAO (2005). Irrigation in Africa fi gures – AQUASTAT Survey 2005. http://www.fao.org/nr/water/aquastat/countries/egypt/egypt_cp.pdf (Accessed on January 8, 2008)
FAO (2007). FAOSTAT ResourceSTAT database. http://faostat.fao.org/site/405/default.aspx (Accessed on January 8, 2008)
Spalding, M.D., Ravilious, C. and Green, E. P. (2001). World Atlas of Coral Reefs. Prepared at UNEP-WCMC. Berkeley: University of California Press.
FAO (2008). AQUASTAT. General Summary Africa. http://www.fao.org/nr/water/aquastat/regions/africa/index.stm (Accessed on February 6, 2008)
UN (2006). United Nations Population Division. Urban Agglomerations 2005. http://www.un.org/esa/population/publications/WUP2005/2005urban_agglo.htm (Accessed on January 8, 2008)
WRI-EarthTrends (2007). Country Profi le for Egypt for theme: Agriculture and Food. http://earthtrends.wri.org/pdf_library/country_profi les/agr_cou_818.pdf (Accessed on February 6, 2008)
Megacity Growing in the Desert, Cairo
El-Batran M. and Arandel C. (1998). A shelter of their own: informal settlement expansion in Greater Cairo and government responses. Environment and Urbanization 10(1):217-232 http://eau.sagepub.com/cgi/reprint/10/1/217.pdf
Department of Energy (2003). Energy Information Administration. http://www.eia.doe.gov/emeu/cabs/egypenv.html (Accessed on December 8, 2006)
UN (2006). UN World Statistics Pocket Book, Department of Economic and Social Affairs, Statistics Division Series V No. 30, New York, 2006
US Library of Congress (n.d.). Major Cities – Egypt http://countrystudies.us/egypt/57.htm (Accessed on January 17, 2008)
UN (1999). United Nations Population Division, World Urbanization Prospects, the 1999 revision
NASA Earth Observatory (2002). http://earthobservatory.nasa.gov/Newsroom/NewImages/images.php3?img_id=10769 (Accessed on December 22, 2005)
NASA (2003). http://asterweb.jpl.nasa.gov/gallery-detail.asp?name=cairo (Accessed on December 22, 2005)
ASTER-VNIR, 02 December 2005, bands 2, 3 and 1
Landsat-1 MSS, 31 August 1972, bands 2, 4 and 1
The Disappearing Damietta Promontory
El Din, S.H. S. (1977). Effect of the Aswan High Dam on the Nile fl ood and on the estuarine and coastal circulation pattern along the Mediterranean Egyptian coast. Limnology and Oceanography, 22(2):194-207.
Frihy, O. and Lawrence, D. (2004). Evolution of the modern Nile delta promontories: development of accretional features during shoreline retreat. Environmental Geology 46:914-931.
Stanley, D.J. (1996). Nile delta: extreme case of sediment entrapment on a delta plain and consequent coastal land loss. Marine Geology 129:189-195.
Stanley, D.J. and Warne, A.G. (1993). Nile Delta: Recent Geological Evolution and Human Impact. Science 260:628-634.
ASTER-VNIR, 01 May 2005, bands 2, 3 and 1
Landsat-1 MSS, 31 August 1972, bands 2, 4 and 1
The Nile’s Waters in the Desert, Toshka Lakes
El Bastawesy, M., Arafat, S. and Khalaf, F. (2007). Estimation of water loss from Toshka Lakes using remote sensing and GIS. Presented at: 10th AGILE International Conference on Geographic Information Science 2007, Aalborg University, Denmark.
Egypt State Information Service (2005). Agricultural Projects Toshka. http://www.sis.gov.eg/En/Economy/Sectors/Agriculture/050301000000000001.htm (Accessed on November 6, 2007)
Elewa, H.H. (2006). Water resources and geomorphological characteristics of Tushka and west of Lake Nasser, Egypt. Hydrogeology Journal 14:942-954.
Kim, J. and Sultan, M. (2002). Assessment of the long-term hydrologic impacts of Lake Nasser and related irrigation projects in Southwestern Egypt. Journal of Hydrology 262:68-83
Lillesand, T.M. and Chipman, J.W. (2007). Satellite-based assessment of the dynamics of new lakes in southern Egypt. International Journal of Remote Sensing 28(19):4365-4379.
Wichelns, D. (2003). Economic Issues Regarding Irrigation Developments in Southern Egypt and on the Sinai Peninsula. Water International 28(1):36-42.
Landsat-5 TM, 13 September 1984 and 29 September 1987, bands 7, 4 and 2
Landsat-7 ETM+, 23 August and 01 September 2000, bands 7, 4 and 2
Landsat-7 ETM+, 05 September and 12 September 2007, bands 7, 4 and 2
EQUATORAL GUINEA
BIOKO (2006). Bioko Biodiversity Protection Program. Monkeys in Trouble: The Rapidly Deteriorating Conservation Status of the Monkeys on Bioko Island, Equatorial Guinea. http://www.bioko.org/conservation/2006MonkeysInTroublev8.pdf (Accessed on January 9, 2008)
EIA (2007a). Energy Information Administration: Equatorial Guinea. Country Analysis Briefs. US Department of Energy. http://www.eia.doe.gov/emeu/cabs/Equatorial_Guinea/Oil.html (Accessed on January 9, 2008)
EIA (2007b). Energy Information Administration. Equatorial Guinea. http://www.eia.doe.gov/cabs/Equatorial_Guinea/Background.html (Accessed on February 6, 2008)
FAO (2003). Forestry Division. Forestry Outlook Study for Africa: Subregional Report – Central Africa. ftp://ftp.fao.org/docrep/fao/005/y8719e/y8719e00.pdf (Accessed on January 9, 2008)
FAO (2007). Land and Water Development Division. AQUASTAT Information System on Water and Agriculture: Online database. http://www.fao.org/nr/water/aquastat/data/query/index.html (Accessed on January 9, 2008)
Sunderland, T.C.H and Tako, C.T. (1999). The Exploitation of Prunus Africana on the island of Bioko, Equatorial Guinea. Gulf of Guinea Conservation Group. Gulf of Guinea Island’s Biodiversity Network. http://www.ggcg.st/bioko/bioko_prunus.htm (Accessed on February 6, 2008)
UN (2007). Millennium Development Goals Indicators. http://mdgs.un.org/unsd/mdg/Default.aspx (Accessed on January 9, 2008)
UNESA (2006). Population Division of the Department of Economic and Social Affairs. World Urbanization Prospects: The 2005 Revision. Dataset on CD-ROM. New York.

359�
World Bank (2007). Development Data Group, The World Bank: 2007 World Development Indicators Online. Washington, DC. http://go.worldbank.org/3JU2HA60D0 (Accessed on January 9, 2008)
Oil and Gas Infrastructure at Punta Europa, Equatorial Guinea
Clean Development Mechanism (CDM). (2006) Reduction of Flaring and Use of Recovered Gas for Methanol Production, Version 2. https://cdm.unfccc.int/UserManagement/FileStorage/PBOEU77Q7BJNWE5YZBUU2MXHH2U3RG (Accessed on January 18, 2008)
Frynas, J. G., (2004). The oil boom in Equatorial Guinea. African Affairs, 103/413, 527-546.
International Gas Union (IGU). (2006). Gas to power-Africa. http://www.wgc2006.nl/fi les/sprb /Gas%20to%20Power%20Africa.pdf (Accessed on January 18, 2008)
McSherry, B. (2006). The political economy of oil in Equatorial Guinea , African studies Quarterly, the online journal for African studies, vol. 8, Issue 3. http://www.africa.ufl .edu/asq/v8/v8i3a2.htm#_edn2 (Accessed on January 18, 2008)
Ministry of Mines, Industry and Energy (2005). Hydrocarbons and mining in Equatorial Guinea. http://www.equatorialoil.com/pdfs/EQG%20Brochure%20August%202005.pdf (Accessed on January 18, 2008)
Oilvioce. (2007), Marathon and partners deliver fi rst LNG cargo from Equatorial Guinea Train 1 LNG project six months ahead of original schedule. http://www.oilvoice.com/Marathon_and_Partners_Deliver_First_LNG_Cargo_From_Equatoria/967.htm (Accessed on January 18, 2008)
United State Initiative on Joint implementation (USIJI) (2001). Equatorial Guinea/Environmentally Responsible gas processing on Bioko Island. http://www.usiji.com/report6/EquatorialGuinea1_13-13.pdf (Accessed on January 18, 2008)
GeoEye-IKONOS, 08 February 2007, bands 3, 2 and 1
GeoEye-IKONOS, 12 November 2000, bands 3, 2 and 1
ERITREA
BBC.CO.UK (2003). Science & Nature: Animals. The Life of Mammals. The rediscovery of Eritrea’s elephants. http://www.bbc.co.uk/nature/animals/features/300feature1.shtml (Accessed on February 6, 2008)
Earth Trends (2007). Calculation using water data from FAO Land and Water Development Division. AQUASTAT Information System on Water and Agriculture: Online database. Rome: FAO. http://www.fao.org/nr/water/aquastat/data/query/index.html and
FAO (n.d.). Fisheries and Aquaculture Department. Fishery and Aquaculture Country Profi le: Eritrea. http://www.fao.org/fi /website/FISearch.do?dom=country (Accessed on January 8, 2008)
FAO (2001). Forestry Department. FOSA Country Report – Eritrea. Forestry Sector Outlook Studies. http://www.fao.org/docrep/003/x6782e/x6782e00.htm#TOC (Accessed on January 8, 2008)
FAO AGL (2003). Land Degradation Severity. Terrastat online database. http://www.fao.org/ag/agl/agll/terrastat/#terrastatdb (Accessed on January 8, 2008)
FAO (2005a). Land and Water Development Division. AQUASTAT Information System on Water and Agriculture: Online database.. http://www.fao.org/nr/water/aquastat/dbase/index.stm (Accessed on January 8, 2008)
FAO (2005b). Irrigation in Africa fi gures – AQUASTAT Survey 2005. http://www.fao.org/nr/water/aquastat/countries/eritrea/eritrea_cp.pdf (Accessed on January 8, 2008)
Spalding, M., Blasco, F., and Field, C. (Eds.). (1997).World Mangrove Atlas. The International Society for Mangrove Ecosystems (ISME), Okinawa, Japan
UNESA (2005). Population Division of the Department of Economic and Social Affairs. World Population Prospects: The 2004 Revision. Dataset on CD-ROM. New York: United Nations. http://www.un.org/esa/population/ordering.htm (Accessed on January 8, 2008)
UNDP (2006). The 2006 Human Development Report Launched in Eritrea. http://www.er.undp.org/news/221106-hdr.html (Accessed on January 8, 2008)
UNEP (2006). Africa Environment Outlook 2: Our Environment, Our Wealth. Nairobi: UNEP Division of Early Warning and Assessment.
UN (2007a). World Statistics Pocketbook. United Nations Statistics Division. Department of Economics and Social Affairs, New York.
UN (2007b). Millennium Development Goals Indicators. Online at: http://mdgs.un.org/unsd/mdg/Default.aspx (Accessed on January 8, 2008)
The Manzanar Project, Cultivating Mangroves at Hagigo
ECOS (2004). The Man Who Defeated Famine. CSIRO Publishing, Collingwood, Australia. http://www.publish.csiro.au/nid/214/issue/1896.htm (Accessed on June 13, 2007)
Sato, G., Fisseha, A., Gebrekiros, S., Karim, H.A., Negassi, S., Fischer, M., Yemane, E., Teclemariam, J. and Riley, R. (2005). A Novel Approach to Growing Mangroves on the Coastal Mud Flats of Eritrea With the Potential for Relieving Regional Poverty and Hunger. Wetlands 25(3):779-779.
The Manzanar Project. (n.d.) http://www.manzanarprojectfoundation.com/ (Accessed on April 24, 2007]
ASTER-VNIR, 26 December 2005, bands 2, 3 and 1
Landsat-1 MSS, 31 January 1973, bands 2, 4 and 1
ETHIOPIA
CIA (2007). The World Factbook. Ethiopia. https://www.cia.gov/library/publications/the-world-factbook/geos/et.html (Accessed on January 8, 2008)
UNCCD (2002). Ethiopia Environmental Protection Authority. The Second National Report on the Implementation of UNCCD/NAP in Ethiopia. Addis Ababa, Ethiopia. Online at: http://www.unccd.int/cop/reports/africa/national/2002/ethiopia-eng.pdf (Accessed on January 8, 2008)
CBD (2005). Convention on Biological Diversity. Ethiopia Institute of Biodiversity Conservation. Ethiopia Third National Report. Online at: http://ibc-et.org/ibc/pubn/fi les/CBD_Third_National_Report_Ethiopia.pdf
FAO (2005). Irrigation in Africa fi gures – AQUASTAT Survey 2005. http://www.fao.org/nr/water/aquastat/countries/ethiopia/ethiopia_cp.pdf (Accessed on January 8, 2008)
FAO (2007). FAOSTAT ResourceSTAT database. http://faostat.fao.org/site/405/default.aspx (Accessed on January 8, 2008)
FAO AGL (2003). Land Degradation Severity. Terrastat online database. http://www.fao.org/ag/agl/agll/terrastat/#terrastatdb (Accessed on January 8, 2008)
National Environment Research Council (2007). Planet Earth Autumn 2006. The birth of an ocean. http://www.nerc.ac.uk/publications/planetearth/2006/autumn/aut06-ocean.pdf (Accessed on February 6, 2008)
UN (2006). Millennium Development Goals Indicators. http://mdgs.un.org/unsd/mdg/Default.aspx (Accessed on February 6, 2008)
UNESA (2006). Population Division of the Department of Economic and Social Affairs. World Urbanization Prospects: The 2005 Revision. Available on CD-ROM. New York.
UN (2007). Millennium Development Goals Indicators. http://mdgs.un.org/unsd/mdg/Default.aspx (Accessed on January 8, 2008)
Urban Sprawl in Addis Ababa
Cheru, F. (2005) Globalization and uneven urbanization in Africa; the limits to effective Urban governance in the provision of basic services. The Globalization Research Center – Africa – University of California Los Angeles. http://www.globalization-africa.org/papers_detail.php?Paper_ID=57 (Accessed on January 15, 2008)
ASTER-VNIR, 26 December 2005, bands 2, 3 and 1
Landsat-1 MSS, 31 January 1973, bands 2, 4 and 1
Shrinking Water Resources, Lake Alemaya
Gebissa, E. (2004). Leaf of Allah, Agricultural Transformation in Harerge Ethiopia 1875-1991. Ohio University Press, Athens, Ohio.
Lemma, B. (2003). Ecological changes in two Ethiopian lakes caused by contrasting human intervention. Limnologica. 33:44-53.
UNICEF (2004). Responding to Water Disaster in Harar. http://www.google.com/search?hl=en&q=RESPONDING+TO+WATER+DISASTER+IN+HARAR&btnG=Google+Search&safe=active (Accessed on September 6, 2007)
World Bank (2006). Ethiopia; Managing Water Resources to Maximize Sustainable Growth – Country Water Resources Assistance Strategy. http://siteresources.worldbank.org/INTWRD/Resources/Ethiopia_fi nal_text_and_cover.pdf (Accessed on September 6, 2007)
ASTER-VNIR, 28 December 2005, bands 2, 3 and 1
Landsat-5 TM, 23 January 1986, bands 7, 4 and 2
GABON
CBD (1999). Republic of Gabon, National Biodiversity Strategy Action Plan. http://www.cbd.int/countries/default.shtml?country=ga
CBD (2007). Secretariat of the Convention on Biological Diversity, “Gabon – Description.” Country Profi les. http://www.cbd.int/countries/default.shtml (Accessed on January 8, 2008)
CIA (2007). Gabon. The World Factbook. https://www.cia.gov/library/publications/the-world-factbook/geos/sf.html (Accessed on January 8, 2008)
CIESIN (2000). Center for International Earth Science Information Network (CIESIN), World Resources Institute, and International Food Policy Research Institute, “Gridded Population of the World, Version 2 alpha” (Columbia University, Palisades, NY, 2000) available at: http://sedac.ciesin.org/plue/gwp (Accessed on January 15, 2008)
EarthTrends (2006). Calculated using population data from: Population Division of the Department of Economic and Social Affairs of the United Nations Secretariat, 2005. World Population Prospects: The 2004 Revision. Dataset on CD-ROM. New York: United Nations. http://www.un.org/esa/population/ordering.htm (Accessed on January 8, 2008)
FAO (2005). FAOSTAT statistical databases. http://faostat.fao.org/default.aspx (Accessed on January 18, 2008)
FAO (2007). State of the World’s Forests 2007. ftp://ftp.fao.org/docrep/fao/009/a0773e/a0773e10.pdf (Accessed on February 6, 2008)
MONGOBAY.COM (2007). Gabon. http://rainforests.mongabay.com/20gabon.htm (Accessed on February 6, 2008)
UNESA (2006). Population Division of the Department of Economic and Social Affairs. World Urbanization Prospects: The 2005 Revision. Dataset on CD-ROM. New York: United Nations.
UNEP (2002). Africa Environment Outlook: past, present and future perspectives. Nairobi: UNEP. http://www.unep.org/dewa/Africa/publications/AEO-1/ (Accessed on January 8, 2008)
UN (2007). Millennium Development Goals Indicators. http://mdgs.un.org/unsd/mdg/Default.aspx. (Accessed on January 8, 2008)
Walsh, P.D. et al. (2003). Catastrophic ape decline in western equatorial Africa. Nature 422, 611-614 (10 April 2003).
Increased Forestry in the Guineo-Congolese Forest
Logging and deforestation (n.d.) http://www.illegal-logging.info/sub_approach.php?subApproach_id=68&approach_id=18#document_anchor (Accessed on January 24, 2008)
FAO (n.d.). http://www.fao.org/forestry/site/23831/en/gab/page.jsp (Accessed on January 24, 2008)
WRI .(2000). Gabon’s dependence on exports of Okoumé for logging industry http://www.wri.org/biodiv/newsrelease_text.cfm?NewsReleaseID=69 (Accessed on January 24, 2008)
Landsat-4 TM, 10 May 1988, bands 2, 4 and 1
Landsat-7 ETM, 08 March 2000, bands 7, 4 and 1
GAMBIA, THE
FAO (1997). Land and Water Development Division. Irrigation Potential in Africa: A basin approach. http://www.fao.org/docrep/W4347E/w4347e00.HTM (Accessed on January 8, 2008)
FAO (2000-2007). Fisheries and Aquaculture Department. Gambia Fisheries and Aquaculture Country Profi le. http://www.fao.org/fi /website/FISearch.do?dom=country (Accessed on January 8, 2008)
FAO (2005). Irrigation in Africa fi gures – AQUASTAT Survey 2005. http://www.fao.org/nr/water/aquastat/countries/gambia/gambia_cp.pdf (Accessed on January 8, 2008)
International Water Management Institute. A Directory of African Wetlands. Gambia. (1992). http://www.iwmi.cgiar.org/wetlands/pdf/CONTENTS.pdf (Accessed February 20, 2008)
The Gambia Department of Parks and Wildlife Management (2006). Third National Biodiversity Report. http://www.biodiv.org/doc/world/gm/gm-nr-03-en.pdf (Accessed on January 8, 2008)
UNESCO (2002). “Where have all the beaches gone?” UNESCOPRESS Media Services. http://portal.unesco.org/en/ev.php-URL_ID=4854&URL_DO=DO_TOPIC&URL_SECTION=201.html (Accessed on January 8, 2008)
UNESA (2005). Population Division of the Department of Economic and Social Affairs. World Population Prospects: The 2004 Revision. Dataset on CD-ROM. New York. http://www.un.org/esa/population/ordering.htm (Accessed on January 8, 2008)
UN (2007). Millennium Development Goals Indicators. http://mdgs.un.org/unsd/mdg/Default.aspx. (Accessed on January 8, 2007)
Urban Sprawl in the Greater Banjul Area
Access Gambia ( n.d.). Gambia Guide – Abuko Nature Reserve, Gambia. http://www.accessgambia.com/information/abuko-nature-reserve.html (Accessed on September 24, 2007)
Columbia (2007). The Atlas of Gambia. Columbia University. http://www.columbia.edu/~msj42/PeopleandCulture.htm (Accessed on September 24, 2007)
Hirani, P. (2005). Ethnoecological Study of the Mangroves of the Tanbi Wetland Complex, The Gambia. Masters Thesis – Vrije Universiteit Brussel. http://webzoom.freewebs.com/danaemaniatis/ph%20main%20textlow%20qual.pdf (Accessed September 24, 2007)
NGA (n.d.) National Geospacial Agencey Gazetteer. http://gnswww.nga.mil/geonames/GNS/index.jsp (Accessed on September 24, 2007)
Ramsar (n.d.). World Wetlands Day in Gambia, New Ramsar site named. http://www.ramsar.org/wwd/7/wwd2007_rpts_gambia1.htm (Accessed on September 24, 2007)
ASTER-VNIR, 25 December 2006, bands 2, 3 and 1
Landsat-1 MSS, 21 February 1973, bands 2, 4 and 1
GHANA, REPUBLIC OF
ACOPS (n.d.). Advisory Committee on Protection of the Sea. Coastal Erosion Control in sub-Saharan Africa (COS1). Project Proposal. http://www.acops.org/African_Process/COASTAL%20EROSION%20COS1.pdf (Accessed on January 8, 2008)
Amlalo, D. S. (2006). The Protection, Management and Development of the Marine and Coastal Environment of Ghana. In Administering Marine Spaces: International Issues. International Federation of Surveyores (FIG) Commissions 4 & 7 Working Group 4.3. Frederiksberg, Denmark: International Federation of Surveyors. http://www.fi g.net/pub/fi gpub/pub36/fi gpub36.htm (Accessed on January 8, 2008)
FAO (2000-2007). Fisheries and Aquaculture Department. Ghana Fisheries and Aquaculture Country Profi le. http://www.fao.org/fi /website/FISearch.do?dom=country (Accessed on January 8, 2008)
FAO (2005). Irrigation in Africa fi gures – AQUASTAT Survey 2005. http://www.fao.org/nr/water/aquastat/countries/ghana/ghana_cp.pdf (Accessed on January 8, 2008)
FAO (2007). FAOSTAT statistical databases. http://faostat.fao.org/default.aspx (Accessed on January 18, 2008)
International Rivers (2007). Environmental Impacts of Large Dams: African examples. http://www.internationalrivers.org/en/africa/environmental-impacts-large-dams-african-examples (Accessed on February 6, 2008)

360 �
Tanaka, M., Adjadeh, T.A., Tanaka, S. and Sugimura, T. (2002) Water surface area measurement of Lake Volta using SSM/I 37-GHz polarization difference in rainy season. Adv. Space Res. 30(11):2501-2504.
UNCCD (2002). Ghana Environmental Protection Agency. National Action Programme to Combat Drought and Desertifi cation. Accra, Ghana: Republic of Ghana. http://www.unccd.int/actionprogrammes/africa/national/2002/ghana-eng.pdf (Accessed on January 8, 2008)
UN (2007). Millennium Development Goals Indicators. http://mdgs.un.org/unsd/mdg/Default.aspx (Accessed on January 8, 2008)
United Nations Conference on Trade And Development (n.d). INFOCOMM. Cocoa. Market. http://unctad.org/infocomm/anglais/cocoa/market.htm (Accessed on February 6, 2008)
Forest Reserves under Pressure from all Sides
Anane, M. (2003). Trouble Looms over Ghana’s Forest Reserves. World Rainforest Bulletin, No. 68. http://www.wrm.org.uy/bulletin/68/Ghana.html (Accessed on January 9, 2008)
FERN (2006). Forest Governance in Ghana: An NGO Perspective. A report produced for FERN by Forest Watch Ghana, March 2006.
Tockman, J. (2002). IMF, mining and logging. World Rainforest Movement, Bulletin No. 54. http://www.wrm.org.uy/bulletin/54/Ghana.html. (Accessed on January 9, 2008)
DigitalGlobe-Quickbird, 02 December 2002, bands 3, 2 and 1
Landsat-1 MSS, 25 November 1973, bands 2, 4 and 1
Landsat-7 ETM+, 02 February 2000, 15 January and 20 March 2002, bands 7, 4 and 2 (pan sharpened – band 8)
Landsat-7 ETM+, 24 December 2002 and 19 February 2003, bands 7, 4 and 1
Gold Mining in Wassa West District
Akabzaa, T. and Darimani, A. (2001). Impact of mining sector investment in Ghana: a study of the Tarkwa mining region, Draft Report prepared for SAPRI.
Akpalu, W. and Parks, P.J. (2007). Natural resource use confl ict: gold mining in tropical rainforest in Ghana. Environment and Development Economics 12:55-72
Hilson, G. and Nyame, F. (2006). Gold mining in Ghana’s forest reserves: a report on the current debate. Area 38(2):175-185
Kusimi, J.M. (2007). Landcover Change in the Wassa West District of Ghana. Master’s Thesis – Royal Institute of Technology (KTH) Department of Land and Water Resources Engineering, Stockholm, Sweden.
Landsat-5 TM, 29 December 1986, bands 7, 4 and 2
Landsat-7 ETM+, 15 January 2002, bands 7, 4 and 2
GUINEA
Campbell, B. (1997). Environmental Policies, Mining and Structural Adjustment in Guinea. University of Quebec in Montreal, Department of Political Science. Presented at the International Studies Association 37th Annual Conference. http://www.unites.uqam.ca/grama/pdf/Environmental%20Policies-Guinea.pdf (Accessed on January 9, 2008)
CBD (2002). Convention on Biological Diversity. Guinea Ministry of Mines, Geology and Environment. National Strategy and Action Plan for Biological Diversity. Conakry, Guinea: Republic of Guinea. http://www.cbd.int/doc/world/gn/gn-nbsap-01-p1-en.pdf (Accessed on January 9, 2008)
ILO (2008). International Labor Organisation. http://www.ilo.int/public/english/employment/strat/download/wr04c3en.pdf (Accessed on March 17, 2008)
FAO (2005). Irrigation in Africa fi gures – AQUASTAT Survey 2005. http://www.fao.org/nr/water/aquastat/countries/guinea/guinea_cp.pdf (Accessed on January 9, 2008)
U.S Department of State (2008). Guinea. http://www.state.gov/r/pa/ei/bgn/2824.htm (Accessed on February 6, 2008)
USGS (2008). United States Geological Survey Commodity Statistics and Information. Bauxite and Alumina Statistics and Information. http://minerals.usgs.gov/minerals/pubs/commodity/bauxite/mcs-2008-bauxi.pdf (Accessed on March 17, 2008)
City between the Mangroves, Conakry
GEF (2006). Coastal Marine and Biodiversity Management Project, Republic of Guinea. Global Environment Facility / World Bank Document Report No: 33214-GN
Menard, C. and Clarke, G. R.G. (1999). A Transitory Regime Water Supply in Conakry, Guinea. World Bank Policy Research Working Paper No. 2362. Accessed June 11, 2007 at SSRN: http://ssrn.com/abstract=630734
U.S. State Department. (n.d.). Background Note: Guinea. http://www.state.gov/r/pa/ei/bgn/2824.htm ( Accessed on June 11, 2007)
ASTER-VNIR, 22 February 2007, TerraLook simulated true color
Landsat-2 MSS, 25 March 1975, TerraLook simulated true color
Mining in a biodiversity “hotspot,” Sangredi Mine
BBC (2007). Guinea takes control of its minerals, BBC news, Monday 15 January 2007. http://news.bbc.co.uk/1/hi/business/6254719.stm (Accessed on August 10, 2007)
Conservation International (2006). Conservation International and Guinee Ecologie Launch Report on Environment in Boke Prefecture. http://www.celb.org/xp/CELB/news-events/press_releases/08242006a.xml (Accessed on August 10, 2007)
IRN (2005). Foiling the Aluminum Industry. International Rivers Network. Berkely, CA. http://www.irn.org/pdf/aluminum/Foiling2005.pdf (Accessed on August 10, 2007)
Mittermeier, R.A., Gil, P.R., Hoffmann, M., Pilgrim, J., Brooks, T., Mittermeier, C.G., Lamoreux, J., Da Fonseca, G. A.B. (2004). Hotspots Revisited: Earth’s Biologically Richest and Most Endangered Terrestrial Ecoregions. Cemex Books on Nature, San Pedro de los Pinos, México.
Wright, H.E., McCullough, J., and Diallo, M.S. (2007). Rapid Biological Assessment of Boké Préfecture, Northwestern Guinea. (Inventaire biologique rapide de la préfecture de Boké dans le nord-ouest de la Guinée.): RAP Bulletin of Biological Assessment, 41. Distributed for Conservation International. 192 p. 8-1/2 x 11 Series: (CI-RAP) Conservation International Rapid Assessment Program
ASTER-VNIR, 26 March 2007, bands 2, 3 and 1
Landsat-5 TM, 11 February 1986, bands 7, 4 and 2
GUINEA-BISSAU
FAO AGL (2003). Land Degradation Severity. Terrastat online database. http://www.fao.org/ag/agl/agll/terrastat/#terrastatdb (Accessed on January 7, 2008)
FAO (2005). Forestry Division. Global Forest Resources Assessment 2005. Rome: FAO. http://www.fao.org/forestry/site/fra2005/en/ (Accessed on January 7, 2008)
FAO (2006). FAOSTAT Online Statistical Service. Rome: FAO. http://faostat.fao.org (Accessed on January 7, 2008)
Mongabay.com (2006). Guinea-Bissau. Tropical Rainforest Country Profi le. http://rainforests.mongabay.com/20guinea-bissau.htm (Accessed on January 7, 2008)
USAID (2005). Senegal. Press Release. USAID join private sector to boost Guinea- Bissau cashew resources. http://senegal.usaid.gov/news/releases/2005/05_06_28_GB_cashews.html (Accessed on February 6, 2008)
UN (2007). Millennium Development Goals Indicators. http://mdgs.un.org/unsd/mdg/Default.aspx. (Accessed on January 7, 2008)
Balanta Rice Farming around the Gêba Estuary
Hawthorne, W. (2003). Planting Rice and Harvesting Slaves: Transformations along the Guinea Bissau coast, 1400-1900. Social History of Africa. Eds. Isaacman, A. and Allmann J. Portsmouth, NH: Heinemann.
USDoS – US Department of State, Bureau of African (2007). Background Note: Guinea-Bissau: Economy. http://www.state.gov/r/pa/ei/bgn/5454.htm (Accessed on May 1, 2007)
DigitalGlobe-Quickbird, 08 December 2005, bands 3, 2 and 1
Landsat-7 ETM+, 08 March 2007, bands 7, 4 and 2
KENYA
FAO (2001). Committee on Commodity Problems. Fourteenth Session of the Intergovernmental Group on Tea. New Delhi, India. Medium-Term Outlook for Tea. http://www.fao.org/DOCREP/MEETING/003/Y1419E.HTM#P39_3820 (Accessed on February 6, 2008)
FAO (2007). Land and Water Development Division. AQUASTAT Information System on Water and Agriculture: Online database. Rome: FAO. http://www.fao.org/nr/water/aquastat/data/query/index.html (Accessed on January 9, 2008)
The Africa Guide (2008). Kenya. http://www.africaguide.com/country/kenya/ (Accessed on February 6, 2008)
UNCCD (2002). Republic of Kenya Ministry of Environment and Natural Resources. National Action Programme: A Framework for Combating Desertifi cation in Kenya. Nairobi: National Environment Secretariat. http://www.unccd.int/php/countryinfo.php?country=KEN (Accessed on January 9, 2008)
UNESCO (1999). Lake Nakuru National Park. The World Heritage List. Online at: http://whc.unesco.org/en/tentativelists/1344/
UN (2006). UN Offi ce for the Coordination of Humanitarian Affairs KENYA: Food situation getting worse, warns FEWS Net. IRIN online news service. http://www.irinnews.org/report.aspx?reportid=58568 (Accessed on January 9, 2008)
UN-Water (2006). Kenya National Water Development Report. http://unesdoc.unesco.org/images/0014/001488/148866E.pdf (Accessed on January 9, 2008)
UN (2007). Millennium Development Goals Indicators. http://mdgs.un.org/unsd/mdg/Default.aspx (Accessed on January 9, 2008)
World Infozone. (2008). Kenya. http://www.worldinfozone.com/country.php?country=Kenya (Accessed on February 6, 2008)
Protection and Management of Mount Kenya
FAO (2002). Mount Kenya: Inappropriate Settlement of Highlands by Lowlanders. In Highland – Lowland Interactive Systems – Jack D. Ives, Ottawa, Canada. http://www.fao.org/forestry/webview/media?mediaId=12408&langId=1 (Accessed on October 18, 2007)
KFWG (2004). Changes in Forest Cover in Kenya’s Five “Water Towers” 2000-2003. Kenya Forests Working Group. http://www.unep.org/dewa/assessments/EcoSystems/land/mountain/Tower/index.asp (Accessed on October 18, 2007)
KWS (1999). Aerial Survey of the Destruction of Mt. Kenya, Imenti and Ngare Ndare Forest Reserves. Kenya Wildlife Service Report, August, 1999. http://www.unep.org/expeditions/docs/Mt-Kenya-report_Aerial%20survey%201999.pdf (Accessed on October 18, 2007)
World Heritage Committee (1997). Reports of the Rapporteurs of the session of the Bureau of the World Heritage Committee held in 1997 – Item 4. WHC-97/CONF.208/4B. http://whc.unesco.org/archive/repbu97b.html (Accessed on October 18, 2007)
DigitalGlobe-Quickbird, 12 June 2005, bands 3, 2 and 1
Landsat-7, ETM+, 08 February 2007, bands 7, 4 and 2
Landsat-2 MSS, 24 January 1976, bands 2, 4 and 1
Large-scale Irrigated Agriculture at Yala Swamp
P.A. ALOO. (2003). Biological diversity of the Yala Swamp lakes, with special emphasis on fi sh species composition, in relation to changes in the Lake Victoria Basin (Kenya): threats and conservation measures. Biodiversity and Conservation 12: 905–920.
Rapid Assessment of the Yala Swamp Wetlands. (2006). The Kenya Wetlands Forum - East African Wildlife Society. www.eawildlife.org/programme_areas/Yala Assesment Report.pdf (Accessed on January 24, 2008)
ASTER-VNIR, 04 September 2002, bands 2, 3 and 1
ASTER-VNIR, 22 February 2007, bands 2, 3 and 1
LESOTHO
FAO (2005). Irrigation in Africa fi gures – AQUASTAT Survey 2005. http://www.fao.org/nr/water/aquastat/countries/lesotho/lesotho_cp.pdf (Accessed on January 9, 2008)
FAO (2007). FAOSTAT statistical databases. FAO: Rome. http://faostat.fao.org/default.aspx (Accessed on January 18, 2008)
Lesotho National Environment Secretariat (1998). Biological Diversity in Lesotho, Convention on Biological Diversity: First Country Report to the COP. http://www.cbd.int/doc/world/ls/ls-nr-01-en.pdf (Accessed on January 9, 2008)
Lesotho National Environment Secretariat (2000). Biological Diversity in Lesotho: a Country Study. Maseru, Lesotho: Ministry of Environment, Gender & Youth Affairs.
Mosenene, L. (n.d). Soil- water and conservation tillage practices in Lesotho: Experiences of SWACAP. FAO. http://www.fao.org/ag/ags/agse/agse_s/3ero/namibia1/c19.htm (Accessed on February 6, 2008)
UN (2007). Millennium Development Goals Indicators. http://mdgs.un.org/unsd/mdg/Default.aspx (Accessed on January 9, 2008)
World Infozone (2008). Lesotho Facts. http://www.worldinfozone.com/facts.php?country=Lesotho (Accessed on February 6, 2008)
The Lesotho Highlands Water Project
Earth Observatory (n.d.). Lesotho Highlands Water Project. http://earthobservatory.nasa.gov/Newsroom/NewImages/images.php3?img_id=17357 (Accessed on September 20, 2007)
IUCN (n.d.). The Lesotho Highlands Water Project: environmental fl ow allocations in an international river. http://www.iucn.org/themes/wani/fl ow/cases/Lesotho.pdf (Accessed on September 20, 2007)
IRN (2001). Pipe Dreams, The World Bank’s Failed Efforts to Restore Lives and Livelihoods of Dam-Affected People in Lesotho. International Rivers Network. http://www.irn.org/programs/lesotho/pdf/pipedreams.pdf (Accessed on September 20, 2007)
Keketso, L. (2003). The Mixed Blessings of the Lesotho Highlands Water Project. Mountain Research and Development, 23(1):7-10
LHDA. (n.d.). Lesotho Highlands Development Authority http://www.lhda.org.ls/news/archive2004/apr04/inauguration_report.htm (Accessed on January 24, 2008)
Matete, M.E. (2006). The ecological economics of inter-basin water transfers: The Case of the Lesotho Highlands Water Project. PhD Thesis University of Pretoria. http://upetd.up.ac.za/thesis/available/etd-06052006-145825/unrestricted/00front.pdf (Accessed on September 20, 2007)
SAIPC (n.d.). Lesotho Highlands Water Project Corruption Trials, Southern African Information portal on Corruption. http://www.ipocafrica.org/cases/highlands/index.htm (Accessed on September 20, 2007)
Landsat-5 TM, 23 April 1991, bands 7, 4 and 2
Landsat-7 ETM+, 07 March 2006, bands 7, 4 and 2
LIBERIA
BBC WEATHER (2006). Average Conditions. Monrovia, Liberia. http://www.bbc.co.uk/weather/world/city_guides/results.shtml?tt=TT000310 (Accessed on February 6, 2008)
CIA (2008). The World Factbook. Liberia. https://www.cia.gov/library/publications/the-world-factbook/geos/li.html (Accessed on February 6, 2008)
National Biodiversity Strategy and Action Plan (n.d.). Republic of Liberia. http://www.biodiv.org/doc/world/lr/lr-nbsap-01-p1-en.pdf (Accessed on January 9, 2008)

361�
UNEP (2004). Restoring the Battered and Broken Environment of Liberia One of the Keys to a New and Sustainable Future. UNEP News Centre. http://www.unep.org/Documents.Multilingual/Default.asp?DocumentID=384&ArticleID=4411&l=en (Accessed on January 9, 2008)
UN. (2007). Millennium Development Goals Indicators. http://mdgs.un.org/unsd/mdg/Default.aspx (Accessed on January 9, 2008)
Harbel Rubber Plantation
Firestone Liberia. (2007). Firestone Liberia Concession Agreement. http://www.fi restonenaturalrubber.com/index.asp?id=faq (Accessed on June 19, 2007)
Globalsecurity.org. (2007). Harbel. http://www.globalsecurity.org/military/world/liberia/harbel.htm (Accessed on March 27, 2007)
Laborrights.org (2006) Stopping Firestone: Getting Rubber to Meet the Road, by Roxanne Lawson and Tim Newman. http://www.laborrights.org/press/Firestone/timfi restone_fpif_120706.htm (Accessed on March 27, 2007)
Suratman, M.N., Bull, G.Q., Leckie, D.G., LeMay, V. and Marshall, P.L. (2002). Modelling attributes of Rubberwood (Hevea brasiliensis) stands using spectral radiance recorded by Landsat Thematic Mapper in Malaysia. International Geoscience and Remote Sensing Symposium, 2002, VOL 4, pages IV: 2087-2090
UNEP. (2004). Desk Study on the Environment in Liberia. United Nations Environment Programme, Geneva Switzerland. ISBN 92-807-2403-7
Landsat-1 MSS, 23 January 1974 and Landsat-2 MSS, 05 March 1975, bands 2, 4 and 1
Landsat-7 ETM+, 04 January 2006, bands 7, 4 and 2
The Indigenous Rainforest of Sapo National Park
BirdLife International (2003). BirdLife’s online World Bird Database: the site for bird conservation. Version 2.0. Cambridge, UK: BirdLife International. http://www.birdlife.org (Accessed on October 4, 2007)
FCRC (2005). Forest Concession Review – Phase III. Report of the Concession Review Committee. http://www.fao.org/forestry/site/29659/en/page.jsp (Accessed on October 4, 2007)
GEF (2004). Medium Sized Project Proposal – Establishing the Basis for Biodiversity Conservation on Sapo National Park and in South-East Liberia. http://www.gefweb.org/Documents/Medium-Sized_Project_Proposals/MSP_Proposals/Liberia_-_Sapo_National_Park_MSP.pdf (Accessed on October 4, 2007)
Global Witness (2001). The Role of Liberia’s Logging Industry on National and Regional Insecurity – briefi ng to the UN Security Council. http://www.globalpolicy.org/security/issues/liberia/report/gwtimber.htm (Accessed on October 4, 2007)
IUCN (n.d.). IUCN Red List of Threatened Species. http://www.iucnredlist.org/search/search-basic (Accessed on October 4, 2007)
USFS (n.d.). Liberia – USDA Forest Service International Programs, Africa. http://www.fs.fed.us/global/globe/africa/liberia.htm (Accessed on October 4, 2007)
Landsat-1 MSS, 22 January 1974, bands 2, 4 and 1
Landsat-7 ETM+, 16 February 2001 and 30 January 2003, bands 7, 4 and 2
LIBYAN ARAB JAMAHIRIYA
eSSORTMENT (2002). Destination attractions: Information, facts and stats about Libya, Africa. http://www.essortment.com/libyaafricainf_oss.htm (Accessed on February 6, 2008)
FAO (2005). Irrigation in Africa fi gures – AQUASTAT Survey 2005. http://www.fao.org/nr/water/aquastat/countries/libya/libya_cp.pdf (Accessed on January 9, 2008)
FAO (2007a). Land and Water Development Division. AQUASTAT Information System on Water and Agriculture: Online database. http://www.fao.org/nr/water/aquastat/data/query/index.html (Accessed on January 9, 2008)
FAO (2007b). FAOSTAT statistical databases. FAO: Rome. http://faostat.fao.org/default.aspx (Accessed on January 18, 2008)
GMRA (n.d). Great Man-Made River Authority. Facts & Figures. http://www.gmmra.org/facts_fi gures.htm (Accessed on February 6, 2008)
UNCCD (1999). Libya Secretariat of Agriculture. Summary of Programmes to Combat Desertifi cation in the Libyan Arab Jamahiriya. Report to the UNCCD. http://www.unccd.int/cop/reports/africa/national/1999/libyan_arab_jamahiriya-eng.pdf (Accessed on January 9, 2008)
US Department of Energy (2005). Libya Reserves, Geology, NOC, Companies. Energy Information Agency Country Analysis Briefs. http://www.eia.doe.gov/emeu/cabs/libyareserves.html (Accessed on January 9, 2008)
The Great Manmade River Project
BBC (2006). Libya’s Thirst for Fossil Water. http://news.bbc.co.uk/2/hi/science/nature/4814988.stm#story (Accessed on May 3, 2007)
NASA Earth Observatory (2006). Fossil Water in Libya. http://earthobservatory.nasa.gov/Newsroom/NewImages/images.php3?img_id=17242 (Accessed on May 3, 2007)
RCM Libya (n.d.). The Great Man-Made River, Revolutionary Committees Movement. http://www.rcmlibya.org/English/Revolution%20_RCM.htm (Accessed on June 4, 2007)
Saudi Aramco World. (2007). Seas Beneath the Sands. http://www.saudiaramcoworld.com/issue/200701/seas.beneath.the.sands.htm (Accessed on May 3, 2007)
ASTER-VNIR, 22 December 2006, bands 2, 3 and 1
ASTER-VNIR, 26 November 2001, bands 2, 3 and 1
Landsat-1 MSS, 15 November 1972, bands 2, 4 and 1
Landsat-4 TM, 24 April 1988, bands 7, 4 and 2
Urban Expansion of Tripoli
El Fleet, M. and Baird, J. (2001). The development and application of groundwater models to simulate the behavior of groundwater resources in the Tripoli jAquifer, Libya. Presented at the First International Conference on Saltwater Intrusion and Coastal Aquifers—Monitoring, Modeling and Management. Essaouira, Morocco, April 23-25, 2001
GMRA (n.d.). Great Man-Made River Authority website. http://www.gmmra.org/index.htm (Accessed on September 27, 2007)
ASTER-VNIR, 05 March and 04 November 2006, bands 2, 3 and 1
Landsat-2 MSS, 29 January 1976, bands 2, 4 and 1
MADAGASCAR
AAAS Atlas of Population & Environment (2008). Case Studies. Population Trends and the Environment in Madagascar. http://atlas.aaas.org/index.php?part=3&sec=mad (Accessed on February 6, 2008)
Conservation International (2007). Biodiversity Hotspots. Madagascar and the Indian Ocean Islands. http://www.biodiversityhotspots.org/xp/hotspots/madagascar/Pages/biodiversity.aspx (Accessed on February 6, 2008)
Department Crop and Grassland Service (n.d.) http://www.fao.org/ag/AGP/AGPC/doc/Counprof/Madagascar/madagascareng.htm (Accessed on January 9, 2008)
FAO (2005). Irrigation in Africa fi gures – AQUASTAT Survey 2005. http://www.fao.org/nr/water/aquastat/countries/madagascar/madagascar_cp.pdf (Accessed on January 9, 2008)
FAO AGL (2003). Land Degradation Severity. Terrastat online database. http://www.fao.org/ag/agl/agll/terrastat/#terrastatdb (Accessed on January 9, 2008)
IUCN (2007). Summary Statistics for Globally Threatened Species. Table 5 & Table 6a. http://www.iucnredlist.org/info/stats (Accessed on January 9, 2008)
Wilkie, M. L., and Fortuna, S. (2003). Status and Trends in Mangrove Area Extent Worldwide. FAO Forestry Department. Rome: FAO. http://www.fao.org/docrep/007/j1533e/J1533E32.htm (Accessed on January 9, 2008)
Rasambainarivo, J.H. and Ranivoarivelo, N. (2003). Country Pasture/Forage Resource Profi les: Madagascar. FAO Agriculture
UN (2007). Millennium Development Goals Indicators. http://mdgs.un.org/unsd/mdg/Default.aspx (Accessed on January 9, 2008)
UNEP-WCMC (2004). Species Data (unpublished, September 2004). http://www.unep-wcmc.org (Accessed on January 9, 2008)
Deforestation in Mikea Forest
BirdLife International. (2004a). Monias benschi. 2007 IUCN Red List of Threatened Species. www.iucnredlist.org (Accessed on December 4, 2007)
BirdLife International. (2004b). Uratelornis chimaera. In: IUCN 2007. 2007 IUCN Red List of Threatened Species. www.iucnredlist.org (Accessed on December 4, 2007)
Du Puy, D.J and Moat, J.F. (1998). Vegetation mapping and classifi cation in madagascar (using GIS): implications and recommendations for the conservation of biodiversity. In: C.R. Huxley, J.M. Lock and D.F. Cutler (editors). Chorology, taxonomy and Ecology of the African and Madagascan fl oras. Royal Botanic Gardens, Kew.
Seddon, N., Tobias, J., Yount, J.W., Ramanampamonjy, J.R. Butchart, S. and Randrianizahana, H. (2000). Conservation issues and priorities in the Mikea Forest of south-west Madagascar. Oryx 34(4):287-304.
Landsat-1 MSS, 15 June 1973, bands 2, 4 and 1
Landsat-7 ETM+, 30 April 2002 and 16 March 2003, bands 7, 4 and 2
Center Pivot Irrigation near Morondava
Gaudin, R., & Rapanoelina, M. (2003). Irrigation based on a nomogram using soil suction measurements. Agricultural Water Management, 58(1), 45-53.
Mission Economique de Tananarive. (April, 2006). Le sucre a Madagascar. Fiche de synthese. Ambassade de France a Madagascar.
MDP – JEXCO. (June, 2004). Etude d’impacts des APE pour Madagascar. Rapport provisoire.
Unité Politique pour le Developpement Rural. (June, 2003). Monographie de la région de Ménabé. Ministère de l’Agriculture, de l’Elevage et de la Pêche, REPOBLIKAN’I MADAGASIKARA.
Landsat-1 MSS, 15 June 1973, bands 2, 4 and 1
Landsat-7 ETM+, 12 June 2006, bands 7, 4 and 2
Landsat-7 ETM+, 27 June 2000, bands 7, 4 and 2
MALAWI
CBD (2007). Secretariat of the Convention on Biological Diversity. Malawi – Description. Country Profi les. http://www.cbd.int/countries/default.shtml (Accessed on January 9, 2008)
FAO (2003). African Development Bank, and the European Commission. Forestry Outlook Studies for Africa: Subregional Report Southern Africa. ftp://ftp.fao.org/docrep/fao/005/y8672e/y8672e00.pdf (Accessed on January 9, 2008)
FAO (2005). Irrigation in Africa fi gures – AQUASTAT Survey 2005. http://www.fao.org/nr/water/aquastat/countries/malawi/malawi_cp.pdf (Accessed on January 9, 2008)
FAO (2007a). Land and Water Development Division. AQUASTAT Information System on Water and Agriculture: Online database. http://www.fao.org/nr/water/aquastat/data/query/index.html (Accessed on January 9, 2008)
FAO (2007b). FAOSTAT statistical databases. http://faostat.fao.org/default.aspx (Accessed on January 18, 2008)
SoE (2002). State of Environment Report for Malawi. Ministry of Mines, Natural Resources and Environment. http://www.sdnp.org.mw/enviro/chilwa/ministry/stateenv2002/Chapters/Chapter3.html (Accessed on January 9, 2008)
Poitras, J. (1999). “Malawi Tobacco Industry and the Environment.” American University Trade Environment Database (TED), Case Number 252. http://www.american.edu/TED/maltobac.htm (Accessed on January 9, 2008)
UN (2006). Department of Economic and Social Affairs. Population Division. Population, Resources, Environment and Development: The 2005 Revision. http://unstats.un.org/pop/dVariables/DRetrieval.aspx (Accessed on February 6, 2008)
UNEP-WCMC (n.d) Protected Areas and World Heritage. Lake Malawi National Park, Malawi. http://www.unep-wcmc.org/sites/wh/lakemal.html (Accessed on February 6, 2008)
Algae Blooms in Lake Malawi
Hecky, R.E., Bootsma, H.A., Kingdon, M.L. (2003). Impact of Land Use on Sediment and Nutrient Yields to Lake Malawi/Nyasa. Journal of Great Lakes Research 29(2):139-158.
Hranova, R., Nkambule, S., Mwandira, S. (2005). Diffuse Pollution of Urban Rivers – Case studies in Malawi and Swaziland, in: Diffuse Pollution of Water Resources: Principles and Case Studies in the Southern African Region.
Mita, D. (2007). A Brief: Eutrophication of Lake Malawi. E-mail correspondence, Unpublished. Geology and Geological Engineering Department, University of Mississippi, Mississippi.
NASA Visible Earth (2007). Fires in Tanzania and Mozambique. http://visibleearth.nasa.gov/view_rec.php?id=15911 ( Accessed on February 15, 2007)
Puchniak, M. K. (2004). Paleolimnological evidence of the effects of recent cultural eutrophication and climatic variability during the last 300 years in Lake Malawi, East Africa. MSc Thesis, University of Waterloo, Ontario, Canada.
Puchniak, M. K., Hall, R. I., Hecky, R. E. (2005). Sediment Records of Recent Cultural Eutrophication in Lake Malawi/Nyasa, East Africa. American Geophysical Union, Fall Meeting 2005
USGS (2006). Toxic Substances Hydrology Program. http://toxics.usgs.gov/defi nitions/eutrophication.html (Accessed on March 17, 2007)
MODIS-Terra, 08 November 2001, bands 1, 3 and 4
MODIS-Terra, 22 November 2006, bands 1, 3 and 4
Deforestation atop Mount Mulanje
BirdLife International (2007). BirdLife’s online World Bird Database: the site for bird conservation. Version 2.1. Cambridge, UK: BirdLife International. http://www.birdlife.org (Accessed on October 29, 2007)
MMCT (2005). Mulanje Mountain conservation Trust: Introductionhttp://www.mountmulanje.org.mw/ (Accessed on February 16, 2007)
NASA Earth Observatory (2007). Mount Mulanje – Malawi http://earthobservatory.nasa.gov/Newsroom/NewImages/images.php3?img_id=16662 (Accessed on February 16, 2007)
Landsat-1 MSS, 08 October 1973, bands 2, 4 and 1
Landsat-7 ETM+, 09 August 2006, bands 7, 4 and 2
MALI
CBD (2001). Convention on Biological Diversity. Mali Ministry of Land Planning, Environment and Urbanization.General Situation of Biological Diversity in Mali. http://www.cbd.int/doc/world/ml/ml-nbsap-01-p1-fr.doc (Accessed on January 9, 2008)
FAO AGL (2003). Land Degradation Severity. Terrastat online database. http://www.fao.org/ag/agl/agll/terrastat/#terrastatdb (Accessed on January 9, 2008)
FAOSTAT (2008). FAOSTAT statistical databases. http://faostat.fao.org/site/377/DesktopDefault.aspx?PageID=377 (Accessed on March 17, 2008)
GEO-Day of Biodiversity in Mali (2005). The cliff of Bandiagara- Oasis of biological diversity in the Land of the Dogons. http://www.biodiversity-day.info/2005/exkursion_en.htm (Accessed on February 6, 2008)
UNESA (2005). Population Division of the Department of Economic and Social Affairs. World Population Prospects: The 2004 Revision. Dataset on CD-ROM. New York. http://www.un.org/esa/population/ordering.htm (Accessed on January 9, 2008)

362 �
UN (2004). Offi ce for the Coordination of Humanitarian Affairs. WEST AFRICA: Niger River action planned, but the river is shrinking. IRIN News Service. http://www.irinnews.org/report.aspx?reportid=49688 (accessed on January 28 2008)
UN (2007). Millennium Development Goals Indicators. http://mdgs.un.org/unsd/mdg/Default.aspx (Accessed on January 9, 2008)
The Drying up of Lake Faguibine
Brooks, N. (2004). Drought in the African Sahel: long term perspectives and future prospects – working paper No. 61. Tyndall Centre for Climate Change Research, Norwich, UK.
CNEARC. (2004). Le lac Faguibine, un espace agropastoral au Nord Mali : Centre National d’Etudes Agronomiques des Régions Chaudes, 1101, avenue Agropolis – BP 5098 - 34033 Montpellier Cedex 01. http://www.cariassociation.org/gtd/?section=documentation&subsection=gtd (Accessed on December 15, 2006)
Giannini, A., Saravanan, R., Chang. P. (2003). Oceanic Forcing of Sahel Rainfall on Interannual to Interdecadal Time Scales. Science 302 (5647), 1027. [DOI: 10.1126/science.1089357]
Santer, B.D., Wigley, T.M., Gleckler, P.J., Bonfi ls, C., Wehner, M.F., Achutarao, K., Barnett, T.P., Boyle, J.S., Brüggemann, W., Fiorino, M., Gillett, N., Hansen, J.E., Jones, P.D., Klein, S.A., Meehl, G.A., Raper, S.C., Reynolds, R.W., Taylor, K.E., Washington, W.M. (2006). Proceedings of the National Academy of Sciences USA. 103(38) 2006 Sept. 12.
Landsat-1 MSS, 03 January 1974, Landsat-3 MSS, 26 December 1978, bands 2, 4 and 1
Landsat-7 ETM+, 30 October 2006, bands 7, 4 and 2
The Intended and Unintended Consequences of Manantali Dam
Adams, A. (2000). The Senegal River: Flood management and the future of the valley. International Institute for Environment and Development. London.
BBC. (2001). Bamako lit up by dam start. BBC News, Wednesday, 12 December 2001. http://news.bbc.co.uk/2/hi/africa/1705902.stm (Accessed on November 27, 2007)
Black, R. and Sessay, M.F. (1997). Refugees, land cover, and environmental change in the Senegal River Valley. GeoJournal 41(1):55-67.
Bosshard, P. (1999). Berne Declaration – A Case Study on the Manantali Dam Project (Mali Mauritania, Senegal). http://internationalrivers.org/en/africa/case-study-manantali-dam-project-mali-mauritania-senegal (Accessed on November 27, 2007)
DeGeorges, A. and Reilly, B.K. (2006). Dams and Large Scale Irrigation on the Senegal river. Impacts on Man and the Environment. Case Study for 2006 Human Development Report. UNDP.
Horowitz, M.M. and Salem-Murdock, M. (1993). Developmnet-Induced Food Insecurity in the Middle Senegal Valley. GeoJournal 30(2)179-184.
Rasmussen, K., Larsen, N., Planchon, F., Andersen, J., Sandholt, I. And Christiansen, S. (1999). Agricultural systems and transnational water management in the Senegal River basin. Danish Journal of Geography 99:59-68.
UNESCO (n.d.). Senegal River Basin (Guinea, Mali, Mauritania, Senegal) : World Water Assessment Programme Case Studies. http://www.unesco.org/water/wwap/case_studies/senegal_river/index.shtml (Accessed on November 27, 2007)
ASTER-VNIR, 31 January 2004, bands 2, 3 and 1
Landsat-2 MSS, 31 January 1978, bands 2, 4 and 1
MAURITANIA
EarthTrends (2006). Calculation using population data from: Population Division of the Department of Economic and Social Affairs of the United Nations Secretariat, 2005. World Population Prospects: The 2004 Revision. Dataset on CD-ROM. New York. http://www.un.org/esa/population/ordering.htm (Accessed on January 7, 2008)
FAO (2000-2007). Fisheries and Aquaculture Department. Mauritania Fisheries and Aquaculture Country Profi le. http://www.fao.org/fi /website/FISearch.do?dom=country (Accessed on January 7, 2008)
FAO (2005a). FAOSTAT statistical databases. http://faostat.fao.org/default.aspx (Accessed on January 18, 2008)
FAO (2005b). Forestry Division. Global Forest Resources Assessment 2005. http://www.fao.org/forestry/site/fra2005/en/ (Accessed on January 7, 2008)
FAO (2007). Land and Water Development Division. AQUASTAT Information System on Water and Agriculture: Online database. http://www.fao.org/nr/water/aquastat/data/query/index.html (Accessed on January 7, 2008)
FAOSTAT (2008). FAOSTAT statistical databases. http://faostat.fao.org/site/377/DesktopDefault.aspx?PageID=377 (Accessed on March 17, 2008)
NASA (2002). Astronomy Picture of the Day. http://apod.nasa.gov/apod/ap021028.html (Accessed February 6, 2008)
UNEP-WCMC (2002). http://www.unep-wcmc.org/sites/wh/bancd%27ar.html (Accessed on January 7, 2007)
UN (2007). Millennium Development Goals Indicators. http://mdgs.un.org/unsd/mdg/Default.aspx. (Accessed on January 7, 2008)
Restored Wetlands around the Diawling National Park
Duvail, S. and Hamerlynck, O. (2003). Mitigation of negative ecological and socio-economic impacts of the Diama dam on the Senegal River Delta wetland (Mauritania), using a model based decision support system. Hydrology and Earth System Sciences 7(1):133-146.
Diawara, Y., and Diagana C.H. (2006). Impacts of the restoration of the hydrological cycle on bird populations and socio-economic benefi ts in and around the Parc National du Diawling in Mauritania. In: Boere, G.C., Galbraith, C.A. and Stroud, D.A. (eds). Waterbirds around the world. The Stationalery Offi ce, Edinburgh, UK.
Amadou, B. (2004). Case 1: Parc National Du Diawling. In: Report of the African Pre-Conference on water for food and ecosystems, Addis Ababa, 4-6 Nov. 2004. http://www.fao.org/ag/wfe2005/docs/annex_d.pdf (Accessed on October 17, 2007)
WMO (2004). Mauritania: Managed Flood Releases and Livelihoods – Lower Delta Senegal River. Edited by Technical Support Unit. World Meteorological Organization – Global Water Partnership. http://www.apfm.info/pdf/case_studies/mauritania.pdf (Accessed on October 17, 2007)
Landsat-3 MSS, 30 September 1979, bands 2, 4 and 1
Landsat-7 ETM+, 06 October 2006, bands 7, 4 and 2
Desertifi cation along the Rosso-Nouakchott Highway
GEF (2000). Biological Diversity Conservation through Participatory Rehabilitation of the Degraded Lands of the Arid and Semi-Arid Transboundary Areas of Mauritania and Senegal – Project Document. http://www.thegef.org/Documents/Project_Proposals_for_Endorsem/PP_Archives/Regional_Mauritania_Senegal.pdf (Accessed on September 25, 2007)
Schlesinger, W.H. (2002). Desertifi cation. In: Andrew S. Goudie, A.S. and Cuff, D.J. (eds). Encyclopedia of global change: environmental change and human society (Oxford: Oxford University Press, 2002)
USGS (n.d.). Earth Shots - Southern Mauritania. http://earthshots.usgs.gov/Mauritania/Mauritania (Accessed on September 25, 2007)
DigitalGlobe-Quickbird, 06 May 2005, bands 3, 2 and 1
Landsat-1 MSS, 30 September 1972, bands 2, 4 and 1
Landsat-5 MSS, 05 December 1990, bands 2, 4 and 1
Landsat-7 ETM+, 06 October 2006, bands 7, 4 and 2
MAURITIUS
EarthTrends (2007). Calculation using land data from FAO. FAOSTAT statistical databases. http://faostat.fao.org/default.aspx (Accessed on January 18, 2008)
IUCN (2007a). Summary Statistics for Globally Threatened Species. Table 6a. http://www.iucnredlist.org/info/stats (Accessed on January 7, 2008)
IUCN (2007b). Summary Statistics for Globally Threatened Species. Table 5. http://www.iucnredlist.org/info/stats (Accessed on January 7, 2008)
IUCN (2007c). Mauritius Echo Parakeet (Psittacula eques). 2007 IUCN Red List of Threatened Species. http://www.iucn.org/themes/ssc/redlist2007/docs/03_mauritus_en_low.pdf (Accessed February 6, 2008)
Mauritius Ministry of Environment and National Development Unit (2006). A Pocketbook of Environment Statistics.
PRB (2007). World Population Data Sheet. Population Reference Bureau. http://www.prb.org/Publications/Datasheets/2007/2007WorldPopulationDataSheet.aspx (Accessed on September 19, 2007)
Threatened Coral Reefs, Mauritius
CIA (2007). Central Intelligence Agency. The World Factbook. Mauritius. https://www.cia.gov/library/publications/the-world-factbook/geos/mp.html (Accessed on September 19, 2007)
Gendre, F. Beck, C. Ruch, P. and Kubler, B. (1994). Human impacts on coral ecosystems at Mauritius island: Coprostnol in surface sediments. Eclogae geol. Helv. 87(2):357-367
Goorah, B. Rathachared, B.D. and Kulputeea, D. (1998). Occurrence of Coral Bleaching in the Marine Parks of Mauritius. Food and Agricultural Research Council, Reduit, Mauritius.
IELS (2003) The Environment of Mauritius. Institute for Environmental and Legal Studies. http://www.intnet.mu/iels/index.htm (Accessed on September 19, 2007)
NOAA (2005) Coral Reef Biology. National Oceanic and Atmospheric Agency. http://www.coris.noaa.gov/about/biology/ (Accessed on September 19, 2007)
PRB (2007) World Population Data Sheet. Population Reference Bureau. http://www.prb.org/Publications/Datasheets/2007/2007WorldPopulationDataSheet.aspx (Accessed on September 19, 2007)
UNSTATS (n.d.). UNSTATS. Country Profi les. Mauritius. http://unstats.un.org/pop/dCountryProfi les/CProfi le.aspx (Accessed on September 19, 2007)
DigitalGlobe-Quickbird, 28 May 2006, bands 3, 2 and 1
GeoEye-IKONOS, 25 May 2007, bands 3, 2 and 1
MOROCCO
Arabic News (2004). Morocco lose 0.3 pct of GDP every year due to desertifi cation, offi cial. http://www.arabicnews.com/ansub/Daily/Day/040619/2004061923.html (Accessed on January 7, 2008)
Encyclopedia of the Nations (2007). Africa. Morocco, Flora and Fauna. http://www.nationsencyclopedia.com/Africa/Morocco-FLORA-AND-FAUNA.html (Accessed February 6, 2008)
FAO (2005). Irrigation in Africa fi gures – AQUASTAT Survey 2005. http://www.fao.org/nr/water/aquastat/countries/morocco/morocco_cp.pdf (Accessed on January 7, 2008)
FAO (2006). FAOSTAT Online Statistical Service. Rome: FAO. http://faostat.fao.org/default.aspx (Accessed on January 18, 2008)
Karrou. M. (n.d.). Climatic Change and Drought Mitigation: Case of Morocco. FAO CLIMAGRImed. http://www.fao.org/sd/climagrimed/pdf/ws01_38.pdf (Accessed on January 7, 2008)
MSN Encarta (2007). Encyclopedia. Morocco. http://encarta.msn.com/encyclopedia_761572952_2/Morocco.html (Accessed February 6, 2008)
Ouali, A.E. (2006). Environment-Morocco: The Old Picture is Disappearing. IPS News. http://ipsnews.net/news.asp?idnews=35290 (Accessed on January 7, 2008)
World Bank (2001). Mediterranean Environmental Technical Assistance Program.Country Report on Water Quality and Potential METAP Interventions. http://www.metap.org/fi les/Water%20Reports/country%20report/MoroccoWaterQualityCountry%20Report.pdf (Accessed on January 18, 2008)
The Sustainability of Al Wahda Dam
A.B.H.S. (2006). Débat national sur l’eau. Le basin hydraulique du Sebou. Royaume du maroc, A.B.H.S.
Agoumi, A. (2003). Vulnerability of North African countries to climatic changes: adaptation and implementation strategies for climatica change. Developing Perspectives on Climat Change: Issues and Analysis from Developing Countries and countries with Economies in Transition. IISD/Climat Change Knowledge Network. http://www.cckn.net/compendium/north_africa.asp (Accessed on January 3, 2008)
Minoia, P., Brusarosco, A. (2006). Water infrastructures facing sustainable development challenges: Integrated evaluation of impacts of dams on regional development in Morocco. Social Science Research Network Electronic Paper Collection. Università Ca’ Foscari di Venezia, Centro Interdipartimentale IDEAS
Snoussi, M., Haida, S., Imassi. S. (2002). Effects of the construction of dams on the water and sediment fl uxes of the Moulouya and the Sebou Rivers, Regional environmental chang, 3, 5-12.
Landsat-5 TM, 07 May 1987, bands 7, 4 and 2
Landsat-7 ETM+, 06 June 2001, bands 7, 4 and 2
Souss-Massa Valley
Abdellah, B. (2002). Changements Climatiques Et Gestion De l’irrigation Dans La Zone d’action De l’ormva Du Souss-Massa. http://lnweb18.worldbank.org/ESSD/ardext.nsf/18ByDocName/ChangementsclimatiquesetgestiondelirrigationdanslazonedactiondelORMVAduSouss-MassaGourma/$FILE/Gourma_SoussMassa.pdf (Accessed on January 15, 2008)
Askassay, K. (2006). La gestion des resources en eau dans le bassin versant du Souss De l’analyse vers la modelisation d’un systeme fragile et complexe. Laboratoire Interactions Nature-Societe, analyse et modeles. UMR6554 LETG, La Baule 2006
Dindane, K.; Bouchaou, L.; Hsissou, Y., and Krimissa, M. (n.d.). Hydrochemical and isotopic characteristics of groundwater in the Souss Upstream Basin, southwestern Morocco. Journal of African Earth Sciences. 2003; 36(4):315-327; ISSN: 08995362 http://fr.wikipedia.org/wiki/Barrage_Youssef_Ibn_Tachfi n (Accessed on January 7, 2008)
Hanafi , A. and El-Fadl, A. (n.d.). Integrated Production and Protection of Greenhouse Tomato in Morocco. Proceedings of the International Symposium on Mediterranean Horticulture: Issues and Prospects; 2002;(582): pp. 153-163.
Sirjacobs, M. (n.d.). Rentabilite de l’eau dans differents sytemes hoticoles. Cahiers Options Mediterraneennes vol. 31: pp. 223-228.
ASTER-VNIR, 09 May 2003, bands 2, 3 and 1
Landsat-4 TM, 09 February 1988, bands 7, 4 and 2
MOZAMBIQUE
UN (2000). Floods take a serious economic toll.. Africa Recovery (part of Mozambique: Country in Focus) 14(3): 13. http://www.un.org/ecosocdev/geninfo/afrec/subjindx/143moz2.htm (Accessed on January 7, 2008)
FAO (2005). Irrigation in Africa fi gures – AQUASTAT Survey 2005. http://www.fao.org/nr/water/aquastat/countries/mozambique/mozambique_cp.pdf (Accessed on January 7, 2008)
Saket, M. (2001). Fire Situation in Mozambique. Part of Global Forest Fire Assessment 1990-2000. http://www.fao.org/DOCREP/006/AD653E/ad653e24.htm (Accessed on January 7, 2008)
UN (2007). Millennium Development Goals Indicators. http://mdgs.un.org/unsd/mdg/Default.aspx (Accessed on January 7, 2008)
UNESA (2006). Population Division of the Department of Economic and Social Affairs. World Urbanization Prospects: The 2005 Revision. Dataset on CD-ROM. New York.
WHO/RBM (2005). World Malaria Report 2005. Mozambique. http://rbm.who.int/wmr2005/profi les/mozambique.pdf (Accessed on February 6, 2008)
WWF (2008). Expeditions in Conservation. Mozambique. http://www.worldwildlife.org/expeditions/mozambique/animals_mangroves.htm (Accessed on February 6, 2008)

363�
Fire Scars Around Beira
GFMC – Global Fire Monitoring Center – an Activity of the UN International Strategy for Disaster Reduction (ISDR). (2007). Fire Situation in Mozambique - IFFN No. 25, July 2001 http://www.fi re.uni-freiburg.de/iffn/country/mz/mz_1.htm (Accessed on February 20, 2007)
NASA Earth Observatory (2006). Natural Hazards: Fires in Mozambique http://earthobservatory.nasa.gov/NaturalHazards/shownh.php3?img_id=13753 (Accessed on February 21, 2007)
Taquidir, M. (1996). Quantifi cação das queimadas nos diferentes tipos de vegetação em Moçambique In: GFMC – Global Fire Monitoring Center – an Activity of the UN International Strategy for Disaster Reduction (ISDR) (2007). Fire Situation in Mozambique - IFFN No. 25, July 2001, p. 22-27http://www.fi re.uni-freiburg.de/iffn/country/mz/mz_1.htm (Accessed on February 20, 2007)
Landsat-7 ETM+, 21 May 2006, bands 7, 4 and 2
Landsat-7 ETM+, 09 August 2006, bands 7, 4 and 2
The Impact of Cahora Bassa Dam
Basson, G. (2004). Hydropower Dams and Fluvial Morphological Impacts – An African Perspective. Paper presented at the United Nations Symposium on Hydropower and Sustainable Development. 27-29 October, 2004, Beijing, China.
Beilfuss, R. (1999). Can this river be saved? Rethinking Cahora Bassa could make a difference for dam battered Zambezi. World Rivers Review 14(1):8-11
Bond, W.J., Coe, N., Jackson, P.B.N. and Rogers K.H. (1978). The limnology of Cabora Bassa, Mozambique, during its fi rst year. Freshwater Biology 8:433-447
Davies, B.R., Beilfuss, R.D. and Thoms, M.C. (2000). Cahora Bassa restrospective, 1974-1997: effects of fl ow regulation on the Lower Zambezi River. Verh. Internat. Verein. Limnol. 27:1-9
Gandolfi , C., Guariso, G. and Togni, D. (1997). Optimal Flow Allocation in the Zambezi River System. Water Resources Management 11:377-393
ILEC (n.d.). International Lake Environment Committee Foundation - Survey of the State of the World’s Lakes. http://www.ilec.or.jp/database/map/world/wldmap.html (Accessed on September 26, 2007)
Landsat-1 MSS, 09 October and 21 November 1972, bands 2, 4 and 1
Landsat-7 ETM+, 26 October and 02 November 2006, bands 7, 4 and 2
NAMIBIA
CI (2007). Conservation International. Biodiversity Hotspots. Succulent Karoo. http://www.biodiversityhotspots.org/xp/Hotspots/karoo/Pages/default.aspx (Accessed on January 7, 2008)
FAO (2005). Irrigation in Africa fi gures – AQUASTAT Survey 2005. http://www.fao.org/nr/water/aquastat/countries/namibia/namibia_cp.pdf (Accessed on January 9, 2008)
FAO (2007a). FAOSTAT statistical databases. FAO: Rome. http://faostat.fao.org/default.aspx (Accessed on January 18, 2008)
Namibia Ministry of Environment and Tourism (2001). Freshwater Resources, Executive Summary. 1998-2001 State of the Environment Report Process. http://www.met.gov.na/programmes/env_indic/env_indic.htm (Accessed on January 7, 2008)
FAO (2007b). Land and Water Development Division. AQUASTAT Information System on Water and Agriculture: Online database. http://www.fao.org/nr/water/aquastat/data/query/index.html (Accessed on January 7, 2008)
FAO AGL (2003). Land Degradation Severity. Terrastat online database. http://www.fao.org/ag/agl/agll/terrastat/#terrastatdb (Accessed on January 7, 2008)
Nichols, P. (2003). A Developing Country Puts a Halt to Overfi shing. Economic Perspectives 8(1). http://usinfo.state.gov/journals/ites/0103/ijee/nichols.htm (Accessed on January 7, 2008)
The Africa Guide (2008). Facts & Figures. http://www.africaguide.com/facts.htm (Accessed on February 6, 2008)
UNESA (2005). Population Division of the Department of Economic and Social Affairs. World Population Prospects: The 2004 Revision. Dataset on CD-ROM. New York. http://www.un.org/esa/population/ordering.htm (Accessed on January 7, 2008)
UNESA (2006). Population Division of the Department of Economic and Social Affairs. World Urbanization Prospects: The 2005 Revision. Dataset on CD-ROM. New York.
WWF (2001). Wild World WWF Full Report. Namib desert. http://www.worldwildlife.org/wildworld/profi les/terrestrial/at/at1315_full.html (Accessed on February 6, 2008)
WWF (2006). Rhino Conservation in Namibia. http://www.panda.org/about_wwf/where_we_work/project/projects/index.cfm?uProjectID=NA0016 (Accessed on January 7, 2008)
Agricultural Expansion in the Kavango Region
Byers, B.A. (1997). Environmental Threats and Opportunities in Namibia: A Comprehensive Assessment. Directorate of Environmental Affairs, Ministry of Environment and Tourism.
Graz, F.P. (2004). Structure and Diversity of the Dry Woodland Savanna of Northern Namibia. Dissertation - zur Erlangung des Doktorgrades an der Fakultat fur Forstwissenschaften und Waldokologieder Georg-August-Universitat Gottingen.
Mendelsohn, J. and el Obeid, S. (2003). Sand and Water: A Profi le of the Kavango Region. Struik Publishers, Capetown, South Africa.
MTI (n.d.). Fruit and Dairy-Related Projects. Webpage of the Ministry of Trade and Industry – Republic of Namibia. http://www.mti.gov.na/subpage.php?linkNo=68 (Accessed on July 5, 2007)
Nujoma (2003). State of the Nation, H.E. Dr. Sam Nujoma, President of the Republic of Namibia, Windhoek, Namibia, 31 March 2003. http://www.un.int/namibia/other31-4-03.html (Accessed on July 5, 2007)
Landsat-1 MSS, 22 January 1973, TerraLook simulated true color
Landsat-7 ETM+, 12 April 2007, TerraLook simulated true color
Salt Production in the Wetlands of Walvis Bay
Davis, J.S. (n.d.). Solar Saltworks – An Environmentally Friendly Industry. http://www.gnest.org/Conferences/Saltworks_post/031-037.pdf (Accessed on January 25, 2008)
The Free Dictionary by Farlex. (1991). Walvis Bay. http://columbia.thefreedictionary.com/Walvisbaai (Accessed on January 24, 2008)
The Ramsar Convention on Wetland. (1995). The Annotated Ramsar List of Wetlands of International Importance. http://www.ramsar.org/profi le/profi les_namibia.htm (Accessed on January 24, 2008)
Walvis Bays: In the path of the dunes. (n.d.). http://www.orusovo.com/guidebook/content15.htm (Accessed on January 24, 2008)
ASTER-VNIR, 08 March 2005, bands 2, 3 and 1
Landsat-1 MSS, 10 August 1973, bands 2, 4 and 1
NIGER
CBD (2004). Convention on Biological Diversity. Republic of Niger. National Vision of Biodiversity. http://bch-cbd.naturalsciences.be/niger/ner-fra/implementation/documents/vision/sommaire.htm (Accessed on January 9, 2008)
FAO (2005a). Irrigation in Africa fi gures – AQUASTAT Survey 2005. http://www.fao.org/nr/water/aquastat/countries/niger/niger_cp.pdf (Accessed on January 9, 2008)
FAO (2005b). FAO Newsroom. Niger food crisis: why now? (Accessed on March 18, 2008)
Mongabay.com (2006). Niger. Tropical Rainforest Country Profi le. http://rainforests.mongabay.com/20niger.htm (Accessed on January 9, 2008)
National Geographic News (2008). Food Crisis In Niger Will Strike Again, Experts Say. http://news.nationalgeographic.com/news/2005/09/0912_050912_niger_2.html (Accessed on March 17, 2008)
Omayra Bermudez-Lugo. (2006). 2005 Minerals Yearbook: Mali, Mauritania, and Niger. USGS. http://minerals.usgs.gov/minerals/pubs/country/2005/mlmrngmyb05.pdf (Accessed on January 9, 2008)
UNESA (2005). Population Division of the Department of Economic and Social Affairs. World Population Prospects: The 2004 Revision. Dataset on CD-ROM. New York. http://www.un.org/esa/population/ordering.htm (Accessed on January 9, 2008)
UN (2001). Offi ce for the Coordination of Humanitarian Affairs. NIGER: Remaining giraffes endangered. IRIN News Service. http://www.irinnews.org/report.aspx?reportid=28478 (Accessed on January 9, 2008)
UN (2007). Millennium Development Goals Indicators. http://mdgs.un.org/unsd/mdg/Default.aspx (Accessed on January 9, 2008)
Degradation and Deforestation of Baban Rafi Forest
Britanica (2006). Encyclopedia Britanica - World Data Niger. http://www.britannica.com/wdpdf/Niger.pdf (Accessed on September 26, 2007)
Elbow, K.M. (1994). Popular Participation in the Management of Natural Resources: Lessons from Baban Rafi , Niger. University of Wisconsin-Madison, Land Tenure Center: Research Paper U.S. ISSN 0084-0815
Mahamane, A. (2001). Usages des terres et evolutions vegetales dans le departement de Maradi. Drylands Research WorkingPaper 27, Drylands Research, Crewkerne England.
Tiffen, M. and Mortimore, M. (2002). ‘Desertifi cation’ – international conventions and private solutions in Sub-Saharan Africa. In: J. Morris (ed) Sustainable Development: Promoting Progress or Perpetuating Poverty. Profi le Books, London
Landsat-2 MSS, 12 January 1976, bands 2, 4 and 1
Landsat-7 ETM+, 02 February 2007, bands 7, 4 and 2
Revitalized Agricultural Land in Tahoua Province
FRAME (2006). Etude de la Regeneration Naturelle Assistee Dans la Region de Zinder (Niger) USAID. (USAID/EGAT). Elle a été préparée par M. Larwanou, M. Abdoulaye, and C. Reij de l’International Resources Group
Guindon-Zador, E. (1995). Environmental Education and Communication Assessment: the Rural Code Process in Niger. Environmental Education and Communication Project, U.S. Agency for International Development, Contract Nos. PCE-5839-C-00-3068-00 and PCE-5839-Q-3069-00.
Reij, C., T. Adam, T. Abdoulaye, M. Larwanou, G. Tappan, and B. Yamba. (2008). Impacts des Investissements dans la Gestion des Ressources Naturelles au Niger: Rapport de Synthèse. Centre Régional d’Enseignement Spécialisé en Agriculture (CRESA), (In French) Niamey, Niger, 85 pp. (unpublished report)
Aerial Photograph – Dry Season 1975 (Gray Tappan, EROS Data Center)
Aerial Photograph Mosaic – 31 October 2005 (Gray Tappan, EROS Data Center)
NIGERIA
BP (2007). Statistical Review of World Energy 2007. BP p.I.C. http://www.bp.com/productlanding.do?categoryId=6848&contentId=7033471 (Accessed on January 9, 2008)
CBD (2007). Convention on Biological Diversity. Nigeria – Description. Country Profi les. http://www.cbd.int/countries/default.shtml (Accessed on January 9, 2008)
EIA (2006). Energy Information Administration. Country Energy Profi le. http://tonto.eia.doe.gov/country/. (Accessed on April 8, 2008)
FAO (2001). Forestry Division. Forestry Outlook Studies in Africa: Country Report – Nigeria. http://www.fao.org/DOCREP/004/AB592E/AB592E00.HTM (Accessed on January 9, 2008)
FAO (2004). Forestry Division. Status and Trends in Mangrove Area Extent Worldwide. http://www.fao.org/docrep/007/j1533e/J1533E29.htm (Accessed on January 9, 2008)
FAO (2005). Forestry Division. Global Forest Resources Assessment 2005. http://www.fao.org/forestry/site/fra2005/en/ (Accessed on January 9, 2008)
FAOSTAT (2008). FAOSTAT statistical databases. http://faostat.fao.org/site/377/DesktopDefault.aspx?PageID=377 (Accessed on March 18, 2008)
IUCN. (2007). Summary Statistics for Globally Threatened Species. Table 5. http://www.iucnredlist.org/info/tables/table1 (Accessed on January 25, 2008)
National Biodiversity Strategy and Action Plan (n.d.). Repubic of Nigeria. http://www.biodiv.org/doc/world/ng/ng-nbsap-01-en.pdf (Accessed on January 9, 2008)
Shell Petroleum Develoment Company of Nigeria Ltd. (2006). Shell Nigeria Annual Report 2006: People and the Environment.
UN (2007). United Nations Statistic Division. Department of Economic and Social Affairs. http://unstats.un.org/unsd/cdb/cdb_years_on_top.asp?srID=13660&Ct1ID=&crID=566&yrID=2006 (Accessed on February 6, 2008)
UNDP (2006). Niger Delta Human Development Report. Nigeria: UNDP. http://hdr.undp.org/en/reports/nationalreports/africa/nigeria/name,3368,en.html (Accessed on January 25, 2008)
UNEP (2002). Africa Environment Outlook. Nairobi : UNEP.
UNESA (2005). Population Division of the Department of Economic and Social Affairs. World Population Prospects: The 2004 Revision. Dataset on CD-ROM. New York. http://www.un.org/esa/population/ordering.htm (Accessed on January 9, 2008)
UNESA (2006). Population Division of the Department of Economic and Social Affairs. World Urbanization Prospects: The 2005 Revision. Dataset on CD-ROM. New York.
UNESCO (2000). Combatting Desertifi cation: Freshwater Resources and the Rehabilitation of Degraded Areas and Drylands. UNESCO-MAB Drylands Series No.1. http://unesdoc.unesco.org/images/0012/001276/127651e.pdf (Accessed on January 9, 2008)
Economic and Environmental Impacts of Challawa Dam
Barbier, E.B. (2002). Upstream Dams and Downstream Water Allocation, The case of the Hadejia’-Jama’are Floodplain, Northern Nigera. Paper prepared for the Environmental Policy Forum, Center for Environmental Science and Policy, Institute for International Studies, Stanford University.
Bdliya, H.H., Barr, J. and Fraser, S. (2006). Institutional failures in the management of critical water resources: the case of the Komadugu-Yobe Basin in Nigeria (or Peersistance and opportunism – the realities of trying to improve water governance in West Africa. Paper for Seminar on Water governance – New Perspectives and Directions February 20-21, 2006 Heaton Mont, Bradford. U.K.
IRN (2001). Dam-Related Flooding Ravages Northern Nigeria. World Rivers Review. October 2001 16(5):1-7
Ramsar Convention Secretariat (2007). Water allocation and management: Guidelines for the allocation and management of water for maintaining the ecological functions of wetlands. Ramsar handbooks for the wise use of wetlands, 3rd edition, vol. 8. Ramsar Convention Secretariat, Gland, Switzerland.
Thompson. (n.d.). The Hadejima-Jama’are River Basin. University College London Department of Geography webpage. http://www.geog.ucl.ac.uk/~jthompso/hadejia-jam.htm (Accessed on November 9, 2007)
Thompson, J.R. and Hollis, G.E. (1995). Hydrological modeling and the sustainable development of the Hadejia-Nguru Wetlands, Nigera. Hydrolocial Sciences 40:97-116.
Landsat-4 TM, 27 November 1990, bands 7, 4 and 2
Landsat-7 ETM+, 07 November 2006, bands 7, 4 and 2
Oil Development in the Niger Delta
Aaron, K.K. (2004). Perspective: Big Oil, Rural Poverty, and Environmental Degradation in the Niger Delta Region of Nigeria. Journal of Agricultural Safety and Health 11(2):127-134.
Fentiman, A. (1996). The anthropology of oil: the impact of the oil industry on a fi shing community in the Niger Delta. Social Justice 23(4):1043-1578
Ologunorisa, T.E. (2001). A review of the effects of gas fl aring on the Niger Delta environment. International Journal of Sustainable Development and World Ecology 8:249-255.
Peterside, S. and Ogon, P. (n.d.) Background Paper, The Niger Delta. Green Governance Project: Institute of International Studies; UC Berkeley. http://globetrotter.berkeley.edu/GreenGovernance/papers/ (Accessed on February 5, 2007)

364 �
UNEP (2006). Niger Delta Human Development Report. United Nations Development Programme, Garki, Abuja, Nigeria. http://hdr.undp.org/reports/detail_reports.cfm?view=1060 (Accessed on January 20, 2007)
WWF (2001) .Ecoregion Profi le – Central African mangroves (AT1401) http://www.worldwildlife.org/wildworld/profi les/terrestrial/at/at1401_full.html (Accessed on June 13, 2007)
Landsat-5 MSS, 13 December 1984, bands 2, 4 and 1
Landsat-7 ETM+, 08 January 2003, bands 7, 4 and 2
RWANDA
CBD (2003). Convention on Biological Diversity. Rwanda Ministry of Lands, Resettlement and Environment. National Strategy and Action Plan for the Conservation of Biodiversity in Rwanda. http://www.cbd.int/doc/world/rw/rw-nbsap-01-en.pdf (Accessed on January 9, 2008)
EarthTrends (2006). Calculation using population data from Population Division of the Department of Economic and Social Affairs of the United Nations Secretariat, 2005. World Population Prospects: The 2004 Revision.
FAO (2005a). FAO STAT statistical databases. http://faostat.fao.org/default.aspx (Accessed on January 18, 2008)
FAO (2005b). Irrigation in Africa fi gures – AQUASTAT Survey 2005. http://www.fao.org/nr/water/aquastat/countries/rwanda/rwanda_cp.pdf (Accessed on January 9, 2008)
FAO AGL (2003). Land Degradation Severity. Terrastat online database. http://www.fao.org/ag/agl/agll/terrastat/#terrastatdb (Accessed on January 9, 2008)
Rwanda Nyungwe Forest (2007). Nyungwe Forest. http://www.rwanda-nyungwe-forest.com/ (Accessed on February 6, 2008)
UN (2007). Millennium Development Goals Indicators. http://mdgs.un.org/unsd/mdg/Default.aspx (Accessed on January 9, 2008)
UNEP (2006). GEO Data Portal. http://geodata.grid.unep.ch/ (Accessed on February 6, 2008)
UNESA (2006). Population Division of the Department of Economic and Social Affairs. World Urbanization Prospects: The 2005 Revision. Dataset on CD-ROM. New York.
USAID (2004). Rwanda Food Security Update September 2004. http://www.fews.net/centers/innerSections.aspx?f=rw&m=1001386&pageID=monthliesDoc (Accessed on January 9, 2008)
WCS (2007). World Conservation Society. Nyungwe National Park. http://www.wcs.org/international/Africa/rwanda/nyungwe (Accessed on January 9, 2008)
Fire Scars around Akagera National Park
FAO (2006). Global Forest Resources Assessment 2005 – Report on fi res in the Sub-Saharan Africa (SSA) Region. Fire Management Working Paper 9. www.fao.org/forestry/site/fi re-alerts/en (Accessed on January 9, 2008)
IRIN (2004). Fire Destroys one-third of Kagera National Park. IRIN News. http://www.irinnews.org/report.asp?ReportID=42062&SelectRegion=Great_Lakes&SelectCountry=RWANDA (Accessed on December 14, 2006)
Kanyamibwa, S. (1998). Impact of war on conservation: Rwandan environment and wildlife in agony. Biodiversity and Conservation 7:1399-1406
Vande Weghe, J.P. (1990). Akagera, land of water, grass and fi re. WWF-Belgium, Brussels, Belgium.
USAID. (2003). Rwanda Environmental Threats and Opportunities Assessment – Task Order No. 818 under the Biodiversity & Sustainable Forestry IQC USAID Contract No. LAG-I-00-99-00014-00 Submitted by: Chemonics International Inc., February 2003.
Landsat-3 MSS, 20 August 1980, bands 2, 4 and 1
Landsat-5 TM, 20 June 1984, bands 7, 4 and 2
Landsat-7 ETM+, 31 December 1999, bands 7, 4 and 2
Landsat-7 ETM+, 21 July 2004, bands 7, 4 and 2
The Dramatic Deforestation of Gishwati Forest
Jones, N. (2003). Chock-Full of Methane, Lake Kivu Stores Enough Energy to Power all of Rwanda. New Scientist, 177(2384), pp. 17
Hansen, B. (2006). Engineers Remove Methane from Africa Lake. Civil Engineering News: Environmental Engineering, American Society of Civil Engineers 08857024.
MLEFWM – Ministry of Lands, Environment, Forestry, Water and Mines, Republic of Rwanda. (2005). Initial National Communication under the United Nations Framework Convention on Climate Change [online]. Available from: http://unfccc.int/resource/docs/natc/rwanc1.pdf (Accessed on December 4, 2006)
RDG – Rwanda Development Gateway. (2005). Environmental Activities in Rwanda: Afforestation [online]. Available from: http://www.rwandagateway.org/article.php3?id_article=92 Accessed: 4th December 2006
WAC - World Agroforestry Centre. (2003). Agroforestry Checks the Devastating Loss of Land on Rwanda’s Thousand Hills. http://www.worldagroforestrycentre.org/ar2003/downloads/2pager_LP_Web002.pdf (Accessed on December 5, 2006)
ASTER-VNIR, 16 June and 03 November 2006, bands 2, 3, and 1
Landsat-2 MSS, 06 February 1978, bands 2, 4 and 1
SÃO TOMÉ AND PRÍNCIPE
EarthTrends (2006). Calculation using population data from: Population Division of the Department of Economic and Social Affairs of the United Nations Secretariat, 2005. World Population Prospects: The 2004 Revision. Dataset on CD-ROM. New York. http://www.un.org/esa/population/ordering.htm (Accessed on January 9, 2008)
Encyclopedia of the Nations (2007). Africa. São Tomé and Príncipe. Environment. http://www.nationsencyclopedia.com/Africa/S-o-Tom-and-Pr-ncipe-ENVIRONMENT.html (Accessed on February 6, 2008)
FAO (2000). Forestry Division. Global Forest Resources Assessment 2000. http://www.fao.org/docrep/004/y1997e/y1997e0n.htm (Accessed on January 9, 2008)
FAO (2007). FAOSTAT statistical databases. http://faostat.fao.org/default.aspx (Accessed on January 18, 2008)
IUCN (2007). Summary Statistics for Globally Threatened Species. Table 5. http://www.iucnredlist.org/info/stats (Accessed on January 25, 2008)
MONGABAY.COM (2007). Tropical Rainforests. SAO TOME AND PRINCIPE. http://rainforests.mongabay.com/20saotome.htm (Accessed on February 6, 2008)
Urban Expansion on São Tomé Island, São Tomé and Príncipe
MDGR (2004).Sao Tome & Principe. http://www.undp.org/energyandenvironment/sustainabledifference/PDFs/Africa/SaoTomeandPrincipe.pdf (Accessed on January 9, 2008)
UNDG (1998). São Tomé and Príncipe: Common Country Assessment. http://www.undg.org/archive_docs/1687-Sao_Tome___Principe_CCA_-_Sao_Tome___Principe_1998.pdf
International Monetary Funds (2005). http://imf.org/external/pubs/ft/scr/2005/cr05334.pdf (Accessed on January 9, 2008)
DigitalGlobe-Quickbird, 17 June 2007, bands 3, 2 and 1
SENEGAL
FAO (2005). Irrigation in Africa fi gures – AQUASTAT Survey 2005. http://www.fao.org/nr/water/aquastat/countries/senegal/senegal_cp.pdf. (Accessed on January 9, 2008)
FAO (2000-2007). Fisheries and Aquaculture Department. Senegal Fisheries and Aquaculture Country Profi le. http://www.fao.org/fi /website/FISearch.do?dom=country (Accessed on January 9, 2008)
UNESA (2006). Population Division of the Department of Economic and Social Affairs. World Urbanization Prospects: The 2005 Revision. Dataset on CD-ROM. New York.
Trade Measures in CITES (2000). IUCN Report. http://www.cites.org/common/prog/economics/iucn-trademeasuresinCITES.pdf (Accessed on February 6, 2008)
UNEP (2002). Africa Environment Outlook. Past, present and future perspective. Nairobi.
UN (2007a). Millennium Development Goals Indicators. http://mdgs.un.org/unsd/mdg/Default.aspx. (Accessed on January 9, 2008)
UN (2007b). World Statistics Pocketbook. United Nations Statistics Division. Department of Economics and Social Affairs, New York.
Urbanization of the Cap Vert Peninsula
Dubresson, A. (1983). Regions. In: Pelissier, P. and Laclavere, G. (eds) Atlas du Senegal. Les Editions Jeune Afrique, Paris.
Gueye, C., Fall, A.S.,Tall, S.M. (2007). Climatic perturbation and urbanization in Senegal. The Geographical Journal 173:88-92.
Pison, G, Hill, K.H,, Cohen, B., Foote, K.A. (1995). Population dynamics of Senegal. National Academy Press, Washington, DC
Mbaye, A. and Moustier, P. (2000). Market-Oriented Urban Agricultural Production in Dakar. In: Bakker, N., Dubbeling, M., Gundel, S., Sabel-Koschella, U., Zeeuw, H.D. (eds) Growing Cities, Growing Food. Urban Agriculture on the Policy Agenda, A Reader on Urban Agriculture, SDE/ZEL, Feldafi ng, p235-56
UN Population Division. (2006). Population, Resources, Environment and Development: The 2005 Revision. http://unstats.un.org/pop/dVariables/DRetrieval.aspx (Accessed on November 19, 2007)
Aerial photograph mosaic, 1942 (Gray Tappan, EROS Data Center)
DigitalGlobe-Quickbird, 21 December 2006 and 26 March 2007, bands 3, 2 and 1
Riverine Forest Loss at Leboudou Doue
Black, R. and Sessay, M.F. (1997a). Forced migration, environmental change and woodfuel issues in the Senegal River Valley, Environmental Conservation 24:251-260.
Black, R. and Sessay, M.F. (1997b). Refugees, land cover, and environmental change in the Senegal River Valley. GeoJournal 41(1): 55-67.
Horowitz, M.M. and Salem-Murdock, M. (1993). Developmnet-Induced Food Insecurity in the Middle Senegal Valley. GeoJournal 30(2): 179-184.
IUCN (n.d.). The Senegal River: Resease of an Artifi cal Flood to Maintain Traditional Floodplain Productions Systems. http://www.iucn.org/themes/wani/fl ow/cases/Senegal.pdf (Accessed on November 26, 2007)
Rasmussen, K. Larsen, N. Planchon, F. Andersen, J. Sandholt, I. And Christiansen, S. (1999). Agricultural systems and transnational water management in the Senegal River basin. Danish Journal of Geography 99: 59-68
Tappan, G.G., Sall, M. Wood, E.C. and Cushing, M. (2004). Ecoregions and land cover trends in Senegal. Journal of Arid Environments 59(3): 427-462.
Corona, 26 December 1996
DigitalGlobe-Quickbird, 08 March 2006, bands 3, 2 and 1
SEYCHELLES
Wilkie, M., L. and Fortuna, S. (2003). Status and Trends in Mangrove Area Extent Worldwide. FAO Forestry Department. http://www.fao.org/docrep/007/j1533e/J1533E32.htm (Accessed on January 9, 2008)
UN (2007). World Statistics Pocketbook. United Nations Statistics Division. Department of Economics and Social Affairs, New York.
UNEP (2006). Africa Environment Outlook 2: our environment, our wealth. Nairobi, Kenya.
UNEP-WCMC (2001). World Atlas of Coral Reefs. http://www.unep-wcmc.org/marine/coralatlas/index.htm (Accessed on January 9, 2008)
UNESCO (2007). Alabro Atoll. World Heritage List. http://whc.unesco.org/en/list/185 (Accessed on January 9, 2008)
Land Reclamation on Mahe Island
GEF (2007). Status of the Marine Environment Report – Seychelles, September 2007. Compiled by Bijoux, J.P., Decomarmond, A. and Aumeeruddy, R.
Prosper, J. P. N. (2007). Personal Communication with Mr. Justin Paul Nicholas Prosper, Senior GIS Offi cer, Department of Environment, Victoria, Mahe, Seychelles.
Aerial photograph mosaic (courtesy of Department of Environment, Seychelles)
DigitalGlobe-Quickbird, 13 December September 2007, bands 3, 2 and 1
SIERRA LEONE
FAO (2007). Land and Water Development Division. AQUASTAT Information System on Water and Agriculture: Online database. http://www.fao.org/nr/water/aquastat/data/query/index.html (Accessed on January 9, 2008)
Blinker, L. (2006). Country Environment Profi le: Sierra Leone. United Kindgom: Consortium Parsons Brickerhoff. http://www.delsle.ec.europa.eu/en/whatsnew/Docs/Final%20Report%20Country%20Environmental%20Profi le%20(CEP)%20SL%2019-OCT-06.pdf (Accessed on January 9, 2008)
CBD (n.d.). Convention on Biological Diversity. Republic of Sierra Leone. National Biodiversity Strategy and Action Plan. http://www.cbd.int/countries/profi le.shtml?country=sl#status (Accessed on January 9, 2008)
UNCCD (2004). National Report on the Implementation of the United Nations Convention to Combat Desertifi cation. Sierra Leone http://www.unccd.int/cop/reports/africa/national/2004/sierra_leone-eng.pdf (Accessed on January 9, 2008)
UNEP (2006). GEO Data Portal. http://geodata.grid.unep.ch/ (Accessed on February 6, 2008)
USGS (2007). 2005 Minerals Yearbook. Sierra Leone. http://minerals.usgs.gov/minerals/pubs/country/2005/slmyb05.pdf (Accessed on February 6, 2008)
Rutile Mining, Moyamba District
Africa Development Bank (ADB). (2005). Sierra Leone 2005-2009 Country Strategy Paper, July 2005.
Brima, A. A. (2004). Development Diamonds-Sierra Leone: Environment, Development and Sustainable Peace, Finding Paths to Environmental Peacemaking, Wilton Park Conference-London 16th-19th September 2004.
Deen, A. M. S. (2003). Mineral Resources Wealth for Sustainable Economic Growth. Extractive Industries Transparency Initiative (eiti), London Conference, 17 June 2003. http://www2.dfi d.gov.uk/pubs/fi les/eitidraftreportsleone.pdf (Accessed on January 25, 2008)
DACO/SLIS (2004). Moyamba District 3rd Data Pack. http://www.daco-sl.org/encyclopedia/3_dist/3_1i_mo.htm (Accessed on January 25, 2008)
Friends of the Earth (1997). Mined Out: The Envionmental and Social Implications of Development Finance to Rutile Mining in Sierra Leone. Friends of the Earth, England Wales and Northern Ireland, 1997. http://www.foe.co.uk/pubsinfo/briefi ngs/html/19971215144610.html (Accessed on June 7, 2007)
USGS (1994). The Mineral Industry of Sierra Leone. United States Geological Survey,
Landsat-1 MSS, 07 January 1974, bands 2, 4 and 1
Landsat-7 ETM+, 24 March 2003, bands 7, 4 and 2
Encroachment on the Western Area Forest Reserve, Freetown
Conservation International CEPF News (2006) .Unity in Action in Sierra Leone. Evyenia Wilkins, Consultant for Environmental Foundation for Africa. http://www.cepf.net/xp/cepf/news/in_focus/2006/may_feature.xml (Accessed on May 25, 2007)
FAO (2001). Forestry Outlook Studies in Africa – Sierra Leone Ministry of Natural Resources and Tourism. ftp://ftp.fao.org/docrep/fao/004/AB577E/AB577E00.pdf (Accessed on June 4, 2007)

365�
GEF (2006a). Sierra Leone Wildlife Protection and Biodiversity Conservation—Integrated Safeguards Data Sheet. http://www-wds.worldbank.org/servlet/WDSContentServer/WDSP/IB/2006/02/02/000104615_20060216145859/Original/Integrated0Saf10Concept0Stage01GEF1.doc (Accessed on May 25, 2007)
U.S. Forest Service (n.d.). International Programs: Sierra Leone. http://www.fs.fed.us/global/globe/africa/sierra_leone.htm#1#1(Accessed on May 25, 2007)
Landsat-5 TM, 03 January 1986, TerraLook simulated true color
Landsat-7 ETM+, 27 February 2003, TerraLook simulated true color
SOMALIA
FAO (2005). Irrigation in Africa fi gures – AQUASTAT Survey 2005. http://www.fao.org/nr/water/aquastat/countries/somalia/somalia_cp.pdf (Accessed on January 25, 2008)
FAO AGL. (2003). Land Degradation Severity. Terrastat online database. http://www.fao.org/ag/agl/agll/terrastat/#terrastatdb (Accessed on January 9, 2008)
FAO (2008). Fisheries and Aquaculture Department. Fisheries and Aquaculture Country Profi le. Somalia. http://www.fao.org/fi shery/countrysector/FI-CP_SO/en (Accessed on February 6, 2008)
National Encyclopedia (2007). Environment. Somalia. http://www.nationsencyclopedia.com/Africa/Somalia-ENVIRONMENT.html
UN (2007). Millennium Development Goals Indicators. http://mdgs.un.org/unsd/mdg/Default.aspx (Accessed on January 9, 2008)
UNECA (2002). African Information Society Initiative (AISI) e-strategies. National Information and Communication Strategies. Somalia. http://www.uneca.org/aisi/nici/country_profi les/Somalia/somab.htm (Accessed on February 6, 2008)
UNEP (2005). The State of the Environment in Somalia: a Desk Study. Nairobi. http://www.unep.org/DEPI/programmes/Somalia_Final.pdf (Accessed on January 9, 2008)
WRI (2007). Calculation using land and pasture data from FAO. (2007). FAOSTAT statistical databases. http://faostat.fao.org/default.aspx (Accessed on January 18, 2008)
Flooding along the Juba River
FAO (1998). Heavy Rains Attributed to El Niño Cause Extensive Crop Damage in Parts of Eastern Africa, Special Report, Global Information and Early Warning System on Food and Agriculture, 05 February 1998.
FSAU Somalia (2007). Food Security & Nutrition, Special Brief – Post Deyr 06/07 Analysis Issued February 14, 2007.
IRIN (2007). Somalia: Warnings of Possible Flooding. http://www.irinnews.org/Report.aspx?ReportId=70764 (Accessed on April 2, 2007)
NASA Earth Observatory (2007). Flooding in Somalia. http://earthobservatory.nasa.gov/Newsroom/NewImages/images.php3?img_id=17573 (Accessed on April 2, 2007)
UNICEF (2006). Frontline diary: Lives uprooted by Somalia fl oods. UNICEF Newsline. http://www.unicef.org/infobycountry/somalia_37858.html (Accessed on April 2, 2007)
UNOCHA (2006). Somaliland Assistance Bulletin October—December 2006.
DigitalGlobe-Quickbird, 06 September 2006, bands 3, 2 and 1
DigitalGlobe-Quickbird, 23 December 2006, bands 3, 2 and 1
SOUTH AFRICA
CBD (2005). Convention on Biological Diversity. South Africa Ministry of Environmental Affairs and Tourism. South Africa’s National Biodiversity Strategy and Action Plan. http://www.cbd.int/doc/world/za/za-nbsap-01-en.pdf (Accessed on January 9, 2008)
CIA (2007). South Africa. The World Factbook. https://www.cia.gov/library/publications/the-world-factbook/ (Accessed on January 9, 2008)
FAO (2005). Irrigation in Africa fi gures – AQUASTAT Survey 2005. http://www.fao.org/nr/water/aquastat/countries/southafrica/southafrica_cp.pdf (Accessed on January 9, 2008)
FAO (2007a). Land and Water Development Division. AQUASTAT Geo-referenced database on African dams. http://www.fao.org/AG/AGL/aglw/aquastat/damsafrica/index.stm (Accessed on January 9, 2008)
FAO (2007b). FAOSTAT statistical databases. http://faostat.fao.org/default.aspx (Accessed on January 18, 2008)
SoE (1999). State of the Environment Report: South Africa. Department of Environment Affairs and Tourism http://www.ngo.grida.no/soesa/nsoer/index.htm (Accessed on January 9, 2008)
UNEP-WCMC (n.d). Protected Areas and World Heritage. Greater St Lucia Wetland Park, Kwazulu-Natal, South Africa. http://www.unep-wcmc.org/sites/wh/st_lucia.html (Accessed on February 6, 2008)
Whitfi eld, A. K. (1994). Fish species diversity in southern African estuarine systems: an evolutionary perspective. Environmental Biology of Fishes 40 (1): 37-48.
WWF (2006). Fynbos- A Global Ecoregion. http://www.panda.org/about_wwf/where_we_work/ecoregions/fynbos.cfm (Accessed on February 6, 2008)
Plantation and Indigenous Forests in the Amatole Mistbelt
Bronner, G. (Afrotheria Specialist Group) (2006). Chrysospalax trevelyani. In: IUCN 2007. 2007 IUCN Red List of Threatened Species. http://www.iucnredlist.org/search/details.php/4828/summ (Accessed on December 31 2007)
Conservation International (2007). Biodiversity Hotspots, Maputaland-Pondoland-Albany. http://www.biodiversityhotspots.org/xp/hotspots/maputaland/Pages/default.aspx#indepth (Accessed on December 31, 2007)
DWAF (2005a). Sustainable Resource Use. Department of Water Affairs and Forestry, Republic of South Africa. http://dwafapp4.dwaf.gov.za/dwaf/download.asp?f=Elsa%5CDocs%5CPFM%5CPFM+Guideline6.pdf&docId=3113 (Accessed on December 31, 2007)
DWAF (2005b). Systematic conservation planning for the forest biome of South Africa – Approach, methods and results of the selection of priority forests for conservation action. October 2005, Department of Water Affairs and Forestry, Republic of South Africa. http://dwafapp4.dwaf.gov.za/dwaf/download.asp?f=4137___FCP+fi nal+edited.pdf&docId=4137 (Accessed on December 31, 2007)
Von Maltitz, G. and Fleming, G. (1999). Status of Conservation of Indigenous forests in South Africa. Division of Environment, Water and Forest Technology, CSIR. Presented at Natural Forests and Woodlands Symposium II, 5 - 9 September 1999. Knysna, South Africa. http://dwafapp4.dwaf.gov.za/dwaf/download.asp?f=4184___Status+of+conservation+of+indigenous+forests+in+South+Africa+vonmaltitz.pdf&docId=4184 (Accessed on December 31, 2007)
WWF. (2001). Knysna-Amatole montane forests (AT0115). http://www.worldwildlife.org/wildworld/profi les/terrestrial/at/at0115_full.html (Accessed on December 31, 2007)
Landsat-1 MSS, 21 November 1972, bands 2, 4 and 1
Landsat-7 ETM+, 05 February 2001, bands 7, 4 and 2
Loss of Natural Areas in the Cape Floristic Region
Conservation International (2007). Biodiversity Hotspots. http://www.biodiversityhotspots.org/xp/Hotspots/cape_fl oristic/Pages/default.aspx (Accessed on January 25, 2008)
Conservation International (2007) Biodiversity Hotspots Revisited. http://www.biodiversityscience.org/publications/hotspots/CapeFloristicRegion.html (Accessed on January 25, 2008)
Kruger, F.J. (1979) South African Heathlands. In: R.L. SPECHT (Ed.). Heathlands and related shrublands. Elsevier, New York
Cowling, R. and D. RICHARDSON. (1995) Fynbos, South Africa’s Unique Floral Kingdom. Fernwood Press, Cape Town.
Landsat-3 MSS, 22 June 1978, bands 2, 4 and 1
Landsat-7 ETM+, 01 June 2007, bands 7, 4 and 2
SUDAN
Blanc, J.J., Barnes, R.F.W., Craig, G.C., Dublin, H.T., Thouless, I., Douglas-Hamilton, and Hart, J.A. (2007). African Elephant Status Report 2007: an Update from the African Elephant Database. IUCN. http://www.iucn.org/themes/ssc/sgs/afesg/aed/aesr2007.html (Accessed on January 9, 2008)
FAO (2000-2008). Fisheries and Aquaculture Department. Fishery and Aquaculture Country Profi le: Sudan. http://www.fao.org/fi /website/FISearch.do?dom=country (Accessed on January 9, 2008)
FAO (2005a). Global Forest Resources Assessment.
FAO (2005b). Irrigation in Africa fi gures – AQUASTAT Survey 2005. http://www.fao.org/nr/water/aquastat/countries/sudan/sudan_cp.pdf ((Accessed on January 9, 2008)
Lovgren, S.(2004). Poachers Threaten Last Northern White Rhinos. National Geographic News. http://news.nationalgeographic.com/news/2004/05/0507_040507_whiterhino.html (Accessed on January 9, 2008)
Ramsar (2006). What’s New @ Ramsar. Sudan’s designation of the Sudd marshes on World Environment Day 2006. http://www.ramsar.org/wn/w.n.sudan_sudd.htm (Accessed on February 6, 2008)
Salih, A.A.M. (2001). FOSA Country Report – Sudan. FAO Forestry Sector Outlook Studies. http://www.fao.org/DOCREP/003/AB574E/AB574E00.HTM (Accessed on January 9, 2008)
UNEP (2007). United Nations Environment Programme. Environment for development. Sudan Post-Confl ict Environment Assessment. http://www.unep.org/sudan/ (Accessed on March 28, 2008)
USAID (2002). Laying the Foundation for Wildlife Conservation in southern Sudan. USAID / Sudan – Success Stories. http://www.usaid.gov/regions/afr/ss02/sudan.html (Accessed on January 9, 2008)
Tree Loss in the Southern Foothills of Jebel Marra
Ahmed, A.A. (1983). Forest reserves and woodland savanna regeneration on the sub-Saharan Massif of Jebel Marra, Democratic Republic of the Sudan. Plant Ecology 54(2):65-78
Digital Globe (2007). 16 June 2007, ID 1010010005B07004; ID 1010010005B07005. (Accessed on Google Earth October 27, 2007)
Hunting Technical Services Ltd. (1958). Land and water survey of Jebel Marra area: Reconnaissance vegetation survey. FAO, Rome. http://library.wur.nl/WebQuery/isric?isric=wate?&wq_sfx=short (Accessed October 27, 2007)
Ibrahim, F. (1978). Anthropogenic causes of desertifi cation in Western Sudan. GeoJournal 2(3):243-254.
Republic of the Sudan - Darfur Joint Assessment Mission (2006). Status of Natural Resources and the Environment. http://www.unsudanig.org/darfurjam/trackII/data/preliminary/development/Status%20of%20Natural%20Resources%20and%20the%20Environment-%2024th%20August.doc. (Accessed on October 27, 2007)
United Nations High Commissioner for Refugees (2005). Return-oriented Profi ling in the southern Part of West Darfur and corresponding Chadian border area – General Presentation of Results. http://www.reliefweb.int/library/documents/2005/unhcr-sdn-31jul.pdf (Accessed on October 27, 2007)
ASTER-VNIR, 01 November 2006, bands 2, 3 and 1
Landsat-1 MSS, 12 November 1972, bands 2, 4 and 1
Natural Flooding and the Jonglei Canal, Sudd Swamp
FAO (1997). Irrigation in Africa, A Basin Approach. In: FAO Food and Water Bulletin 4, http://www.fao.org/docrep/W4347E/w4347e11.htm (Accessed on September 27, 2006)
Howell, P., Lock, M. and Cobb, S. (1988). Jonglei Canal: Impact and Opportunity (Cambridge: Cambridge University Press)
Krishnamurthy, V.G. (1980). The Impact Forseen of the Jonglei Canal Scheme on The Fisheries on the Sudd Region: The Problems and Solutions. In CIFA Technical Paper No. 8: Seminar on River Basin Management and Development, Blantyre, Malawi, 8-10 December
Laki, S.L. (1994). The impact of the Jonglei Canal on the economy of the local people. International Journal of Sustainable Development and World Ecology, 1:89-96
UN News Centre (n.d.). UN agency hails inclusion of vast wetlands in south Sudan on conservation list. UN News Centre. http://www.un.org/apps/news/story.asp?NewsID=20439&Cr=sudan&Cr1 (Accessed on December 14, 2007)
ASTER-VNIR, 21 February 2005, bands 2, 3 and 1
ASTER-VNIR, 31 July and 09 August 2005, bands 2, 3 and 1
SWAZILAND
FAO (2003). Workshop on Tropical Secondary Forest Management in Africa: Reality and Perspectives. Country paper: Swaziland. http://www.fao.org/DOCREP/006/J0628E/J0628E62.htm (Accessed on February 6, 2008)
FAO (2005). Irrigation in Africa fi gures – AQUASTAT Survey 2005. http://www.fao.org/nr/water/aquastat/countries/swaziland/swaziland_cp.pdf (Accessed on January 9, 2008)
UNESA (2005). Population Division of the Department of Economic and Social Affairs. World Population Prospects: The 2004 Revision. Dataset on CD-ROM. New York. http://www.un.org/esa/population/ordering.htm. (Accessed on January 9, 2008)
SoE (2001). State of Environment Report For Swaziland. Mbabane. Swaziland Ministry of Tourism, Environment and Communication. http://www.environment.gov.sz/fi les/soer.pdf (Accessed on January 9, 2008)
WRI (2007). EarthTrends The Environmental Information Portal. Water Resources and Freshwater Ecosystems. Swaziland. http://earthtrends.wri.org/pdf_library/country_profi les/wat_cou_748.pdf (Accessed on February 6, 2008)
Sugarcane Farming
Environmental Centre Swaziland (2004).Swaziland’s First National Communication to the United Nations Framework Convention on Climate Change, http://www.ecs.co.sz/unfccc/chapter4_4.htm (Accessed on January 25, 2008)
IRIN (2005). SWAZILAND: Sugar farmers urged to diversify as EU slashes subsidy, http://www.irinnews.org/report.aspx?reportid=52820 (Accessed on January 25, 2008)
Swaziland Sugar Association (n.d.). Chairman’s Message, Senator Obed Dlamini. Swaziland Sugar Association. http://www.swazibusiness.com/swazisugar/chairman.html. (Accessed on January 30, 2008)
ASTER-VNIR, 02 May and 06 June 2006, Bands 2, 3 and 1
Landsat-3 MSS, 10 June 1979, bands 2, 4 and 1
TANZANIA, UNITED REPUBLIC OF
CORDIO (2005). Coral Reef Degradation in the Indian Ocean: Status Report. (2005). Eds. David Souter and Olof Linden. Sweden: CORDIO.
FAO (2005). Irrigation in Africa fi gures – AQUASTAT Survey 2005. http://www.fao.org/nr/water/aquastat/countries/tanzania/tanzania_cp.pdf (Accessed on January 30, 2008)
FAO AGL (2003). Land Degradation Severity. Terrastat online database. http://www.fao.org/ag/agl/agll/terrastat/#terrastatdb (Accessed on January 30, 2008)
FAO (2005). Global Forest Resources Assessment. Rome: FAO. http://www.fao.org/forestry/site/fra/en/ (Accessed on Janaury 30, 2008)
Froese, R. and Pauly, D. (ed.). (2007). FishBase. www.fi shbase.org, version. http://fi sh.mongabay.com/data/ecosystems/ (Accessed on August 15, 2007)
Mgana, S. S. and Mahongo, S. (2002). Strategic Action Plan for Land-Based Sources and Activities Affecting the Marine, Coastal and Associated Fresh Water Environment in the Eastern African Region. A Report prepared by Food and Agriculture Organisation of the United Nations project for the Protection and Management of the Marine and Coastal Areas of the Eastern African Region (EAF/5).

366 �
Swahili Language & Culture (n.d.). The Serengeti National Park. http://www.glcom.com/hassan/serengeti.html (Accessed on February 6, 2008)
Spalding, M.D., Corinna Ravilious, Green, E.P. (2001). World Atlas of Coral Reefs. Prepared at UNEP-WCMC. Berkeley: University of California Press.
Tanzania National Bureau of Statistics (2005). Environmental Statistics. Dar es Salaam, Tanzania.
UNEP- WCMC (n.d). Protected Areas and World Heritage. Kilimanjaro National Park, Tanzania. http://www.unep-wcmc.org/sites/wh/kilimanj.html (Accessed on February 6, 2008)
UNESCO (2007). World Heritage List. Serengeti National Park. http://whc.unesco.org/en/list/156 (Accessed on January 30, 2008)
Invasive Plants in Lake Jipe
IPPMedia (2006). Lake Jipe Extinction Imminent. http://www.ippmedia.com/ipp/guardian/2006/08/15/72449.html (Accessed on December 4, 2006)
IUCN (2003). IUCN Eastern Africa Programme – Pangani Basin: A Situation Analysis. http://www.iucn.org/themes/wani/pub/SituationPangani.pdf (Accessed on December 4, 2006)
MNRT, Wildlife Division (2004). The United Republic of Tanzania, Ministry of Natural Resources and Tourism, Wildlife Division: Lake Jipe Awareness Raising Strategy, 2005-2007. http://www.ramsar.org/outreach_actionplan_tanzania_jipe.pdf (Accessed on December 4, 2006)
ASTER-VNIR, 11 February 2005, bands 2, 3 and 1
Landsat-2 MSS, 27 July 1975, bands 2, 4 and 1
The Impact of Decreased Precipitation on Mount Kilimanjaro
Hemp, A. (2005). Climate change-driven forest fi res marginalize the impact of ice cap wasting on Kilimanjaro. Global Change Biology 11:1013-1023.
Kaser, G., Hardy, D.R. , Molg, T., Bradley, R.S. and Hyera, T.M. (2004). Modern glacier retreat on Kilimanjaro as evidence of climate change: observations and facts. International Journal of climatology 24:329-339.
Thompson, L.G., Mosley-Thompson, E., Davis, M.E., Henderson, K.A., Brecher, H.H., Zagorodnov, V.S., Mashiotta, T.A., Lin, P.N, Mikhalenko, V.N., Hardy, D.R., Beer, J. (2002). Kilimanjaro ice core records: evidence of Holocene climate change in tropical Africa. Science 298:589–593.
Landsat-2 MSS, 24 January 1976, bands 2, 4 and 1
Landsat-7 ETM+, 29 January 2005 and 05 February 2006, bands 7, 4 and 2
TOGO
CBD (2003). Convention on Biological Biodiversity. Togo Ministry of the Environment and Forest Resources. National Biodiversity Strategy and Action Plan. http://www.cbd.int/doc/world/tg/tg-nbsap-01-fr.doc (Accessed on January 9, 2008)
FAO AGL (2003). Land Degradation Severity. Terrastat online database. http://www.fao.org/ag/agl/agll/terrastat/#terrastatdb (Accessed on January 9, 2008)
FAO (2005). Irrigation in Africa fi gures – AQUASTAT Survey 2005. http://www.fao.org/nr/water/aquastat/countries/togo/togo_cp.pdf (Accessed on January 9, 2008)
FAO Statistics (2006). The Statistics Division. Compendium of food and agriculture indicators 2006. Togo. http://www.fao.org/ES/ess/compendium_2006/pdf/TOG_ESS_E.pdf (Accessed on February 6, 2008)
Gnandi, K., Tchangbedji, G., Killi, K., Baba, G. and Abbe, K. (2006). The Impact of Phosphate Mine Tailings on the Bioaccumulation of Heavy Metals in Marine fi sh and Crustaceans from the coastal Zone of Togo. Mine Water and the Environment 25 (1): 56-62
UN (2007). Millennium Development Goals Indicators. http://mdgs.un.org/unsd/mdg/Default.aspx (Accessed on January 9, 2008)
Displacement and Environmental Changes around Nangbéto Dam
Adam, K.S. (1989). Les Impacts Environnementaux du Barrage du Nangbeto (Togo). Geo-Eco-Trop, 13 (1-4) 103-112.
World Bank (1998). Recent Experience with Involuntary Resettlement Togo-Nangbeto. Report No.17543
Landsat-5 TM, 13 January 1986, bands 7, 4 and 2
Landsat-7 ETM+, 13 December 2001, bands 7, 4 and 2
TUNISIA
FAO. (n.d). Geonetwork. http://www.fao.org/geonetwork/srv/en/main.home (Accessed on February 6, 2008)
FAO. (2004). Gateway to Land and Water Information. Reports. Tunisia. http://www.fao.org/ag/agL/swlwpnr/reports/y_nf/z_tn/tn.htm (Accessed on February 6, 2008)
FAO (2007). Land and Water Development Division. AQUASTAT Information System on Water and Agriculture: Online database. http://www.fao.org/nr/water/aquastat/data/query/index.html (Accessed on January 9, 2008)
IUCN and WWF (2003). Restore forests to fi ght Mediterranean desertifi cation – WWF and IUCN. Press Release 17 June 2003. http://www.iucn.org/en/news/archive/2001_2005/press/prdesertifi cation.pdf (Accessed on January 9, 2008)
Jdid, E.A., Blazy, P., Kamoun, S., Guedria, A., Marouf, B., Kitane, S. (1999). Environmental impact of mining activity on the pollution of the Medjerda River, north-west Tunisia. Bulletin of Engineering Geology and the Environment. 57(3): 1435-9529. http://www.springerlink.com/content/jq7lgr11t0vpb0kf/ (Accessed on January 9, 2008)
Mtimet, A. (2004). Gateway to Land and Water Information: Tunisia National Report. FAO. http://www.fao.org/ag/agl/swlwpnr/reports/y_nf/z_tn/tn.htm (Accessed on January 9, 2008)
UNESCO-WCMC (2007). World Heritage List. Ichkeul National Park, Tunisia. http://www.unep-wcmc.org/sites/wh/ichkeul.html (Accessed on January 9, 2008)
UN (2007). Millennium Development Goals Indicators. http://mdgs.un.org/unsd/mdg/Default.aspx. (Accessed on January 9, 2008)
UNESA (2006). Population Division of the Department of Economic and Social Affairs. World Urbanization Prospects: The 2005 Revision. Available on CD-ROM. New York.
Changes in Hydrology, Vegetation and Habitat, Lake Ichkeul
Agence national de protection de l’environnement. (n.d.). Rapport sur le suivi scientifi que au parc national de l’Ichkeul année 2004-2005. Ministère de l’environnement et du développement durable. 74. pp
Agence national de protection de l’environnement. (n.d.). Rapport sur le suivi scientifi que au parc national de l’Ichkeul année 2003-2004. Ministère de l’environnement et du développement durable. 59. pp
BirdLife International (2007). BirdLife’s online World Bird Database: the site for bird conservation. Version 2.1. Cambridge, UK: BirdLife International. http://www.birdlife.org (Accessed on November 14, 2007)
Shili, A., Maïz, N. B., Boudouresque, C. F., & Trabelsi, E. B. (2007). Abrupt changes in potamogeton and ruppia beds in a mediterranean lagoon. Aquatic Botany, 87(3), 181-188.
Protection and Habitat Regeneration at Sidi Toui National Park
Mohamed, Y.O.S., Neffati, M. and Henchi, B. (2002). Study of the effect of the vegetation management mode on its dynamics in pre-Saharan Tunisia: the case of the national park of Sidi Toui and its surroundings Science et changements planétaires / Sécheresse 13(3):195-203
Comunique. (2006). Returning the Addax and the Oryx to Tunisia. Association of zoos and Aquariums. http://www.aza.org/Publications/2006/04/Addax_Oryx.pdf (Accessed on November 16, 2007)
Smithsonian National Zoological Park Website (n.d.). Recovery of the Desert Antelope. http://nationalzoo.si.edu/ConservationAndScience/ReproductiveScience/AntelopesCervids/ (Accessed on November 16, 2007)
IUCN (2007). Antelope Specialist Group 2007. Oryx dammah. In: IUCN 2007. 2007 IUCN Red List of Threatened Species. www.iucnredlist.org (Accessed on November 19, 2007)
CMS (2000). Reintroduction Programme of the Scimitar-Horned Oryx to Sidi Toui National Park, Tunisia. Renata Molcanova (Zollological Garden Bratislava, Slovak Republic) Simon Wakefi eld (Marwell Zoological Park, UK). In CMS Bulletin #12.
Landsat-5 TM, 02 January 1987, bands 7, 4 and 2
Landsat-7 ETM+, 14 January 2006, bands 7, 4 and 2
UGANDA
FAO (2005). Irrigation in Africa fi gures – AQUASTAT Survey 2005. http://www.fao.org/nr/water/aquastat/countries/uganda/uganda_cp.pdf (Accessed on January 9, 2008)
FAO (2007). Land and Water Development Division. AQUASTAT Information System on Water and Agriculture: Online database. http://www.fao.org/nr/water/aquastat/data/query/index.html (Accessed on January 9, 2008)
SoE (2000/2001). State of Environment Report for Uganda 2000/2001. National Environment Management Authority.
Science Daily (2007). Science News. Uganda’s Mountain Gorillas Increase In Number. http://www.sciencedaily.com/releases/2007/04/070420143329.htm (Accessed on February 6, 2008)
UNESCO (2007). World Heritage List. Bwindi Impenetrable National Park. http://whc.unesco.org/en/list/682 (Accessed on January 9, 2008)
UNESCO (n.d.). World Water Assessment Programme for development, capacity building and the environment. Assessing the impacts of climate change in Uganda. http://www.unesco.org/water/wwap/wwdr2/case_studies/uganda/index.shtml (Accessed on February 6, 2008)
WHO (2006). World Health Organization. Global Health Atlas: World Health Statistics. www.who.int/GlobalAtlas/ (Accessed on January 25, 2008)
Glacial Recession in the Rwenzori Mountains
EWP (2001). Glacial Recession in the Rwenzoris. http://www.kilimanjaro.cc/rwenzoriglaciers.htm (Accessed on October 16, 2006)
Moelg, T., Georges C., Kaser G. (2003). The contribution of increased incoming shortwave radiation to the retreat of the Rwenzori Glaciers, East Africa, during the 20th century. International Journal of Climatology, 23 (3), pp. 291-303.
Santer, B. D., et al. (2005). Amplifi cation of surface temperature trends and variability in the tropical atmosphere, Science, 309, 1551– 1556.
Taylor R.G., Mileham L., Tindimugaya C., Majugu A., Muwanga A.,Nakileza B (2006). Recent glacial recession in the Rwenzori Mountains of East Africa due to rising air temperature. Geophysical Research Letters, 33, pp. 1-4.
ASTER-VNIR, 21 February 2005, bands 2, 3 and 1
Landsat-5 TM, 07 August 1987, bands 7, 4 and 2
Secondary Forest Growth in Mabira Forest, Uganda
BBC (2007). Deaths in Uganda forest protest. BBC NEWS online 12 April 2007. http://news.bbc.co.uk/2/hi/africa/6548107.stm (Accessed on June 18, 2007)
Davenport et al. in Muramira, T. (2001). Valuing the losses caused to Mabira Forest by hydropower development in Uganda. Innovation 8(2):28-30.
Muramira, T. (2001). Valuing the losses caused to Mabira Forest by hydropower development in Uganda. Innovation 8(2):28-30.
Museveni. (2007). Why I Support Mabira Forest give-away to Mehta Group. Yoweri Museveni, President Uganda, published on New Vision: http://www.newvision.co.ug/D/8/20/560792 (Accessed on August 6, 2007)
Naidoo, R. and Adamowicz, W.L. (2005). Economic benefi ts of biodiversity exceed costs of conservation at an African rainforest reserve. Proceeding of the National Academy of Sciences. 102(46):16714-16716.
Westman, W. E., Strong, L. L., Wilcox, B. A. (1989). Tropical Deforestation and Species Endangerment: the Role of Remote Sensing. Landscape Ecology, 3 (2), pp. 97-109
Landsat-1 MSS, 02 February 1973 and 29 January 1974, bands 2, 4 and 1
Landsat-7 ETM+, 27 November 2001, bands 7, 4 and 2
Landsat-7 ETM+, 25 January 2006, bands 7, 4 and 2
WESTERN SAHARA
FAO (2006). FAOSTAT statistical databases. http://faostat.fao.org/default.aspx (Accessed on January 18, 2008)
FAO (2007). Fisheries and Aquaculture Information and Statistics Service. Capture production 1950-2005. FISHSTAT Plus - Universal software for fi shery statistical time series [online or CD-ROM]. http://www.fao.org/fi /statist/FISOFT/FISHPLUS.asp (Accessed on January 9, 2008)
UNESA (2006). Population Division of the Department of Economic and Social Affairs. World Urbanization Prospects: The 2005 Revision. Dataset on CD-ROM. New York: United Nations.
United Nations (n.d). MINURSO United Nations Mission for The Referendum in Western Sahara 1991 to today. http://www.un.org/Depts/dpko/missions/minurso/MINURSO.pdf (Accessed on February 6, 2008)
Western Sahara Resource Watch (2007). The phosphate exports. http://www.wsrw.org/index.php?cat=117&art=521 (Accessed on February 6, 2008)
Phosphate Mining at Bou Craa, Western Sahara
France Libertés. (2003). Report: International Mission of Investigation In Western Sahara. France Libertés – AFASPA. http://www.arso.org/FL101102e.pdf (Accessed on November 20, 2007)
USGS (2001). The mineral industry of Morocco and Western Sahara, Philip A. Szczesniak. US Geological Survey. http://minerals.usgs.gov/minerals/pubs/country/2001/momyb01.pdf (Accessed on November 20, 2007)
ASTER-VNIR, 25 April 2007, bands 3, 2 and 1
Landsat-5 TM, 20 January 1987, bands 5, 4 and 3
Landsat-1 MSS, 25 August 1972 and 27 June 1973, bands 2, 4 and 1
Landsat-7 ETM+, 16 January and 05 August 2000, bands 7, 4 and 2
ZAMBIA
BBC (2006). World’s Pollution Hotspots Mapped. http://news.bbc.co.uk/2/hi/science/nature/6063344.stm (Accessed on October 18, 2006)
FAO (2003). Forestry Outlook Study for Africa: Sub-regional Report for Southern Africa.
FAO (2005). Global Forest Resources Assessment.
GTZ (2004). Sharing the experience on regulation in the water sector, SOWAS – working group on regulation and PSP in Sub Saharan Africa. German Technical Cooperation Agency, Lusaka. http://www2.gtz.de/dokumente/bib/04-0177.pdf (Accessed 13 March 2008)
IUCN (2006). The IUCN Red list of Threatened Species. Summary Statistics for Globally Threatened Species. Table 5. http://www.iucnredlist.org/info/stats. (Accessed on January 8, 2008)
LAKENET (2004). Lake Profi le. Kariba. http://www.worldlakes.org/lakedetails.asp?lakeid=8360 (Accessed on February 6, 2008)
World Infozone (2008). Zambia Facts. http://www.worldinfozone.com/facts.php?country=Zambia (Accessed on February 6, 2008)
Zambia National Tourist Board (n.d.). Zambia. Kafue National Park. http://www.zambiatourism.com/travel/nationalparks/kafue.htm (Accessed on February 6, 2008)
UN (2007). Convention on Biodiversity. Country Profi le. Zambia. http://www.cbd.int/countries/profi le.shtml?country=zm#status. (Accessed on January 8, 2008)

367�
UN-HABITAT (2007). Zambia: Lusaka Urban Sector Profi le, United Nations Human Settlements Programme, pp.32
World Bank (2002). Zambia Copperbelt Environment Project. Report No. PID9676. http://www-wds.worldbank.org/external/default/WDSContentServer/WDSP/IB/2000/11/23/000094946_00112305435537/Rendered/PDF/multi0page.pdf (Accessed on January 25, 2008)
World Bank (2002) UPGRADING LOW INCOME URBAN SETTLEMENTS- COUNTRY ASSESSMENT REPORT: Zambia, The World Bank, January 2002, pp 7. http://www.worldbank.org/urban/upgrading/docs/afr-assess/zambia.pdf
Natural and Managed Flooding at Kafue Flats
AAAS (1998). Case Study: Zambia – Integrating Water Conservation and Population Strategies on the Kafue Flats, Harry N. Weza Chabwela, University of Zambia & Wanga Mumba, Environment and Population Centre. http://www.aaas.org/international/ehn/waterpop/zambia.htm (Accessed on June 7, 2007)
Centre for Ecology and Hydrology (CEH) (2001). Managed Flood Releases: A working conference on guidelines for managed fl ood releases and lessons learned from Itezhi-tezhi. Lusaka 13-14 March 2001. Workshop Report
Schelle, P., and Pittock, J. (2005). Restoring the Kafue Flats, A partnership approach to environmental fl ows in Zambia. Presented at 10th International Riversymposium & Environmental Flows Conference, Brisbane, Australia, September 3, 2005.
WWF (2007). Towards Effective Conservation Strategies – The application of strategic principles to increase the impact and sustainability of WWF conservation efforts. Prepared by AIDEnvironment for WWF Netherlands, WWF US & WWF UK. Accessed June 6, 2007 at: http://assets.panda.org/downloads/wwf_nl_strategic_principles_03_29_07.pdf
Landsat-1 MSS, 29 June 1973, 26 September 1973 and 30 September 1972, bands 2, 4 and 1
Page 132 and 133 bottom – Landsat-7 ETM+, 15 March and 25 April 2007, bands 7, 4 and 2
Mines, Population and Deforestation in Copperbelt Province
Chidumayo, E.N. (1989). Land Use, Deforestation and Reforestation in the Zambian Copperbelt. Land Degradation and Rehabilitation. 1:209-216
Government of the Republic of Zambia, (2006) Vision 2030, Lusaka, Zambia
WWF (2006). From copper to conservation: Rehabilitating Zambia’s copper belt. http://www.panda.org/news_facts/newsroom/features/index.cfm?uNewsID=72580 (Accessed on November 7, 2006)
Landsat-1 MSS, 13 and 30 September 1972, bands 2, 4 and 1
Landsat-7 ETM+, 12 July 2006, bands 7, 4 and 2
ZIMBABWE
CBD (1998). Covention on Biological Diversity. Zimbabwe Ministry of Environment and Tourism. Zimbabwe Biodiversity Strategy and Action Plan. Harare. http://www.cbd.int/doc/world/zw/zw-nbsap-01-en.pdf (Accessed on January 8, 2008)
FAO (2004). Subregional Offi ce for Southern and East Africa Harare. Drought impact mitigation and prevention in the Limpopo River Basin: a situation analysis. http://www.fao.org/docrep/008/y5744e/y5744e08.htm (Accessed on January 8, 2008)
FAO (2005). Forestry Division. Global Forest Resources Assessment 2005. Rome: FAO. http://www.fao.org/forestry/site/fra2005/en/ (Accessed on January 8, 2008)
International Rhino Foundation (n.d). Zimbabwe. http://www.rhinos-irf.org/zimbabwe/ (Accessed on February 6, 2008)
IUCN (2007). African Rhino Specialist Group 2003. Diceros bicornis ssp. longipes. In: IUCN 2007. 2007 IUCN Red List of Threatened Species. www.iucnredlist.org. (Accessed on October 9, 2007)
Reuters. (2007). Poaching Rises in Zimbabwe’s Game Parks: Report. http://www.reuters.com/article/environmentNews/idUSSCH73666220070507 (Accessed on May 7, 2007)
UN (2006). Offi ce for the Coordination of Humanitarian Affairs . ZIMBABWE: Water crisis hits major cities. IRIN News Service. http://www.irinnews.org/report.aspx?reportid=57763 (Accessed on January 8, 2008)
UN (2007). World Statistics Pocketbook. United Nations Statistics Division. Department of Economics and Social Affairs, New York.
UNEP-WCMC (n.d.). Protected Areas and World Heritage Programme, Guidelines for Protected Area Management Categories. http://www.unep-wcmc.org/protected_areas/categories/eng/ex-iii.htm (Accessed on March 27, 2008)
Agricultural Changes in Mashonaland Central Province
International Food Policy Research Institute (2002). Land Reform in Zimbabwe: Farm-Level Effects and Cost-Benefi t Analysis. http://www.ifpri.org/Divs/Tmd/Dp/Papers/Tmdp84.Pdf. (Accessed February 25, 2008)
FAO (2004). Special Report, Zimbabwe. http://www.fao.org/docrep/007/J2650e/J2650e00.htm#14 (Accessed February 22, 2008)
Smith, J., M. Budde, J. Rowland, G. Senay, G. Tappan and J. Verdin. (2006). WRSI / NDVI Comparison of Cultivated Areas in Zimbabwe.
ASTER-VNIR, 25 August 2001, bands 2, 3 and 1
ASTER-VNIR, 11 August 2005, bands 2, 3 and 1
Excess Nutrients and Invasive Plants inLake Chivero
Chikwenhere, C.P. (2001). Current Strategies for the Management of Water Hyacinth on the Manyame River System in Zimbabwe. In; Biological and Integrated Control of Water Hyacinth, Eichhomia crassipes, edited by M.H. Julien, M.P. Hill, T.D. Center and Ding Jianqing. ACIAR Proceedings 102 (Printed version published in 2001).
Chikwenhere, C.P. and Phiri, G. (1999). History of water hyacinth and its control efforts on Lake Chivero in Zimbabwe. In: Hill MP, Julien MH & Center TD (Eds) Proceedings of the fi rst IOBC global working group meeting for the biological and integrated control of water hyacinth, 16 – 19 November, Harare, Zimbabwe
IRIN (2005). Harare’s Water Supply Threatened. UN Integrated Regional Information Networks. http://www.zimconservation.com/archives5-51.htm (Accessed on December 18, 2007)
Landsat-5 TM, 19 May 1989, bands 7, 4 and 2
Landsat-7 ETM+, 30 April 2000, bands 7, 4 and 2
Following data source has been used for the MDG graphs in the country profi les:
MDG Indicators. (2007). United Nations Statistics Division. http://mdgs.un.org/unsd/mdg/Default.aspx
Following data sources have been used for the graphs in the country profi les:
AQUASTAT (2007). Food and Agriculture organization of the United Nations. http://www.fao.org/nr/water/aquastat/main/index.stm
BP (2007). Statistical Review of World Energy 2007. BP p.I.C. http://www.bp.com/productlanding.do?categoryId=6848&contentId=7033471
EDGAR (n.d.). Netherlands Environmental Assessment Agency.
EM-DAT (2007). Emergency Events Database. http://www.emdat.be/
FAOSTAT (2007). Food and Agriculture organization of the United Nations. http://faostat.fao.org/default.aspx
FISHSTAT (2007). FAO. Fisheries and Aquaculture Information and Statistics Service. Capture production 1950-2005. FISHSTAT Plus - Universal software for fi shery statistical time series [online or CD-ROM EM-DAT disaster
IMF (n.d.). International Monetary Fund. http://www.imf.org/external/pubs/cat/longres.cfm?sk=19205.0
International Rhino Foundation. (2003). http://www.rhinos-irf.org/rhinoinformation/blackrhino/index.htm
IUCN (2007). http://cms.iucn.org/
IUCN redlist (2007). 2007 IUCN Red List of Threatened species. http://www.iucnredlist.org/
Kenya National Water Development Report (2006). UNESCO World Water Assessment Programme
MDG Indicators (2007). United Nations Statistics Division. http://mdgs.un.org/unsd/mdg/Default.aspx
National Disaster Management Policy, Republic of Kenya (2004). http://www.oxfamamerica.org/resources/fi les/2006_Oxfam_Kenya_Background_Report.pdf
National Report on the Status of Biodiversity in São Tomé and Príncipe (2007). http://www.cbd.int/doc/world/st/st-nr-03-en.pdf
Nigeria National Biodiversity Strategies and Action Plans (NBSAP) (n.d.). United Nations.
Rwanda State of Environment Report (2002)
Status and Trends in Mangrove Area Extent Worldwide (2003). FAO. http://www.fao.org/docrep/007/j1533e/j1533e00.htm
UN Population Division (2006). Department of Economic and Social Affairs. World Urbanization Prospects: The 2005 Revision.
UNEP (2005). State of the Environment in Somalia: a Desk Study. http://www.unep.org/DEPI/programmes/Somalia_Final.pdf
USGS International Mineral Statistics and Information (2005). Africa and the Middle East http://minerals.usgs.gov/minerals/pubs/country/africa.html#ct
World Conservation Monitoring Centre of the United Nations Environment Programme (UNEP-WCMC) (2004). Species Data (unpublished, September 2004). Web site at: http://www.unep-wcmc.org Cambridge, England: UNEP-WCMC.
World Bank World Development Indicators (2006). The World Bank. http://web.worldbank.org/WBSITE/EXTERNAL/DATASTATISTICS/0,,contentMDK:20899413~pagePK:64133150~piPK:64133175~theSitePK:239419,00.html
WRI- EarthTrends (2007). http://earthtrends.wri.org/

368 �
Acronyms and Abbreviations
AARSE African Association of Remote Sensing of the EnvironmentACOPS Advisory Committee on Protection of the SeaAMCEN The African Ministerial Conference on the EnvironmentASAR Advanced Synthetic Aperture Radar bbl/d barrels per dayBCLME Benguela Current Large Marine EcosystemBP British PetroleumCAR Central African RepublicCARPE Central African Regional Program for the EnvironmentCBD Convention on Biological DiversityCDIAC Carbon Dioxide Information Analysis CenterCFCs Chlorofl uorocarbonsCI Conservation InternationalCIESIN Center for International Earth Science Information NetworkCITES Convention on International Trade in Endangered SpeciesCO Carbon MonoxideCO2 Carbon DioxideCRED Centre for Research on the Epidemiology of DisastersDEWA Division of Early Warning and AssessmentDMS dense media separationDOE Department of EnergyDRC Democratic Republic of the CongoEIA Energy Information Administration, United States Department of EnergyEIS–Africa Environmental Information Systems – AfricaEM-DAT Emergency Events Database ENSO El Niño/Southern OscillationENVISAT European Space Agency Environmental SatelliteEPA Environmental Protection AgencyFAO Food and Agriculture Organisation of the United NationsGDP Gross Domestic ProductGEO Group on Earth ObservationsGIS Geographic Information ScienceGLCF Global Land Cover FacilityGLTP Great Limpopo Transfrontier Park GMMR Great Man-made RiverHABs Harmful Algal Blooms HIPC heavily indebted poor countriesIMF International Monetary FundIPCC Intergovernmental Panel on Climate Change ISO International Standards OrganizationITCZ Inter-Tropical Convergence ZoneIUCN International Union for Conservation of Nature and Natural ResourcesIUSSP International Union for the Scientifi c Study of Populationkg kilogramskm kilometreskm2 square kilometres km3 cubic kilometresLME Large Marine Ecosystemm metresm2 square metresm3 cubic metresMDGs Millennium Development GoalsMETAP Mediterranean Environmental Technical Assistance Programmm millimetres
MODIS Moderate Resolution Imaging SpectroradiometerNO2 Nitrogen Dioxide N2O Nitrous Oxide NASA National Aeronautics and Space AdministrationNDVI Normalized Difference Vegetation IndexNOAA National Oceanic and Atmospheric AdministrationNOSA National Occupational Safety Association NP National ParkNWSA North-West Sahara AquiferODA Offi cial development assistanceODP Ozone depleting potentialOECD/DAC Organization for Economic Co-operation and Development/Development Assistance CommitteeOMVS Oganisation pour la mise en valeur du fl euve Sénégal (Organisation for the Development of the Senegal River)PPP Purchasing Power ParityRCMRD Regional Centre for Mapping of Resources for DevelopmentRS Remote SensingSADC Southern African Development Community SADCC Southern African Development Coordination Conference (Group of nine countries—Angola, Botswana, Lesotho, Malawi, Mozambique, Swaziland, Tanzania, Zambia, and Zimbabwe—surrounding or surrounded by the Republic of South Africa)SAIC Science Applications International CooperationSCOUL Sugar Cooperation of UgandaSDSU South Dakota State UniversitySOE State of the EnvironmentTWh terawatt hour (it corresponds to 1 000 000 000 kWh (kilowatt hours) or one thousand Gigawatt hours) UMD University of MarylandUN United NationsUNCCD United Nations Convention to Combat Desertifi cationUNDP United Nations Development ProgrammeUNECA United Nations Economic Commissions for AfricaUNEP United Nations Environnent ProgrammeUN ESA United Nations – Department of Economic and Social AffairsUNESCO United Nations Educational, Scientifi c and Cultural OrganisationUNFCCC United Nations Framework Convention on Climate ChangeUNFPA United Nations Population FundUNHCR United Nations High Commissioner for RefugeesUNICEF United Nations Children’s FundUSAID United States Agency for International DevelopmentUSGS United States Geological Survey USSP Uganda Strategy Support ProgramUV Ultra VioletWAP W-Arly-Pendjari WCMC World Conservation Monitoring CentreWHO World Health OrganizationWIO West Indian Ocean WRI World Resources InstituteWWF World Wildlife Fundyr year

369�
Changes in MDG Goal 7: Forested Land Carbon Dioxide Protected area Access to Access to Improved Slum Population
Environmental Sustainability as % of Land emissions (CO2), to total surface, Improved Water Sanitation as percentage of
Indicators Area metric tons of area percentage source (% of (% of total urban population
CO2 per capita total population) population)
Country Names 1990 2005 1990 2004 1990 2005 1990 2004 1990 2004 1990 2001
Algeria, People’s Democratic Republic of 0.8 1 3.0471 5.994 5 5 94 85 88 92 11.8 11.8
Angola, Republic of 48.9 47.4 0.4413 0.5051 12.1 12.1 36 53 29 31 83.1 83.1
Benin, Republic of 30 21.3 0.138 0.2902 23 23 63 67 12 33 80.3 83.6
Botswana, Republic of 24.2 21.1 1.5876 2.3693 29.4 30.2 93 95 38 42 59.2 60.7
Burkina Faso 30.6 29 0.112 0.0812 14.9 15.4 38 61 7 13 80.9 76.5
Burundi, Republic of 11.3 5.9 0.0341 0.0291 4.4 5.6 69 79 44 36 83.3 65.3
Cameroon, Republic of 52.7 45.6 0.1312 0.2205 5.4 8.9 50 66 48 51 62.1 67
Cape Verde, Republic of 14.3 20.7 0.2476 0.5553 0 0 80 43 70.3 69.6
Central African Republic 37.2 36.5 0.0658 0.0614 15.1 15.7 52 75 23 27 94 92.4
Chad, Republic of 10.4 9.5 0.0234 0.0127 9.3 9.3 19 42 7 9 99.3 99.1
Comoros, Union of the 6.5 2.9 0.1253 0.1132 2.7 93 86 32 33 61.7 61.2
Congo, Republic of the 66.5 65.8 0.4844 1.0034 6.4 14.1 58 27 84.5 90.1
Congo, Democratic Republic of the 62 58.9 0.1047 0.037 7.2 8.4 43 46 16 30 51.9 49.5
Côte d`Ivore, Republic of 32.1 32.7 0.4217 0.2825 16.4 16.4 69 84 21 37 50.5 67.9
Djibouti, Republic of 0.2 0.2 0.6278 0.4639 72 73 79 82
Egypt, Arab Republic of 0 0.1 1.369 2.2116 6.5 13.3 94 98 54 70 57.5 39.9
Equatorial Guinea, Republic of 66.3 58.2 0.3454 11.4748 4.9 14.3 43 53 89.1 86.5
Eritrea 16 15.4 0.1735 3.2 3.2 43 60 7 9 69.9 69.9
Ethiopia, Federal Democratic Republic of 13.8 11.9 0.058 0.1037 16.9 16.9 23 22 3 13 99 99.4
Gabonese Republic 85.1 84.5 6.5306 1.0796 4.7 16.2 88 36 56.1 66.2
Gambia, Republic of the 39.1 41.7 0.1981 0.1821 3.9 4.1 82 53 67 67
Ghana, Republic of 32.7 24.2 0.2419 0.326 14.6 14.7 55 75 15 18 80.4 69.6
Guinea, Republic of 30.1 27.4 0.1677 0.1515 3.3 6.1 44 50 14 18 79.6 72.3
Guinea-Bissau, Republic of 78.8 73.7 0.2056 0.1752 3.2 7.3 59 35 93.4 93.4
Kenya, Republic of 6.5 6.2 0.2485 0.3054 12.5 12.7 45 61 40 43 70.4 70.7
Lesotho, Kingdom of 0.2 0.3 0.2 0.2 79 37 37 49.8 57
Liberia, Republic of 42.1 32.7 0.2179 0.1401 12.7 12.7 55 61 39 27 70.2 55.7
Libyan Arab Jamahiriya, Socialist People’s 0.1 0.1 8.6612 10.331 0.1 0.1 71 97 97 35.2 35.2
Madagascar, Republic of 23.5 22.1 0.0783 0.1506 1.8 2.6 40 50 14 34 90.9 92.9
Malawi, Republic of 41.4 36.2 0.0637 0.081 16.4 16.4 40 73 47 61 94.6 91.1
Mali, Republic of 11.5 10.3 0.055 0.0501 1.6 2.1 34 50 36 46 94.1 93.2
Mauritania, Islamic Republic of 0.4 0.3 1.3551 0.8866 1.7 1.7 38 53 31 34 94.3 94.3
Mauritius, Republic of 19.2 18.2 1.3844 2.598 0.5 0.9 100 100 94
Morocco, Kingdom of 9.6 9.8 0.9473 1.3654 0.8 1.2 75 81 56 73 37.4 32.7
Mozambique, Republic of 25.5 24.6 0.0736 0.1079 7.6 8.6 36 43 20 32 94.5 94.1
Namibia, Republic of 10.6 9.3 0.0052 1.2394 14.6 14.6 57 87 24 25 42.3 37.9
Niger, Republic of the 1.5 1 0.1341 0.0947 6.6 6.6 39 46 7 13 96 96.2
Nigeria, Federal Republic of 18.9 12.2 0.4803 0.8263 3.7 6.1 49 48 39 44 80 79.2
Rwanda, Republic of 12.9 19.5 0.0724 0.0632 3.9 7.6 59 74 37 42 82.2 87.9
Sao Tome and Principe, Democratic Republic 28.4 28.4 0.5683 0.6106 79 25
Senegal, Republic of 48.6 45 0.397 0.4353 10.8 10.8 65 76 33 57 77.6 76.4
Seychelles, Republic of 88.9 88.9 1.5783 6.4395 1 1 88 88
Sierra Leon, Republic of 42.5 38.5 0.0816 0.1843 3.9 3.9 57 39 90.9 95.8
Somali Republic 13.2 11.4 0.0027 0.7 0.7 29 26 96.3 97.1
South Africa, Republic of 7.6 7.6 9.0777 9.1927 5.6 6.1 83 88 69 65 46.2 33.2
Sudan, Republic of the 32.1 28.4 0.2077 0.287 4.7 4.7 64 70 33 34 86.4 85.7
Swaziland, Kingdom of 27.4 31.5 0.4917 0.8589 3.5 3.5 62 48
United Republic of Tanzania 46.9 39.9 0.0916 0.116 38 38.4 46 62 47 47 99.1 92.1
Togolese Republic 12.6 7.1 0.1898 0.3805 11.2 11.2 50 52 37 35 80.9 80.6
Tunisia, Republic of 4.1 6.8 1.6144 2.2895 1.2 1.3 81 93 75 85 9 3.7
Uganda, Republic of 25 18.4 0.0456 0.0651 25.6 26.3 44 60 42 43 93.8 93
Western Sahara, Non-Self-Governing Territory of 3.8 3.8 0.8967 0.5726 7.1 7.1
Zambia, Republic of 66.1 57.1 0.3011 0.203 40.6 41.5 50 58 44 55 72 74
Zimbabwe, Republic of 57.5 45.3 1.5882 0.8106 14.7 14.7 78 81 50 53 4 3.4
* Improvements are marked in “Green and Bold”
Annex I

370 �
About Remote Sensing Images and Aerial Photographs Used in this Publication
The Landsat satellite program, jointly managed by NASA and the U.S. Geological Survey, has collected and archived images of the Earth’s surface for over 35 years. This historical record provides a unique opportunity for identifying and documenting areas of environmental change anywhere on the planet. The majority of the remote sensing images used in this atlas are Landsat images.
The sensors used in the Landsat series are referred to as “mul-tispectral” sensors. They collect refl ected electromagnetic energy from the visible range (400 to 700 nanometers) as well as wave-lengths that the human eye cannot see (700-2 350 nanometers) and thermal energy. Multi-spectral sensors divide the electromag-netic spectrum into a small number of “bands” or ranges of wave-length. For example Landsat-7 collects electromagnetic radiation in eight different bands or ranges of wavelength (see table). Each of these ranges of “light” can tell us something different about the Earth’s surface.
To create viewable images from multi-spectral sensors, three of the available bands are selected and displayed, each through one of the three colours of standard monitor displays—red, green and blue. This can sometimes yield an image that is not intuitive for the non-specialist to interpret (left image). By selecting certain bands and adjusting the distribution of brightness, the overall brightness and the contrast, a more intuitive looking image can be achieved (right image). The images in this atlas have been adjusted so that non-expert readers can interpret these images more easily. The specifi c sensors and the band combinations used in chapter three can be found the references at the end of the chapter.
In general, the images are displayed so that growing vegeta-tion shows as various shades of green. Conifer forests will generally
show as darker shades of green as will mangroves to a lesser degree. Broadleaf forests are typically a slightly brighter shade of green. Agricultural fi elds with actively growing crops can show as a still brighter shade of green; however this is dependant on the crop and its state of growth. The patterns of brightness are often impor-tant clues as to the nature of the vegetation as well. Senescent or inactive vegetation generally appears as shades of gray and brown.
Water bodies will generally be blue to black in appearance, how-ever when sediment is present or the water is shallow it will appear lighter even taking on a pink caste. Areas of bare ground will show as bright usually almost white while urban areas and roads gener-ally appear as a shade of pale purple. Clouds, when they cannot be avoided, will appear as bright white.
In addition to Landsat images, data from other sensors such as ASTER1 and MODIS2, have been used as well as the high resolu-tion commercial sensors QuickBird3 and IKONOS4, declassifi ed spy satellite images (Corona and Argon)5 and aerial photography.
Band Spectral Range (nm) Description
1 450 to 515 nm blue-green light
2 525 to 605 nm green light
3 630 to 690 nm red light
4 775 to 900 nm near-infrared radiation
5 1 550 to 1 750 nm mid-infrared radiation
6 10 400 to 12 500 nm thermal-infrared radiation
7 2 090 to 2 350 nm mid-infrared radiation
8 520 to 900 nm pan-chromatic
Landsat-7 ETM+ Bands
Both of these images are from the same Landsat-7 remote sensing image
taken over the Everglades of Florida, USA in March of 2002. On the left bands
1, 2 and 3 are shown as red, green and blue respectively with the contrast
and brightness determined by the default settings of a standard Geographic
Information System software program. On the right bands 7, 4 and 2 are
displayed as red, green and blue and the contrast and brightness have been
adjusted.
1 ASTER (The Advanced Spaceborne Thermal Emission and Refl ection Radiometer) is a sensor aboard the TERRA satellite is a joint effort between National Aeronautics and Space Administration (NASA) and Japan’s Earth Remote Sensing Data Analysis Center (ERSDAC).
2 MODIS (Moderate Resolution Imaging Spectroradiometer) is a sensor carried on NASA’s TERRA and AQUA satellites.
3 QuickBird is a high resolution commercial multispectral sensor aboard the QuickBird satellite, operated by DigitalGlobe.
4 IKONOS is a high resolution commercial multispectral sensor aboard GeoEye’s IKONOS satellite.
5 Corona and Argon are U.S. photographic surveillance satellites fl own from the 1950s through the early 1970s.

371�
AAddis Ababa 172-173Aerosols 32, 63, 64Afromontane 23, 24, 42, 46, 302Air and Atmosphere 16 Albertine Rift 11, 42Algeria 4, 26, 52, 76-81 Amatole Mistbelt 302-303Angola 2, 5, 22, 56, 82-87, 97, 161, 252Anjouan Island 129Atlantic Ocean 4, 11, 32, 62, 63, 66, 178, 194, 237, 244, 292
BBaban Rafi 264-265Bangassou 120-121Banjul 180-181Barrier Islands 5Beira 254-255Beki 144, 145Benguela Current 5, 11, 22, 257Benin 3, 41, 45, 88-91, 272Biological Diversity 4, 23, 41, 74, 75Biomass Burning 16, 61, 63 - 67Biosphere Reserve 43, 89, 146, 194, 195, 328Bodele Depression 62Boma National Park 46, 307Botswana 31, 56, 92-97Bujumbura 106-107Bumba 138-139Burkina Faso 3, 26, 41, 45, 62, 89, 98-103Burundi 12, 41, 43, 104 -109
CCairo 156-157Cameroon 4, 9, 26, 52, 53, 110- 115, 123, 125, 161, 212, 294 Cap Vert 284-285Cape of Good Hope 27, 31Cape Floristic Region 23, 24, 304-305Cape Verde 116, 117Carbon Monoxide 65, 66Central African Republic 19, 42, 52, 75, 118-121Chad 3, 9, 26, 52, 53, 60, 62, 75, 110, 122- 127, 217, 262Chernozem 3Climate Zones 8-10Coasts 5, 9, 152Coastal and Marine Ecosystems 110, 111Comoros 25, 128-129Conakry 190-191Congo 2, 4, 7, 20, 33, 42, 46, 130-135, 137, 307Congo Basin 2, 3, 39, 41, 42, 82, 104, 108, 119, 130, 274Coral Reefs 5, 149, 153, 221, 242, 243, 288, 297, 317, Côte d’Ivoire 3, 142-147, 189Crater Highlands 31Craton 2
DDadaab Refugee Camp 58Dahlak Archipelago 165Dam Akosombo 182, 183 Al Wahda 246-247 Aswan High154, 155 Cahora Bassa 252-253 Challawa 270-271 Diama 238
Itezhi-tezhi 344 Kafue Gorge 345 Katse 205, 207 Manantali 234-235, 287 Meula 207 Mohale 206, 207 Nangbéto 324-325 Nyumba ya Mungu 319 Youssef Ben Tachfi ne 248 Ziga 99Darfur 60, 309Delta Niger 14, 29, 268, 269, 272-273 Nile 12, 21, 152, 153, 154-155, 159, 268 Okavango 31, 56, 92, 96-97, 159 Tana 12, 202, Zambezi 253Damietta Promontory 154-155Democratic Republic of Congo 3, 4, 7, 8, 20, 42, 46, 136-141, 307, 316, 334, 335Desert Arabian 157 Kalahari (Kgalagadi) 2, 3, 11, 56, 92, 93, 94, 256 Namib 3, 9, 11 Sahara 2, 3, 4, 8, 11, 32, 46, 52, 62, 63, 65, 77, 80, 98, 122, 214, 230, 231, 236, 244, 256, 262, 269, 326, 330 Zone 8, 9Djibouti 148-151Doba 124-125Dust Storm 32, 61, 62, 63
EEarth Observations 1, 28Ensure Environmental Sustainability 74Egypt 6, 7, 20, 26, 27, 152-159, 217Equator 8, 9, 10, 11, 30, 42, 274, 287, 334Equatorial Guinea 20, 42, 160-163Eritrea 2, 164-167Estuaries 5, 7, 62, 83, 174, 301Ethiopia 5, 12, 19, 75, 168-173
FFires 19, 61, 63-65, 110, 220, 254Freetown 294-295Freshwater 6, 20, 48, 56, 77, 83, 99, 104, 105, 155, 157, 179, 190, 198, 199, 227, 243, 245, 297, 301, 327, 328, 332
GGabon 9, 42, 174-177Gambia 20, 178- 181, 282Gas Flaring 29, 175Gêba Estuary 196-197Ghana 3, 19, 146, 182-187Gishwati 278-279Great Limpopo Transfrontier Park 45, 251Great Man-Made River Project 216-217Guinea 4, 11, 19, 20, 23, 24, 42, 59, 142, 188-193, 212, 234, 294 Guinea-Bissau 194-196Guineo-Congolese 176-177Gulf of Aden 148, 296Gulf of Guinea 4, 42, 142Gulf of Tunis 327Guraghe Escarpment 5
HHagigo 166-167Harbel 210-211Hassi R’Mel 78-79
Horn of Africa 5, 9, 23, 25, 296, 298Hotspots 23-25, 257, 300Huambo Province 86-87Humid Tropical Zone 8, 9
IIndian Ocean 5, 23, 25, 198, 242, 250, 252, 288, 296, 300, 316
JJebel Marra 308-309Jonglei Canal 310-311
KKavango 258-259Kenya 4, 5, 7, 20, 27, 41, 44, 48, 49, 58, 198-203, 318, 319
LLagoons 5, 21, 88, 131, 142, 155, 174, 208, 243, 268, 322Lake Alemaya 170-171 Chad 52, 53, 54, 55, 62, 122-123 Chivero 350-351 Eyasi 31, 44 Faguibine 232-233 Ichkeul 327, 328-329 Jipe 318-319 Kivu 33 Makgadikgadi 56 Malawi (Nyasa) 226, 227, 228 Nakuru 199 Tanganyika 7, 104, 105, 316, 317 Toshka 158-159 Victoria 5, 7, 27, 48, 49, 50, 51, 199, 202, 317, 332 Volta 182, 183Land Conversion 17, 18, 19, 21, 105, 214, 215 Cover 14, 16, 17, 45, 118, 171, 179, 187, 209 Degradation 17, 18, 19, 86, 87, 98, 99, 110, 111, 116, 117, 118, 119, 122, 123, 149, 152, 153, 164, 165, 168, 169, 182, 183, 188, 189, 195, 205, 231, 237, 251, 256, 257, 269, 290, 291, 297, 300, 301, 306, 307, 309, 312, 313, 316, 317, 322, 323, 326, 327, 332, 333, 348, 349 Productivity 16, 19, 82, 265 Use 16, 17, 20, 43, 45, 93, 103, 107, 139, 250, 251, 253, 269, 313, 338, 339, 343Leboudou Doue 286-287 Lesotho 204-207Lesotho Highlands 206-207Liberia 3, 5, 9, 13, 19, 59, 208-213Libyan Arab Jamahiriya 26, 52, 63, 80, 214-219Lubombo Province 314-315
MMaasai Mara 41, 44, 198Mabira 336-337Madagascar 6, 9, 11, 18, 23, 25, 26, 128, 220-225, 288Maggia Valley 16Mahe Island 289Makgadikgadi Pans 31Malawi 20, 226-229Mali 3, 6, 26, 29, 230-235, 238, 287
Index

372 �
Mangroves 5, 131, 153, 166, 167, 179, 183, 1889, 190-191, 194, 195, 196, 197, 208, 221, 250, 268, 269, 283, 288, 289Maputaland-Pondoland-Albany 25, 302Marine Environment 5, 20, 22, 83, 165, 242 Marofototra 224-225Mashonaland 352-353Mauritania 19, 26, 62, 236-241, 287Mauritius 26, 27, 242-243Mediterranean 4, 9, 11, 24, 63, 76, 77, 152, 154, 155, 214, 218, 244, 304 Mikea 222-223Millennium Development Goals 73, 74Mine Bou Craa 340-341 Catoca 84-85 Copperbelt 343, 346-347 Jwaneng 94-95 Moyamba 292-293 Sangaredi 192-193 Wassa West 186-187Montane 4, 11, 43, 108, 201, 209 274, 275, 280Morocco 3, 4, 6, 11, 26, 244-249, 338, 339, 341Mount Cameroon 4, 7, 114-115 Elgon 4, Kenya 4, 198, 200-201 Kilimanjaro 4, 5, 316, 320-321, 354 Nimba 209 Nlonako 110 Meru 4 Mulanje 229Mountain Arc 11 Atakora 45 Atlas 4, 26, 244, 326 Drakensberg 4, 11, 205 Lebombo 45 Maloti 205 Mitumba 5 Rwenzori 4, 334-335Mountain Gorilla 46, 146, 274, 332, 333Mozambique 3, 5, 45, 228, 250-255, 312
NNamibia 5, 22, 24, 30, 56, 97, 256-261National Parks Akagera 276-277 Amboseli 198 Banc d’Arguin 237 Black River Gorges 242 Boma 46, 307 Bwindi 46, 332 Campo-Ma’an 112-113 Diawling 238-239 Etosha 257 Garamba 307 Gonarezhou 45 Kibira 41, 43, 108-109 Kruger 45 Limpopo Nakuru 198, 199 Nyungwe 43, 275 Kahuzi-Biega 137 Pendjari Salong 136 Sapo 212-213 Serengeti 41, 44, 316, 317 Sidi Toui 330-331 Simien 169 Tai 143, 146-147 Tsavo 319 Virunga 46, 137, 140-141 Volcano 274 “W”-Arly-Pendjari 45, 102-103, 263Niger 7, 16, 19, 26, 29, 41, 45, 52, 53, 62, 75, 88, 89, 188, 262-267
Nigeria 3, 6, 12, 19, 22, 26, 29, 52, 53, 62, 161, 262, 268-272Ngorongoro 31, 316
OOlduvai Gorge 12Ouagadougou 100-101Ouargla Oasis 80-81Ouesso 134-135Ozone 30, 64, 67, 74
PParrot’s Beak Region 59Phytoplankton 30Plateau 2, 4, 16, 17, 45, 62, 77, 82, 92, 98, 110, 152, 168, 178, 188, 220, 256, 274, 290, 300, 342, 348Pollution 14, 16, 19, 21, 22, 61, 64, 66, 67, 75, 76, 77, 82, 83, 89, 93, 105, 111, 118, 119, 123, 131, 142, 143, 148, 149, 152, 153, 160, 161, 174, 175, 188, 198, 199, 204, 205, 208, 209, 214, 215, 226, 227, 230, 231, 242, 244, 245, 256, 268, 269, 274, 280, 282, 283, 290, 291, 300, 301, 307, 312, 313, 316, 317, 323, 326, 327, 332, 333, 342, 343, 348Protected Areas 23, 40, 41, 43, 44, 45, 75, 102, 103, 110, 119, 131, 140, 141, 143, 147, 149, 152, 174, 185, 205, 251, 323Punta Europa 162-163
RRain Forest 10, 11, 14, 18, 28, 31, 42, 82, 89, 108, 110, 112, 115, 118, 120, 130, 132, 134, 136, 138, 142, 143, 146, 174, 176, 182, 209, 212, 220, 275, 306, 342Red Sea 5, 148, 152, 153, 164, 165, 166, 307Refugees 57-60, 87, 123, 141, 188, 189, 191, 277, 287, 295, 309Rift Valley 5, 31, 105, 136, 168, 198River 7 Akagera 276 Bani 29 Benin 272 Chari 53, 54 Congo 39, 82, 104, 136 Gambia 178, 179, 282 Juba 297, 298-299 Kafue 344-345 Madjerda 327 Makgadikgadi Malibamatso 206 Nile 21, 27, 39, 104, 152, 153, 154, 157-158, 168, 306, 307, 310 Niger 14, 29, 45, 88, 89, 188, 230, 231, 232 Limpopo 45, 348 Okvango 56, 96, 259 Ouemé 90-91 Pangani 318-319 Senegal 188, 230, 231, 234, 235, 236, 237, 238, 282, 283, 286-287 Tana 4, 200, 202 Volta 182, 183 Zambezi 82, 252-253, 342, 343, 348River Basin 47 Amazon 62 Congo 39, 108, 130, 274 Niger 88, 89, 188, 230, 231, 232, 262 Nile 39, 47, 48, 108, 274 Senegal 230 Volta 182Rosso-Nouakchott 240-241Rwanda 12, 41, 46, 140, 274-279
SSahara 3, 8, 9, 11, 12, 28, 32, 37, 277, 306, 327Sahel 3, 11, 16, 19, 20, 29, 98, 122, 123, 233, 265, 266
Sahelian 9, 102, 123, 179, 236, 265, 282, 306, 330São Tomé and Príncipe 280-281 Savannah 10, 11, 19, 23, 31, 44, 45, 64, 65, 92, 98, 102, 110, 118, 119, 131, 133, 136, 137, 142, 174, 179, 188, 194, 195, 208, 250, 259, 262, 265, 276, 309, 312, 313, 317, 322, 325, 332, 342, 343, 346 Senegal 3, 5, 19, 20, 26, 282-287Seychelles 25, 27, 288-289Sierra Leone 3, 9, 19, 20, 59, 146, 189, 191, 290-295Soils 3, 10, 11, 16, 17, 77, 82, 86, 87, 99, 107, 116, 117, 123, 128, 142, 149, 165, 182, 188, 195, 205, 209, 220, 241, 257-259, 275, 307, 313, 323, 326, 327 Somali 5, 19, 31, 58, 296-299Souss-Massa 248-249South Africa 3, 5, 6, 11, 12, 21, 22, 24, 26, 27, 45, 204, 205, 206, 251, 300-305, 312Sub-Saharan 13, 16, 21, 27,74, 75, 83, 123, 131, 161, 199Succulent Karoo 24, 257, 300Sudan 6, 11, 19, 26, 46, 52, 60, 76, 217, 282, 287, 306-311Swaziland 312- 315
TTahoua 266-267Temperate 11, 25, 164, 204, 274, 300, 326Togo 3, 322- 323Tropical Zone 9, 122, 262Tunisia 4, 11, 21, 26, 80, 326 -331
UUganda 4, 7, 9, 20, 27, 46, 48, 50, 140, 199, 332-337 United Republic of Tanzania 3, 4, 7, 20, 27, 31, 41, 44, 48, 199, 228, 316- 320UV Exposure 30
WWalvis Bay 260-261Water Hyacinth 49, 50, 51, 199, 269, 350, 351 Water Resources 6, 7, 20-22, 40, 77, 170, 339Western Sahara 2, 26, 338-341 Wetlands 5, 7, 21, 29, 43, 89, 90, 104, 105, 123, 130, 131, 137, 153, 179, 205, 238, 239, 260, 270, 271, 275, 276, 282, 283, 288, 290, 301, 306, 310, 311, 328, 332, 333Winam Gulf 49
YYala Swamp 202-203Yamba Berté 126-127
ZZambia 3, 342-347, 348, Zimbabwe 3, 45, 227, 251, 342, 348, 350-353

373� 3737373737337373737337377377737337737337777773737377373337377737373777777333737773733373333337737333333333333333333333333333333333333333333333333333333333���������������������������������������������������������������������������
Editorial and Production Team
United Nations Environment Programme
Team CoordinatorsAshbindu SinghCharles Sebukeera
Science Applications International Corporation (SAIC), contractor to the United States Geological Survey (USGS)Bruce Pengra, GeographerKimberly Giese, Graphic DesignerMichelle Anthony, Senior AnalystArshia Chander, Editorial Assistant/Support
ConsultantsTejaswi Giri, Project Manager, NepalEugene Apindi Ochieng, GIS Analyst, KenyaG. Gray Tappan, USGS, USA
WritersH. Gyde LundJane BarrHarvey CrozeYasmin AzizZinta Zommers
EditorsRebecca L. JohnsonMunyaradzi Chenje
Library ResearchCarol Deering
Visiting Scientists at UNEP–Global Resource Information Database, Sioux Falls, USAAdolfo Kindgard, ArgentinaBernard Adusei, GhanaBlessing Siwela, ZimbabweClaudia Perea, ColombiaEmmanuel Tachie-Obeng, GhanaErick Khamala, KenyaHenok Alemu T., EthiopiaJoseph Muhlhausen, FranceMeron Abrham, EthiopiaMin Feng, ChinaMohamadou Keita, MaliRojina Manandhar, NepalSami Eria, UgandaSiwe Ngamabou Rene, CameroonStefanie Bohms, GermanySneha Potdar, IndiaVeronica Grasso, Italy
World Resources Institute (USA)Amy CassaraCrystal DavisDan Tunstall
Along the beach in Zanzibar, United Republic of Tanzania
Flic
kr.
com

374 �
Acknowledgements
UNEP thanks the following for their contributions:
UNEPAdel Farid Abdel-KaderAudrey RinglerBeth IngrahamBob Kagumaho KakuyoChris AmbalaChristian LambrechtsClayton AdamsElisabeth Guilbaud-CoxHassan PartowJames SniffenJanet WaiyakiJeremy BezyeJoana Akofi Johannes AkiwumiJohn Peter OosterhofJohn UgoloJose GamarraMarie KarlbergMarion CheatlePatrick M’mayiPatrick SalifuPascal PeduzziPeter AcquahPeter GilruthPriscilla RosanaSalif DiopTess CieuxWilliam H. Mansfi eld
Global Earth ObservationImraan Saloojee
US Agency for International DevelopmentCarrie Stokes
US Geological SurveyCharles M. TrautweinJames P. VerdinMichael P. CraneRobert Campbell
SAIC, contractor to the USGS, National Center for Earth Resources Observation and Science (EROS), USABrenda EllisChandra GiriEugene FosnightEric WoodGuleid ArtanHua ShiJames RowlandJane S. SmithRonald Smith
Other ContributorsAhmed Abdelrehim, EgyptAlessandro Fusari, MozambiqueAlkhalil Adoum, NigerAly Amasha, EgyptAmoyaw Osei, GhanaAngela Emmanuel Malisa, The United Republic of TanzaniaAmbroise Zanga, Central African RepublicAmidou Traore, MaliAmy Oppoermand, USAAtta Kouacou Jean-Marie, Côte d’IvoireBalgis M.E. Osman Elasha, SudanBenon Bibbu Yassin, MalawiBlaise Mouga, ChadCamille Jepang, CameroonCatherine Ghaly, EgyptChuck Herring, USAClever Mafuta, ZimbabweDora Mbeera Mwesige, South AfricaElke Verbeeten, Burkina FasoElizabeth Gowa Kironde, KenyaEng. Moheeb Abdel-Sattar Ebrahim, EgyptFrank Richard Turyatunga, Grid–Arendal, NorwayGabriel Opare Mintah, GhanaGeoffrey D. Dabelko, USAHari Eswaran, USAHeather E. Eves, USAHuda Mohammed Al Houqani, Abu DhabiIrene G. Lungu, ZambiaJ. Baker Hill, NigerJacques André Ndione, SenegalJacques Souebele, CongoJean Marie Vianney Minani, RwandaJean-Robert Bolambee Bwangoy-Bankanza, DR CongoJohn Laing Roberts, MauritiusJohnson Boanuh, GhanaJoseph Opio-Odongo, KenyaJustin Paul Nicholas Prosper, SeychellesKhaled Mubarak, EgyptLorant Czaran (UN), USALucie Ambinintsoa Noasilalaonomenjanahary, MadagascarMaha El Ebiary, EgyptMahamat Djimadingar, ChadMai El Remeisy, EgyptMamadou A. Dembele, MaliMary Goretti Kitutu Kimono, UgandaMaryam Aziz, EgyptMatthew C. Hansen, USAMayar Sabet, EgyptMunyaradzi Sithole, ZimbabweNadia Mahmud, Thailand Mohammed Edrees, EgyptNaoual Zoubair, Morocco
Nestor Nikobagomba, BerundiNouri Soussi, TunisiaQongqong Hoohlo, LesothoOusmane Laye, EthiopiaPotjo Elliot Tsoene, LesothoRainer Chr Henning, NorwayRobert David Baden Barnes, ZimbabweRichard Ingwe, NigeriaSahon Flan, Côte d’IvoireSamuel Okorom Echoku, UgandaSani Dawaki Usman, NigeriaSives Govender, South AfricaSerge Hervé Ondoua, CameroonSobhi Edali, Libyan Arab JamahiriyaSophonea Thabo Joseph, LesothoSteve Barrett, United KingdomTarik Fouad Hassan Hosny, EgyptTelly Eugene Muramira, UgandaTerry Fahmy, EgyptTesfaye Woldeyes Gammo, EthiopiaYousouf Mahmood Buxsoo, Mauritius
Cover Photos (left to right): Flickr.com; Flickr.com; ©Remkor; NASA; Steve Adams/Flickr.com; ©Paul Myhill; Flickkr.com; Flickr.com; Flickr.com