Unemployment: Theory, Evidence, and Policy Introduction to Political Economy: Macroeconomics...
27
Unemployment: Unemployment: Theory Theory , Evidence, and , Evidence, and Policy Policy Introduction to Political Economy: Introduction to Political Economy: Macroeconomics Macroeconomics Washington University – St. Louis Washington University – St. Louis Mark Vaughan Mark Vaughan Fall 2008 Fall 2008
-
date post
19-Dec-2015 -
Category
Documents
-
view
216 -
download
3
Transcript of Unemployment: Theory, Evidence, and Policy Introduction to Political Economy: Macroeconomics...

Unemployment:Unemployment:TheoryTheory, Evidence, and Policy, Evidence, and Policy
Introduction to Political Economy: Introduction to Political Economy: MacroeconomicsMacroeconomicsWashington University – St. LouisWashington University – St. Louis
Mark VaughanMark VaughanFall 2008Fall 2008
3 - 26Slideshow Updated: 04/18/23
Vaughan – 104 / Fall 2008Unemployment
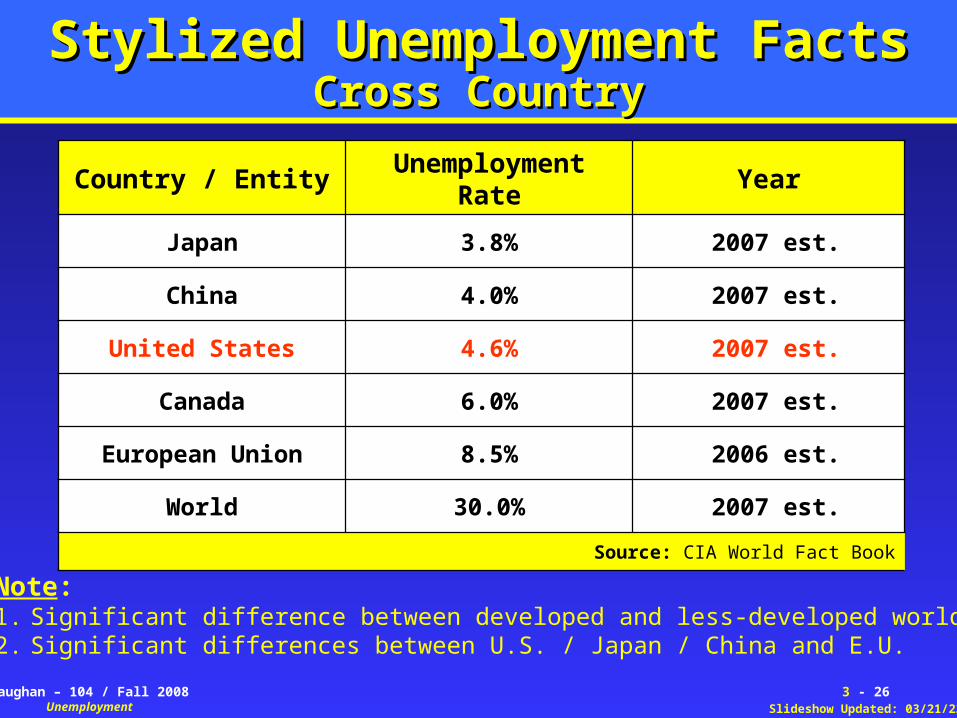
Stylized Unemployment FactsStylized Unemployment FactsCross CountryCross Country
Country / Entity Unemployment Rate Year
Japan 3.8% 2007 est.
China 4.0% 2007 est.
United States 4.6% 2007 est.
Canada 6.0% 2007 est.
European Union 8.5% 2006 est.
World 30.0% 2007 est.
Source: CIA World Fact Book
Note:1. Significant difference between developed and less-developed world.2. Significant differences between U.S. / Japan / China and E.U.

4 - 26Slideshow Updated: 04/18/23
Vaughan – 104 / Fall 2008Unemployment
Stylized Unemployment FactsStylized Unemployment FactsPost-War United StatesPost-War United States
5 - 26Slideshow Updated: 04/18/23
Vaughan – 104 / Fall 2008Unemployment
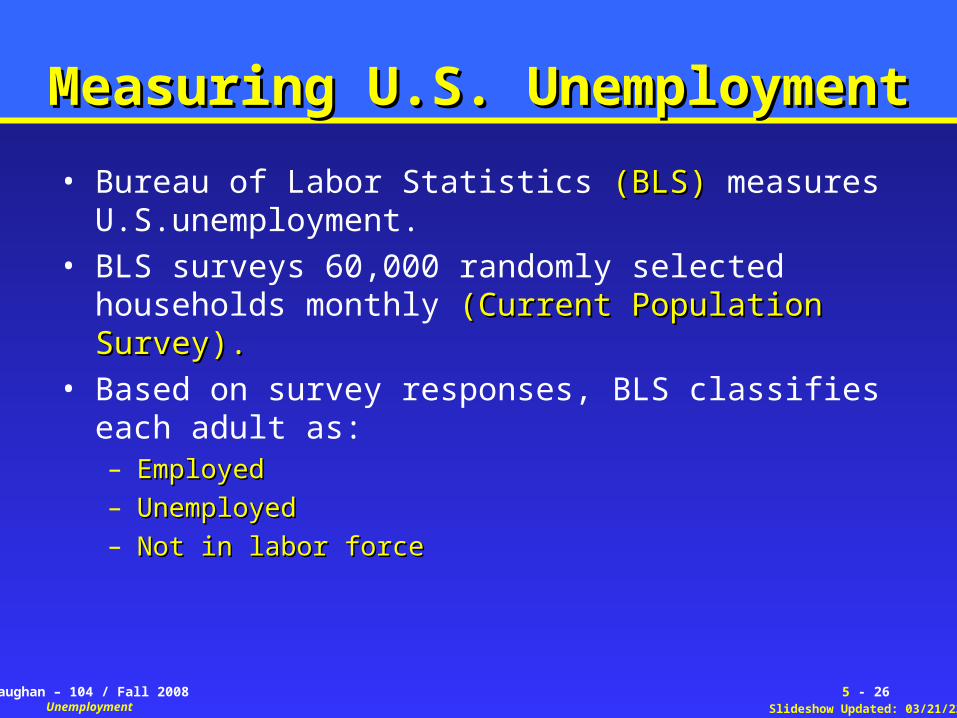
Measuring U.S. UnemploymentMeasuring U.S. Unemployment
• Bureau of Labor Statistics (BLS) (BLS) measures U.S.unemployment.
• BLS surveys 60,000 randomly selected households monthly (Current Population Survey).(Current Population Survey).
• Based on survey responses, BLS classifies each adult as:– EmployedEmployed– UnemployedUnemployed– Not in labor forceNot in labor force
6 - 26Slideshow Updated: 04/18/23
Vaughan – 104 / Fall 2008Unemployment
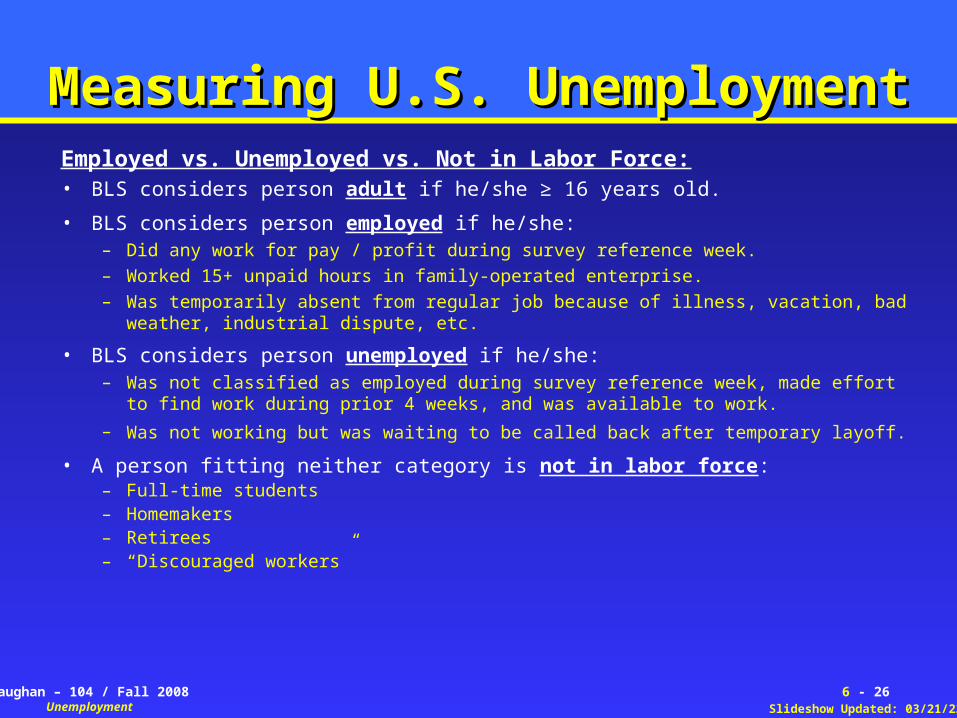
Measuring U.S. UnemploymentMeasuring U.S. UnemploymentEmployed vs. Unemployed vs. Not in Labor Force:• BLS considers person adult if he/she ≥ 16 years old.
• BLS considers person employed if he/she:– Did any work for pay / profit during survey reference week. – Worked 15+ unpaid hours in family-operated enterprise. – Was temporarily absent from regular job because of illness, vacation, bad weather,
industrial dispute, etc.
• BLS considers person unemployed if he/she: – Was not classified as employed during survey reference week, made effort to find work
during prior 4 weeks, and was available to work.
– Was not working but was waiting to be called back after temporary layoff.
• A person fitting neither category is not in labor force:– Full-time students– Homemakers– Retirees– “Discouraged workers”

7 - 26Slideshow Updated: 04/18/23
Vaughan – 104 / Fall 2008Unemployment
Biases in Unemployment FiguresBiases in Unemployment Figures
• “Discouraged workers” not in labor force (hence not unemployed)(hence not unemployed)
• “Underemployed” counted as employed(even though not in job fully utilizing skills)(even though not in job fully utilizing skills)
• “Full-time wannabes” counted as employed (even though part-timer wanted full-time work)(even though part-timer wanted full-time work)
Note: Bias in unemployment rate (as indicator of labor-market conditions) is more pronounced during recessions.

8 - 26Slideshow Updated: 04/18/23
Vaughan – 104 / Fall 2008Unemployment
Measuring U.S. UnemploymentMeasuring U.S. Unemployment
• Labor-force participation rateLabor-force participation rate (LFPR)(LFPR) is percentage of adult population in labor force.
• Unemployment rateUnemployment rate is percentage of labor force classified as unemployed.
U n em p lo y m en t ra te =N u m b er u n em p lo y ed
L ab o r fo rce 1 0 0
Labor forceAdult population
100XLFPR =
9 - 26Slideshow Updated: 04/18/23
Vaughan – 104 / Fall 2008Unemployment
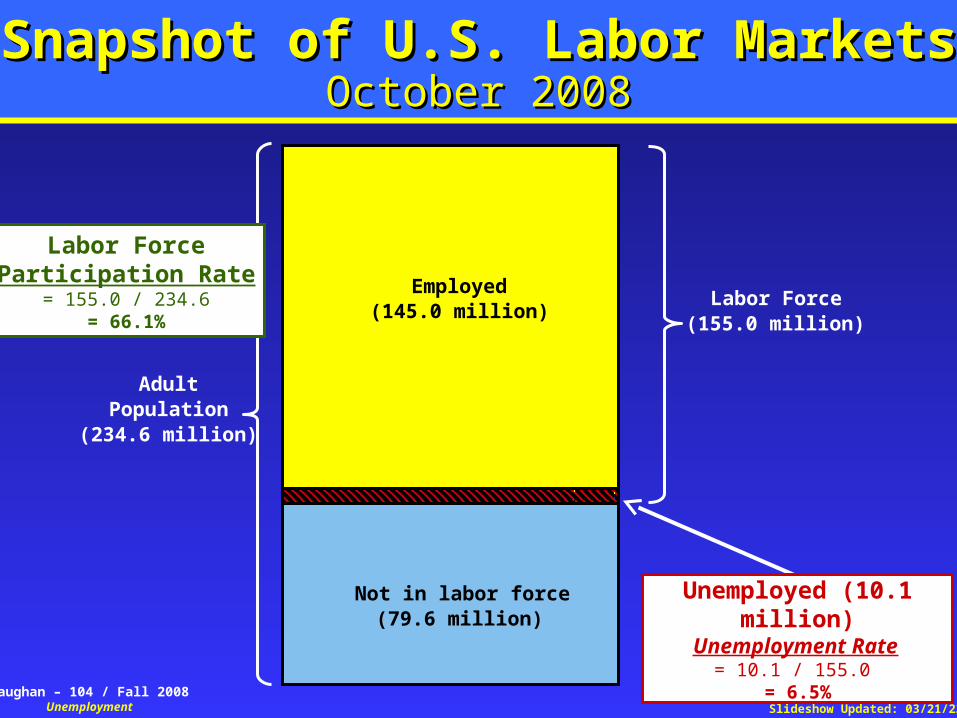
Snapshot of U.S. Labor MarketsSnapshot of U.S. Labor MarketsOctober 2008October 2008
AdultPopulation
(234.6 million)
Labor Force(155.0 million)
Employed(145.0 million)
Not in labor force(79.6 million)
Unemployed (10.1 million)Unemployment Rate
= 10.1 / 155.0 = 6.5%
Labor ForceParticipation Rate
= 155.0 / 234.6= 66.1%
10 - 26Slideshow Updated: 04/18/23
Vaughan – 104 / Fall 2008Unemployment
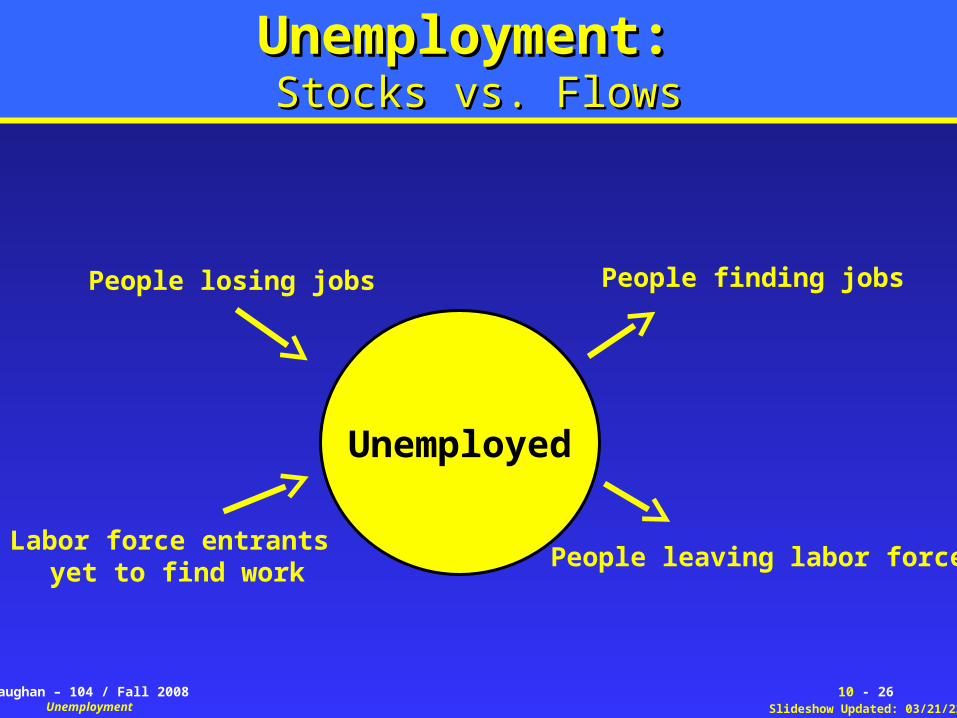
Unemployment:Unemployment: Stocks vs. FlowsStocks vs. Flows
Unemployed
People losing jobs
Labor force entrants yet to find work
People finding jobs
People leaving labor force

11 - 26Slideshow Updated: 04/18/23
Vaughan – 104 / Fall 2008Unemployment
Snapshot of U.S. Labor MarketsSnapshot of U.S. Labor MarketsOctober 2008
(Seasonally Adjusted)
Demographic GroupUnemployment
RateLabor Force
Participation Rate
Adults (Age ≥ 20 Years)
White, Male 5.7% 76.3%
White, Female 4.9% 60.6%
Black, Male 11.6% 70.9%
Black, Female 8.8% 64.1%
Teenagers (16 ≤ Ages ≤ 19 Years)
White, Both Sexes 18.5% 42.9%
Black, Both Sexes 32.4% 30.1%Source: Bureau of Labor Statistics
Note:1. Significant differences between adults and teens.2. Significant differences between men and women.3. Significant differences between white and black.

12 - 26Slideshow Updated: 04/18/23
Vaughan – 104 / Fall 2008Unemployment
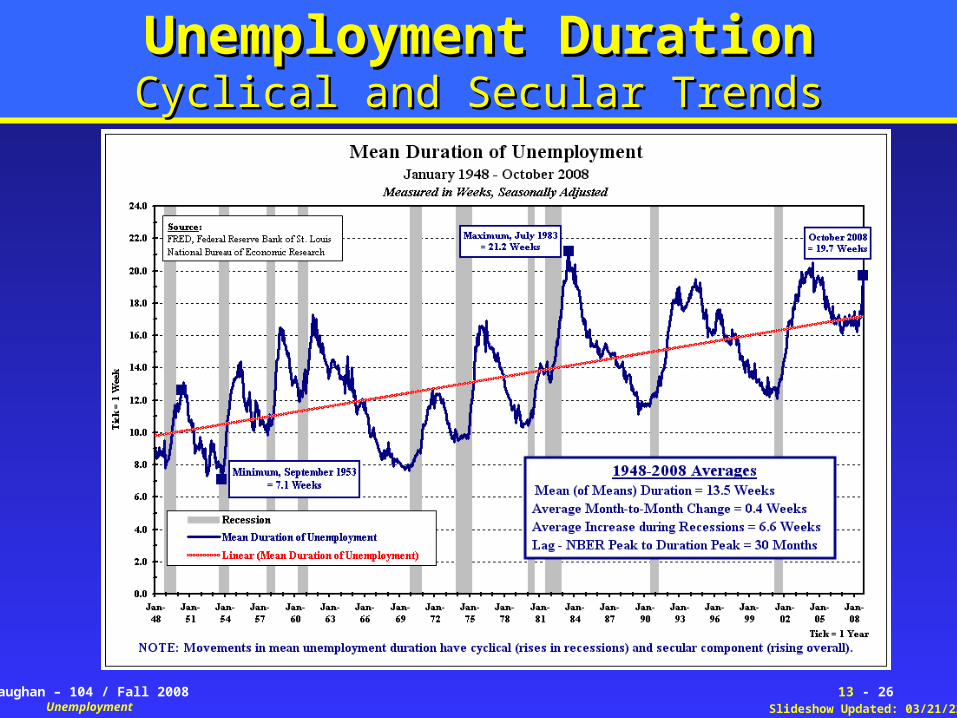
More U.S. Stylized FactsMore U.S. Stylized FactsDuration of UnemploymentDuration of Unemployment
• For most workers, unemployment spells are short.
• But at any given time, non-trivial number of unemployed have been out of work a long time. – October 2008October 2008: 22.3% of U.S. unemployed out of work 27+
weeks
• During recessions, unemployment duration rises.– Job losses increase– Hiring slows
• Over time, U.S. unemployment duration has risen (controlling for business cycle)
– Evidence points to declining job security (permanent job losses)
13 - 26Slideshow Updated: 04/18/23
Vaughan – 104 / Fall 2008Unemployment
Unemployment DurationUnemployment DurationCyclical and Secular TrendsCyclical and Secular Trends

14 - 26Slideshow Updated: 04/18/23
Vaughan – 104 / Fall 2008Unemployment
Why is unemployment is always with us?Why is unemployment is always with us?
In “frictionless” labor market, wages adjust to equilibrate supply and demand, ensuring all workers are fully employed.
But, some “frictions” may be desirable. Put another way, socially optimal Put another way, socially optimal unemployment rate is not zero! unemployment rate is not zero!
Quantity of Labor
WageLabor Supply
Labor Demand
WE
QE
15 - 26Slideshow Updated: 04/18/23
Vaughan – 104 / Fall 2008Unemployment
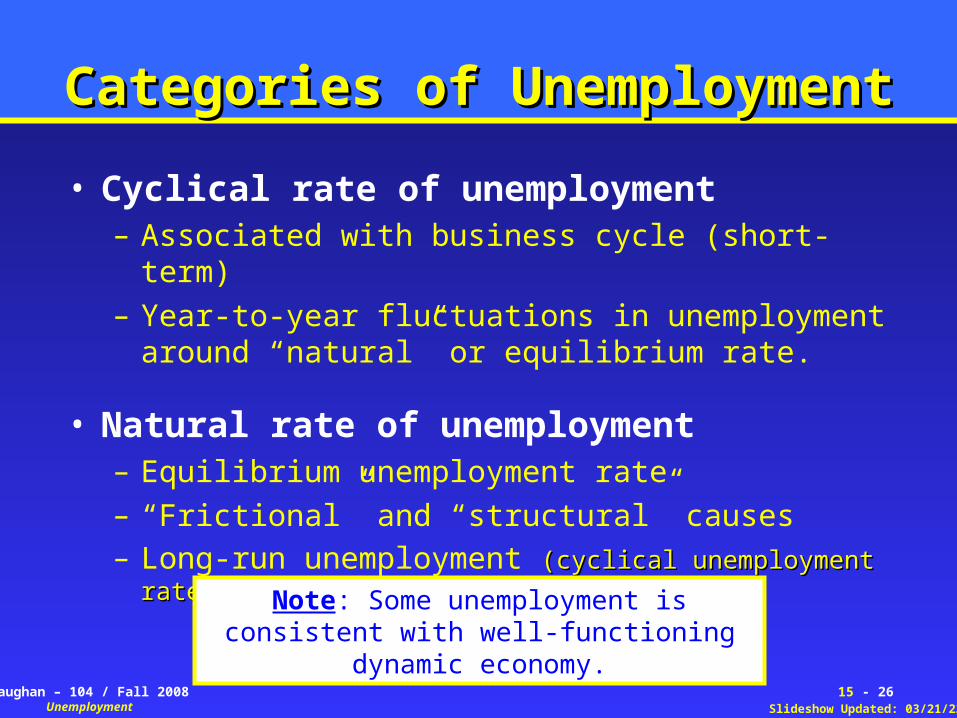
• Cyclical rate of unemployment– Associated with business cycle (short-term)– Year-to-year fluctuations in unemployment around
“natural” or equilibrium rate.
• Natural rate of unemployment– Equilibrium unemployment rate– “Frictional” and “structural” causes– Long-run unemployment (cyclical unemployment rate = 0)(cyclical unemployment rate = 0)
Categories of UnemploymentCategories of Unemployment
Note: Some unemployment is consistent with well-functioning dynamic economy.

16 - 26Slideshow Updated: 04/18/23
Vaughan – 104 / Fall 2008Unemployment
Natural Rate of Unemployment Natural Rate of Unemployment A Closer LookA Closer Look
• Frictional unemployment – Results from job search
– Imperfect information in labor market (firms as well as workers) implies it takes time to match positions and job seekers.
• Structural unemployment – Results from job-skill mismatch / other, more substantive labor-
market frictions than imperfect information
– Job-Skill Mismatch: Structural economic change means skills in demand might differ from those available workers could supply.
– More Substantive Frictions: Policy-induced impediments to labor-market clearing (ex: minimum wage, employer mandates, and unions).
“Sectoral shifts” explains some frictional / structural unemployment(due to changes in composition of demand among industries / regions)
17 - 26Slideshow Updated: 04/18/23
Vaughan – 104 / Fall 2008Unemployment
Natural Rate of Unemployment Natural Rate of Unemployment A Closer LookA Closer Look
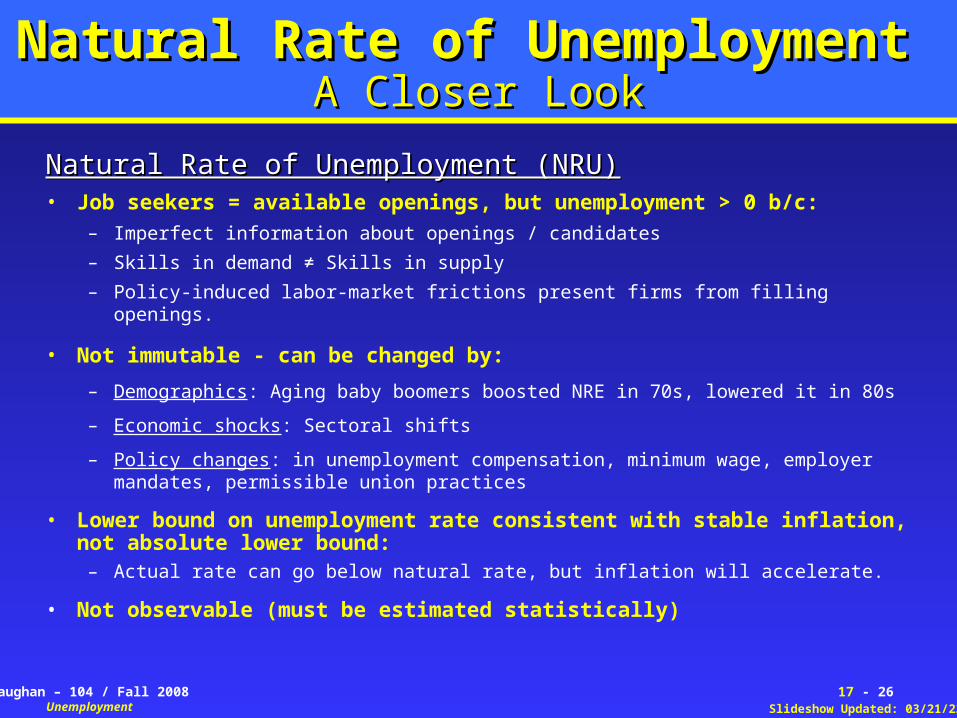
Natural Rate of Unemployment (NRU)Natural Rate of Unemployment (NRU)• Job seekers = available openings, but unemployment > 0 b/c:
– Imperfect information about openings / candidates
– Skills in demand ≠ Skills in supply
– Policy-induced labor-market frictions present firms from filling openings.
• Not immutable - can be changed by:
– Demographics: Aging baby boomers boosted NRE in 70s, lowered it in 80s
– Economic shocks: Sectoral shifts
– Policy changes: in unemployment compensation, minimum wage, employer mandates, permissible union practices
• Lower bound on unemployment rate consistent with stable inflation,not absolute lower bound:
– Actual rate can go below natural rate, but inflation will accelerate.
• Not observable (must be estimated statistically)

18 - 26Slideshow Updated: 04/18/23
Vaughan – 104 / Fall 2008Unemployment
Natural Rate is not immutable!Natural Rate is not immutable!

19 - 26Slideshow Updated: 04/18/23
Vaughan – 104 / Fall 2008Unemployment
Policy-Induced NRU “Inflators” Policy-Induced NRU “Inflators” Minimum-Wage LawsMinimum-Wage Laws
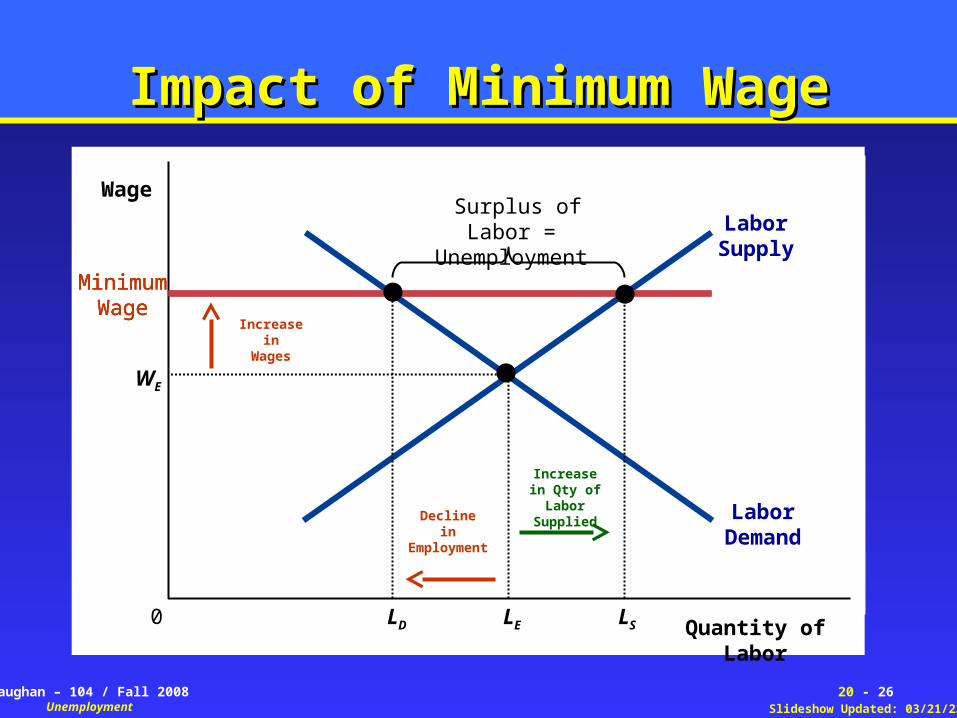
• Business demand for labor determined by worker productivity.
• Unskilled workers receive low wages because of low productivity.
• Mandated wage above market-clearing level results in lower quantity of labor demanded and unemployment.
• Analysis carries over to other employer mandates:– Family / medical leave (U.S)– Legally mandated vacation (E.U. minimum is 20 days per year)
20 - 26Slideshow Updated: 04/18/23
Vaughan – 104 / Fall 2008Unemployment
Quantity of Labor0
Surplus of Labor =
Unemployment LaborSupply
LaborDemand
Wage
MinimumWage
WE
LE
Impact of Minimum WageImpact of Minimum Wage
Declinein
Employment
Increase inWages
Increase in Qty of Labor
Supplied
MinimumWage
LD LS
MinimumWage
21 - 26Slideshow Updated: 04/18/23
Vaughan – 104 / Fall 2008Unemployment
Policy-Induced NRU “Inflators”Policy-Induced NRU “Inflators” UnionsUnions
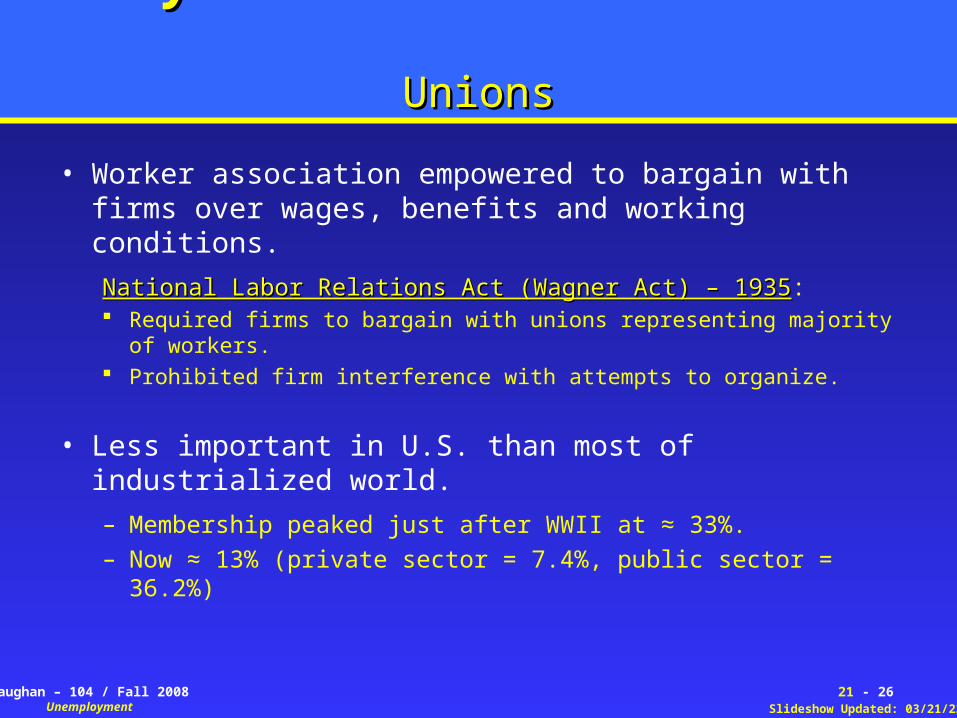
• Worker association empowered to bargain with firms over wages, benefits and working conditions.
National Labor Relations Act (Wagner Act) – 1935National Labor Relations Act (Wagner Act) – 1935: Required firms to bargain with unions representing majority of workers. Prohibited firm interference with attempts to organize.
• Less important in U.S. than most of industrialized world.
– Membership peaked just after WWII at ≈ 33%. – Now ≈ 13% (private sector = 7.4%, public sector = 36.2%)

22 - 26Slideshow Updated: 04/18/23
Vaughan – 104 / Fall 2008Unemployment
Union ImportanceUnion ImportanceCross-Country ComparisonsCross-Country Comparisons
COUNTRYUnion Membership
(% Of Workers)
% of Workers Covered by Collective
Bargaining Agreement
France* 10% 93%
Italy* 35% 83%
Germany* 25% 68%
Canada 28% 32%
Japan 22% 18%
United States 13% 14%
*E.U. Member Source: OECD, 2004 Data
Note:1. In U.S. and Japan, collectively bargained agreements cover small % of workers.
2. In E.U. countries, agreements cover large % of non-union workers.
23 - 26Slideshow Updated: 04/18/23
Vaughan – 104 / Fall 2008Unemployment
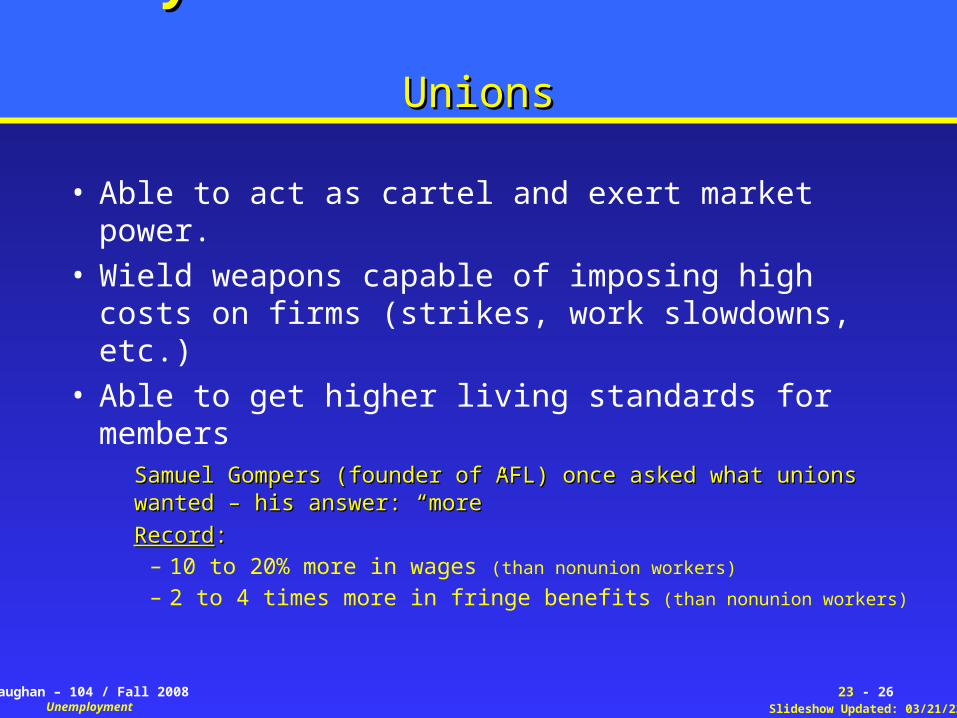
Policy-Induced NRU “Inflators”Policy-Induced NRU “Inflators” UnionsUnions
• Able to act as cartel and exert market power.• Wield weapons capable of imposing high costs
on firms (strikes, work slowdowns, etc.)• Able to get higher living standards for members
Samuel Gompers (founder of AFL) once asked what unions Samuel Gompers (founder of AFL) once asked what unions wanted – his answer: “more”wanted – his answer: “more”
RecordRecord::– 10 to 20% more in wages (than nonunion workers)
– 2 to 4 times more in fringe benefits (than nonunion workers)
24 - 26Slideshow Updated: 04/18/23
Vaughan – 104 / Fall 2008Unemployment
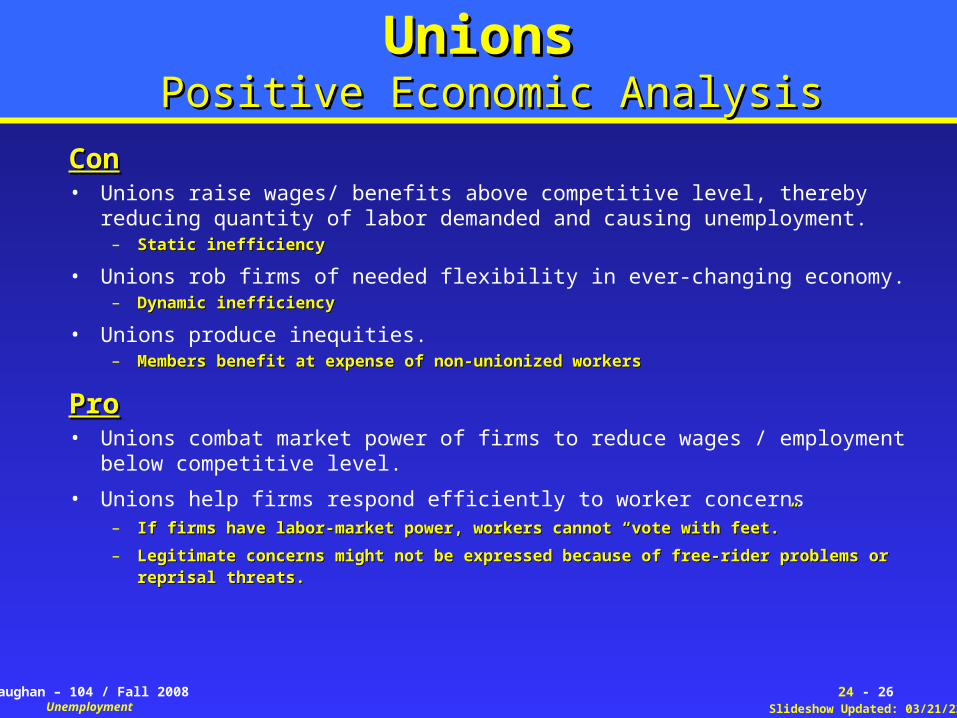
UnionsUnions Positive Economic Analysis Positive Economic Analysis
ConCon• Unions raise wages/ benefits above competitive level, thereby reducing quantity
of labor demanded and causing unemployment.– SStatic inefficiencytatic inefficiency
• Unions rob firms of needed flexibility in ever-changing economy.– Dynamic Dynamic inefficiencyinefficiency
• Unions produce inequities.– Members Members benefitbenefit at expense of non-unionized workers at expense of non-unionized workers
ProPro• Unions combat market power of firms to reduce wages / employment below
competitive level.
• Unions help firms respond efficiently to worker concerns – If firms have labor-market power, workers cannot “vote with feet.” If firms have labor-market power, workers cannot “vote with feet.”
– Legitimate concerns might not be expressed because of free-rider problems or reprisal Legitimate concerns might not be expressed because of free-rider problems or reprisal threats. threats.
25 - 26Slideshow Updated: 04/18/23
Vaughan – 104 / Fall 2008Unemployment
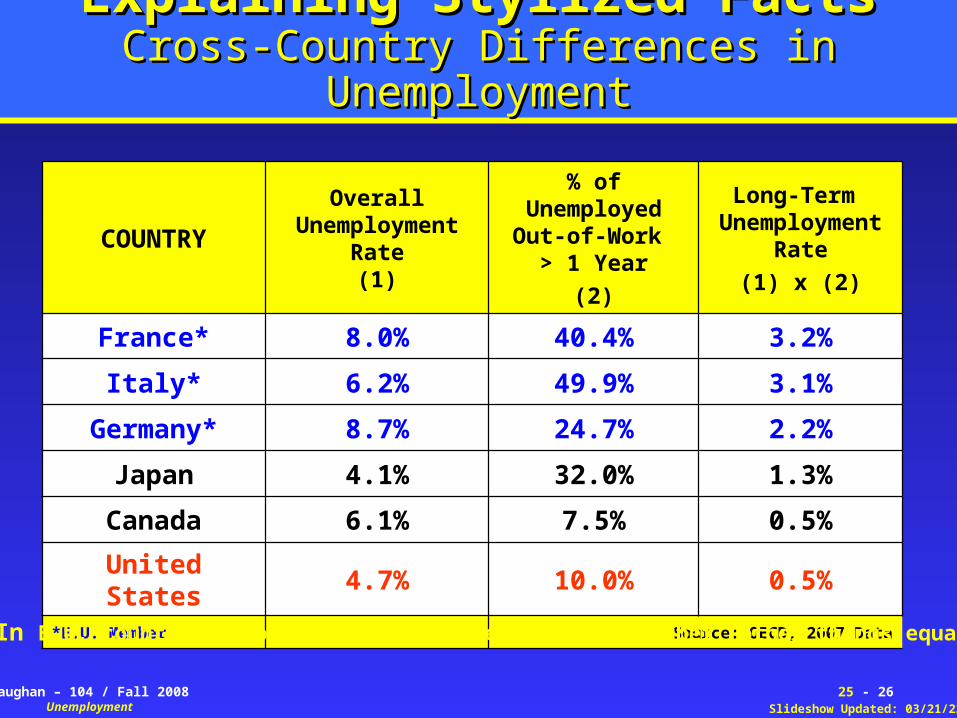
Explaining Stylized FactsExplaining Stylized FactsCross-Country Differences in UnemploymentCross-Country Differences in Unemployment
COUNTRY
Overall Unemployment
Rate(1)
% of UnemployedOut-of-Work
> 1 Year
(2)
Long-Term Unemployment
Rate
(1) x (2)
France* 8.0% 40.4% 3.2%
Italy* 6.2% 49.9% 3.1%
Germany* 8.7% 24.7% 2.2%
Japan 4.1% 32.0% 1.3%
Canada 6.1% 7.5% 0.5%
United States 4.7% 10.0% 0.5%*E.U. Member Source: OECD, 2007 Data
Note: In E.U. countries, long-term unemployment rate is higher (other things equal).

26 - 26Slideshow Updated: 04/18/23
Vaughan – 104 / Fall 2008Unemployment
Stylized Unemployment FactsStylized Unemployment FactsExplanationsExplanations
Higher Unemployment Rates in E.U.• Greater unionization• Greater job-protection policies • More mandated vacations / public holidays• Minimum wages are higher
ResultResult: Higher natural rate of unemployment!: Higher natural rate of unemployment!
First Rise, then Fall in U.S. Natural Rate• Demographics – aging of the baby boom generation
27 - 26Slideshow Updated: 04/18/23
Vaughan – 104 / Fall 2008Unemployment
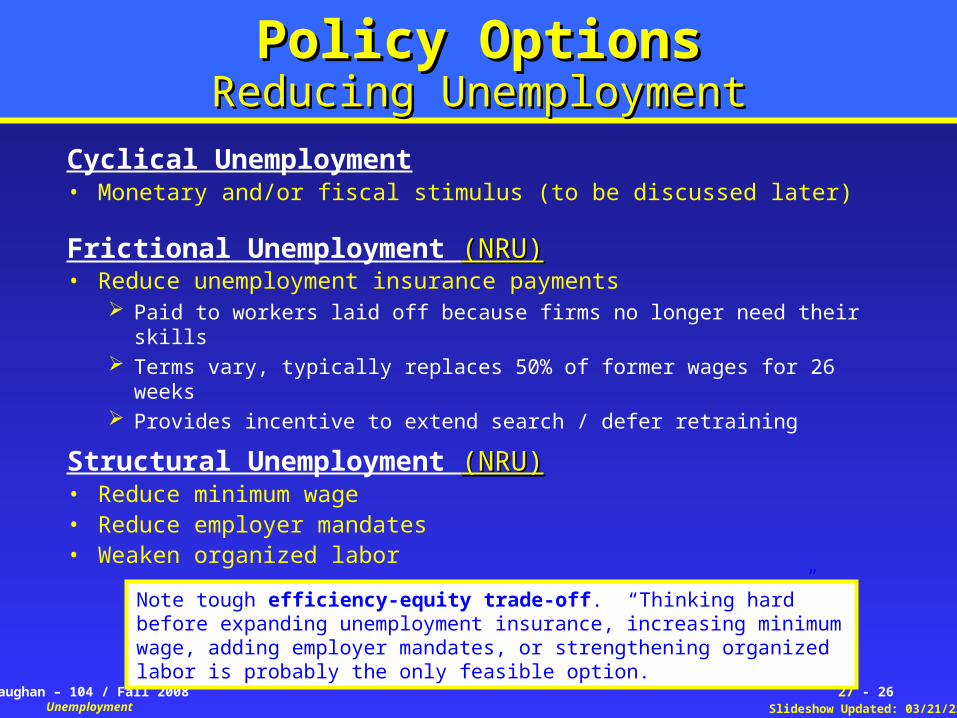
Policy OptionsPolicy OptionsReducing UnemploymentReducing Unemployment
Cyclical Unemployment• Monetary and/or fiscal stimulus (to be discussed later)
Frictional Unemployment (NRU)(NRU)• Reduce unemployment insurance payments
Paid to workers laid off because firms no longer need their skills Terms vary, typically replaces 50% of former wages for 26 weeks Provides incentive to extend search / defer retraining
Structural Unemployment (NRU)(NRU)• Reduce minimum wage • Reduce employer mandates• Weaken organized labor
Note tough efficiency-equity trade-off. “Thinking hard” before expanding unemployment insurance, increasing minimum wage, adding employer mandates, or strengthening organized labor is probably the only feasible option.
Unemployment:Unemployment:TheoryTheory, Evidence, and Policy?, Evidence, and Policy?
Introduction to Political Economy: Introduction to Political Economy: MacroeconomicsMacroeconomicsWashington University – St. LouisWashington University – St. Louis
Mark VaughanMark VaughanFall 2008Fall 2008
Questions over: