Unemployment, Market Work and Household Productionftp.iza.org/dp3955.pdf · Unemployment, Market...
22
IZA DP No. 3955 Unemployment, Market Work and Household Production Michael C. Burda Daniel S. Hamermesh DISCUSSION PAPER SERIES Forschungsinstitut zur Zukunft der Arbeit Institute for the Study of Labor January 2009
Transcript of Unemployment, Market Work and Household Productionftp.iza.org/dp3955.pdf · Unemployment, Market...

IZA DP No. 3955
Unemployment, Market Work and HouseholdProduction
Michael C. BurdaDaniel S. Hamermesh
DI
SC
US
SI
ON
PA
PE
R S
ER
IE
S
Forschungsinstitutzur Zukunft der ArbeitInstitute for the Studyof Labor
January 2009

Unemployment, Market Work and
Household Production
Michael C. Burda Humboldt University of Berlin,
CEPR and IZA
Daniel S. Hamermesh University of Texas at Austin,
NBER and IZA
Discussion Paper No. 3955 January 2009
IZA
P.O. Box 7240 53072 Bonn
Germany
Phone: +49-228-3894-0 Fax: +49-228-3894-180
E-mail: [email protected]
Any opinions expressed here are those of the author(s) and not those of IZA. Research published in this series may include views on policy, but the institute itself takes no institutional policy positions. The Institute for the Study of Labor (IZA) in Bonn is a local and virtual international research center and a place of communication between science, politics and business. IZA is an independent nonprofit organization supported by Deutsche Post World Net. The center is associated with the University of Bonn and offers a stimulating research environment through its international network, workshops and conferences, data service, project support, research visits and doctoral program. IZA engages in (i) original and internationally competitive research in all fields of labor economics, (ii) development of policy concepts, and (iii) dissemination of research results and concepts to the interested public. IZA Discussion Papers often represent preliminary work and are circulated to encourage discussion. Citation of such a paper should account for its provisional character. A revised version may be available directly from the author.
IZA Discussion Paper No. 3955 January 2009
ABSTRACT
Unemployment, Market Work and Household Production*
Using time-diary data from four countries we show that the unemployed spend most of the time not working for pay in additional leisure and personal maintenance, not in increased household production. There is no relation between unemployment duration and the split of time between household production and leisure. U.S. data for 2003-2006 show that almost none of the lower amount of market work in areas of long-term high unemployment is offset by additional household production. In contrast, in those areas where unemployment has risen cyclically reduced market work is made up almost entirely by additional time spent in household production. JEL Classification: E24, J22, D13 Keywords: unemployment, time use, household production, paid work Corresponding author: Daniel S. Hamermesh Department of Economics University of Texas Austin, TX 78712 USA E-mail: [email protected]
* We thank Steve Trejo and Philippe Weil for excellent comments, and Holly Monti and Juliane Scheffel for helpful research assistance.

I. Introduction—the Problem
Over the past two decades research in macroeconomics has occasionally gone beyond
the dichotomy between market work and all other time (usually called leisure) to consider
how the trichotomy—market work, household production and all remaining time—might
inform the modeling of macroeconomic fluctuations. Among the leading studies in
modeling this problem have been Greenwood and Hercowitz (1991) and Greenwood et al
(1995); and others (Baxter and Jermann, 1999) have linked it to permanent-income
explanations of cyclical fluctuations in consumption. In terms of unemployment policy
the very simple question is whether household production is readily substitutable for
market production. If this is the case, a cyclical reduction in the latter generates little or
no loss in total output, measured broadly to include non-market activities, and would
imply small welfare costs of cyclical reductions in market output.1 This could be true
even if the aggregate intertemporal elasticity of labor supply were not very large.
Given the data that were available until recently, the theoretical literature had to rely
on very sparse information to draw its conclusions. The bases for the literature and our
views on this question have been attempts to estimate substitution elasticities between
market and household production. The underlying data have either been from the Panel
Study of Income Dynamics (Benhabib et al, 1991) or from time-diary surveys (Rupert et
al, 2000). The former data set only contained information on time spent on child-care
and some house-keeping chores. The time diaries in the latter data sets were very few in
number. Moreover, no study has examined how unemployment, both long-term
differences and cyclical fluctuations, affects the split among market work, household 1While there are claims (Freeman and Schettkat, 2005) using population averages that most differences in the average amount of market work between countries generate offsetting differences in non-market work, more detailed evidence (Burda et al, 2008) refutes this.
production and other uses of time in an entire labor market; and even the simpler and not
directly relevant question, how the employed and unemployed differ in their use of time,
has received little attention.2
Our purpose here is take advantage of a new set of data to provide information on this
crucial issue that could not heretofore have been considered in this way. While we do
offer a brief interpretation of the simple evidence that we provide, our main goal is to
present these new facts as a challenge to refine and restrict the scope of models
admissible for explaining employment and output over the business cycle.
II. The Facts on Time Use and Unemployment
A. Unemployment Levels and the Mix of Work
Time-diary studies, which have become increasingly widespread, ask the respondent
to keep a comprehensive diary of activities showing what s/he was doing at each moment
of the previous day. In the diaries used here the individual noted the activity, either
begun at a specific time or occurring during a short time interval, which was then
classified into a set of categories defined by the survey agency. Throughout this Section
we use 2003-2006 data from the United States, which offers the only frequently collected
set of time diaries in its American Time Use Survey (ATUS) (see Hamermesh et al,
2005). Because this data set is very large and contains detailed geographic information, it
allows us to go beyond an examination of the differences in time use between employed
and unemployed individuals to study how differences in long-term unemployment across
labor markets, and cyclical shocks to labor markets, affect time use. In the initial
examination, of differences in time use of the employed and unemployed, we also use
2See, however, Ahn et al (2005), using time-diary data for Spain, and Gronau (2006), using recall data for Russia, for evidence related to this last question.
2

data from: Australia, 1992 (Australian Bureau of Statistics, 1993); Italy, 2002 (ISTAT,
2005); and Germany, 2001/02 (Bundesministerium für Familie, Senioren, Frauen und
Jugend, 2005). The Australian and German studies obtained data from individuals on two
or more days, so that potential problems induced by observing people on atypical days
are reduced.
To begin examining these data we define the concepts market work and household
production. Because we use data sets from four different countries in the first part of the
analysis, the definition cannot be uniform—each country classifies activities somewhat
differently. Indeed, that is the best justification for using several countries’ data: The
idiosyncrasies of each country’s choices about how to classify time use and the need for
aggregation of what are in each case over 200 individual types of activities require where
at all possible that we use many data sets if we are to claim that we have demonstrated a
general fact.3 In general we follow standard practice and define market work as time
spent for pay (or in unpaid household production for the market). We count as household
production those activities that satisfy the third-party rule (Reid, 1934) that substituting
market goods and services for one’s own time is possible. Such activities have the
common characteristics that we could pay somebody to perform them for us and that we
are not paid for performing them for ourselves. The Appendix lists the choices we have
made in categorizing activities in each data set.
As a first cut at the question of how unemployment alters the mix of market work and
household production, Table 1 presents the average time spent on these two aggregates of
3An alternative when using only one country’s data, as in Aguiar and Hurst (2007), is to experiment with a wide variety of definitions of the important aggregates.
3

activities for each of the four countries.4 The means and their standard errors are listed
for all respondents ages 15 through 59, and separately for men and women. We restrict
the analysis to this age range to mitigate effects that may be induced by retirement
incentives. The results indicate that each hour of market time not worked by an
unemployed individual corresponds to only 16 (60 x 0.27) minutes of additional
household production. Even the largest extra household production observed among the
unemployed, performed by German women, represents only 52 percent of the difference
in time spent in market work between them and those German women who report
themselves employed.
One might be concerned that differences in time use between the employed and the
unemployed arise from differences in underlying demographic characteristics. To
examine this possibility we estimate regressions “explaining” time spent in market work
and in household production. For each country and, again, separately by gender, we add
controls for age, educational attainment and the numbers of children present, plus other
variables as they are available in the individual data sets. Evidently, the conclusions from
Table 1 are robust to conditioning on other observables: The parameter estimate on the
indicator for unemployment status in the equation describing household production
ranges from 12 to 51 percent of its size in the equation describing market work. Even
adjusting for personal characteristics it is reasonable to conclude that most of the lesser
market work among the unemployed in the data sets that we use is not compensated by
increased household production.
4In all tables presented in this section the data are weighted by the sampling weights provided in the data set.
4

Despite these results it would be premature to conclude that most of the time released
from market work due to unemployment is accounted for by leisure—it may be that the
unemployed are unobservably different from the employed. Nor do our results address
the role of cyclical unemployment on the amount of total work. One cannot use cross-
sectional differences between the unemployed and the employed to draw conclusions
about the impact of cyclical changes on an entire labor market. Instead, to answer the
macroeconomic question one needs to examine how the degree of slack affects all
individuals in that market—the unemployed, the employed and non-labor-force
participants. Only with the creation and continuation of the ATUS has this become
possible.
We use the Current Population Survey (CPS-MORG) for each year 2003-2006 to
calculate unemployment rates for use in inferring the impacts of unemployment on time
use. In the first column of Table 3 we present the current unemployment rate averaged
across all ATUS respondents aged 15-59 and resident in the 107 metropolitan areas in
which there were more than 500 respondents in the CPS-MORG in a particular year. As
the data show, there is substantial cross-sectional geographic variation in unemployment
rates in these data. Column (2) of the Table presents unemployment rates in these same
areas averaged over the current and the preceding five years, which might be interpreted
as measuring long-run unemployment across labor markets. Not surprisingly, the cross-
section variation in these long-run rates is below that in the annual rates of
unemployment, although there is still substantial geographic variation. The final column
of the Table presents the unemployment shock—the difference between the current
year’s unemployment rate and the unemployment rate averaged over the previous five
5

years. We interpret this as the cyclical shock to the labor market in the area; and here too
we observe substantial geographic variation.
In Table 4 we examine how time use is related to unemployment in the labor market
where the individual resides. As before, we divide total time into market work,
household production, and the excluded category, all other uses of time, for all
individuals ages 15-59 in the ATUS 2003-06. We linked the records of ATUS
respondents to the long-term and current unemployment rates in the metropolitan areas in
which they reside. Each regression also includes a wide variety of demographic controls
describing the individual. The upper panel of the table shows the results for the long-term
(six-year) average unemployment rate. As expected, higher average unemployment in an
area is associated with less market work: Each one percentage-point increase in
unemployment is associated with the average person working 3.3 fewer minutes per day
in the market. Full-time workers work about 300 minutes in the market on the average
day, so that this decline is quite consistent with the expected difference that would occur
mechanically where unemployment is higher.
As the results in the top panel of Table 4 show, there is almost no response of
household production to higher long-term unemployment in a labor market. Indeed, the
parameter estimate is unexpectedly negative, implying that where unemployment has
been higher for a long time people engage in slightly less household production. Given
the size of the effect and its statistical insignificance, the appropriate conclusion here is
that the long-term differences in market work generated by long-term differences in
unemployment are not accompanied by any offsetting differences in household
production. These results corroborate and strengthen the results in Tables 1 and 2
comparing employed and unemployed individuals.
6
The middle panel presents estimates for the same regressions, but with the current
unemployment rate substituted for the long-term unemployment rate.5 Here we see that,
as with long-term unemployment, market-wide increases are associated with reductions
in market time for the typical individual, with the effect almost identical to that of
differences in long-term unemployment across areas. For household production,
however, the results are totally changed: Each one-percentage-point shock to
unemployment increases the average adult’s household production by 2.5 minutes, an
increase that is not significantly different from the negative of the effect on market work.
The point estimates suggest that a one-hour decline in market-based production
associated with cyclical increases in unemployment is matched by an increase in
household production of 46 minutes; and we cannot reject the hypothesis that the offset is
one-for-one.
In the bottom panel of the Table we include both the lagged five-year average rate of
unemployment in each area and its current value. Our estimates corroborate the
inferences drawn above: Higher long-term unemployment is associated with both less
market work in an area and less household production. Areas of long-term high
unemployment are those where the average individual has chosen to spend more time on
personal activities and in leisure. When unemployment is temporarily higher, however,
the resulting reduction in market work at the individual level is associated with increased
household production, with no increase in personal activities or leisure. Evidently,
permanent and temporary differences in local employment conditions evoke strikingly
different responses in household behavior.
5We could just as easily have included the shock to unemployment, since it is calculated as the difference between current and long-term unemployment. The conclusions from equations using any two of the three measures would be the same as those based on the results in Table 4.
7

B. Time Use and the Duration of Unemployment
We can shed additional light on the relationship between unemployment and patterns
of household production by examining patterns of time use among the unemployed
distinguished by the duration of their spells of unemployment. We stress that we are
unable to hold constant those unobservable characteristics likely to affect the duration
dependence of spells of unemployment (Katz and Meyer, 1990); all we can do is ask
whether workers with longer spells of unemployment use time differently from those
with shorter spells. One possibility is that individuals engaged in market work
accumulate a stock of unfinished home projects that cannot be completed on weekends or
during off-work hours. Early in a spell of unemployment the unemployed worker would
use the extra time to engage in the household production that was postponed while
working for pay, but that as an unemployment spell lengthens more non-market time
would be used as (unwanted) leisure. This would suggest that the burden of
unemployment rises with the duration of unemployment spell (as argued by Hurd, 1980).
Alternatively, individual households evidence non-separability of the utility of leisure
over time, as proposed by Kydland and Prescott (1982). People would then use short
periods of unemployment to relax from the stresses of any kind of work, and only later
begin to substitute household production for the market work in which they are no longer
engaged.
To examine this issue we take all the individuals in the ATUS who report being
unemployed on the diary day. We assume that those who stated that they were
unemployed and who reported unemployment in the eighth (their final) month in the CPS
(two to five months before the diary day) have unemployment duration equal to the
duration reported in the CPS plus the interval between that eighth month and the diary
8

day. For those unemployed ATUS respondents who were not unemployed in their eighth
CPS month, we make two polar assumptions: 1) Maximum duration—all became
unemployed immediately after they were interviewed in their eighth CPS month, so that
their unemployment duration equals the interval between that interview and the ATUS
diary day; and 2) Minimum duration—all became unemployed on the diary day and have
an unemployment duration of zero.
Table 5 shows the means of time use among the ATUS unemployed distinguished by
their duration of unemployment. There is no monotonic relationship between household
production and unemployment duration, although it is true (at least under the assumption
of maximum duration) that the long-term unemployed spend significantly more time in
household production than all those currently less far into their unemployment spells. A
similar conclusion can be drawn when comparing the long-term unemployed to those
ATUS respondents who became unemployed after their eighth CPS month (those with
minimum duration of 0-4 weeks).
Even these small differences disappear when we estimate regressions of household
production on a large number of covariates and indicators of the duration of
unemployment, as shown in Table 6. None of the parameters on the duration indicators
has a t-statistic greater than one, and all are tiny in absolute value. A reasonable
conclusion is that the time-diary data provide no evidence that the split of non-market
time use between household production and all other unpaid activities varies with
unemployment duration. Theories of labor supply based on non-separability of utility
over leisure across time periods appear of little use in explaining the intertemporal
behavior of leisure and household production. Similarly, the absence of any dependence
9

of household production on unemployment duration negates an “unfinished projects”
approach at the individual level.
III. An Interpretation
We have demonstrated that the employed do not spend much less time in household
production than do observationally identical unemployed workers, so that the
unemployed engage in much less total work. Similarly, in geographic areas where
unemployment is consistently higher, the average individual spends less time in market
work and no more time in household production than counterparts in areas where
unemployment is consistently lower. In areas where unemployment has suddenly risen,
however, the average resident spends less time in market work, but offsets most of this
decline by an increase in time spent in household production rather than leisure or
personal maintenance.
How can we rationalize the apparent absence of any effect of long-term differences
in unemployment on time spent in household production with the nearly complete offset
of lost market work by increased household production that occurs when an entire labor
market experiences a negative shock, presumably associated with a cyclical downturn?
One possibility is that they arise in a world in which there is easy short-run substitution
between market work and home production, yet where social norms about preferences for
work (market and household) and leisure differ geographically, possibly in ways which
are dependent on the past history of unemployment. No doubt a number of other theories
can also rationalize these quite surprising facts. The next step would be to test these
theories on the increasingly available and appropriate data that would allow
distinguishing among them.
10

REFERENCES
Mark Aguiar and Erik Hurst, “Measuring Trends in Leisure: The Allocation of Time over Five Decades,” Quarterly Journal of Economics, 122 (Aug. 2007): 969-1006.
Namkee Ahn, Juan Francisco Jimeno and Arantxa Ugidos, “Monday at the Sun:
Unemployment, Time Use and Consumption Patterns in Spain,” in Daniel Hamermesh and Gerard Pfann, eds., The Economics of Time Use. Amsterdam: Elsevier, 2005.
Australian Bureau of Statistics, 1992 Time Use Survey. Canberra, ABS, 1993. Marianne Baxter and Urban Jermann, “Household Production and the Excess sensitivity
of Consumption to Current Income,” American Economic Review, 89 (Sept. 1999): 902-920.
Jess Benhabib, Richard Rogerson and Randall Wright, “Homework in Macroeconomics:
Household Production and Aggregate Fluctuations,” Journal of Political Economy, 99 (Dec. 1991): 1166-87.
Bundesministerium für Familie, Senioren, Frauen und Jugend,
http://www.bmfsfj.de/bmfsfj/generator/Kategorien/Forschungsnetz/forschungsberichte,did=12818.html , 2005.
Michael Burda, Daniel Hamermesh and Philippe Weil, “The Distribution of Total Work
in the EU and US,” in Tito Boeri, Michael Burda and Francis Kramarz, eds., Working Hours and Job Sharing in the EU and USA: Are Americans Crazy? Are Europeans Lazy?” New York: Oxford University Press, 2008.
Richard Freeman and Ronald Schettkat, “Marketization of Household Production and the
EU-US Gap in Work,” Economic Policy, 41 (Jan. 2005): 5-39. Jeremy Greenwood and Zvi Hercowitz, “The Allocation of Capital and Time over the
Business Cycle,” Journal of Political Economy, 99 (Dec. 1991): 1188-1214. Jeremy Greenwood, Richard Rogerson and Randall Wright, “Household Production in
Real Business Cycle Theory, in Thomas Cooley, ed., Frontiers of Business Cycle Research. Princeton, NJ: Princeton University Press, 1995.
11

12
Reuben Gronau, “Home Production and the Macroeconomy—Some Lessons from Pollak and Wachter and from Transition Russia,” NBER Working Paper No. 12287, June 2006.
Daniel Hamermesh, Harley Frazis and Jay Stewart, “Data Watch: The American Time
Use Survey,” Journal of Economic Perspectives, 19 (Winter 2005): 221-232. Michael Hurd, “A Compensation Measure of the Cost of Unemployment to the
Unemployed,” Quarterly Journal of Economics, 95 (Sept. 1980): 225-43. ISTAT, Indagine Multiscopo sulle Famiglie Uso del Tempo 2002-2003. Rome: Instituto
Nazionale di Statistica, 2005. Lawrence Katz and Bruce Meyer “The Impact of the Potential Duration of
Unemployment Benefits on the Duration of Unemployment,” Journal of Public Economics, 41 (Feb. 1990): 45-72
Finn Kydland, and Edward Prescott “Time to Build and Aggregate Fluctuations,”
Econometrica, 50 (Nov. 1982): 1345-1370. Margaret Reid, Economics of Household Production. New York: Wiley, 1934. Peter Rupert, Richard Rogerson and Randall Wright, “Homework in Labor Economics:
Household Production and Intertemporal Substitution,” Journal of Monetary Economics, 46 (Dec. 2000): 557-79.

Table 1. Time Use by Employment Status and Gender, U.S., 2003-06, Italy 2002, Australia 1992, Germany, 2001.02, Ages 15-59* Market Household Market Household Work Production Work Production All U.S. AUSTRALIA Employed 343.13 191.27 328.64 181.90 (1.50) (0.98) (3.25) (2.01) Unemployed 35.58 249.82 37.6 230.3 (2.08) (4.44) (3.53) (5.82) Male Employed 377.87 153.25 393.07 123.90 (2.22) (1.29) (4.54) (2.17) Unemployed 44.40 202.79 52.15 182.1 (3.50) (5.08) (5.42) (5.43) Female Employed 303.62 234.53 253.67 249.30 (1.98) (1.44) (4.33) (3.20) Unemployed 26.31 299.30 20.12 288.10 (2.35) (6.06) (4.10) (9.04) All ITALY GERMANY Employed 370.17 156.02 268.85 214.66 (1.87) (1.19) (1.91) (1.27) Unemployed 31.27 244.69 48.37 315.01 (2.29) (5.04) (2.82) (4.26) Male Employed 413.95 87.05 323.90 158.52 (2.46) (1.06) (2.85) (1.61) Unemployed 52.00 100.28 58.93 242.65 (4.54) (4.69) (5.29) (6.62) Female Employed 305.98 257.12 212.86 271.75 (2.71) (2.02) (2.42) (1.80) Unemployed 17.50 340.60 41.81 359.94 (2.22) (6.44) (3.16) (5.15)
*Standard errors of the means in parentheses. All observations are weighted to account for sampling distributions across days of the week here and in Tables 2-6.

Table. 2. Effect of Unemployment Status on Time Use, Average and by Gender, U.S. 2003-06, Italy 2002, Australia 1992, Germany, 2001.02, Ages 15-59* Market Household Market Household Work Production Work Production U.S. AUSTRALIA All -272.46 94.11 -293.54 84.51 (9.69) (6.49) (9.36) (5.06) R2 0.109 0.151 0.158 0.252 Male -292.52 92.39 -336.29 82.93 (14.92) (9.13) (13.31) (12.38) R2 0.096 0.065 0.135 0.072 Female -252.66 91.08 -234.38 78.61 (12.64) (9.17) (12.75) (8.63) R2 0.088 0.150 0.122 0.276 ITALY GERMANY All -321.42 90.52 -222.58 95.73 (6.07) (3.38) (6.03) (3.96) R2 0.169 0.385 0.115 0.166 Male -356.88 41.26 -276.63 93.24 (9.86) (4.26) (10.47) (6.15) R2 0.113 0.072 0.080 0.033 Female -296.02 124.7 -185.68 94.79 (7.34) (5.00) (6.95) (5.18) R2 0.172 0.334 0.083 0.124
*Standard errors in parentheses. Also included in the regressions are: For the United States, vectors of indicators for educational attainment and the number and ages of resident children; indicators of gender and marital status, and their interaction; indicators of race, immigrant status; and age, here and in Tables 4 and 6. For Italy, all the same vectors and indicators are included, except immigrant status and race. For Australia, all the same vectors are included, except only number of resident children is included, and race is not included. For Germany, age, ages and number of children, and marital status are included.

Table 3. Metropolitan Area Unemployment Rates, 2003-2006, N = 107* Actual Six-year Average Shock
Year 2003 5.94 4.69 1.49
(1.41) (0.97) (1.02) [2.15, 10.97] [2.66, 8.80] [ -1.27, 4.72]
2004 5.54 4.95 0.72
(1.54) (0.88) (1.25) [1.93, 9.16] [3.08, 6.86] [ 2.26, 5.02]
2005 4.89 5.12 -0.27 (1.15) (1.03) (1.07) [2.22, 9.08] [2.65, 10.06] [ -2.66, 2.85]
2006 4.40 5.32 -1.10 (1.09) (0.97) (1.15) [1.95, 8.89] [3.03, 9.62] [ -4.78, 2.43]
2003-2006 5.29 4.98 0.00 (1.44) (0.99) (1.43) [1.94, 10.97] [2.65, 10.06] [ -4.78, 5.02]
*Standard deviations in parentheses, minima and maxima in brackets. Calculated from the CPS-MORG linked to ATUS respondents of all ages.
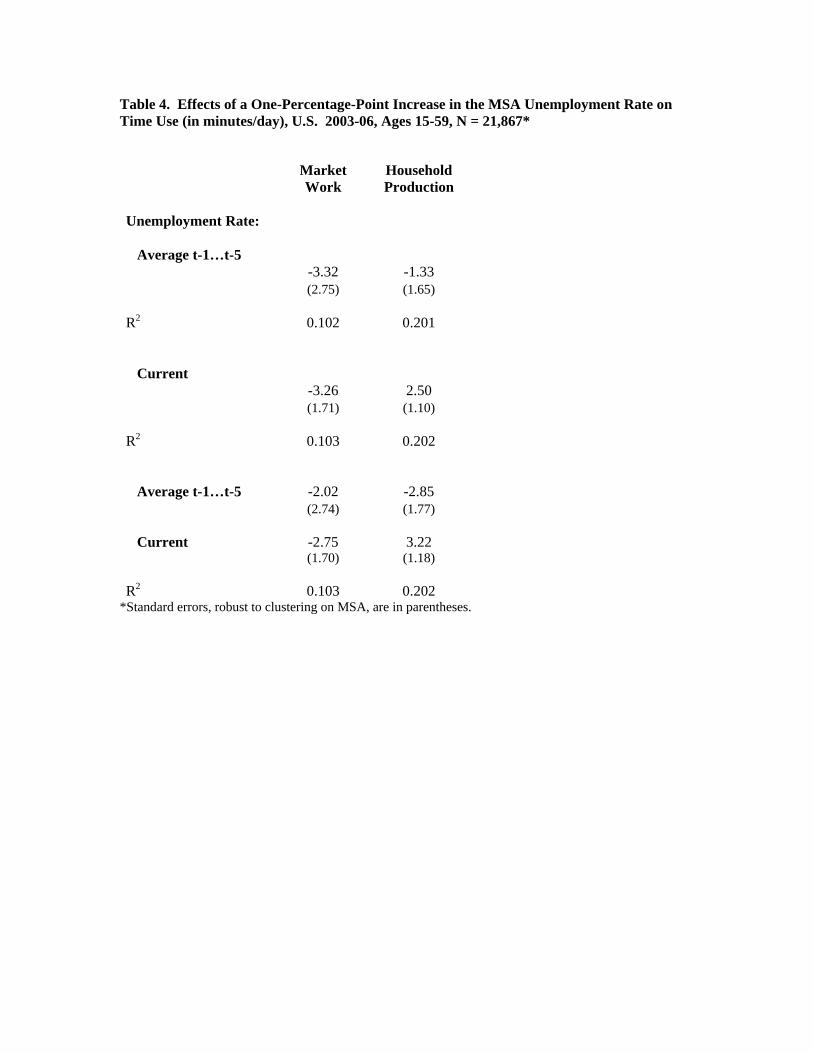
Table 4. Effects of a One-Percentage-Point Increase in the MSA Unemployment Rate on Time Use (in minutes/day), U.S. 2003-06, Ages 15-59, N = 21,867*
Market Work
Household Production
Unemployment Rate: Average t-1…t-5 -3.32 -1.33 (2.75) (1.65) R2 0.102 0.201 Current -3.26 2.50 (1.71) (1.10) R2 0.103 0.202 Average t-1…t-5 -2.02 -2.85 (2.74) (1.77) Current -2.75 3.22 (1.70) (1.18) R2 0.103 0.202
*Standard errors, robust to clustering on MSA, are in parentheses.
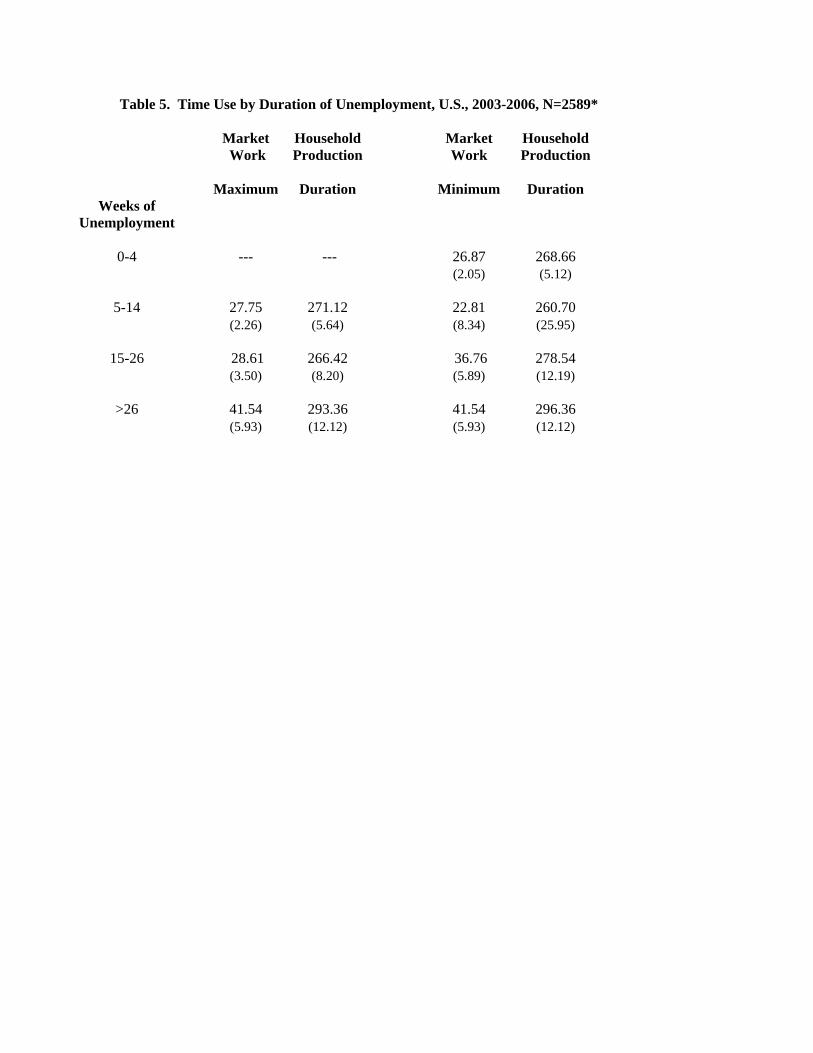
Table 5. Time Use by Duration of Unemployment, U.S., 2003-2006, N=2589* Market Household Market Household Work Production Work Production Maximum Duration Minimum Duration
Weeks of Unemployment
0-4 --- --- 26.87 268.66
(2.05) (5.12)
5-14 27.75 271.12 22.81 260.70 (2.26) (5.64) (8.34) (25.95)
15-26 28.61 266.42 36.76 278.54 (3.50) (8.20) (5.89) (12.19)
>26 41.54 293.36 41.54 296.36 (5.93) (12.12) (5.93) (12.12)

Table 6. Effect of Unemployment Duration on Time Use, U.S., 2003-2006, N=2589* Market Household Market Household Work Production Work Production
Maximum Duration Minimum Duration Weeks of
Unemployment
5-14 --- --- -16.65 9.55 (12.18) (23.43)
15-26 -3.95 7.34 9.26 3.06 (4.40) (8.45) (6.19) (11.91)
>26 -7.62 2.67 -5.58 1.00
( 6.76) (13.00) (6.67) (12.84)
R2 0.047 0.235 0.048 0.235
*Standard errors in parentheses. See footnote to Table 2 for list of covariates.

APPENDIX. Broad Categorizations of Activities into Market Work and Household Production United States:
Market work: market work and work-related activities; travel related to work. Household production: All household activities; caring for and helping household members; consumer purchases; professional and personal care services; household services; government services; travel related to these.
Australia:
Market work and travel related to it. Household production: Cleaning and cooking; family and child care; shopping; and travel associated with these.
Germany:
Market work: market work; employment and job search. Household production: home work activities; handicraft/gardening; care and sitting.
Italy:
Market work: market work; professional activities; training. Household production: domestic activities; family care; purchasing goods and services.