Undervaluing Gratitude: Expressers Misunderstand the …€¦ · gratitude can be relatively cheap,...
13
Psychological Science 1–13 © The Author(s) 2018 Reprints and permissions: sagepub.com/journalsPermissions.nav DOI: 10.1177/0956797618772506 www.psychologicalscience.org/PS Research Article Positive connections with other people are essential for happiness and health (Frey & Stutzer, 2002; Helliwell & Putnam, 2004; Kahneman & Deaton, 2010; Luo, Hawkley, Waite, & Cacioppo, 2012; Myers, 2000). For instance, one survey distinguishing very happy people from very unhappy people concluded, “No variable was sufficient for happiness, but good social relations were necessary (Diener & Seligman, 2002, p. 81). In meta- analyses of mortality risks (Holt-Lunstad, Smith, & Layton, 2010; House, Landis, & Umberson, 1988), lack- ing social support is as big a risk factor for early death as cigarette smoking and a greater risk than alcohol consumption, obesity, and air pollution. Mismanaging social relationships could reduce both the quality and quantity of life. Although the benefit of connecting with other peo- ple is obvious in the empirical record, it may not be as obvious in daily life. Consumers in one experiment who received either $5 or $20 predicted being happier if they spent the money on themselves than on someone else, but those randomly assigned to actually spend the money on someone else were significantly happier than those assigned to spend on themselves (Dunn, Aknin, & Norton, 2008). Commuters on trains and bus- ses in another series of experiments predicted having a less positive commute if they engaged a stranger in conversation than if they sat in solitude, but those ran- domly assigned to actually have a conversation with a stranger reported a significantly more positive commute than those assigned to sit in solitude (Epley & Schroeder, 2014). Likewise, introverted college students predicted being less happy if they acted extroverted in an interac- tion compared with acting introverted, but both intro- verts and extroverts reported feeling happier when they 772506PSS XX X 10.1177/0956797618772506Kumar, EpleyUnderappreciation research-article 2018 Corresponding Authors: Amit Kumar, The University of Texas at Austin, McCombs School of Business, 2110 Speedway, Austin, TX 78705 E-mail: [email protected] Nicholas Epley, The University of Chicago, Booth School of Business, 5807 S. Woodlawn Ave., Chicago IL 60637 E-mail: [email protected] Undervaluing Gratitude: Expressers Misunderstand the Consequences of Showing Appreciation Amit Kumar and Nicholas Epley Booth School of Business, The University of Chicago Abstract Expressing gratitude improves well-being for both expressers and recipients, but we suggest that an egocentric bias may lead expressers to systematically undervalue its positive impact on recipients in a way that could keep people from expressing gratitude more often in everyday life. Participants in three experiments wrote gratitude letters and then predicted how surprised, happy, and awkward recipients would feel. Recipients then reported how receiving an expression of gratitude actually made them feel. Expressers significantly underestimated how surprised recipients would be about why expressers were grateful, overestimated how awkward recipients would feel, and underestimated how positive recipients would feel. Expected awkwardness and mood were both correlated with participants’ willingness to express gratitude. Wise decisions are guided by an accurate assessment of the expected value of action. Underestimating the value of prosocial actions, such as expressing gratitude, may keep people from engaging in behavior that would maximize their own—and others’—well-being. Keywords gratitude, social cognition, social connection, happiness, well-being, open data, open materials, preregistered Received 8/2/17; Revision accepted 3/25/18
Transcript of Undervaluing Gratitude: Expressers Misunderstand the …€¦ · gratitude can be relatively cheap,...
https://doi.org/10.1177/0956797618772506
Psychological Science 1 –13© The Author(s) 2018Reprints and permissions: sagepub.com/journalsPermissions.navDOI: 10.1177/0956797618772506www.psychologicalscience.org/PS
Research Article
Positive connections with other people are essential for happiness and health (Frey & Stutzer, 2002; Helliwell & Putnam, 2004; Kahneman & Deaton, 2010; Luo, Hawkley, Waite, & Cacioppo, 2012; Myers, 2000). For instance, one survey distinguishing very happy people from very unhappy people concluded, “No variable was sufficient for happiness, but good social relations were necessary (Diener & Seligman, 2002, p. 81). In meta-analyses of mortality risks (Holt-Lunstad, Smith, & Layton, 2010; House, Landis, & Umberson, 1988), lack-ing social support is as big a risk factor for early death as cigarette smoking and a greater risk than alcohol consumption, obesity, and air pollution. Mismanaging social relationships could reduce both the quality and quantity of life.
Although the benefit of connecting with other peo-ple is obvious in the empirical record, it may not be as obvious in daily life. Consumers in one experiment who received either $5 or $20 predicted being happier if they spent the money on themselves than on someone else, but those randomly assigned to actually spend
the money on someone else were significantly happier than those assigned to spend on themselves (Dunn, Aknin, & Norton, 2008). Commuters on trains and bus-ses in another series of experiments predicted having a less positive commute if they engaged a stranger in conversation than if they sat in solitude, but those ran-domly assigned to actually have a conversation with a stranger reported a significantly more positive commute than those assigned to sit in solitude (Epley & Schroeder, 2014). Likewise, introverted college students predicted being less happy if they acted extroverted in an interac-tion compared with acting introverted, but both intro-verts and extroverts reported feeling happier when they
772506 PSSXXX10.1177/0956797618772506Kumar, EpleyUnderappreciationresearch-article2018
Corresponding Authors:Amit Kumar, The University of Texas at Austin, McCombs School of Business, 2110 Speedway, Austin, TX 78705 E-mail: [email protected]
Nicholas Epley, The University of Chicago, Booth School of Business, 5807 S. Woodlawn Ave., Chicago IL 60637E-mail: [email protected]
Undervaluing Gratitude: Expressers Misunderstand the Consequences of Showing Appreciation
Amit Kumar and Nicholas EpleyBooth School of Business, The University of Chicago
AbstractExpressing gratitude improves well-being for both expressers and recipients, but we suggest that an egocentric bias may lead expressers to systematically undervalue its positive impact on recipients in a way that could keep people from expressing gratitude more often in everyday life. Participants in three experiments wrote gratitude letters and then predicted how surprised, happy, and awkward recipients would feel. Recipients then reported how receiving an expression of gratitude actually made them feel. Expressers significantly underestimated how surprised recipients would be about why expressers were grateful, overestimated how awkward recipients would feel, and underestimated how positive recipients would feel. Expected awkwardness and mood were both correlated with participants’ willingness to express gratitude. Wise decisions are guided by an accurate assessment of the expected value of action. Underestimating the value of prosocial actions, such as expressing gratitude, may keep people from engaging in behavior that would maximize their own—and others’—well-being.
Keywordsgratitude, social cognition, social connection, happiness, well-being, open data, open materials, preregistered
Received 8/2/17; Revision accepted 3/25/18
2 Kumar, Epley
were instructed to act extroverted during the interaction (Zelenski et al., 2013). Decisions can be guided by the expected value of actions. These results suggest that people may systematically undervalue positive interac-tions with others, producing expectations that could keep people from being social enough for their own well-being. Here, we predicted that egocentric biases in social judgment may also lead people to systemati-cally undervalue the benefits of positive social engage-ment to others.
Specifically, we studied one of the most reliable methods of improving a person’s own well-being through positive social engagement: expressing grati-tude to another person (DeSteno, Li, Dickens, & Lerner, 2014; Dickens & DeSteno, 2016; Emmons & McCullough, 2003; Lyubomirsky, Dickerhoof, Boehm, & Sheldon, 2011; Seligman, Steen, Park, & Peterson, 2005). Unlike some activities that also increase well-being, expressing gratitude can be relatively cheap, costing only a few minutes of conversation or a few dollars for a card. Nevertheless, choices are guided at least partly by the expected value of possible actions. If people systemati-cally undervalue how positively others will respond to their expression of gratitude, they might not express it when they feel it, missing an opportunity to increase both their own and others’ well-being.
We believe there are at least two reasons that people might undervalue the positive impact of expressing gratitude on others, both of which create a systematic difference in perspective between gratitude expressers and gratitude recipients. Differing perspectives can lead to mistaken expectations because people often rely to some degree on their own egocentric perspective when predicting others’ mental states (Epley, Keysar, Van Boven, & Gilovich, 2004; Ross & Sicoly, 1979; Tamir & Mitchell, 2013). First, expressers may assume that recipi-ents are already aware of their gratitude, a “curse of knowledge” that makes expression seem unnecessary (Camerer, Loewenstein, & Weber, 1989). Believing one’s gratitude is more obvious than it actually is would lead expressers to underestimate surprise in a gratitude recipient. Second, actors tend to evaluate their own interpersonal actions in terms of competence, whereas observers tend to interpret those same actions in terms of an actor’s warmth (Fiske, Cuddy, & Glick, 2007; Wojciszke, 1994). Expressers may therefore worry inor-dinately about how they are expressing gratitude—their ability to articulate the words “just right”—whereas recipients are focused more on the prosocial meaning of the expression—its warmth and positive intent. This could lead expressers to underestimate a recipient’s positive mood and overestimate how awkward express-ing gratitude will make a recipient feel.
These mechanisms suggest that a gratitude recipient’s positive experience is uniquely difficult to fully appreciate
from an outsider’s perspective (Van Boven, Loewenstein, Dunning, & Nordgren, 2013). Even if gratitude expressers are somewhat aware of the divergence between their own and a recipient’s perspective, existing research suggests they may still account for it insufficiently (Epley et al., 2004; Gilbert & Gill, 2000). This led us to predict that people expressing gratitude would underestimate how surprised and positive recipients would feel after receiving a gratitude letter but overestimate how awkward recipi-ents would feel.
We conducted two initial experiments to test these hypotheses. Participants wrote a letter of gratitude and predicted their recipient’s experience. We then compared these expectations with recipients’ actual experiences of receiving the letters. We conducted two additional experiments to examine how expecta-tions about surprise, mood, and awkwardness might guide decisions about expressing gratitude. A final experiment examined whether an asymmetry in eval-uations of competence versus warmth between expressers and recipients could partly explain why expressers undervalue the effect of their prosocial actions on others.
Experiment 1
Method
For all experiments, we report all methods completely, including discussions of how sample sizes were deter-mined and whether any data were excluded from analyses. Informed consent was obtained from all participants.
Participants. We asked master of business administra-tion (MBA) students (N = 107, 41 female; age: M = 29.66, SD = 3.10) to express their gratitude to another person as part of a voluntary class exercise. This sample size was the total number, out of 129 students, who were willing to participate in this experiment for research purposes. Of the 107 participants who sent gratitude letters, 15 did not give us permission to contact their recipients. We therefore sent questionnaires to 92 recipients, of whom 80 completed them (42 female; age: M = 31.83, SD = 9.46), yielding an 87% response rate. Although this response rate is quite high, it is not perfect. Imperfect response rates could have created an artifact in our results if the recipients who responded differed system-atically from those who did not or if those who allowed us to e-mail recipients differed systematically from those who did not. However, we did not observe any signifi-cant differences between predictions of expressers whose recipients responded compared with those whose recipi-ents did not respond (see the Supplemental Material available online for details). We address response rates among recipients in the details of each experiment and in
Underappreciation 3
the General Discussion. A sensitivity analysis indicates that this sample size has 80% statistical power to detect a minimum effect size of 0.32 for our primary analyses.
Procedure. Expressers received instructions about com-pleting their gratitude letter in a classroom session, fol-lowed up by a reiteration of these instructions in an e-mail. Although this was not the unique focus of this experiment, 99 of the 107 expressers reported their mood on a brief survey just before receiving the in-class instruc-tions. This enabled a comparison of the expressers’ mood in a baseline measurement against the mood reported after completing their gratitude letter.
Expressers were instructed to write a letter express-ing gratitude to someone who had touched their life in a meaningful way. Participants were encouraged to write to another student in their MBA program but not to another student in the same course because we assumed this would increase the likelihood that letter writers would know their recipient’s e-mail address (and hence could be contacted). However, expressers were also told that they could write their letter to some-one else from their life if they preferred. The instruc-tions asked expressers to write a letter explaining why they were grateful to this person and to describe what this person did for them and how it affected their life. We adapted this method from Lyubomirsky et al. (2011).
Expressers were further informed that they could let their recipient know that their letter was encouraged as part of a class they were taking and that the professor would be sending them a brief questionnaire that they could complete if they wanted to. Expressers were also given the option of not having us e-mail their recipient, and 15 out of 107 chose that option. Expressers were asked to write and send their letters within 2 days.
Immediately after writing and sending their gratitude letters, expressers completed a questionnaire reporting their own experience and predicting their recipient’s experience. Expressers first reported their name, the name of their recipient, their recipient’s e-mail, the date and time they sent their letter, and what they said they were grateful for in general terms. Participants then reported their own experience and predicted their recipients’ experience. To test the curse-of-knowledge hypothesis described earlier, we attempted to measure surprise at the content of the letter. To do this, we dis-tinguished surprise at receipt of the letter from surprise about the contents of the letter. Expressers first pre-dicted how surprised the recipient would report feeling about receiving their letter on a scale ranging from 0 (not at all surprised) to 10 (extremely surprised). They were then told,
We’re also interested in the extent to which you feel like the person you sent this letter to already
knows the things you wrote down. That is, how surprised do you think they will be to learn about the specific reasons for why you feel grateful to them?
They predicted how surprised the recipient would report feeling about the specific reasons for feeling grateful on a scale ranging from 0 (not at all surprised) to 10 (extremely surprised). Expressers then predicted how the letter would make the recipient feel on a scale ranging from −5 (much more negative than normal) to 5 (much more positive than normal), with the midpoint of 0 labeled no different than normal. Expressers also reported how writing the letter made them feel person-ally on the same scale. Finally, expressers predicted how awkward the recipient “will report feeling after reading your letter” on a scale ranging from 0 (not at all awkward) to 10 (extremely awkward) and how awk-ward sending the letter made them feel on the same scale.
Expressers completed the survey by reporting on the current status of their relationship with the recipient on a scale ranging from −5 (feels like we’re miles apart) to 5 (feels like we’re really close), reporting their age and gender, and then pasting the letter they wrote into a text box (if they felt comfortable doing so and redacting any portion they preferred to keep private).
We e-mailed the recipients we had permission to contact as soon as expressers completed their survey. Recipients were informed that they had recently received a letter as part of a class exercise and were asked to complete a voluntary and confidential online survey reporting their experience. This survey asked recipients to report the name of their expresser, their age, and their gender. Recipients then reported how surprised they were to receive the letter, how surprised they were by the letter’s content, how the letter made them feel, and how awkward they felt after receiving the letter on the same scales that expressers used.
Results
Consistent with many findings reported in the existing literature (e.g., Lyubomirsky et al., 2011; Seligman et al., 2005), our results showed that writing a gratitude letter was a positive experience. Expressers reported being in a significantly more positive mood than normal (M = 2.58, SD = 1.30), one-sample t(106) = 20.59, p < .0001, d = 1.98, and reported being in a more positive mood after sending the gratitude letter than they did at the baseline measurement (M = 0.46, SD = 1.66), t(98) = 10.89, p < .0001, d = 1.09.
More important for our current hypotheses, express-ers also systematically undervalued the positive impact their gratitude letter would have on recipients. As
4 Kumar, Epley
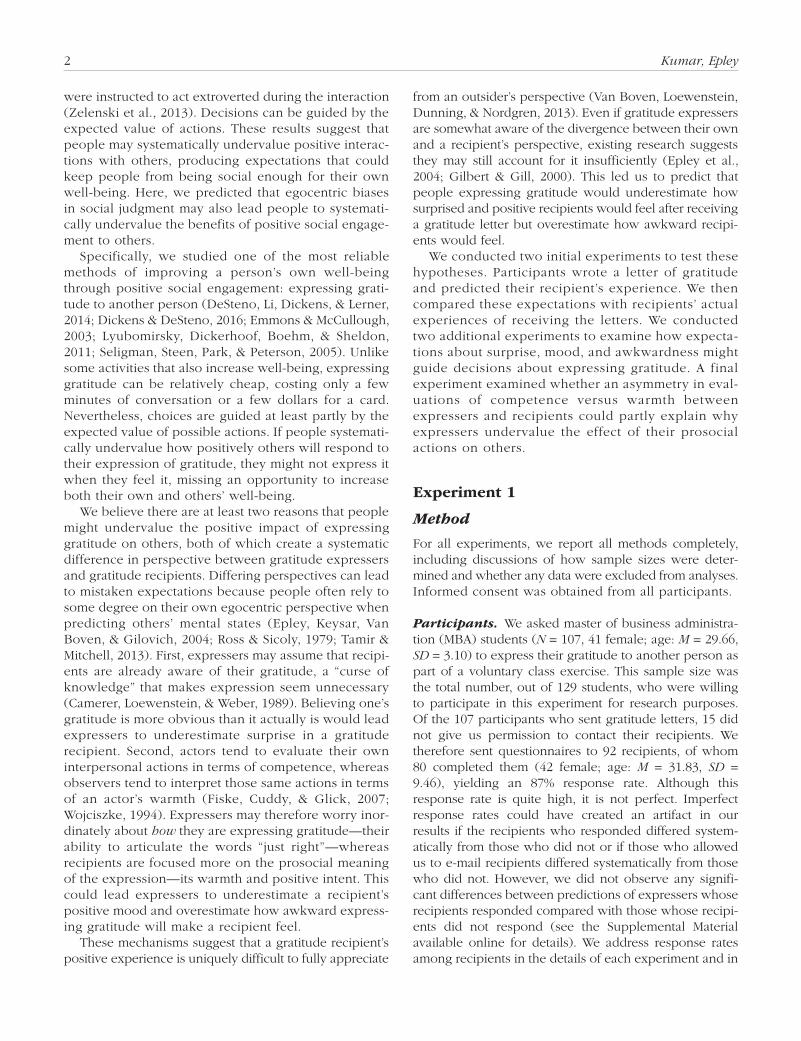
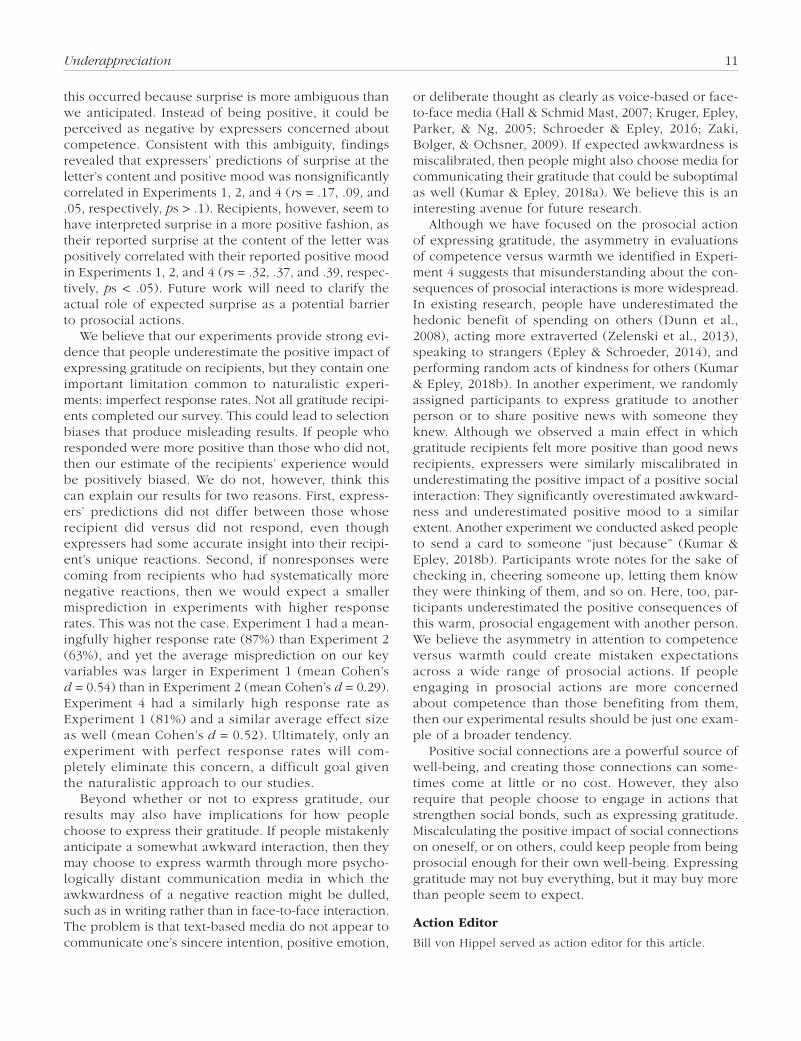
shown in Figure 1, expressers significantly underesti-mated how surprised recipients would be to receive the letter, paired-samples t(79) = 6.09, p < .0001, d = 0.68; underestimated how surprised they would be by the content of the letter, paired-samples t(79) = 3.49, p < .001, d = 0.40; underestimated how positive recipi-ents would feel, paired-samples t(79) = 6.60, p < .0001, d = 0.74; and overestimated how awkward recipients would feel, paired-samples t(79) = −2.89, p < .01, d = 0.32. Expressers believed that receiving gratitude would be a relatively positive experience, but it was even more positive for recipients than they expected.
It is important to note that these results do not nec-essarily indicate imperfect insight into a recipient’s unique response to a gratitude letter. Expressers could theoretically have complete insight into their own recip-ient’s unique experience compared with other recipi-ents, even if expressers are systematically miscalibrated on each item. That is, expressers could show a high degree of discrimination accuracy, indexed as a correla-tion between predicted and actual experiences, even while being miscalibrated, as indexed by a difference between the average predicted and actual experience. Figure 1, however, shows that this was not the case. The correlations between expressers’ predicted ratings and their recipient’s actual ratings were consistently small, being significantly larger than zero only when expressers predicted surprise at receiving the letter (r = .35, p < .01). Accuracy correlations for predicted surprise at the content of the letter, mood, and awk-wardness were all nonsignificantly different from zero
(all ps > .2). Expressers did not appear to have great insight into their recipient’s unique experience, and they systematically underestimated how positive receiv-ing gratitude would be for recipients.
Follow-up experiment with third-party simulators
We suggest that people underestimate the positive impact of expressing gratitude on the basis of an ego-centric bias in evaluations of a recipient’s perspective. Expressers are aware of their gratitude before express-ing it and also may focus on their competence in expressing gratitude, whereas recipients attend to the warmth that comes from the positive interaction. We conducted an indirect test of these mechanisms by ask-ing a group of 701 participants recruited through Amazon’s Mechanical Turk (MTurk) to read one of the gratitude letters from Experiment 1 from the perspective of either the letter writer or the recipient. We then asked them to predict the recipient’s reaction using the same measures as in Experiment 1 (manipulated perspective did not systematically alter predictions; see the Supple-mental Material for full details). Because these third-person observers would be relatively unaware of the expresser’s reason for expressing gratitude, we expected that their expectation of surprise would match the eval-uations provided by the original letter recipients. How-ever, because the warmth that comes from experiencing an expression of gratitude is unique to the person who actually receives it, we predicted third-person observers’
0
1
2
3
4
5
6
7
8
9
10
Surprise AboutReceiving
Surprise AboutContent
Recipient’sMood
How Awkward?
Ratin
g
Predicted
Actualr = .35**
r = .09
r = .16
r = .12
Fig. 1. Results from Experiment 1: expressers’ mean predictions of recipients’ experiences receiving a letter of gratitude and recipients’ actual ratings. The correlation between pre-dicted and actual ratings is reported for each item. All items were answered on response scales ranging from 0 to 10, except for mood, which was answered on a scale ranging from −5 (much more negative than normal) to 5 (much more positive than normal). We rescaled this item for this figure by adding 5 to each participant’s response. Asterisks indicate a significant correlation (p < .01). Error bars reflect standard errors.
Underappreciation 5
expectations of a recipient’s mood and awkwardness would match those of the original letter writers.
Results were consistent with our predicted perspec-tive gaps in the actual experience of expressers and recipients (see the Supplemental Material). First, the average evaluations of surprise made by these outside observers were more like average evaluations of actual recipients than expressers for surprise at receiving the letter (Ms = 7.61, 6.01, and 7.88 for observers, express-ers, and recipients, respectively) and for surprise at the content of the letter (Ms = 6.39, 4.45, 5.66, respectively). Second, average evaluations by third-person observers (who did not directly experience the warmth of receiv-ing gratitude like actual recipients did) were more simi-lar to predicted evaluations of the original expressers for both mood (respective Ms = 3.28, 3.11, 4.12) and awkwardness (Ms = 3.20, 2.95, 1.95). These results sug-gest that the unique psychological perspective of people expressing versus receiving gratitude can help to explain why the positive impact of expressing gratitude on recipients may be systematically undervalued. In Experi-ment 2, we tested how systematic this underestimation actually was by conducting a direct replication of Exper-iment 1 outside the classroom context with participants expressing gratitude to a broader range of recipients.
Experiment 2
Method
Participants. One hundred participants (46 female; age: M = 20.27, SD = 2.85) recruited to a laboratory on The University of Chicago campus completed this experiment in exchange for $5. We expected a lower response rate for recipients than we observed in Experiment 1 because par-ticipants were encouraged to write to a broader range of recipients who might not be as likely to respond. We therefore targeted 100 participants thinking that a 50% response rate would still yield a sufficient sample size (50 pairs) for our primary analyses.
Of the 100 participants who wrote a gratitude letter, 98 granted us permission to contact the recipients of their gratitude letters. The contact information provided by 6 of these participants, however, contained some sort of mistake (e.g., a spelling error) that prevented us from reaching their recipients. We therefore sent questionnaires to 92 recipients, of whom 58 completed them (33 female; age: M = 32.14, SD = 15.84), yielding a 63% response rate. As in Experiment 1, we observed nonsignificant differences in predictions about recipi-ents’ experiences between expressers whose recipient did versus did not respond (see the Supplemental Mate-rial). A sensitivity analysis indicated that this sample size had 80% statistical power to detect a minimum effect size of 0.37 for our primary analyses.
Procedure. The procedure was similar to that used in Experiment 1 with three notable exceptions. First, we recruited participants for an experiment conducted in a laboratory rather than as part of a voluntary class exer-cise. Second, we encouraged participants to write to any-one in their lives they felt grateful to, rather than encouraging (although not restricting) them to write to another professional student. We provided several exam-ples as possible recipients: “parents, friends, teachers, coaches, teammates, employers, and so on.” This poten-tially expanded the pool of recipients who received a letter compared with the pool in Experiment 1. Finally, participants wrote their gratitude letter in the laboratory, during the experimental session, rather than writing it at their own chosen time and in their own chosen context. All other procedural details and experimental measures followed the methods used in Experiment 1.
Results
As in Experiment 1, writing a gratitude letter was a positive experience. Expressers reported being in a significantly more positive mood than normal (M = 2.56, SD = 1.73), one-sample t(99) = 14.79, p < .0001, d = 1.48, and also reported being in a more positive mood after writing the letter than they reported feeling at the beginning of the experiment (M = 0.77, SD = 1.72), paired-samples t(99) = 9.74, p < .0001, d = 0.97.
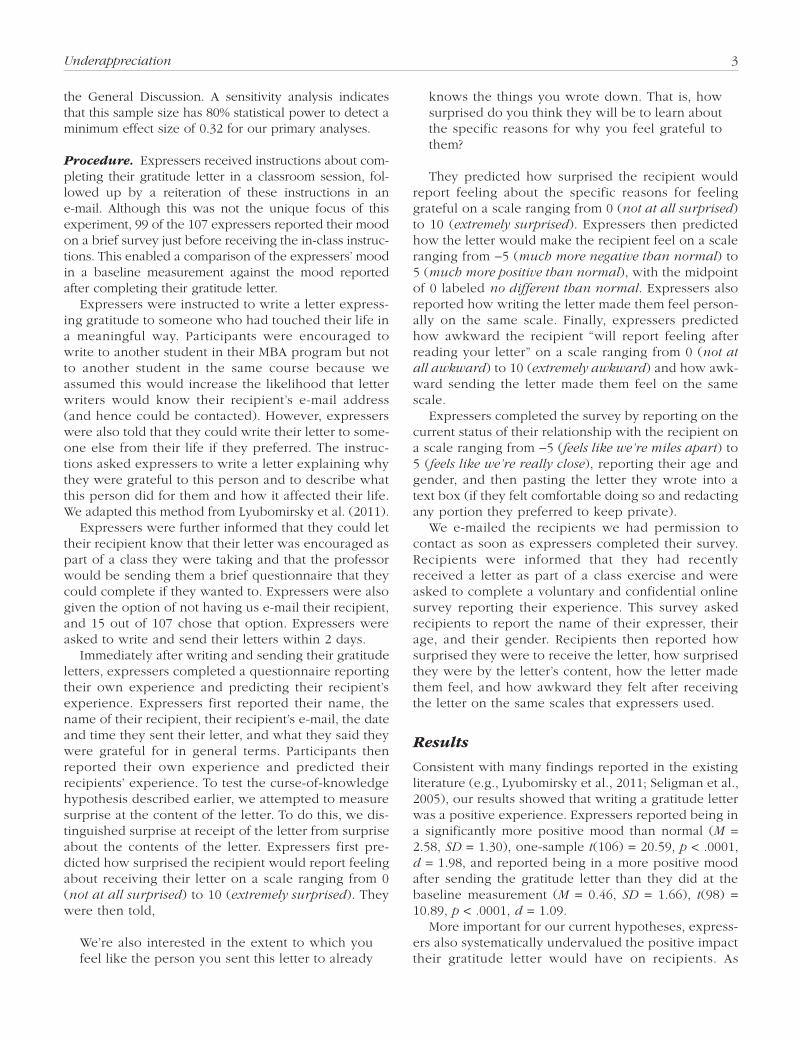
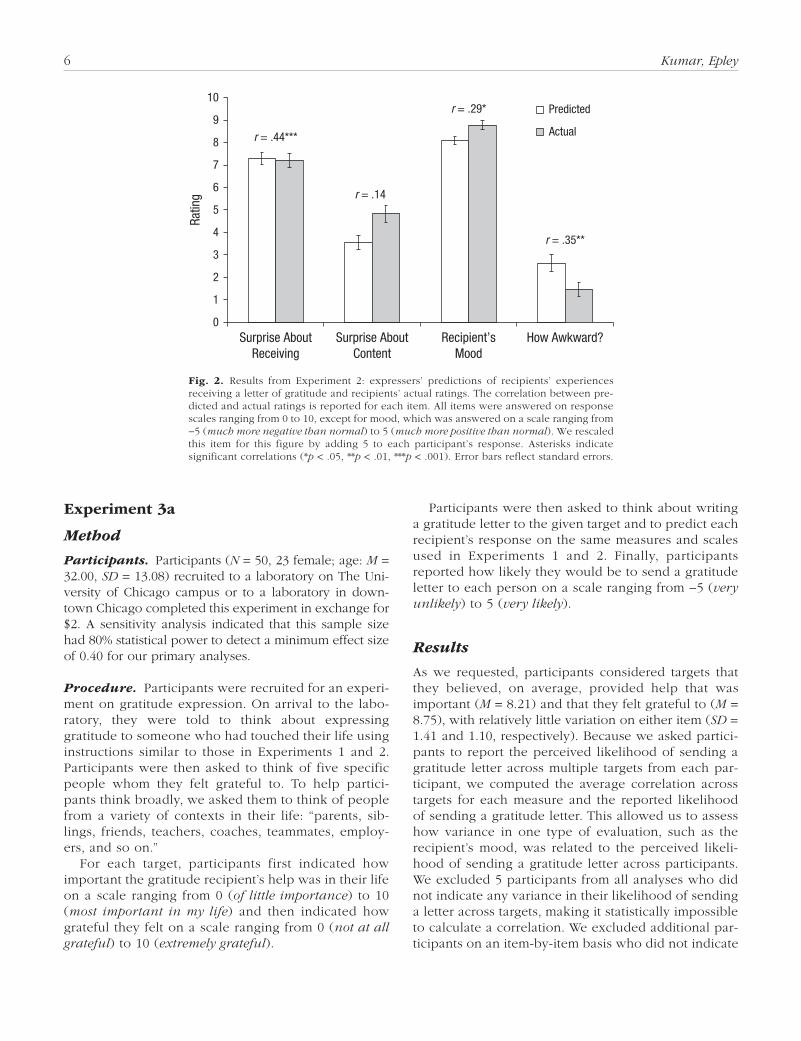
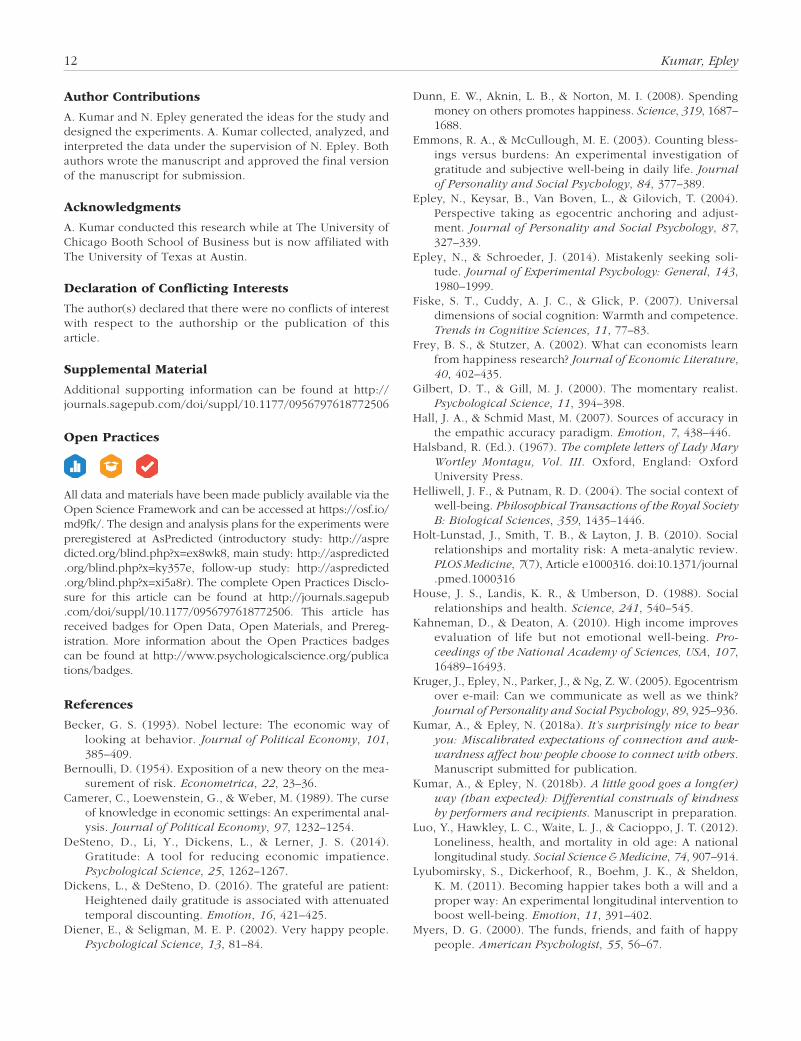
More important, expressers again systematically underestimated the positive impact that their gratitude letter would have on recipients (see Fig. 2). Unlike in Experiment 1, expressers did not significantly underes-timate how surprised recipients would be to receive their letter, paired-samples t(57) = −0.28, p = .78, d = −0.04. However, expressers again underestimated how surprised they would be by the precise content of the letter, paired-samples t(57) = 2.79, p < .01, d = 0.36; underestimated how positive recipients would feel, paired-samples t(57) = 3.19, p < .01, d = 0.43; and over-estimated how awkward recipients would feel, paired-samples t(57) = −2.99, p < .01, d = 0.39. Expressers again showed relatively modest insight into their recipient’s actual experience. Although we observed above-chance accuracy in three of the four measures, as can be seen in Figure 2, the correlations were far from perfect. This experiment replicates the main results of Experiment 1, demonstrating again that people may systematically undervalue the positive impact that expressing gratitude will have on recipients. Experiment 3a tested how these expectations of a recipient’s reactions were related to the reported likelihood of expressing gratitude to exam-ine whether miscalibrated expectations about surprise, positive mood, and awkwardness could be a barrier to expressing felt gratitude.
6 Kumar, Epley
Experiment 3a
Method
Participants. Participants (N = 50, 23 female; age: M = 32.00, SD = 13.08) recruited to a laboratory on The Uni-versity of Chicago campus or to a laboratory in down-town Chicago completed this experiment in exchange for $2. A sensitivity analysis indicated that this sample size had 80% statistical power to detect a minimum effect size of 0.40 for our primary analyses.
Procedure. Participants were recruited for an experi-ment on gratitude expression. On arrival to the labo-ratory, they were told to think about expressing gratitude to someone who had touched their life using instructions similar to those in Experiments 1 and 2. Participants were then asked to think of five specific people whom they felt grateful to. To help partici-pants think broadly, we asked them to think of people from a variety of contexts in their life: “parents, sib-lings, friends, teachers, coaches, teammates, employ-ers, and so on.”
For each target, participants first indicated how important the gratitude recipient’s help was in their life on a scale ranging from 0 (of little importance) to 10 (most important in my life) and then indicated how grateful they felt on a scale ranging from 0 (not at all grateful) to 10 (extremely grateful).
Participants were then asked to think about writing a gratitude letter to the given target and to predict each recipient’s response on the same measures and scales used in Experiments 1 and 2. Finally, participants re ported how likely they would be to send a gratitude letter to each person on a scale ranging from −5 (very unlikely) to 5 (very likely).
Results
As we requested, participants considered targets that they believed, on average, provided help that was important (M = 8.21) and that they felt grateful to (M = 8.75), with relatively little variation on either item (SD = 1.41 and 1.10, respectively). Because we asked partici-pants to report the perceived likelihood of sending a gratitude letter across multiple targets from each par-ticipant, we computed the average correlation across targets for each measure and the reported likelihood of sending a gratitude letter. This allowed us to assess how variance in one type of evaluation, such as the recipient’s mood, was related to the perceived likeli-hood of sending a gratitude letter across participants. We excluded 5 participants from all analyses who did not indicate any variance in their likelihood of sending a letter across targets, making it statistically impossible to calculate a correlation. We excluded additional par-ticipants on an item-by-item basis who did not indicate
0
1
2
3
4
5
6
7
8
9
10
Surprise AboutReceiving
Surprise AboutContent
Recipient’sMood
How Awkward?
Ratin
g
r = .44***
r = .14
r = .29*
r = .35**
Predicted
Actual
Fig. 2. Results from Experiment 2: expressers’ predictions of recipients’ experiences receiving a letter of gratitude and recipients’ actual ratings. The correlation between pre-dicted and actual ratings is reported for each item. All items were answered on response scales ranging from 0 to 10, except for mood, which was answered on a scale ranging from −5 (much more negative than normal) to 5 (much more positive than normal). We rescaled this item for this figure by adding 5 to each participant’s response. Asterisks indicate significant correlations (*p < .05, **p < .01, ***p < .001). Error bars reflect standard errors.
Underappreciation 7
any variance across potential recipients on the other measures (two for importance, seven for felt gratitude, five for mood, and two for awkwardness).
As predicted, participants’ perceived likelihood of sending a gratitude letter was correlated with the per-ceived positive impact that the letter would have on the recipients’ mood and awkwardness. The perceived likeli-hood of writing a gratitude letter was positively corre-lated with the recipient’s predicted positive mood (mean correlation = .33), t(39) = 3.99, p < .001, d = 0.63, but negatively correlated with the recipient’s predicted feel-ing of awkwardness (mean correlation = −.30), t(42) = −3.70, p < .001, d = 0.57. Inconsistent with our predic-tion, surprise at the content of the letter was nonsignifi-cantly correlated with the perceived likelihood of writing a gratitude letter (mean correlation = −.18), t(44) = −1.96, p = .06, d = 0.30. Participants in this experiment appeared to interpret “surprise at the content of the letter” as a potentially negative response rather than as a positive response. Indeed, surprise was positively correlated with the negative experience of awkward-ness across the targets they considered (mean correla-tion = −.50), t(45) = 8.93, p < .0001, d = 1.32, but was nonsignificantly correlated with expectations about positive mood (mean correlation = .12), p > .1. This suggests that participants were not thinking of this solely in terms of a positive surprise at hearing of another’s gratitude. This is an important result that we will return to in the General Discussion.
Overall, these results suggest that people’s willing-ness to express gratitude is guided by the expected value of a recipient’s response. In Experiment 3b, we provided another test of this hypothesis by asking expressers to choose between different gratitude recipi-ents who were expected to be either high or low on the dimensions of interest. If expectations about expressing gratitude are based on the expected value to recipients, then people should choose to express gratitude to someone who is expected to respond most favorably. We tested this in Experiment 3b by asking participants to write a letter to one of six recipients after predicting each person’s reactions to receiving a letter.
Experiment 3b
Method
Participants. Participants (N = 100, 58 female; age: M = 20.98, SD = 3.87) recruited to a laboratory on The Univer-sity of Chicago campus completed the experiment in exchange for $5. A technical failure resulted in data not being recorded for 1 participant, and another participant did not complete the study, leaving a final sample size of 98 participants. A sensitivity analysis indicated that this
sample size had 80% statistical power to detect a mini-mum effect size of 0.28 for our primary analyses.
Procedure. The experimenter provided participants with written instructions asking them to think about people in their lives to whom they could write a letter expressing gratitude. These instructions provided a description of what a gratitude letter would contain, consistent with the instructions from Experiments 1 to 3a, and told partici-pants that they would be considering six different grati-tude recipients. The instructions then directed participants to think of distinct individuals to whom they felt similarly grateful but who differed on our key variables of interest (surprise, positive mood, and awkwardness). For each variable, presented in a random order, participants identi-fied one person who would be high on that variable and another who would be low on that variable. For instance, when considering how surprised a person would be about a letter’s content, participants thought of one per-son who would be very surprised and another person who would not be very surprised. Participants then indi-cated how grateful they felt to each person on a scale ranging from 0 (not at all grateful) to 10 (extremely grate-ful) and which person in the pair they would rather write a gratitude letter to if they could write to only one per-son. Participants answered the same series of questions for positive mood and awkwardness. These choices are our primary variables of interest.
Participants then read that they would be asked to write a gratitude letter to one of the six people they considered as part of the experiment and ranked all six individuals from the person they would be most likely to write a letter to (ranked 1) to least likely (ranked 6). Participants then wrote a letter of gratitude to the per-son they ranked first, using either e-mail (which they sent) or a notecard we provided (which we subse-quently mailed for participants).
Immediately after writing their gratitude letter, par-ticipants reported their mood on a scale ranging from −5 (much more negative than normal) to 5 (much more positive than normal). Finally, participants reported how frequently they expressed gratitude in this way by responding to the following question:
Think about how often you typically write gratitude letters like this. Sometimes people feel they do certain activities too rarely (for example, many people think they exercise too little). Other times people feel they do certain activities too often (for example, many people think they procrastinate too much). And still other times, people think their behavior is just right, such as spending just the right amount of time on work or leisure activities. When thinking about how
8 Kumar, Epley
often you typically write letters of gratitude, do you feel that you do this less often than you’d like to, more often than you’d like to, or is your frequency just right?
Participants responded on a scale ranging from −5 (I do this much less often than I’d like) to 5 (I do this much more often than I’d like), where 0 was labeled just about right. Participants then indicated their age and gender and were thanked for completing the experiment.
Results
If people’s willingness to express gratitude is at least partly guided by its expected value to recipients, then participants should prefer expressing gratitude to a recipi-ent who is expected to respond positively. Consistent with Experiment 3a, results showed that expectations about the recipient’s surprise were not related to their preference for expressing gratitude, with only 53.05% preferring to express gratitude to a person they believed would be more surprised, χ2(1, N = 98) = 0.37, p = .54.
Expectations about a recipient’s mood and awkward-ness, however, were again strongly related to prefer-ences for expressing gratitude. Specifically, 88.78% of participants preferred to express gratitude to the person they believed would feel especially positive, χ2(1, N = 98) = 58.94, p < .0001, φ = 0.78, and 84.69% preferred the person they believed would not feel awkward, χ2(1, N = 98) = 47.18, p < .0001, φ = 0.69.
Participants’ rankings of their preference for express-ing gratitude to all six of the potential recipients showed a similar pattern. Specifically, participants ranked the recipient they expected would be in a really positive mood as the person they would be most interested in sending a letter to (average rank = 2.22), followed by the person they expected would not feel awkward (average rank = 2.87), the person they thought would be very surprised about the letter’s content (average rank = 2.90), the person who would not be surprised (average rank = 3.40), the person who would not feel positive (average rank = 4.70), and the person who would feel awkward (average rank = 4.89). Participants were most interested in expressing gratitude to the person who would feel really positive and least inter-ested in expressing gratitude to the person who would feel awkward.
Participants choice of whom to write a letter to fol-lowed these stated preferences: 31 (32% of the sample) wrote a gratitude letter to the person they expected would feel very positive, 25 (26%) to the person they expected would not feel awkward, 22 (22%) to the person they thought would be really surprised, 16
(16%) to the person they anticipated would not be surprised, 3 (3%) to the person would not feel positive, and only 1 (1%) to the person he or she expected would feel awkward when receiving it. These results again suggest that expressions of gratitude are guided by expectations about a recipient’s reactions, with people choosing to express their gratitude to recipients who they believe will feel positive.
Finally, participants reported feeling significantly happier than normal after expressing gratitude (M = 2.91, SD = 1.63), one-sample t(97) = 17.72, p < .0001, d = 1.79. However, participants also reported express-ing gratitude in this way significantly less often than they would like to (M = −2.06, SD = 2.04), t(97) = −10.00, p < .0001, d = −1.01. Misunderstanding how positively recipients will respond to an expression of gratitude may leave people choosing to express grati-tude less often than they would actually want to, a potentially misplaced barrier to positive interactions that could be suboptimal for both their own and others’ well-being.
Experiment 4
We predicted that people would undervalue the posi-tive impact of expressing gratitude partly because of an asymmetry in evaluations of competence and warmth between gratitude expressers and recipients. To test whether concerns about competence could serve as a barrier to expressing gratitude, we asked 198 MTurk workers (see the Supplemental Material) to indicate someone they feel grateful to, to imagine writing that person a gratitude letter, and then to indicate how much they would be thinking about two competence attributes when deciding to write a gratitude letter (“What will I actually write?” and “How articulate will I be?”) and two warmth attributes (“How friendly and kind will my letter appear to be?” and “How sincere will my letter seem to this person?”). On scales ranging from 0 (not at all) to 10 (a great deal), participants indicated that they would be thinking about all of these attributes equally (and highly), on average. But when asked what would come to mind first, 74.75% indicated one of the competence items, χ2(1, N = 198) = 48.51, p < .0001. Experiment 4 tested the extent to which expressers’ expectations about warmth and competence guided evaluations of a recipient’s reaction and their calibration with recipients’ actual experiences.
Method
Participants. One hundred twenty-seven MBA stu-dents (64 female; age: M = 29.26, SD = 2.48) participated in a preregistered study that closely followed the procedure
Underappreciation 9
of Experiment 1. The sample size was the total number of students in the course who agreed to complete a class exercise and also consented to using their data for research purposes. Of the 127 participants who volunteered to write gratitude letters, 31 did not provide contact informa-tion for their recipients. We thus sent questionnaires to 96 recipients, of whom 78 completed the follow-up survey (43 female; age: M = 38.32, SD = 14.17), yielding an 81% response rate. Predictions again did not differ signifi-cantly between expressers whose recipient did versus did not respond (see the Supplemental Material). A sen-sitivity analysis indicated that this sample size had 80% statistical power to detect a minimum effect size of 0.32 for our primary analyses.
Procedure. The procedure was very similar to that used in Experiment 1, with a few notable exceptions. First, participants did not provide a baseline mood rating in class. Second, participants were instructed to write their gratitude letter to anyone they felt grateful to (as in Experiment 2), rather than being encouraged to write to another student at their school.
More important, this experiment included measures of competence and warmth based on the traits and definitions provided by Fiske et al. (2007). Expressers reported their perceived competence in expressing gratitude by answering the following two items: (a) “To what extent were you able to express your gratitude using words that were just right?” and (b) “After your recipient reads your letter, how articulate do you believe they will think your expression of gratitude is?” Both items were rated on 11-point scales ranging from 0 (not at all) to 10 (extremely). Expressers reported their perceived warmth by answering these two items: (a) “After your recipient reads your letter, how warm do you think they will perceive your letter to be?” and (b) “How sincere do you believe they will think your expression of gratitude is?” These responses were pro-vided on similar 11-point scales. The follow-up survey sent to recipients also included these four items pertain-ing to the letter writer’s ability to express their gratitude using words that were just right, how articulate the letter was, how warm the letter was, and how sincere they believed the expression of gratitude to be (using the same scales as the expressers).
Expressers and recipients also completed all other measures from Experiment 1 and the measure from Experiment 3b that asked expressers to indicate whether they express gratitude too little, too much, or just the right amount.
Results
As in Experiments 1 and 2, writing a gratitude letter was again a positive experience for expressers, who
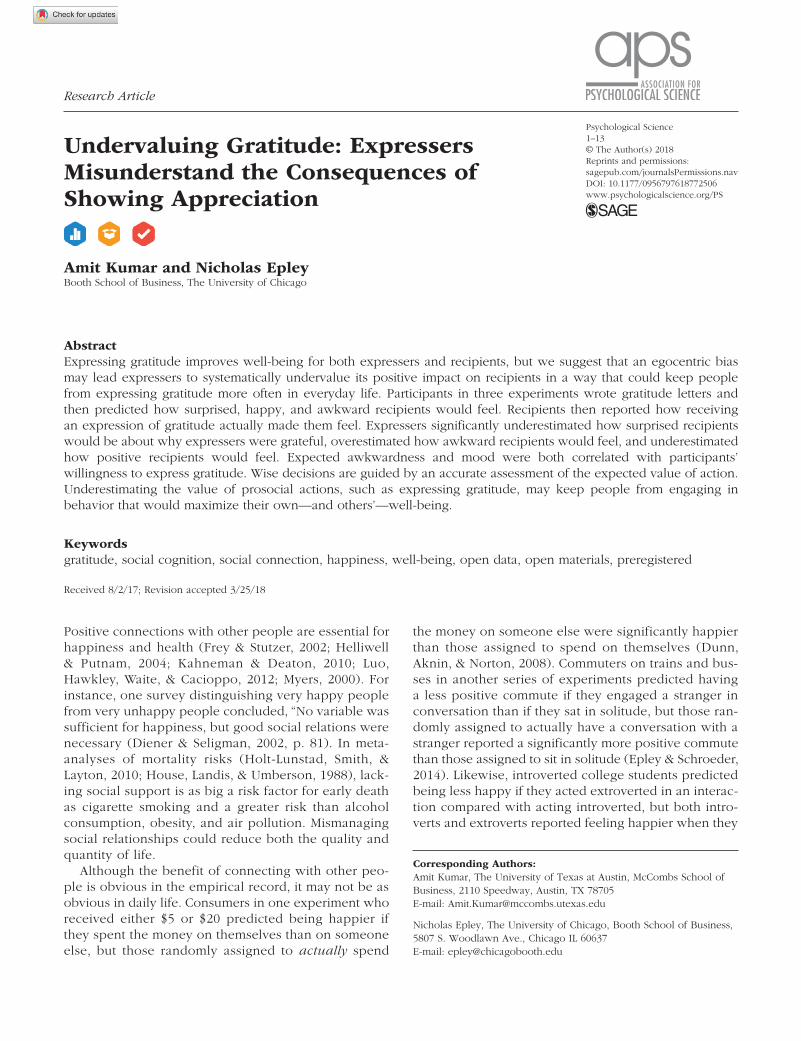
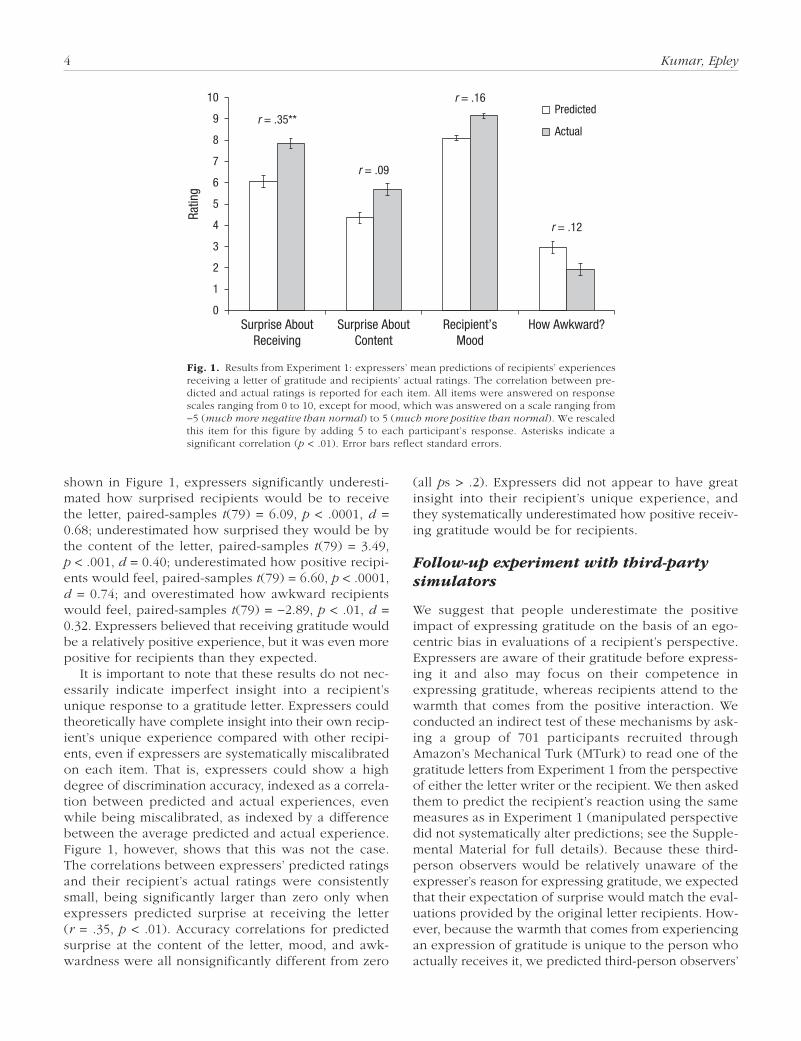
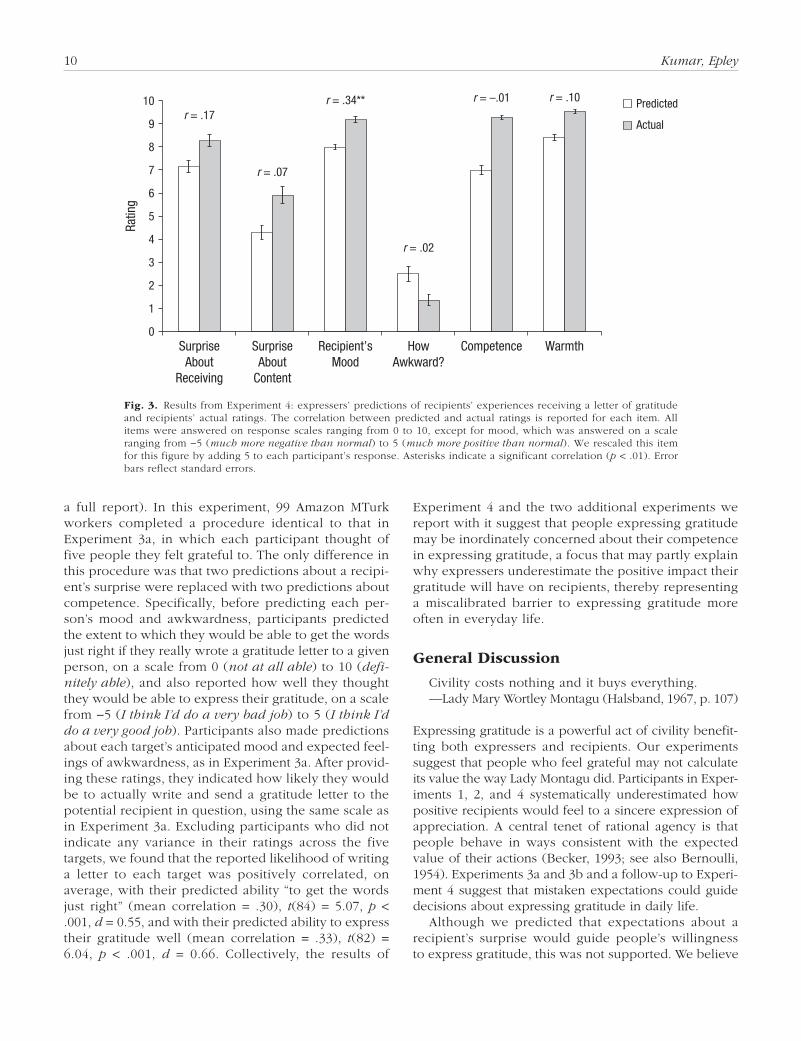
reported feeling significantly better than they usually do after writing their letter (M = 2.85, SD = 1.45), one-sample t(126) = 22.28, p < .0001, d = 1.97. Expressers also significantly undervalued the positive impact of their gratitude on recipients, replicating the primary results from Experiments 1 and 2. That is, expressers significantly underestimated how surprised recipients would be to receive the letter, paired-samples t(77) = 3.28, p < .01, d = 0.37; underestimated how surprised they would be by the content of the letter, paired-samples t(77) = 3.57, p < .001, d = 0.40; underestimated how positive recipients would feel, paired-samples t(77) = 8.43, p < .0001, d = 0.96; and overestimated how awkward recipients would feel, paired-samples t(77) = −2.80, p < .01, d = 0.32 (see Fig. 3). Finally, expressers again indicated that they did not express gratitude often enough (M = −2.29, SD = 2.09), one-sample t(126) = 12.36, p < .0001, d = 1.10.
Our primary hypotheses in this experiment, however, focused on evaluations of competence and warmth by expressers and recipients. Because the two competence and two warmth items were each highly correlated (rs > .5, ps < .0001), we averaged each pair into a single composite measure of competence and warmth. As pre-dicted, expressers significantly underestimated how competent they would be rated by recipients (Ms = 6.99 and 9.28, respectively, SDs = 1.65 and 0.92), paired-samples t(77) = 10.62, p < .0001, d = 1.20, and also underestimated how warm they would be rated by recipients (Ms = 8.40 and 9.54, respectively, SDs = 1.25 and 0.88), paired-samples t(77) = 6.95, p < .0001, d = 0.79. More important, miscalibration was significantly larger for competence (mean difference = 2.28, SD = 1.90) than for warmth (mean difference = 1.14, SD = 1.45), paired-samples t(77) = 7.33, p < .0001, d = 0.83. These results suggest that the first thoughts that may come to mind for people when deciding to express gratitude—their ability to competently articulate their gratitude—may be an unwarranted barrier to expressing gratitude more often in everyday life. As expected, we also observed a significant correlation between express-ers’ competence ratings and their expectations about their recipient’s mood (r = .32, p < .01). The correlation was directionally larger, however, between expressers’ warmth ratings and their expectations about their recip-ient’s mood (r = .57, p < .0001). Given that evaluations of warmth and competence were highly correlated in this experiment (r = .57, p < .0001) and that we did not experimentally manipulate expectations about compe-tence and warmth, we cannot identity the causal rela-tionship between these two variables.
A brief follow-up experiment replicating the proce-dure of Experiment 3a confirmed that expectations about competence could guide expressers’ willingness to express gratitude (see the Supplemental Material for
10 Kumar, Epley
a full report). In this experiment, 99 Amazon MTurk workers completed a procedure identical to that in Experiment 3a, in which each participant thought of five people they felt grateful to. The only difference in this procedure was that two predictions about a recipi-ent’s surprise were replaced with two predictions about competence. Specifically, before predicting each per-son’s mood and awkwardness, participants predicted the extent to which they would be able to get the words just right if they really wrote a gratitude letter to a given person, on a scale from 0 (not at all able) to 10 (defi-nitely able), and also reported how well they thought they would be able to express their gratitude, on a scale from −5 (I think I’d do a very bad job) to 5 (I think I’d do a very good job). Participants also made predictions about each target’s anticipated mood and expected feel-ings of awkwardness, as in Experiment 3a. After provid-ing these ratings, they indicated how likely they would be to actually write and send a gratitude letter to the potential recipient in question, using the same scale as in Experiment 3a. Excluding participants who did not indicate any variance in their ratings across the five targets, we found that the reported likelihood of writing a letter to each target was positively correlated, on average, with their predicted ability “to get the words just right” (mean correlation = .30), t(84) = 5.07, p < .001, d = 0.55, and with their predicted ability to express their gratitude well (mean correlation = .33), t(82) = 6.04, p < .001, d = 0.66. Collectively, the results of
Experiment 4 and the two additional experiments we report with it suggest that people expressing gratitude may be inordinately concerned about their competence in expressing gratitude, a focus that may partly explain why expressers underestimate the positive impact their gratitude will have on recipients, thereby representing a miscalibrated barrier to expressing gratitude more often in everyday life.
General Discussion
Civility costs nothing and it buys everything.—Lady Mary Wortley Montagu (Halsband, 1967, p. 107)
Expressing gratitude is a powerful act of civility benefit-ting both expressers and recipients. Our experiments suggest that people who feel grateful may not calculate its value the way Lady Montagu did. Participants in Exper-iments 1, 2, and 4 systematically underestimated how positive recipients would feel to a sincere expression of appreciation. A central tenet of rational agency is that people behave in ways consistent with the expected value of their actions (Becker, 1993; see also Bernoulli, 1954). Experiments 3a and 3b and a follow-up to Experi-ment 4 suggest that mistaken expectations could guide decisions about expressing gratitude in daily life.
Although we predicted that expectations about a recipient’s surprise would guide people’s willingness to express gratitude, this was not supported. We believe
0
1
2
3
4
5
6
7
8
9
10
SurpriseAbout
Receiving
SurpriseAbout
Content
Recipient’sMood
HowAwkward?
Competence Warmth
Ratin
g
Predicted
Actualr = .17
r = .07
r = .34**
r = .02
r = –.01 r = .10
Fig. 3. Results from Experiment 4: expressers’ predictions of recipients’ experiences receiving a letter of gratitude and recipients’ actual ratings. The correlation between predicted and actual ratings is reported for each item. All items were answered on response scales ranging from 0 to 10, except for mood, which was answered on a scale ranging from −5 (much more negative than normal) to 5 (much more positive than normal). We rescaled this item for this figure by adding 5 to each participant’s response. Asterisks indicate a significant correlation (p < .01). Error bars reflect standard errors.
Underappreciation 11
this occurred because surprise is more ambiguous than we anticipated. Instead of being positive, it could be perceived as negative by expressers concerned about competence. Consistent with this ambiguity, findings revealed that expressers’ predictions of surprise at the letter’s content and positive mood was nonsignificantly correlated in Experiments 1, 2, and 4 (rs = .17, .09, and .05, respectively, ps > .1). Recipients, however, seem to have interpreted surprise in a more positive fashion, as their reported surprise at the content of the letter was positively correlated with their reported positive mood in Experiments 1, 2, and 4 (rs = .32, .37, and .39, respec-tively, ps < .05). Future work will need to clarify the actual role of expected surprise as a potential barrier to prosocial actions.
We believe that our experiments provide strong evi-dence that people underestimate the positive impact of expressing gratitude on recipients, but they contain one important limitation common to naturalistic experi-ments: imperfect response rates. Not all gratitude recipi-ents completed our survey. This could lead to selection biases that produce misleading results. If people who responded were more positive than those who did not, then our estimate of the recipients’ experience would be positively biased. We do not, however, think this can explain our results for two reasons. First, express-ers’ predictions did not differ between those whose recipient did versus did not respond, even though expressers had some accurate insight into their recipi-ent’s unique reactions. Second, if nonresponses were coming from recipients who had systematically more negative reactions, then we would expect a smaller misprediction in experiments with higher response rates. This was not the case. Experiment 1 had a mean-ingfully higher response rate (87%) than Experiment 2 (63%), and yet the average misprediction on our key variables was larger in Experiment 1 (mean Cohen’s d = 0.54) than in Experiment 2 (mean Cohen’s d = 0.29). Experiment 4 had a similarly high response rate as Experiment 1 (81%) and a similar average effect size as well (mean Cohen’s d = 0.52). Ultimately, only an experiment with perfect response rates will com-pletely eliminate this concern, a difficult goal given the naturalistic approach to our studies.
Beyond whether or not to express gratitude, our results may also have implications for how people choose to express their gratitude. If people mistakenly anticipate a somewhat awkward interaction, then they may choose to express warmth through more psycho-logically distant communication media in which the awkwardness of a negative reaction might be dulled, such as in writing rather than in face-to-face interaction. The problem is that text-based media do not appear to communicate one’s sincere intention, positive emotion,
or deliberate thought as clearly as voice-based or face-to-face media (Hall & Schmid Mast, 2007; Kruger, Epley, Parker, & Ng, 2005; Schroeder & Epley, 2016; Zaki, Bolger, & Ochsner, 2009). If expected awkwardness is miscalibrated, then people might also choose media for communicating their gratitude that could be suboptimal as well (Kumar & Epley, 2018a). We believe this is an interesting avenue for future research.
Although we have focused on the prosocial action of expressing gratitude, the asymmetry in evaluations of competence versus warmth we identified in Experi-ment 4 suggests that misunderstanding about the con-sequences of prosocial interactions is more widespread. In existing research, people have underestimated the hedonic benefit of spending on others (Dunn et al., 2008), acting more extraverted (Zelenski et al., 2013), speaking to strangers (Epley & Schroeder, 2014), and performing random acts of kindness for others (Kumar & Epley, 2018b). In another experiment, we randomly assigned participants to express gratitude to another person or to share positive news with someone they knew. Although we observed a main effect in which gratitude recipients felt more positive than good news recipients, expressers were similarly miscalibrated in underestimating the positive impact of a positive social interaction: They significantly overestimated awkward-ness and underestimated positive mood to a similar extent. Another experiment we conducted asked people to send a card to someone “just because” (Kumar & Epley, 2018b). Participants wrote notes for the sake of checking in, cheering someone up, letting them know they were thinking of them, and so on. Here, too, par-ticipants underestimated the positive consequences of this warm, prosocial engagement with another person. We believe the asymmetry in attention to competence versus warmth could create mistaken expectations across a wide range of prosocial actions. If people engaging in prosocial actions are more concerned about competence than those benefiting from them, then our experimental results should be just one exam-ple of a broader tendency.
Positive social connections are a powerful source of well-being, and creating those connections can some-times come at little or no cost. However, they also require that people choose to engage in actions that strengthen social bonds, such as expressing gratitude. Miscalculating the positive impact of social connections on oneself, or on others, could keep people from being prosocial enough for their own well-being. Expressing gratitude may not buy everything, but it may buy more than people seem to expect.
Action Editor
Bill von Hippel served as action editor for this article.
12 Kumar, Epley
Author Contributions
A. Kumar and N. Epley generated the ideas for the study and designed the experiments. A. Kumar collected, analyzed, and interpreted the data under the supervision of N. Epley. Both authors wrote the manuscript and approved the final version of the manuscript for submission.
Acknowledgments
A. Kumar conducted this research while at The University of Chicago Booth School of Business but is now affiliated with The University of Texas at Austin.
Declaration of Conflicting Interests
The author(s) declared that there were no conflicts of interest with respect to the authorship or the publication of this article.
Supplemental Material
Additional supporting information can be found at http://journals.sagepub.com/doi/suppl/10.1177/0956797618772506
Open Practices
All data and materials have been made publicly available via the Open Science Framework and can be accessed at https://osf.io/md9fk/. The design and analysis plans for the experiments were preregistered at AsPredicted (introductory study: http://aspre dicted.org/blind.php?x=ex8wk8, main study: http://aspredicted .org/blind.php?x=ky357e, follow-up study: http://aspredicted .org/blind.php?x=xi5a8r). The complete Open Practices Disclo-sure for this article can be found at http://journals.sagepub .com/doi/suppl/10.1177/0956797618772506. This article has received badges for Open Data, Open Materials, and Prereg-istration. More information about the Open Practices badges can be found at http://www.psychologicalscience.org/publica tions/badges.
References
Becker, G. S. (1993). Nobel lecture: The economic way of looking at behavior. Journal of Political Economy, 101, 385–409.
Bernoulli, D. (1954). Exposition of a new theory on the mea-surement of risk. Econometrica, 22, 23–36.
Camerer, C., Loewenstein, G., & Weber, M. (1989). The curse of knowledge in economic settings: An experimental anal-ysis. Journal of Political Economy, 97, 1232–1254.
DeSteno, D., Li, Y., Dickens, L., & Lerner, J. S. (2014). Gratitude: A tool for reducing economic impatience. Psychological Science, 25, 1262–1267.
Dickens, L., & DeSteno, D. (2016). The grateful are patient: Heightened daily gratitude is associated with attenuated temporal discounting. Emotion, 16, 421–425.
Diener, E., & Seligman, M. E. P. (2002). Very happy people. Psychological Science, 13, 81–84.
Dunn, E. W., Aknin, L. B., & Norton, M. I. (2008). Spending money on others promotes happiness. Science, 319, 1687–1688.
Emmons, R. A., & McCullough, M. E. (2003). Counting bless-ings versus burdens: An experimental investigation of gratitude and subjective well-being in daily life. Journal of Personality and Social Psychology, 84, 377–389.
Epley, N., Keysar, B., Van Boven, L., & Gilovich, T. (2004). Perspective taking as egocentric anchoring and adjust-ment. Journal of Personality and Social Psychology, 87, 327–339.
Epley, N., & Schroeder, J. (2014). Mistakenly seeking soli-tude. Journal of Experimental Psychology: General, 143, 1980–1999.
Fiske, S. T., Cuddy, A. J. C., & Glick, P. (2007). Universal dimensions of social cognition: Warmth and competence. Trends in Cognitive Sciences, 11, 77–83.
Frey, B. S., & Stutzer, A. (2002). What can economists learn from happiness research? Journal of Economic Literature, 40, 402–435.
Gilbert, D. T., & Gill, M. J. (2000). The momentary realist. Psychological Science, 11, 394–398.
Hall, J. A., & Schmid Mast, M. (2007). Sources of accuracy in the empathic accuracy paradigm. Emotion, 7, 438–446.
Halsband, R. (Ed.). (1967). The complete letters of Lady Mary Wortley Montagu, Vol. III. Oxford, England: Oxford University Press.
Helliwell, J. F., & Putnam, R. D. (2004). The social context of well-being. Philosophical Transactions of the Royal Society B: Biological Sciences, 359, 1435–1446.
Holt-Lunstad, J., Smith, T. B., & Layton, J. B. (2010). Social relationships and mortality risk: A meta-analytic review. PLOS Medicine, 7(7), Article e1000316. doi:10.1371/journal .pmed.1000316
House, J. S., Landis, K. R., & Umberson, D. (1988). Social relationships and health. Science, 241, 540–545.
Kahneman, D., & Deaton, A. (2010). High income improves evaluation of life but not emotional well-being. Pro-ceedings of the National Academy of Sciences, USA, 107, 16489–16493.
Kruger, J., Epley, N., Parker, J., & Ng, Z. W. (2005). Egocentrism over e-mail: Can we communicate as well as we think? Journal of Personality and Social Psychology, 89, 925–936.
Kumar, A., & Epley, N. (2018a). It’s surprisingly nice to hear you: Miscalibrated expectations of connection and awk-wardness affect how people choose to connect with others. Manuscript submitted for publication.
Kumar, A., & Epley, N. (2018b). A little good goes a long(er) way (than expected): Differential construals of kindness by performers and recipients. Manuscript in preparation.
Luo, Y., Hawkley, L. C., Waite, L. J., & Cacioppo, J. T. (2012). Loneliness, health, and mortality in old age: A national longitudinal study. Social Science & Medicine, 74, 907–914.
Lyubomirsky, S., Dickerhoof, R., Boehm, J. K., & Sheldon, K. M. (2011). Becoming happier takes both a will and a proper way: An experimental longitudinal intervention to boost well-being. Emotion, 11, 391–402.
Myers, D. G. (2000). The funds, friends, and faith of happy people. American Psychologist, 55, 56–67.
Underappreciation 13
Ross, M., & Sicoly, F. (1979). Egocentric biases in availabil-ity and attribution. Journal of Personality and Social Psychology, 37, 322–336.
Schroeder, J., & Epley, N. (2016). Mistaking minds and machines: How speech affects dehumanization and anthropomorphism. Journal of Experimental Psychology: General, 145, 1427–1437.
Seligman, M. E., Steen, T. A., Park, N., & Peterson, C. (2005). Positive psychology progress: Empirical validation of interventions. American Psychologist, 60, 410–421.
Tamir, D. I., & Mitchell, J. P. (2013). Anchoring and adjust-ment during social inferences. Journal of Experimental Psychology: General, 142, 151–162.
Van Boven, L., Loewenstein, G., Dunning, D., & Nordgren, L. F. (2013). Changing places: A dual judgment model of
empathy gaps in emotional perspective taking. In J. M. Olson & M. P. Zanna (Eds.), Advances in experimental social psychol-ogy (Vol. 48, pp. 117–171). San Diego, CA: Academic Press.
Wojciszke, B. (1994). Multiple meanings of behavior: Con-struing actions in terms of competence or morality. Jou rnal of Personality and Social Psychology , 67, 222–232.
Zaki, J., Bolger, N., & Ochsner, K. (2009). Unpacking the informational bases of empathic accuracy. Emotion, 9, 478–487.
Zelenski, J. M., Wheland, D. C., Nealis, L. J., Besner, C. M., Santoro, M. S., & Wynn, J. E. (2013). Personality and affec-tive forecasting: Trait introverts underpredict the hedonic benefits of acting extraverted. Journal of Personality and Social Psychology, 104, 1092–1108.