![Index [ceramictiledesign.net]ceramictiledesign.net/wordpressnew/wp-content/... · *Stone* porcelain Platinum or ... Metal Gun Metal - D Antique Distressed Antique Mirror Blanc Bosseler](https://static.fdocuments.us/doc/165x107/5fb31219ea7a1a15c50e797c/index-stone-porcelain-platinum-or-metal-gun-metal-d-antique-distressed.jpg)
Understanding water management in platinum group metal ...
9
Journal of Power Sources 472 (2020) 228442 Available online 3 July 2020 0378-7753/© 2020 Elsevier B.V. All rights reserved. Understanding water management in platinum group metal-free electrodes using neutron imaging Siddharth Komini Babu a, * , Dusan Spernjak a , Rangachary Mukundan a , Daniel S. Hussey b , David L. Jacobson b , Hoon T. Chung a , Gang Wu c , Andrew J. Steinbach d , Shawn Litster e , Rod L. Borup a , Piotr Zelenay a a MPA-11, MPA, Los Alamos National Laboratory, Los Alamos, NM, 87545, USA b Physical Measurement Laboratory, National Institute of Standards and Technology, 100 Bureau Drive, Gaithersburg, MD, 20899, USA c Department of Chemical and Biological Engineering, University at Buffalo, The State University of New York, Buffalo, NY, 14260, USA d 3M Company, Fuel Cell Components Program, 3M Center, St. Paul, MN, 55144, USA e Department of Mechanical Engineering, Carnegie Mellon University, Pittsburgh, PA, 15213, USA HIGHLIGHTS G R A P H I C A L ABSTRACT � Understand water management in thick PGM-free fuel cell cathode electrodes. � In-operando neutron imaging to esti- mate water content in components of fuel cell. � Performance improvement by enhancing water removal in flooded PGM-free electrode. � Improved water removal through novel microporous layer with hydrophilic additives. � Increasing catalyst porosity lowers saturation and hence improving gas transport. A R T I C L E INFO Keywords: Water imaging Fuel cell Pgm-free catalyst Thick electrodes Polymer electrolyte membranes ABSTRACT Platinum group metal-free (PGM-free) catalysts are a low-cost alternative to expensive PGM catalysts for polymer electrolyte fuel cells. However, due to the low volumetric activity of PGM-free catalysts, the catalyst layer thickness of the PGM-free catalyst electrode is an order of magnitude higher than PGM based electrodes. The thick PGM-free electrodes suffer from increased transport resistance and poor water management, which ulti- mately limits the fuel cell performance. This manuscript presents the study of water management in the PGM-free electrodes to understand the transport limitations and improve fuel cell performance. In-operando neutron im- aging is performed to estimate the water content in different components across the fuel cell thickness. Water saturation in thick PGM electrodes, with similar catalyst layer thickness to PGM-free electrodes, is lower than in the PGM-free electrodes irrespective of the operating conditions, due to high water retention by PGM-free cat- alysts. Improvements in fuel cell performance are accomplished by enhancing water removal from the flooded PGM-free electrode in three ways: (i) enhanced water removal with a novel microporous layer with hydrophilic pathways incorporated through hydrophilic additives, (ii) water removal through anode via novel GDL in the anode, and (iii) lower water saturation in PGM-free electrode structures with increased catalyst porosity. * Corresponding author. E-mail address: [email protected] (S. Komini Babu). Contents lists available at ScienceDirect Journal of Power Sources journal homepage: www.elsevier.com/locate/jpowsour https://doi.org/10.1016/j.jpowsour.2020.228442 Received 2 March 2020; Received in revised form 22 May 2020; Accepted 28 May 2020
Transcript of Understanding water management in platinum group metal ...
Journal of Power Sources 472 (2020) 228442
Available online 3 July 20200378-7753/© 2020 Elsevier B.V. All rights reserved.
Understanding water management in platinum group metal-free electrodes using neutron imaging
Siddharth Komini Babu a,*, Dusan Spernjak a, Rangachary Mukundan a, Daniel S. Hussey b, David L. Jacobson b, Hoon T. Chung a, Gang Wu c, Andrew J. Steinbach d, Shawn Litster e, Rod L. Borup a, Piotr Zelenay a
a MPA-11, MPA, Los Alamos National Laboratory, Los Alamos, NM, 87545, USA b Physical Measurement Laboratory, National Institute of Standards and Technology, 100 Bureau Drive, Gaithersburg, MD, 20899, USA c Department of Chemical and Biological Engineering, University at Buffalo, The State University of New York, Buffalo, NY, 14260, USA d 3M Company, Fuel Cell Components Program, 3M Center, St. Paul, MN, 55144, USA e Department of Mechanical Engineering, Carnegie Mellon University, Pittsburgh, PA, 15213, USA
H I G H L I G H T S G R A P H I C A L A B S T R A C T
� Understand water management in thick PGM-free fuel cell cathode electrodes. � In-operando neutron imaging to esti-
mate water content in components of fuel cell. � Performance improvement by
enhancing water removal in flooded PGM-free electrode. � Improved water removal through novel
microporous layer with hydrophilic additives. � Increasing catalyst porosity lowers
saturation and hence improving gas transport.
A R T I C L E I N F O
Keywords: Water imaging Fuel cell Pgm-free catalyst Thick electrodes Polymer electrolyte membranes
A B S T R A C T
Platinum group metal-free (PGM-free) catalysts are a low-cost alternative to expensive PGM catalysts for polymer electrolyte fuel cells. However, due to the low volumetric activity of PGM-free catalysts, the catalyst layer thickness of the PGM-free catalyst electrode is an order of magnitude higher than PGM based electrodes. The thick PGM-free electrodes suffer from increased transport resistance and poor water management, which ulti-mately limits the fuel cell performance. This manuscript presents the study of water management in the PGM-free electrodes to understand the transport limitations and improve fuel cell performance. In-operando neutron im-aging is performed to estimate the water content in different components across the fuel cell thickness. Water saturation in thick PGM electrodes, with similar catalyst layer thickness to PGM-free electrodes, is lower than in the PGM-free electrodes irrespective of the operating conditions, due to high water retention by PGM-free cat-alysts. Improvements in fuel cell performance are accomplished by enhancing water removal from the flooded PGM-free electrode in three ways: (i) enhanced water removal with a novel microporous layer with hydrophilic pathways incorporated through hydrophilic additives, (ii) water removal through anode via novel GDL in the anode, and (iii) lower water saturation in PGM-free electrode structures with increased catalyst porosity.
* Corresponding author. E-mail address: [email protected] (S. Komini Babu).
Contents lists available at ScienceDirect
Journal of Power Sources
journal homepage: www.elsevier.com/locate/jpowsour
https://doi.org/10.1016/j.jpowsour.2020.228442 Received 2 March 2020; Received in revised form 22 May 2020; Accepted 28 May 2020
Journal of Power Sources 472 (2020) 228442
2
1. Introduction
Electrification of the transportation sector has seen a dramatic rise due to the increased demand for more efficient vehicles with cleaner emissions. Electric vehicles powered using polymer electrolyte mem-brane fuel cells (PEMFCs) provide a significant number of advantages, including longer range than pure battery electric vehicles, zero emis-sions, and high energy density. PEMFC operation is based on the hydrogen oxidation reaction (HOR) occurring at the anode and the ox-ygen reduction reaction (ORR) occurring at the cathode [1]. A signifi-cant amount of catalyst is required to perform the sluggish ORR at the cathode when compared to the HOR at the anode. The high cost asso-ciated with Pt-based materials is still a barrier to achieve a target cost of $30/kW by 2030 estimated by the United States Department of Energy (DOE) [2]. To facilitate widespread commercialization of PEMFCs, there is a crucial need to substantially reduce or replace the Pt content, especially in the cathode.
Platinum group metal-free (PGM-free) catalysts synthesized from the pyrolysis of low-cost precursors mainly comprising of a nitrogen- containing polymeric backbone organic precursor, carbon black, and transition metal salts can significantly reduce the cost of PEMFCs. Over the last decade, there has been substantial progress in the development of PGM-free catalysts [3–7]. However, due to low turnover frequency (TOF) and/or active site density, the PGM-free catalyst layer (CL) re-quires an order of magnitude thicker electrode than the Pt-based elec-trode to generate comparable PEMFC performance. As a result, PGM-free electrodes are prone to increased gas and ionic transport resistance, limiting the high current density performance [8–10]. Therefore, further understanding of these mass transport limitations is required to make changes to the electrode architecture, which will improve the PGM-free electrode fuel cell performance. The morphology of the PGM-free CL in a PEMFC can significantly affect the performance of the fuel cell. Ionomer loading, equivalent weight, catalyst porosity, morphology, and catalyst loading have a significant effect on the per-formance of the electrode [11–14]. Modeling studies have suggested a significant improvement in PEMFC performance when the water satu-ration in the CL of the PGM-free electrode is reduced. Water content in the PGM-free CL has been observed to affect both the performance and durability of the electrode [15–17]. Due to the hydrophilic nature of the PGM-free catalyst surface, the CL retains significantly more water than conventional carbon-supported Pt catalyst, increasing its transport resistance by flooding and reducing the accessibility to the active sites. Neutron imaging has been widely used to study water in operating fuel cells (in-operando) due to the ability of neutrons to penetrate the fuel cell hardware as opposed to the specialized hardware required for in-situ X-ray imaging [18–20]. Previously neutron imaging [21–24] has been used to study the ice formation during sub-zero operation [25–27]; cold-start [28]; water content in polymer electrolyte membrane [29,30]; effect of channel wettability [31]; water management in gas diffusion layers (GDLs) [32,33], microporous layers (MPLs) [34,35]; liquid accumulation with dead ended anode [36]; flow distribution [37,38]; and changes in water management in the MEA due to carbon corrosion [39,40]. Quentin et al. has combined the neutron imaging with com-bined temperature and current mapping to study the correlation water transport mechanism with the operating conditions [41,42]. Neutron imaging has been extended to 3D neutron tomography by 360-degree rotation of the hardware during imaging [27,43,44]. For thick PGM-free CLs, neutron imaging can be a valuable tool to study the effect of parameters like morphology, operating conditions, electrode fabri-cation, and electrode components on water management.
In this work, we study water management in-operando in thick PGM- free catalyst electrodes to understand the transport limitations of these thick electrodes to improve the fuel cell performance. Fuel cell perfor-mance and water management are measured for (i) PGM and PGM-free electrodes with a similar thickness (with other components such as GDL identical); (ii) PGM-free electrodes with different GDL materials, namely
with and without hydrophilic additives in the MPL; (iii) in PGM-free catalysts with different porosity (and surface area); and (iv) in PGM- free CLs with different catalyst loading.
2. Experimental methods
2.1. Catalyst synthesis
PANI-Fe-C: The synthesis of PANI-Fe-C is described in detail in Ref. [5]. In brief, Ketjenblack® EC 300J was treated in an HCl solution, to remove impurities, for 24 h. In a 0.5 M solution of HCl, aniline and the treated carbon were dispersed and maintained at 10 �C. Ammonium peroxydisulfate was added as an oxidant, followed by FeCl3 as a source for transition metal. The suspension was stirred continuously for 24 h and then dried in a rotary evaporator. The dried precursor was heat-treated in an inert environment (N2) at 900 �C for 1 h. The heat-treated catalyst was added to 0.5 M solution of H2SO4, to leach inactive impurities from the catalyst, and maintained at 80 �C for 8 h. The catalyst was filtered and then heated treated at 900 �C in N2 at-mosphere for 3 h.
CM-PANI-Fe-C: The CM-PANI-Fe-C synthesis is described in detail in Ref. [45]. In brief, aniline was added to a 1.5 M HCl solution followed by FeCl3 and cyanamide. The suspension was stirred at room temperature, and ammonium peroxydisulfate was added as an oxidant. After 4 h, carbon (Black Pearls 2000), which was pretreated in concentrated HNO3 solution for 8 h, was added to the suspension. The suspension was dried by heating at 80 �C. The precursor was heat-treated at 900 �C for 1 h in N2 atmosphere. The heat-treated catalyst was ground and then treated in 0.5 M H2SO4 for 8 h. The leached catalyst was washed in DI water and dried at 90 �C in a vacuum oven. The catalyst was heat-treated for a second time at 900 �C for 3 h in N2 atmosphere.
2.2. MEA fabrication and testing
The PGM-free catalyst ink was prepared by ultrasonically mixing the catalyst powder with Nafion® suspension for 4 h. The ink was then painted on to the gas diffusion layer (carbon cloth GDL, ELAT LT 1400W, E-TEK) by successive brush-painting until the cathode catalyst loading reached ca. 4 mg cm� 2. The Nafion® loading in the dry catalyst layer was maintained at ca. 35 wt %. The Pt/C reference MEA also was fabricated by painting an ink using 20% Pt/C (TKK, TEC10V20E) cata-lyst onto a GDL until the total carbon loading reached 4.0 mg cm� 2 (0.8 mg cm� 2 of Pt). Commercial Pt-catalyzed carbon cloth GDL (E-TEK, 0.25 mgPt.cm� 2) was used as the anode GDE. The cathode and anode GDEs were hot-pressed onto a Nafion®117 membrane to form a membrane- electrode assembly (MEA). The thicker membrane was used deliber-ately in the neutron imaging experiments to improve the delineation of water between the various fuel cell components. The types of GDLs used in this work, and their structural properties are presented in Table S2.
For cathode catalyst coated membrane (CCM) electrodes, the ink was painted directly onto a Nafion®212 membrane. The anode CCM was painted onto a separate Nafion®211 membrane. The MEA was prepared by hot pressing the cathode and anode CCMs along with the GDLs.
The active area of the MEA is 2.5 cm2, which matches the single serpentine flow field area (see Fig. 1 in Ref. [33]). The fuel cell was tested at 80 �C and 3 atm absolute pressure. The H2/air gas flows are in co-flow configuration with a fixed flow rate of 100 and 200 sccm on anode and cathode, respectively. Only representative points on the po-larization curve were recorded while simultaneously recording the water distribution (described in the next section). For complete polari-zation curve for PANI-Fe-C and CM-PANI-Fe-C see Fig. 3 in Ref. [5] and Fig. 2 in Refs. [3], respectively. The performance of the MEA were recorded during the Neutron imaging and averaged over the 30 min time period for each condition which followed a transition period of 15mins under each condition.
EIS, the cell was held at steady state condition for at least 45 min. EIS
S. Komini Babu et al.
Journal of Power Sources 472 (2020) 228442
3
was recorded using a Zahner potentiostat, where these small 2.5 cm2
cells were either run in the galvanostatic mode at the reported current density or in a potentiostatic mode at a fixed voltage where the average current density during the experiment was reported. The AC amplitude was �10 mV in the potentiostatic mode and �10 mA in the galvanostatic mode. Frequency range covered is from 500 mHz to 10 kHz, with 8 steps per decade. The transmission circuit analysis has been performed similar to that reported in ref [46].
2.3. Neutron imaging
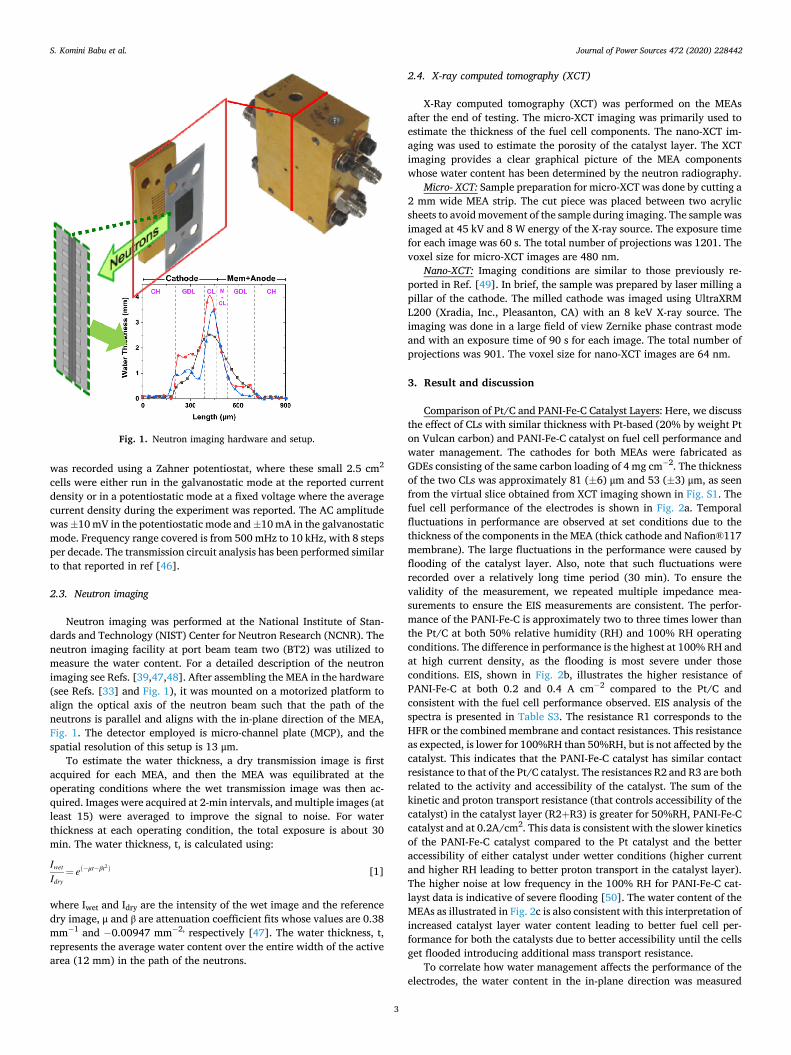
Neutron imaging was performed at the National Institute of Stan-dards and Technology (NIST) Center for Neutron Research (NCNR). The neutron imaging facility at port beam team two (BT2) was utilized to measure the water content. For a detailed description of the neutron imaging see Refs. [39,47,48]. After assembling the MEA in the hardware (see Refs. [33] and Fig. 1), it was mounted on a motorized platform to align the optical axis of the neutron beam such that the path of the neutrons is parallel and aligns with the in-plane direction of the MEA, Fig. 1. The detector employed is micro-channel plate (MCP), and the spatial resolution of this setup is 13 μm.
To estimate the water thickness, a dry transmission image is first acquired for each MEA, and then the MEA was equilibrated at the operating conditions where the wet transmission image was then ac-quired. Images were acquired at 2-min intervals, and multiple images (at least 15) were averaged to improve the signal to noise. For water thickness at each operating condition, the total exposure is about 30 min. The water thickness, t, is calculated using:
Iwet
Idry¼ eð� μt� βt2Þ [1]
where Iwet and Idry are the intensity of the wet image and the reference dry image, μ and β are attenuation coefficient fits whose values are 0.38 mm� 1 and � 0.00947 mm� 2, respectively [47]. The water thickness, t, represents the average water content over the entire width of the active area (12 mm) in the path of the neutrons.
2.4. X-ray computed tomography (XCT)
X-Ray computed tomography (XCT) was performed on the MEAs after the end of testing. The micro-XCT imaging was primarily used to estimate the thickness of the fuel cell components. The nano-XCT im-aging was used to estimate the porosity of the catalyst layer. The XCT imaging provides a clear graphical picture of the MEA components whose water content has been determined by the neutron radiography.
Micro- XCT: Sample preparation for micro-XCT was done by cutting a 2 mm wide MEA strip. The cut piece was placed between two acrylic sheets to avoid movement of the sample during imaging. The sample was imaged at 45 kV and 8 W energy of the X-ray source. The exposure time for each image was 60 s. The total number of projections was 1201. The voxel size for micro-XCT images are 480 nm.
Nano-XCT: Imaging conditions are similar to those previously re-ported in Ref. [49]. In brief, the sample was prepared by laser milling a pillar of the cathode. The milled cathode was imaged using UltraXRM L200 (Xradia, Inc., Pleasanton, CA) with an 8 keV X-ray source. The imaging was done in a large field of view Zernike phase contrast mode and with an exposure time of 90 s for each image. The total number of projections was 901. The voxel size for nano-XCT images are 64 nm.
3. Result and discussion
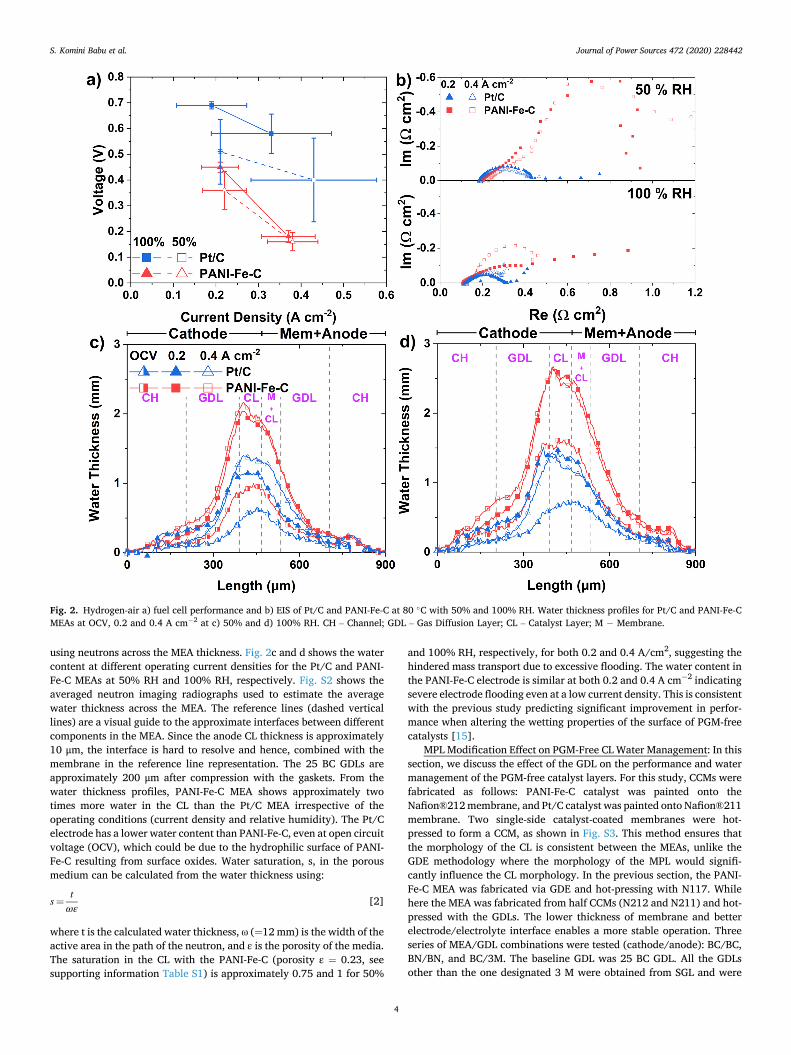
Comparison of Pt/C and PANI-Fe-C Catalyst Layers: Here, we discuss the effect of CLs with similar thickness with Pt-based (20% by weight Pt on Vulcan carbon) and PANI-Fe-C catalyst on fuel cell performance and water management. The cathodes for both MEAs were fabricated as GDEs consisting of the same carbon loading of 4 mg cm� 2. The thickness of the two CLs was approximately 81 (�6) μm and 53 (�3) μm, as seen from the virtual slice obtained from XCT imaging shown in Fig. S1. The fuel cell performance of the electrodes is shown in Fig. 2a. Temporal fluctuations in performance are observed at set conditions due to the thickness of the components in the MEA (thick cathode and Nafion®117 membrane). The large fluctuations in the performance were caused by flooding of the catalyst layer. Also, note that such fluctuations were recorded over a relatively long time period (30 min). To ensure the validity of the measurement, we repeated multiple impedance mea-surements to ensure the EIS measurements are consistent. The perfor-mance of the PANI-Fe-C is approximately two to three times lower than the Pt/C at both 50% relative humidity (RH) and 100% RH operating conditions. The difference in performance is the highest at 100% RH and at high current density, as the flooding is most severe under those conditions. EIS, shown in Fig. 2b, illustrates the higher resistance of PANI-Fe-C at both 0.2 and 0.4 A cm� 2 compared to the Pt/C and consistent with the fuel cell performance observed. EIS analysis of the spectra is presented in Table S3. The resistance R1 corresponds to the HFR or the combined membrane and contact resistances. This resistance as expected, is lower for 100%RH than 50%RH, but is not affected by the catalyst. This indicates that the PANI-Fe-C catalyst has similar contact resistance to that of the Pt/C catalyst. The resistances R2 and R3 are both related to the activity and accessibility of the catalyst. The sum of the kinetic and proton transport resistance (that controls accessibility of the catalyst) in the catalyst layer (R2þR3) is greater for 50%RH, PANI-Fe-C catalyst and at 0.2A/cm2. This data is consistent with the slower kinetics of the PANI-Fe-C catalyst compared to the Pt catalyst and the better accessibility of either catalyst under wetter conditions (higher current and higher RH leading to better proton transport in the catalyst layer). The higher noise at low frequency in the 100% RH for PANI-Fe-C cat-layst data is indicative of severe flooding [50]. The water content of the MEAs as illustrated in Fig. 2c is also consistent with this interpretation of increased catalyst layer water content leading to better fuel cell per-formance for both the catalysts due to better accessibility until the cells get flooded introducing additional mass transport resistance.
To correlate how water management affects the performance of the electrodes, the water content in the in-plane direction was measured
Fig. 1. Neutron imaging hardware and setup.
S. Komini Babu et al.
Journal of Power Sources 472 (2020) 228442
4
using neutrons across the MEA thickness. Fig. 2c and d shows the water content at different operating current densities for the Pt/C and PANI- Fe-C MEAs at 50% RH and 100% RH, respectively. Fig. S2 shows the averaged neutron imaging radiographs used to estimate the average water thickness across the MEA. The reference lines (dashed vertical lines) are a visual guide to the approximate interfaces between different components in the MEA. Since the anode CL thickness is approximately 10 μm, the interface is hard to resolve and hence, combined with the membrane in the reference line representation. The 25 BC GDLs are approximately 200 μm after compression with the gaskets. From the water thickness profiles, PANI-Fe-C MEA shows approximately two times more water in the CL than the Pt/C MEA irrespective of the operating conditions (current density and relative humidity). The Pt/C electrode has a lower water content than PANI-Fe-C, even at open circuit voltage (OCV), which could be due to the hydrophilic surface of PANI- Fe-C resulting from surface oxides. Water saturation, s, in the porous medium can be calculated from the water thickness using:
s¼t
ωε [2]
where t is the calculated water thickness, ω (¼12 mm) is the width of the active area in the path of the neutron, and ε is the porosity of the media. The saturation in the CL with the PANI-Fe-C (porosity ε ¼ 0.23, see supporting information Table S1) is approximately 0.75 and 1 for 50%
and 100% RH, respectively, for both 0.2 and 0.4 A/cm2, suggesting the hindered mass transport due to excessive flooding. The water content in the PANI-Fe-C electrode is similar at both 0.2 and 0.4 A cm� 2 indicating severe electrode flooding even at a low current density. This is consistent with the previous study predicting significant improvement in perfor-mance when altering the wetting properties of the surface of PGM-free catalysts [15].
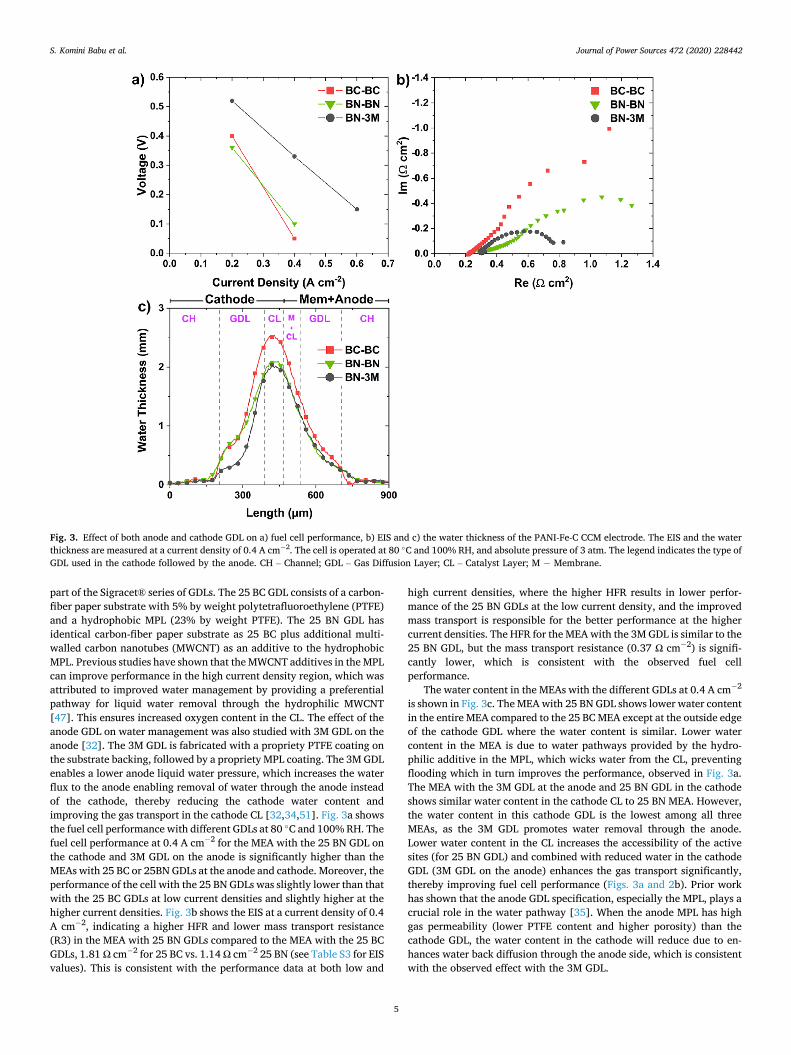
MPL Modification Effect on PGM-Free CL Water Management: In this section, we discuss the effect of the GDL on the performance and water management of the PGM-free catalyst layers. For this study, CCMs were fabricated as follows: PANI-Fe-C catalyst was painted onto the Nafion®212 membrane, and Pt/C catalyst was painted onto Nafion®211 membrane. Two single-side catalyst-coated membranes were hot- pressed to form a CCM, as shown in Fig. S3. This method ensures that the morphology of the CL is consistent between the MEAs, unlike the GDE methodology where the morphology of the MPL would signifi-cantly influence the CL morphology. In the previous section, the PANI- Fe-C MEA was fabricated via GDE and hot-pressing with N117. While here the MEA was fabricated from half CCMs (N212 and N211) and hot- pressed with the GDLs. The lower thickness of membrane and better electrode/electrolyte interface enables a more stable operation. Three series of MEA/GDL combinations were tested (cathode/anode): BC/BC, BN/BN, and BC/3M. The baseline GDL was 25 BC GDL. All the GDLs other than the one designated 3 M were obtained from SGL and were
Fig. 2. Hydrogen-air a) fuel cell performance and b) EIS of Pt/C and PANI-Fe-C at 80 �C with 50% and 100% RH. Water thickness profiles for Pt/C and PANI-Fe-C MEAs at OCV, 0.2 and 0.4 A cm� 2 at c) 50% and d) 100% RH. CH – Channel; GDL – Gas Diffusion Layer; CL – Catalyst Layer; M � Membrane.
S. Komini Babu et al.
Journal of Power Sources 472 (2020) 228442
5
part of the Sigracet® series of GDLs. The 25 BC GDL consists of a carbon- fiber paper substrate with 5% by weight polytetrafluoroethylene (PTFE) and a hydrophobic MPL (23% by weight PTFE). The 25 BN GDL has identical carbon-fiber paper substrate as 25 BC plus additional multi-walled carbon nanotubes (MWCNT) as an additive to the hydrophobic MPL. Previous studies have shown that the MWCNT additives in the MPL can improve performance in the high current density region, which was attributed to improved water management by providing a preferential pathway for liquid water removal through the hydrophilic MWCNT [47]. This ensures increased oxygen content in the CL. The effect of the anode GDL on water management was also studied with 3M GDL on the anode [32]. The 3M GDL is fabricated with a propriety PTFE coating on the substrate backing, followed by a propriety MPL coating. The 3M GDL enables a lower anode liquid water pressure, which increases the water flux to the anode enabling removal of water through the anode instead of the cathode, thereby reducing the cathode water content and improving the gas transport in the cathode CL [32,34,51]. Fig. 3a shows the fuel cell performance with different GDLs at 80 �C and 100% RH. The fuel cell performance at 0.4 A cm� 2 for the MEA with the 25 BN GDL on the cathode and 3M GDL on the anode is significantly higher than the MEAs with 25 BC or 25BN GDLs at the anode and cathode. Moreover, the performance of the cell with the 25 BN GDLs was slightly lower than that with the 25 BC GDLs at low current densities and slightly higher at the higher current densities. Fig. 3b shows the EIS at a current density of 0.4 A cm� 2, indicating a higher HFR and lower mass transport resistance (R3) in the MEA with 25 BN GDLs compared to the MEA with the 25 BC GDLs, 1.81 Ω cm� 2 for 25 BC vs. 1.14 Ω cm� 2 25 BN (see Table S3 for EIS values). This is consistent with the performance data at both low and
high current densities, where the higher HFR results in lower perfor-mance of the 25 BN GDLs at the low current density, and the improved mass transport is responsible for the better performance at the higher current densities. The HFR for the MEA with the 3M GDL is similar to the 25 BN GDL, but the mass transport resistance (0.37 Ω cm� 2) is signifi-cantly lower, which is consistent with the observed fuel cell performance.
The water content in the MEAs with the different GDLs at 0.4 A cm� 2
is shown in Fig. 3c. The MEA with 25 BN GDL shows lower water content in the entire MEA compared to the 25 BC MEA except at the outside edge of the cathode GDL where the water content is similar. Lower water content in the MEA is due to water pathways provided by the hydro-philic additive in the MPL, which wicks water from the CL, preventing flooding which in turn improves the performance, observed in Fig. 3a. The MEA with the 3M GDL at the anode and 25 BN GDL in the cathode shows similar water content in the cathode CL to 25 BN MEA. However, the water content in this cathode GDL is the lowest among all three MEAs, as the 3M GDL promotes water removal through the anode. Lower water content in the CL increases the accessibility of the active sites (for 25 BN GDL) and combined with reduced water in the cathode GDL (3M GDL on the anode) enhances the gas transport significantly, thereby improving fuel cell performance (Figs. 3a and 2b). Prior work has shown that the anode GDL specification, especially the MPL, plays a crucial role in the water pathway [35]. When the anode MPL has high gas permeability (lower PTFE content and higher porosity) than the cathode GDL, the water content in the cathode will reduce due to en-hances water back diffusion through the anode side, which is consistent with the observed effect with the 3M GDL.
Fig. 3. Effect of both anode and cathode GDL on a) fuel cell performance, b) EIS and c) the water thickness of the PANI-Fe-C CCM electrode. The EIS and the water thickness are measured at a current density of 0.4 A cm� 2. The cell is operated at 80 �C and 100% RH, and absolute pressure of 3 atm. The legend indicates the type of GDL used in the cathode followed by the anode. CH – Channel; GDL – Gas Diffusion Layer; CL – Catalyst Layer; M � Membrane.
S. Komini Babu et al.
Journal of Power Sources 472 (2020) 228442
6
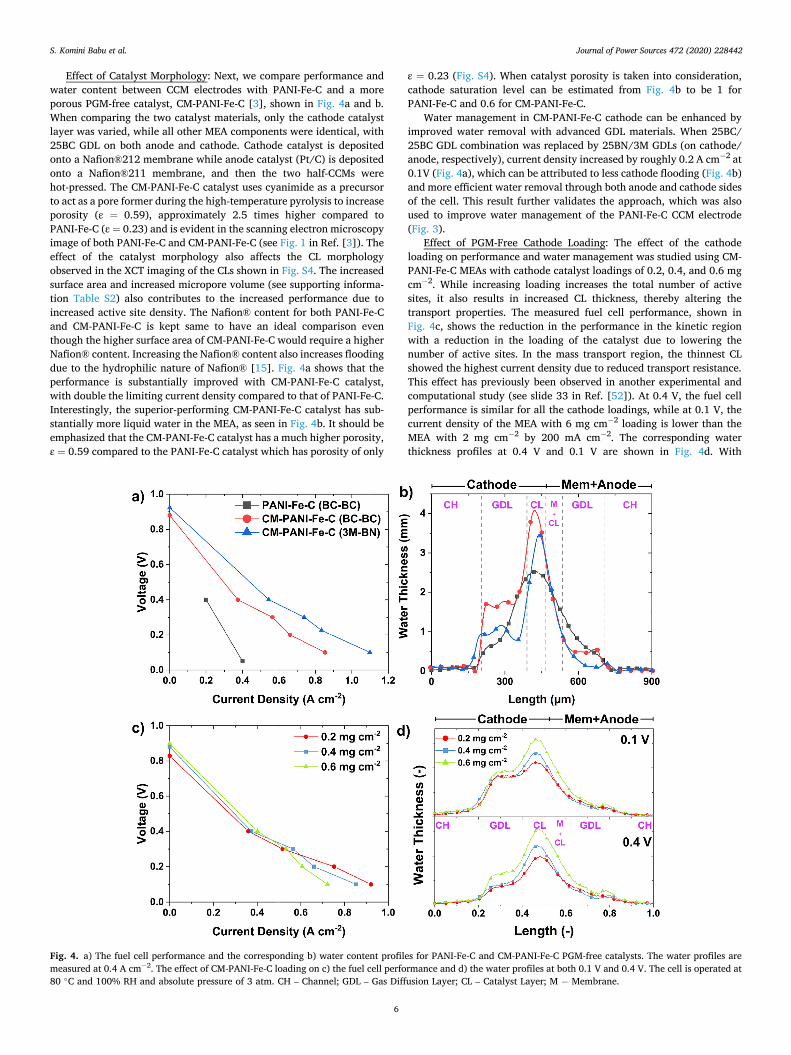
Effect of Catalyst Morphology: Next, we compare performance and water content between CCM electrodes with PANI-Fe-C and a more porous PGM-free catalyst, CM-PANI-Fe-C [3], shown in Fig. 4a and b. When comparing the two catalyst materials, only the cathode catalyst layer was varied, while all other MEA components were identical, with 25BC GDL on both anode and cathode. Cathode catalyst is deposited onto a Nafion®212 membrane while anode catalyst (Pt/C) is deposited onto a Nafion®211 membrane, and then the two half-CCMs were hot-pressed. The CM-PANI-Fe-C catalyst uses cyanimide as a precursor to act as a pore former during the high-temperature pyrolysis to increase porosity (ε ¼ 0.59), approximately 2.5 times higher compared to PANI-Fe-C (ε ¼ 0.23) and is evident in the scanning electron microscopy image of both PANI-Fe-C and CM-PANI-Fe-C (see Fig. 1 in Ref. [3]). The effect of the catalyst morphology also affects the CL morphology observed in the XCT imaging of the CLs shown in Fig. S4. The increased surface area and increased micropore volume (see supporting informa-tion Table S2) also contributes to the increased performance due to increased active site density. The Nafion® content for both PANI-Fe-C and CM-PANI-Fe-C is kept same to have an ideal comparison even though the higher surface area of CM-PANI-Fe-C would require a higher Nafion® content. Increasing the Nafion® content also increases flooding due to the hydrophilic nature of Nafion® [15]. Fig. 4a shows that the performance is substantially improved with CM-PANI-Fe-C catalyst, with double the limiting current density compared to that of PANI-Fe-C. Interestingly, the superior-performing CM-PANI-Fe-C catalyst has sub-stantially more liquid water in the MEA, as seen in Fig. 4b. It should be emphasized that the CM-PANI-Fe-C catalyst has a much higher porosity, ε ¼ 0.59 compared to the PANI-Fe-C catalyst which has porosity of only
ε ¼ 0.23 (Fig. S4). When catalyst porosity is taken into consideration, cathode saturation level can be estimated from Fig. 4b to be 1 for PANI-Fe-C and 0.6 for CM-PANI-Fe-C.
Water management in CM-PANI-Fe-C cathode can be enhanced by improved water removal with advanced GDL materials. When 25BC/ 25BC GDL combination was replaced by 25BN/3M GDLs (on cathode/ anode, respectively), current density increased by roughly 0.2 A cm� 2 at 0.1V (Fig. 4a), which can be attributed to less cathode flooding (Fig. 4b) and more efficient water removal through both anode and cathode sides of the cell. This result further validates the approach, which was also used to improve water management of the PANI-Fe-C CCM electrode (Fig. 3).
Effect of PGM-Free Cathode Loading: The effect of the cathode loading on performance and water management was studied using CM- PANI-Fe-C MEAs with cathode catalyst loadings of 0.2, 0.4, and 0.6 mg cm� 2. While increasing loading increases the total number of active sites, it also results in increased CL thickness, thereby altering the transport properties. The measured fuel cell performance, shown in Fig. 4c, shows the reduction in the performance in the kinetic region with a reduction in the loading of the catalyst due to lowering the number of active sites. In the mass transport region, the thinnest CL showed the highest current density due to reduced transport resistance. This effect has previously been observed in another experimental and computational study (see slide 33 in Ref. [52]). At 0.4 V, the fuel cell performance is similar for all the cathode loadings, while at 0.1 V, the current density of the MEA with 6 mg cm� 2 loading is lower than the MEA with 2 mg cm� 2 by 200 mA cm� 2. The corresponding water thickness profiles at 0.4 V and 0.1 V are shown in Fig. 4d. With
Fig. 4. a) The fuel cell performance and the corresponding b) water content profiles for PANI-Fe-C and CM-PANI-Fe-C PGM-free catalysts. The water profiles are measured at 0.4 A cm� 2. The effect of CM-PANI-Fe-C loading on c) the fuel cell performance and d) the water profiles at both 0.1 V and 0.4 V. The cell is operated at 80 �C and 100% RH and absolute pressure of 3 atm. CH – Channel; GDL – Gas Diffusion Layer; CL – Catalyst Layer; M � Membrane.
S. Komini Babu et al.
Journal of Power Sources 472 (2020) 228442
7
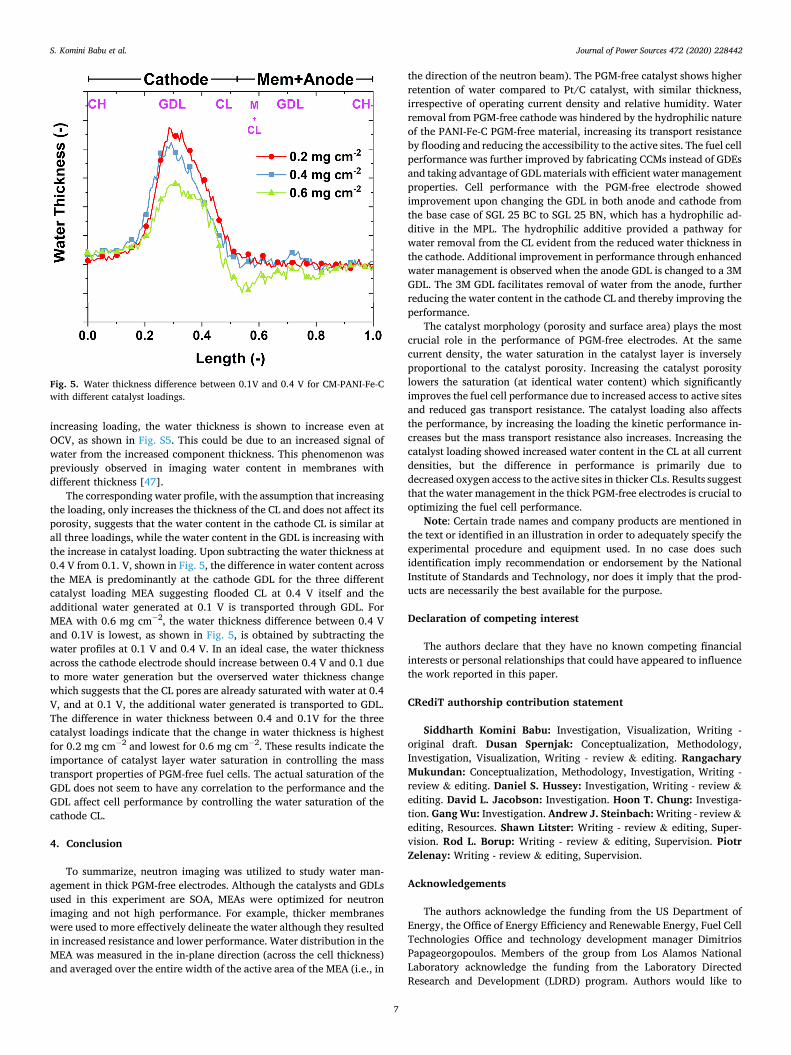
increasing loading, the water thickness is shown to increase even at OCV, as shown in Fig. S5. This could be due to an increased signal of water from the increased component thickness. This phenomenon was previously observed in imaging water content in membranes with different thickness [47].
The corresponding water profile, with the assumption that increasing the loading, only increases the thickness of the CL and does not affect its porosity, suggests that the water content in the cathode CL is similar at all three loadings, while the water content in the GDL is increasing with the increase in catalyst loading. Upon subtracting the water thickness at 0.4 V from 0.1. V, shown in Fig. 5, the difference in water content across the MEA is predominantly at the cathode GDL for the three different catalyst loading MEA suggesting flooded CL at 0.4 V itself and the additional water generated at 0.1 V is transported through GDL. For MEA with 0.6 mg cm� 2, the water thickness difference between 0.4 V and 0.1V is lowest, as shown in Fig. 5, is obtained by subtracting the water profiles at 0.1 V and 0.4 V. In an ideal case, the water thickness across the cathode electrode should increase between 0.4 V and 0.1 due to more water generation but the overserved water thickness change which suggests that the CL pores are already saturated with water at 0.4 V, and at 0.1 V, the additional water generated is transported to GDL. The difference in water thickness between 0.4 and 0.1V for the three catalyst loadings indicate that the change in water thickness is highest for 0.2 mg cm� 2 and lowest for 0.6 mg cm� 2. These results indicate the importance of catalyst layer water saturation in controlling the mass transport properties of PGM-free fuel cells. The actual saturation of the GDL does not seem to have any correlation to the performance and the GDL affect cell performance by controlling the water saturation of the cathode CL.
4. Conclusion
To summarize, neutron imaging was utilized to study water man-agement in thick PGM-free electrodes. Although the catalysts and GDLs used in this experiment are SOA, MEAs were optimized for neutron imaging and not high performance. For example, thicker membranes were used to more effectively delineate the water although they resulted in increased resistance and lower performance. Water distribution in the MEA was measured in the in-plane direction (across the cell thickness) and averaged over the entire width of the active area of the MEA (i.e., in
the direction of the neutron beam). The PGM-free catalyst shows higher retention of water compared to Pt/C catalyst, with similar thickness, irrespective of operating current density and relative humidity. Water removal from PGM-free cathode was hindered by the hydrophilic nature of the PANI-Fe-C PGM-free material, increasing its transport resistance by flooding and reducing the accessibility to the active sites. The fuel cell performance was further improved by fabricating CCMs instead of GDEs and taking advantage of GDL materials with efficient water management properties. Cell performance with the PGM-free electrode showed improvement upon changing the GDL in both anode and cathode from the base case of SGL 25 BC to SGL 25 BN, which has a hydrophilic ad-ditive in the MPL. The hydrophilic additive provided a pathway for water removal from the CL evident from the reduced water thickness in the cathode. Additional improvement in performance through enhanced water management is observed when the anode GDL is changed to a 3M GDL. The 3M GDL facilitates removal of water from the anode, further reducing the water content in the cathode CL and thereby improving the performance.
The catalyst morphology (porosity and surface area) plays the most crucial role in the performance of PGM-free electrodes. At the same current density, the water saturation in the catalyst layer is inversely proportional to the catalyst porosity. Increasing the catalyst porosity lowers the saturation (at identical water content) which significantly improves the fuel cell performance due to increased access to active sites and reduced gas transport resistance. The catalyst loading also affects the performance, by increasing the loading the kinetic performance in-creases but the mass transport resistance also increases. Increasing the catalyst loading showed increased water content in the CL at all current densities, but the difference in performance is primarily due to decreased oxygen access to the active sites in thicker CLs. Results suggest that the water management in the thick PGM-free electrodes is crucial to optimizing the fuel cell performance.
Note: Certain trade names and company products are mentioned in the text or identified in an illustration in order to adequately specify the experimental procedure and equipment used. In no case does such identification imply recommendation or endorsement by the National Institute of Standards and Technology, nor does it imply that the prod-ucts are necessarily the best available for the purpose.
Declaration of competing interest
The authors declare that they have no known competing financial interests or personal relationships that could have appeared to influence the work reported in this paper.
CRediT authorship contribution statement
Siddharth Komini Babu: Investigation, Visualization, Writing - original draft. Dusan Spernjak: Conceptualization, Methodology, Investigation, Visualization, Writing - review & editing. Rangachary Mukundan: Conceptualization, Methodology, Investigation, Writing - review & editing. Daniel S. Hussey: Investigation, Writing - review & editing. David L. Jacobson: Investigation. Hoon T. Chung: Investiga-tion. Gang Wu: Investigation. Andrew J. Steinbach: Writing - review & editing, Resources. Shawn Litster: Writing - review & editing, Super-vision. Rod L. Borup: Writing - review & editing, Supervision. Piotr Zelenay: Writing - review & editing, Supervision.
Acknowledgements
The authors acknowledge the funding from the US Department of Energy, the Office of Energy Efficiency and Renewable Energy, Fuel Cell Technologies Office and technology development manager Dimitrios Papageorgopoulos. Members of the group from Los Alamos National Laboratory acknowledge the funding from the Laboratory Directed Research and Development (LDRD) program. Authors would like to
Fig. 5. Water thickness difference between 0.1V and 0.4 V for CM-PANI-Fe-C with different catalyst loadings.
S. Komini Babu et al.
Journal of Power Sources 472 (2020) 228442
8
thank Ruediger-Bernd Schweiss from SGL Carbon for long-term collab-oration and for providing the MPLs and GDLs used in this study.
Members of NIST acknowledge U.S. Department of Commerce, the NIST Radiation and Physics Division, the Director’s office of NIST, the NIST Center for Neutron Research, and the Department of Energy interagency agreement No. DE_AI01-01EE50660. The nano-CT instru-ment was acquired with the support of a Major Research Infrastructure award from the National Science Foundation under Grant No. 1229090.
Appendix A. Supplementary data
Supplementary data to this article can be found online at https://doi. org/10.1016/j.jpowsour.2020.228442.
References
[1] K.L. More, R. Borup, K.S.S. Reeves, Identifying contributing degradation phenomena in PEM fuel cell membrane electrode assemblies via electron microscopy, ECS Transactions 1 (2006) 717–733, https://doi.org/10.1017/ CBO9781107415324.004.
[2] D. Papageorgopoulos, Fuel Cell R&D Overview, DOE Hydrogen and Fuel Cells Program FY2019 Annual Merit Review Proceedings, 2019.
[3] H.T. Chung, D.A. Cullen, D. Higgins, B.T. Sneed, E.F. Holby, K.L. More, P. Zelenay, Direct atomic-level insight into the active sites of a high-performance PGM-free ORR catalyst, Science 357 (2017) 479–484, https://doi.org/10.1126/science. aan2255.
[4] F. Jaouen, E. Proietti, M. Lef�evre, R. Chenitz, J.-P. Dodelet, G. Wu, H.T. Chung, C. M. Johnston, P. Zelenay, Recent advances in non-precious metal catalysis for oxygen-reduction reaction in polymer electrolyte fuelcells, Energy Environ. Sci. 4 (2011) 114–130, https://doi.org/10.1039/c0ee00011f.
[5] G. Wu, K.L. More, C.M. Johnston, P. Zelenay, High-performance electrocatalysts for oxygen reduction derived from polyaniline, iron, and cobalt, Science 332 (2011) 443–447, https://doi.org/10.1126/science.1200832.
[6] F. Jaouen, V. Goellner, M. Lef�evre, J. Herranz, E. Proietti, J.P. Dodelet, Oxygen reduction activities compared in rotating-disk electrode and proton exchange membrane fuel cells for highly active FeNC catalysts, Electrochim. Acta 87 (2013) 619–628, https://doi.org/10.1016/j.electacta.2012.09.057.
[7] A. Zitolo, V. Goellner, V. Armel, M.T. Sougrati, T. Mineva, L. Stievano, E. Fonda, F. Jaouen, Identification of catalytic sites for oxygen reduction in iron- and nitrogen-doped graphene materials, Nat. Mater. 14 (2015) 937–942, https://doi. org/10.1038/nmat4367.
[8] S. Komini Babu, H.T. Chung, G. Wu, P. Zelenay, S. Litster, Modeling hierarchical non-precious metal catalyst cathodes for PEFCs using multi-scale X-ray CT imaging, ECS Transactions 64 (2014) 281–292, https://doi.org/10.1149/06403.0281ecst.
[9] J.J. Liu, M.R. Talarposhti, T. Asset, D.C. Sabarirajan, D.Y. Parkinson, P. Atanassov, I.V. Zenyuk, Understanding the role of interfaces for water management in platinum group metal-free electrodes in polymer electrolyte fuel cells, ACS Appl. Energy Mater. 2 (2019) 3542–3553, https://doi.org/10.1021/acsaem.9b00292.
[10] H.A. Gasteiger, S.S. Kocha, B. Sompalli, F.T. Wagner, Activity benchmarks and requirements for Pt, Pt-alloy, and non-Pt oxygen reduction catalysts for PEMFCs, Appl. Catal. B Environ. 56 (2005) 9–35, https://doi.org/10.1016/j. apcatb.2004.06.021.
[11] S. Komini Babu, H.T. Chung, P. Zelenay, S. Litster, Resolving electrode morphology’s impact on platinum group metal-free cathode performance using nano-CT of 3D hierarchical pore and ionomer distribution, ACS Appl. Mater. Interfaces 8 (2016) 32764–32777, https://doi.org/10.1021/acsami.6b08844.
[12] S. Litster, Advanced PGM-free cathode engineering for high power density and durability, in: 2018 Annual Merit Review Proceedings, 2018.
[13] X. Yin, L. Lin, H.T. Chung, S.K. Babu, U. Martinez, G.M. Purdy, P. Zelenay, Effects of MEA fabrication and ionomer composition on fuel cell performance of PGM-free ORR catalyst, Selected Proceedings from the 231st Ecs Meeting 77 (2017) 1273–1281, https://doi.org/10.1149/07711.1273ecst.
[14] D. Banham, T. Kishimoto, Y. Zhou, T. Sato, K. Bai, J.I. Ozaki, Y. Imashiro, S. Ye, Critical advancements in achieving high power and stable nonprecious metal catalyst-based MEAs for real-world proton exchange membrane fuel cell applications, Sci Adv 4 (2018) eaar7180, https://doi.org/10.1126/sciadv.aar7180.
[15] S.K. Babu, H.T. Chung, P. Zelenay, S. Litster, Modeling electrochemical performance of the hierarchical morphology of precious group metal-free cathode for polymer electrolyte fuel cell, J. Electrochem. Soc. 164 (2017) F1037–F1049, https://doi.org/10.1149/2.0041712jes.
[16] U. Martinez, S.K. Babu, E.F. Holby, P. Zelenay, Durability challenges and perspective in the development of PGM-free electrocatalysts for the oxygen reduction reaction, Current Opinion in Electrochemistry 9 (2018) 224–232, https://doi.org/10.1016/j.coelec.2018.04.010.
[17] J.-Y. Choi, L. Yang, T. Kishimoto, X. Fu, S. Ye, Z. Chen, D. Banham, Is the rapid initial performance loss of Fe/N/C non precious metal catalysts due to micropore flooding? Energy Environ. Sci. 10 (2017) 296–305, https://doi.org/10.1039/ c6ee03005j.
[18] R.T. White, F.P. Orfino, M. El Hannach, O. Luo, M. Dutta, A.P. Young, E. Kjeang, 3D printed flow field and fixture for visualization of water distribution in fuel cells by
X-ray computed tomography, J. Electrochem. Soc. 163 (2016) F1337–F1343, https://doi.org/10.1149/2.0461613jes.
[19] G. Hinds, In situ diagnostics for polymer electrolyte membrane fuel cells, Current Opinion in Electrochemistry 5 (2017) 11–19.
[20] Q. Meyer, Y. Zeng, C. Zhao, In situ and operando characterization of proton exchange membrane fuel cells, Adv. Mater. 31 (2019) 1901900.
[21] A. Bazylak, Liquid water visualization in PEM fuel cells: a review, Int. J. Hydrogen Energy 34 (2009) 3845–3857, https://doi.org/10.1016/j.ijhydene.2009.02.084.
[22] P. Boillat, E.H. Lehmann, P. Trtik, M. Cochet, Neutron imaging of fuel cells - recent trends and future prospects, Current Opinion in Electrochemistry 5 (2017) 3–10, https://doi.org/10.1016/j.coelec.2017.07.012.
[23] R. Satija, D.L. Jacobson, M. Arif, S. Werner, In situ neutron imaging technique for evaluation of water management systems in operating PEM fuel cells, J. Power Sources 129 (2004) 238–245.
[24] D. Kramer, J. Zhang, R. Shimoi, E. Lehmann, A. Wokaun, K. Shinohara, G. G. Scherer, In situ diagnostic of two-phase flow phenomena in polymer electrolyte fuel cells by neutron imaging: Part A. Experimental, data treatment, and quantification, Electrochim. Acta 50 (2005) 2603–2614.
[25] N. Macauley, R.W. Lujan, D. Spernjak, D.S. Hussey, D.L. Jacobson, K. More, R. L. Borup, R. Mukundana, Durability of polymer electrolyte membrane fuel cells operated at subfreezing temperatures, J. Electrochem. Soc. 163 (2016) F1317–F1329, https://doi.org/10.1149/2.0191613jes.
[26] R. Mukundan, R.L. Borup, Visualising liquid water in PEM fuel cells using neutron imaging, Fuel Cell. 9 (2009) 499–505, https://doi.org/10.1002/fuce.200800050.
[27] A. Santamaria, H.Y. Tang, J.W. Park, G.G. Park, Y.J. Sohn, 3D neutron tomography of a polymer electrolyte membrane fuel cell under sub-zero conditions, Int. J. Hydrogen Energy 37 (2012) 10836–10843, https://doi.org/10.1016/j. ijhydene.2012.04.093.
[28] P. Oberholzer, P. Boillat, R. Siegrist, R. Perego, A. K€astner, E. Lehmann, G. Scherer, A. Wokaun, Cold-start of a PEFC visualized with high resolution dynamic in-plane neutron imaging, J. Electrochem. Soc. 159 (2011) B235–B245.
[29] D. Spernjak, P.P. Mukherjee, R. Mukundan, J. Davey, D.S. Hussey, D.L. Jacobson, R.L. Borup, Measurement of water content in polymer electrolyte membranes using high resolution neutron imaging, 33, Polymer Electrolyte Fuel Cells 10 (Pts 1 and 2) (2010), https://doi.org/10.1149/1.3484637, 1451.
[30] R. Bellows, M. Lin, M. Arif, A.K. Thompson, D. Jacobson, Neutron imaging technique for in situ measurement of water transport gradients within Nafion in polymer electrolyte fuel cells, J. Electrochem. Soc. 146 (1999) 1099–1103.
[31] A. Turhan, S. Kim, M. Hatzell, M.M. Mench, Impact of channel wall hydrophobicity on through-plane water distribution and flooding behavior in a polymer electrolyte fuel cell, Electrochim. Acta 55 (2010) 2734–2745, https://doi.org/10.1016/j. electacta.2009.11.095.
[32] A.J. Steinbach, J.S. Allen, R.L. Borup, D.S. Hussey, D.L. Jacobson, A. Komlev, A. Kwong, J. MacDonald, R. Mukundan, M.J. Pejsa, M. Roos, A.D. Santamaria, J. M. Sieracki, D. Spernjak, I.V. Zenyuk, A.Z. Weber, Anode-design strategies for improved performance of polymer-electrolyte fuel cells with ultra-thin electrodes, Joule 2 (2018) 1297–1312, https://doi.org/10.1016/j.joule.2018.03.022.
[33] R. Mukundan, J.R. Davey, T. Rockward, J.S. Spendelow, B. Pivovar, D.S. Hussey, D. L. Jacobson, M. Arif, R. Borup, Imaging of water profiles in PEM fuel cells using neutron radiography: effect of operating conditions and GDL composition, ECS Transactions 11 (2007) 411–422.
[34] D. Spernjak, R. Mukundan, R.L. Borup, L.G. Connolly, B.I. Zackin, V. De Andrade, M. Wojcik, D.Y. Parkinson, D.L. Jacobson, D.S. Hussey, K.L. More, T. Chan, A. Z. Weber, I.V. Zenyuk, Enhanced water management of polymer electrolyte fuel cells with additive-containing microporous layers, ACS Appl. Energy Mater. 1 (2018) 6006–6017, https://doi.org/10.1021/acsaem.8b01059.
[35] Q. Meyer, S. Ashton, P. Boillat, M. Cochet, E. Engebretsen, D.P. Finegan, X. Lu, J. J. Bailey, N. Mansor, R. Abdulaziz, O.O. Taiwo, R. Jervis, S. Torija, P. Benson, S. Foster, P. Adcock, P.R. Shearing, D.J.L. Brett, Effect of gas diffusion layer properties on water distribution across air-cooled, open-cathode polymer electrolyte fuel cells: a combined ex-situ X-ray tomography and in-operando neutron imaging study, Electrochim. Acta 211 (2016) 478–487, https://doi.org/ 10.1016/j.electacta.2016.06.068.
[36] J.B. Siegel, D.A. McKay, A.G. Stefanopoulou, D.S. Hussey, D.L. Jacobson, Measurement of liquid water accumulation in a PEMFC with dead-ended anode, J. Electrochem. Soc. 155 (2008) B1168–B1178.
[37] T. Kim, J. Kim, C. Sim, S. Lee, M. Kaviany, S. Son, M. Kim, Experimental approaches for distribution and behavior of water in PEMFC under flow direction and differential pressure using neutron imaging technique, Nucl. Instrum. Methods Phys. Res. Sect. A Accel. Spectrom. Detect. Assoc. Equip. 600 (2009) 325–327, https://doi.org/10.1016/j.nima.2008.11.083.
[38] D. Spernjak, A.K. Prasad, S.G. Advani, In situ comparison of water content and dynamics in parallel, single-serpentine, and interdigitated flow fields of polymer electrolyte membrane fuel cells, J. Power Sources 195 (2010) 3553–3568, https:// doi.org/10.1016/j.jpowsour.2009.12.031.
[39] J.D. Fairweather, D. Spernjak, A.Z. Weber, D. Harvey, S. Wessel, D.S. Hussey, D. L. Jacobson, K. Artyushkova, R. Mukundan, R.L. Borup, Effects of cathode corrosion on through-plane water transport in proton exchange membrane fuel cells, J. Electrochem. Soc. 160 (2013) F980–F993, https://doi.org/10.1149/ 2.024309jes.
[40] D. Spernjak, J. Fairweather, R. Mukundan, T. Rockward, R.L. Borup, Influence of the microporous layer on carbon corrosion in the catalyst layer of a polymer electrolyte membrane fuel cell, J. Power Sources 214 (2012) 386–398, https://doi. org/10.1016/j.jpowsour.2012.04.086.
[41] Q. Meyer, S. Ashton, R. Jervis, D.P. Finegan, P. Boillat, M. Cochet, O. Curnick, T. Reisch, P. Adcock, P.R. Shearing, The hydro-electro-thermal performance of air-
S. Komini Babu et al.
Journal of Power Sources 472 (2020) 228442
9
cooled, open-cathode polymer electrolyte fuel cells: combined localised current density, temperature and water mapping, Electrochim. Acta 180 (2015) 307–315.
[42] Q. Meyer, S. Ashton, S. Torija, C. Gurney, P. Boillat, M. Cochet, E. Engebretsen, D. P. Finegan, P. Adcock, P.R. Shearing, Nitrogen blanketing and hydrogen starvation in dead-ended-anode polymer electrolyte fuel cells revealed by hydro-electro- thermal analysis, Electrochim. Acta 203 (2016) 198–205.
[43] H.-Y. Tang, A. Santamaria, J. Kurniawan, J.W. Park, T.-H. Yang, Y.-J. Sohn, Developing a 3D neutron tomography method for proton exchange membrane fuel cells, J. Power Sources 195 (2010) 6774–6781.
[44] H. Mark€otter, I. Manke, R. Kuhn, T. Arlt, N. Kardjilov, M.P. Hentschel, A. Kupsch, A. Lange, C. Hartnig, J. Scholta, Neutron tomographic investigations of water distributions in polymer electrolyte membrane fuel cell stacks, J. Power Sources 219 (2012) 120–125.
[45] H.T. Chung, D.A. Cullen, D. Higgins, B.T. Sneed, E.F. Holby, K.L. More, P. Zelenay, Direct atomic-level insight into the active sites of a high-performance PGM-free ORR catalyst, Science 357 (2017) 479–483, https://doi.org/10.1126/science. aan2255.
[46] S. Arisetty, X. Wang, R.K. Ahluwalia, R. Mukundan, R. Borup, J. Davey, D. Langlois, F. Gambini, O. Polevaya, S. Blanchet, Catalyst durability in PEM fuel cells with low platinum loading, J. Electrochem. Soc. 159 (2012) B455–B646, https://doi.org/10.1149/2.jes113064.
[47] D.S. Hussey, D. Spernjak, A.Z. Weber, R. Mukundan, J. Fairweather, E.L. Brosha, J. Davey, J.S. Spendelow, D.L. Jacobson, R.L. Borup, Accurate measurement of the
through-plane water content of proton-exchange membranes using neutron radiography, J. Appl. Phys. 112 (2012) 104906, https://doi.org/10.1063/ 1.4767118. Artn 104906.
[48] D.S. Hussey, J.M. LaManna, E. Baltic, D.L. Jacobson, S. Stariha, D. Spernjak, R. Mukundan, R.L. Borup, Membrane/electrode assembly water content measured with 2 μm spatial resolution neutron imaging, ECS Transactions 80 (2017) 385–393, https://doi.org/10.1149/08008.0385ecst.
[49] S. Komini Babu, H.T. Chung, P. Zelenay, S. Litster, Resolving electrode morphology’s impact on platinum group metal-free cathode performance using nano-CT of 3D hierarchical pore and ionomer distribution, ACS Appl. Mater. Interfaces 8 (2016) 32764–32777, https://doi.org/10.1021/acsami.6b08844.
[50] S.K. Roy, M.E. Orazem, Analysis of flooding as a stochastic process in polymer electrolyte membrane (PEM) fuel cells by impedance techniques, J. Power Sources 184 (2008) 212–219, https://doi.org/10.1016/j.jpowsour.2008.06.014.
[51] J. Lee, R. Banerjee, M.G. George, D. Muirhead, P. Shrestha, H. Liu, N. Ge, S. Chevalier, A. Bazylak, Multiwall carbon nanotube-based microporous layers for polymer electrolyte membrane fuel cells, J. Electrochem. Soc. 164 (2017) F1149–F1157, https://doi.org/10.1149/2.0861712jes.
[52] P. Zelenay, Non-Precious metal fuel cell cathodes: catalyst development and electrode structure design, in: 2016 DOE Annual Merit Review Proceedings, 2016. https://www.hydrogen.energy.gov/pdfs/review16/fc107_zelenay_2016_o.pdf.
S. Komini Babu et al.