UNDERSTANDING VOLUNTEER MOTIVATIONS TO...
151
UNDERSTANDING VOLUNTEER MOTIVATIONS TO PARTICIPATE IN CITIZEN SCIENCE PROJECTS: A DEEPER LOOK AT WATER QUALITY MONITORING by Bethany J. Alender A Thesis Submitted in partial fulfillment of the requirements for the degree Master of Environmental Studies The Evergreen State College June 2015
Transcript of UNDERSTANDING VOLUNTEER MOTIVATIONS TO...
UNDERSTANDING VOLUNTEER MOTIVATIONS TO
PARTICIPATE IN CITIZEN SCIENCE PROJECTS:
A DEEPER LOOK AT WATER QUALITY MONITORING
by
Bethany J. Alender
A Thesis Submitted in partial fulfillment
of the requirements for the degree Master of Environmental Studies
The Evergreen State College June 2015

©2015 by Bethany J. Alender. All rights reserved.
This Thesis for the Master of Environmental Studies Degree
by
Bethany J. Alender
has been approved for
The Evergreen State College
by
________________________ Kevin Francis, Ph. D.
Director, Graduate Program on the Environment Member of the Faculty
________________________ Date
ABSTRACT
Understanding Volunteer Motivations to Participate in Citizen Science Projects: A Deeper Look at Water Quality Monitoring
Bethany J. Alender
Volunteer water quality monitors represent the cross section between citizen science and environmental stewardship. They provide a vital resource to society and the environment by identifying sources of pollution and unhealthy water bodies, yet these volunteers have been understudied. Volunteer retention is one of the biggest challenges faced by citizen science, and understanding what motivates participation will enable project managers to improve recruitment and retention.
This study surveyed 271 volunteers from eight water quality monitoring organizations in five U.S. states. Survey questions were designed to identify both intrinsic and extrinsic motivators as well as variations by age, gender, and length of involvement with the organization. Motivations that allow volunteers to express their values (particularly those related to altruism) were the most important (e.g. to help the environment or the community). Other highly important motivators helped individuals escape negativity (to get outside or connect with nature) or contributed to understanding (to contribute to scientific knowledge, to learn about water quality, and to learn new skills or knowledge). Social learning was also an important motivator (to learn from others and to share knowledge with others). The least important motivator was career advancement. There was no difference in the importance of motivations based on gender. However, younger volunteers have different motivations and preferences than older volunteers.
Preferences about training, weather, responsibility, group size, and type of recognition were revealed. Respondents indicated a strong desire for results to be shared with them and even more importance was placed on identifying and addressing environmental problems with the use of their data. Volunteers value the communication of tangible results more than recognition or reward.

iv
Table of Contents List of Figures ................................................................................................................................................. v
List of Tables .................................................................................................................................................. vi
Acknowledgements ...................................................................................................................................... vii
Chapter 1: Introduction ................................................................................................................................ 1 1.1 Purpose ................................................................................................................................................. 1 1.2 What is Citizen Science? ...................................................................................................................... 2 1.3 Citizen Science: The Term ................................................................................................................... 3 1.4 Why Citizen Science? ........................................................................................................................... 4 1.5 Understanding Volunteers .................................................................................................................... 6 1.6 Volunteer Water Quality Monitoring ................................................................................................... 7 1.7 Contributions of this Study ................................................................................................................... 9 1.8 Overview ............................................................................................................................................ 10
Chapter 2. Literature Review ..................................................................................................................... 11 2.1 Introduction ........................................................................................................................................ 11 2.2 Framework for Assessing Volunteer Motivations .............................................................................. 12 2.3 Motivations to Participate in Environmental Stewardship Projects ................................................... 14 2.4 Motivations to Participate in Citizen Science Projects ....................................................................... 31 2.5 The Overlap: Motivations to Participate in Water Quality Monitoring ............................................. 42 2.6 Summary ............................................................................................................................................. 46
Chapter 3: Methods ..................................................................................................................................... 50 3.1 Introduction ........................................................................................................................................ 50 3.2 Study Design ...................................................................................................................................... 50 3.3 Survey Design and Data Collection ................................................................................................... 51 3.4 Using the Likert Scale and Likert-type Questions .............................................................................. 53 3.5 Data Analysis ...................................................................................................................................... 58
Chapter 4: Results and Discussion ............................................................................................................ 60 4.1 Participating Organizations ................................................................................................................ 60 4.2 Demographics ..................................................................................................................................... 62 4.3 Volunteer Activity and Performance .................................................................................................. 64 4.4 Motivations to Participate ................................................................................................................... 74 4.5 Use of Volunteer Collected Data ........................................................................................................ 86 4.6 Training .............................................................................................................................................. 91 4.7 Responsibility ..................................................................................................................................... 93 4.8 Social Interactions .............................................................................................................................. 95 4.9 Recognition and Appreciation .......................................................................................................... 101
Chapter 5: Conclusion .............................................................................................................................. 106 5.1 Key Findings and Applications ........................................................................................................ 106 5.2 Limitations ........................................................................................................................................ 109 5.3 Further Research ............................................................................................................................... 109
References ................................................................................................................................................... 112
Appendices .................................................................................................................................................. 119 Appendix A: Recruitment Details ........................................................................................................... 119 Appendix B: Participating Organizations ................................................................................................ 121 Appendix C: Survey ................................................................................................................................ 122 Appendix D: Demographics .................................................................................................................... 139 Appendix E: Outdoor Activity ................................................................................................................ 141 Appendix F: Recognition ........................................................................................................................ 143
v
List of Figures
Figure 1. Venn diagram showing the relationships of volunteer projects.. ....................... 8 Figure 2. Number of responses per organization and percent of total responses. ........... 62 Figure 3. Age Distribution of Respondents. .................................................................... 63 Figure 4. Tasks performed by volunteers. ....................................................................... 66 Figure 5. First year of volunteering with organization. ................................................... 67 Figure 6. Length of involvement with organization. ....................................................... 69 Figure 7. Distribution of age groups by length of involvement with organization.. ........ 70 Figure 8. Average attendance frequency. ........................................................................ 71 Figure 9. Average attendance duration. ........................................................................... 71 Figure 10. Attendance duration versus attendance frequency. ........................................ 72 Figure 11. Future likelihood of continued engagement with organization.. .................... 74 Figure 12. Level of agreement with reasons for volunteering.. ....................................... 76 Figure 13. Importance of motivations for different lengths of involvement. .................. 81 Figure 14. Importance of motivations for different age groups. ...................................... 83 Figure 15. Importance of motivations for different genders. ........................................... 85 Figure 16. Level of agreement about how data is used by the organization. ................... 88 Figure 17. Data use for scientific publications vs. contribute to scientific knowledge. .. 89 Figure 18. More should be done with the data vs. contribute to scientific knowledge. .. 90 Figure 19. Level of agreement about training. ................................................................. 92 Figure 20. Level of agreement about depth of participation. ........................................... 93 Figure 21. Importance of opportunity to advance for different lengths of involvement. 94 Figure 22. Group size preference. .................................................................................... 95 Figure 23. Distribution of age groups by group size preference. ..................................... 96 Figure 24. Distribution of genders by group size preference.. ......................................... 97 Figure 25. Level of agreement about social reasons to participate. ................................. 98 Figure 26. Importance of social motivations for different lengths of involvement. ........ 99 Figure 27. Importance of social motivations for different age groups. ......................... 100 Figure 28. Importance of social motivations for different genders. .............................. 101 Figure 29. Importance of receiving recognition or appreciation. .................................. 102 Figure 30. Importance of different forms of recognition or appreciation. ..................... 103 Figure 31. Importance of different forms of recognition for different age groups. ....... 105

vi
List of Tables
Table 1. Motivations to volunteer for The Nature Conservancy (choose all) ................. 16 Table 2. Motivations to volunteer for The Nature Conservancy (choose only one) ........ 17 Table 3. Motivations for continued participation in three stewardship projects .............. 20 Table 4. Motivations to participate in six stewardship projects. ...................................... 22 Table 5. Motivations to participate in urban conservation. ............................................. 25 Table 6. Motivations to participate in a Florida stewardship project. ............................. 28 Table 7. Motivation categories to participate in the Galaxy Zoo project. ....................... 34 Table 8. Frequency of motivations to participate in the Galaxy Zoo project. ................. 35 Table 9. Motivations to participate in Save Our Streams. ............................................... 43 Table 10. Motivations to participate in Save Our Streams across participation levels. ... 44 Table 11. Save Our Stream volunteer preferences for types of recognition. ................... 45 Table 12. Example of a Likert scale with labeled parts ................................................... 55 Table 13. Example of Likert-type items with labeled parts. ............................................ 56 Table 14. Appropriate analyses for Likert-type and Likert scale data. ............................ 58 Table 15. Participating organizations and corresponding response rates. ....................... 61 Table 16. Motivations organized by function. .................................................................. 78
vii
Acknowledgements
This study would not have been possible without the participating organizations and the staff members who promoted my survey: Scott Williams and Jonnie Maloney (Maine Volunteer Lake Monitoring Program), Linda Green (University of Rhode Island Watershed Watch), Rachel Hutchinson (South Yuba River Citizens League), Rick Watson (North Pond Association of Maine), Sheila Wilson (Nisqually River Education Project), Stephanie Bishop (South Sound GREEN), Anita Deming (Boquet River Association), and Kim Benedict (Olympia Stream Team).
My sincere appreciation goes to my thesis advisor, Dr. Kevin Francis, for providing insightful guidance, for keeping me on track, and for educing higher achievement. I thank my peer review group (Team Inspiriters!) and the MES cohort for providing quality feedback and indispensable doses of enthusiasm. Finally, I thank my parents and loved ones who encouraged me and cheered me on.
This research was funded in part by The Evergreen State College Student Foundation Activity Grant.
1
Chapter 1: Introduction
1.1 Purpose
Citizen science projects involve the general public in scientific research and have
the capacity to collect and analyze more data than scientists alone. This enables
community groups and government agencies to monitor and respond to environmental
issues more efficiently (Conrad & Hilchey, 2011). Because citizen science depends on
volunteers, project managers need to have a thorough understanding of volunteers, but
most organizations lack the resources to conduct internal research.
The purpose of my thesis research is to gain an understanding of volunteer
motivations to participate in citizen science projects – specifically those that focus on
environmental stewardship. To complete this research, I have reviewed the published
literature and surveyed volunteers from organizations that monitor water quality because
this activity reflects a unique characteristic of volunteers who want to contribute both to
environmental protection and the scientific process. This study provides insight into
strength of motivations and how motivations vary by demographics. Project coordinators
can use this information to reduce costs associated with volunteer recruitment and
retention.
I will begin this chapter by introducing the reader to citizen science and its
significance. This is followed by a discussion of the importance of understanding
volunteers and an introduction to volunteer water quality monitoring. Finally, I give an
overview of the contributions of this study and the contents of this thesis.

2
1.2 What is Citizen Science?
“Citizen science” is a term that refers to public involvement in scientific research
and inquiry (Dickinson & Bonney, 2012; “SciStarter,” n.d.; Theobald et al., 2015). A
“citizen scientist” is any member of the public who voluntarily contributes to research,
typically by collecting or analyzing data (Dickinson & Bonney, 2012; Raddick et al.,
2010; “SciStarter,” n.d.). Anyone can be a citizen scientist, trained or untrained, and
projects may contribute to any field of research including, but not limited to: ecology,
environment, pollution, health, medicine, psychology, statistics, computer science, and
astronomy (Dickinson & Bonney, 2012; Rotman et al., 2014; “SciStarter,” n.d.; Theobald
et al., 2015).
The longest running example of a citizen science project is the National Audubon
Society’s Annual Christmas Bird Count (“About the Christmas Bird Count,” n.d.).
Celebrating its 115th anniversary in 2014, the Bird Count began as an alternative to the
traditional “Side Hunt,” a hunting competition that led to concern for observed declines
in bird populations. For the Christmas Bird Count, volunteers sign up to join a group of
counters during December; they identify birds in a specified location and submit their
data online. The data show changes in bird populations over both time and space, which
can indicate environmental changes and inform management decisions about habitat
(“About the Christmas Bird Count,” n.d.).
There are hundreds of citizen science projects around the world and their topics
vary tremendously (“SciStarter,” n.d.). Another example of citizen science is a fish
survey conducted by the Reef Environmental Education Foundation (REEF). Volunteers
receive training and record fish species while they enjoy snorkeling or scuba diving
3
(“REEF,” n.d.). Countless organizations support volunteer water quality monitoring
efforts, which vary from chemical tests to macroinvertebrate surveys of water bodies
from estuaries to groundwater (US EPA, n.d.). Other projects monitor light pollution
(“Dark Sky Meter,” n.d.) or seasonal changes in plants and animals (“Project BudBurst,”
n.d., “USA National Phenology Network,” n.d.).
Because citizen science projects vary widely across disciplines and activities, it is
helpful to narrow the scope of this study to offer a deeper understanding of a subset of the
population. My own interest in environmental stewardship and outdoor activity has led
me to focus on projects that promote those interests rather than citizen science projects
that are completely online or that fall in different disciplines. Therefore, this thesis will
be limited to projects that pertain to water quality monitoring, but the results will be
useful to any organization with a focus on environmental stewardship and data collection.
1.3 Citizen Science: The Term
Citizen science refers to projects that engage the public in scientific research
(Dickinson & Bonney, 2012). The field of projects belonging to citizen science has taken
many names, such as volunteer biological monitoring, community science, community-
based monitoring, and participatory monitoring (Shirk et al., 2012). Shirk et al. proposed
a new umbrella term in 2012 for all fields that involve the public in the scientific process:
public participation in scientific research (PPSR). PPSR can be applied to projects in
health, astronomy, ecology, the environment, or any other field. Although PPSR is an
all-encompassing and self-explanatory term, many authors have more readily adopted use
of the term “citizen science.” For example, the Ecological Society of America recently
4
published a series of articles specifically dedicated to citizen science in the journal
Frontiers in Ecology and the Environment. Additionally, a new professional society,
called the Citizen Science Association (CSA), has emerged in the past year; CSA will be
hosting a conference entirely dedicated to citizen science and will publish a journal in
2015 (“Citizen Science Association,” n.d.). In this thesis I will use the term “citizen
science” because it is simple, does not require an acronym, and is gaining acceptance in
the scientific community.
1.4 Why Citizen Science?
Citizen science is growing in number of projects and participants (Conrad &
Hilchey, 2011; Dickinson & Bonney, 2012; “SciStarter,” n.d.; Theobald et al., 2015).
Technology and the Internet have allowed for more efficient data collection and more
immediate engagement for participants (Raddick et al., 2010; Rotman et al., 2014); the
multifaceted and interconnected benefits of citizen science provide services to both
ecosystems and people (Dickinson & Bonney, 2012). Citizen science projects generally
have several overlapping goals that yield benefits in three major categories: outcomes for
scientific research such as data collection, outcomes for participants including education
and new skills, and outcomes for social-ecological systems like conservation,
stewardship, and policy (Dickinson & Bonney, 2012; Shirk et al., 2012). In this section I
describe some of the benefits and limitations that accompany citizen science projects.
5
Benefits
Social and ecological benefits derived from citizen science projects include:
enhanced relationships between citizens and management agencies, better wildlife
habitat, improved ability to address environmental problems, and increased citizen
engagement in policy (Shirk et al., 2012). Ecosystem research efforts often lack
resources for thorough and on-going monitoring, yet government agencies require
monitoring to make management decisions (Conrad & Hilchey, 2011). Citizen science
provides a cost-effective alternative to employee monitoring (Conrad & Hilchey, 2011;
Nov, Arazy, & Anderson, 2014). Additionally, when the public collaborates with
researchers, community groups are enabled to “monitor, track, and respond” to
environmental issues (Conrad & Hilchey, 2011, p. 274; Nov et al., 2014).
For example, Santa Barbara ChannelKeeper is a non-profit organization that
conducts monthly water quality monitoring with volunteers in a program called Stream
Team (“Stream Team,” n.d.). Stream Team promotes stewardship by engaging
community members in an accessible outdoor activity and educates the community about
local water issues. Local government agencies use Stream Team data to evaluate stream
health and address pollution problems. Stream Team data has led to the cleanup of
sixteen impaired streams between Santa Barbara and Ventura, California (“Stream
Team,” n.d.). Without the effort of volunteers, the state agencies responsible for
enforcing water quality regulations may not have been able to effectively monitor and
address these problems.
6
Limitations
Because funding and resources are limited, citizen science projects make trade-
offs between their goals of research, education, and stewardship (Dickinson & Bonney,
2012), which may reduce the project’s ability to tackle complex issues (Shirk et al.,
2012). The main challenges for citizen science projects include collection of rigorous
data and program organization (Conrad & Hilchey, 2011).
The scientific and government communities struggle to trust citizen science data
for several reasons: data may be subjected to fragmentation, inaccuracy, lack of
objectivity, poor experimental design, and inadequate sample size (Conrad & Hilchey,
2011). Some scientists and government agencies also do not have confidence in the level
of training volunteers receive. On the other hand, some researchers have found that data
collected by volunteers can be comparable to data collected by trained professionals
when a little effort is applied to validation and calibration (Conrad & Hilchey, 2011).
At the organizational level, the main challenges to citizen science projects include
funding and volunteer recruitment (Conrad & Hilchey, 2011). These two issues may be
reinforcing since funding is needed to recruit volunteers and volunteer participation is
often needed to attract funding (Dickinson & Bonney, 2012). Thus understanding
volunteer motivations to participate is a critical element of producing a successful citizen
science project.
1.5 Understanding Volunteers
Volunteers are the backbone of citizen science projects. If project managers want
to generate the best outcomes possible, they need to understand what drives volunteers.

7
Further, understanding volunteers helps managers tailor their projects and recruitment
strategies, reducing time and money spent on the wrong techniques.
Volunteer project outcomes are influenced by both quantity and quality of
participation (Shirk et al., 2012). Quantity of participation reflects the number of
participants and how much time they spend participating. Quality of participation
reflects “the extent to which a project’s goals and activities align with, respond to, and
are relevant to the needs and interests of public participants” (Shirk et al., 2012, p.4). If
the quality of participation is carefully cultivated, then increased quantity of participation
can lead to enhanced outcomes. Thus taking volunteer motivations into account can
increase both the quantity and quality of participation and improve the ability of the
project to meet its goals (Shirk et al., 2012).
While citizen science projects offer a cost-effective way to collect more data than
scientists could accomplish on their own, it is important to point out that volunteers are
not free labor: “Financial and human resources are required to recruit, train, supervise,
and retain volunteers and to recognize their accomplishments” (Jacobson, Carlton, &
Monroe, 2012, p.53). Understanding volunteer motivations will help project managers
reduce recruitment and retention costs and maximize the benefits derived from
volunteerism (Jacobson et al., 2012; Raddick et al., 2010; Shirk et al., 2012).
1.6 Volunteer Water Quality Monitoring
Not all citizen science projects are environmental and not all environmental projects
involve citizen science. However, water quality monitoring projects represent the
intersection because they have stewardship goals and they collect data to meet those
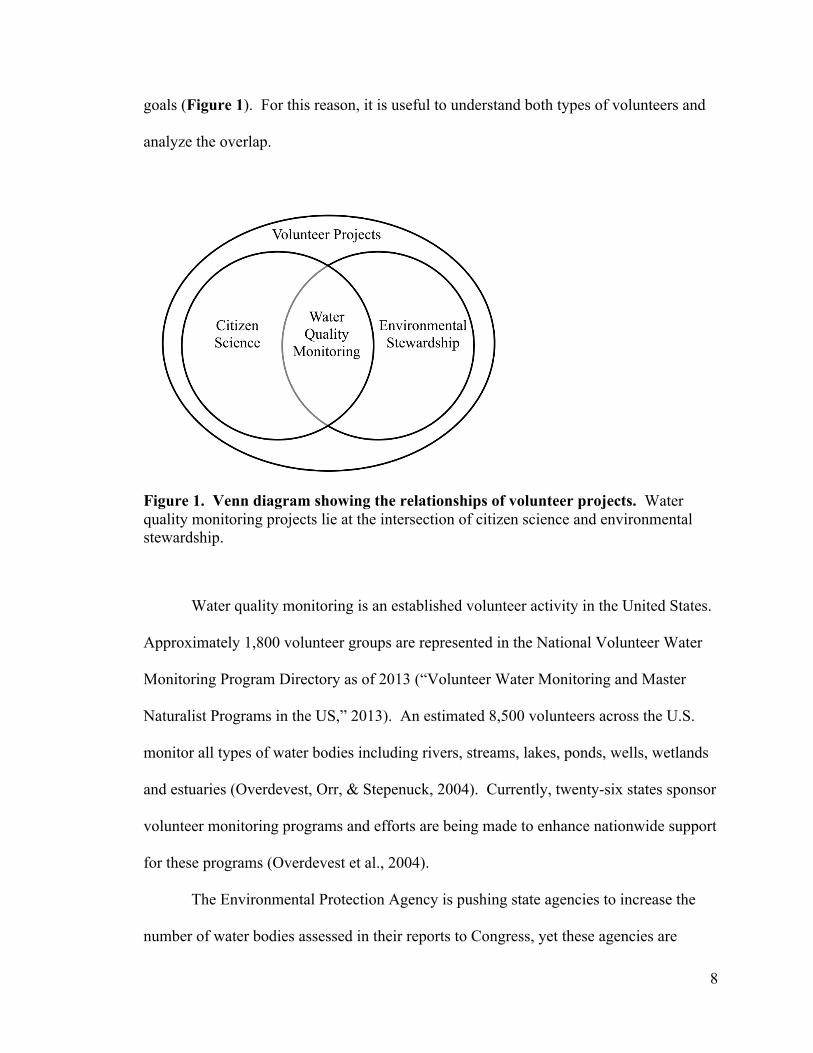
8
goals (Figure 1). For this reason, it is useful to understand both types of volunteers and
analyze the overlap.
Figure 1. Venn diagram showing the relationships of volunteer projects. Water quality monitoring projects lie at the intersection of citizen science and environmental stewardship.
Water quality monitoring is an established volunteer activity in the United States.
Approximately 1,800 volunteer groups are represented in the National Volunteer Water
Monitoring Program Directory as of 2013 (“Volunteer Water Monitoring and Master
Naturalist Programs in the US,” 2013). An estimated 8,500 volunteers across the U.S.
monitor all types of water bodies including rivers, streams, lakes, ponds, wells, wetlands
and estuaries (Overdevest, Orr, & Stepenuck, 2004). Currently, twenty-six states sponsor
volunteer monitoring programs and efforts are being made to enhance nationwide support
for these programs (Overdevest et al., 2004).
The Environmental Protection Agency is pushing state agencies to increase the
number of water bodies assessed in their reports to Congress, yet these agencies are

9
typically understaffed (Addy, Green, Herron, & Stepenuck, 2010). Thus, volunteer water
quality monitoring programs provide a great service to society while also engaging the
public in watershed protection and enhancement (Addy et al., 2010).
Due to personal connections to water bodies – such as being a recreational user,
being a property owner, or valuing a cultural aspect of the water – volunteers are
passionate about water bodies (Addy et al., 2010). This passion translates into a
dedication to protect water resources. Through training and monitoring activities,
volunteers can learn about water quality issues, how their actions affect the water, and
what can be done to protect water bodies and human health. Volunteers often share what
they have learned with others and become involved in management decisions (Addy et
al., 2010), effectively meeting all three goals of citizen science: education, research, and
stewardship.
1.7 Contributions of this Study
Peer-reviewed literature on citizen science projects is “both limited and dispersed
across fields;” existing empirical evidence is insufficient to guide project managers
toward successful project design (Nov et al., 2014; Shirk et al., 2012, p.2). Volunteer
motivations have been studied in many fields, but few studies have been published on
motivations that pertain specifically to participants in citizen science projects (Nov et al.,
2014; Raddick et al., 2010). If project managers have a good understanding of what
motivates participation, they can reduce recruitment and retention costs and maximize the
benefits derived from volunteers (Jacobson et al., 2012; Raddick et al., 2010; Shirk et al.,
2012). This study illuminates motivations specific to citizen science volunteers and
10
explores how these motivations vary by demographics so that managers can prioritize
their resources.
1.8 Overview
In Chapter 1, I have given the reader a brief introduction to citizen science,
benefits and limitations of citizen science, water quality monitoring, and why
understanding volunteer motivations is important. In Chapter 2, I review the peer-
reviewed literature to understand volunteers in citizen science and environmental
stewardship programs. This review will serve to support the methods I have chosen for
my research, which are described in Chapter 3. Chapter 4 will reveal the results of the
study along with analysis and discussion. A summary of the study and my conclusions
are presented in the final Chapter 5.
11
Chapter 2. Literature Review
2.1 Introduction
Citizen science projects have the ability to tackle complex environmental issues
by educating the public, providing data to researchers, and informing management
agencies. The momentum building behind these projects can be attributed to an increased
awareness and concern about human impacts on ecosystems (Conrad & Hilchey, 2011).
Because citizen science projects inherently depend on volunteers, understanding their
motivations is critical to developing a successful program (Jacobson et al., 2012). In this
section I review the published literature on volunteer motivations. Although the literature
specific to citizen science is limited (Nov et al., 2014; Rotman et al., 2014), particularly
to ecology-driven citizen science, volunteerism cuts across disciplines. Thus, many
articles reviewed pertain to environmental volunteerism in general.
First I present the predominant framework for assessing volunteer motivations for
any type of volunteer (Section 2.2). Then I review articles that pertain to volunteers
involved in environmental stewardship projects (Section 2.3). These projects do not
necessarily ask volunteers to be involved with the scientific process but they ask
volunteers to participate in environmental protection or enhancement projects, such as
invasive weed control, pollution cleanup, and habitat protection. Next I review studies
that pertain specifically to citizen science projects (Section 2.4). These are related to
water quality monitoring because they ask volunteers to collect or analyze data. Last, I
review motivations specific to water quality monitors (Section 2.5) and conclude this
chapter with a summary (Section 2.6).
12
2.2 Framework for Assessing Volunteer Motivations
In the 1990s, much of the literature on people who voluntarily make sacrifices for
others focused on situations where there is an unexpected need for help. Referred to as
“spontaneous helping,” the helper makes a brief singular action to assist someone in
immediate need (Clary et al., 1998, p. 1516). Yet at this time, not many studies had
evaluated the psychology of volunteerism, which is a very different form of helping.
Those who volunteer typically engage in “planned helping” by actively seeking out
opportunities to help (Clary et al., 1998, p. 1517). Volunteers may deliberate for quite
some time about where, when, and how much they will volunteer; and they often make a
commitment to help on many occasions over a long period of time.
In a seminal article on volunteer motivations, Clary et al. (1998) explored reasons
for people to volunteer and why they continue volunteering. Hypothesizing that
volunteerism serves psychological functions, Clary et al. developed the Volunteer
Functions Inventory (VFI) as an instrument to evaluate these functions. A core property
of functionalism – the underlying theory of the VFI – is that people can serve distinct
psychological functions by performing the same actions (Clary et al., 1998). Six
motivational functions were identified:
1) Values. Volunteering allows individuals to express their values, particularly
those related to altruism and concern for others.
2) Understanding. Volunteering offers the opportunity to learn, have new
experiences, and “exercise knowledge, skills, and abilities that might
otherwise go unpracticed” (p. 1518).
13
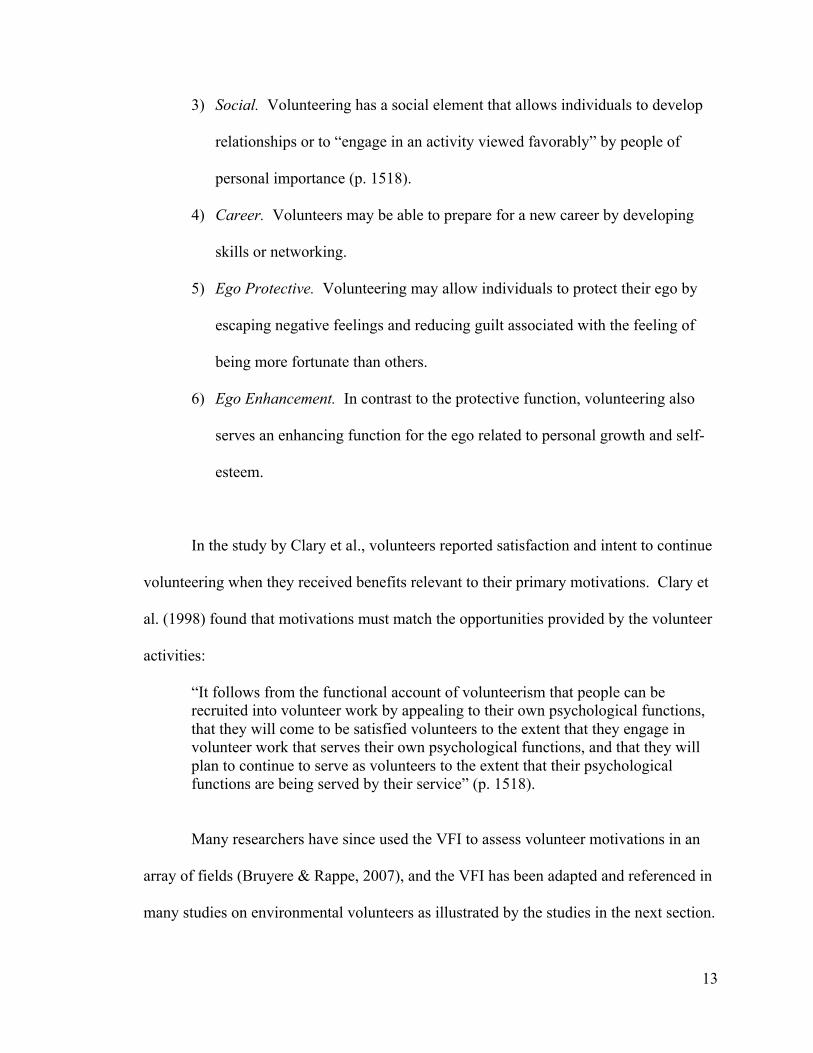
3) Social. Volunteering has a social element that allows individuals to develop
relationships or to “engage in an activity viewed favorably” by people of
personal importance (p. 1518).
4) Career. Volunteers may be able to prepare for a new career by developing
skills or networking.
5) Ego Protective. Volunteering may allow individuals to protect their ego by
escaping negative feelings and reducing guilt associated with the feeling of
being more fortunate than others.
6) Ego Enhancement. In contrast to the protective function, volunteering also
serves an enhancing function for the ego related to personal growth and self-
esteem.
In the study by Clary et al., volunteers reported satisfaction and intent to continue
volunteering when they received benefits relevant to their primary motivations. Clary et
al. (1998) found that motivations must match the opportunities provided by the volunteer
activities:
“It follows from the functional account of volunteerism that people can be recruited into volunteer work by appealing to their own psychological functions, that they will come to be satisfied volunteers to the extent that they engage in volunteer work that serves their own psychological functions, and that they will plan to continue to serve as volunteers to the extent that their psychological functions are being served by their service” (p. 1518).
Many researchers have since used the VFI to assess volunteer motivations in an
array of fields (Bruyere & Rappe, 2007), and the VFI has been adapted and referenced in
many studies on environmental volunteers as illustrated by the studies in the next section.
14
One of the limitations to the VFI is that many motivations expressed by volunteers may
fall into more than one of the six functions identified. Therefore, categorizing
motivations uniformly is difficult and researchers have not adopted a standard
categorization methodology. Comparing results and findings across studies is
consequently impaired to some degree. For future research, I would urge researchers to
establish a standard framework that could be adapted for unique situations. Because of
its reputation, the Volunteer Functions Inventory would be a great starting point and
researchers should attempt to place motivations in one of the six categories.
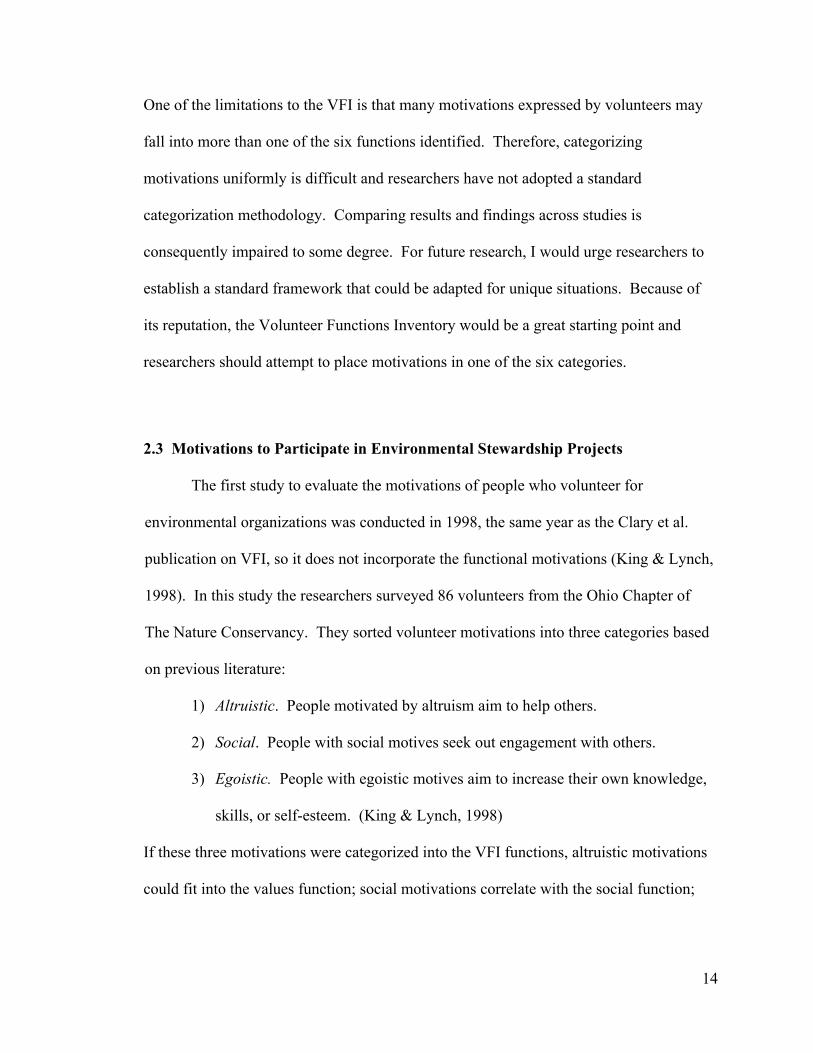
2.3 Motivations to Participate in Environmental Stewardship Projects
The first study to evaluate the motivations of people who volunteer for
environmental organizations was conducted in 1998, the same year as the Clary et al.
publication on VFI, so it does not incorporate the functional motivations (King & Lynch,
1998). In this study the researchers surveyed 86 volunteers from the Ohio Chapter of
The Nature Conservancy. They sorted volunteer motivations into three categories based
on previous literature:
1) Altruistic. People motivated by altruism aim to help others.
2) Social. People with social motives seek out engagement with others.
3) Egoistic. People with egoistic motives aim to increase their own knowledge,
skills, or self-esteem. (King & Lynch, 1998)
If these three motivations were categorized into the VFI functions, altruistic motivations
could fit into the values function; social motivations correlate with the social function;

15
and egoistic motivations could be divided into protective, enhancement, and
understanding functions.
The survey included a series of four statements in each of the three categories
above. Respondents could select all that apply from the 12 options, and they were asked
if their motives were fulfilled. Respondents were also asked to select one motivation that
most strongly aligned with their initial reason to participate and if their motivations had
changed over time.
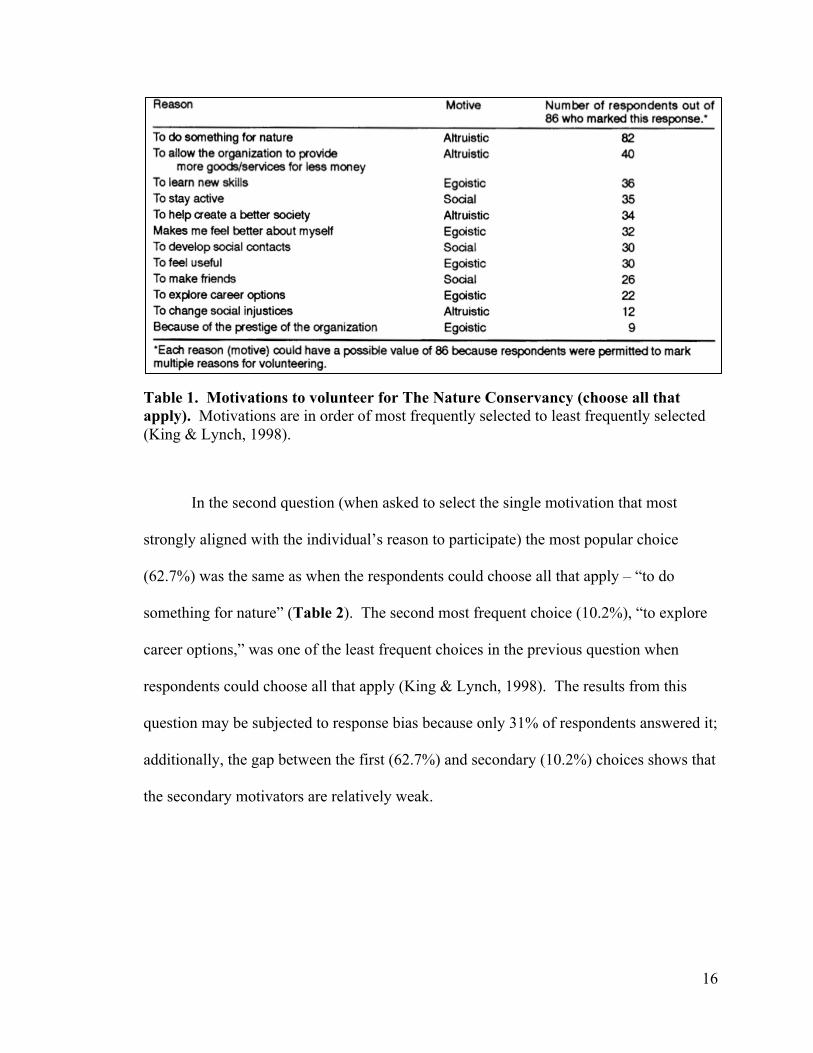
For the first question (in which respondents could choose all motivators that
applied to them) almost all of the respondents (82 of 86) selected an altruistic motivation
– “to do something for nature” – as one motivation (Table 1). The next most frequent
choice (40 of 86) was also altruistic – “to allow the organization to provide more
goods/services for less money” (King & Lynch, 1998, p. 8). Other frequent choices (34-
36 of 86) were an altruistic motivation (“to help create a better society”), a social
motivation (“to stay active”)1, and an egoistic motivation (“to learn new skills”) (p.8).
This study shows that the most popular reason to volunteer for the Nature Conservancy is
altruistic – “to do something for nature” – and two more altruistic motivations also
floated to the top in frequency (King & Lynch, 1998).
1 Many categories of motivators established by the authors of the articles reviewed here are overlapping and sometimes the fits are arguable. For example, I question the categorization of “to stay active” as a social motivation because it is not exclusively a social activity. At its root “staying active” seems like a personal gain that would help one
16
Table 1. Motivations to volunteer for The Nature Conservancy (choose all that apply). Motivations are in order of most frequently selected to least frequently selected (King & Lynch, 1998).
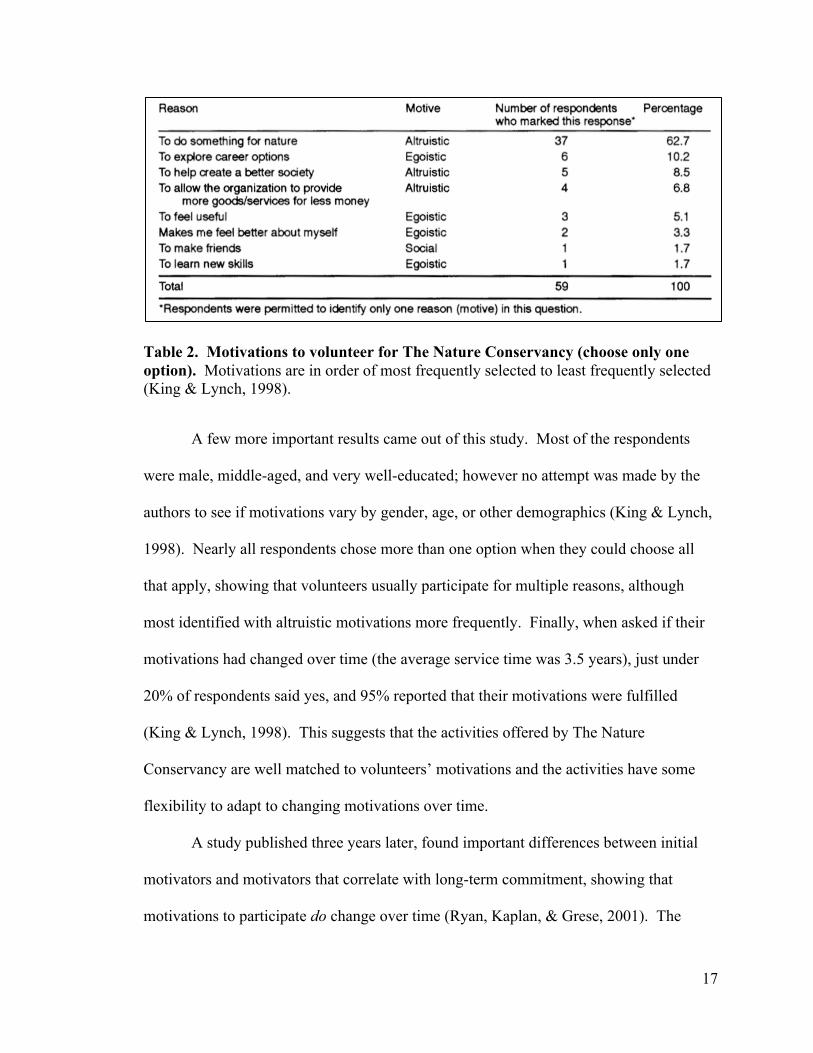
In the second question (when asked to select the single motivation that most
strongly aligned with the individual’s reason to participate) the most popular choice
(62.7%) was the same as when the respondents could choose all that apply – “to do
something for nature” (Table 2). The second most frequent choice (10.2%), “to explore
career options,” was one of the least frequent choices in the previous question when
respondents could choose all that apply (King & Lynch, 1998). The results from this
question may be subjected to response bias because only 31% of respondents answered it;
additionally, the gap between the first (62.7%) and secondary (10.2%) choices shows that
the secondary motivators are relatively weak.
17
Table 2. Motivations to volunteer for The Nature Conservancy (choose only one option). Motivations are in order of most frequently selected to least frequently selected (King & Lynch, 1998).
A few more important results came out of this study. Most of the respondents
were male, middle-aged, and very well-educated; however no attempt was made by the
authors to see if motivations vary by gender, age, or other demographics (King & Lynch,
1998). Nearly all respondents chose more than one option when they could choose all
that apply, showing that volunteers usually participate for multiple reasons, although
most identified with altruistic motivations more frequently. Finally, when asked if their
motivations had changed over time (the average service time was 3.5 years), just under
20% of respondents said yes, and 95% reported that their motivations were fulfilled
(King & Lynch, 1998). This suggests that the activities offered by The Nature
Conservancy are well matched to volunteers’ motivations and the activities have some
flexibility to adapt to changing motivations over time.
A study published three years later, found important differences between initial
motivators and motivators that correlate with long-term commitment, showing that
motivations to participate do change over time (Ryan, Kaplan, & Grese, 2001). The
18
authors found from previous literature that altruism (e.g. helping the environment) was an
important motivation for initializing participation, but self-interest motivations (e.g.
developing relationships) were important for continued participation. Ryan et al. (2001)
specifically surveyed long-term volunteers – defined as volunteers who had spent at least
one year with one organization. The researchers surveyed 148 volunteers from three
stewardship organizations in Michigan, one of which was a watershed council with water
quality monitoring activities.
First, the researchers assessed volunteer commitment scores by combining the
responses of those who volunteer on a regular and basis and those who consider
volunteering a high priority. Volunteers with strong commitment scores correlated with
high frequency of participation, but length of involvement with the organization did not
correlate with either commitment or frequency. This suggests that a key to volunteer
retention is frequent opportunities to participate (Ryan et al., 2001). It can be inferred
that participation frequency may tie in with social motivators: the more often volunteers
participate, the more likely they are to develop relationships which reinforce the
motivation to participate. Later in the study, social motivators are revealed to be a
predictor of commitment, reinforcing this inference.
Ryan et al. (2001) found that age, distance to volunteering site, time, and specific
activity were not correlated to a volunteer’s commitment, duration, or frequency of
volunteering. I would argue, based on discussions with volunteers and volunteer
managers, that these are important to initial volunteers. An individual is likely to make a
decision to begin volunteering for an organization based on these factors. However,
since the volunteers in this study have been volunteering for at least one year, they have
19
already gone through a decision-making process based on these factors and their
continued service is more dependent on other elements. Volunteer recruiters could
benefit from a survey that asks how far or how much time individuals would be willing to
travel to volunteer sites. This would enable the recruiters to target people that live within
a specific radius of their project sites. Ryan et al. found that more than half of volunteers
lived within five miles of their project site (2001).
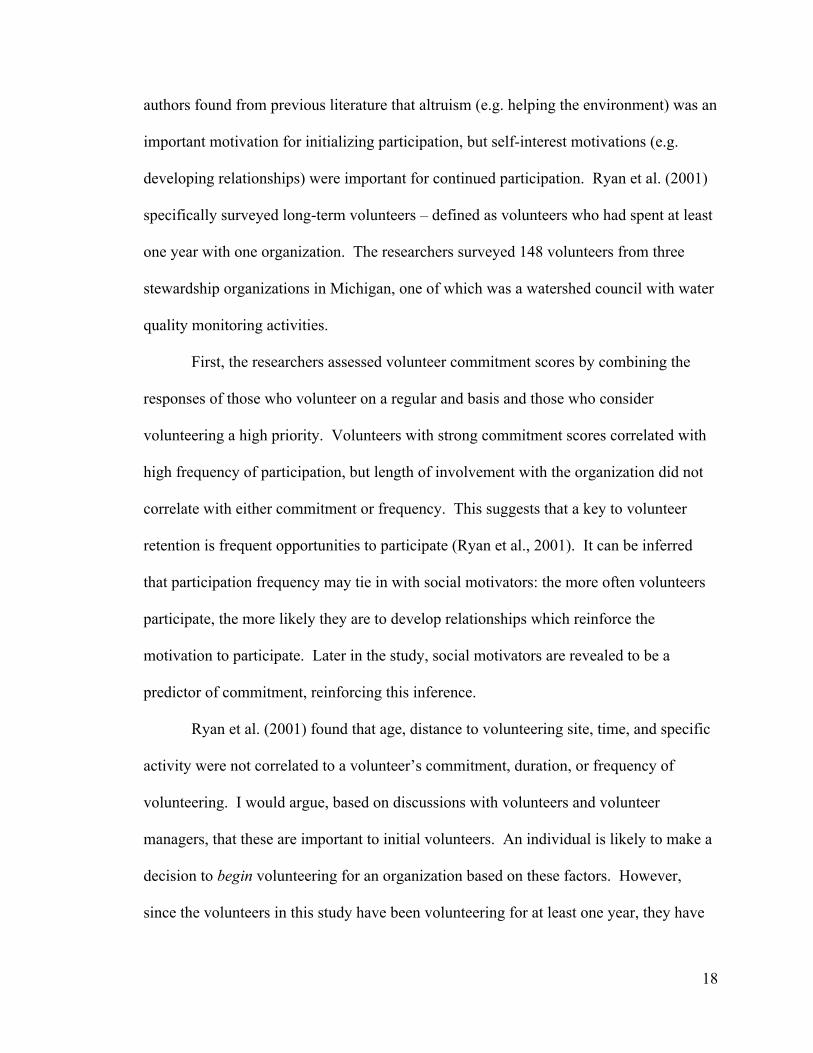
Ryan et al. (2001) identified seven motivational themes using a five-point rating
scale (Table 3). The highest rated motivation was “feeling of doing something useful,”
which is related to the second highest rated motivation – “helping the environment” – but
might be broader and less tangible. “Feeling of doing something useful” would best fit in
the ego enhancement function of the VFI, while “helping the environment” would be
considered a value function because it is related to altruism. Third highest rated was
“learning,” which would fit in the understanding function of the VFI, but its score is not
significantly different from “helping the environment.” “Project organization” and
“social” followed without significant difference between each other. “Reflection” was
rated lower than “social” but showed no significant difference. The lowest rated item
was “making decisions about projects.” This was surprising because it is contrary to
literature that suggests volunteers (any type of volunteer) can be retained by offering
them leadership positions (Knoke, 1981; Ryan et al., 2001).

20
Table 3. Motivations for continued participation in three stewardship projects. Motivations are in order of highest to lowest mean score (except for the “Individual items” category). Responses were weighted on a five-point scale (Ryan et al., 2001).
Ryan et al. (2001) also wanted to see if any of these motivators were predictors of
long-term commitment. They used multiple regression analysis and found that “project
organization” and “social” were positive predictors for commitment. Disorganized
projects can dampen an individual’s willingness to participate. Project managers could
enhance the volunteer’s experience by asking volunteers with expertise to help newer

21
volunteers which would serve the VFI social and enhancement functions by recognizing
the individual’s value to the group (Ryan et al., 2001).
In 2007, Bruyere and Rappe surveyed 401 volunteers from six environmental
stewardship organizations located near Colorado State University. The survey asked
respondents to rate the importance of motivations on a seven-point scale from “strongly
unimportant” to “strongly important” (Bruyere & Rappe, 2007, p. 508). Motivation
categories were based on the Volunteer Functions Inventory (Clary et al., 1998) plus
three additional categories – “help the environment,” “project organization,” and “user”
(a “user” is a person who uses or enjoys a particular area, e.g. for hiking or fishing).
Again, “help the environment” could fit under the value function of the VFI, but the other
two are more difficult to categorize.
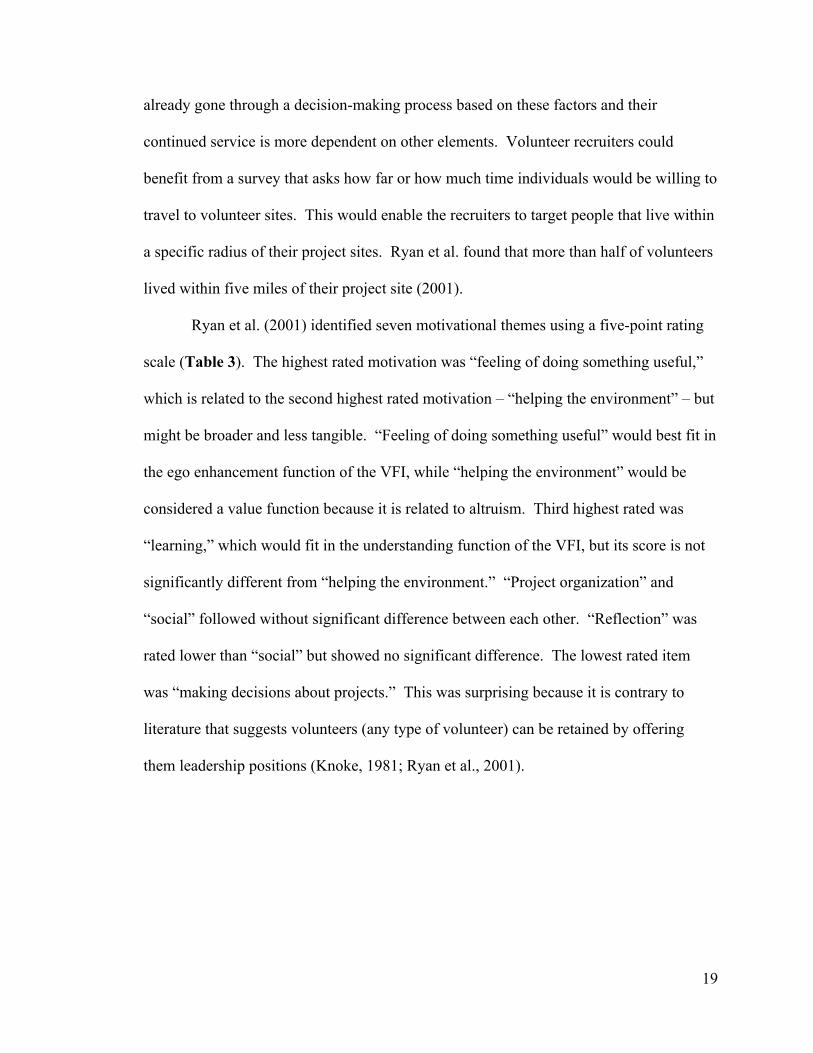
Bruyere and Rappe (2007) also found that “help the environment” was the highest
rated motivation to participate (mean = 6.11 out of 7) and the lowest rated motivation
was “career” (Table 4). Only 20% of respondents were current students while 40% were
50 years of age or older (thus more likely to be settled in career); these factors may
explain why “career” was rated lowest. The authors mention a possible relationship
between students and the “career” motivator, but they do not quantitatively assess the
relationship. The remaining five categories – “user,” “learning,” “social,” “project
organization,” and “values and esteem” – were rated almost equally to each other (mean
scores were between 4.59 and 4.96) (Bruyere & Rappe, 2007). These results are very
similar to those found by King and Lynch (1998) and Ryan et al. (2001). No
demographic patterns were explored in this study.
22
Table 4. Motivations to participate in six stewardship projects. Means are highlighted for clarity. The first two categories have the highest and lowest means. The other five categories have means very close to each other. Responses were weighted from 1 for “strongly unimportant” to 7 “strongly important” (Bruyere & Rappe, 2007).
23
This study also asked a few open-ended questions and identified an additional
motivation that occurred in 18% of the responses: “to get outside” (Bruyere & Rappe,
2007). This motivator is not clearly expressed by the respondents; “to get outside” could
serve a variety of psychological functions depending on the individual. For example,
getting outside may act as a form of respite from daily life (Bruyere & Rappe, 2007) and
thus serves an ego protective function allowing individuals to escape negativity, as
described by the VFI. Getting outside could also relate to a desire to maintain physical
well-being. This motivation may imply that volunteers will be less likely to attend
outdoor events when the weather is unfavorable (Bruyere & Rappe, 2007).
This study supports the claim made by King and Lynch (1998) that volunteers
have multiple reasons for participation. Volunteers not only want to help the
environment, but they also want to feel like they are part of something with purpose that
allows them to express themselves. Additionally, project organization is equally
important as the psychological motivations. Volunteers do not want to give their time
when they feel it is being wasted.
Asah and Blahna (2012) found that the study by Ryan et al. (2001) was the only
study to assess whether motivations are predictors of long-term participation and
conducted another study to address the same topic. They developed a survey that asked
242 volunteers in urban conservation to rate motivations on a five-point scale from “very
unimportant” to “very important.” Asah and Blahna (2012) found six motivational
categories that are similar to previous studies (in order of highest to lowest mean):
“environment,” “community,” “social interactions,” “ego defense and enhancement,”
“escape and exercise,” and “career and learning,” (Table 5). These motivations are very

24
similar to the VFI and could be easily compared with other studies except in cases where
motivations are lumped together. For example, “career and learning” should not be
combined, because they serve very different functions and project coordinators will need
to know which of the two is more motivating.

25
Table 5. Motivations to participate in urban conservation. The first two categories have the highest and lowest means. The other four categories have means very close to each other. Responses were weighted from 1 for “very unimportant” to 5 “very important” (Asah & Blahna, 2012).

26
During a preliminary interview process, Asah and Blahna (2012) found that
volunteers noted a distinct difference in their reasons for volunteering in general
compared to their reasons for volunteering for their favorite stewardship organization,
which was largely motivated by social reasons. The researchers looked at how different
motivators influenced volunteer intensity between volunteering in general and
volunteering for a favorite organization. They found that “helping the environment” was
only a marginally significant predictor of participation. “Ego defense and enhancement”
was a significant predictor of participation frequency for general volunteering, whereas
“social interactions” turned out to be the most significant predictor for participating with
a favorite organization. In other words, the more people want to make a positive change
in the environment and feel less guilty about anthropogenic harm to the environment, the
more often they will volunteer in general; and the more people want to develop
relationships and interact with like-minded others, the more they will volunteer with their
favorite organization (Asah & Blahna, 2012).
Another study published in 2012 surveyed volunteers at the Florida Fish and
Wildlife Conservation Commission (FWC). FWC volunteers participate in
environmental stewardship through a variety of activities including: exotic plant removal,
infrastructure construction, outreach and education programs, animal population
monitoring, and habitat restoration (Jacobson et al., 2012). The researchers administered
a web survey to all volunteers with a valid email address. Being entered in a raffle to win
a wildlife magazine subscription incentivized volunteers, and staff members encouraged
27
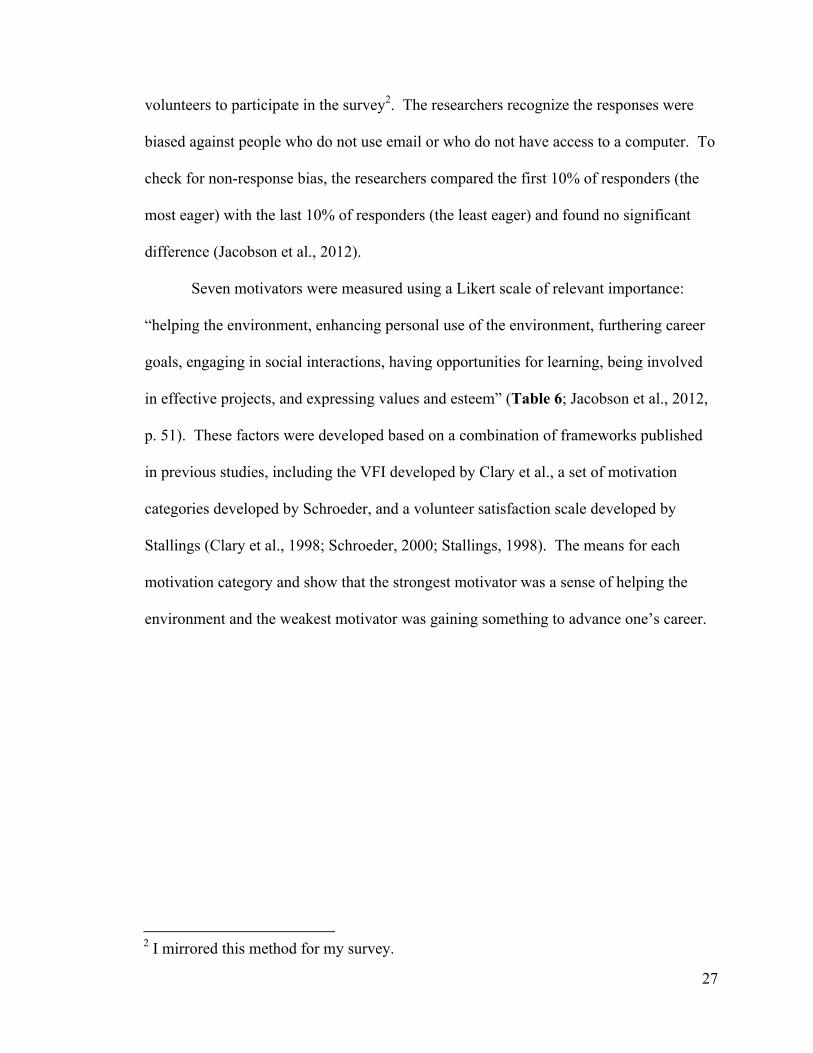
volunteers to participate in the survey2. The researchers recognize the responses were
biased against people who do not use email or who do not have access to a computer. To
check for non-response bias, the researchers compared the first 10% of responders (the
most eager) with the last 10% of responders (the least eager) and found no significant
difference (Jacobson et al., 2012).
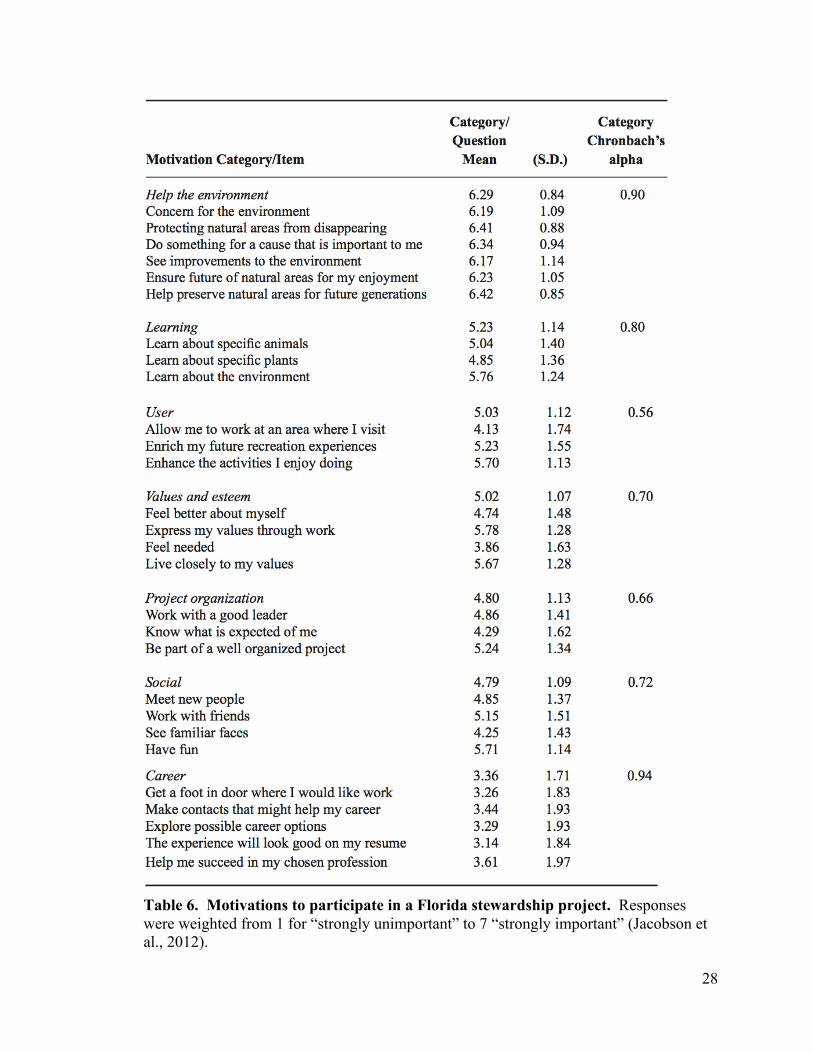
Seven motivators were measured using a Likert scale of relevant importance:
“helping the environment, enhancing personal use of the environment, furthering career
goals, engaging in social interactions, having opportunities for learning, being involved
in effective projects, and expressing values and esteem” (Table 6; Jacobson et al., 2012,
p. 51). These factors were developed based on a combination of frameworks published
in previous studies, including the VFI developed by Clary et al., a set of motivation
categories developed by Schroeder, and a volunteer satisfaction scale developed by
Stallings (Clary et al., 1998; Schroeder, 2000; Stallings, 1998). The means for each
motivation category and show that the strongest motivator was a sense of helping the
environment and the weakest motivator was gaining something to advance one’s career.
2 I mirrored this method for my survey.
28
Table 6. Motivations to participate in a Florida stewardship project. Responses were weighted from 1 for “strongly unimportant” to 7 “strongly important” (Jacobson et al., 2012).
29
Jacobson et al. (2012) gathered information about demographics (gender, age,
ethnicity, employment, education), time contribution (number of hours per year and
years), training, and acknowledgement. This is the first study, chronologically, that I
found to explore relationships between motivations and demographics. The researchers
did not collect income data, which may be a factor that could enable or prevent
volunteering. The authors found that females rated the following motivators significantly
higher than males: helping the environment, career, learning, and values and esteem.
Volunteers over 40 years of age rated the following motivators significantly lower than
younger volunteers: user, project organization, and career.
Jacobson et al. (2012) found that the number of years of volunteer service was
positively correlated with helping the environment and negatively correlated with
advancing one’s career. The number of hours volunteered per year was significantly
correlated with social motivations. This is aligned with the findings by Ryan et al.
(2001) showing that social motivations were more important to volunteers who
participated frequently.
Tangible results of restoration work are also an important motivator for land
stewardship volunteers (Jacobson et al., 2012); this could translate to citizen science
volunteers who monitor ecosystems. However, it is important to note that the results
must be communicated to the volunteers in some form because the results for a monitor
are not immediately visible as they are for a land steward who may be pulling weeds or
planting trees (Roggenbuck, Haas, Hall, & Hull, 2001).
Many guidelines for volunteer management emphasize rewarding volunteers to
enhance participation (Jacobson et al., 2012). Rewards may come in many forms: verbal
30
appreciation, clothing, appreciation events, or recognition in a publication. Individuals
who are “users” of natural areas (e.g. hikers, fishermen, boaters, etc.) are motivated to
enhance, protect, or somehow be involved with an area they enjoy; managers could
reward these individuals with special access to restricted or difficult to reach areas. For
example, Reef Environmental Education Foundation rewards volunteers who have
completed a certain number of fish surveys and a certain level of training by inviting
them to accompany biologists on research boats (Nichols, 2014).
Although rewards are considered necessary for volunteer retention, Jacobson et al.
found that 12% of their survey respondents preferred no recognition (2012). Perhaps
these individuals are truly altruistic, or they may have other reasons, unstated, for
wanting no recognition. Roggenbuck et al. (discussed later in Section 2.5) also found
that a majority of volunteers did not want recognition (2001). This could be due to
societal perceptions of volunteering as altruistic, and thus the individual feels they should
not desire reward (Roggenbuck et al., 2001).
In summary, while “helping the environment” might be the most important reason
for a person to decide to start volunteering, this motivator is not necessarily what drives
volunteers to participate often or over time. This may be because “helping the
environment” is readily satisfied: the results of one’s actions are tangible in a short
amount of time (e.g. picking up trash, removing invasive species, planting trees,
maintaining trails). “Helping the environment” is probably a prerequisite for the
individual’s decision-making process for volunteering; the individual knows before
participating that they want to do something for the environment and that by volunteering
for a certain event or organization, that motive will be fulfilled. However, other

31
underlying factors cause this person to come back again and again. If the project is
disorganized, this will be apparent after one or two events and the person will not come
back if they feel their time is being wasted. If the person feels isolated during tasks, they
will probably not come back again. But if a person meets new people and feels like their
contributions are needed, they will be more likely to return to receive the social and ego
enhancement benefits again (Clary et al., 1998). Furthermore, all of these studies found
that “career advancement” was not a strong motivator. This is likely due to the
demographics of volunteers: most of them are over 40 years of age and either employed
or retired, so they are not looking for opportunities to network or enhance their skills.
Additionally, all but one of these studies evaluated volunteers as a single group with no
demographic variation. Although summaries of demographics are reported, there is no
exploration of relationships between age and gender with motivations. Young people
may have different motivations than older people while males and females may also have
differing motivations. These are gaps in the literature that I explore in my study.
2.4 Motivations to Participate in Citizen Science Projects
In this section I review articles on volunteer motivations specific to citizen
science projects. Recall that not all citizen science projects are oriented toward
environmental stewardship, but water quality monitors are citizen scientists because they
participate in the scientific process.
In a qualitative study conducted in Europe, researchers evaluated factors that
influence recruitment, retention, and volunteer motivations to participate in nine
biodiversity monitoring projects (Bell et al., 2008). In these projects, volunteers help

32
record observations and conduct surveys to assess the presence and distribution of
species and habitat types (Bell et al., 2008). The authors used semi-structured interviews,
focus groups, and participant observation and found that social experiences are important
to volunteers. This is in line with many environmental stewardship studies from the
previous section but contrasts with the findings from other citizen science studies
(discussed later in this section; Nov et al., 2014; Raddick et al., 2010) in which the
volunteers participate solely through an online platform, signifying that the type of
activity performed by volunteers is an important factor for motivations to participate.
This study teases apart the nuances between recruitment, retention, and
motivations to participate (Bell et al., 2008). Recruitment is achieved through visibility
of the project, which is predominately executed via advertisement: a high degree of
exposure can lead to a high degree of recruitment. Retention enables projects to build
long-term expertise in their volunteer base and reduces recruitment costs. The authors
found that sustained participation is dependent on “a combination of cognitive, social,
and emotional drivers” (Bell et al., 2008, p. 3448).
Two important emotional motivators were revealed. Volunteers enjoyed the
opportunity to socialize with like-minded people, and the opportunity to “be alone with
nature” – away from the everyday toils of life (Bell et al., 2008, p. 3449). The authors
found that social trust and bonding were critical elements in all projects, and projects
lacking these social elements also lacked volunteer commitment. This correlates with the
social function in the Volunteer Functions Inventory (VFI; Clary et al., 1998).
Volunteers associated positive feelings with being in nature and negative feelings
with the working world. This implies that people find sanctuary and comfort in the act of

33
volunteering outdoors, which correlates with the findings from Bruyere and Rappe
(2007) in the previous section. When volunteers go outdoors to work on a common task,
they find a sense of fellowship; they are compelled to share the meanings they find in
nature with each other. One volunteer informant clearly expressed this sentiment: “The
thing with birdwatching is it cuts boundaries. It doesn’t matter who you are… nobody
cares what background you are from… You are there to birdwatch” (Bell et al., 2008, p.
3449).
Another strong motivator, found in other studies as well, was the desire to learn –
new skills, knowledge, or the development of existing skills (Bell et al., 2008). This
motivation was found to be particularly strong in cases where learning was cyclical and
accompanied by social experience. For example, in many projects, the more experienced
volunteers teach the less experienced. Volunteers also expressed excitement to learn
from project leaders who are enthused to pass on their knowledge. Creating an
atmosphere of social learning is a key factor in sustained participation (Bell et al., 2008).
The relationship between volunteers and employees within the organizations is an
important factor in a couple of ways. One way is that recognition and feedback are vital
to volunteer retention (Bell et al., 2008). The authors advise project leaders to
communicate to volunteers the value and usefulness of the data they have collected
because volunteers like feeling they have a purpose for their actions. Another way that
relationships between professionals and volunteers influence participation is through
mutual trust and respect. When project leaders think of volunteers as incapable of
complex tasks, the tasks offered become limited and volunteers become frustrated by a
34
lack of interesting activities. However, when professionals treat volunteers as equals, the
project sees greater stability and continuity (Bell et al., 2008).
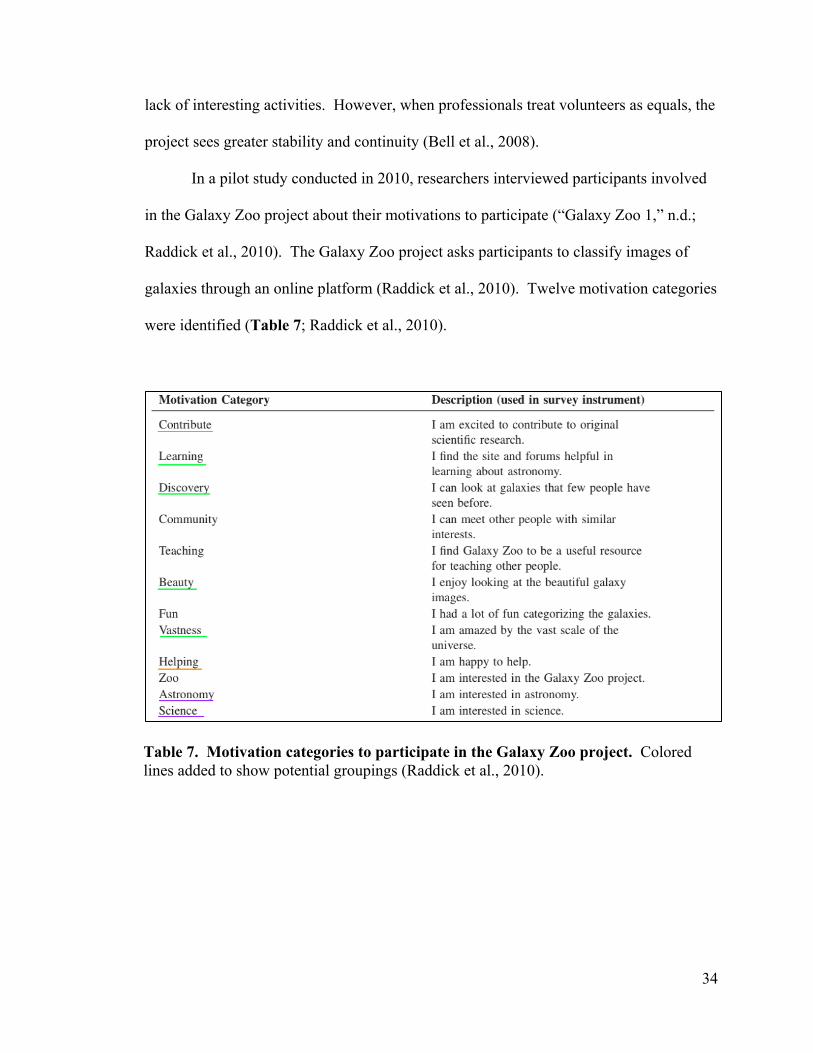
In a pilot study conducted in 2010, researchers interviewed participants involved
in the Galaxy Zoo project about their motivations to participate (“Galaxy Zoo 1,” n.d.;
Raddick et al., 2010). The Galaxy Zoo project asks participants to classify images of
galaxies through an online platform (Raddick et al., 2010). Twelve motivation categories
were identified (Table 7; Raddick et al., 2010).
Table 7. Motivation categories to participate in the Galaxy Zoo project. Colored lines added to show potential groupings (Raddick et al., 2010).
35
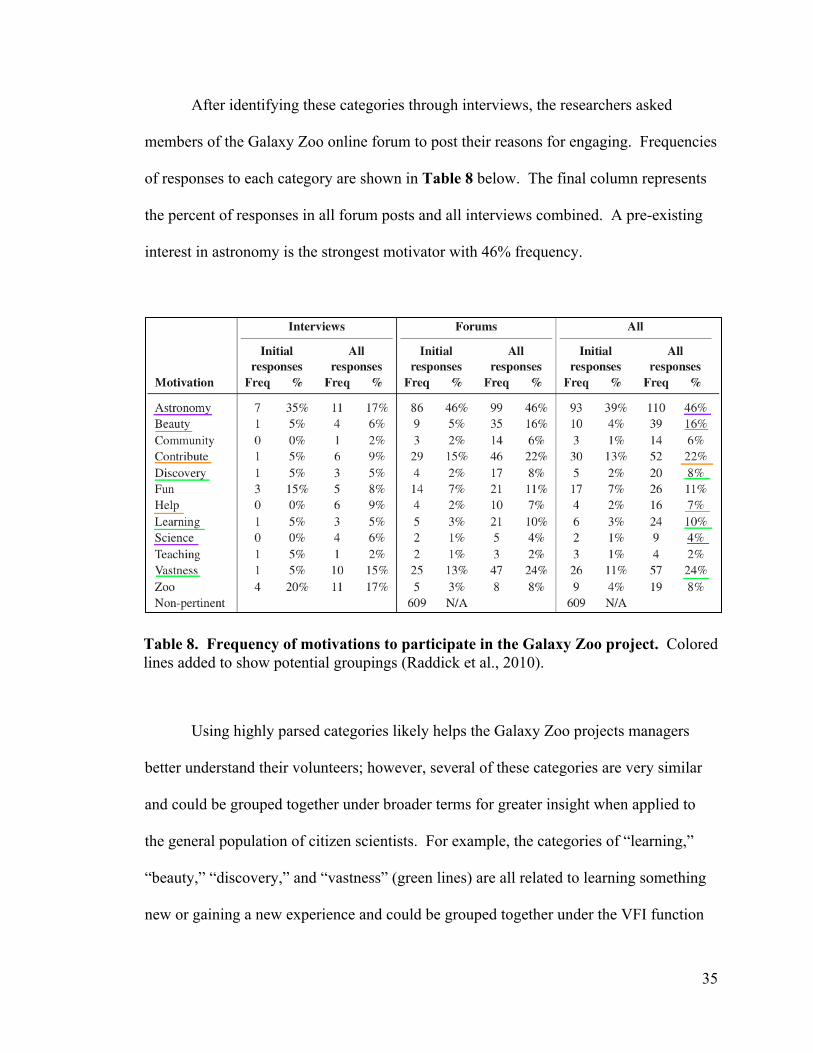
After identifying these categories through interviews, the researchers asked
members of the Galaxy Zoo online forum to post their reasons for engaging. Frequencies
of responses to each category are shown in Table 8 below. The final column represents
the percent of responses in all forum posts and all interviews combined. A pre-existing
interest in astronomy is the strongest motivator with 46% frequency.
Table 8. Frequency of motivations to participate in the Galaxy Zoo project. Colored lines added to show potential groupings (Raddick et al., 2010).
Using highly parsed categories likely helps the Galaxy Zoo projects managers
better understand their volunteers; however, several of these categories are very similar
and could be grouped together under broader terms for greater insight when applied to
the general population of citizen scientists. For example, the categories of “learning,”
“beauty,” “discovery,” and “vastness” (green lines) are all related to learning something
new or gaining a new experience and could be grouped together under the VFI function
36
“understanding.” Collectively, these represent 58% of responses, revealing that the
desire for new knowledge is a stronger motivator than a pre-existing interest in
astronomy, even if “astronomy” and “science” (purple lines) are summed to 50%
frequency. Similarly, the categories “contribute” and “help” (orange lines) could be
joined and categorized under the values function of the VFI, bringing their total to 29%
frequency, the third strongest motivator. In fourth place, “fun” (having fun completing
tasks) is a relatively weaker motivator, but still garners 11% frequency.
Finally, the category “community” (meeting or interacting with others with
similar interests) represents one of the weakest motivators with only 6 percent frequency.
This number, although low, is likely an overestimate and unrepresentative of Galaxy
Zoo’s participants because only about seven percent of 160,000 volunteers are members
of the forum and only eight percent of the forum members responded; additionally, the
responses were conveniently collected, not randomly sampled. Thus, some volunteers
belonging to the forum are motivated by the opportunity to be part of a community, but
this is not likely a factor for the majority of volunteers due to the fact that participation
takes place entirely online.
In a 2014 study published as a conference proceeding, participants in citizen
science projects from three countries were interviewed about initial and long-term
motivations to participate (Rotman et al., 2014). The projects were located in the United
States, India, and Costa Rica. The projects are not described, so the type of activities
performed by volunteers is unknown. Interviewees were selected based on purposeful
and snowball sampling, wherein interviewees point to other potential interviewees, in
order to create a rich portrait rather than a representative sample (Rotman et al., 2014).
37
The resulting themes from the interviews show that initial participation is highly
motivated by self-interest (which could be considered ego enhancement under the VFI),
whereas the motivation for long-term participation is more complex and de-motivators
become a factor (Rotman et al., 2014).
Four factors strongly motivated initial participation: personal interests, self-
promotion, self-efficacy, and social responsibility (Rotman et al., 2014). Interviewees
expressed a desire to use their volunteer time to pursue personal interests, such as the
opportunity to learn something new, to further an existing hobby, or to enhance
relationships with friends and family through a shared experience. Self-promotion
motivated one interviewee through the opportunity to gain experience and make an
addition to his resume. The extent to which a project enhanced a volunteer’s sense of
self-efficacy, the belief in one’s own ability to complete tasks (“Self-efficacy,” n.d.),
resulted in “feelings of equality and control over the scientific process” (Rotman et al.,
2014, p. 115). Self-efficacy as a motivator resonated strongly in Costa Rican
interviewees who enjoyed open access to their data. Feelings of “social responsibility
toward natural resources” also motivated Costa Ricans on a moral level, but not Indians
or Americans (Rotman et al., 2014, p. 115).
Rotman et al. found five motivators influencing long-term participation: trust,
communication, acknowledgement, mentorship, and external relationships (2014). The
authors found scientists and volunteers were more likely to develop interpersonal
relationships and trust when the structure of the project was more centralized, allowing
volunteers and scientists to work together; however, the authors failed to relate this issue
back to how it influences long-term participation. It could be inferred that volunteers are

38
more likely to continue participation if they feel comfortable working with scientists and
project leaders, but this is not clearly stated in the study. Communicating goals,
expectations, outcomes, and upcoming events on a regular basis encouraged volunteers to
participate for longer periods (Rotman et al., 2014). This relates best to “project
organization” as a motivator found in other studies from the previous section (Bruyere &
Rappe, 2007; Ryan et al., 2001).
Essential to promoting long-term participation is acknowledgement of the
volunteers’ contributions (Rotman et al., 2014). Acknowledgement can take almost any
form, from a simple recognition to formal events showcasing volunteer work; however,
more “scientifically valid” attributions were more highly valued. Volunteers who found
their data published without attributions were disappointed (Rotman et al., 2014).
Acknowledgement would probably best fit in the ego enhancement function of the VFI
because it is a form of reward that enhances self-esteem.
Also contributing to long-term participation is mentorship (Rotman et al., 2014).
Mentorship takes the form of education, training, and closeness with scientists.
Volunteers appreciate opportunities to meet with scientists and to advance their
knowledge and abilities. Mentorship also benefits the research because well-trained
volunteers collect high-quality data and are more deeply committed to the project.
Finally, the external relationships developed by volunteers with community
members were also found to play a role in long-term participation (Rotman et al., 2014).
Many volunteers found that citizen science has the capacity to affect their immediate
environment and were inspired to reach beyond the project by becoming a liaison
between the local and scientific communities. By educating themselves through

39
participation, the volunteers were empowered to increase awareness and education about
eco-social issues in their communities. Being able to see the project’s “broader impact
on scientific advancements and their own communities” motivated volunteers toward
long-term and more complex involvement (Rotman et al., 2014, p. 119). Although not
explicitly stated in the study, this motivator is more reflexive than others: long-term
participation inspires outreach and reveals palpable impact, which causes a positive
feedback motivating further participation.
Over time, participation rates were reported to drop, which could be due to a lack
of motivational factors or the emergence of de-motivating factors, such as excessive time
demands and poor use of technology (Rotman et al., 2014). Participation is curtailed
when project leaders and volunteers have different expectations about how much time
should be dedicated to a task. Some volunteers jump at the opportunity to participate in
time intensive projects because their sense of self-efficacy is augmented; however most
volunteers balk at time intensive tasks (Rotman et al., 2014). Inadequate or overly
complex technologies can cause frustration and disenchantment among volunteers due to
poor accessibility and poor usability. Projects that minimized technological barriers and
enabled facile task completion were able to retain volunteers for longer periods (Rotman
et al., 2014).
In a 2014 study focused on motivations of participants in online citizen science
projects, the researchers assessed what drives the quantity and quality of contributions.
In this study quantity “refers to the total amount of what is produced,” or frequency of
participation, and quality is “a degree of excellence of what is produced,” or expertise
(Nov et al., 2014, p. 2). A web-based survey was sent to volunteers of three

40
organizations, with a total of over 3,000 responses and a 28% response rate (Nov et al.,
2014). This study has the largest number of responses by far of any study on volunteer
motivations in citizen science. This study is the first so far in the literature on citizen
science volunteers to conduct a quantitative survey.
The motivations were categorized into four groups: collective, intrinsic rewards,
norm-oriented, and reputation (Nov et al., 2014). Collective motives relate to the value
one ascribes to the aggregate goals of the project. Collective motives would fall into the
values function of the VFI. Intrinsic reward comes from the enjoyment from or interest
in the tasks done by the volunteers. Norm-oriented motives relate to “expected reactions
of important others such as family and friends” (Nov et al., 2014, p. 3). Norm-oriented
motives would fall into the social function of the VFI. Reputation motives relate to
receipt of appreciation for contributions or recognition of status. Reputation motives
would best fit in the ego enhancement function of the VFI.
The researchers asked participants to respond to statements by indicating their
level of agreement on a Likert scale of one to seven (Nov et al., 2014). The results
showed that frequency of participation (contribution quantity) was driven by the
following motivators (mean score out of 7): collective (6.26), intrinsic (5.88), norm-
oriented (4.56), and reputation (3.64). This indicates that volunteers care more about
helping the project meet its goals than about personal gain, but enjoyment is almost as
important as helping the project.
Contribution quality, on the other hand, had a positive correlation with only two
of the motivators – collective and reputation – and a negative correlation with norm-
oriented and intrinsic motivators (Nov et al., 2014). The authors suggest that reputation
41
motivates volunteers when a performance metric is made visible to the public. The
authors also found that extrinsic motivators, such as reputation, reinforce intrinsic
motivators. This happens particularly when there is a trusting, reciprocal relationship
between citizens and professionals in the organization (Nov et al., 2014).
This study also considered age, gender, and level of computer expertise as
independent variables, showing that researchers are starting to investigate demographics
as possible explanatory variables for variations in motivators. Younger people were
found to contribute more frequently (Nov et al., 2014); however no age range is defined
for “young” or “old” in the paper. Gender had no significant effect. Computer expertise
had no significant effects, except for in one project where the tasks were relatively more
complex than the other projects (Nov et al., 2014).
The results of this study indicate that collective motivators (or the values function
in the VFI) influence both quantity and quality of participation. Managers should
emphasize collective motivators by encouraging commitment to the goals of the project,
which can be accomplished by communicating the mission and achievements (Nov et al.,
2014). Norm-oriented, intrinsic, and reputation motivators could be enhanced through
social networks that recognize the quality of an individual’s participation and through a
structure that allows volunteers to increase their expertise and responsibility over time
(Nov et al., 2014). Many online citizen science projects are limited in the latter capacity
because they ask their participants to complete relatively simple, repetitive tasks;
Embracing a structure that allows volunteers to progressively take on more responsibility
both enhances the motivation to participate and allows the staff to delegate
responsibilities, enabling the project to grow (Nov et al., 2014).
42
In summary, citizen science volunteers have many reasons for participating.
Echoing the motives of environmental stewardship volunteers, citizen scientists are
motivated by learning, socializing, and recognition. Unique motives to citizen science
volunteers are the desire to contribute to scientific knowledge and the opportunity to
work with scientists. It is important that the scientists and project leaders have good
working relationships with the volunteers and treat them as equals in the process. Citizen
scientists are discouraged from participation by mismatched expectations, time barriers,
and poor use of technology.
2.5 The Overlap: Motivations to Participate in Water Quality Monitoring
The published literature specific to water quality volunteer motivations is
extremely limited. Although there are many papers on general water quality monitoring
topics, I was only able to find one study that empirically assessed volunteer motivations.
In this study, the researchers utilized focus groups to inform the development of a survey
that was sent to volunteers of Save Our Streams (SOS) in Virginia (Roggenbuck et al.,
2001). The focus groups revealed nine motivational categories: “nostalgia, protect the
environment, guard against local threats, be of service, teach, learn, be social, enjoy
nature, and career growth” (p. xvii).
While most of these categories are self-explanatory, “nostalgia” merits a brief
explanation. Many people who grew up active in the outdoors (hunting, fishing,
camping, or playing) and have positive memories of those activities, perceived stream
monitoring as an extension of their previous outdoor activity (Roggenbuck et al., 2001).
Quotes from volunteers suggest that monitoring is a reason to go outside and it feels “like

43
a natural progression” from current interests (p.xvii). Negative memories also played a
role in motivating some volunteers: One volunteer mentioned looking for “critters” in her
backyard stream as a child and never finding any, but by being involved with SOS she
could find them in other streams (p. xviii). “Nostalgia” did not appear in the survey.
The survey asked respondents to rate motivations on a five-point scale from “not
at all important” to “very important” (Roggenbuck et al., 2001, p. xlii). Similar to other
environmental volunteer studies, the average age of respondents was 41 years, most
(78%) had completed at least a college degree, and most (70.9%) were employed.
Motivation ratings mirrored those of environmental volunteers: the highest rated category
was “protect the environment” and the lowest rated category was “career growth.” Other
important motivators revealed from the survey were “learning, “teaching,” “to be of
service,” “for nature enjoyment,” “to be social,” and “to guard against local threats”
(Table 9; Roggenbuck et al., 2001, p. xliii).
Table 9. Motivations to participate in Save Our Streams. Motivations are in order of highest to lowest mean score. Responses were weighted from 1 for “not all important” to 5 “very important” (Roggenbuck et al., 2001).
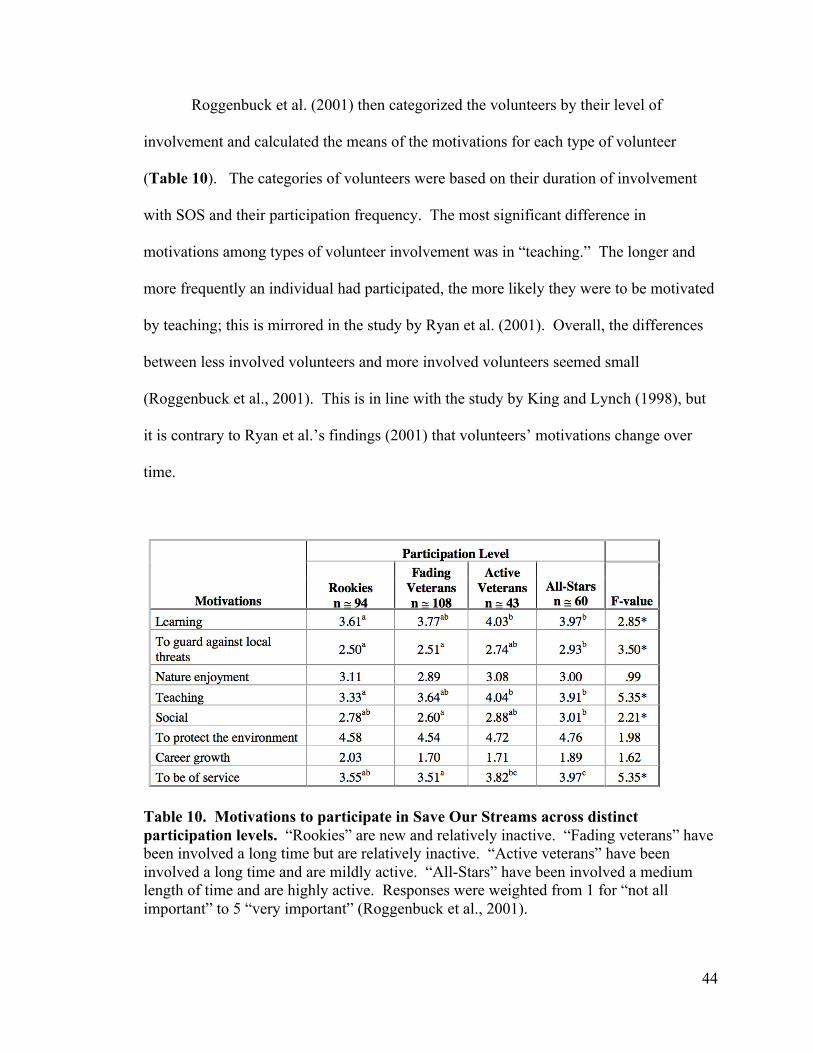
44
Roggenbuck et al. (2001) then categorized the volunteers by their level of
involvement and calculated the means of the motivations for each type of volunteer
(Table 10). The categories of volunteers were based on their duration of involvement
with SOS and their participation frequency. The most significant difference in
motivations among types of volunteer involvement was in “teaching.” The longer and
more frequently an individual had participated, the more likely they were to be motivated
by teaching; this is mirrored in the study by Ryan et al. (2001). Overall, the differences
between less involved volunteers and more involved volunteers seemed small
(Roggenbuck et al., 2001). This is in line with the study by King and Lynch (1998), but
it is contrary to Ryan et al.’s findings (2001) that volunteers’ motivations change over
time.
Table 10. Motivations to participate in Save Our Streams across distinct participation levels. “Rookies” are new and relatively inactive. “Fading veterans” have been involved a long time but are relatively inactive. “Active veterans” have been involved a long time and are mildly active. “All-Stars” have been involved a medium length of time and are highly active. Responses were weighted from 1 for “not all important” to 5 “very important” (Roggenbuck et al., 2001).

45
The survey also asked respondents to indicate their preferences about recognition
of their contributions. Surprisingly, 63.7% indicated that they do not need recognition,
contrary to common volunteer management recommendations (Table 11; Roggenbuck et
al., 2001). However, almost 30% of “All-Stars” and 11% of “Rookies” indicated that
some form of recognition was important, although the specific type of recognition did not
matter. The response of the SOS volunteers may be indicative that volunteers may feel
they are not supposed to want recognition for an activity that is often considered altruistic
by society (Roggenbuck et al., 2001). This may also reflect a self-report bias and a
limitation of the survey format. Volunteers may not be fully candid about this topic, but
an interview may be able to better assess a volunteer’s true feelings. Further, recognition
may motivate some volunteers in a subtle way that the individual does not overtly
recognize.
Table 11. Save Our Stream volunteer preferences for types of recognition. Respondents could select all that apply (Roggenbuck et al., 2001).
During the focus groups, volunteers expressed a strong desire for an increased use
of citizen-collected data by government agencies and for more feedback about how the
data is being used, specifically to protect streams (Roggenbuck et al., 2001). This is an

46
issue that has not been explored by any other study on citizen science motivations, but it
is one that strongly influenced the topic choice for this thesis. In my previous research on
water quality monitoring organizations, I found a substantial lack of data-use for
regulation or protection enforcement, and this seemed like an issue that would discourage
volunteers from continued participation. This also reinforces the imperative need for
managers to communicate the results of the organization’s efforts to their volunteers.
Volunteers also expressed a need for more effective leadership, in the form of a
full-time staff member responsible for volunteer coordination (Roggenbuck et al., 2001).
This need is related to the motive “project organization” in other studies. Volunteers
noted that continuity is important, and when the entire program depends on volunteers, it
has potential to collapse. They also expressed that being part of a team with a strong,
organized leader was an important reason for their continued involvement with the
program: “full-time paid regional coordinators would help substantially in retaining and
satisfying current volunteers” (Roggenbuck et al., 2001, p. xxvi). This is supported by
survey respondents who indicated they did not want to make decisions about the
organization in the study by Ryan et al. (2001).
2.6 Summary
While the tasks asked of the volunteers are quite different between citizen science
projects and environmental stewardship projects, both have similar end goals – to connect
people with their environment and, in most cases, to enhance the environment in some
capacity. Water quality monitoring projects share overlapping qualities with the two
groups because they collect data and engage in environmental stewardship.
47
There are several overlapping themes between motivations for volunteers in
citizen science projects and in environmental stewardship projects. The opportunity to
socialize is a repeating theme, as well as the opportunities to learn, to teach, and to help.
For environmental stewardship, the motive “to help” is specifically for the environment,
but for citizen science projects, “to help” is also for the organization and for the
accumulation of scientific knowledge.
Because water quality monitors are both citizen scientists and environmental
stewards, they are likely to have motivations that are similar to both groups. The study
by Roggenbuck et al. (2001) exemplifies the motivations for water quality monitors: to
help the environment, to learn and teach, to socialize, to be of service, project
organization, communication, and collection of useful data. Career growth was
consistently rated as the least important motivator across all studies. The importance of
recognition is inconclusive. Some researchers find recognition is very important while
others find just the opposite.
More important than recognition may be sharing with the volunteers the impact of
the volunteers’ work. Volunteers want to know that their effort has had an effect. This is
particularly important for water quality monitors, because, unlike environmental stewards
who may see immediate results by pulling weeds or planting trees, monitors do not
instantly see the results of the data they have collected. This is made evident by the
desire of SOS volunteers to see an increased use of data by protection agencies – they
want to see that streams are cleaned up because of their monitoring.
While “helping the environment” is rated as the highest motivation for all
environmental stewardship volunteers, it is important to remember that this motivation is
48
not enough to retain volunteers. Each volunteer has multiple reasons for participating
and they will only participate for as long as those motivations are fulfilled (Clary et al.,
1998). Project managers might be able to hook a volunteer with environmental
motivations, but the activities offered need to address a variety of motivations to enhance
involvement over time. Frequent opportunities to participate are an excellent way to
create social motivation – the more often events occur, the more likely volunteers will
develop relationships, and the opportunity to see a familiar face will continue to motivate
the volunteer.
Researchers and project coordinators would benefit from a more standardized
method to assess volunteer motivations. The Volunteer Functions Inventory (VFI)
developed by Clary et al. (1998) provides a useful starting point to develop a standard
framework to assess volunteer motivations. However, the VFI is limited in some ways.
Many motivators may fall into more than one functions category, and it is also limited in
scope. For example, the VFI does not take into account extrinsic motivators such as
project organization and communication from the staff to the volunteers. It also does not
consider physical well-being as a motivator, although this could fit into ego enhancement
if maintaining physical well-being enhances one’s self-esteem. Finally, some intrinsic
motivators, such as having fun or being a user of an area, also do not fit well in the VFI.
Overall, the strongest motivators from these studies fell into the values and ego
enhancement functions, the weakest motivators fell into the career function, and the
social function appears to have the most influence on long-term motivation. Project
coordinators should remember that volunteers have multiple reasons for volunteering and
they will only volunteer for as long as they continue to receive psychological benefits
49
(Clary et al., 1998; King & Lynch, 1998). Project managers should be wary of de-
motivating factors, which include mismatched expectations, poor organization, and poor
use of technology. Recognition may enhance volunteer retention, but the results are
inconclusive. Further research is needed to determine how strongly this influences
participation. Finally, more studies need to explore the relationships between
demographics and motivators. If there are significant differences between differing
demographics, this information will be extremely useful to project coordinators who
want to tailor their recruitment and retention campaigns.
50
Chapter 3: Methods
3.1 Introduction
This chapter will describe the design of the study and the methods used to collect
and analyze data. This study was approved by the Institutional Review Board of the
Evergreen State College, Olympia, WA.
3.2 Study Design
The purpose of my thesis research is to gain an understanding of volunteer
motivations to participate in citizen science projects that have a focus on environmental
stewardship. To complete this research, I surveyed volunteers from eight organizations
that monitor water quality because this activity reflects a unique characteristic of those
volunteers who want to contribute both to environmental protection and the scientific
process. I surveyed volunteers using a web-based questionnaire with multiple choice and
Likert-type questions. Likert-type questions ask respondents to indicate their opinion
with a five-point response format, which generally use words ranging on the continuum
from “strongly disagree” to “strongly agree.” I analyzed the results using quantitative
descriptive statistics. The following sections in this chapter give more details of the
survey and analyses.
I expect to find that motivations vary by demographics: age, gender, frequency of
participation, and length of involvement with the organization. Motivational factors may
be intrinsic or extrinsic. Intrinsic motivators come from within the individual and include
personal interests, being outdoors, socializing, helping the environment, and learning
51
something new. Extrinsic motivators come from outside the individual, such as weather,
training, and rewards.
To recruit organizations to participate in my study, I sent a call for research
participants to several listserv groups based in the United States (Appendix A:
Recruitment Details). I stated that I was looking for organizations with volunteers that
monitor water quality. I purposely left out specific parameters, because I was hoping to
capture a broad array of monitoring activities including, but not limited to, chemical tests,
secchi disk clarity tests, and macroinvertebrate monitoring.
I asked staff members of participating organizations to send emails to their
volunteer base with a link to an electronic survey. The staff members sent reminder
emails roughly once per week. I provided optional material for staff members to use to
promote the survey (Appendix A: Recruitment Details). The survey opened February
18, 2015 and closed March 13, 2015. Some organizations felt that once per week was too
frequent and thus sent fewer emails. One organization also posted the survey to their
webpage on Facebook.com (Appendix B: Participating Organizations). As a way of
incentivizing participation, all respondents who completed the survey had the option to
be entered in a random drawing for one of ten subscriptions to National Geographic.
3.3 Survey Design and Data Collection
Because I anticipated a large number of responses, I created a survey with
quantitative responses. A qualitative survey with open-ended questions might provide a
richer picture with unanticipated responses, but the main driver of my choice is that I
wanted to survey hundreds of volunteers across several organizations, and given the time
52
limits, a quantitative study is more efficient. Further, many previous studies have
conducted qualitative research and have revealed both the major and nuanced
motivations, which I have incorporated into my survey. By surveying many volunteers
from several organizations, the results will be useful and generalizable to a larger
population.
The survey is comprised of an introduction, an informational letter detailing the
project, a consent form, 27 questions, and a thank you page inviting respondents to enter
the drawing for one of ten National Geographic subscriptions (Appendix C: Survey).
The first section of the survey asked for demographics: age, gender, having children
under 18, education, employment, personal income, and household income. Responses to
these questions may give an indication of potential leisure time. For example, a person
who has no children under 18, is unemployed or earns less than half of the household
income, may be more able to volunteer than someone with young children and a full-time
job.
The next section asked volunteers about their typical volunteering activities and
habits. This allowed me to identify if the volunteers were actually participating in the
scientific aspects of the project. Respondents also indicated in which year they began
volunteering, how often, and how much time they usually spend at each volunteer event.
The remainder of the survey asked about motivations with Likert-type questions.
Likert-type questions are often used in the social sciences to measure relative attitudes
and opinions (Gliem & Gliem, 2003). Likert-type response alternatives may be
weighted, which is helpful to quantify variables that are not directly measurable. Studies
have shown that use of a 5-point or 7-point response format is the optimal choice to use

53
for reliability and validity; fewer points decrease reliability and validity while more
points do not improve either any further (Dawes, 2008). I chose a 5-point response
format for ease of use both for the respondents and for analysis. I describe using Likert-
type questions in more detail in the next section.
The survey questions were crafted based on the information I gleaned from the
literature review (see Chapter 2), my own ideas about volunteering, discussions with
peers who have participated in citizen science projects, and feedback from my thesis
advisor. Six people took my survey before it was finalized. In the creation of my survey,
I strove to reflect what is known in the literature so that I could compare my results to the
results of the literature, while also adding unique elements to gain new insights.
3.4 Using the Likert Scale and Likert-type Questions
The Likert scale and Likert-type questions are different concepts that need to be
described for clarity. Carifio and Perla (2007) point out that many authors do not use the
correct terms when discussing Likert scales, Likert-type questions, and scales, and that
this has caused confusion and methodological error. The following is my attempt to help
my reader understand, to the best of my ability, the concepts associated with the Likert
scale.
The Likert Scale
The original Likert scale was developed by Rensis Likert in 1932 as a method to
measure attitudes, opinions, and personality traits (Boone & Boone, 2012; Gliem &
Gliem, 2003; Likert, 1932). The original Likert scale consists of a series of statements or

54
questions that are combined to create an index measurement of an attitude or trait (Boone
& Boone, 2012; Gliem & Gliem, 2003; Likert, 1932). This is known as a summated
scale (Clason & Dormody, 1994). Each question within the series of Likert’s original
scale has five response alternatives: strongly approve, approve, undecided, disapprove,
and strongly disapprove (Table 12; Boone & Boone, 2012; Clason & Dormody, 1994).
The five response alternatives are collectively called the response format, which is
commonly – but incorrectly – called a scale (Carifio & Perla, 2007). This is where much
of the confusion sets in because the Likert scale is a series of questions with a set of
response alternatives that may also be scalar (e.g. “strongly agree” is greater than
“agree,” which is greater than “disagree” and so on; Carifio & Perla, 2007).
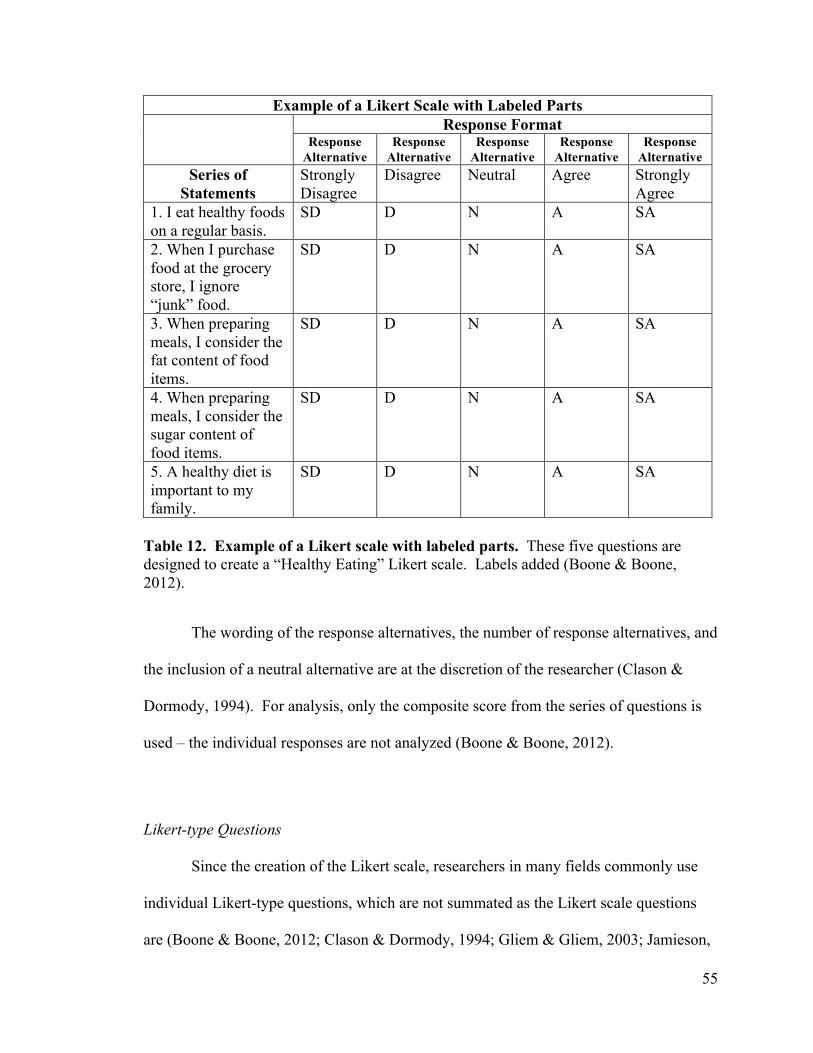
55
Example of a Likert Scale with Labeled Parts Response Format
Response Alternative
Response Alternative
Response Alternative
Response Alternative
Response Alternative
Series of Statements
Strongly Disagree
Disagree Neutral Agree Strongly Agree
1. I eat healthy foods on a regular basis.
SD D N A SA
2. When I purchase food at the grocery store, I ignore “junk” food.
SD D N A SA
3. When preparing meals, I consider the fat content of food items.
SD D N A SA
4. When preparing meals, I consider the sugar content of food items.
SD D N A SA
5. A healthy diet is important to my family.
SD D N A SA
Table 12. Example of a Likert scale with labeled parts. These five questions are designed to create a “Healthy Eating” Likert scale. Labels added (Boone & Boone, 2012).
The wording of the response alternatives, the number of response alternatives, and
the inclusion of a neutral alternative are at the discretion of the researcher (Clason &
Dormody, 1994). For analysis, only the composite score from the series of questions is
used – the individual responses are not analyzed (Boone & Boone, 2012).
Likert-type Questions
Since the creation of the Likert scale, researchers in many fields commonly use
individual Likert-type questions, which are not summated as the Likert scale questions
are (Boone & Boone, 2012; Clason & Dormody, 1994; Gliem & Gliem, 2003; Jamieson,

56
2004). Likert-type questions are single items with response alternatives similar to those
of the original Likert scale, and these items are analyzed separately (Table 13; Boone &
Boone, 2012; Clason & Dormody, 1994). Some authors criticize the use of single-item
questions to measure psychological attributes, claiming that they are unreliable due to
measurement error (Gliem & Gliem, 2003). Single-item questions also lack the ability to
measure a fine degree of differences and to represent complex concepts (Gliem & Gliem,
2003).
Example of Likert-type Items with Labeled Parts Response Format
Response Alternative
Response Alternative
Response Alternative
Response Alternative
Response Alternative
Statements Strongly Disagree
Disagree Neutral Agree Strongly Agree
1. 4-H has been a good experience for me.
SD D N A SA
2. My parents have provided support for my 4-H projects.
SD D N A SA
3. My 4-H involvement will allow me to make a difference.
SD D N A SA
4. My 4-H advisor was always there for me.
SD D N A SA
5. Collegiate 4-H is important in the selection of a college.
SD D N A SA
Table 13. Example of Likert-type items with labeled parts. Labels added (Boone & Boone, 2012).

57
Analysis
The response alternatives for Likert-type questions are considered ordinal data
because the responses are ordered, but the interval between responses are immeasurable
and not necessarily equal (Allen & Seaman, 2007; Boone & Boone, 2012; Jamieson,
2004). To clarify, “strongly agree” is greater than “agree,” but there is no measurement
of how much greater (Boone & Boone, 2012).
In contrast, Likert scale data are considered interval data because the results are
acquired from a composite score (sum or mean) of several questions (Boone & Boone,
2012). The composite scores can be analyzed as interval data because they reflect order
and a measurable distance between scores (Allen & Seaman, 2007; Boone & Boone,
2012). For example, four units are greater than three units by one unit.
Ordinal data and interval data require different types of analyses: means may
used for Likert scale data, and modes (not means) should be used for Likert-type data
(Table 14). Only non-parametric tests should be used for ordinal data; however, many
authors ignore the rules and use ANOVA or t-test for Likert-type data, which continues
to be controversial (Allen & Seaman, 2007; Jamieson, 2004). Likert scales should be
analyzed with parametric tests if assumptions of normality are met (Allen & Seaman,
2007). However, Clason and Dormody (1994) argue that analyzing Likert-type data is
not a matter of right or wrong; it is a matter of meaningfully answering the research
question. Thus many researchers use the mean and the mode for Likert-type items.

58
Appropriate Analyses for Likert-type and Likert Scale Data Likert-type (ordinal)
Data Likert Scale (interval) Data
Sources
Central Tendency Median or mode Mean (Allen & Seaman, 2007; Boone & Boone, 2012; Jamieson, 2004)
Variability Frequencies or percentages
Standard deviation (Allen & Seaman, 2007; Boone & Boone, 2012; Clason & Dormody, 1994; Jamieson, 2004)
Associations Kendall’s tau b or c Pearson’s r (Boone & Boone, 2012; Clason & Dormody, 1994)
Other Statistics Non-parametric tests: Chi-square, Spearman’s rho, Mann-Whitney U-test
ANOVA, t-test, regression
(Allen & Seaman, 2007; Boone & Boone, 2012; Clason & Dormody, 1994; Jamieson, 2004)
Reliability and validity
Cronbach’s alpha, Kappa test
(Allen & Seaman, 2007; Gliem & Gliem, 2003)
Table 14. Appropriate analyses for Likert-type and Likert scale data.
3.5 Data Analysis
All complete surveys were included in the dataset. Incomplete surveys were
included if the respondent answered most of the demographic questions and at least some
of the motivation questions. Incomplete surveys were excluded if the respondent did not
answer any motivation questions. Surveys were excluded if the respondent failed to
indicate their membership of a participating organization. All responses were aggregated
for analysis.
I found the percent of total for demographic responses and I found the percent of
responses and modes for Likert-type responses. Because the mean is often used in

59
practice for Likert-type items, I also used the mean in some cases to find patterns of
preferences across different types of volunteers based on age, gender, and length of
involvement.
Likert-type responses were weighted for analysis from 1, representing “never,”
“not at all likely,” “strongly disagree,” or “not at all meaningful” to 5, representing
“always,” “extremely likely,” “strongly agree,” or “very meaningful.” Most questions
also had a response option of “N/A” (or not applicable), which was given no weight.

60
Chapter 4: Results and Discussion
4.1 Participating Organizations
A total of eight organizations participated in this study (Table 15). The survey
was emailed to 1,045 volunteers across the eight organizations. The total number of
responses was 271 and the overall response rate was 25.9%. One organization, Maine
Volunteer Lake Monitoring Program, represented 48% of the total responses, which may
be a source of bias (Figure 2). Another organization, University of Rhode Island
Watershed Watch Program, comprised 27% of the total responses. A third organization,
South Yuba River Citizens League, constituted 11% of the responses while the remaining
five organizations comprised less than 4% each. (See Appendix B: Participating
Organizations for more details about each organization including websites and types of
monitoring activities.)

61
Participating Organizations
Organization Location
Number of volunteers who were sent the
survey via email
Number of responses received
Response rate
South Yuba River Citizens League (SYRCL)
California: Nevada City
57 30 52.6%
Maine Volunteer Lake Monitoring Program (VLMP)
Maine: statewide
466 130 27.9%
North Pond Association of Maine (NPA)
Maine: Mercer, Smithfield, and Rome
15 10 66.7%
Boquet River Association (BRASS)
New York: Elizabethtown
4 53 125.0%
University of Rhode Island Watershed Watch Program (URIWW)
Rhode Island: statewide
360 74 20.6%
Nisqually River Education Project (NREP)
Washington: Thurston County
49 10 20.4%
South Sound Global Rivers Environmental Education Network (GREEN)
Washington: Thurston County
24 7 29.2%
Stream Team Washington: Thurston County
70 5 7.1%
Total: 1045 271 Overall Response Rate:
25.9% Table 15. Participating organizations and corresponding response rates.
3 For unknown reasons, Boquet River Association returned more responses than were emailed.

62
Figure 2. Number of responses per organization and percent of total responses.
4.2 Demographics
Most survey respondents were over age 50 (86%), the age group with the most
responses was 60-69 (37%), and thirteen respondents were over age 80 (5%; Figure 3).
The respondents were split fairly evenly between male (55%) and female (44%); 1%
preferred not to answer. Most were well educated (35% with a bachelor’s degree and
45% with a graduate degree). Respondents that reported income were not necessarily
affluent; however, about one-fifth of respondents chose not to answer the question.
Respondents reported both personal income and household income. For personal
income, about 21% of respondents earned less than $25,000, 23% earned between
$25,000 and $50,000, while 16% earned over $75,000. The household income was
11.1%
48.0%
3.7%
1.8%
27.3%
3.7%
2.6%
1.8%
0 20 40 60 80 100 120 140
California: SYRCL
Maine: VLMP
Maine: NPA
New York: BRASS
Rhode Island: URIWW
Washington: NREP
Washington: South Sound GREEN
Washington: Stream Team
Number of Responses per Organization
Response Count
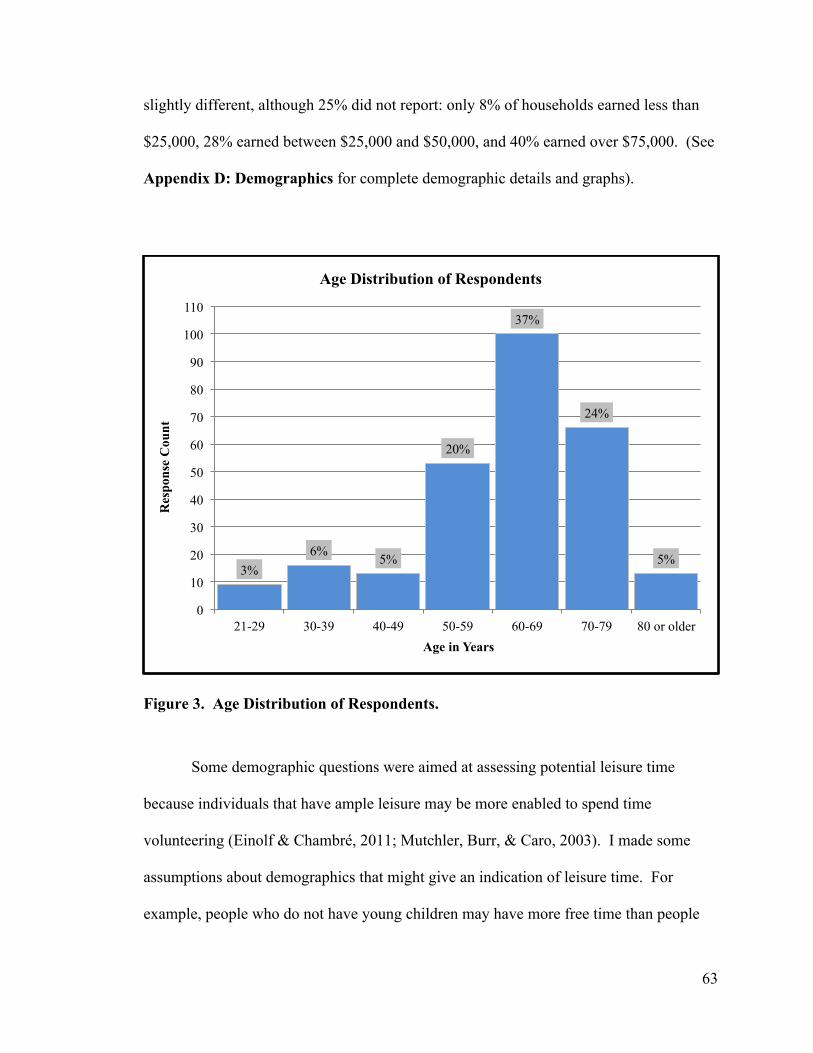
63
slightly different, although 25% did not report: only 8% of households earned less than
$25,000, 28% earned between $25,000 and $50,000, and 40% earned over $75,000. (See
Appendix D: Demographics for complete demographic details and graphs).
Figure 3. Age Distribution of Respondents.
Some demographic questions were aimed at assessing potential leisure time
because individuals that have ample leisure may be more enabled to spend time
volunteering (Einolf & Chambré, 2011; Mutchler, Burr, & Caro, 2003). I made some
assumptions about demographics that might give an indication of leisure time. For
example, people who do not have young children may have more free time than people
3% 6% 5%
20%
37%
24%
5%
0
10
20
30
40
50
60
70
80
90
100
110
21-29 30-39 40-49 50-59 60-69 70-79 80 or older
Res
pons
e C
ount
Age in Years
Age Distribution of Respondents
64
that do have young children, or individuals who are not responsible for earning the
majority of the household income may have more free time than the significant income
earner of the house. Employment or student status may also affect potential leisure time.
I found that some of the assumptions held up, while others did not. Factors
indicating that respondents may have more leisure time than other adults include: not
having young children, not being a full-time student, and being retired. A large majority
of respondents did not have children under 18 years old (89%) and were not students
(97%). As expected from previous research, a large portion of respondents was retired
(45%; Appendix D: Demographics).
There were also factors indicating that respondents do not necessarily have more
leisure time than other adults. About one-third was employed full-time (32%) and one-
sixth was employed part-time (17%). Of the respondents that reported income, most
earned at least half of the household income (84%) and 38% earned all of the household
income. However, because such a large portion of respondents were retired, it is likely
that that many of the respondents who earned at least half of the household income are
now retired. Thus this variable may be confounded with other factors.
4.3 Volunteer Activity and Performance
To gain a deeper understanding of volunteer activities and preferences, I asked
several questions related to activity and performance. First I wanted to ensure that most
of the respondents to my survey were citizen scientists, so I asked respondents to choose
tasks from a list that they perform when volunteering (respondents could select all that
apply). Many options described roles of citizen scientists (e.g. “collect data or record
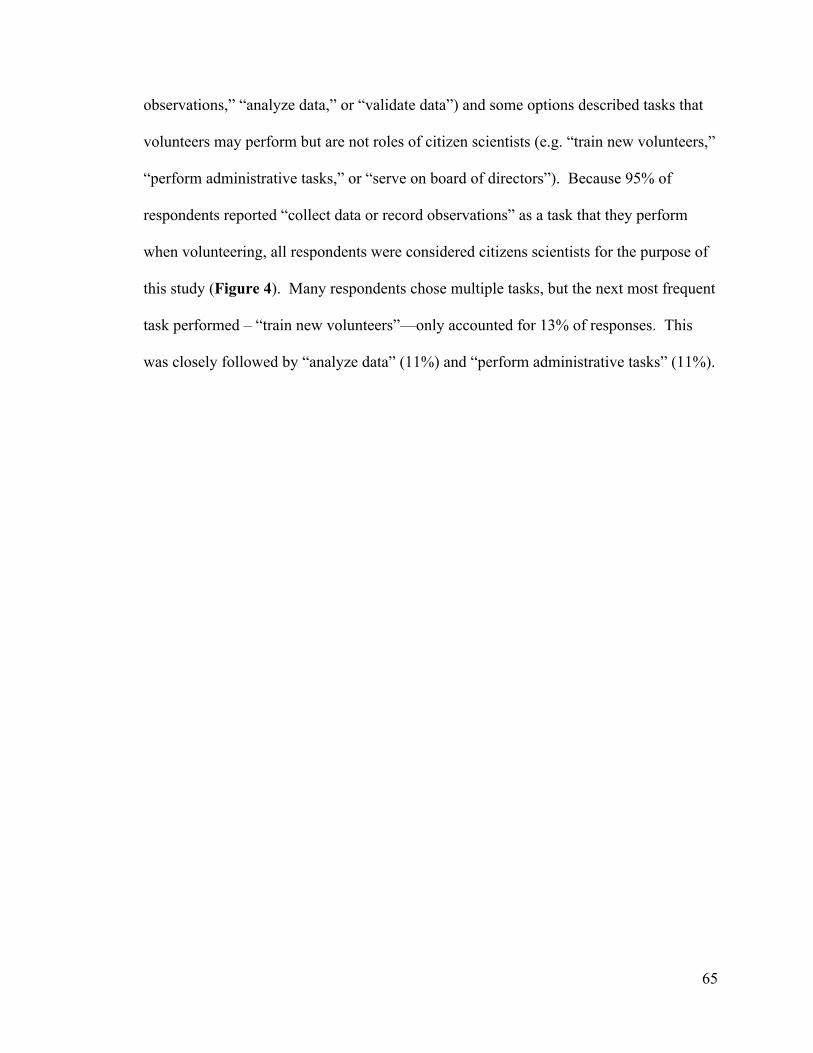
65
observations,” “analyze data,” or “validate data”) and some options described tasks that
volunteers may perform but are not roles of citizen scientists (e.g. “train new volunteers,”
“perform administrative tasks,” or “serve on board of directors”). Because 95% of
respondents reported “collect data or record observations” as a task that they perform
when volunteering, all respondents were considered citizens scientists for the purpose of
this study (Figure 4). Many respondents chose multiple tasks, but the next most frequent
task performed – “train new volunteers”—only accounted for 13% of responses. This
was closely followed by “analyze data” (11%) and “perform administrative tasks” (11%).
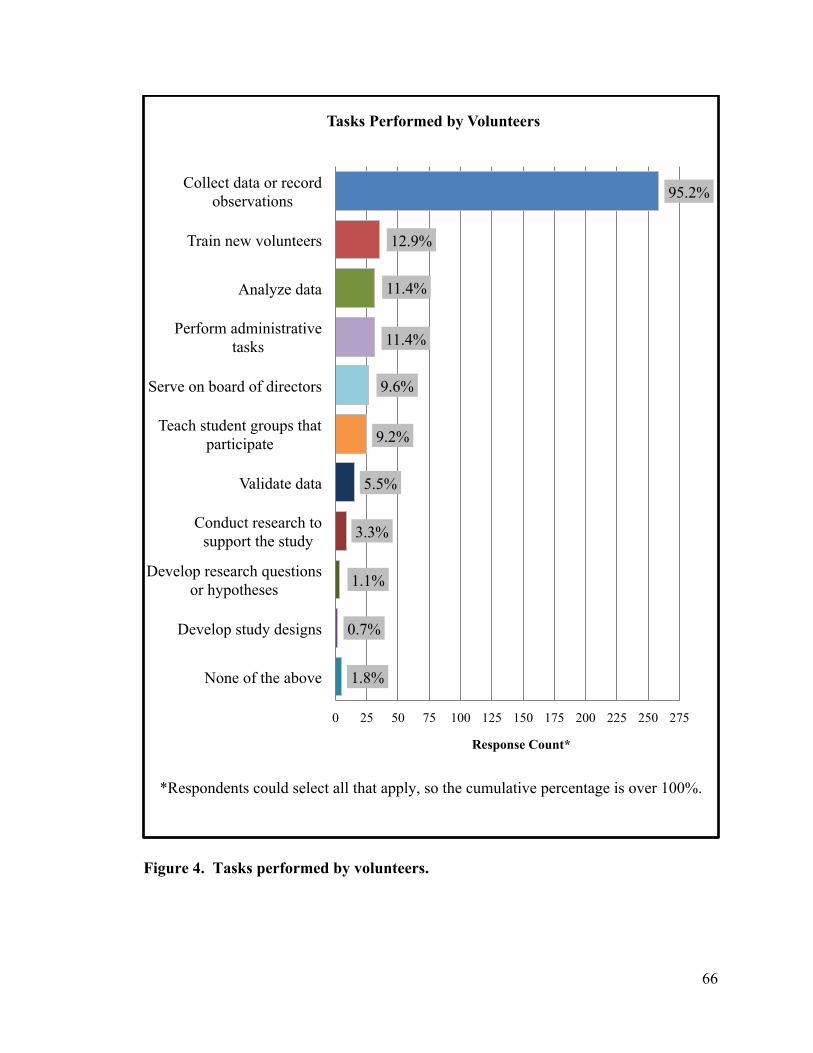
66
Figure 4. Tasks performed by volunteers.
95.2%
12.9%
11.4%
11.4%
9.6%
9.2%
5.5%
3.3%
1.1%
0.7%
1.8%
0 25 50 75 100 125 150 175 200 225 250 275
Collect data or record observations
Train new volunteers
Analyze data
Perform administrative tasks
Serve on board of directors
Teach student groups that participate
Validate data
Conduct research to support the study
Develop research questions or hypotheses
Develop study designs
None of the above
Response Count*
Tasks Performed by Volunteers
*Respondents could select all that apply, so the cumulative percentage is over 100%.
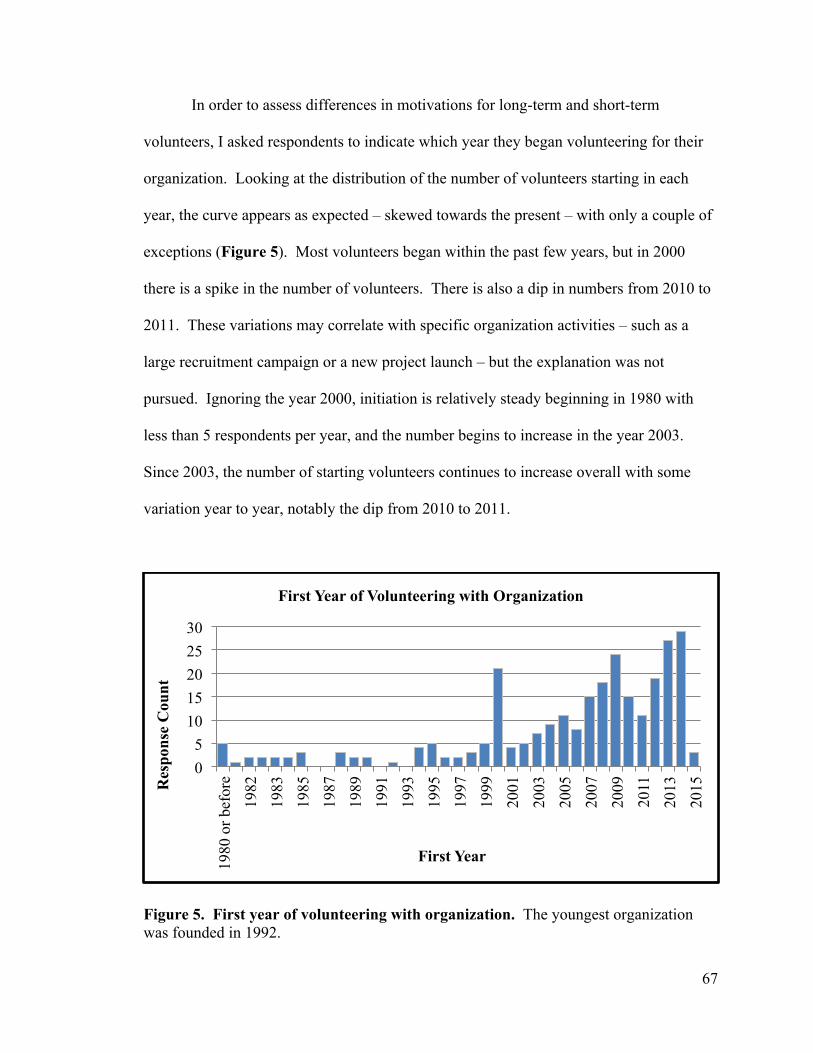
67
In order to assess differences in motivations for long-term and short-term
volunteers, I asked respondents to indicate which year they began volunteering for their
organization. Looking at the distribution of the number of volunteers starting in each
year, the curve appears as expected – skewed towards the present – with only a couple of
exceptions (Figure 5). Most volunteers began within the past few years, but in 2000
there is a spike in the number of volunteers. There is also a dip in numbers from 2010 to
2011. These variations may correlate with specific organization activities – such as a
large recruitment campaign or a new project launch – but the explanation was not
pursued. Ignoring the year 2000, initiation is relatively steady beginning in 1980 with
less than 5 respondents per year, and the number begins to increase in the year 2003.
Since 2003, the number of starting volunteers continues to increase overall with some
variation year to year, notably the dip from 2010 to 2011.
Figure 5. First year of volunteering with organization. The youngest organization was founded in 1992.
0 5
10 15 20 25 30
1980
or b
efor
e
1982
1983
1985
1987
1989
1991
1993
1995
1997
1999
2001
2003
2005
2007
2009
2011
2013
2015
Res
pons
e C
ount
First Year
First Year of Volunteering with Organization

68
For purposes of analysis and comparison, I grouped the start years into bins that
mirror the bins used by Roggenbuck et al. (2001). Roggenbuck et al. (2001) found that
most volunteers had been involved with the program for up to three years (25% were
involved up to one year and 55% were involved one to three years). The number of
people involved four or more years was much less and decreased over time. I found a
very different pattern in my study population. A smaller portion of volunteers have been
involved up to one year4 (12%), while an equal number of people have been involved for
both one to three years and four to six years (21% each; Figure 6). Respondents
involved seven to ten years represent 16% of the population. The largest diversion from
the pattern in Roggenbuck et al. (2001) is in the group with the most longevity. In the
Roggenbuck et al. (2001) study, only 6% were volunteers for more than ten years, but in
my population 30% were volunteers for more than ten years. This may indicate a
response bias: the volunteers who have been dedicated to their organization for more
years may also be more likely to respond to surveys from the project coordinators. For
the remainder of this study, I will refer to volunteers as “new” and “veteran” on the
continuum of involvement from “up to one year” (newest) to “more than 10 years” (most
veteran). I will use the term “longevity” to refer to a volunteer’s length of involvement
with the organization.
4 Respondents took the survey in February and March of 2015. Some respondents began volunteering in 2015, and since there were less than three months of 2015 at the time of the survey, I joined those volunteers with respondents who began in 2014. Thus, the group “up to one year” actually reflects up to 15 months of involvement.

69
Figure 6. Length of involvement with organization. *“Up to one year” actually reflects up to 15 months of involvement.
To see if newer volunteers are also younger in age, I created a distribution of ages
within each group of longevity (Figure 7). The percentage of the two youngest age
brackets (21-29, and 30-39) is greater in the groups of newer volunteers (up to one year
and one to three years) and decreases with length of involvement. This is expected, as
younger people have not lived as many years. The age groups are more evenly
distributed within the group of newest volunteers (up to one year).
12%
21% 21%
16%
30%
0 10 20 30 40 50 60 70 80 90
Up to 1 year* 1 to 3 years 4 to 6 years 7 to 10 years More than 10 years
Res
pons
e C
ount
Length of Involvement with Organization
70
Figure 7. Distribution of age groups by length of involvement with organization. Lighter shades represent younger volunteers, darker shades represent older volunteers. *“Up to one year” actually reflects up to 15 months of involvement.
I gathered information about frequency and duration of volunteer activities.
Nearly half of respondents (42%) volunteer about two times per month and 18%
volunteer at least once per week (Figure 8). One-quarter of volunteers (24%) spend
between 30 minutes and one hour each time they volunteer, nearly one-third (29%) spend
between one and two hours, and one-third (33%) spend between two and four hours
(Figure 9).
0% 10% 20% 30% 40% 50% 60% 70% 80% 90% 100%
Up to 1 year*
1 to 3 years
4 to 6 years
7 to 10 years
More than 10 years
Age in years Len
gth
of in
volv
emen
t with
org
aniz
atio
n
21-29 30-39 40-49 50-59 60-69 70-79 80 or older
Distribution of Age Groups by Length of Involvement with Organization
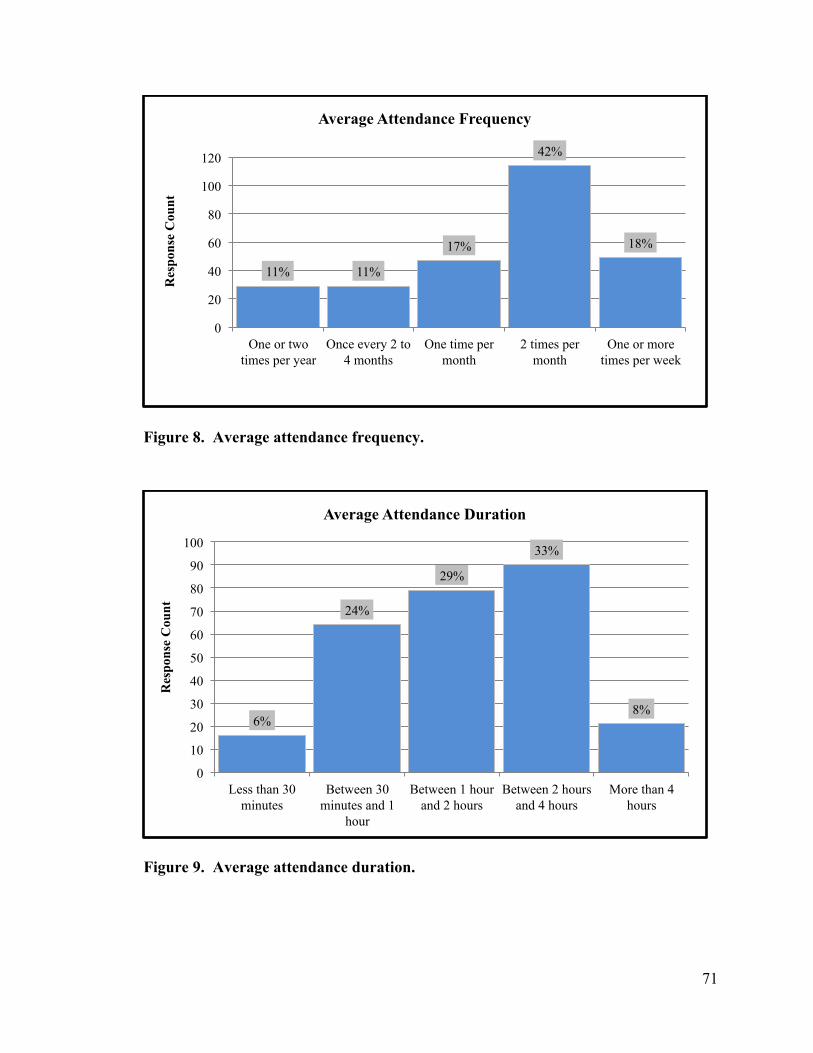
71
Figure 8. Average attendance frequency.
Figure 9. Average attendance duration.
11% 11%
17%
42%
18%
0
20
40
60
80
100
120
One or two times per year
Once every 2 to 4 months
One time per month
2 times per month
One or more times per week
Res
pons
e C
ount
Average Attendance Frequency
6%
24%
29%
33%
8%
0
10
20
30
40
50
60
70
80
90
100
Less than 30 minutes
Between 30 minutes and 1
hour
Between 1 hour and 2 hours
Between 2 hours and 4 hours
More than 4 hours
Res
pons
e C
ount
Average Attendance Duration

72
While I was not surprised that the most popular attendance frequency was two
times per month, I was surprised that the most popular time spent per event was between
two and four hours. To better understand how volunteers allocate their time, I created a
visual representation of the responses using a heat map – darker squares represent more
responses than lighter squares (Figure 10). Volunteers who attend events twice per
month most frequently spend between 30 minutes and one hour, which is closer to what I
expected. In addition, the number of volunteers who attend twice per month decrease
with increasing time spent per event.
Figure 10. Attendance duration versus attendance frequency. Heat map indicating response counts for attendance frequency (horizontal axis) versus attendance duration (vertical axis). Darker colors represent more responses than lighter colors.

73
One topic that is missing from the literature is how weather affects attendance.
Over half of respondents (57%) always perform tasks outdoors, and nearly one-third of
respondents (29%) usually perform tasks outdoors. Over half of respondents (52%)
indicated that unfavorable weather would not deter them from completing tasks. Almost
half (44%) of respondents reported they would go out in weather that is somewhat
unfavorable, while nearly one-third (29%) would only be stopped by a severe storm.
Coordinators might benefit from knowing if protective clothing is a barrier to those who
would perform tasks outdoors but do not have appropriate gear. I found that only 2% of
respondents wanted or needed to borrow outdoor clothing. (See Appendix E: Outdoor
Activity for complete details and graphs on outdoor activity.)
Finally, I assessed volunteer satisfaction by asking a few questions about their
future plans for volunteering. The overwhelming majority of volunteers plan to continue
volunteering with their organization (92%; Figure 11). They do not feel very strongly
about increasing the amount of time they spend volunteering, but overall they do not plan
to decrease the amount of time spent. Lastly, most volunteers (89%) are likely to
recommend their projects to others, which is a good indicator that the respondents are
happy with their organizations and enjoy being part of them.
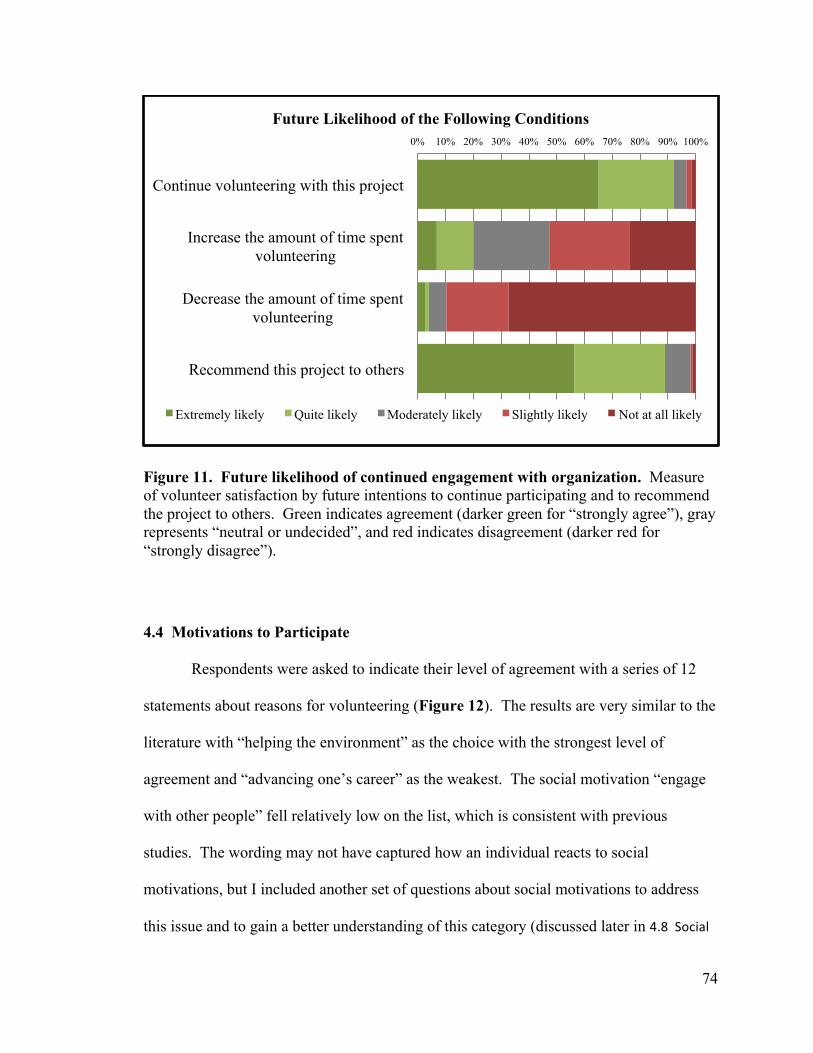
74
Figure 11. Future likelihood of continued engagement with organization. Measure of volunteer satisfaction by future intentions to continue participating and to recommend the project to others. Green indicates agreement (darker green for “strongly agree”), gray represents “neutral or undecided”, and red indicates disagreement (darker red for “strongly disagree”).
4.4 Motivations to Participate
Respondents were asked to indicate their level of agreement with a series of 12
statements about reasons for volunteering (Figure 12). The results are very similar to the
literature with “helping the environment” as the choice with the strongest level of
agreement and “advancing one’s career” as the weakest. The social motivation “engage
with other people” fell relatively low on the list, which is consistent with previous
studies. The wording may not have captured how an individual reacts to social
motivations, but I included another set of questions about social motivations to address
this issue and to gain a better understanding of this category (discussed later in 4.8 Social
0% 10% 20% 30% 40% 50% 60% 70% 80% 90% 100%
Continue volunteering with this project
Increase the amount of time spent volunteering
Decrease the amount of time spent volunteering
Recommend this project to others
Future Likelihood of the Following Conditions
Extremely likely Quite likely Moderately likely Slightly likely Not at all likely
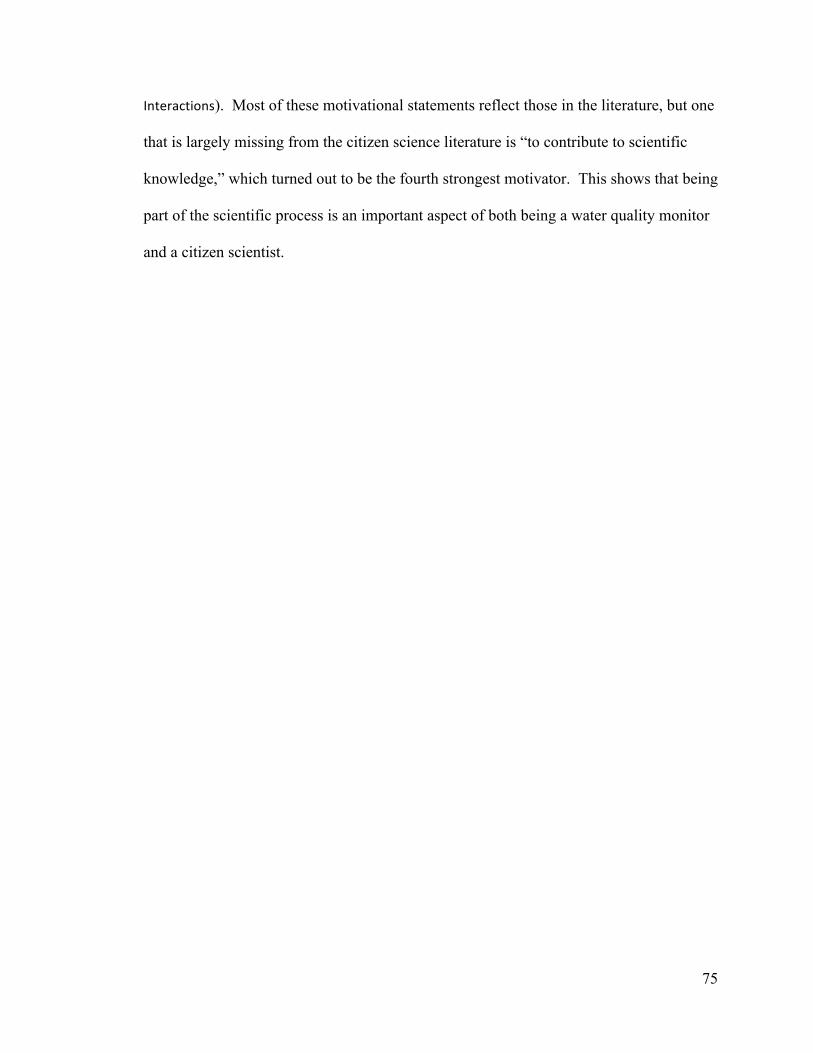
75
Interactions). Most of these motivational statements reflect those in the literature, but one
that is largely missing from the citizen science literature is “to contribute to scientific
knowledge,” which turned out to be the fourth strongest motivator. This shows that being
part of the scientific process is an important aspect of both being a water quality monitor
and a citizen scientist.

76
Figure 12. Level of agreement with reasons for volunteering. Distribution of responses for each motivation in order of strongest to weakest agreement. Green indicates agreement (darker green for “strongly agree”), gray represents “neutral or undecided”, and red indicates disagreement (darker red for “strongly disagree”). Orange represents “N/A” (not applicable).
0% 20% 40% 60% 80% 100%
I want to help or enhance the environment.
I want to help the community.
I want to get outside or connect with nature.
I want to contribute to scientific knowledge.
I want to learn more about water quality.
I want to do something physically active.
I want to learn skills or new knowledge.
I want to have fun.
I want to help this organization do more for less money.
I want to engage with other people.
I want to enhance my reputation in my community.
I want to advance my career through gained experience or networking.
Level of Agreement with Reasons for Volunteering
Strongly Agree Agree Neutral or Undecided Disagree Strongly Disagree N/A
77
In practice, many researchers use the mean for individual Likert-type items. For
certain analyses, I have chosen to report the mean for ease of comparison. For example,
respondents were asked to indicate how strongly they feel motivated by 12 different
statements. The mode reveals that many motivations carry the same weight and is not
very useful for interpretation (e.g. the mode response for seven of the 12 motivations is
“strongly agree”). However the mean reveals slight variations in the frequency of
response to each of the five options when weighted. Responses were weighted from 1,
strongly disagree, to 5, strongly agree.
The mean score for each motivational statement was found and statements were
then categorized by the Volunteer Functions Inventory (VFI) to show which overarching
types of motivations are most important (Table 16; see Section 2.2). When the
motivations are organized this way and the means are combined, the strongest
motivations are those that serve the values function and ego protective function, followed
by understanding, ego enhancement, social, and last is career.

78
Motivations Organized by Function
VFI Function Motivation Mean Combined Mean
Values I want to help or enhance the environment.
4.81 4.50
I want to help the community.
4.55
I want to help this organization do more for less money.
4.12
Ego Protective I want to get outside or connect with nature.
4.48 4.48
Understanding I want to contribute to scientific knowledge.
4.47 4.31
I want to learn more about water quality.
4.33
I want to learn skills or new knowledge.
4.13
Ego Enhancement I want to do something physically active.
4.25 4.19
I want to have fun.
4.13
Social I want to engage with other people.
3.68 3.27
I want to enhance my reputation in my community.
2.84
Career I want to advance my career through gained experience or networking.
2.75 2.75
Table 16. Motivations organized by function. Categorized by function according the Volunteer Functions Inventory (Clary et al., 1998) in order of highest to lowest mean score. Responses were weighted from 1 for “strongly disagree” to 5 for “strongly agree.”
79
I developed my survey before fully understanding the usefulness of the VFI, so I
organized the motivations by function after writing the survey statements. Thus, the
motivations are not a perfect fit for the functions, as is the case in most of the literature.
The motivations I placed in the ego enhancement function (“to do something physically
active” and “to have fun”) do not match the wording used in other studies and may not be
a perfect fit for this function, but they most closely relate to feeling good about oneself. I
placed “to get outside or connect with nature” in the ego protective function because it
most closely relates to feelings of escapism (i.e. from daily life), which helps reduce
negativity. Because individuals have multiple and overlapping motivations, the
motivations are not a perfect fit for the functions of the VFI. For example, “to contribute
to scientific knowledge” may fit in both the “understanding” function and the “values”
function because it implies that volunteers are both seeking knowledge and donating their
time for a purpose beyond themselves.
Organizing the motivations by function allows coordinators to generalize the
motivations to a broader category. For example, instead of focusing campaign messages
specifically on “helping the community,” messages can appeal to any value that
expresses altruism within the goals and mission of the organization. Likewise, a
coordinator for a project that does not monitor water quality can focus on the
understanding function in a way that fits their organization’s goals.
Because volunteer retention is important to environmental stewardship
organizations, I wanted to determine if motivations change over time so that coordinators
will know if they should use different recruitment messages for different audiences. I
found the mean rating for each group of longevity with the organization: up to one year,
80
one to three years, four to six years, seven to ten years, and over ten years. If veteran
volunteers have different motivators than newer volunteers, this would be valuable
information to incorporate in recruitment and retention campaigns.
For most motivations, I found very few differences between the newer and more
veteran volunteers (Figure 13). However, there are some differences in the last three
categories: “engage with other people,” “enhance my reputation,” and “advance my
career.” The newest volunteers (up to one year) felt more strongly about these three
motivations than the veteran volunteers, although these are still the lowest rated
motivations of all the motivations for new volunteers. One possible explanation is that
the newer volunteers might be new to their community and they want to establish
themselves or make new friends. Another possibility is that the newer volunteers are also
younger in age and are trying to develop their careers.
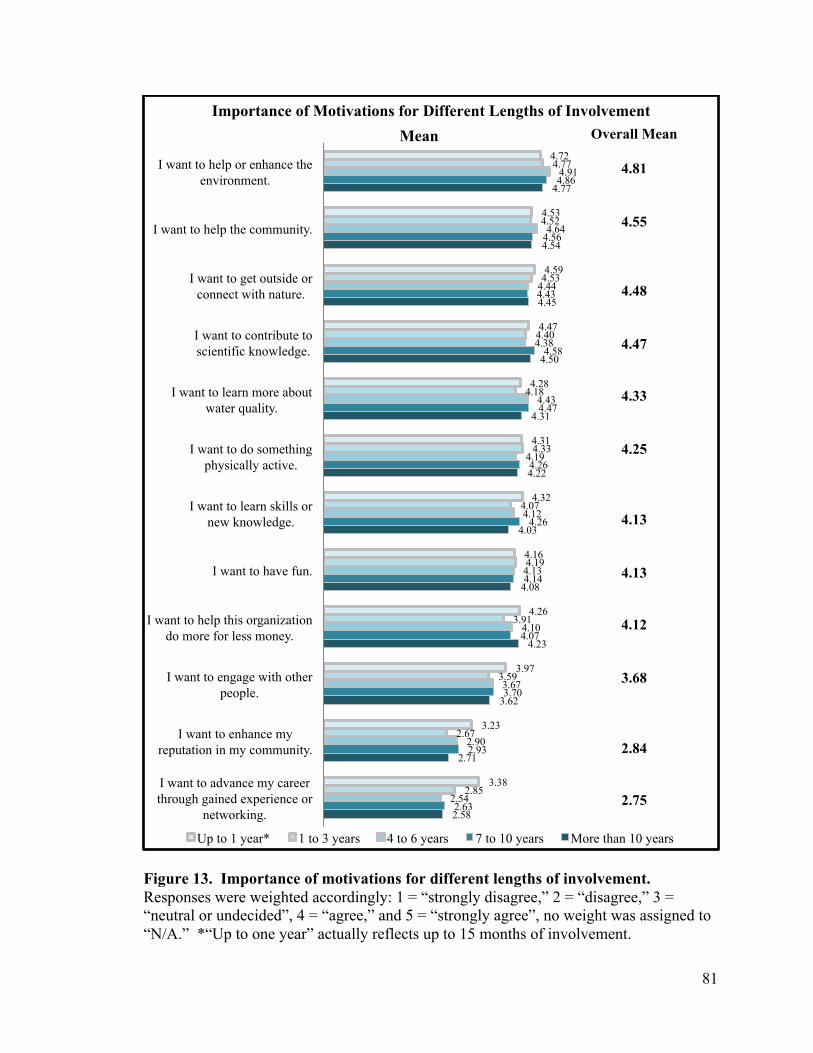
81
Figure 13. Importance of motivations for different lengths of involvement. Responses were weighted accordingly: 1 = “strongly disagree,” 2 = “disagree,” 3 = “neutral or undecided”, 4 = “agree,” and 5 = “strongly agree”, no weight was assigned to “N/A.” *“Up to one year” actually reflects up to 15 months of involvement.
4.72
4.53
4.59
4.47
4.28
4.31
4.32
4.16
4.26
3.97
3.23
3.38
4.77
4.52
4.53
4.40
4.18
4.33
4.07
4.19
3.91
3.59
2.67
2.85
4.91
4.64
4.44
4.38
4.43
4.19
4.12
4.13
4.10
3.67
2.90
2.54
4.86
4.56
4.43
4.58
4.47
4.26
4.26
4.14
4.07
3.70
2.93
2.63
4.77
4.54
4.45
4.50
4.31
4.22
4.03
4.08
4.23
3.62
2.71
2.58
I want to help or enhance the environment.
I want to help the community.
I want to get outside or connect with nature.
I want to contribute to scientific knowledge.
I want to learn more about water quality.
I want to do something physically active.
I want to learn skills or new knowledge.
I want to have fun.
I want to help this organization do more for less money.
I want to engage with other people.
I want to enhance my reputation in my community.
I want to advance my career through gained experience or
networking.
Mean
Up to 1 year* 1 to 3 years 4 to 6 years 7 to 10 years More than 10 years
Importance of Motivations for Different Lengths of Involvement Overall Mean
4.81
4.55
4.48
4.47
4.33
4.25
4.13
4.13
4.12
3.68
2.84
2.75
82
To see if age influences the importance of motivators, I found the mean rating of
motivations for each age group (Figure 14). I found that the youngest age group of
volunteers (20-29) explains the higher ratings for newer volunteers in the last three
categories (“engage with other people,” “enhance my reputation,” and “advance my
career”). I found that the younger volunteers rated the “career” motivation much higher
than the other age groups. The mean ratings of “career” for the two youngest age groups
(20-29 and 30-39) were 4.33 and 3.56, while the overall mean for “career” was only 2.75.
The “career” motivation is the sixth strongest motivator for the two youngest age groups,
as opposed to the 12th and weakest motivator for respondents overall. Furthermore, the
mean scores for the “career” motivation decrease with increasing age.
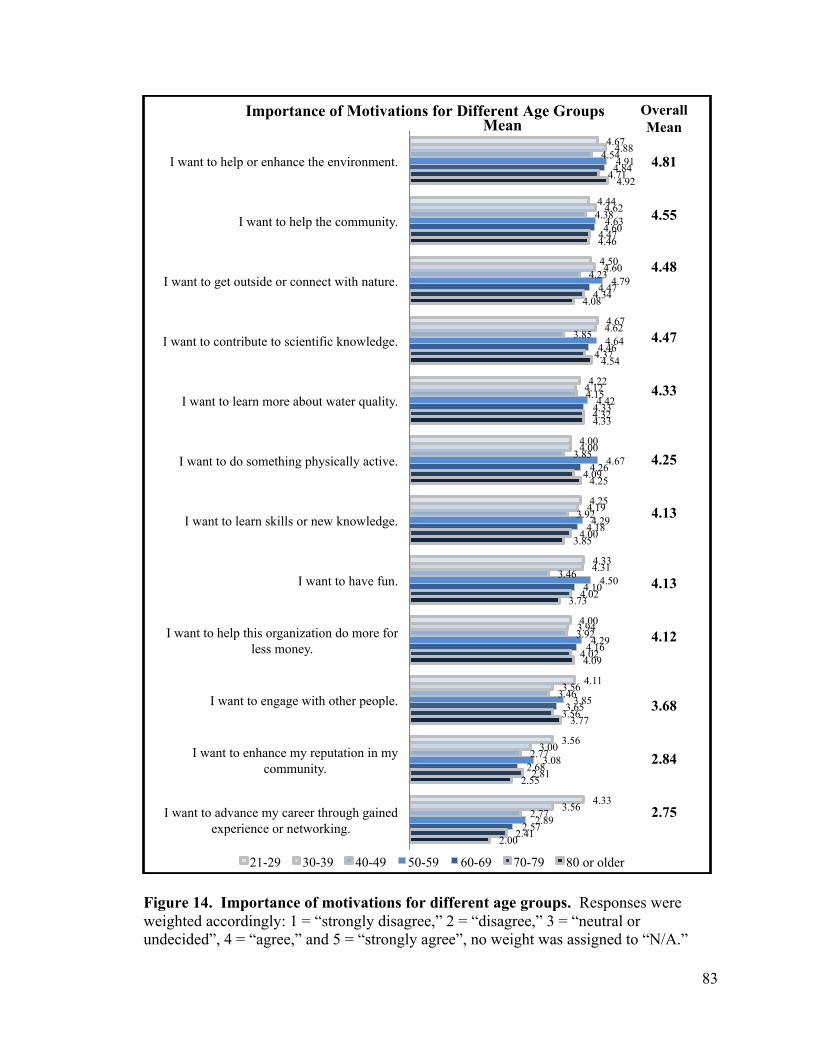
83
Figure 14. Importance of motivations for different age groups. Responses were weighted accordingly: 1 = “strongly disagree,” 2 = “disagree,” 3 = “neutral or undecided”, 4 = “agree,” and 5 = “strongly agree”, no weight was assigned to “N/A.”
4.67
4.44
4.50
4.67
4.22
4.00
4.25
4.33
4.00
4.11
3.56
4.33
4.88
4.62
4.60
4.62
4.12
4.00
4.19
4.31
3.94
3.56
3.00
3.56
4.54
4.38
4.23
3.85
4.15
3.85
3.92
3.46
3.92
3.46
2.77
2.77
4.91
4.63
4.79
4.64
4.42
4.67
4.29
4.50
4.29
3.85
3.08
2.89
4.84
4.60
4.47
4.46
4.33
4.26
4.18
4.10
4.16
3.65
2.68
2.57
4.71
4.47
4.34
4.37
4.32
4.09
4.00
4.02
4.02
3.56
2.81
2.41
4.92
4.46
4.08
4.54
4.33
4.25
3.85
3.73
4.09
3.77
2.55
2.00
I want to help or enhance the environment.
I want to help the community.
I want to get outside or connect with nature.
I want to contribute to scientific knowledge.
I want to learn more about water quality.
I want to do something physically active.
I want to learn skills or new knowledge.
I want to have fun.
I want to help this organization do more for less money.
I want to engage with other people.
I want to enhance my reputation in my community.
I want to advance my career through gained experience or networking.
Mean
21-29 30-39 40-49 50-59 60-69 70-79 80 or older
Importance of Motivations for Different Age Groups
Overall Mean
4.81
4.55
4.48
4.47
4.33
4.25
4.13
4.13
4.12
3.68
2.84
2.75
84
This validates the assumptions made in the literature about younger volunteers
being more motivated than older volunteers by career advancement. It also suggests that
coordinators may want to recruit younger people with different messages than they would
use to recruit older people, and they will need to change their messages over time as the
new recruits age to enhance retention. While the differences are important to
coordinators who want to recruit certain age groups, coordinators will also want to meet
the needs of their most common volunteer. The largest age group is 60-69 and the mean
ratings for this age group are very close to the overall ratings. Coordinators should keep
this in mind when developing activities.
To see if gender influences the importance of motivators, I found the mean ratings
of motivations for males and females (Figure 15). There is very little difference in the
means between males and females. Females rated the “career” motivator somewhat
higher (2.92) than males (2.64), but both were close to the overall mean (2.75). This
suggests that gender explains very little of the variation in motivators.

85
Figure 15. Importance of motivations for different genders. Responses were weighted accordingly: 1 = “strongly disagree,” 2 = “disagree,” 3 = “neutral or undecided”, 4 = “agree,” and 5 = “strongly agree”, no weight was assigned to “N/A.”
4.84
4.58
4.54
4.51
4.40
4.32
4.30
4.12
4.15
3.71
2.86
2.92
4.79
4.55
4.45
4.45
4.27
4.21
4.00
4.15
4.11
3.66
2.83
2.64
I want to help or enhance the environment.
I want to help the community.
I want to get outside or connect with nature.
I want to contribute to scientific knowledge.
I want to learn more about water quality.
I want to do something physically active.
I want to learn skills or new knowledge.
I want to have fun.
I want to help this organization do more for less money.
I want to engage with other people.
I want to enhance my reputation in my community.
I want to advance my career through gained experience or networking.
Mean
Female Male
Importance of Motivations for Different Genders Overall
Mean
4.81
4.55
4.48
4.47
4.33
4.25
4.13
4.13
4.12
3.68
2.84
2.75

86
4.5 Use of Volunteer Collected Data
Because many citizen science projects and water quality monitoring projects are
data intensive, I wanted to explore volunteers’ feelings about how their organizations use
volunteer collected data. Volunteers who participate in these types of programs might be
motivated to participate by the use of data for ecosystem management or scientific
publications. For example, in the study by Roggenbuck et al. (2001), volunteers stated
that they wanted an increase in the use of data by government agencies and more
feedback from coordinators about how the data is used.
Many of the participating organizations use data to inform the public or state
agencies about the health of water bodies. To provide more details on how organizations
use volunteer-collected data, the focus is narrowed to the organizations with the most
survey respondents: (1) Maine Volunteer Lake Monitoring Program (Maine VLMP), (2)
University of Rhode Island Watershed Watch (URIWW), and (3) South Yuba River
Citizens League (SYRCL). These three groups combined contributed 86.4% of the total
survey responses.
The data collected by Maine VLMP is considered the “primary source of lake
data in the state of Maine” (Maine Volunteer Lake Monitoring Program, 2013). Maine
VLMP produces an annual report (available online) that summarizes lake water quality
and the status of invasive plants (“Maine Lakes Report,” n.d.). The report includes an
appendix with a list of all volunteers, several photos, and a separate list recognizing those
volunteers with 10 or more years of service (Maine Volunteer Lake Monitoring Program,
2013). The organization also publishes near real-time water quality data for eleven lakes
87
online to provide the public with an overview on state lake health (“Near Real-Time Lake
Data,” n.d.).
The data collected by URIWW is used to assess and manage state water bodies by
the Rhode Island Department of Environmental Management, “municipal governments,
associations, consulting firms and residents” (“URIWW Data and Results,” n.d.). Data is
available online or by request and updates on bacteria are posted within one week of
sampling (“URIWW Data Available Online,” n.d.).
Data collected by SYRCL volunteers is used to inform SYRCL’s restoration
projects and advocacy campaigns about salmon habitat, dams, and hydropower (“River
Science,” n.d.). The data was used to produce a report assessing the state of the Yuba
River Watershed in 2006 (Shilling, 2006). Data is also contributed to an ongoing project
called Yuba Shed, which makes data, photos, maps, and tools available to the public
online (“Yuba Shed,” n.d.).
I found that while nearly all respondents agree or strongly agree that the data is
used appropriately, about one-third agree or strongly agree that more should be done with
the data (Figure 16). A little more than half agree or strongly agree that the data should
be used for scientific publications. Nearly all respondents indicated feeling good when
data and/or results are shared with them and when environmental problems are identified
and addressed because of the data collected.
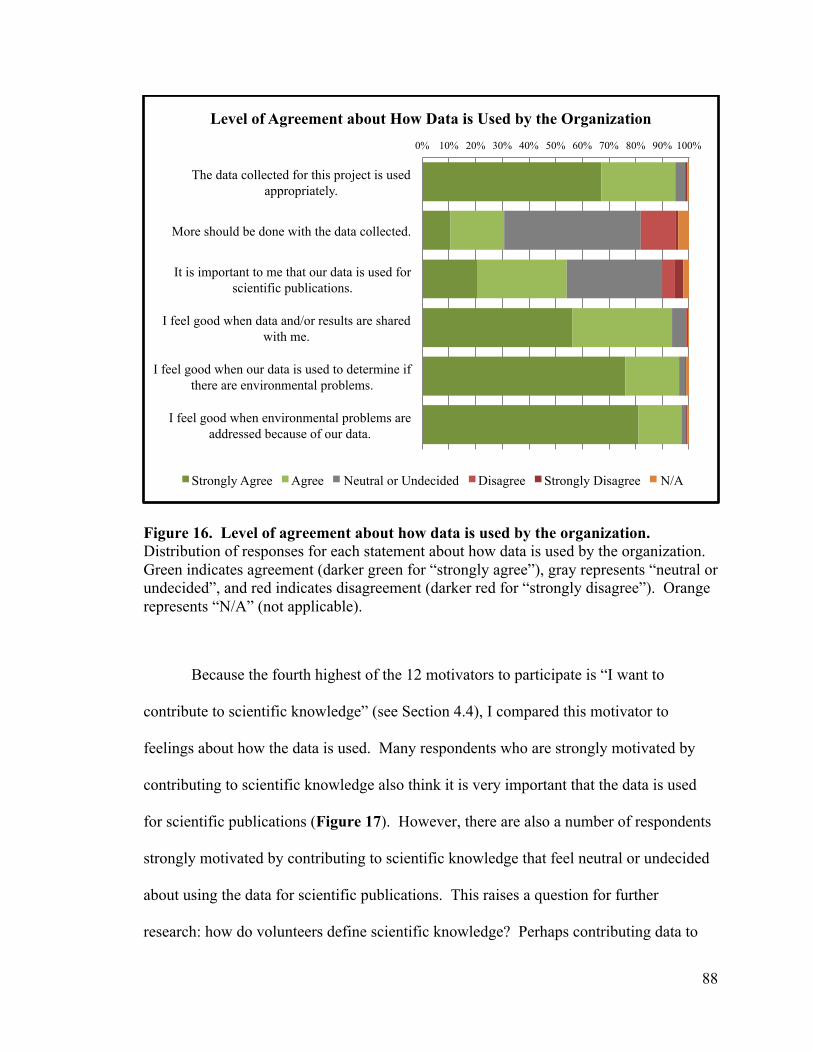
88
Figure 16. Level of agreement about how data is used by the organization. Distribution of responses for each statement about how data is used by the organization. Green indicates agreement (darker green for “strongly agree”), gray represents “neutral or undecided”, and red indicates disagreement (darker red for “strongly disagree”). Orange represents “N/A” (not applicable).
Because the fourth highest of the 12 motivators to participate is “I want to
contribute to scientific knowledge” (see Section 4.4), I compared this motivator to
feelings about how the data is used. Many respondents who are strongly motivated by
contributing to scientific knowledge also think it is very important that the data is used
for scientific publications (Figure 17). However, there are also a number of respondents
strongly motivated by contributing to scientific knowledge that feel neutral or undecided
about using the data for scientific publications. This raises a question for further
research: how do volunteers define scientific knowledge? Perhaps contributing data to
0% 10% 20% 30% 40% 50% 60% 70% 80% 90% 100%
The data collected for this project is used appropriately.
More should be done with the data collected.
It is important to me that our data is used for scientific publications.
I feel good when data and/or results are shared with me.
I feel good when our data is used to determine if there are environmental problems.
I feel good when environmental problems are addressed because of our data.
Level of Agreement about How Data is Used by the Organization
Strongly Agree Agree Neutral or Undecided Disagree Strongly Disagree N/A
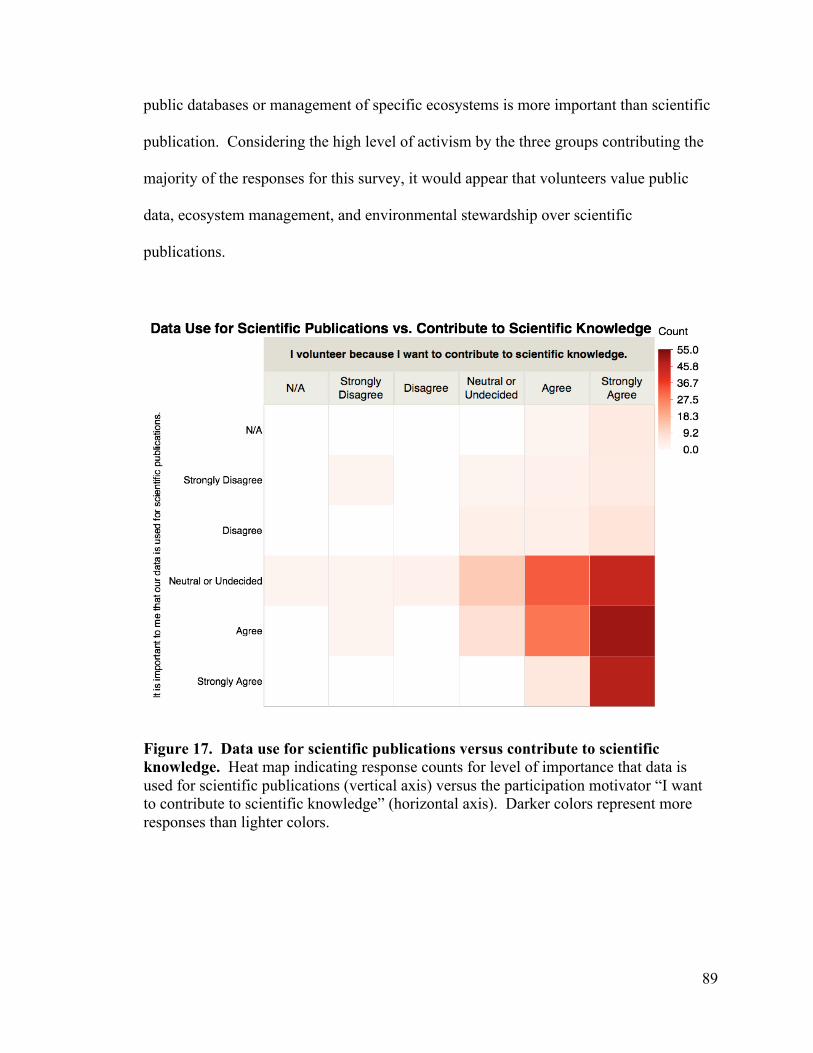
89
public databases or management of specific ecosystems is more important than scientific
publication. Considering the high level of activism by the three groups contributing the
majority of the responses for this survey, it would appear that volunteers value public
data, ecosystem management, and environmental stewardship over scientific
publications.
Figure 17. Data use for scientific publications versus contribute to scientific knowledge. Heat map indicating response counts for level of importance that data is used for scientific publications (vertical axis) versus the participation motivator “I want to contribute to scientific knowledge” (horizontal axis). Darker colors represent more responses than lighter colors.
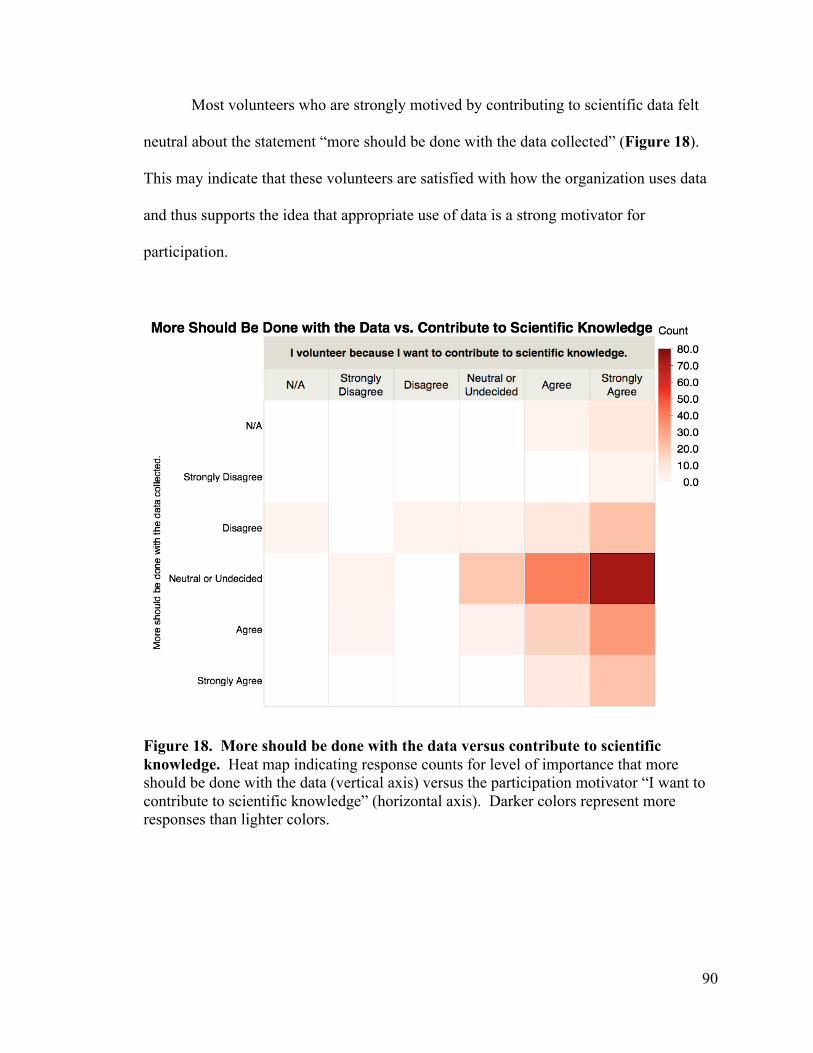
90
Most volunteers who are strongly motived by contributing to scientific data felt
neutral about the statement “more should be done with the data collected” (Figure 18).
This may indicate that these volunteers are satisfied with how the organization uses data
and thus supports the idea that appropriate use of data is a strong motivator for
participation.
Figure 18. More should be done with the data versus contribute to scientific knowledge. Heat map indicating response counts for level of importance that more should be done with the data (vertical axis) versus the participation motivator “I want to contribute to scientific knowledge” (horizontal axis). Darker colors represent more responses than lighter colors.

91
These results support the findings by Roggenbuck et al. (2001) and also show that
volunteers want the outcomes of their labor to directly affect the issue they are
monitoring. More importantly, they want to know how their efforts have made an
impact. Volunteers felt more strongly about the results being shared with them than
about the data being used for scientific publication. This reinforces claims made by other
researchers that coordinators need to share results with their volunteers (Knoke, 1981;
Nov et al., 2014; Roggenbuck et al., 2001; Rotman et al., 2014). Further research could
be done to explore the best or preferred methods for communicating results with
volunteers.
4.6 Training
Citizen science and monitoring projects usually require volunteers to undergo
some level of training in order to participate because collection methods with good
protocol will yield rigorous data that can be used to inform management decisions.
Training requires time and resources on behalf of the organization, so understanding how
volunteers want to receive training will help reduce costs. Training requirements may
also act as a barrier to participation if the training intensity is too high. I found that most
respondents (over 75%) prefer single training events to sequential training events, but
more than half also like sequential training to improve their expertise (Figure 19).
Many organizations offer tokens or certificates to volunteers who complete
training activities. I found that most volunteers do not feel strongly about this type of
reward; at least one-third indicated that they do not want recognition for training (Figure
19). This may be an area that requires a more in-depth interview process to fully
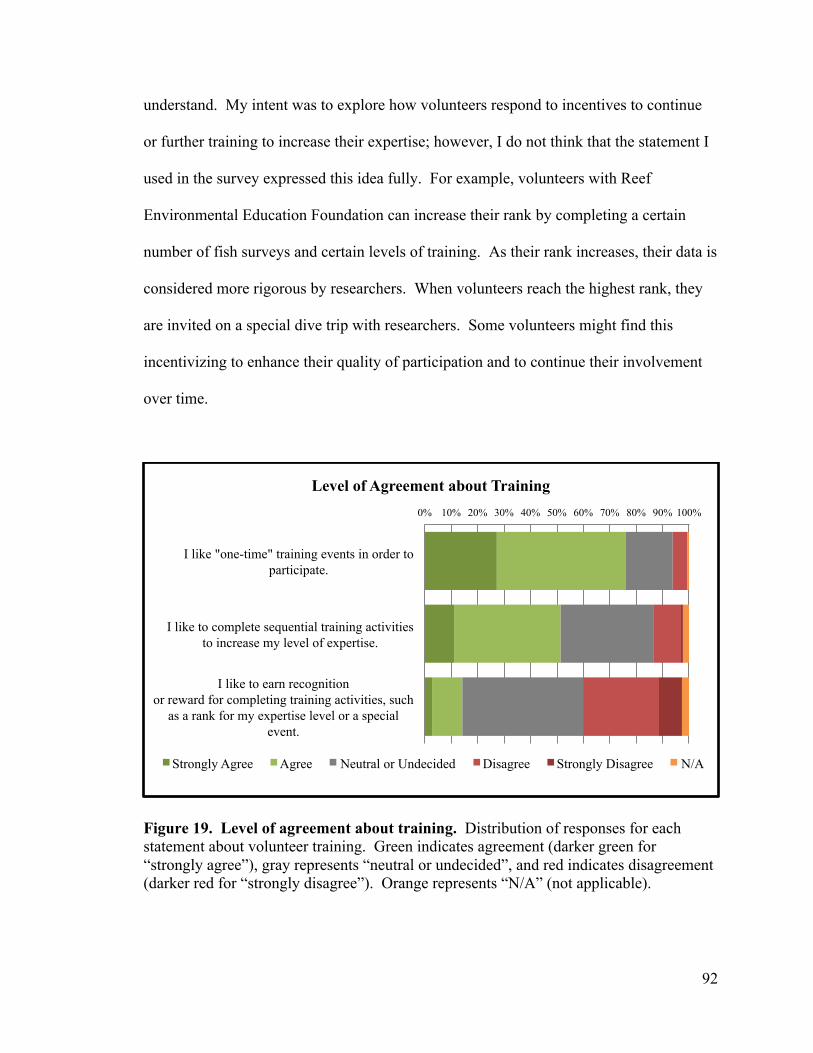
92
understand. My intent was to explore how volunteers respond to incentives to continue
or further training to increase their expertise; however, I do not think that the statement I
used in the survey expressed this idea fully. For example, volunteers with Reef
Environmental Education Foundation can increase their rank by completing a certain
number of fish surveys and certain levels of training. As their rank increases, their data is
considered more rigorous by researchers. When volunteers reach the highest rank, they
are invited on a special dive trip with researchers. Some volunteers might find this
incentivizing to enhance their quality of participation and to continue their involvement
over time.
Figure 19. Level of agreement about training. Distribution of responses for each statement about volunteer training. Green indicates agreement (darker green for “strongly agree”), gray represents “neutral or undecided”, and red indicates disagreement (darker red for “strongly disagree”). Orange represents “N/A” (not applicable).
0% 10% 20% 30% 40% 50% 60% 70% 80% 90% 100%
I like "one-time" training events in order to participate.
I like to complete sequential training activities to increase my level of expertise.
I like to earn recognition or reward for completing training activities, such
as a rank for my expertise level or a special event.
Level of Agreement about Training
Strongly Agree Agree Neutral or Undecided Disagree Strongly Disagree N/A

93
4.7 Responsibility
Some researchers suggest that giving a volunteer more responsibility makes them
feel valued and thus motivates continued participation (Knoke, 1981). However, Ryan et
al. (2001) found that volunteers were not very interested in making decisions about the
organization (mean 2.10 out of 5), and Roggenbuck et al. (2001) also found that
volunteers want a leader who is in a full-time paid staff position (expressed numerous
times in a focus group). I found that the opportunity to advance one’s role in the
organization was important to only about 20% of respondents and roughly 30%
considered it unimportant (Figure 20). Despite the lack of desire to take on more
responsibility, over 80% of respondents felt that they would be supported by the staff if
they chose to do so. This indicates a positive working relationship exists between staff
members and volunteers in the participating organizations.
Figure 20. Level of agreement about depth of participation. Distribution of responses for each statement about depth of participation. Green indicates agreement (darker green for “strongly agree”), gray represents “neutral or undecided”, and red indicates disagreement (darker red for “strongly disagree”). Orange represents “N/A” (not applicable).
0% 10% 20% 30% 40% 50% 60% 70% 80% 90% 100%
Opportunities for my role to grow or advance within this project are
important to me.
I feel that the staff would support me if I wanted to deepen my level of
participation.
Level of Agreement about Depth of Participation
Strongly Agree Agree Neutral or Undecided Disagree Strongly Disagree N/A
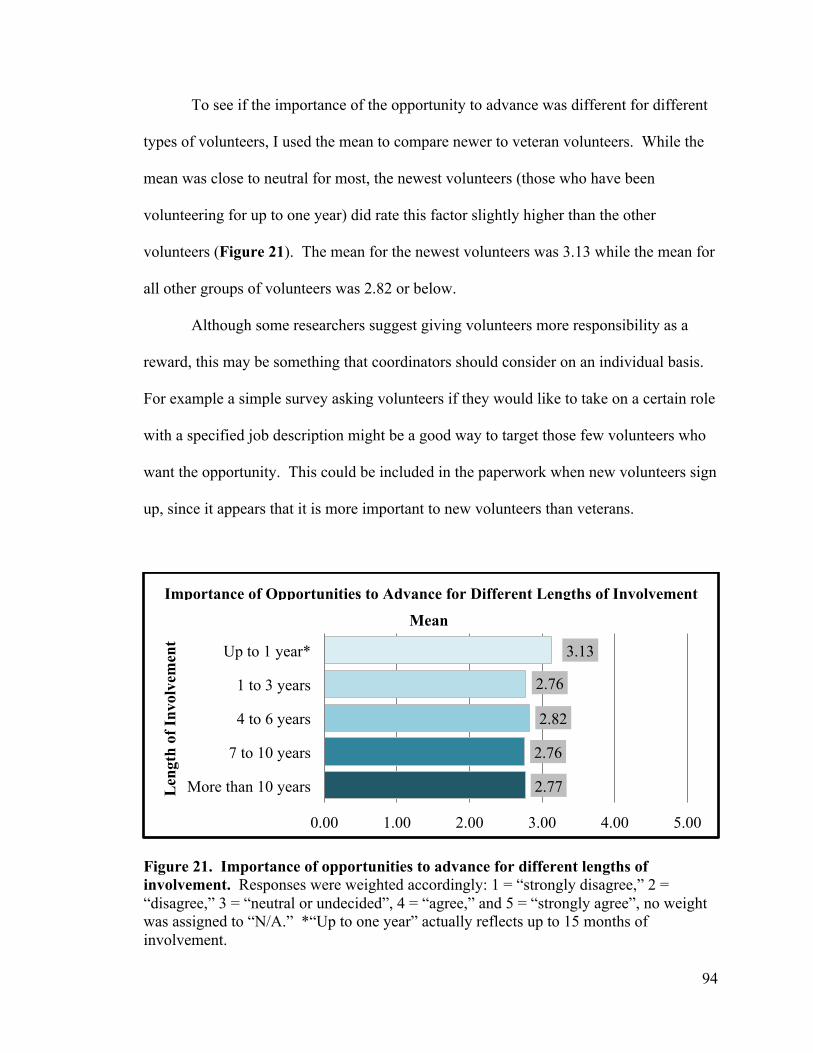
94
To see if the importance of the opportunity to advance was different for different
types of volunteers, I used the mean to compare newer to veteran volunteers. While the
mean was close to neutral for most, the newest volunteers (those who have been
volunteering for up to one year) did rate this factor slightly higher than the other
volunteers (Figure 21). The mean for the newest volunteers was 3.13 while the mean for
all other groups of volunteers was 2.82 or below.
Although some researchers suggest giving volunteers more responsibility as a
reward, this may be something that coordinators should consider on an individual basis.
For example a simple survey asking volunteers if they would like to take on a certain role
with a specified job description might be a good way to target those few volunteers who
want the opportunity. This could be included in the paperwork when new volunteers sign
up, since it appears that it is more important to new volunteers than veterans.
Figure 21. Importance of opportunities to advance for different lengths of involvement. Responses were weighted accordingly: 1 = “strongly disagree,” 2 = “disagree,” 3 = “neutral or undecided”, 4 = “agree,” and 5 = “strongly agree”, no weight was assigned to “N/A.” *“Up to one year” actually reflects up to 15 months of involvement.
3.13
2.76
2.82
2.76
2.77
0.00 1.00 2.00 3.00 4.00 5.00
Up to 1 year*
1 to 3 years
4 to 6 years
7 to 10 years
More than 10 years
Mean
Len
gth
of In
volv
emen
t
Importance of Opportunities to Advance for Different Lengths of Involvement

95
4.8 Social Interactions
Roggenbuck et al. (2001) and Ryan et al. (2001) discuss the importance of social
opportunities for continued volunteer commitment and point out that those who volunteer
more frequently are motivated by social reasons. To gain a more thorough understanding
of social interactions and social motivations, I asked respondents several questions about
this category. I compared their responses to age, gender, and longevity to see how
different types of volunteers feel about social factors. This will allow coordinators to
customize activities based on the demographic makeup of their volunteers.
I analyzed group size preference because this will help coordinators set up
activities that allow volunteers to participate in a group of their preference. I found that
the most common response (41%) for group size preference was to perform tasks with a
partner and the second most common preference (34%) was to perform tasks alone
(Figure 22). A small group (three to five people) was the third most common response
(17%), and groups larger than five were seldom preferred.
Figure 22. Group size preference.
34%
41%
17%
6%
2%
0 10 20 30 40 50 60 70 80 90 100 110 120
Alone
With a partner
Small group (3-5)
Medium group (6-10)
Large group (10 or more)
Group Size Preference
Response Count
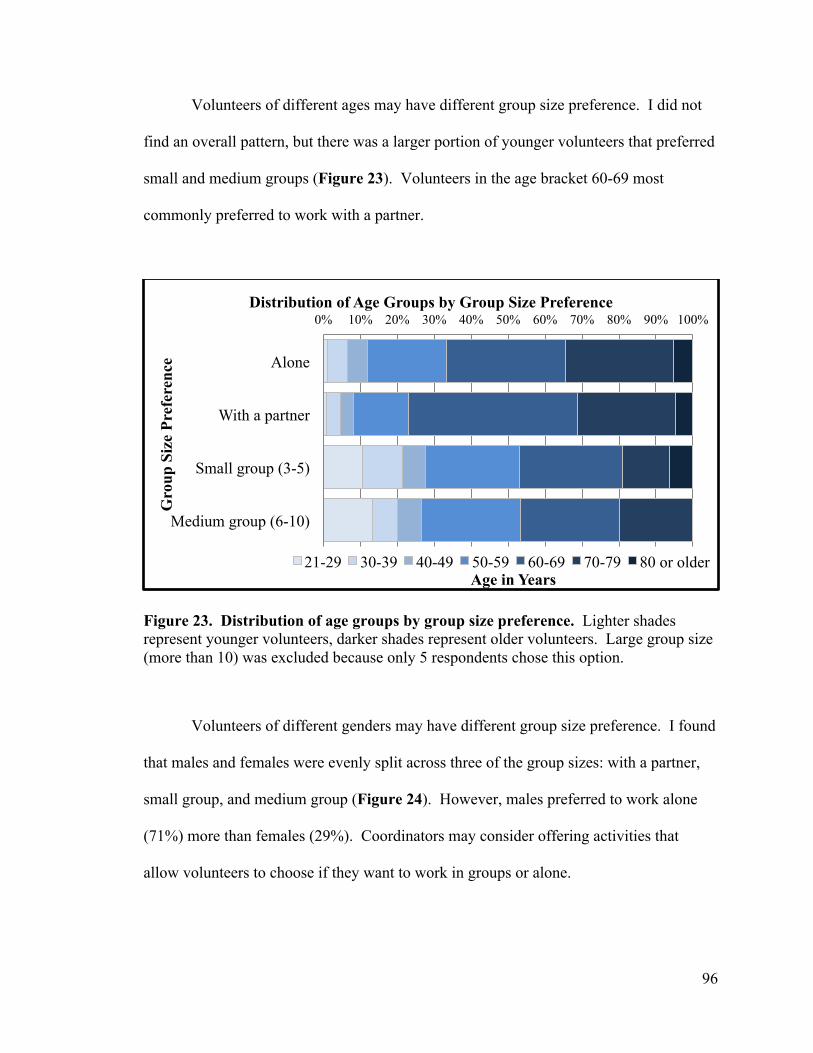
96
Volunteers of different ages may have different group size preference. I did not
find an overall pattern, but there was a larger portion of younger volunteers that preferred
small and medium groups (Figure 23). Volunteers in the age bracket 60-69 most
commonly preferred to work with a partner.
Figure 23. Distribution of age groups by group size preference. Lighter shades represent younger volunteers, darker shades represent older volunteers. Large group size (more than 10) was excluded because only 5 respondents chose this option.
Volunteers of different genders may have different group size preference. I found
that males and females were evenly split across three of the group sizes: with a partner,
small group, and medium group (Figure 24). However, males preferred to work alone
(71%) more than females (29%). Coordinators may consider offering activities that
allow volunteers to choose if they want to work in groups or alone.
0% 10% 20% 30% 40% 50% 60% 70% 80% 90% 100%
Alone
With a partner
Small group (3-5)
Medium group (6-10)
Age in Years
Gro
up S
ize
Pref
eren
ce
Distribution of Age Groups by Group Size Preference
21-29 30-39 40-49 50-59 60-69 70-79 80 or older

97
Figure 24. Distribution of genders by group size preference. Large group size (more than 10) was excluded because only 5 respondents chose this option.
Respondents were asked to indicate their level of agreement with five statements
that completed the sentence “I volunteer because _____.” These statements all relate to
social interactions. The social reason to volunteer with the highest level of agreement
was “I like learning from others with more experience than me;” this was closely
followed by “I like sharing my experience, knowledge, or expertise with other
volunteers” (Figure 25). Third highest was “I want to interact with like-minded people.”
The top three reasons each had at least 70% agreement.
The two reasons with the lowest level of agreement were “I want to spend time
with family or friends” (43%) and “I want to meet new people” (42%). Further research
may benefit from asking volunteers if they have made friends in the organization and if
those friendships offer motivation to participate. Although most respondents indicated
that spending time with friends is not a reason for volunteering, they may have
0% 10% 20% 30% 40% 50% 60% 70% 80% 90% 100%
Alone
With a partner
Small group (3-5)
Medium group (6-10)
Gro
up S
ize
Pref
eren
ce
Distribution of Genders by Group Size Preference
Female Male

98
friendships in the organization, which may provide a subtle layer of motivation. For
example, a person with a lower level of commitment to the organizations may be
persuaded to attend an event if one of their friends is going or if one of their friends
persuades them to attend.
Figure 25. Level of agreement about social reasons to participate. Distribution of responses for each statement about social interactions in order of strongest to weakest agreement. Green indicates agreement (darker green for “strongly agree”), gray represents “neutral or undecided”, and red indicates disagreement (darker red for “strongly disagree”). Orange represents “N/A” (not applicable).
Social motivations may change over time, so I compared the means for each
motivator across different lengths of involvement (Figure 26). The differences are small,
but the newest volunteers (up to one year involvement) rated all of the social motivators
higher than veteran volunteers. However, the most veteran volunteers (more than ten
years involvement) tended to rate these motivators second highest.
0% 10% 20% 30% 40% 50% 60% 70% 80% 90% 100%
I like learning from others with more experience than me.
I like sharing my experience, knowledge, or expertise with other volunteers.
I want to interact with like-minded people.
I want to spend time with family or friends.
I want to meet new people.
Level of Agreement about Social Reasons to Participate
Strongly Agree Agree Neutral or Undecided Disagree Strongly Disagree N/A
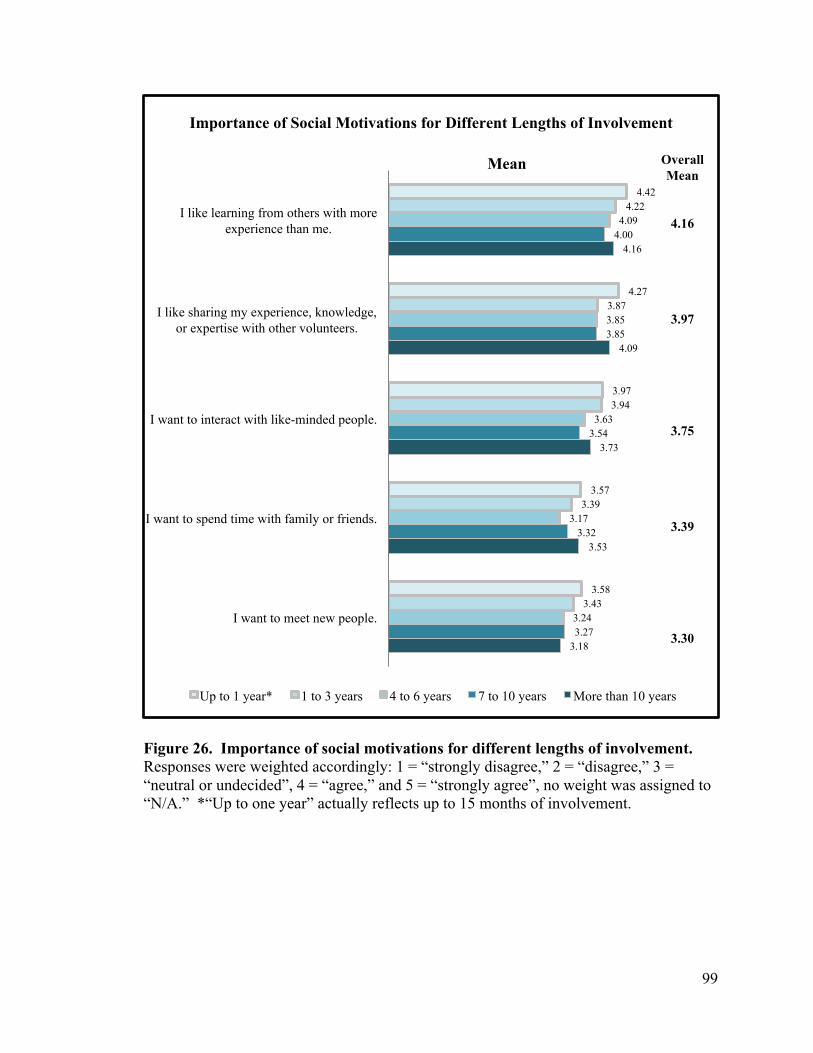
99
Figure 26. Importance of social motivations for different lengths of involvement. Responses were weighted accordingly: 1 = “strongly disagree,” 2 = “disagree,” 3 = “neutral or undecided”, 4 = “agree,” and 5 = “strongly agree”, no weight was assigned to “N/A.” *“Up to one year” actually reflects up to 15 months of involvement.
4.42
4.27
3.97
3.57
3.58
4.22
3.87
3.94
3.39
3.43
4.09
3.85
3.63
3.17
3.24
4.00
3.85
3.54
3.32
3.27
4.16
4.09
3.73
3.53
3.18
I like learning from others with more experience than me.
I like sharing my experience, knowledge, or expertise with other volunteers.
I want to interact with like-minded people.
I want to spend time with family or friends.
I want to meet new people.
Mean
Up to 1 year* 1 to 3 years 4 to 6 years 7 to 10 years More than 10 years
Overall Mean
4.16
3.97
3.75
3.39
3.30
Importance of Social Motivations for Different Lengths of Involvement

100
I also compared the means for each motivator across different age groups and
gender. The most notable difference is in the last reason “I want to meet new people,”
which is rated higher by younger respondents than older respondents (Figure 27).
Females rated all of the motivators higher than males, but only slightly (Figure 28).
Figure 27. Importance of social motivations for different age groups. Responses were weighted accordingly: 1 = “strongly disagree,” 2 = “disagree,” 3 = “neutral or undecided”, 4 = “agree,” and 5 = “strongly agree”, no weight was assigned to “N/A.”
4.00
4.25
3.25
3.29
3.75
4.06
3.94
3.75
3.44
3.44
3.77
3.85
3.62
2.92
3.00
4.13
3.88
3.67
3.44
3.37
4.19
3.94
3.87
3.29
3.29
4.27
4.07
3.72
3.53
3.24
4.23
4.08
3.62
3.73
3.25
I like learning from others with more experience than me.
I like sharing my experience, knowledge, or expertise with other volunteers.
I want to interact with like-minded people.
I want to spend time with family or friends.
I want to meet new people.
Mean
Importance of Social Motivations for Different Age Groups
21-29 30-39 40-49 50-59 60-69 70-79 80 or older
Overall Mean
4.16
3.97
3.75
3.39
3.30
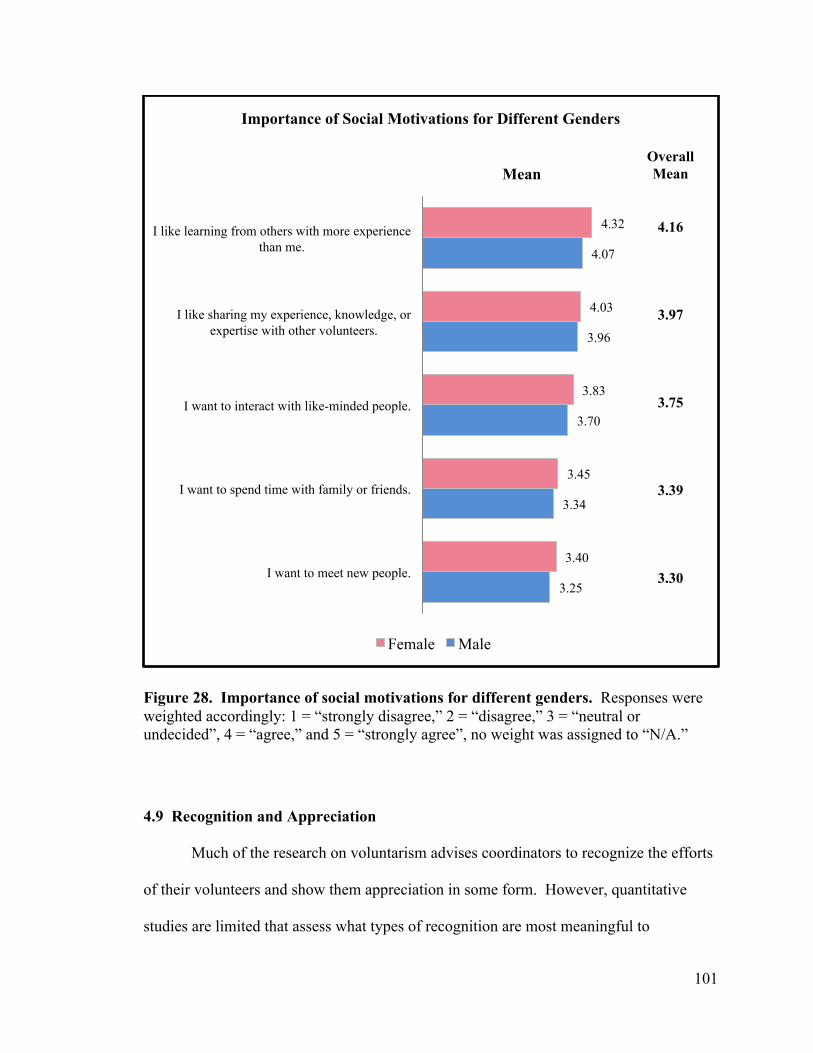
101
Figure 28. Importance of social motivations for different genders. Responses were weighted accordingly: 1 = “strongly disagree,” 2 = “disagree,” 3 = “neutral or undecided”, 4 = “agree,” and 5 = “strongly agree”, no weight was assigned to “N/A.”
4.9 Recognition and Appreciation
Much of the research on voluntarism advises coordinators to recognize the efforts
of their volunteers and show them appreciation in some form. However, quantitative
studies are limited that assess what types of recognition are most meaningful to
4.32
4.03
3.83
3.45
3.40
4.07
3.96
3.70
3.34
3.25
I like learning from others with more experience than me.
I like sharing my experience, knowledge, or expertise with other volunteers.
I want to interact with like-minded people.
I want to spend time with family or friends.
I want to meet new people.
Mean
Importance of Social Motivations for Different Genders
Female Male
Overall Mean
4.16
3.97
3.75
3.39
3.30

102
volunteers. Most respondents (84%) reported having received some form of recognition
(Appendix F: Recognition), however they do not indicate strong feelings (only 40%
agreement) about the importance of receiving recognition (Figure 29). The most
common response to this question was “neutral or undecided.” Some studies have found
that some volunteers would prefer not to receive any recognition. My results do not
support this claim very strongly; less than 10% of respondents agree. I also found no
differences across length of involvement, gender, or age.
Figure 29. Importance of receiving recognition or appreciation. Distribution of responses for each statement about receiving recognition or appreciation. Green indicates agreement (darker green for “strongly agree”), gray represents “neutral or undecided”, and red indicates disagreement (darker red for “strongly disagree”). Orange represents “N/A” (not applicable).
Respondents were asked to indicate how meaningful different forms of
recognition were to them on a scale from “not meaningful at all” to “very meaningful.”
The highest rated form of recognition was a hand-written card (over 60% found this
moderately meaningful or very meaningful); this was followed closely by a personalized
0% 10% 20% 30% 40% 50% 60% 70% 80% 90% 100%
It is important to me to receive some form of recognition or appreciation for my work
I would prefer not to receive any recognition or appreciation for my work
Importance of Receiving Recognition or Appreciation
Strongly Agree Agree Neutral or Undecided Disagree Strongly Disagree
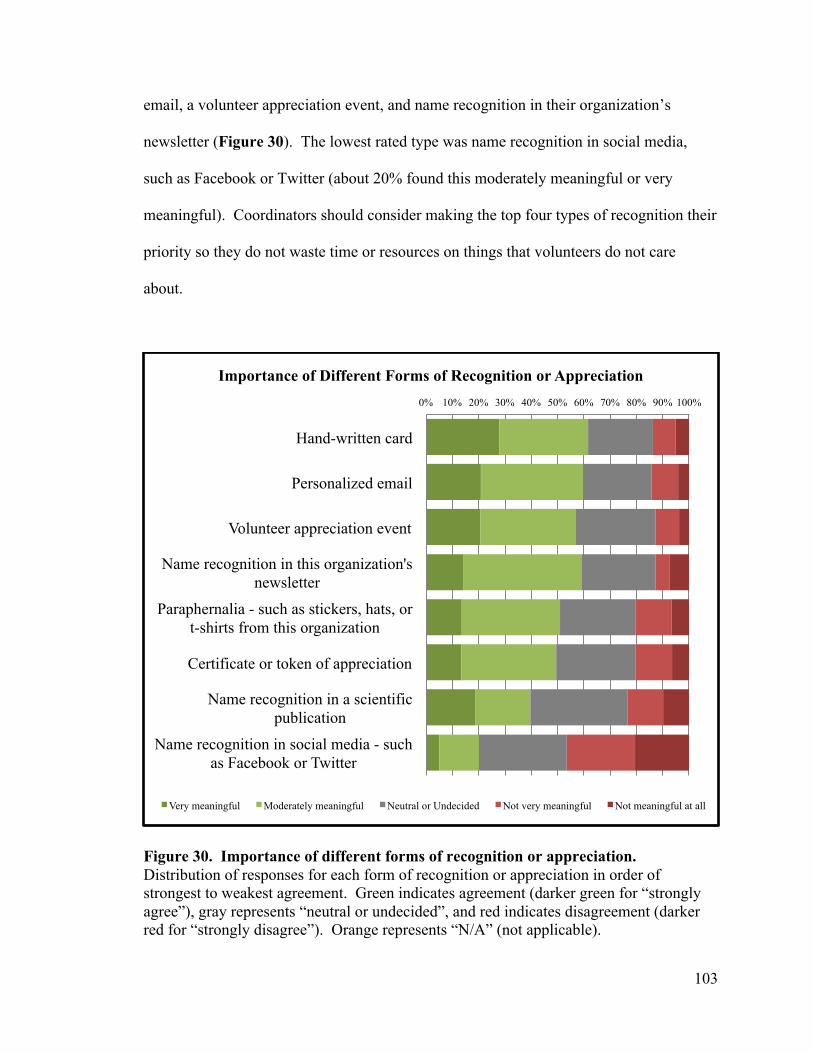
103
email, a volunteer appreciation event, and name recognition in their organization’s
newsletter (Figure 30). The lowest rated type was name recognition in social media,
such as Facebook or Twitter (about 20% found this moderately meaningful or very
meaningful). Coordinators should consider making the top four types of recognition their
priority so they do not waste time or resources on things that volunteers do not care
about.
Figure 30. Importance of different forms of recognition or appreciation. Distribution of responses for each form of recognition or appreciation in order of strongest to weakest agreement. Green indicates agreement (darker green for “strongly agree”), gray represents “neutral or undecided”, and red indicates disagreement (darker red for “strongly disagree”). Orange represents “N/A” (not applicable).
0% 10% 20% 30% 40% 50% 60% 70% 80% 90% 100%
Hand-written card
Personalized email
Volunteer appreciation event
Name recognition in this organization's newsletter
Paraphernalia - such as stickers, hats, or t-shirts from this organization
Certificate or token of appreciation
Name recognition in a scientific publication
Name recognition in social media - such as Facebook or Twitter
Importance of Different Forms of Recognition or Appreciation
Very meaningful Moderately meaningful Neutral or Undecided Not very meaningful Not meaningful at all

104
Younger and older volunteers expressed different views about preferred forms of
recognition. Younger respondents scored all forms of recognition higher than older
respondents (Figure 31). Young people rated name recognition in both scientific
publication and social media much higher than older people. Because younger volunteers
care more about advancing their career and enhancing their reputation than older
volunteers, younger volunteers may care more about name recognition. The youngest
age group rated name recognition in a scientific publication higher than all other forms
(4.62). This may indicate that younger volunteers have different priorities than older
volunteers, which may represent a generational shift. I found very little difference
between genders (Appendix F: Recognition).

105
Figure 31. Importance of different forms of recognition for different age groups. Responses were weighted accordingly: 1 = “strongly disagree,” 2 = “disagree,” 3 = “neutral or undecided”, 4 = “agree,” and 5 = “strongly agree”, no weight was assigned to “N/A.”
4.25
4.00
4.00
3.63
3.75
3.38
4.62
3.50
3.88
4.06
3.88
3.75
3.88
3.63
3.94
3.19
3.92
3.38
3.85
3.46
3.46
3.38
3.31
2.62
3.90
3.58
3.62
3.48
3.14
3.40
3.22
2.60
3.58
3.67
3.49
3.43
3.34
3.18
3.05
2.48
3.57
3.52
3.68
3.68
3.44
3.48
3.19
2.48
3.82
3.25
3.25
3.50
3.17
3.58
3.25
2.50
Hand-written card
Personalized email
Volunteer appreciation event
Name recognition in this organization's newsletter
Paraphernalia - such as stickers, hats, or t-shirts from this organization
Certificate or token of appreciation
Name recognition in a scientific publication
Name recognition in social media - such as Facebook or Twitter
Mean
21-29 30-39 40-49 50-59 60-69 70-79 80 or older
Overall Mean
3.71
3.62
3.61
3.53
3.37
3.36
3.25
2.58
Importance of Different Forms of Recognition for Different Age Groups

106
Chapter 5: Conclusion
5.1 Key Findings and Applications
Volunteer Profile
This research collected survey response from 271 volunteer water quality
monitors from eight organizations across the United States. Respondents were almost
equally divided between male and female. Most survey respondents were over age 50
(86%) and the age group with the most responses was 60-69 (37%). Most were well
educated, almost half were retired, and one-third were employed full-time.
I expected a normal distribution for length of involvement with the organization,
with more people being involved for mid-term ranges (one to six years) and fewer
involved for long-term ranges (more than seven years), but surprisingly, 30% of
respondents (and the mode response) have been involved more than 10 years. This may
indicate a response bias and a limitation of the study: those who are more dedicated to the
organization are more likely to respond to a survey.
Most respondents volunteer twice per month for an average duration of 30
minutes to one hour. They usually perform tasks outdoors and they are not deterred by
bad weather. Most respondents prefer one-time training events in order to participate, but
over half also like sequential training to increase their expertise. Most prefer to work in
small groups (5 or less) or alone to larger groups. Of those who like to work alone, 70%
are male. When developing activities for volunteers, coordinators should consider these
preferences and create options for volunteers to choose from. For example, at one event,

107
multiple activities could occur at once – some that require only one person or optionally
working with a partner and some activities that engage three to five people.
Motivations
Motivations that serve the values function of the Volunteer Functions Inventory
(see Section 2.2; Clary et al., 1998) are the strongest (to help the environment and
community); closely followed by motivations serving the ego protective function (to get
outside or connect with nature) and the understanding function (to contribute to scientific
knowledge, to learn about water quality, to learn new skills or knowledge).
There was no difference in the importance of motivations based on gender.
However, age and being a new volunteer played a role in the career motivation. The
career motivation is the weakest motivator overall. However, younger and newer
volunteers rate career higher than older or veteran volunteers. The career motivator
decreases in importance with increasing age. Even though the career motivator is rated
lowest out of 12 for the population as a whole, it is the 6th strongest for younger
volunteers. Coordinators who want to recruit new volunteers or younger volunteers
should consider this when crafting their messages.
Because volunteers found “learning from others” and “sharing experiences with
others” very important, coordinators should strive to create activities that are suitable for
a range of experience and expertise levels. Creating an atmosphere of social learning can
be achieved, while incorporating group size preference, by pairing or grouping more
experienced volunteers with less experienced volunteers. Allowing the veteran
108
volunteers to train the new volunteers is another option. Coordinators should note that
younger and newer volunteers rated social motivations slightly higher than other groups.
Communication and Recognition
Respondents overwhelmingly indicated feeling good when results are shared with
them and even more so when environmental problems are identified and addressed
because of their data. Most respondents were neutral about receiving recognition for
their work, although it is important to at least 30%. This indicates that tangible results
derived from the efforts of the volunteers are more important than any form of reward. It
also shows that communicating results to the volunteers is equally important. However,
because other studies have revealed divergent results on the importance of recognition,
this may be better explored through focus groups. In addition, individual personality may
play a large role in whether recognition is desired and in what form (Trachtman, 2015).
A hand-written card was perceived as the most meaningful form of recognition.
Younger respondents rated all forms of recognition higher than older respondents, and
the most important form of recognition to younger people was name recognition in a
scientific publication, whereas this was the second least meaningful to the respondents
overall. This may be indicative of either a generational or maturational shift. It could be
that as people age, they care less about name recognition. However, it could indicate that
the younger generation has different priorities, which may or may not change as they age.
Coordinators should pay close attention to the pattern across age groups. When
coordinators recruit young people, they should consider ways that their data can be
published and make it known to the volunteers that they will receive acknowledgement in

109
the publications. Coordinators also need to pay attention to the body of volunteers that
are currently participating and make sure that they cultivate the motivations of those
volunteers as well. Since most respondents are over 50 years of age and place little
importance on name recognition, coordinators will need to reward them differently, such
as with a card or an appreciation event.
5.2 Limitations
Because the survey was quantitative, this study was limited by an inability to ask
respondents about topics at a deeper level. When analyzing Likert-type data with means,
there is an assumption of equal distance between the response alternatives on a 5-point
scale. Whereas in reality, there is no unit of measure between feelings of “agree” and
“strongly agree.” Finally, the aggregated results of this study are biased toward Maine
VLMP volunteers because they represent nearly half of the respondents.
5.3 Further Research
Although the fourth highest of the 12 motivators to participate is “I want to
contribute to scientific knowledge,” many respondents feel neutral about data being used
for scientific publications. This set of responses raises interesting questions and avenues
for further exploration: How do citizen scientists perceive or define scientific knowledge?
Why are publications relatively unimportant to the volunteer and what form of scientific
knowledge should the data take? This could be explored by asking volunteers their
opinion on how their data should be used. Volunteers may perceive scientific
publications as somewhat inaccessible, and, since they value tangible results, perhaps the
110
issue is more about the data being made publicly available so that it may be used to solve
problems.
Volunteers place great value on results being shared with them, so the next step
would be to elicit the best methods to communicate this information. Volunteers may
prefer to receive updates via email or newsletters, or they might prefer a presentation that
interprets the results. This would fulfill the understanding motivation and some
volunteers may take this information and act as ambassadors by teaching other non-
participants about stewardship.
Conflicting responses about social motivators indicate that this topic is difficult to
address in a closed-ended questionnaire. The motivators “I want to engage with other
people” was important to 60% of respondents, and “I want to interact with like-minded
people” was important to 70%, but “to spend time with family and friends” and “to meet
new people” were only important to 40%. Individuals may be more motivated than they
report by interpersonal relationships within the organization. For example, when
friendships are developed, an individual may become more motivated to attend events
knowing that they might see their friends there. However, this force may act on a level
that is too subtle for an individual to be very conscious of when taking a survey.
Understanding how social interactions influence participation may require focus groups
or participant observation.
Finally, coordinators would benefit greatly from more specific knowledge about
how to acknowledge their volunteers. The most meaningful form of reward to
respondents was a hand-written card (60%). There could be a form of reward that is
meaningful to more than 60% of volunteers that could be elicited from an open-ended
111
survey question. However, individuals may feel uncomfortable naming a specific
reward because they are contributing their efforts mostly from a function of altruism and
thus they feel that should not need a reward. Like social interactions, reward may act on
a subtle level of consciousness, wherein receiving a reward makes the volunteer feel
good, but this feeling may not arise to a level of awareness when the individual is taking
a survey.
This study raises interesting questions for future research while providing clear
directions for project coordinators which can be incorporated into the activities they plan,
how they show appreciation to their volunteers, and how they craft messages to recruit
and retain volunteers. Volunteer water quality monitors provide a vital resource to
society by identifying sources of pollution and unhealthy water bodies, yet these
volunteers have been understudied. Because water quality monitors represent a cross
section between citizen science and environmental stewardship, this study will help
coordinators in both fields to improve retention.
112
References
About the Christmas Bird Count. (n.d.). Retrieved January 2, 2015, from
http://birds.audubon.org/about-christmas-bird-count
Addy, K., Green, L., Herron, E., & Stepenuck, K. (2010). Why Volunteer Water Quality
Monitoring Makes Sense. US Department of Agriculture, Washington, DC:
USDA - NIFA Volunteer Water Quality Monitoring National Facilitation Project,
Factsheet II. Retrieved from http://www.usawaterquality
.org/volunteer/pdf/GuideBook/Why_Makes_Sense_II.pdf
Allen, I. E., & Seaman, C. A. (2007). Likert scales and data analyses. Quality Progress,
40(7), 64–65.
Asah, S. T., & Blahna, D. J. (2012). Motivational functionalism and urban conservation
stewardship: implications for volunteer involvement: Urban conservation
stewardship. Conservation Letters, 5(6), 470–477. http://doi.org/10.1111/j.1755-
263X.2012.00263.x
Bell, S., Marzano, M., Cent, J., Kobierska, H., Podjed, D., Vandzinskaite, D., … Muršič,
R. (2008). What counts? Volunteers and their organisations in the recording and
monitoring of biodiversity. Biodiversity and Conservation, 17(14), 3443–3454.
http://doi.org/10.1007/s10531-008-9357-9
Boone, H. N., & Boone, D. A. (2012). Analyzing likert data. Journal of Extension, 50(2),
1–5.
Bruyere, B., & Rappe, S. (2007). Identifying the motivations of environmental
volunteers. Journal of Environmental Planning and Management, 50(4), 503–
516. http://doi.org/10.1080/09640560701402034
113
Carifio, J., & Perla, R. J. (2007). Ten common misunderstandings, misconceptions,
persistent myths and urban legends about Likert scales and Likert response
formats and their antidotes. Journal of Social Sciences, 3(3), 106.
Citizen Science Association. (n.d.). Retrieved January 2, 2015, from
http://citizenscienceassociation.org/
Clary, E. G., Snyder, M., Ridge, R. D., Copeland, J., Stukas, A. A., Haugen, J., & Miene,
P. (1998). Understanding and assessing the motivations of volunteers: a functional
approach. Journal of Personality and Social Psychology, 74(6), 1516.
Clason, D. L., & Dormody, T. J. (1994). Analyzing data measured by individual Likert-
type items. Journal of Agricultural Education, 35, 4.
Conrad, C. C., & Hilchey, K. G. (2011). A review of citizen science and community-
based environmental monitoring: issues and opportunities. Environmental
Monitoring and Assessment, 176(1-4), 273–291. http://doi.org/10.1007/s10661-
010-1582-5
Dark Sky Meter. (n.d.). Retrieved January 3, 2015, from http://www.darkskymeter.com/
Dawes, J. (2008). Do data characteristics change according to the number of scale points
used? An experiment using 5-point, 7-point, and 10-point scales. International
Journal of Market Research, 50(1), 61–77.
Dickinson, J. L., & Bonney, R. (Eds.). (2012). Citizen Science: Public Participation in
Environmental Research. Ithaca, NY: Cornell University Press.
Einolf, C., & Chambré, S. M. (2011). Who volunteers? Constructing a hybrid theory:
Who volunteers? Constructing a hybrid theory. International Journal of Nonprofit

114
and Voluntary Sector Marketing, 16(4), 298–310.
http://doi.org/10.1002/nvsm.429
Galaxy Zoo 1. (n.d.). Retrieved January 9, 2015, from http://zoo1.galaxyzoo.org/
Gliem, J. A., & Gliem, R. R. (2003). Calculating, interpreting, and reporting Cronbach’s
alpha reliability coefficient for Likert-type scales. Midwest Research-to-Practice
Conference in Adult, Continuing, and Community Education. Retrieved from
https://scholarworks.iupui.edu/handle/1805/344
Jacobson, S. K., Carlton, J. S., & Monroe, M. C. (2012). Motivation and Satisfaction of
Volunteers at a Florida Natural Resource Agency. Journal of Park and Recreation
Administration, 30(1), 51–67.
Jamieson, S. (2004). Likert scales: how to (ab)use them. Medical Education, 38(12),
1217–1218. http://doi.org/10.1111/j.1365-2929.2004.02012.x
King, K. N., & Lynch, C. V. (1998). The Motivation Of Volunteers In The Nature
Conservancy-Ohio Chapter, a Non-Profit Environmental Organization. The
Journal of Volunteer Administration, 16(2), 5–11.
Knoke, D. (1981). Commitment and Detachment in Voluntary Associations. American
Sociological Review, 46(2), 141. http://doi.org/10.2307/2094975
Likert, R. (1932). A Technique for the Measurement of Attitudes. Archives of
Psychology, 140(55).
Maine Lakes Report | Maine Volunteer Lake Monitoring Program. (n.d.). Retrieved June
2, 2015, from http://www.mainevlmp.org/maine-lake-report/
Maine Volunteer Lake Monitoring Program. (2013). Maine Lakes Report 2013. Auburn,
ME.
115
Mutchler, J. E., Burr, J. A., & Caro, F. G. (2003). From Paid Worker to Volunteer:
Leaving the Paid Workforce and Volunteering in Later Life*. Social Forces,
81(4), 1267–1293.
Near Real-Time Lake Data | Maine Volunteer Lake Monitoring Program. (n.d.).
Retrieved June 2, 2015, from http://www.mainevlmp.org/near-real-time-lake-
data/
Nichols, J. (2014, February). Make Your Dives Count! REEF Volunteer Survey Project in
the Pacific NW. LOTT’s WET (Water Education and Technology) Science
Center: Olympia, WA.
Nov, O., Arazy, O., & Anderson, D. (2014). Scientists@Home: What Drives the Quantity
and Quality of Online Citizen Science Participation? PLoS ONE, 9(4), 1–11.
http://doi.org/10.1371/journal.pone.0090375
Overdevest, C., Orr, C. H., & Stepenuck, K. (2004). Volunteer stream monitoring and
local participation in natural resource issues. Human Ecology Review, 11(2), 177–
185.
Project BudBurst. (n.d.). Retrieved January 3, 2015, from http://budburst.org/
Raddick, M. J., Bracey, G., Gay, P. L., Lintott, C. J., Murray, P., Schawinski, K., …
Vandenberg, J. (2010). Galaxy Zoo: Exploring the Motivations of Citizen Science
Volunteers. Astronomy Education Review, 9(1).
http://doi.org/10.3847/AER2009036
REEF Volunteer Fish Survey Project. (n.d.). Retrieved January 2, 2015, from
http://www.reef.org/programs/volunteersurvey
116
River Science | South Yuba River Citizens League. (n.d.). Retrieved June 2, 2015, from
http://yubariver.org/our-work/river-science/
Roggenbuck, J. W., Haas, S. C., Hall, T. E., & Hull, R. B. (2001). Motivation, Retention,
and Program Recommendations of Save Our Streams Volunteers. Blacksburg,
VA: Virginia Water Resources Research Center at Virginia Polytechnic Institute
and State University.
Rotman, D., Hammock, J., Preece, J., Hansen, D., Boston, C., Bowser, A., & He, Y.
(2014). Motivations Affecting Initial and Long-Term Participation in Citizen
Science Projects in Three Countries (pp. 110–124). Presented at the iConference,
iSchools. http://doi.org/10.9776/14054
Ryan, R. L., Kaplan, R., & Grese, R. E. (2001). Predicting volunteer commitment in
environmental stewardship programmes. Journal of Environmental Planning and
Management, 44(5), 629–648.
Schroeder, H. W. (2000). The restoration experience: Volunteers’ motives, values, and
concepts of nature. In P. H. Gobster & R. B. Hull (Eds.), Restoring nature:
Perspectives from the social sciences and humanities (pp. 247–264). Washington,
DC: Island Press.
SciStarter. (n.d.). Retrieved January 2, 2015, from
http://scistarter.com/page/Citizen%20Science.html
Self-efficacy - Wikipedia, the free encyclopedia. (n.d.). Retrieved January 8, 2015, from
http://en.wikipedia.org/wiki/Self-efficacy#cite_note-1
Shilling, F. (2006). State of the Yuba: An Assessment of the Yuba River Watershed.
Nevada City, CA: South Yuba River Citizens League.

117
Shirk, J. L., Ballard, H. L., Wilderman, C. C., Phillips, T., Wiggins, A., Jordan, R., …
Bonney, R. (2012). Public Participation in Scientific Research: a Framework for
Deliberate Design. Ecology and Society, 17(2). http://doi.org/10.5751/ES-04705-
170229
Stallings, B. B. (1998). Training busy staff to succeed with volunteers: Building
commitment and competence in staff/volunteer teams (2nd ed.). Pleasanton, CA:
Building Better Skills.
Stream Team - Santa Barbara Channelkeeper - Keeping watch for clean water. (n.d.).
Retrieved January 3, 2015, from http://www.sbck.org/current-issues/water-
quality-monitoring/stream-team/
Theobald, E. J., Ettinger, A. K., Burgess, H. K., DeBey, L. B., Schmidt, N. R., Froehlich,
H. E., … Parrish, J. K. (2015). Global change and local solutions: Tapping the
unrealized potential of citizen science for biodiversity research. Biological
Conservation, 181, 236–244. http://doi.org/10.1016/j.biocon.2014.10.021
Trachtman, M. (2015, March). Volunteer Management: Recruiting, Retention, and
Performance. LOTT’s WET (Water Education and Technology) Science Center:
Olympia, WA.
URI Watershed Watch Data Available Online. (n.d.). Retrieved June 2, 2015, from
http://www.uri.edu/ce/wq/ww/data/DataTable.htm
URI Watershed Watch Monitoring Data and Results. (n.d.). Retrieved June 2, 2015, from
http://www.uri.edu/ce/wq/ww/Data.htm
USA National Phenology Network. (n.d.). Retrieved January 3, 2015, from
https://www.usanpn.org/about

118
US EPA. (n.d.). Monitoring and Assessing Water Quality. Retrieved January 2, 2015,
from http://water.epa.gov/type/rsl/monitoring/index.cfm
Volunteer Water Monitoring and Master Naturalist Programs in the US. (2013).
Retrieved January 22, 2015, from
http://www.usawaterquality.org/volunteer/VolunteerMonPrograms/index.html
Yuba Shed: The Yuba River Watershed Information System. (n.d.). Retrieved June 2,
2015, from http://yubashed.org/

119
Appendices
Appendix A: Recruitment Details
Call for Research Participants
To recruit organizations to participate in my study I sent a call for research
participants to several listserv groups: Association for Environmental Studies and
Sciences (AESS), Cornell Citizen Science Discussion, Thurston Eco Network (formerly
EETAC), and EPA Volunteer Monitor. I also sent a request to three listserv managers to
post my call for participants, but they either did not respond or failed to follow through.
In my call for participants, I stated that I was looking for organizations with volunteers
that monitor water quality. I purposely left out specific parameters, because I was hoping
to capture a broad array of monitoring activities including, but not limited to, chemical
tests, secchi disk, and macroinvertebrate monitoring. Of the organizations that contacted
me with expressed interest in participating, one opted out due to lack of time and another
I excluded because the volunteers collected wildlife data and not water quality data. I also
contacted three organizations directly via email, but these organizations did not respond.
Promotional Material
We want to hear from you! Our organization has been asked by Bethany Alender,
Master of Environmental Studies Candidate with The Evergreen State College, to
participate in her graduate study about what motivates people to participate in volunteer
water quality monitoring. Your participation in the study will help us better understand
volunteer motivations and will help us tailor our program to better serve

120
our volunteers. Please click on the link below to participate in a brief survey (about 10
minutes). For questions about the survey, you may contact Bethany
Participants who fully complete the questionnaire will be entered in a random drawing
for 1 of 10 one-year subscriptions to National Geographic!
Please complete the survey by Friday, March 13th.

121
Appendix B: Participating Organizations
Org
aniz
atio
nL
ocat
ion
Wat
er q
ualit
y m
easu
rem
ents
W
ebsi
teYe
ar
Foun
ded
Tota
l nu
mbe
r of
vo
lunt
eers
Num
ber
of
volu
ntee
rs
that
this
su
rvey
ap
plie
d to
Num
ber
of
volu
ntee
rs
who
wer
e se
nt
the
surv
ey v
ia
emai
lN
umbe
r of
re
spon
ses
Res
pons
e ra
tePe
rcen
t of a
ll re
spon
ses
Not
esSo
uth
Yuba
Riv
er
Citi
zens
Lea
gue
(SY
RC
L)
Cal
iforn
ia:
Nev
ada
City
wat
er te
mpe
ratu
re, a
ir te
mpe
ratu
re,
cond
uctiv
ity, d
isso
lved
oxy
gen,
pH
, ch
lorid
e, tu
rbid
ity
http
://yu
bariv
er.o
rg/ri
ver-m
onito
ring/
1983
600
5757
3052
.6%
11.1
%O
nly
one
volu
ntee
r did
not
use
em
ail.
Mai
ne V
olun
teer
La
ke M
onito
ring
Prog
ram
(VLM
P)
Mai
ne:
stat
ewid
ew
ater
cla
rity
(Sec
chi d
isk)
, tot
al
phos
phor
ous,
chlo
roph
yll a
, alk
alin
ity,
pH, a
ppar
ent c
olor
, spe
cific
co
nduc
tanc
e, tr
ophi
c st
ate
inde
x,
diss
olve
d ox
ygen
, tem
pera
ture
ww
w.m
aine
volu
ntee
rlake
mon
itors
.org
1971
1200
624
466
130
27.9
%48
.0%
The
initi
al e
mai
l sen
t had
a b
roke
n su
rvey
link
. V
LMP
sent
out
a
corr
ecte
d lin
k w
ithin
a fe
w h
ours
. Th
e co
ordi
nato
r cho
se to
send
onl
y tw
o em
ails
with
the
surv
ey li
nk b
ecau
se
thei
r vol
unte
ers d
o no
t lik
e re
ceiv
ing
man
y em
ails
.
Nor
th P
ond
Ass
ocia
tion
of
Mai
ne
Mai
ne: t
owns
of
Mer
cer,
Smith
field
, and
R
ome
wat
er c
larit
y (S
ecch
i dis
k)ht
tp://
ww
w.n
orth
pond
.net
/hom
e19
85un
know
n15
1510
66.7
%3.
7%Fi
fteen
boa
rd m
embe
rs re
ceiv
ed th
e su
rvey
via
em
ail.
One
boa
rd m
embe
r po
sted
the
surv
ey li
nk to
the
NPA
Fa
cebo
ok p
age
whi
ch h
as 3
00 “
likes
,”
of w
hich
100
wer
e m
embe
rs a
nd so
me
wer
e vo
lunt
eers
.
Boq
uet R
iver
A
ssoc
iatio
n (B
RA
SS)
New
Yor
k:
Eliz
abet
htow
nph
osph
orou
s, ba
cter
ia, h
eavy
met
als
http
://bo
quet
river
.org
/com
plet
ed-
proj
ects
/mon
itorin
g/19
84un
know
n4
45
125.
0%1.
8%Fo
ur b
oard
mem
bers
rece
ived
the
surv
ey v
ia e
mai
l. T
he su
rvey
was
not
sh
ared
with
oth
er v
olun
teer
s or
mem
bers
of B
RA
SS.
The
reas
on fo
r th
e fif
th re
spon
se is
unk
now
n.
Uni
vers
ity o
f Rho
de
Isla
nd W
ater
shed
W
atch
Pro
gram
(U
RIW
W)
Rho
de Is
land
: st
atew
ide
wat
er c
larit
y (S
ecch
i dis
k), a
lgal
den
sity
(c
hlor
phyl
l a),
diss
olve
d ox
ygen
, wat
er
tem
pera
ture
, alk
alin
ity, p
H, t
otal
and
di
ssol
ved
nutri
ents
(pho
spho
rous
, am
mon
ia, a
nd n
itrat
e-ni
troge
n), b
acte
ria
in m
arin
e w
ater
ww
w.u
ri.ed
u/ce
/wq/
ww
1988
400
400
360
7420
.6%
27.3
%Th
ree
volu
ntee
rs d
id n
ot u
se e
mai
l.
Som
e re
cipi
ents
wer
e no
t vol
unte
ers
and
wer
e in
stru
cted
to ig
nore
the
surv
ey, s
o th
e re
spon
se ra
te is
in
accu
rate
.
Nis
qual
ly R
iver
Ed
ucat
ion
Proj
ect
(NR
EP)
Was
hing
ton:
Th
urst
on C
ount
ydi
ssol
ved
oxyg
en, f
ecal
col
iform
, tot
al
solid
sht
tp://
nrep
.nis
qual
lyriv
er.o
rg/
1991
unkn
own
4949
1020
.4%
3.7%
Stre
am T
eam
Was
hing
ton:
O
lym
pia,
Lac
ey,
Tum
wat
er, a
nd
Thur
ston
Cou
nty
mac
roin
verte
brat
esht
tp://
ww
w.st
ream
team
.info
1990
unkn
own
118
705
7.1%
1.8%
Stre
am T
eam
has
seve
ral w
ater
qua
lity
mon
itorin
g pr
ogra
ms.
The
coor
dina
tor
chos
e to
send
the
surv
ey v
ia e
mai
l onc
e an
d on
ly to
vol
unte
ers w
ho h
ad
surv
eyed
mac
roin
verte
brat
es w
ithin
the
past
yea
r.
Sout
h So
und
GR
EEN
(Glo
bal
Riv
ers
Envi
ronm
enta
l Ed
ucat
ion
Net
wor
k)
Was
hing
ton:
O
lym
pia,
Lac
ey,
Tum
wat
er, a
nd
Thur
ston
Cou
nty
diss
olve
d ox
ygen
, fec
al c
olifo
rmw
ww
.thur
ston
cd.c
om/s
outh
-sou
nd-
gree
n.ht
ml
1992
100
2424
729
.2%
2.6%
Sout
h So
und
GR
EEN
is c
ompr
ised
m
ostly
of h
igh
scho
ol st
uden
ts. T
he
coor
dina
tor s
ent t
his s
urve
y to
teac
hers
w
ho v
olun
taril
y pa
rtici
pate
with
thei
r cl
asse
s.
Tota
ls:
over
230
012
9110
4527
110
0.0%
Ove
rall
Res
pons
e R
ate:
25.9
%

122
Appendix C: Survey
Page 1
Understanding Volunteer MotivationsUnderstanding Volunteer MotivationsUnderstanding Volunteer MotivationsUnderstanding Volunteer Motivations
Dear Volunteer, Thank you for volunteering with our organization. You are receiving this questionnaire because your email address is in our volunteer database. Our organization has been asked by Bethany Alender, Master of Environmental Studies Candidate with The Evergreen State College, to participate in her graduate study about what motivates people to participate in volunteer water quality monitoring. Ms. Alender provides more information about her study on the following page. Your participation in the study will help us better understand volunteer motivations and will help us tailor our program to better serve our volunteers. This study is completely optional, and only Ms. Alender will see your confidential responses to the survey. The questionnaire should take about 10 minutes to complete. Thank you for your participation!
Introduction

123
Page 2
Understanding Volunteer MotivationsUnderstanding Volunteer MotivationsUnderstanding Volunteer MotivationsUnderstanding Volunteer Motivations
Dear Participant, I am a graduate student at The Evergreen State College earning my Master of Environmental Studies. As part of my thesis research, I am studying volunteer motivations to participate in water quality monitoring. The purpose of my project is to gather information about what motivates volunteers and produce a thesis research paper and presentation about my findings. I hope that your participation in the study may provide insight into volunteers’ reasons for longterm participation. This information will help project coordinators tailor their programs to better serve their volunteers. It will also help project coordinators maximize resources by reducing costs associated with the recruitment and retention of volunteers, overall enabling the program to better meet its goals. Your participation is completely voluntary and I appreciate your time. As a way of thanking those who participate, all participants who fully complete the questionnaire will be entered in a random drawing for one of ten oneyear subscriptions to National Geographic (your choice of print or digital editions for iPad, iPhone, or Kindle Fire plus online archive). If you wish to be entered in the drawing, your contact information will be collected at the end of the questionnaire. Your contact information will not be connected to your individual responses. The questionnaire will be closed to responses on March 13, 2015. If you have any questions about this project or your participation in it, you can email me at [email protected] or call me at 4048198192. Thank you for your participation. Sincerely, Bethany Alender Master of Environmental Studies Candidate Graduate Program on the Environment The Evergreen State College Olympia, WA
Informational Letter from the Researcher

124
Page 3
Understanding Volunteer MotivationsUnderstanding Volunteer MotivationsUnderstanding Volunteer MotivationsUnderstanding Volunteer Motivations
You are being invited to participate in a research study titled “Understanding Volunteer Motivations to Participate in Citizen Science Projects: A Deeper Look at Water Quality Monitoring.” This study is being done by Bethany Alender from The Evergreen State College. You were selected to participate in this study because you are in the volunteer database of an organization that conducts water quality monitoring. The purpose of this research study is to gather information about volunteers in water quality monitoring projects and produce a thesis research paper about the findings. If you agree to take part in this study, you will be asked to complete an online questionnaire. This questionnaire will ask about your volunteering habits, reasons for volunteering, and opinions. It will take you approximately 10 minutes to complete. You may not directly benefit from this research; however, I hope that your participation in the study may provide insight into volunteers’ reasons for longterm participation. This information will help project coordinators tailor their programs to better serve their volunteers, while reducing costs associated with the recruitment and retention of volunteers allowing the program to better meet its goals. Risks to you are minimal and are likely to be no more than mild discomfort with sharing your opinion. To the best of my ability your answers in this study will remain confidential and anonymous. Your email and IP addresses will not be collected. With any online related activity, however, the risk of a breach of confidentiality is always possible. I will minimize any risks by storing the questionnaires in a password protected electronic format. Only I will be able to access your individual responses to the questionnaire. Aggregates and summaries of the responses, however, will be shared with participating project coordinators and may appear in publications and presentations of the research findings. Your participation in this study is completely voluntary and you can withdraw at any time. You are free to skip any question that you choose. However, I encourage you to answer all questions to the best of your ability. The final data set will be most useful if all questions are answered. If you have questions about this project or if you have a researchrelated problem, you may contact the researcher, Bethany Alender, at 4048198192 or [email protected]. If you have any questions concerning your rights as a research subject, or you experience problems as a result of participating in this research project, you may contact John McLain, IRB Administrator at The Evergreen State College at 360.867.6045 or [email protected].
1. By clicking “I agree” below you are indicating that you are at least 18 years old, have read and understood this consent form and agree to participate in this research study.
Please print a copy of this page for your records.
Consent Form
*
I agree nmlkj
I do not agree nmlkj

125
Page 4
Understanding Volunteer MotivationsUnderstanding Volunteer MotivationsUnderstanding Volunteer MotivationsUnderstanding Volunteer Motivations
Please tell me a little about yourself.
2. What is your age?
3. What gender do you identify as?
4. Do you have any children under 18?
5. What is the highest level of school you have completed or the highest degree you have received?
Demographics
17 or younger nmlkj
1820 nmlkj
2129 nmlkj
3039 nmlkj
4049 nmlkj
5059 nmlkj
6069 nmlkj
7079 nmlkj
80 or older nmlkj
Male nmlkj
Female nmlkj
Prefer not to answer nmlkj
Please specify
nmlkj
Yes nmlkj
No nmlkj
Less than high school degree nmlkj
High school degree or equivalent (e.g., GED) nmlkj
Some college but no degree nmlkj
Associate degree nmlkj
Bachelor degree nmlkj
Graduate degree nmlkj

126
Page 5
Understanding Volunteer MotivationsUnderstanding Volunteer MotivationsUnderstanding Volunteer MotivationsUnderstanding Volunteer Motivations6. Are you currently enrolled as a student?
7. Which of the following categories best describes your employment status?
8. How much money did YOU personally earn in 2014? Do not include income earned by members of your family or household.
No, I am not currently enrolled as a student nmlkj
Yes, at a high school or equivalent nmlkj
Yes, part time at an undergraduate college/university nmlkj
Yes, full time at an undergraduate college/university nmlkj
Yes, part time in graduate school nmlkj
Yes, full time in graduate school nmlkj
Employed, working fulltime nmlkj
Employed, working parttime nmlkj
Not employed, looking for work nmlkj
Not employed, NOT looking for work nmlkj
Retired nmlkj
Disabled, not able to work nmlkj
$0 to $9,999 nmlkj
$10,000 to $24,999 nmlkj
$25,000 to $49,999 nmlkj
$50,000 to $74,999 nmlkj
$75,000 to $99,999 nmlkj
$100,000 to $124,999 nmlkj
$125,000 to $149,999 nmlkj
$150,000 to $174,999 nmlkj
$175,000 to $199,999 nmlkj
$200,000 and up nmlkj
Prefer not to answer nmlkj

127
Page 6
Understanding Volunteer MotivationsUnderstanding Volunteer MotivationsUnderstanding Volunteer MotivationsUnderstanding Volunteer Motivations9. How much total combined money did all members of your HOUSEHOLD earn last year?
$0 to $9,999 nmlkj
$10,000 to $24,999 nmlkj
$25,000 to $49,999 nmlkj
$50,000 to $74,999 nmlkj
$75,000 to $99,999 nmlkj
$100,000 to $124,999 nmlkj
$125,000 to $149,999 nmlkj
$150,000 to $174,999 nmlkj
$175,000 to $199,999 nmlkj
$200,000 and up nmlkj
Prefer not to answer nmlkj
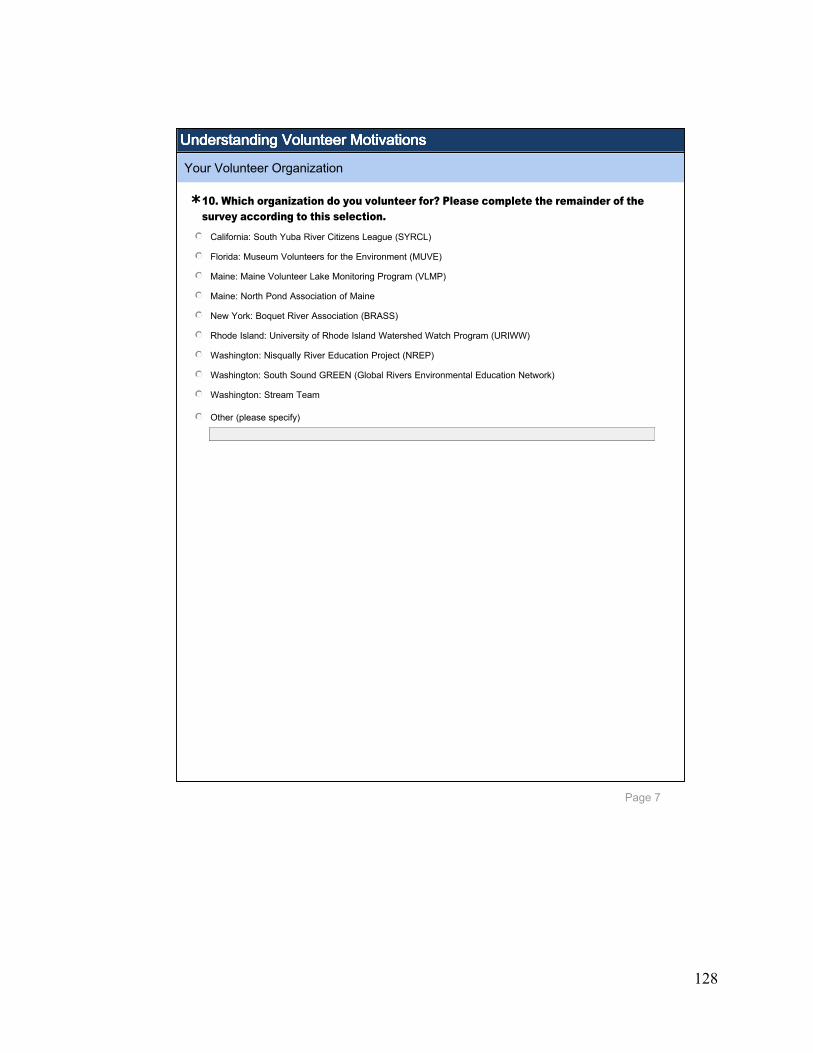
128
Page 7
Understanding Volunteer MotivationsUnderstanding Volunteer MotivationsUnderstanding Volunteer MotivationsUnderstanding Volunteer Motivations
10. Which organization do you volunteer for? Please complete the remainder of the survey according to this selection.
Your Volunteer Organization
*
California: South Yuba River Citizens League (SYRCL) nmlkj
Florida: Museum Volunteers for the Environment (MUVE) nmlkj
Maine: Maine Volunteer Lake Monitoring Program (VLMP) nmlkj
Maine: North Pond Association of Maine nmlkj
New York: Boquet River Association (BRASS) nmlkj
Rhode Island: University of Rhode Island Watershed Watch Program (URIWW) nmlkj
Washington: Nisqually River Education Project (NREP) nmlkj
Washington: South Sound GREEN (Global Rivers Environmental Education Network) nmlkj
Washington: Stream Team nmlkj
Other (please specify)
nmlkj

129
Page 8
Understanding Volunteer MotivationsUnderstanding Volunteer MotivationsUnderstanding Volunteer MotivationsUnderstanding Volunteer Motivations
11. When you volunteer for this project, which of the following tasks do you perform? Select all that apply.
12. In what year did you first volunteer for this project?
13. On average, how frequently do you volunteer or attend volunteer events?
14. On average, how much time do you spend each time you volunteer or attend a volunteer event?
Volunteer Habits
6
Collect data or record observations gfedc
Analyze data gfedc
Validate data gfedc
Develop research questions or hypotheses gfedc
Develop study designs gfedc
Conduct research to support the study gfedc
Train new volunteers gfedc
Perform administrative tasks gfedc
Serve on board of directors gfedc
Teach student groups that participate gfedc
None of the above gfedc
One or more times per week nmlkj
2 times per month nmlkj
One time per month nmlkj
Once every 2 to 4 months nmlkj
One or two times per year nmlkj
Less than 30 minutes nmlkj
Between 30 minutes and 1 hour nmlkj
Between 1 hour and 2 hours nmlkj
Between 2 hours and 4 hours nmlkj
More than 4 hours nmlkj
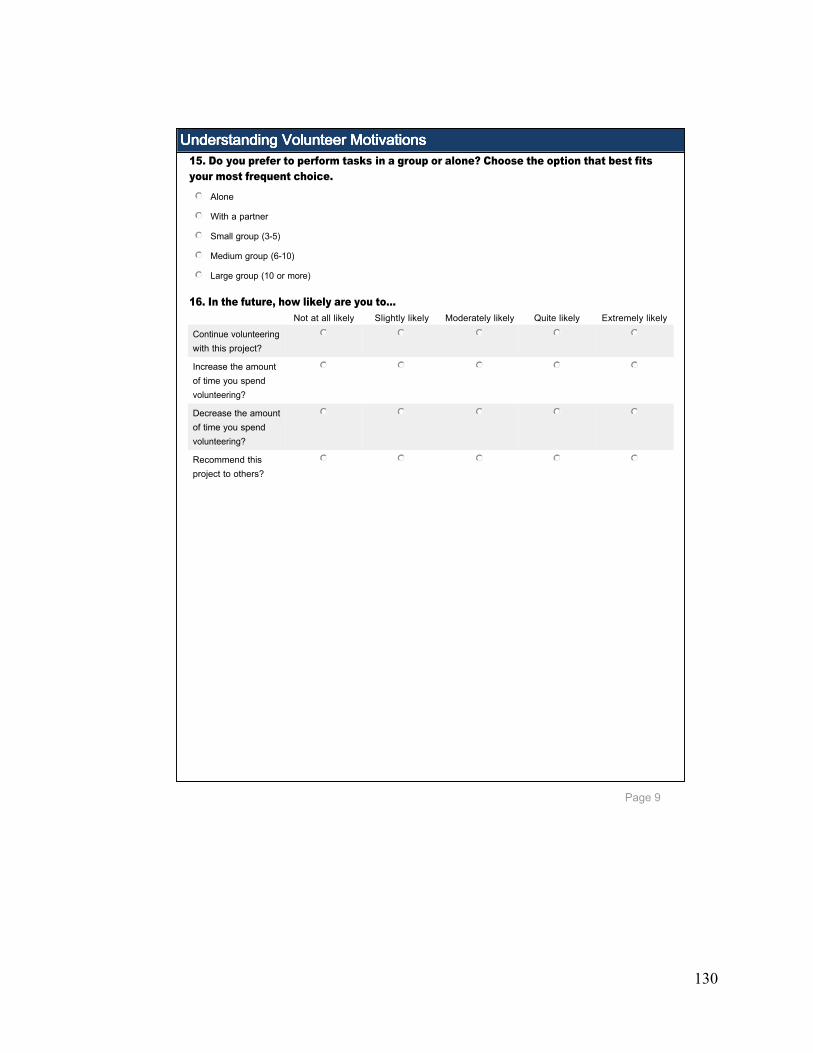
130
Page 9
Understanding Volunteer MotivationsUnderstanding Volunteer MotivationsUnderstanding Volunteer MotivationsUnderstanding Volunteer Motivations15. Do you prefer to perform tasks in a group or alone? Choose the option that best fits your most frequent choice.
16. In the future, how likely are you to...Not at all likely Slightly likely Moderately likely Quite likely Extremely likely
Continue volunteering with this project?
nmlkj nmlkj nmlkj nmlkj nmlkj
Increase the amount of time you spend volunteering?
nmlkj nmlkj nmlkj nmlkj nmlkj
Decrease the amount of time you spend volunteering?
nmlkj nmlkj nmlkj nmlkj nmlkj
Recommend this project to others?
nmlkj nmlkj nmlkj nmlkj nmlkj
Alone nmlkj
With a partner nmlkj
Small group (35) nmlkj
Medium group (610) nmlkj
Large group (10 or more) nmlkj

131
Page 10
Understanding Volunteer MotivationsUnderstanding Volunteer MotivationsUnderstanding Volunteer MotivationsUnderstanding Volunteer Motivations
17. Please indicate your level of agreement with the following phrases that complete the statement: "I volunteer for this organization because…"
I volunteer because...
Strongly Disagree
DisagreeNeutral or Undecided
Agree Strongly Agree N/A
I want to help or enhance the environment.
nmlkj nmlkj nmlkj nmlkj nmlkj nmlkj
I want to help the community.
nmlkj nmlkj nmlkj nmlkj nmlkj nmlkj
I want to help this organization do more for less money.
nmlkj nmlkj nmlkj nmlkj nmlkj nmlkj
I want to contribute to scientific knowledge.
nmlkj nmlkj nmlkj nmlkj nmlkj nmlkj
I want to learn skills or new knowledge.
nmlkj nmlkj nmlkj nmlkj nmlkj nmlkj
I want to learn more about water quality.
nmlkj nmlkj nmlkj nmlkj nmlkj nmlkj
I want to engage with other people.
nmlkj nmlkj nmlkj nmlkj nmlkj nmlkj
I want to get outside or connect with nature.
nmlkj nmlkj nmlkj nmlkj nmlkj nmlkj
I want to do something physically active.
nmlkj nmlkj nmlkj nmlkj nmlkj nmlkj
I want to have fun. nmlkj nmlkj nmlkj nmlkj nmlkj nmlkj
I want to advance my career through gained experience or networking.
nmlkj nmlkj nmlkj nmlkj nmlkj nmlkj
I want to enhance my reputation in my community.
nmlkj nmlkj nmlkj nmlkj nmlkj nmlkj

132
Page 11
Understanding Volunteer MotivationsUnderstanding Volunteer MotivationsUnderstanding Volunteer MotivationsUnderstanding Volunteer Motivations
18. When volunteering, how often do you perform tasks outdoors?
19. How likely are you to perform an outdoor task if the weather is unfavorable?
20. When a task must be completed outdoors, which of the following best describes your attitude?
21. When the weather requires protective clothing or boots, would you rather use your own gear or borrow gear from the organization?
Outdoor Activities
Never Seldom About half the time Usually Always
nmlkj nmlkj nmlkj nmlkj nmlkj
Not at all likely Slightly likely Moderately likely Quite likely Extremely likely
nmlkj nmlkj nmlkj nmlkj nmlkj
I'm a fair weather participant Bring on the sun! nmlkj
I will go out if the weather is somewhat unfavorable. nmlkj
There's no such thing as bad weather, just bad gear! nmlkj
It would take a severe storm or unsafe conditions to stop me from going out. nmlkj
I would prefer to use my own gear. nmlkj
I usually use my own gear, but I might need to borrow certain items in some conditions. nmlkj
I would prefer to borrow gear so that mine doesn't get messed up. nmlkj
I usually need to borrow gear. nmlkj
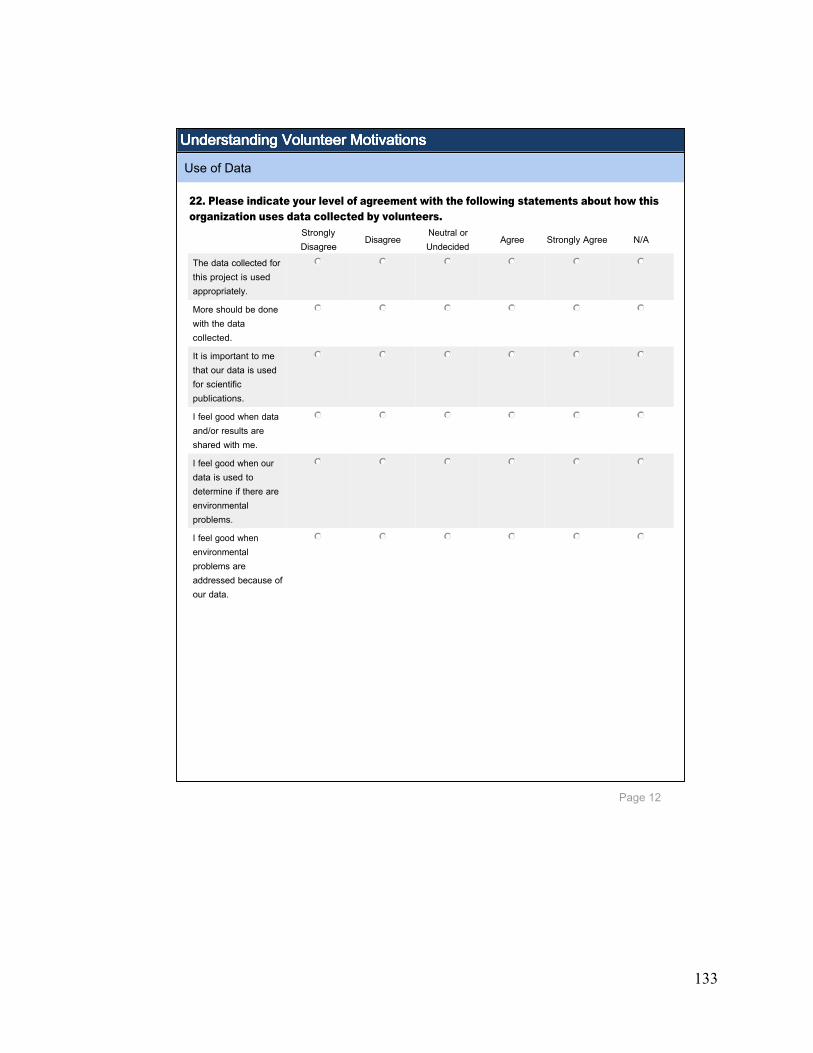
133
Page 12
Understanding Volunteer MotivationsUnderstanding Volunteer MotivationsUnderstanding Volunteer MotivationsUnderstanding Volunteer Motivations
22. Please indicate your level of agreement with the following statements about how this organization uses data collected by volunteers.
Use of Data
Strongly Disagree
DisagreeNeutral or Undecided
Agree Strongly Agree N/A
The data collected for this project is used appropriately.
nmlkj nmlkj nmlkj nmlkj nmlkj nmlkj
More should be done with the data collected.
nmlkj nmlkj nmlkj nmlkj nmlkj nmlkj
It is important to me that our data is used for scientific publications.
nmlkj nmlkj nmlkj nmlkj nmlkj nmlkj
I feel good when data and/or results are shared with me.
nmlkj nmlkj nmlkj nmlkj nmlkj nmlkj
I feel good when our data is used to determine if there are environmental problems.
nmlkj nmlkj nmlkj nmlkj nmlkj nmlkj
I feel good when environmental problems are addressed because of our data.
nmlkj nmlkj nmlkj nmlkj nmlkj nmlkj
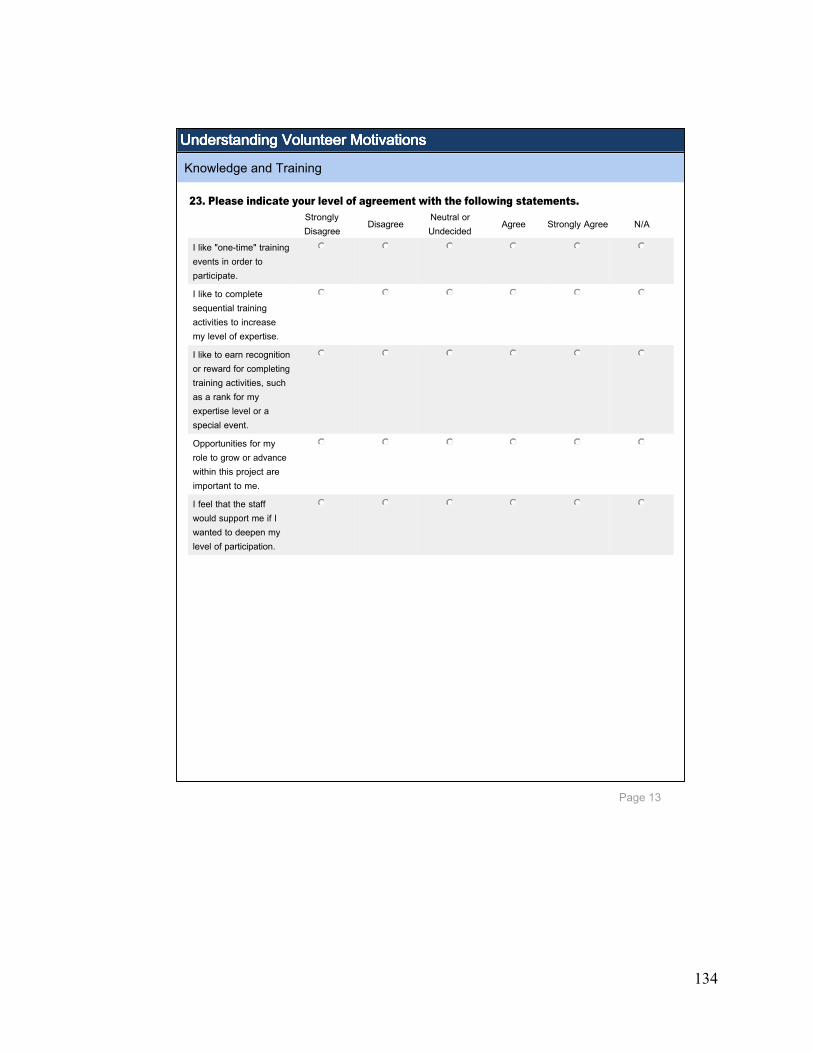
134
Page 13
Understanding Volunteer MotivationsUnderstanding Volunteer MotivationsUnderstanding Volunteer MotivationsUnderstanding Volunteer Motivations
23. Please indicate your level of agreement with the following statements.
Knowledge and Training
Strongly Disagree
DisagreeNeutral or Undecided
Agree Strongly Agree N/A
I like "onetime" training events in order to participate.
nmlkj nmlkj nmlkj nmlkj nmlkj nmlkj
I like to complete sequential training activities to increase my level of expertise.
nmlkj nmlkj nmlkj nmlkj nmlkj nmlkj
I like to earn recognition or reward for completing training activities, such as a rank for my expertise level or a special event.
nmlkj nmlkj nmlkj nmlkj nmlkj nmlkj
Opportunities for my role to grow or advance within this project are important to me.
nmlkj nmlkj nmlkj nmlkj nmlkj nmlkj
I feel that the staff would support me if I wanted to deepen my level of participation.
nmlkj nmlkj nmlkj nmlkj nmlkj nmlkj
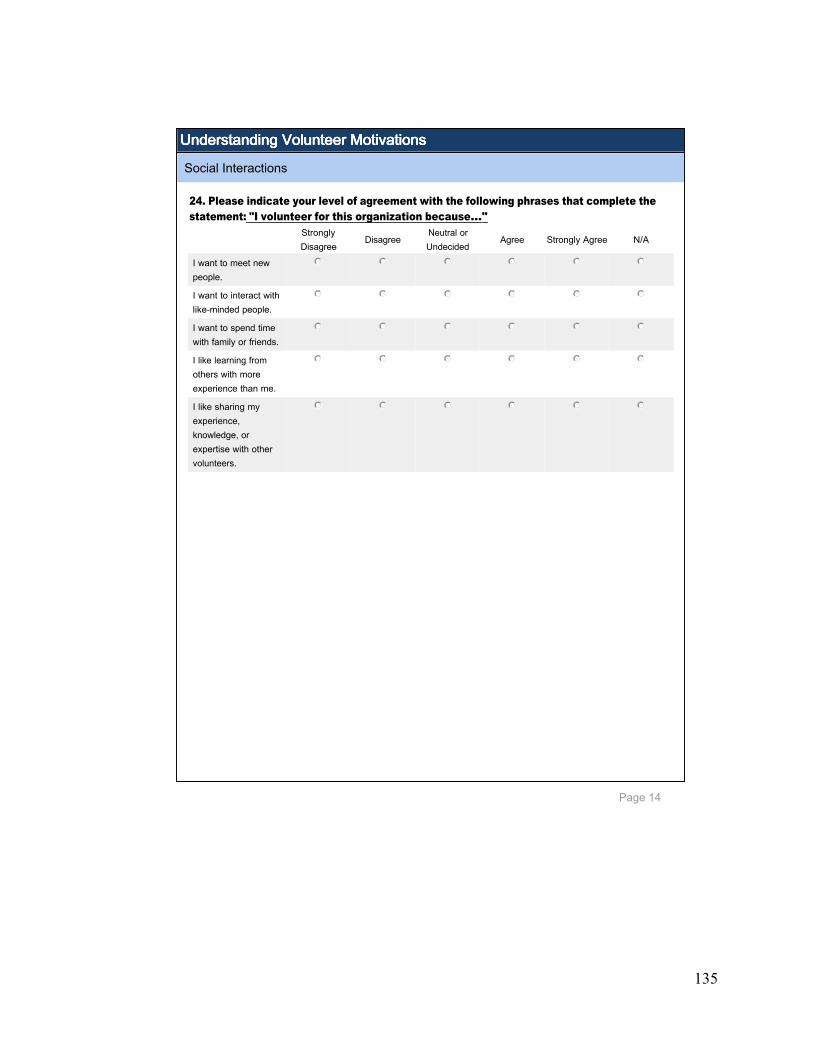
135
Page 14
Understanding Volunteer MotivationsUnderstanding Volunteer MotivationsUnderstanding Volunteer MotivationsUnderstanding Volunteer Motivations
24. Please indicate your level of agreement with the following phrases that complete the statement: "I volunteer for this organization because…"
Social Interactions
Strongly Disagree
DisagreeNeutral or Undecided
Agree Strongly Agree N/A
I want to meet new people.
nmlkj nmlkj nmlkj nmlkj nmlkj nmlkj
I want to interact with likeminded people.
nmlkj nmlkj nmlkj nmlkj nmlkj nmlkj
I want to spend time with family or friends.
nmlkj nmlkj nmlkj nmlkj nmlkj nmlkj
I like learning from others with more experience than me.
nmlkj nmlkj nmlkj nmlkj nmlkj nmlkj
I like sharing my experience, knowledge, or expertise with other volunteers.
nmlkj nmlkj nmlkj nmlkj nmlkj nmlkj

136
Page 15
Understanding Volunteer MotivationsUnderstanding Volunteer MotivationsUnderstanding Volunteer MotivationsUnderstanding Volunteer Motivations
25. I have received some form of recognition or appreciation for my work
26. Please indicate your level of agreement with the following statements.
Recognition
Strongly Disagree
DisagreeNeutral or Undecided
Agree Strongly Agree N/A
It is important to me to receive some form of recognition or appreciation for my work
nmlkj nmlkj nmlkj nmlkj nmlkj nmlkj
I would prefer not to receive any recognition or appreciation for my work
nmlkj nmlkj nmlkj nmlkj nmlkj nmlkj
Yes nmlkj
No nmlkj
Unsure nmlkj

137
Page 16
Understanding Volunteer MotivationsUnderstanding Volunteer MotivationsUnderstanding Volunteer MotivationsUnderstanding Volunteer Motivations27. How important or meaningful are the following forms of recognition to you?
Not meaningful at all
Not very meaningful
Neutral or Undecided
Moderately meaningful
Very meaningful
N/A
Handwritten card nmlkj nmlkj nmlkj nmlkj nmlkj nmlkj
Personalized email nmlkj nmlkj nmlkj nmlkj nmlkj nmlkj
Volunteer appreciation event
nmlkj nmlkj nmlkj nmlkj nmlkj nmlkj
Certificate or token of appreciation
nmlkj nmlkj nmlkj nmlkj nmlkj nmlkj
Paraphernalia such as stickers, hats, or tshirts from this organization
nmlkj nmlkj nmlkj nmlkj nmlkj nmlkj
Name recognition in this organization's newsletter
nmlkj nmlkj nmlkj nmlkj nmlkj nmlkj
Name recognition in social media such as Facebook or Twitter
nmlkj nmlkj nmlkj nmlkj nmlkj nmlkj
Name recognition in a scientific publication
nmlkj nmlkj nmlkj nmlkj nmlkj nmlkj

138
Page 17
Understanding Volunteer MotivationsUnderstanding Volunteer MotivationsUnderstanding Volunteer MotivationsUnderstanding Volunteer Motivations
You have reached the end of the questionnaire. Thank you for participating in my thesis research! Your responses will be kept completely confidential and anonymous. If you would like to be entered into the drawing to win one of ten subscriptions to National Geographic, please click "submit" below, and then follow the link on the next page to enter the drawing. If you win the drawing, you will receive a oneyear subscription to National Geographic (12 issues). You have your choice of a print or digital edition. The digital edition includes online archive and is available on iPad, iPhone, or Kindle Fire. This questionnaire and the opportunity to be entered in the drawing will be closed March 13, 2015. Winners will be notified within 2 to 4 weeks of the closing date. Make sure you click "SUBMIT" on this page before you close the window! Thank you!
End of Questionnaire

139
Appendix D: Demographics
3% 10% 7%
35%
45%
0 20 40 60 80
100 120 140
High school degree or equivalent (e.g., GED)
Some college but no degree
Associate degree
Bachelor degree
Graduate degree
Res
pons
e C
ount
Highest Completed Degree
Education Level of Respondents
10% 11%
23%
18%
8%
3% 2% 1% 0% 2%
21%
0 10 20 30 40 50 60 70
Res
pons
e C
ount
Personal Income (USD)
Personal Income

140
4% 4%
13% 15% 15%
11%
6% 2% 2%
4%
25%
0 10 20 30 40 50 60 70
Res
pons
e C
ount
Household Income (USD)
Household Income
45%
32%
17%
2% 3% 2% 0
20 40 60 80
100 120 140
Retired Employed, working full-time
Employed, working part-time
Not employed, looking for
work
Not employed,
NOT looking for
work
Disabled, not able to
work
Res
pons
e C
ount
Employment Status
Employment Status

141
Appendix E: Outdoor Activity
4% 10%
29%
57%
0 20 40 60 80
100 120 140 160 180
Seldom About half the time
Usually Always
Res
pons
e C
ount
Frequency of Performing Tasks Outdoors
9%
15%
24%
42%
10%
0
20
40
60
80
100
120
Not at all likely
Slightly likely Moderately likely
Quite likely Extremely likely
Res
pons
e C
ount
Likelihood of Performing Tasks Outdoors in Unfavorable Weather

142
4%
44%
22%
29%
0 20 40 60 80 100 120 140
I'm a fair weather participant - Bring on the sun!
I will go out if the weather is somewhat unfavorable.
There's no such thing as bad weather, just bad gear!
It would take a severe storm or unsafe conditions to stop me from going out.
Response Count
Attitudes about Performing Tasks Outdoors
80%
18%
1%
1%
0 50 100 150 200 250
I would prefer to use my own gear.
I usually use my own gear, but I might need to borrow certain items in some
conditions.
I would prefer to borrow gear so that mine doesn't get messed up.
I usually need to borrow gear.
Response Count
Need to Borrow Protective Clothing in Weather
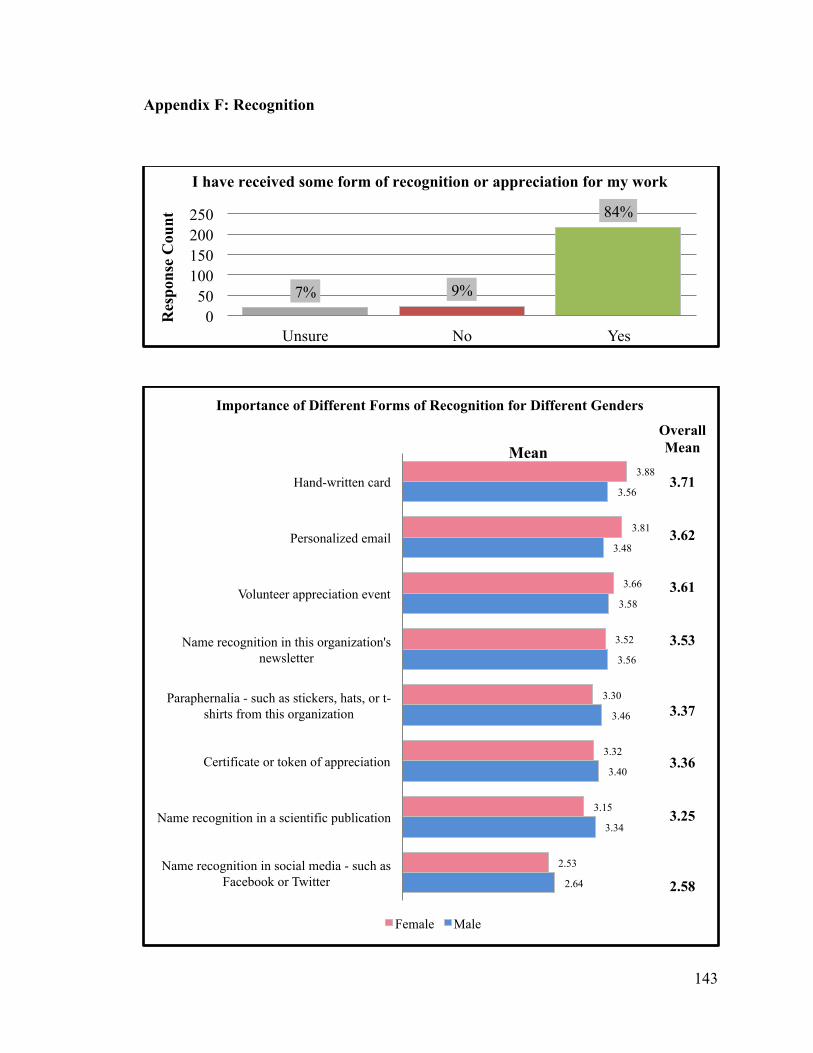
143
Appendix F: Recognition
84%
9% 7% 0
50 100 150 200 250
Yes No Unsure
Res
pons
e C
ount
I have received some form of recognition or appreciation for my work
3.88
3.81
3.66
3.52
3.30
3.32
3.15
2.53
3.56
3.48
3.58
3.56
3.46
3.40
3.34
2.64
Hand-written card
Personalized email
Volunteer appreciation event
Name recognition in this organization's newsletter
Paraphernalia - such as stickers, hats, or t-shirts from this organization
Certificate or token of appreciation
Name recognition in a scientific publication
Name recognition in social media - such as Facebook or Twitter
Mean
Female Male
Overall Mean
3.71
3.62
3.61
3.53
3.37
3.36
3.25
2.58
Importance of Different Forms of Recognition for Different Genders