Understanding this Document
32
Understanding this Document This is the fourth of six SEP documents and follows directly after the Detailed Strategy Descriptions. The previous SEP sections provided in-depth descriptions, staffing requirements and action plans for the strategies included in the SEP. The purpose of this document is to provide project concepts that are tied to realizing the Resolution 17-043 SEP goals, particularly for municipal electricity usage. This document also endeavors to provide concrete project examples to jumpstart climate and energy efforts beyond the SEP. These project concepts are organized by theme and categorized as either “RFP-Ready Projects” and “Pitch-Ready Projects”. RFP-Ready Projects “RFP-Ready Projects” are project concepts that are well understood and ready to be included in an RFP by the City. Importantly, these projects have clear and realistic funding strategies associated with them, such as financing through a Power Purchase Agreement (PPA). These projects primarily support the realization of the City’s goal for clean energy at municipal facilities via development of distributed energy resources and microgrids at municipal facilities (as referenced in Strategy 4.1). Pitch-Ready Projects “Pitch-Ready Projects” are project concepts that need further development prior to implementation or RFP issuance. This development is most likely funded through a grant or another form of external funding and these project concepts are intended to serve as the basis for future funding applications submitted by the City. These projects support the realization of multiple strategies including, Strategy 4.1: Develop Distributed Energy Resources & Microgrids at Municipal Facilities, Strategy 4.3: Create a Smart Energy Zone, as well as overall SEP priorities of increasing reliability and resilience in the electrical system. Moving Beyond 100% Renewable Electricity: Leveraging Energy & Climate Program Capacity In response to community feedback received throughout the SEP process expressing a desire for the City to expand planning efforts beyond the 100% renewable electricity goals into areas such vehicle electrification, this document includes several project ideas that extend beyond the City’s 100% renewable electricity goal. Strategy 1.1 (Formalizing an Energy & Climate Program) of the SEP calls for the addition or reassignment of four full-time staff focused on energy and climate efforts. The Water-Energy Nexus, Transportation and Resilience projects described in this document provide a roster of possible next-steps and focus areas for ECP staff when they are not engaged in direct implementation of the SEP strategies. The City can use the capacity built through Strategy 1.1 to expand energy and climate efforts into important areas beyond the scope of the SEP. Introduction Progress to Date Resolution 17-043 established a goal of 100% renewable energy for the City of Santa Barbara community as well as goals related to municipal facilities, namely the interim goal that municipal facilities would reach a target of 50% renewable electricity by 2020 and a final goal of 100%
Transcript of Understanding this Document
Understanding this Document This is the fourth of six SEP documents and follows directly after the Detailed Strategy Descriptions. The previous SEP sections provided in-depth descriptions, staffing requirements and action plans for the strategies included in the SEP. The purpose of this document is to provide project concepts that are tied to realizing the Resolution 17-043 SEP goals, particularly for municipal electricity usage. This document also endeavors to provide concrete project examples to jumpstart climate and energy efforts beyond the SEP. These project concepts are organized by theme and categorized as either “RFP-Ready Projects” and “Pitch-Ready Projects”. RFP-Ready Projects “RFP-Ready Projects” are project concepts that are well understood and ready to be included in an RFP by the City. Importantly, these projects have clear and realistic funding strategies associated with them, such as financing through a Power Purchase Agreement (PPA). These projects primarily support the realization of the City’s goal for clean energy at municipal facilities via development of distributed energy resources and microgrids at municipal facilities (as referenced in Strategy 4.1). Pitch-Ready Projects “Pitch-Ready Projects” are project concepts that need further development prior to implementation or RFP issuance. This development is most likely funded through a grant or another form of external funding and these project concepts are intended to serve as the basis for future funding applications submitted by the City. These projects support the realization of multiple strategies including, Strategy 4.1: Develop Distributed Energy Resources & Microgrids at Municipal Facilities, Strategy 4.3: Create a Smart Energy Zone, as well as overall SEP priorities of increasing reliability and resilience in the electrical system. Moving Beyond 100% Renewable Electricity: Leveraging Energy & Climate Program Capacity In response to community feedback received throughout the SEP process expressing a desire for the City to expand planning efforts beyond the 100% renewable electricity goals into areas such vehicle electrification, this document includes several project ideas that extend beyond the City’s 100% renewable electricity goal. Strategy 1.1 (Formalizing an Energy & Climate Program) of the SEP calls for the addition or reassignment of four full-time staff focused on energy and climate efforts. The Water-Energy Nexus, Transportation and Resilience projects described in this document provide a roster of possible next-steps and focus areas for ECP staff when they are not engaged in direct implementation of the SEP strategies. The City can use the capacity built through Strategy 1.1 to expand energy and climate efforts into important areas beyond the scope of the SEP.
Introduction Progress to Date Resolution 17-043 established a goal of 100% renewable energy for the City of Santa Barbara community as well as goals related to municipal facilities, namely the interim goal that municipal facilities would reach a target of 50% renewable electricity by 2020 and a final goal of 100%
City of Santa Barbara Strategic Energy Plan: Municipal Pilot Projects
Page | 2
renewable electricity, by 20301. The City has already made significant progress towards these goals
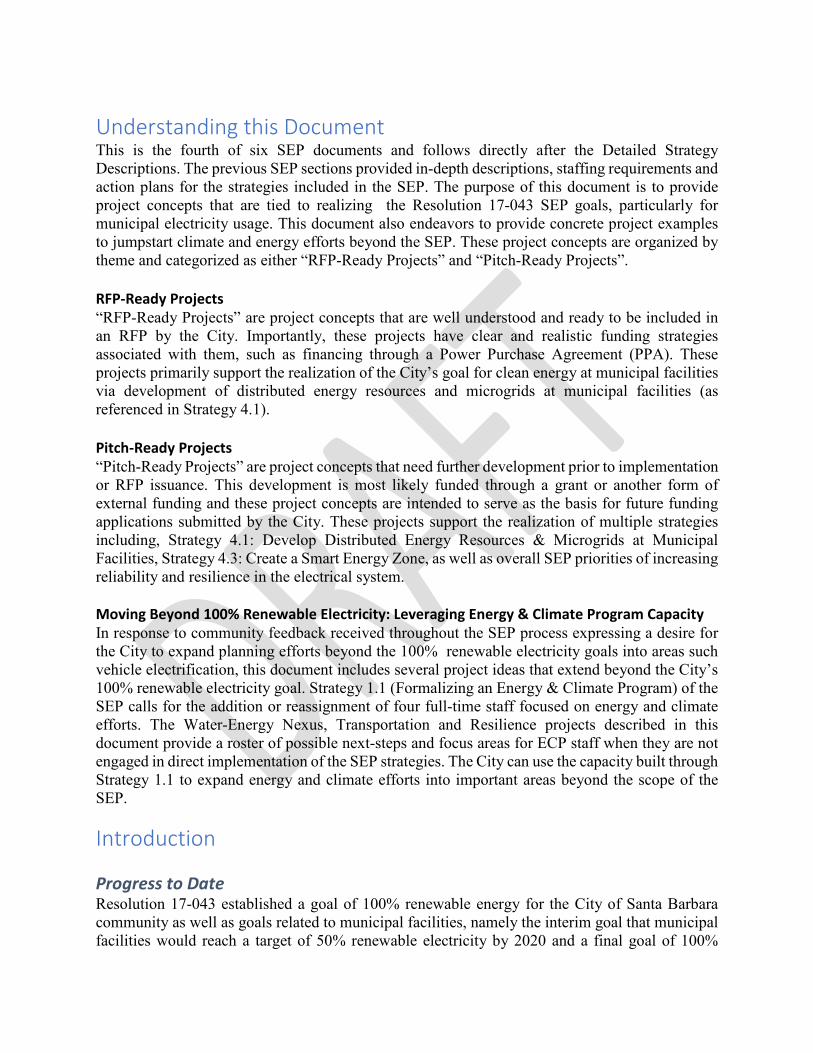
through energy efficiency and renewable generation projects. At the end of 2018, the City achieved approximately 42% renewable electricity through a combination of energy efficiency, renewable content supplied by SoCal Edison, on-site solar generation, hydroelectric generation and cogeneration2. Figure 1 shows the electricity and financial savings achieved by the City through their energy efficiency projects. Table 1 shows the on-site renewable generation at municipal facilities by generation type in 2018.
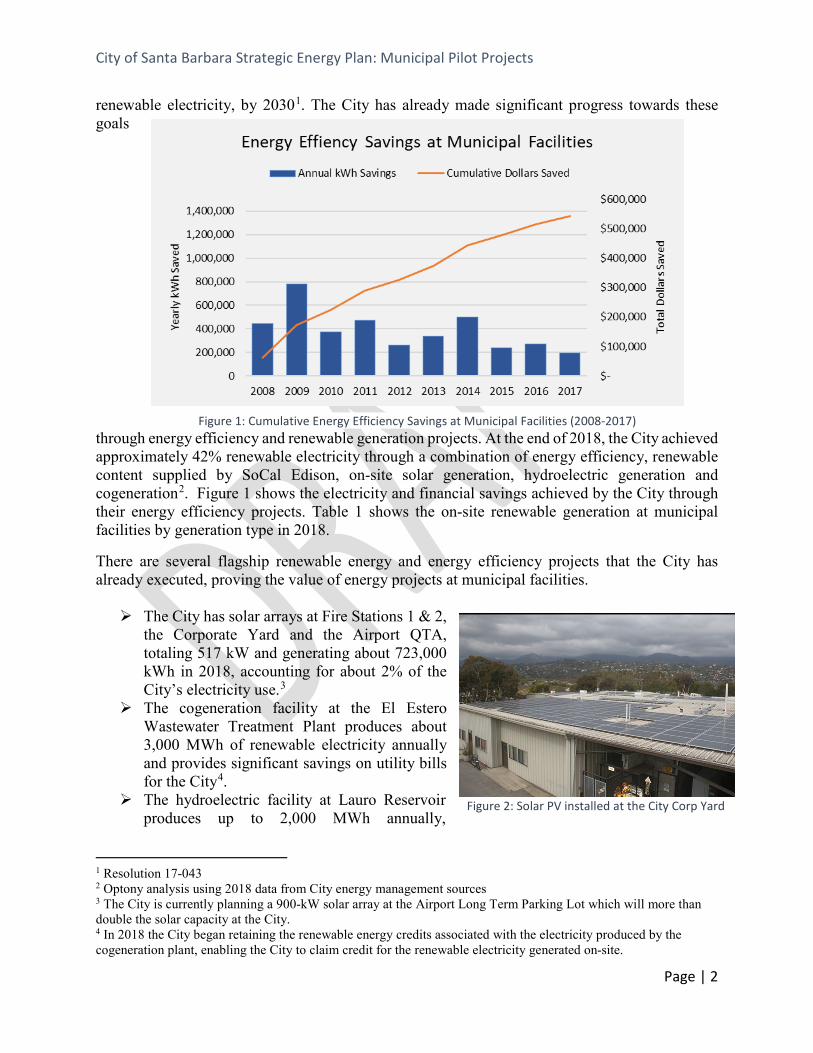
There are several flagship renewable energy and energy efficiency projects that the City has already executed, proving the value of energy projects at municipal facilities. The City has solar arrays at Fire Stations 1 & 2,
the Corporate Yard and the Airport QTA, totaling 517 kW and generating about 723,000 kWh in 2018, accounting for about 2% of the City’s electricity use.3
The cogeneration facility at the El Estero Wastewater Treatment Plant produces about 3,000 MWh of renewable electricity annually and provides significant savings on utility bills for the City4.
The hydroelectric facility at Lauro Reservoir produces up to 2,000 MWh annually,
1 Resolution 17-043 2 Optony analysis using 2018 data from City energy management sources 3 The City is currently planning a 900-kW solar array at the Airport Long Term Parking Lot which will more than double the solar capacity at the City. 4 In 2018 the City began retaining the renewable energy credits associated with the electricity produced by the cogeneration plant, enabling the City to claim credit for the renewable electricity generated on-site.
Figure 2: Solar PV installed at the City Corp Yard
Figure 1: Cumulative Energy Efficiency Savings at Municipal Facilities (2008-2017)

City of Santa Barbara Strategic Energy Plan: Municipal Pilot Projects
Page | 3
depending on rainfall, creating about $200,000 in revenue for the City through electricity sales to SoCal Edison.5
The City installed solar hot water heaters at all bathrooms at the Santa Barbara Harbor. The City completed significant energy efficiency upgrades by switching the majority of its
City-owned streetlights to LEDs, as well as other highly impactful lighting upgrade projects.
The City also has several renewable development projects underway including a 900-kW carport array at the Santa Barbara Airport Long Term Parking Lot which will more than double the current solar capacity at the City, solar installations at the Eastside Library and Fire Stations 4 and 5, and a possible solar array at one of its downtown parking lots. Despite the significant progress made by the City, there is still more development necessary to meet the 2020 and 2030 goals. Accordingly, the City has continued to assess
the remaining renewable energy potential at municipal facilities, both through the SEP and through a Zero-Net Energy Feasibility study (discussed below). Strategy 4.1 is designed specifically to prioritize the development of the remaining potential.
Table 1: Renewable Electricity Generated at Municipal Facilities - 2018
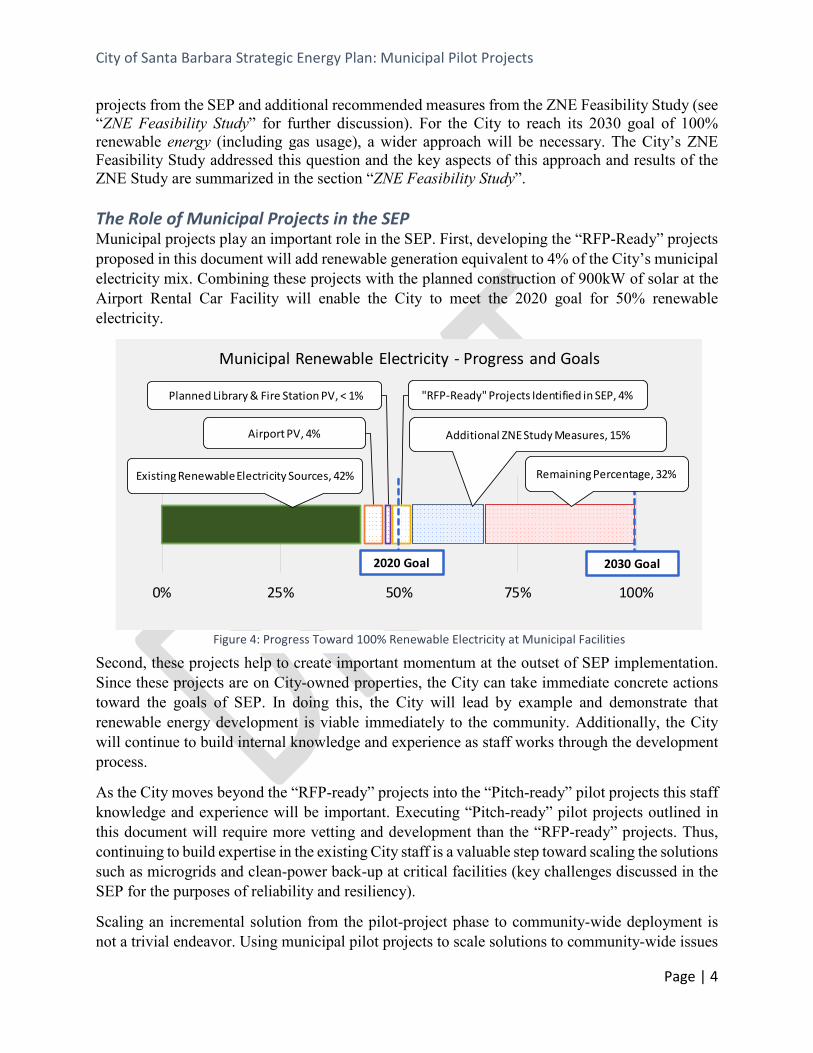
Overall Municipal Potential The total potential for solar PV installations across all municipal sites, not accounting for load constraints or installation constraints is estimated to be approximately 11.2 MW6. For context, to meet all of the City’s municipal electricity consumption in 2017, the City would need to develop the equivalent of about 22 MW of solar. The City will need a combination of solar, energy efficiency and cogeneration to meet its 2030 goal for municipal electricity. Figure 4 shows the progress the City has made towards its 2020 goal of 50% renewable electricity and its 2030 goal of 100% renewable electricity currently, as well as the impacts of planned projects, RFP-Ready
5 However, the City cannot apply the renewable electricity generated by this facility to their “renewable electricity percentage” because when the electricity is sold to SoCal Edison it is included in SoCal Edison’s renewable content. Thus, any additional inclusion when calculating the renewable electricity used at municipal facilities would be double counting. Accordingly, the generation from the hydroelectric facility is not included in Table 1. 6 This figure was calculated by combining estimated capacity from the ZNE Feasibility Study and analysis be SEP consultants of additional sites not included in the ZNE study.
Resource Type 2018 Production Percentage of Municipal Load
Solar 723.8 MWh 2% Cogeneration 4,700 MWh 11%
Figure 3: Hydroelectric generation at Lauro Reservoir
City of Santa Barbara Strategic Energy Plan: Municipal Pilot Projects
Page | 4
projects from the SEP and additional recommended measures from the ZNE Feasibility Study (see “ZNE Feasibility Study” for further discussion). For the City to reach its 2030 goal of 100% renewable energy (including gas usage), a wider approach will be necessary. The City’s ZNE Feasibility Study addressed this question and the key aspects of this approach and results of the ZNE Study are summarized in the section “ZNE Feasibility Study”. The Role of Municipal Projects in the SEP Municipal projects play an important role in the SEP. First, developing the “RFP-Ready” projects proposed in this document will add renewable generation equivalent to 4% of the City’s municipal electricity mix. Combining these projects with the planned construction of 900kW of solar at the Airport Rental Car Facility will enable the City to meet the 2020 goal for 50% renewable electricity.
Second, these projects help to create important momentum at the outset of SEP implementation. Since these projects are on City-owned properties, the City can take immediate concrete actions toward the goals of SEP. In doing this, the City will lead by example and demonstrate that renewable energy development is viable immediately to the community. Additionally, the City will continue to build internal knowledge and experience as staff works through the development process.
As the City moves beyond the “RFP-ready” projects into the “Pitch-ready” pilot projects this staff knowledge and experience will be important. Executing “Pitch-ready” pilot projects outlined in this document will require more vetting and development than the “RFP-ready” projects. Thus, continuing to build expertise in the existing City staff is a valuable step toward scaling the solutions such as microgrids and clean-power back-up at critical facilities (key challenges discussed in the SEP for the purposes of reliability and resiliency).
Scaling an incremental solution from the pilot-project phase to community-wide deployment is not a trivial endeavor. Using municipal pilot projects to scale solutions to community-wide issues
Existing Renewable Electricity Sources, 42%
Airport PV, 4%
Planned Library & Fire Station PV, < 1% "RFP-Ready" Projects Identified in SEP, 4%
Additional ZNE Study Measures, 15%
Remaining Percentage, 32%
2020 Goal 2030 Goal
0% 25% 50% 75% 100%
Municipal Renewable Electricity - Progress and Goals
Figure 4: Progress Toward 100% Renewable Electricity at Municipal Facilities
City of Santa Barbara Strategic Energy Plan: Municipal Pilot Projects
Page | 5
can be a key technique to achieving the City’s community-wide electricity goal. The “Pitch-ready” projects described in this document are designed to kick-start this approach by providing City staff with a clear project concept that can be used to begin implementation of SEP strategies in Program Area 3: Funding Sources & Financial Incentives and Program Area 4: Municipal Development & Pilot Projects. Together, these Program Areas are projected to have a 14.5% contribution to the City’s community-wide goal. Municipal pilot projects will be the driver that enables this contribution.
Zero Net Energy Feasibility Study In 2017, the City received funding from the California Energy Commission to complete a Zero Net Energy Feasibility Study with a focus on achieving zero net energy for City facilities, thereby achieving the City’s goal of 100% renewable energy for municipal facilities by 2030. When discussing the City’s municipal energy goals this study provides important context. The study included an audit of 36 sites, recommended energy efficiency measures and recommended solar system sizes and used conclusions from those sites to make the same recommendations for the rest of the City sites. After implementation of the suggested measures, the study concluded that the City would only reach 67% of a net-zero electricity goal. The study also indicated a significant shortfall in meeting a net-zero thermal energy goal. As evidenced through the ZNE Feasibility Study, thermal energy currently supplied by natural gas is an area where the City will have difficulty reaching its goals for municipal facilities. Given the significant role that PV will have in meeting the ZNE electricity goal, there may be a useful option to help reduce the need for natural gas by using solar thermal or photovoltaic-thermal solar. Photovoltaic-thermal solar energy systems simultaneously capture both electrical and thermal irradiance7. Thermal energy which is wasted by a traditional PV system is captured by photovoltaic-thermal solar energy systems in order to produce a simultaneous dual output of electricity and heat. Solar thermal, or photovoltaic-thermal solar, captures thermal energy from solar irradiance via a recirculating heat transfer fluid, this heat transfer fluid exits the solar panel and flows through a heat exchanger where this heat can be used to produce ZNE building heating, ZNE domestic hot water, or ZNE pool heating. To achieve zero-net energy for thermal and electrical energy the City would need to convert much of its gas-fired equipment to other energy sources. The alternative solution of over-generating renewable electricity offsets to balance the GHG accounting for natural gas combustion is technically difficult and not cost-effective8. Many if the on-site energy measures discussed in this document can be developed immediately as the City assesses the results of the ZNE Feasibility Study and determines a course of future actions.
7 Journal of Energy Conversion and Management, Hybrid photovoltaic-thermal solar systems for combined heating, cooling, and power provision in the urban environment, Alba Ramos, et. Al. Clean Energy Processes (CEP) Laboratory, Department of Chemical Engineering, Imperial College London, 2017; available at www.elsevier.com 8 TRC Report, page 10

City of Santa Barbara Strategic Energy Plan: Municipal Pilot Projects
Page | 6
Project Area 1: Distributed Energy Resource Development
Project 1.1: RFP for Multi-Site Procurement of Solar + Storage Project Type: RFP - Ready Proposed Timing: 2019 - 2020
Responsible Party: Energy & Climate Program Staff Estimated Budget: No upfront
investment Project Background & Description
There are 9 sites analyzed by Optony and/or TRC that could be included in an RFP for DER procurement immediately. These sites were chosen through an assessment of solar capacity across all municipally controlled sites. Storage is included in this RFP because the new time-of-use (TOU) periods of SoCal Edison render solar-only projects economically infeasible in many cases. As a result of this trend and the falling prices of battery storage, the market has witnessed an explosion of behind-the-meter storage installations.9 The City can take advantage of these trends and the resulting fact that solar + storage projects designed to increase savings under the new TOU periods have become standard offerings from developers. The existence of standard offerings enables the City to procure systems without the need for grant funding or additional study. For these projects, storage is used for peak shaving and energy arbitrage that increases savings for the City. This is a different application than clean-power back-up (see Project 4.1: Feasibility Study & Procurement of Clean Power Back-up at Critical Facilities) and requires different battery sizing for optimal performance. Since the California Utilities announced their intention to shift the peak TOU in the evening, developers have been touting battery storage as the key to realizing significant additional savings.10 This document includes a sample attachment to an RFP that provides possible solar designs at each site to be included for use by the respondents replying to the City’s RFP. The issued RFP should include a request for a pricing under three options; a Power Purchase Agreement (PPA), a PPA with an up-front payment to buy-down the price of the PPA in the long-term and a cash purchase. While a PPA is likely preferable to the City because there is no upfront cost, the total lifetime savings from a PV system can be higher under a cash purchase and the comparison is useful to have when assessing RFPs. The RFP should also request a proposed construction schedule across all sites. For reference by the City, but not to be included in an RFP, this document also includes a financial feasibility assessment with high-level modeling to estimate the electricity cost impacts of developing DERs at the proposed sites.
9 https://www.greentechmedia.com/articles/read/tracking-the-shifting-makeup-of-the-us-energy-storage-market#gs.WDSxFI0Z 10 https://www.greentechmedia.com/articles/read/california-time-of-use-commercial-customers-solar-pv#gs.DyVzKIxx
City of Santa Barbara Strategic Energy Plan: Municipal Pilot Projects
Page | 7
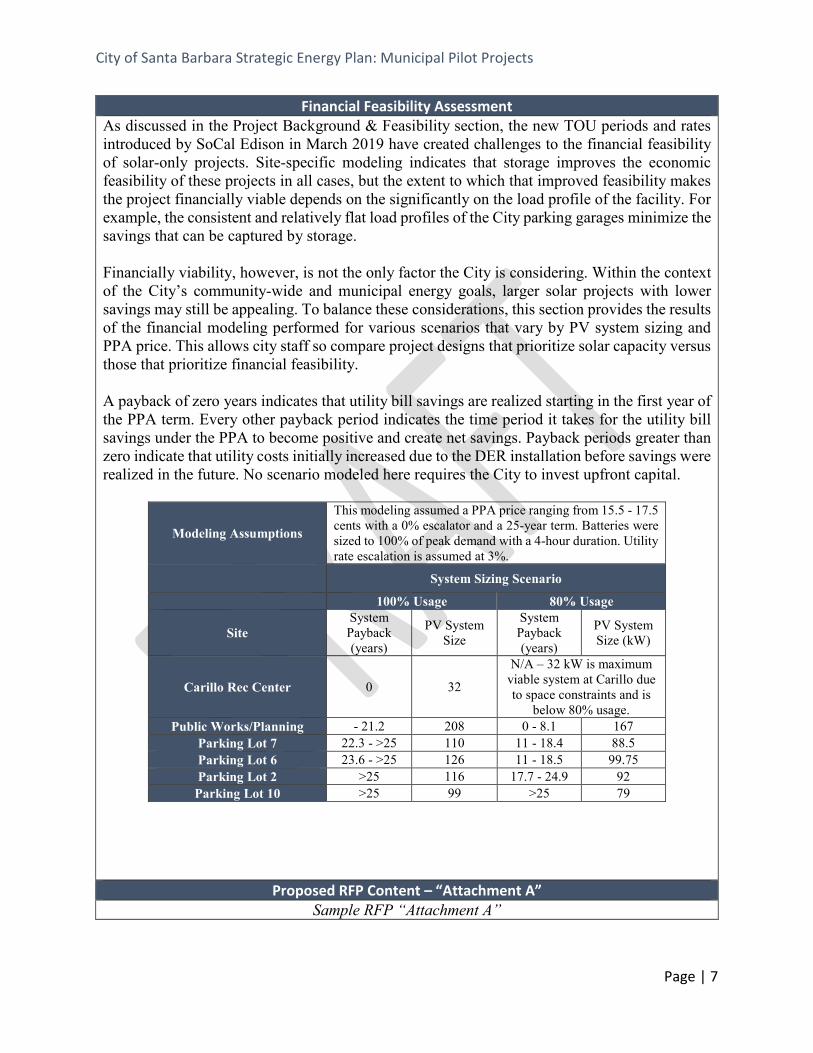
Financial Feasibility Assessment As discussed in the Project Background & Feasibility section, the new TOU periods and rates introduced by SoCal Edison in March 2019 have created challenges to the financial feasibility of solar-only projects. Site-specific modeling indicates that storage improves the economic feasibility of these projects in all cases, but the extent to which that improved feasibility makes the project financially viable depends on the significantly on the load profile of the facility. For example, the consistent and relatively flat load profiles of the City parking garages minimize the savings that can be captured by storage. Financially viability, however, is not the only factor the City is considering. Within the context of the City’s community-wide and municipal energy goals, larger solar projects with lower savings may still be appealing. To balance these considerations, this section provides the results of the financial modeling performed for various scenarios that vary by PV system sizing and PPA price. This allows city staff so compare project designs that prioritize solar capacity versus those that prioritize financial feasibility. A payback of zero years indicates that utility bill savings are realized starting in the first year of the PPA term. Every other payback period indicates the time period it takes for the utility bill savings under the PPA to become positive and create net savings. Payback periods greater than zero indicate that utility costs initially increased due to the DER installation before savings were realized in the future. No scenario modeled here requires the City to invest upfront capital.
Modeling Assumptions
This modeling assumed a PPA price ranging from 15.5 - 17.5 cents with a 0% escalator and a 25-year term. Batteries were sized to 100% of peak demand with a 4-hour duration. Utility rate escalation is assumed at 3%.
System Sizing Scenario
100% Usage 80% Usage
Site System Payback (years)
PV System Size
System Payback (years)
PV System Size (kW)
Carillo Rec Center 0 32
N/A – 32 kW is maximum viable system at Carillo due to space constraints and is
below 80% usage. Public Works/Planning - 21.2 208 0 - 8.1 167
Parking Lot 7 22.3 - >25 110 11 - 18.4 88.5 Parking Lot 6 23.6 - >25 126 11 - 18.5 99.75 Parking Lot 2 >25 116 17.7 - 24.9 92
Parking Lot 10 >25 99 >25 79
Proposed RFP Content – “Attachment A” Sample RFP “Attachment A”
City of Santa Barbara Strategic Energy Plan: Municipal Pilot Projects
Page | 8
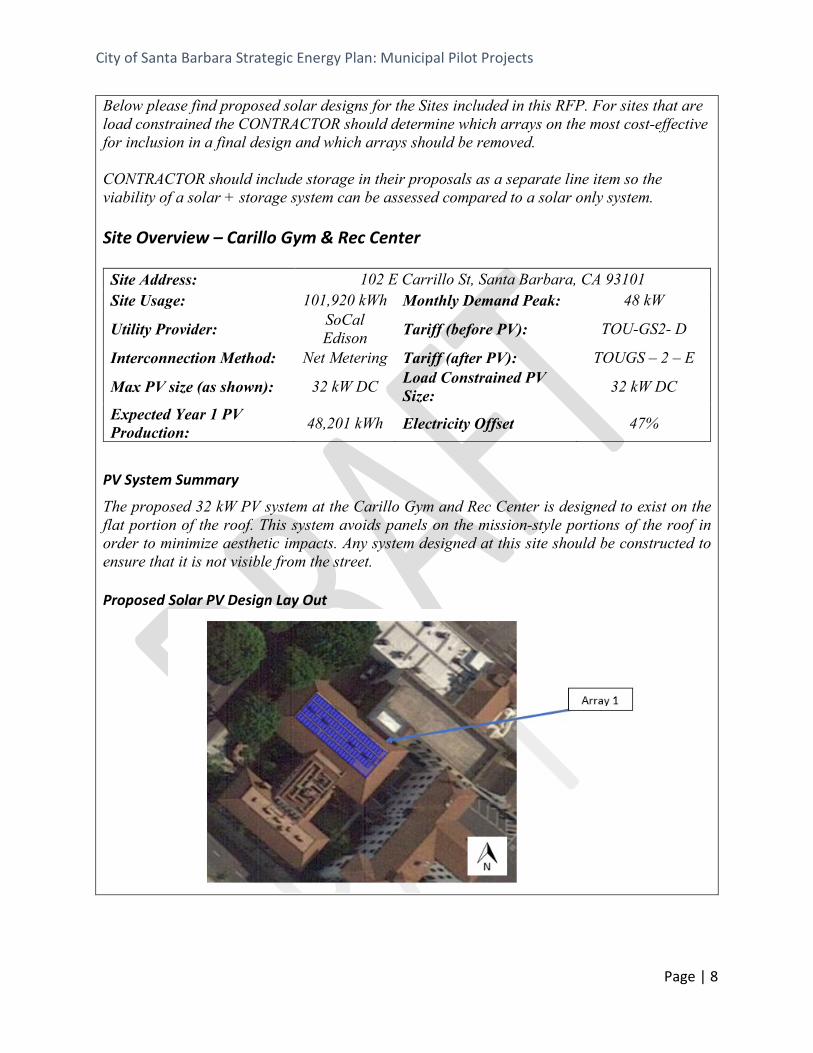
Below please find proposed solar designs for the Sites included in this RFP. For sites that are load constrained the CONTRACTOR should determine which arrays on the most cost-effective for inclusion in a final design and which arrays should be removed. CONTRACTOR should include storage in their proposals as a separate line item so the viability of a solar + storage system can be assessed compared to a solar only system. Site Overview – Carillo Gym & Rec Center Site Address: 102 E Carrillo St, Santa Barbara, CA 93101 Site Usage: 101,920 kWh Monthly Demand Peak: 48 kW
Utility Provider: SoCal Edison Tariff (before PV): TOU-GS2- D
Interconnection Method: Net Metering Tariff (after PV): TOUGS – 2 – E
Max PV size (as shown): 32 kW DC Load Constrained PV Size: 32 kW DC
Expected Year 1 PV Production: 48,201 kWh Electricity Offset 47%
PV System Summary
The proposed 32 kW PV system at the Carillo Gym and Rec Center is designed to exist on the flat portion of the roof. This system avoids panels on the mission-style portions of the roof in order to minimize aesthetic impacts. Any system designed at this site should be constructed to ensure that it is not visible from the street. Proposed Solar PV Design Lay Out

City of Santa Barbara Strategic Energy Plan: Municipal Pilot Projects
Page | 9
Table 2: Solar Array Technical Specifications
Site Overview – Public Works/Planning Office, Building Maintenance, Parks & Recreation
Site Address: 616 & 620, 625, 635 Laguna St, 630 Garden St & 402 E Ortega St, Santa Barbara, CA 93101
Site Usage: 554,973 kWh Monthly Demand Peak: 119
Utility Provider: SoCal Edison
Tariffs (before PV, grandfathered):
TOUGS – 2 – B, TOUGS – 2 – R
TOU-2APB Interconnection Method: Net Metering Tariff (after PV): TOUGS – 2 – E
Max PV size (as shown): 216 kW DC Load Constrained PV Size: 216 kW DC
Expected Year 1 PV Production: 330,730 kWh Electricity Offset 58 %
PV System Summary & Site Concerns
This system design is intended to be installed across multiple buildings with aggregated meters. There is existing solar on-site but enough remaining load, net of generation to support the maximum PV size. Two individual arrays, however, have site specific concerns that should be addressed in any proposal:
• Array 1 has shading concerns. Any proposal should include discussion of necessary tree removal.
• Array 3 will likely be space constrained during construction. Any proposal should include discussion of estimated parking lot closures and minimize disruptions.
Below is a list of the meters to be aggregated, as well as their service addresses and associated annual usage.
Table 3: Meter Aggregation Information Service Address Meter Number Annual Usage (kWh)
402 E ORTEGA PMP 256000-220741 151,399
625 LAGUNA ST ZYA102-000247 129,811
635 LAGUNA ST ZYA102-000235 127,253
625 LAGUNA ST 254000-013988 20,602
Sub-array # Array Type Azimuth Tilt System Size (kW-DC)
Sub-array 1 Rooftop (Fixed tilt mount) 221⁰ 10⁰ 32 Totals - - - 32

City of Santa Barbara Strategic Energy Plan: Municipal Pilot Projects
Page | 10
630 GARDEN ST 256000-167794 4,515
630 GARDEN ST ZYA102-000248 121,393
Proposed Solar PV Design Layout
Table 4: Solar Array Technical Specifications
Site Overview – Parking Lot 7 Site Address: 1115 Anacapa St, Santa Barbara, CA 93101 Site Usage: 195,049 kWh Monthly Demand Peak: 38
Utility Provider: SoCal Edison Tariff (before PV): TOUGS – 2 – D
Interconnection Method: Net Metering Tariff (after PV): TOUGS – 2 – E
Max PV size (as shown): 179.6 kW DC Load Constrained PV Size: 119.2 kW DC
Expected Year 1 PV Production: 195,049 kWh Electricity Offset 100 %
Sub-array # Address Array Type Azimuth Tilt System Size (kW-DC)
1 630 Garden St. Rooftop (fixed-tilt) 131⁰ 10⁰ 51 2 625 Laguna St. Rooftop (flush-mount) 221⁰ ~30⁰ 38 3 616 Laguna St. Carport 131⁰ 5⁰ 50 4 616 Laguna St. Rooftop (flush-mount) 221⁰ ~30⁰ 14 5 620 Laguna St. Rooftop (flush-mount) 131⁰ ~30⁰ 35 6 403 E Ortega Rooftop (flush-mount) 131⁰ ~30⁰ 27
Totals - - - - 215

City of Santa Barbara Strategic Energy Plan: Municipal Pilot Projects
Page | 11
PV System Summary & Site Concerns
The sample PV system design at this site was created to maximize system size and provide the most possible options for array locations, but any system installed at this site would need to be reduced by about 44%, at the current kWh/kWp ratio, due to load constraints. If the Contractor intends to include the Array 3 in the final design, necessary tree removal due to shading concerns should be worked out with the City during contract negotiation. Proposed Solar PV Design Layout
Table 5: Solar Array Technical Specifications
Site Overview – Parking Lot 6 Site Address: 1221 Anacapa St, Santa Barbara, CA 93101 Site Usage: 482,060 kWh Monthly Demand Peak: 48 kW
Utility Provider: SoCal Edison Tariff (before PV): TOUGS – 2 – D
Interconnection Method: Net Metering Tariff (after PV): TOUGS – 2 – E
Max PV size (as shown): 240.5 kW DC Load Constrained PV Size: 240.5 kW DC
Expected Year 1 PV Production: 386,400 kWh Electricity Offset 80%
Sub-array # Array Type Azimuth Tilt System Size (kW-DC)
1 Carport 130⁰ 5⁰ 30 2 Carport 221⁰ 5⁰ 25 3 Carport 221⁰ 5⁰ 39 4 Carport 130⁰ 5⁰ 23 5 Carport 221⁰ 5⁰ 28 6 Carport 221⁰ 5⁰ 34
Totals - - - 179

City of Santa Barbara Strategic Energy Plan: Municipal Pilot Projects
Page | 12
PV System Summary & Site Concerns
This is a strong candidate for development due to the lack of shading or structural concerns and the high load at the site. Proposed Solar PV Design Layout
Table 6: Solar Array Technical Specifications
Site Overview – Parking Lot 2 Site Address: 914 Chapala St, Santa Barbara, CA 93101 Site Usage: 211,789 kWh Monthly Demand Peak: 37 kW
Utility Provider: SoCal Edison Tariff (before PV): TOUGS – 2 – D
Sub-array # Array Type Azimuth Tilt System Size (kW-DC)
1 Carport 131⁰ 5⁰ 25 2 Carport 131⁰ 5⁰ 25 3 Carport 131⁰ 5⁰ 25 4 Carport 131⁰ 5⁰ 25 5 Carport 220⁰ 5⁰ 45 6 Carport 131⁰ 5⁰ 30 7 Carport 220⁰ 5⁰ 29 8 Carport 131⁰ 5⁰ 35
Totals - - - 239
City of Santa Barbara Strategic Energy Plan: Municipal Pilot Projects
Page | 13
Interconnection Method: Net Metering Tariff (after PV): TOUGS – 2 – E
Max PV size (as shown): 265.7 kW DC Load Constrained PV Size: 131.9 kW DC
Expected Year 1 PV Production: 211,789 kWh Electricity Offset 100 %
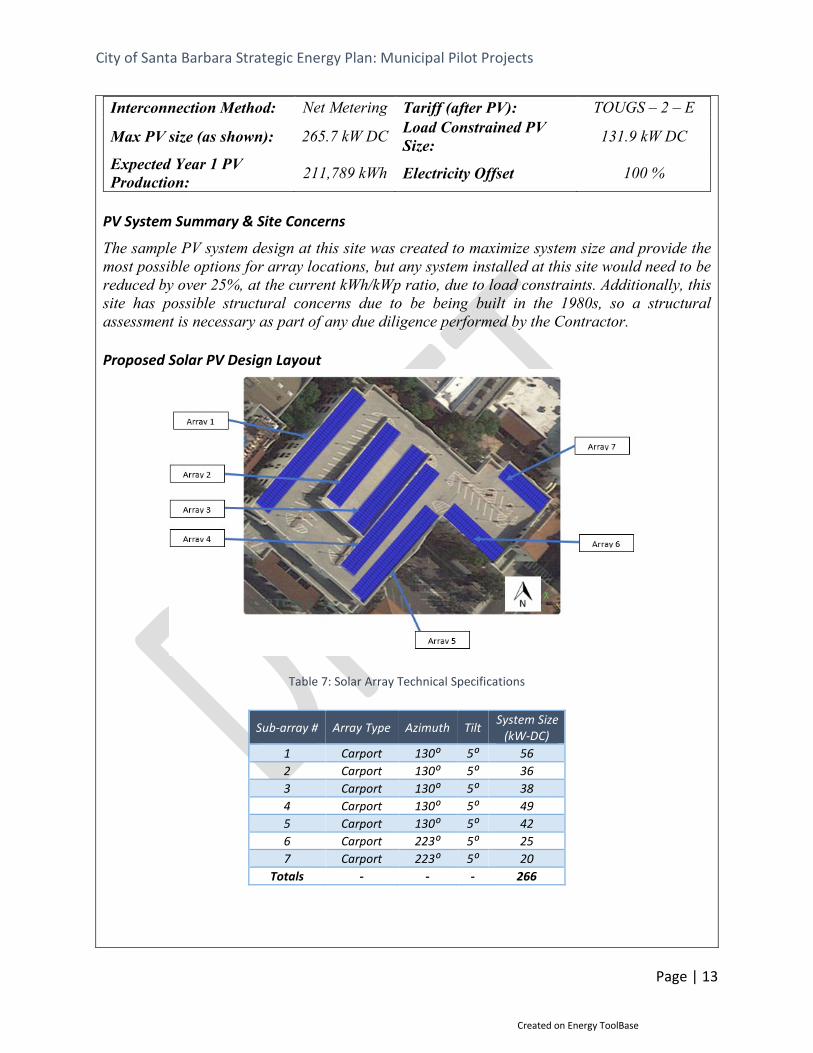
PV System Summary & Site Concerns
The sample PV system design at this site was created to maximize system size and provide the most possible options for array locations, but any system installed at this site would need to be reduced by over 25%, at the current kWh/kWp ratio, due to load constraints. Additionally, this site has possible structural concerns due to be being built in the 1980s, so a structural assessment is necessary as part of any due diligence performed by the Contractor. Proposed Solar PV Design Layout
Table 7: Solar Array Technical Specifications
Sub-array # Array Type Azimuth Tilt System Size (kW-DC)
1 Carport 130⁰ 5⁰ 56 2 Carport 130⁰ 5⁰ 36 3 Carport 130⁰ 5⁰ 38 4 Carport 130⁰ 5⁰ 49 5 Carport 130⁰ 5⁰ 42 6 Carport 223⁰ 5⁰ 25 7 Carport 223⁰ 5⁰ 20
Totals - - - 266
Created on Energy ToolBase
City of Santa Barbara Strategic Energy Plan: Municipal Pilot Projects
Page | 14
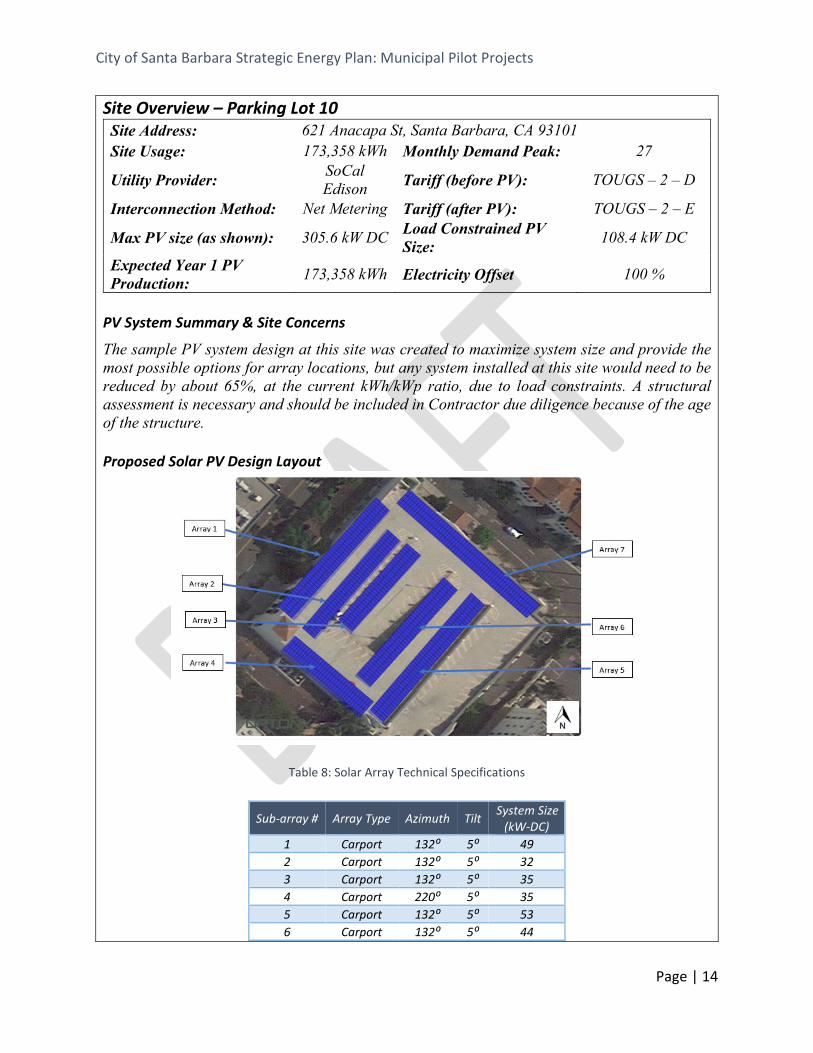
Site Overview – Parking Lot 10 Site Address: 621 Anacapa St, Santa Barbara, CA 93101 Site Usage: 173,358 kWh Monthly Demand Peak: 27
Utility Provider: SoCal Edison Tariff (before PV): TOUGS – 2 – D
Interconnection Method: Net Metering Tariff (after PV): TOUGS – 2 – E
Max PV size (as shown): 305.6 kW DC Load Constrained PV Size: 108.4 kW DC
Expected Year 1 PV Production: 173,358 kWh Electricity Offset 100 %
PV System Summary & Site Concerns
The sample PV system design at this site was created to maximize system size and provide the most possible options for array locations, but any system installed at this site would need to be reduced by about 65%, at the current kWh/kWp ratio, due to load constraints. A structural assessment is necessary and should be included in Contractor due diligence because of the age of the structure. Proposed Solar PV Design Layout
Table 8: Solar Array Technical Specifications
Sub-array # Array Type Azimuth Tilt System Size (kW-DC)
1 Carport 132⁰ 5⁰ 49 2 Carport 132⁰ 5⁰ 32 3 Carport 132⁰ 5⁰ 35 4 Carport 220⁰ 5⁰ 35 5 Carport 132⁰ 5⁰ 53 6 Carport 132⁰ 5⁰ 44
City of Santa Barbara Strategic Energy Plan: Municipal Pilot Projects
Page | 15
7 Carport 220⁰ 5⁰ 59 Totals - - - 307
Project 1.2: RFP for Multi-Site Procurement of Solar + Storage – Airport Only Project Type: RFP - Ready Proposed Timing: 2020
Responsible Party: Airport Staff and Energy & Climate Program Staff
Estimated Budget: No Upfront Cost
Project Background & Description At a macro-level, the Airport campus contains 47 buildings with about 1.6 MW of solar potential11. The portion of that capacity that can be immediately developed, however, is much lower because the City does not pay the electricity bills at all the facilities. Many of the facilities on the Airport campus are leased and the tenant is responsible for the electricity costs. The sites listed in this Project cover the largest City-payed electrical loads within the Airport campus after the Airport Terminal, which is being developed with a separate 900 kW project at the time of writing. This RFP should include all considerations included in Project 2, with the addition of the airport specific considerations outlined in “Attachment A”. “Attachment A” also includes sample PV system designs for each site for inclusion in an RFP. Just as in Project 1.1, this document includes a financial feasibility assessment with high level modeling to estimate the electricity cost impacts of developing DERs at the proposed sites.
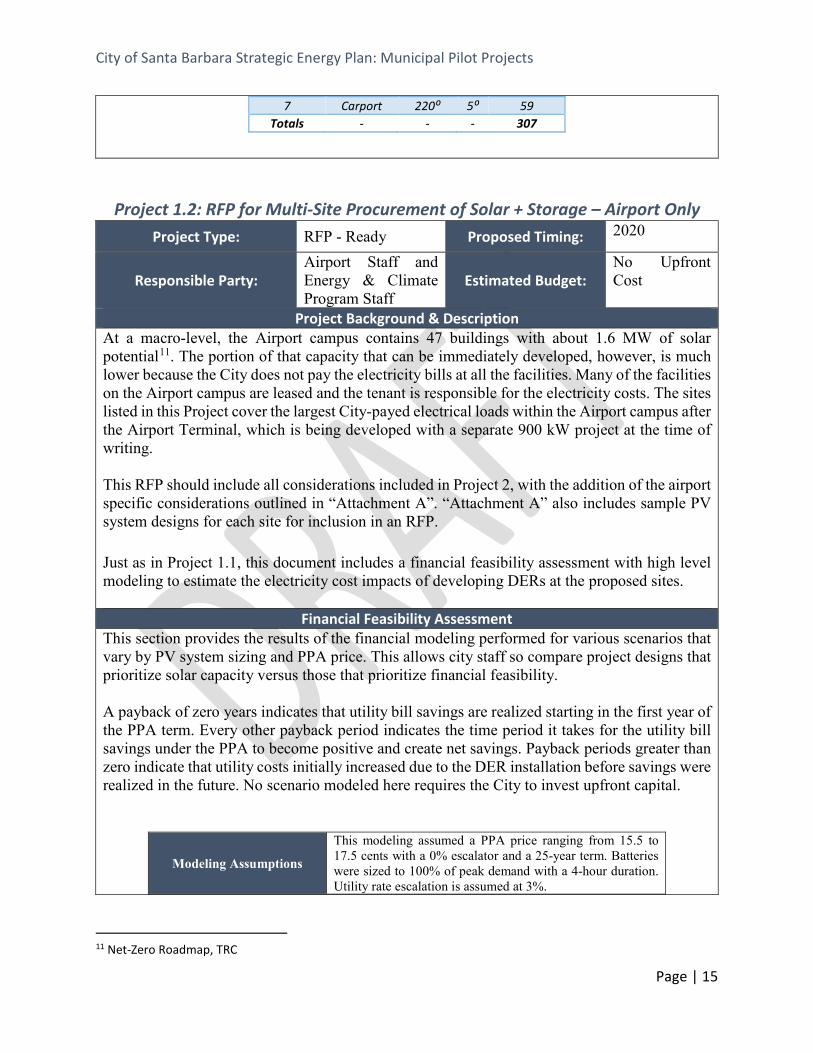
Financial Feasibility Assessment This section provides the results of the financial modeling performed for various scenarios that vary by PV system sizing and PPA price. This allows city staff so compare project designs that prioritize solar capacity versus those that prioritize financial feasibility. A payback of zero years indicates that utility bill savings are realized starting in the first year of the PPA term. Every other payback period indicates the time period it takes for the utility bill savings under the PPA to become positive and create net savings. Payback periods greater than zero indicate that utility costs initially increased due to the DER installation before savings were realized in the future. No scenario modeled here requires the City to invest upfront capital.
Modeling Assumptions
This modeling assumed a PPA price ranging from 15.5 to 17.5 cents with a 0% escalator and a 25-year term. Batteries were sized to 100% of peak demand with a 4-hour duration. Utility rate escalation is assumed at 3%.
11 Net-Zero Roadmap, TRC
City of Santa Barbara Strategic Energy Plan: Municipal Pilot Projects
Page | 16
System Sizing Scenario
100% Usage 80% Usage
Site System Payback (years)
PV System Size
System Payback (years)
PV System Size (kW9
1699 Firestone Aggregation 14.3 - 22 28 5.3 - 13 23 1501 Cook Aggregation >24.5 217 12.8 - 20.6 165
601 Firestone Aggregation 22.7 - >25 51 20.9 - >25 42
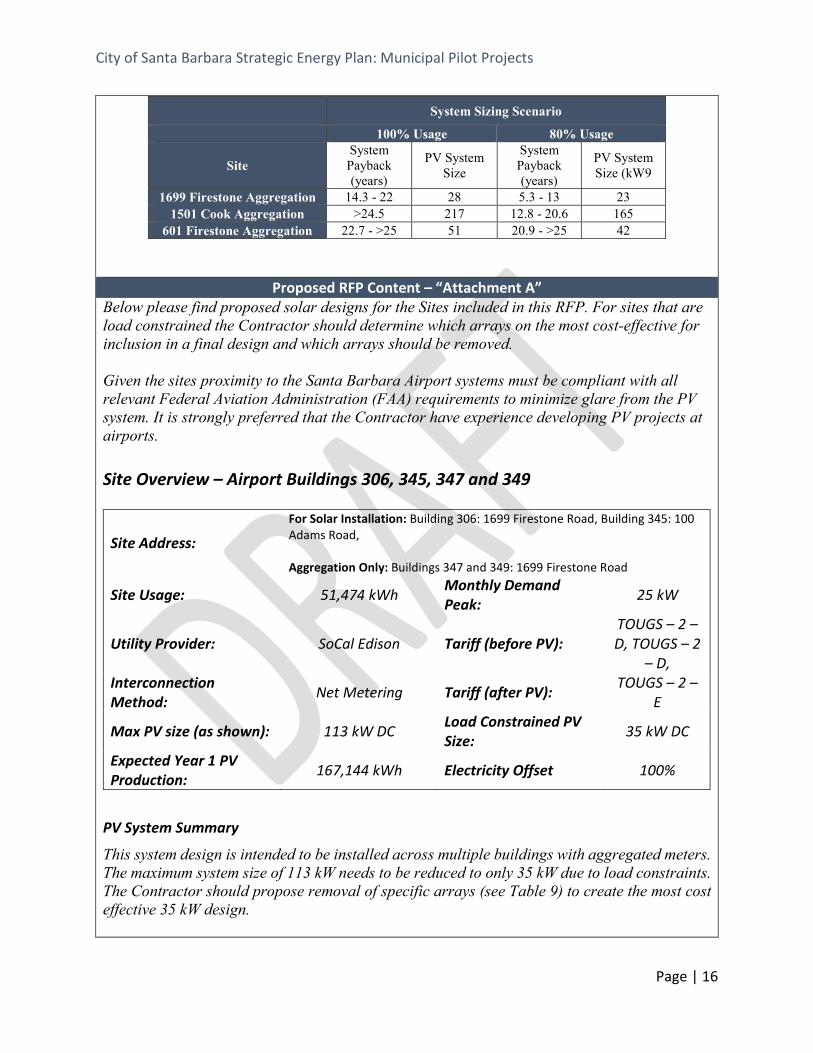
Proposed RFP Content – “Attachment A” Below please find proposed solar designs for the Sites included in this RFP. For sites that are load constrained the Contractor should determine which arrays on the most cost-effective for inclusion in a final design and which arrays should be removed. Given the sites proximity to the Santa Barbara Airport systems must be compliant with all relevant Federal Aviation Administration (FAA) requirements to minimize glare from the PV system. It is strongly preferred that the Contractor have experience developing PV projects at airports. Site Overview – Airport Buildings 306, 345, 347 and 349
Site Address:
For Solar Installation: Building 306: 1699 Firestone Road, Building 345: 100 Adams Road, Aggregation Only: Buildings 347 and 349: 1699 Firestone Road
Site Usage: 51,474 kWh Monthly Demand Peak: 25 kW
Utility Provider: SoCal Edison Tariff (before PV): TOUGS – 2 – D, TOUGS – 2
– D, Interconnection Method: Net Metering Tariff (after PV): TOUGS – 2 –
E
Max PV size (as shown): 113 kW DC Load Constrained PV Size: 35 kW DC
Expected Year 1 PV Production: 167,144 kWh Electricity Offset 100%
PV System Summary
This system design is intended to be installed across multiple buildings with aggregated meters. The maximum system size of 113 kW needs to be reduced to only 35 kW due to load constraints. The Contractor should propose removal of specific arrays (see Table 9) to create the most cost effective 35 kW design.
City of Santa Barbara Strategic Energy Plan: Municipal Pilot Projects
Page | 17
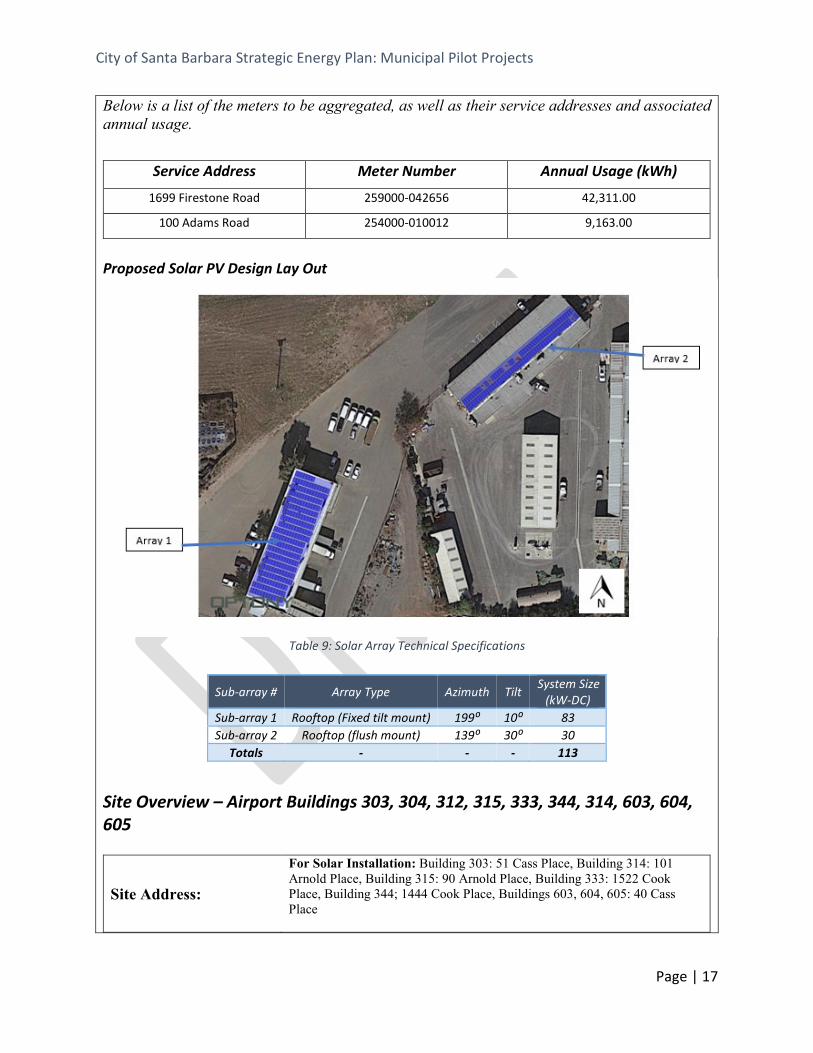
Below is a list of the meters to be aggregated, as well as their service addresses and associated annual usage.
Service Address Meter Number Annual Usage (kWh)
1699 Firestone Road 259000-042656 42,311.00
100 Adams Road 254000-010012 9,163.00
Proposed Solar PV Design Lay Out
Table 9: Solar Array Technical Specifications
Site Overview – Airport Buildings 303, 304, 312, 315, 333, 344, 314, 603, 604, 605
Site Address:
For Solar Installation: Building 303: 51 Cass Place, Building 314: 101 Arnold Place, Building 315: 90 Arnold Place, Building 333: 1522 Cook Place, Building 344; 1444 Cook Place, Buildings 603, 604, 605: 40 Cass Place
Sub-array # Array Type Azimuth Tilt System Size (kW-DC)
Sub-array 1 Rooftop (Fixed tilt mount) 199⁰ 10⁰ 83 Sub-array 2 Rooftop (flush mount) 139⁰ 30⁰ 30
Totals - - - 113
City of Santa Barbara Strategic Energy Plan: Municipal Pilot Projects
Page | 18
Aggregation Only: Building 304: 53 – A Cass Place, Building 312; 1501 – 1505 Cook Place
Site Usage: 363,563 kWh Monthly Demand Peak: 88 kW
Utility Provider: SoCal Edison Tariff (before PV): TOUGS – 2 – D, TOUGS – 2 – D
Interconnection Method: Net Metering Tariff (after PV): TOUGS – 2 – E
Max PV size (as shown): 569 kW DC Load Constrained PV
Size: 255 kW DC
Expected Year 1 PV Production: 393,152 kWh Electricity Offset 100%
PV System Summary
This system design is intended to be installed across multiple buildings with aggregated meters. The maximum system size of 569 kW needs to be reduced to 255 kW due to load constraints. The Contractor should propose removal of specific arrays (see Table 8) to create the most cost effective 255 kW design. Below is a list of the meters to be aggregated, as well as their service addresses and associated annual usage.
Service Address Meter Number Annual Usage (kWh)
1505 Cook Place ZYA102-000239 271,732.00
1501 Cook Place 259000-067122 71,642.00
301 Donaldson Place # C 222013-824574 1,906.00
40 Cass Place 222013-887682 14,773.00
101 Arnold Place # C 222013-777819 2,875.00
101 Arnold Place # B 222014-084528 635.00
Proposed Solar PV Design Lay Out
City of Santa Barbara Strategic Energy Plan: Municipal Pilot Projects
Page | 19
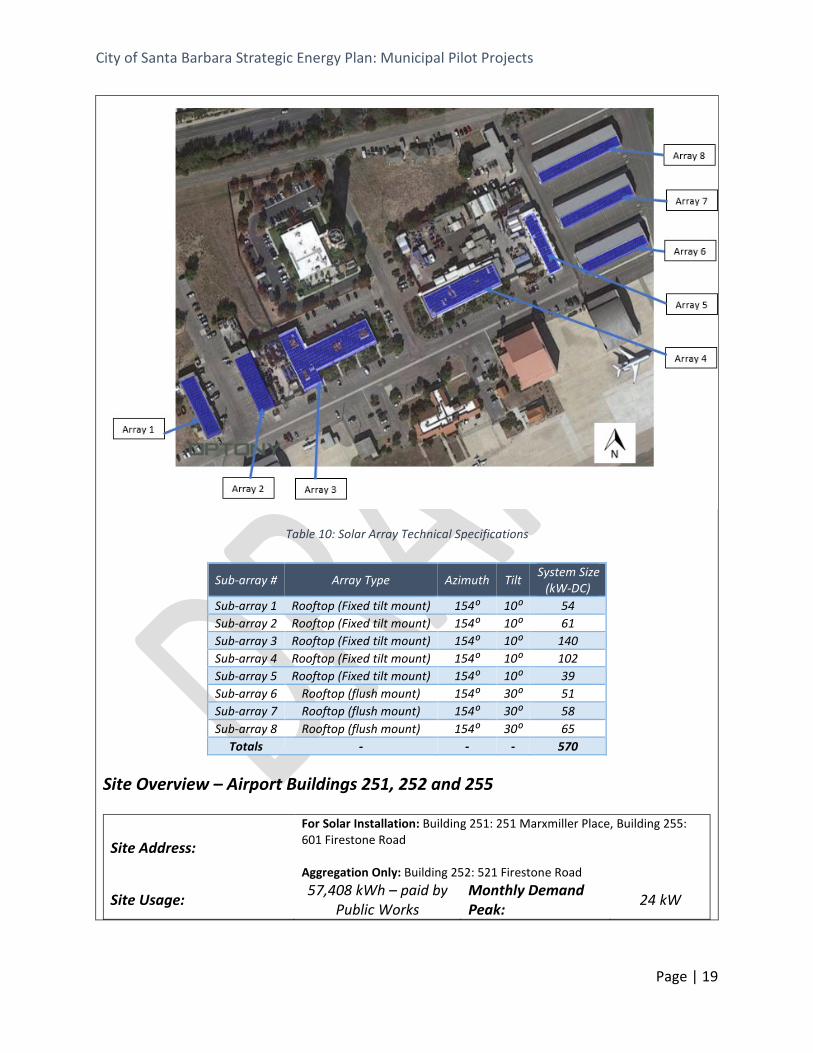
Table 10: Solar Array Technical Specifications
Site Overview – Airport Buildings 251, 252 and 255
Site Address:
For Solar Installation: Building 251: 251 Marxmiller Place, Building 255: 601 Firestone Road Aggregation Only: Building 252: 521 Firestone Road
Site Usage: 57,408 kWh – paid by Public Works
Monthly Demand Peak: 24 kW
Sub-array # Array Type Azimuth Tilt System Size (kW-DC)
Sub-array 1 Rooftop (Fixed tilt mount) 154⁰ 10⁰ 54 Sub-array 2 Rooftop (Fixed tilt mount) 154⁰ 10⁰ 61 Sub-array 3 Rooftop (Fixed tilt mount) 154⁰ 10⁰ 140 Sub-array 4 Rooftop (Fixed tilt mount) 154⁰ 10⁰ 102 Sub-array 5 Rooftop (Fixed tilt mount) 154⁰ 10⁰ 39 Sub-array 6 Rooftop (flush mount) 154⁰ 30⁰ 51 Sub-array 7 Rooftop (flush mount) 154⁰ 30⁰ 58 Sub-array 8 Rooftop (flush mount) 154⁰ 30⁰ 65
Totals - - - 570

City of Santa Barbara Strategic Energy Plan: Municipal Pilot Projects
Page | 20
Utility Provider: SoCal Edison Tariff (before PV): TOUGS – 2 – D, TOUGS –
2 – D,
Interconnection Method: Net Metering Tariff (after PV): TOUGS – 2 – E
Max PV size (as shown): 138 kW DC Load Constrained PV Size: 37 kW DC
Expected Year 1 PV Production: 212,722 kWh Electricity Offset 100%
PV System Summary
This system design is intended to be installed across multiple buildings with aggregated meters. The maximum system size of 138 kW needs to be reduced to only 37 kW due to load constraints. The Contractor should propose removal of specific arrays (see Table 10) to create the most cost effective 37 kW design. Below is a list of the meters to be aggregated, as well as their service addresses and associated annual usage.
Service Address Meter Number Annual Usage (kWh)
400 MARXMILLER 222013-890460 1,804.00
400 MARXMILLER PL D 222013-890437 111.00
400 MARXMILLER PL C 222013-890463 20.00
601 FIRESTONE RD 223000-018415 53,380.00
521 FIRESTONE RD 256000-122447 2,093.00
Proposed Solar PV Design Lay Out
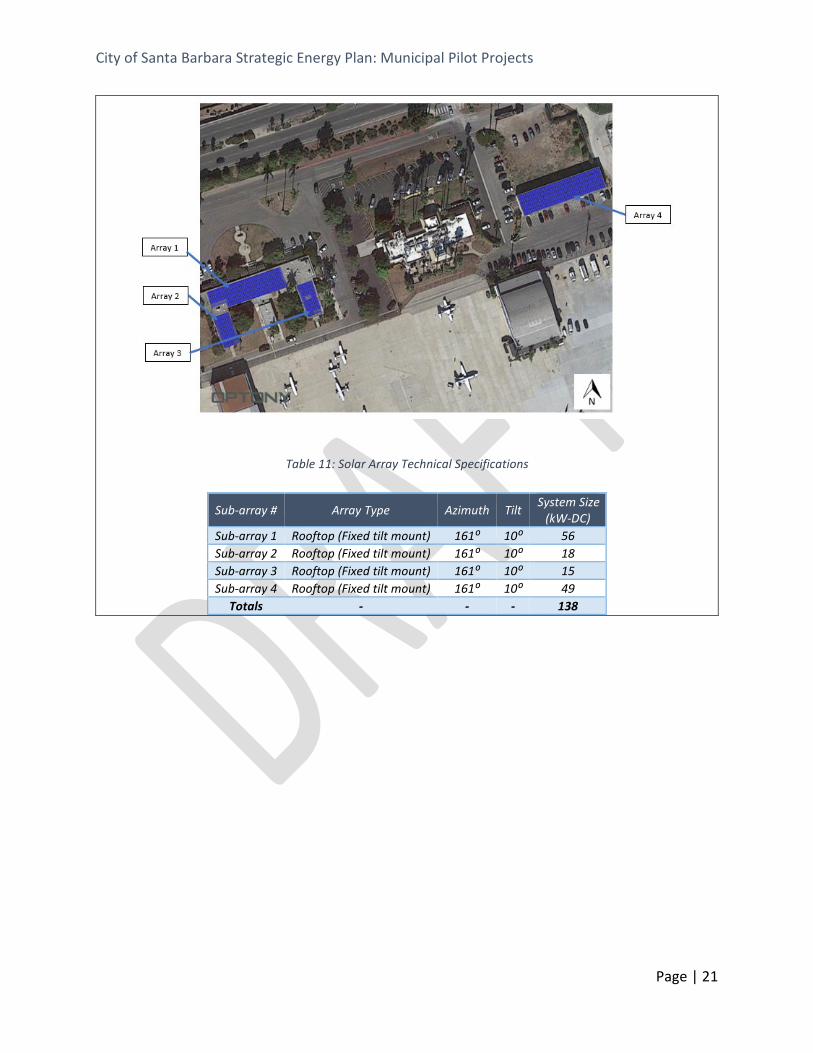
City of Santa Barbara Strategic Energy Plan: Municipal Pilot Projects
Page | 21
Table 11: Solar Array Technical Specifications
Sub-array # Array Type Azimuth Tilt System Size (kW-DC)
Sub-array 1 Rooftop (Fixed tilt mount) 161⁰ 10⁰ 56 Sub-array 2 Rooftop (Fixed tilt mount) 161⁰ 10⁰ 18 Sub-array 3 Rooftop (Fixed tilt mount) 161⁰ 10⁰ 15 Sub-array 4 Rooftop (Fixed tilt mount) 161⁰ 10⁰ 49
Totals - - - 138

City of Santa Barbara Strategic Energy Plan: Municipal Pilot Projects
Page | 22
Project Area 2: Water-Energy Nexus
Project 2.1: RFP for Water System Energy Masterplan Project Type: RFP - Ready Proposed Timing: As Water Resources
budget allows.
Responsible Party: Water Resources Staff and Energy & Climate Program Staff
Estimated Budget: $200,000 – $300,000
Project Background & Description The water-energy nexus–particularly the criticality of the existing electricity grid in providing continuity in water services–has been discussed in the SEP and in the City’s 2017 Energy Report. The City’s municipal facilities provide two examples of the interconnected nature of these systems. Project 1 is an RFP for a Water System Masterplan that assess specific ways for the City of Santa Barbara to leverage its water system to support its renewable electricity goals and manage the electricity system to support water system function. As examples of the interplay between water and energy one might consider how the City uses its water supply to produce electricity at the Lauro Reservoir via a hydroelectric plant, and conversely how the City relies on its electricity supply to produce potable water at the Meyer Desalination Plant, and how the El Estero wastewater plant draws both thermal and electricity production from effluent via cogenerations. Although the City’s many facilities are miles apart, they are component parts of a water-energy system: A single contiguous network of electrical distribution circuits, drinking water supply conduits, and wastewater treatment lines. This project option would review and identify how this system both consumes and produces water and energy, and how continuity, interoperability, and disaster recovery of separate components of the water-energy system can produce effects (either positively of negatively) on the other components system and, in turn, the Santa Barbara community. The following document is example language for a Scope of Work that could be reviewed by City staff and used in an RFP.
Proposed RFP Content
Water System Energy Masterplan – Scope of Work The City is seeking an experience consultant to complete a Water System Energy Masterplan on accordance with the City’s vision for a comprehensive model and approach to water systems. The Consultant will be working across multiple types of utility systems and generation technologies and will need to have knowledge of and experience analyzing both wastewater and water distribution systems, as well as the development of distributed energy resources including cogeneration, solar PV and battery storage. The appropriate consultants will have experience in an entire range of water and energy systems including:
• Potable water treatment • Wastewater treatment / wastewater digester gas production and treatment • Cogeneration
City of Santa Barbara Strategic Energy Plan: Municipal Pilot Projects
Page | 23
• Desalination • Efficiency of pumps, motors, lighting • Hydroelectric power systems, hydraulics and pressure-reducing valves, in-conduit
hydroelectric • Solar thermal and solar photovoltaics • Microgrids, battery energy storage, and stationary generators • Building/plant energy management systems and electrical engineering
This Masterplan will include a full assessment and business case development of opportunities for additional renewable energy generation and energy efficiency within the portfolio of municipal water system capital assets and properties. Consultant will create a business plan and cost savings analysis for electricity systems investments necessary to maintain/improve water quality and/or reliability of water supply while taking advantage of new energy recovery or generation projects. The Consultant will work with the City Water Resources Division and Energy & Climate Program team to complete this project. Deliverables will include, but are not limited to:
1. Assessment of overall water system, for opportunities for energy efficiency and renewable energy generation, inclusive of water treatment, desalination, distribution and wastewater (that is, plant processes, facilities, and offices and buildings)
a. Inventory, audit, and collection of all available water-energy data sources and information into a single compendium as both a document and a database
b. Estimations of assumed energy consumptions for all load types based on actual utility billing records
c. Use of hourly/sub-hourly utility interval meter data to determine peak load and load profiles most viable for electricity demand cost (kW) reductions through water-energy efficiency or process synergies
d. Natural gas and other fossil fuel profile with GHG reduction/elimination opportunities
e. Assessment of the energy potential of microturbines at pressure reducing valves throughout the water distribution system and assessment of business case for developing and installing turbines
2. Determination of cost savings payback period for all recommended energy measures
a. Estimated cost (less any recommended incentives and rebates) b. Annual cost savings c. Total lifecycle costs
3. Financial best use for cogeneration waste heat at El Estero Wastewater Treatment Plant
a. Determine cost effectiveness of thermal uses in desalination b. Determine cost effectiveness of thermal for increased heat to digesters

City of Santa Barbara Strategic Energy Plan: Municipal Pilot Projects
Page | 24
c. Discover other technology innovations in thermal uses
4. Capital projects and engineering solutions a. Solar feasibility study of floating solar at Gibraltar Reservoir (2.5M-3.0M sq-ft
of surface area; 20MW-30MW depending on panel efficiency, tilt, spacing) b. Increase of reliability and consistency in operations and potential for expansion
of fats, oils and grease intake at El Estero Wastewater Treatment Plant c. Feasibility study of utility-scale battery energy storage for ancillary services and
clean power back up at critical facilities
5. Development of actionable strategies for electric costs management and clean back-up power at Meyer Desalination Plant;
a. This should include but is not limited to efficiency upgrades (in both plant equipment and desalination process), district energy, and solar development and aggregation of neighboring parcels, innovations in over-the-fence solar energy transfers
6. Rates analysis of reasonable recurring electricity resiliency investment and associated bill adder directly tied to water quality and reliability. This analysis should aid the City to:
a. Clarify financial crosslinks between the stability and prices of electricity in
order to structure an appropriate level of investment (either programmatically or through capital projects) to provide long-term water rates stability
b. Derive justifiable crosslinks for the impacts to water rates which are tied to energy (i.e. changes to water supply such as the availability of water at Lauro Reservoir limit ability to provide hydroelectric generator output)
c. Derive justifiable crosslinks for the impacts to water rates of energy availability (i.e. Public Safety Power Shutdown leads to loss of electricity which determines water availability and cost at Meyer Desalination Plant)
Project 2.2: Water Facilities Masterplan Grant-funded Extension; Utility Scale Storage Development Feasibility Study vs. Pumped Hydroelectric Energy Storage
Project Type: Pitch Ready Proposed Timing: Following results of Energy System Master Plan
Responsible Party: Water Resources and Energy & Climate Program staff
Estimated Budget: $250,000 - $350,000
Project Background & Description As an extension to the Water Systems Energy Masterplan RFP this grant funding proposal looks at the possibilities of new large infrastructure investments to enable the water systems to use the elevation change between the city and the mountains in the Gibraltar Reservoir area to store utility-scale renewable energy. As a comparative planning exercise, this project would

City of Santa Barbara Strategic Energy Plan: Municipal Pilot Projects
Page | 25
create a costs-benefits analysis of grid-scale energy storage using batteries and other alternatives to pumped-hydroelectric energy storage. The City of Santa Barbara owns sites that could host a utility-scale battery storage system in order to provide resilient power in times of emergency and increase the distribution system’s ability to host distributed generation. During normal grid operation, the system owner could participate in the CAISO ancillary service markets and provide grid services that support the local distribution system to earn revenue. During grid outages, the City’s contract would stipulate that power must be provided to sustain electric service to a portion of the community. The City’s vulnerable position at the end of the SoCal Edison distribution line is well documented and the resilience and reliability concerns stemming from that position are a priority of the SEP and the City. If successful, this project would develop a large-scale battery that could provide back-up power to help alleviate that vulnerability. SoCal Edison and the California Independent System Operator (CAISO) have also recognized the vulnerability and SoCal Edison released an RFP for new capacity in the Moorpark - Goleta electric service area to address it. 68% of the bids received by SCE were stand-alone battery storage projects. This demonstrates the increasing viability of stand-alone utility-scale battery storage projects in SoCal Edison territory. SoCal Edison also notes that the increase in battery storage projects in the Goleta electric service area, resulting from this RFP, will enable a higher penetration of renewables in the area moving forward. The City could procure a project outside of SoCal Edison processes, in order to remove delays and have control over siting, but with the goal of achieving similar results. The “Community Resource Potential” analysis revealed that the distribution grid in Santa Barbara can accommodate about 47 MW of distributed generation without any additional review by the utility. In addition to the resilience benefits, a utility-scale battery can provide flexible load on a day-to-day basis that enables a higher penetration of distributed generation by providing a place for excess generation to be stored when it is not being used on-site and the distribution grid cannot support it. In order to capture important resilience benefits and support SEP implementation by increasing the amount of DERs that can be interconnected with the distribution system the City would explore the viability of developing a utility-scale solar project operating in partnership with SoCal Edison but controlled by the City and its private partner (Gibraltar Reservoir is a possible location). If the study shows the utility-scale energy storage is feasible the development of these sites could be achieved in partnership with a third-party developer which would build, operate and maintain the systems.
City of Santa Barbara Strategic Energy Plan: Municipal Pilot Projects
Page | 26
Possible funding is available from the US Dept. of Energy Office of Energy Efficiency and Renewable Energy under the Furthering Advancements to Shorten Time (FAST) Commissioning for Pumped Storage Hydropower prize. Low-interest financing under California Energy Commission may be available through Energy Conservation Assistance Act loans. Alternative low-interest funding may also be available through Drinking Water State Revolving Fund loan (DWSRF) if a tie between water reliability and critical infrastructure is made. The pumped-hydroelectric feasibility study involves several key land use and engineering elements:
1. Feasibility of new reservoirs a. Possibility of a new smaller high elevation hydroelectric reservoir b. New lower reservoir c. Floating solar on either/both new reservoirs
2. Aqueducts
a. Age/condition of Mission Tunnel (longest of its kind at the time of construction)
b. Sealed pipeline through Mission Tunnel c. Separate conduit inside the tunnel d. Separate pressurized conduit in a different location
3. New electrical systems a. medium-voltage distribution lines b. New reversable generator at base elevation
The battery storage alternative feasibility study also requires land use and engineering elements:
4. Interconnection a. Voltage/amperage limits of SCE distribution system b. Duration and peak power specifications c. Resource scheduling power matching to community load profile
5. Permitting a. Fire safety b. Battery chemistry c. Groundwater contamination risks
The project’s business case with also have regulatory feasibility questions:
6. Distributed energy resources provider agreement with CAISO 7. Developer agreement 8. FERC generator permissions 9. State/federal land use permissions 10. Owner/operator question (including CCA) 11. Existing/new distributed energy resource provider tariffs that the City can best benefit
from

City of Santa Barbara Strategic Energy Plan: Municipal Pilot Projects
Page | 27
Program Area 3: Transportation Project 3.1: Community-wide EV Master Plan
Project Type: RFP - Ready Proposed Timing: 2020-2021 Responsible Party: Energy & Climate
Program Staff Estimated Budget: $300,000 – 450,000
Project Background & Description Vehicle electrification is rapidly occurring in California. Statewide electric vehicles (EVs) reach a market share of just under 8% in 2018. The state has set an aggressive goal of having 5 million zero-emission vehicles on the road by 2030. In the City of Santa Barbara EVs have a market share of about 1.8% and that number is expected to increase to over 13% by 2028. Additionally, the Santa Barbara Municipal Transportation District (SBMTD) Board of Directors adopted a Zero Emission Bus (ZEB) goal to achieve 100% ZEBs by 2030. Accommodating the electrical load impact resulting from this commitment creates a critical need, and significant opportunity, for alignment of the ZEB Rollout Plan with SEP implementation. Aligning SBMTD’s electrification efforts with the City’s SEP efforts will create synergies that enable the success of both efforts by ensuring that DER development through the SEP can support ZEB charging needs during regular operation and critical events and exploring the role that SBMTD charging infrastructure can play in the Smart Energy Zone or related microgrid efforts pursued through the SEP. Finally, supporting transit electrification also aligns with the City’s resilience goals. Public transit authorities are responsible for providing uninterrupted service during power outages or disaster situations and the SBMTD ZEB commitment provides an opportunity to align SBMTD’s goals with City efforts on emergency energy preparedness and disaster resiliency through coordination around the development of strategically sited DERs. Supporting vehicle electrification to reduce transportation-related greenhouse gas emissions aligns with the City of Santa Barbara’s climate efforts. Throughout the SEP process feedback provided both by community members and City Council reflected concern that the City needed to prepare for the expected proliferation of EVs. The community also communicated a desire that the City increase efforts to support the expected proliferation of EVs. A complete planning effort to determine the actions necessary to prepare for and support vehicle electrification in Santa Barbara is necessary to address these concerns. This project description includes three key prongs that should be included in a Community-wide EV Masterplan for the City of Santa Barbara. These prongs are as follows: An assessment of opportunities for vehicle electrification within the City’s fleet and
charging infrastructure development at City facilities An assessment of enabling practices (policies and programs) to support the development
of electric vehicles in the community and public charging infrastructure An assessment of opportunities to support the electrification of public transit vehicles
through innovative partnerships and distributed energy resource (DER) development12
12 This prong of the Masterplan focuses on collaboration between the City and SBMTD and the opportunity to fund these efforts using a cost-share between the two agencies should be explored.
City of Santa Barbara Strategic Energy Plan: Municipal Pilot Projects
Page | 28
Given the wide scope of EV planning opportunities needed, the City may seek multiple consultants to complete the Community-wide EV Masterplan. The Proposed RFP Content Outline provides the framework for a Scope of Work to be included in a future RFP.
Proposed RFP Content Outline Community-wide EV Masterplan – Scope of Work
Planning Area 1 – Municipal Fleet & Facilities Task 1.1: Municipal Fleet Assessment Consultant will provide an assessment of all internal combustion vehicles in the municipal fleet and create an “Electrification Plan”. This Plan should identify near-term electrification opportunities for vehicles that can be converted to EVs immediately, given current market status. This Plan should also provide guidelines for future planning and monitoring of electrification opportunities for medium and heavy-duty vehicles to guide the City as vehicle technology improves. The fleet assessment will rely on relevant vehicle data provided by the City and interviews with City staff to provide insight on vehicle duty cycles and uses when available data is not sufficient. Task 1.2: Site Assessment for Electric Vehicle Supply Equipment (EVSE)13 Consultant will develop and execute a site assessment methodology to determine 2-5 priority sites for EVSE development in support of municipal fleet electrification. For each site the Consultant should provide;
1. Recommendation for number of EVSE ports and charging capability (L2, DC Fast) 2. Discussion of installation challenges related to existing electric infrastructure at sites in
question 3. Estimation of site load impacts and electrical cost impacts resulting from suggested
EVSE installation 4. Discussion of DER options to support EVSE development and mitigate increased
electrical load and costs associated with EVSE operation
Planning Area 2 – Community EV Adoption & Charging Infrastructure Development Task 2.1: EV Growth Forecasting & Associated EVSE Needs Consultant will leverage existing EV growth forecasts and associated EVSE needs to create relevant projections for the City of Santa Barbara. The City-specific projections should include an estimate of EVSE needs that delineates use-cases (multi-unit dwelling, workplace, public) and charger-type.
13 Depending on available budget, Task 1.2 could be expanded into multiple tasks to include a full site assessment for EVSE and DERs and operational modeling of electrical loads, resulting in complete development plans for each site that include recommendations for EVSE and DER development (e.g. kW capacities for solar & battery storage)

City of Santa Barbara Strategic Energy Plan: Municipal Pilot Projects
Page | 29
Task 2.2: Programs & Policies to Support EV Adoption The Consultant shall survey best practices of peer municipal governments and provide a set of recommended actions that the City can take to support EV adoption throughout its community. The Consultant will provide a synopsis of each recommended program or policy that provides the City with an understanding of the party responsible for implementation, the actions required for implementation and a cost estimate for implementation. Task 2.3: Programs & Policies to Support EVSE Development The Consultant shall survey best practices of peer municipal governments and provide a set of recommended actions that the City can take to support EVSE development in its community. Priority should be given to programs and policies that address the use cases identified as having the biggest EVSE need through Task 2.1. The Consultant will provide a synopsis of each recommended program or policy that provides the City with an understanding of the party responsible for implementation, the actions required for implementation and a cost estimate for implementation.
Planning Area 3 – Public Transit Electrification & Resilience Task 3.1: Survey of Load Impacts of Public Transit Electrification & Assessment of Supporting DER Assets The Consultant will work to assess and quantify the projected load impacts of public transit electrification in the City with a particular focus on SBMTD’s ZEB Plan. The Consultant shall use the results of this assessment to perform a needs assessment to determine which DER assets will best support this increased load and enable transit electrification.14 Task 3.2: Recommendations for Support of Public Transit Electrification Using the results of task 3.1, the Consultant should identify opportunities for the City to support public transit electrification including, but not limited to; Opportunities for joint procurement of DERs between the City and SBMTD at agency-
controlled sites Policy changes to enable opportunity charging and support the operational needs of a
ZEB fleet Task 3.3: Identification of Grant Opportunities & Mechanism for Joint Funding Applications Consultant should identify grant opportunities and develop a joint approach, involving both the City and SBMTD, to execute joint funding applications that could be more likely to succeed. Using the results of Task 3.1 and 3.2 the Consultant should establish key characteristics, topic areas and sources of funding opportunities to guide the City in identifying opportunities for collaboration.
14 Depending on coordination with SBMTD, the Consultant can also determine which DER assets are necessary to protect the SBMTD from charging-cost overruns and on-site infrastructure inadequacy. This analysis could include PV, energy storage, stationary fuel cells, and software solutions at the direction of SBMTD.

City of Santa Barbara Strategic Energy Plan: Municipal Pilot Projects
Page | 30
Project Area 4: Community Resilience Project 4.1: Feasibility Study & Procurement of Clean Power Back-up at Critical Facilities
Project Type: Pitch - Ready Proposed Timing: 2020 -2021
Responsible Party: Energy & Climate Program Staff Estimated Budget:
Study: $150,000 – $200,000 Installation: TBD
Project Background & Description There are several municipal sites that serve critical roles in the community, whether in provision of necessary services (e.g. public safety, potable water) or as shelters in times of emergency. Aligning with the SEP goals of increased renewable energy and increased grid resilience and reliability, these sites would be well served with renewable generation and battery storage systems to provide emergency power when the electricity grid is compromised. The economic case, however, of battery storage as clean power back-up is less well established than battery storage used for load shifting or peak shaving (as proposed in Project 2). Valuing the resilience benefits of solar + storage systems can increase the economic viability of projects, but it also results in several system changes that need to be accounted for15. These include additional system hardware, such as an automatic transfer switch and critical load circuit, and changes to the optimal system size such as a larger battery, a larger solar system, or both16. The exact valuation of resilience benefits of these systems at municipal facilities in Santa Barbara is an outstanding question, as is the site analysis necessary to identify the cost-optimal system sizing. Accordingly, further feasibility analyses are needed to determine the project specifications that should be added to an RFP focused around clean power back-up. They may also require grant funding to be economically feasible for the City in the near-term. This project scope includes potential sites for inclusion in further analysis and potential development, as well as important questions to answer around resilience valuation and system design. Due to the uncertainty and variability in project costs, the development costs associated with these systems should be assessed during the Feasibility Study. Additionally, development costs associated with resilience projects were not included in the SEP Budget provided to the City, but the City is aware of the need for increased infrastructure investment tied to resilience throughout the community. The clean power back-up projects scoped in this Feasibility Study are an example of this infrastructure investment.
15 Clean Energy Group & NREL, Valuing Resilience https://www.cleanegroup.org/wp-content/uploads/Valuing-Resilience.pdf 16 IBID

City of Santa Barbara Strategic Energy Plan: Municipal Pilot Projects
Page | 31
Note: The five Fire Stations included below do not have enough solar capacity to be included in a traditional solar RFP, but they are included here due to their role as critical facilities. An additional goal of the study needed should be to determine the economic viability of small solar arrays, or battery storage-only, projects at the Fire Stations. The sites included here with larger solar potential (i.e. Cater Water Treatment, City Hall and the Central Library) could be developed under Project 2 (with stipulations that any solar systems installed are capable of connecting to a larger storage system) and still be included in any future grant funding received or contract signed under this project.
Sample Grant Application: Feasibility Study Scope & Potential Sites The following questions should constitute the study scope needed for a grant application and guide the feasibility assessment. They can be tailored for inclusion in a grant application or narrowed if the City determines that the most critical questions are best answered through a simple solicitation of vendor bids and analysis of resulting system designs. Financial Feasibility Questions What is the proper valuation of resilience for a battery storage system in Santa
Barbara? At municipal facilities? At commercial facilities? (likely based on data of economic impacts from 2017/2018 natural disasters)
What purchasing or contracting mechanism is most suited to support the procurement of these systems?
System Design Questions Is there a standard system design that can be replicated across critical municipal
facilities? Is increasing the size of the battery storage system or the size of the solar array the
least cost option to increase back-up power duration? What is the optimal battery storage duration, based outage length and solar size? Is there a need for system redundancy by keeping a traditional generator?
Table 12: Potential Sites for Feasibility Assessment
Site PV Capacity (proposed kW, unless otherwise noted)
Expected PV Annual Generation (kWh)
Storage Capacity (kw/kWh)17
Westside Community Center 56 88,368 15/360
Cater Water Treatment 282 454,500 385/9,240 City Hall 103 166,500 40/960
Central Library 146 333,528 50/1,200 Santa Barbara County Mental Health Facility 83 133,601 20/480
Ortega Pumping Station 27 42,440 25/600 Franklin Center 52 80,735 25/600 Fire Station 118 10 (existing) 15,121 (existing) 35/840
17 Storage systems sized for 24-hours of back-up power at full load for illustrative purposes. Sizing expected to change during study and procurement. 18 Fire Station 1 already has an existing 10 kW PB system but is included here because it has additional capacity and is adjacent to the Fire Headquarters, which likely has a significant need for power in emergency situations.

City of Santa Barbara Strategic Energy Plan: Municipal Pilot Projects
Page | 32
51 (total proposed) 80,600 (expected) Fire Station 8 22 33,630 10/240 Fire Station 2 15 23,317 15/360 Fire Station 3 6 9,793 5/120 Fire Station 6 15 22,850 25/600 Fire Station 7 9 13,991 10/240


![Oracle Fusion Middleware Understanding Oracle WebLogic Server · [1]Oracle® Fusion Middleware Understanding Oracle WebLogic Server 12c (12.1.2) E28091-03 December 2014 This document](https://static.fdocuments.us/doc/165x107/5ae5c13f7f8b9a87048d0a5e/oracle-fusion-middleware-understanding-oracle-weblogic-server-1oracle-fusion-middleware.jpg)