Understanding the plurality of public interests for … - P-Seg_final.pdf · Understanding the...
44
1 Understanding the plurality of public interests for open strategy in science and innovation Go Yoshizawa 1 , Makiko Suga 2 , Mitsuru Kudo 3 , Eri Mizumachi 3,5 , and Kei Kano 4,5 1. Graduate School of Medicine, Osaka University 2-2 Yamadaoka, Suita, Osaka 565-0871 Japan [email protected] 2. Department of Business Administration, Tezukayama University 7-1-1 Tezukayama, Nara 631-8501 Japan 3. Center for the Study of Co* Design, Osaka University 1-16 Machikaneyama-cho, Toyonaka, Osaka 560-0043 Japan 4. Faculty of Education, Shiga University 2-5-1 Hiratsu, Otsu 520-0862 Japan 5. Institute for Integrated Cell-Material Sciences, Kyoto University Yoshidaushinomiyacho, Sakyo-ku, Kyoto 606-8501 Japan Abstract Public engagement may guarantee the diversity of evidence for policymaking as public opinions are qualitatively different from expert knowledge. It has been addressed in science, technology and innovation (STI) policy world-widely, but left unanswered the question of with what type of publics we need to engage. This study aims to identify new population segments that are more relevant to policy matters relating to aspects of innovation. The nation-wide face-to-face interview survey in 2013 collected 887 samples from Japanese citizens. A combinative method of factor analysis and decision tree analysis shows that only four questions are sufficient to characterise six population segments for public engagement in STI policy – ‘Discouraged’, ‘Independent Engagers’, ‘Uninterested’, ‘Empowered Sceptics’, ‘Trustful Engagers’, and ‘Interested Followers’. This segment model thus demonstrates practical feasibility, global applicability and methodological extendibility.
Transcript of Understanding the plurality of public interests for … - P-Seg_final.pdf · Understanding the...

1
Understandingthepluralityofpublicinterestsforopenstrategyinscienceandinnovation
GoYoshizawa1,MakikoSuga2,MitsuruKudo3,EriMizumachi3,5,andKeiKano4,5
1. GraduateSchoolofMedicine,OsakaUniversity
2-2Yamadaoka,Suita,Osaka565-0871Japan
2. DepartmentofBusinessAdministration,TezukayamaUniversity
7-1-1Tezukayama,Nara631-8501Japan
3. CenterfortheStudyofCo*Design,OsakaUniversity
1-16Machikaneyama-cho,Toyonaka,Osaka560-0043Japan
4. FacultyofEducation,ShigaUniversity
2-5-1Hiratsu,Otsu520-0862Japan
5. InstituteforIntegratedCell-MaterialSciences,KyotoUniversity
Yoshidaushinomiyacho,Sakyo-ku,Kyoto606-8501Japan
Abstract
Publicengagementmayguaranteethediversityofevidenceforpolicymakingaspublicopinionsare
qualitatively different from expert knowledge. It has been addressed in science, technology and
innovation(STI)policyworld-widely,butleftunansweredthequestionofwithwhattypeofpublics
weneedtoengage.Thisstudyaimstoidentifynewpopulationsegmentsthataremorerelevantto
policymatters relating toaspectsof innovation.Thenation-wide face-to-face interviewsurvey in
2013collected887samples fromJapanesecitizens.Acombinativemethodof factoranalysisand
decision treeanalysis shows thatonly fourquestionsaresufficient tocharacterisesixpopulation
segments for public engagement in STI policy – ‘Discouraged’, ‘Independent Engagers’,
‘Uninterested’,‘EmpoweredSceptics’,‘TrustfulEngagers’,and‘InterestedFollowers’.Thissegment
modelthusdemonstratespracticalfeasibility,globalapplicabilityandmethodologicalextendibility.

2
Introduction:publicengagementasevidenceforpolicy
Evidence-basedpracticeorpolicywas first introduced in the1990s in themedical field.Thishas
invokedanumberofattemptstoevaluateeffectivenessfordecisionmakersbyorderingavariety
ofevidencesmeasures,suchassystematicreview(Youngetal.2002;Leigh2009).However,ithas
been well known in policy studies since the 1970s that this kind of scientific knowledge and
researchisnotasuseful insocialpolicy(Lipsky1971;Nelson1974),whichhasoftenresultedina
division between ‘two communities’ of knowledge producers and policy makers (Caplan 1979).
Whenevidence-basedactivitiesinmedicine,socialwelfareandeducationarenotconfinedtothe
policylevel,butspreadtothepracticelevel,on-sitepractitionerscanberegardedascreatorsofa
third knowledge culture (Shonkoff 2000). In creating a typology of evidence (e.g. Sebba 2004;
Banks 2009) a division can be observed between scientific knowledge, political knowledge, and
professionalknowledge(Head2008).However,thistypologyplacesdisproportionateemphasison
rational expertise and faces challenges from real issues, such as illogical sentiments in criminal
policyandsocialinclusionofaboriginalgroups(Head2013).Intheperson-centredcareapproach,
evidence sources can include patients and clients, and be composed of local contexts and
environments surrounding stakeholders (Rycroft-Malone et al. 2004). Such stakeholders and
serviceusersdonotmerelybringempiricalknowledgeasthefourthtypeofevidence(Gough2007;
Head 2010) – they are rather thosewho can provide epistemological knowledge concerning the
value-ladenquestionof ‘whyweneedthispolicy’ (Nutley,Walter&Davies2003;Mingers2008).
While defining evidence is by itself a social act and a part of the policy process (Parsons 2002;
Wesselink,Colebatch&Pearce2014) and therearediverseperspectives among stakeholderson
whatevidence istrustworthy(Glasby&Beresford2006),areflexiveact toredefinethenatureof
evidence would entail a more democratic process. This would be an attempt to facilitate
interaction between knowledge producers and knowledge users for democratic policymaking
(Torgerson1986)undertheterm‘policysciences’(Lasswell1951).Inshort,publicengagementmay
guarantee the diversity of evidence in the sense that public opinions are qualitatively different
fromexpertknowledge.However,thisdoesnotmeanthatthereisanyorderofevidencebetween
expertsandcitizens.Theprocessofpublicengagementprovidesavaluableopportunitytoincrease
awarenessofanddevelopdiscussionsonwhatisevidenceamongstakeholders.
InJapan,overthelasttwentyyears,thegovernmenthaspromotedscienceandtechnology
underScienceandTechnologyBasicPlans,whicharerevisedevery fiveyears.The4thBasicPlan
(2011-15)providesforintegrateddevelopmentofscience,technologyandinnovation(STI).Asthe
interrelationshipbetweenscience,technologyandsocietybecomesevenmorecomplex,STIpolicy

3
needs increasedpublicunderstanding,public trustandpublicengagement toproduce thepublic
good. For this, policymakers pursue a more rational policymaking process and greater public
accountabilitybyplanningandimplementingevidence-basedpolicies.Againstthisbackground,the
MinistryofEducation,Culture,Sports,ScienceandTechnology(MEXT)haspromotedthe‘Science
for RE-designing Science, Technology and Innovation Policy (SciREX)’ program since 2011. The
SciREXprogramproposesa ‘rationalprocess’ andprovides ‘objectiveevidence’aiming to reform
STIpolicymaking.
In Europe, there is a significant degree of correlation between research and innovation
intensityinacountryandtheroleofsocietyintheadoptionanddisseminationofscientificresults
(Tsipouri 2012). Accepting cluster and open-innovation policies as promising (Vigier 2007), the
EuropeanCommissionrecentlydeclaredanopenstrategyinscienceandinnovation(Moedas2015).
Asoneofthestrategytools,publicengagementhasbeenaddressedinvariousphasesandlevelsof
STI policy, not only in human subject researchor labour-intensive research, but also in research
and innovation projects (e.g. crowd funding, citizen science), project design (e.g. science shops,
user innovation), program development (e.g. advisory boards), and policy formation (e.g.
technologyassessment)(Hennen2015).Yet,thistrendhasleftunansweredthequestionsofhow
tomeasureandevaluatepublicengagementactivities, andmore importantly,withwhat typeof
publicsweneedtoengage(Godin&Doré2005;Roweetal.2005;Roweetal.2008;Bauer,Allum&
Miller2007;Neresini&Bucchi2011).
Whoarethepublics?
In identifying citizen profiles for marketing research, there is a long history of segmenting the
wholepopulationintoseveralgroups(Smith1956).Readersmayfindtensionbetweenmarketing
researchfortheprivatesectorandpolicystudiesforthepublicsector,butgiventheeffectiveness
of marketing research in public service, civil servants are no longer able to manage public
administrationwithout citizen input (Kotler& Lee 2007). This is concurrentwith the newpublic
management (NPM),which stresses ‘hands-onprofessionalmanagement, explicit standards, and
measuresofperformance;managingbyresults;valueformoney;and,morerecently,closenessto
the customer’ (Rhodes 1996: 655). From the perspective of innovation studies, population
segmentation enables the characterisation of people and the identification of target customers
whengoingbeyondthe‘chasm’ininnovationdissemination(Moore2014).
Asano (2010) categorised segmentation methods into three generations. The first
generation witnessed the still most popular method based on demographics, such as age, sex,

4
marital status, residence area, literacy/education, employment status, occupation, nationality,
religion,andethnicity.Inthisgeneration,therearealreadyanumberofsurveysonpublicattitudes
towardsscienceandscientific literacy,suchastheScience IndicatorsandEurobarometers(Pardo
and Calvo 2002; Nissen 2014) and the Programme for the International Assessment of Adult
Competencies (PIAAC) (Sellar & Lingard 2014). However, these surveys segment the targeted
population a priori without taking into account their perceptions, behaviours, and attitudes in
relationtoSTIpolicy.Thesecondgenerationappearedontheresearchsceneinthe1970s,when
marketingresearchersrealisedthatdemographicsdonotsuccessfullysegmentpeopleaccordingto
theirneedsandvalues.AtypicalexampleisthePublicAttitudestoScience(PAS)surveyintheUK,
conducted five times since 2000. These surveys cluster the British population into six distinct
categories of similar attitudes to science: ‘confident engagers’, ‘distrustful engagers’, ‘late
adopters’, ‘concerned’, ‘disengaged sceptics’, and ‘indifferent’ (Castell et al. 2014). Similarly, a
clusteranalysisoftheJapanesepopulationbasedontenquestionsderivesfourdistinctcategories:
‘Inquisitive’, ‘sciencephiles’, ‘life-centred’, and ‘low interest’ (Kawamoto et al. 2013). Here,
demographic data served as explanatory (independent) variables, and served as response
(dependent) variables in these surveys. One of major limitations of this method is that it is
impossible topredictwithwhichsegmenta respondentwillbeclustered.Thisbecomesacritical
flawwhenwewishtoengagethepubliconareal-timebasisinaworkshoporsimilarsituation.We
arenotable tosegment thepublicparticipants into individualclustersandconsequently identify
whotheyare–segmentationalwaysoccursinhindsightandisnotpracticallyusable.
The third generation of segmentation has been developed to overcome the above
limitations.Itcombinesfactoranalysisanddecisiontreeanalysisandenablesthesegmentationof
respondentsintooneofseveraldistinctgroupsaccordingtotheirresponsestosimplequestions.A
study of the State of Victoria in Australia (2008) is one example of this generation. In 2007 and
2011, the state government conducted surveys on attitudes to science and technology and
identifiedsixpopulationsegmentsusingacombinationofthefollowingthreequestions:
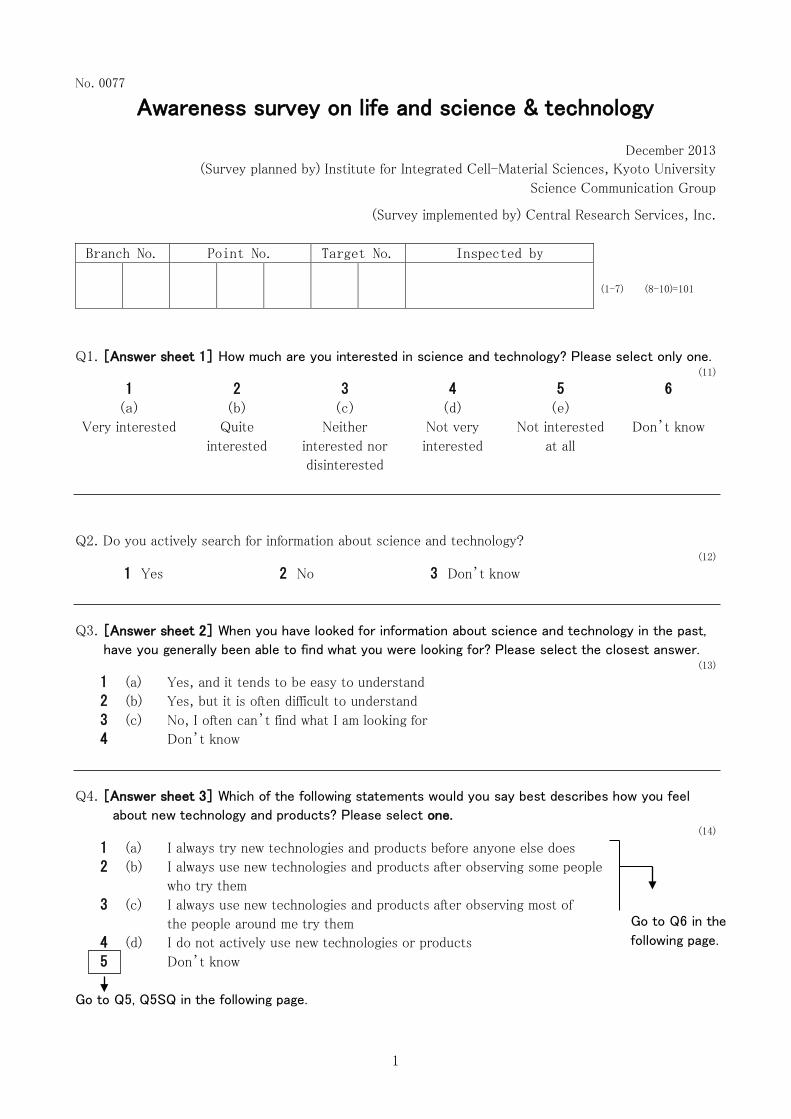
1. Canyoupleasetellmehowinterestedyouareinscience?
2. Doyouactivelysearchforinformationaboutscienceand/ortechnology?
3. Whenyouhave looked for informationaboutscienceandtechnology in thepast,haveyou
generallybeenabletofindwhatyouwerelookingfor?
A study adopting this segmentmodel in the Japanese contextdemonstrates that a less-engaged

5
publicmayhavedifferentopinionsandperspectivesthatmighthaveneverbeencollectedthrough
the current public comment system or other conventional engagement tools for policymaking
(Kanoetal.2016).Thisideaisacognateoftheconceptofcivicepistemologies,whichmakenoa
prioriassumptionsaboutwhatpublicsshouldknoworunderstandofscienceandaskshowsome
knowledgeclaimsareperceivedasreliable(Jasanoff2005).
Newsegmentmodel
As aforementioned, Japanese STI policymakers have faced an increasing demand of public
engagement for evidence-based policy. We initially assumed that policymakers might have
different kinds of people inmind for public engagement – thosewho trust in policymakers and
would like to say engagewith them; thosewho do not trust in policymakers andwould like to
engage; those who neither trust nor wish to engage with policymakers (Table 1). The most
important target group in our initial assumption is those who neither trust in nor speak with
policymakers,butwanttomakeacomplaint.
Table1.Publicengagementstrategiesinapopulationsegmentmodel
People… makeacomplaint donotmakeacomplaint
trustin
policymakers
Policymakerspersuadethem
(publicunderstanding)
Policymakersignorethem
distrustin
policymakers
Policymakersinvolvethem
(publicparticipation)
butwantto:
Policymakersmakethemdeliberate
(publicengagement)
anddonotwantto:
Policymakersignorethem
Nevertheless, the most crucial problem is, as our preliminary interviews reveal, that STI
policymakersdonothaveaclearideaofwhoisthe‘public’orhowtoapproachthem.Ontheother
hand, most citizens have never thought about commenting to policymakers or participating in
publicpolicy.
Under these circumstances, we have recently developed a novel and tangible segment
modelunderthe‘FrameworkforBroadPublicEngagementinScience,TechnologyandInnovation
Policy’ (PESTI) project funded by the Research Institute of Science and Technology for Society

6
(RISTEX) in Japan (Kano 2014). Under the umbrella of the SciREX program, RISTEX organises a
research fundingschemetopromoteresearchand innovationprojects todevelopnewanalytical
methodologies, models and indicators, which are expected to contribute to evidence-based
policymakingforSTIpolicyinthemid-tolong-term.PESTIisatransdisciplinaryprojectconsistingof
a wide variety of experts on science communication, science education, marketing research,
scienceandtechnologypolicy,psychology, informationscience,businessscience,communication
science,anduniversity-industry-governmentlinks.
Our new assumption is that a person’s interest in STI does not necessarily and clearly
correspondtohis/herwillingnesstoengageinSTIpolicy.Astheconceptofgovernanceproliferates,
interestedpeoplemaypreferotherengagementoptionsoverparticipationinpublicpolicy.Ifthose
whoare less interested inscienceandtechnologyaretobeengagedwithSTIpolicymaking,such
policyshouldbebasedonawiderangeofpublicneedsandvaluesandwillbemoredemocratically
legitimate (Kano2014;Maenami, Yoshizawa&Kano2016).Our strategy is thus two-fold.One is
makinganachievementinpublicsegmentationforpolicymaking.Theotherisfacilitatingcitizensto
make themconsider engagement in STI governance that covers STI policy. This ideawas further
elaborated to integrate the idea of innovation marketing that reflects Rogers’ model (1983),
because citizens are merely interested in tangible technologies and products provided by the
market. Somepolicymakers are reluctant touse the term ‘market’ as it connotesneo-liberalistic
new public management, so we deliberately discuss ‘living activity’ rather than ‘consumption
behaviour’. We also wanted to relativise STI policy among all public policies, including pension
policy,medicalpolicyandnationaldefencepolicy.Bysodoing,wehaveendeavouredtoacquirea
more general profile of respondents as citizens living in this society. This is critical, particularly
whenpolicymakerswishtoapproachthosewhoarelessinterestedinSTI.Fromtheirdailyactivities,
policymakersshouldfindahooktoattractcitizenstopublicengagementinSTIpolicy.
Method
WhiletheVictorianstudyaimedtofostercommunityengagementandlittleisknownaboutwhat
type of publics support government spending on science and technology (Sanz-Menéndez, Van
Ryzin&delPino2013),ourstudyaimstoidentifynewpopulationsegmentsthataremorerelevant
topolicymattersrelatingtoaspectsofinnovation.Thisfocusarisesfromarapidlygrowingpolitical
demandformoreapplication-orientedpublic-researchperformancemeasurements(Ernø-Kjølhede
&Hansson2011).
Followinganumberofpilotwebsurveysandfocusgroup interviewson interest inscience

7
andtechnology,weconductedafull-scalesurveyasdetailedinTable2.
Table2.Surveydetails
Targetedregion Nationwide
Targetedrespondents Japanesecitizensaged16+
Surveymethod Structuredinterviewonaface-to-facebasis
Surveyperiod 12-23December2013
Sampling Two-stagestratifiedrandomsampling
Numberofsamples 2,000
Numberofsubgroups 140
Numberofvalidresponses 887
Responserate 44.4%
ThequestionnaireincludedthethreequestionsfromtheVictoriansegmentation[Q1-3],the
adoptabilityofnewtechnologiesandproducts(Rogers1983)[Q4],expectationsofSTIpolicy[Q5],
currentandideallevelsofinterviewees’owninfluenceonpolicyrelatedtoscienceandtechnology
[Q6-7], the levelof importance intervieweesplacedonvariouspolicies, includingSTIpolicy [Q8],
desirable bodies and collaborations to lead the development of science and technology [Q9],
factorsfacilitatingSTI[Q10],andreliablesourcesofinformationonscienceandtechnology[Q11].
Questions9and11wereincludedtojudgeifcitizensthinktheydonothavetobeengagedinSTI
policywhentheyareawareoftrustedbodiesandcollaborations.Question10aimedtograsphow
muchcitizensobservegovernmentpolicyaffecting thedevelopmentofSTI.Simulationofbudget
allocation to various policies [Q12] and respondents’ reflections on the simulation [Q13] can be
regardedasanovelchallengeinthiskindofpublicsurvey.Thesequestionsmakecitizensarticulate
how they can think and behave like policymakers. In the context of policymaking, policymakers
cannotonlyfocusonSTIpolicy.Likewise,ourapproachtopublicengagementinSTIpolicyshould
berelativisedwithinthewholepolicyandpoliticalarena.Thesubsequentquestionsaretobeused
forconstructingamoregeneralprofileofindividualrespondents,includingtrendsfollowingRogers’
innovation model [Q14], basic daily activities [Q15-17], information resources [Q18] and
opportunities for understanding science and technology [Q19]. Questions 18 and 19 served to
followthefirstthreequestionsfromtheVictoriansegmentmodel.
8
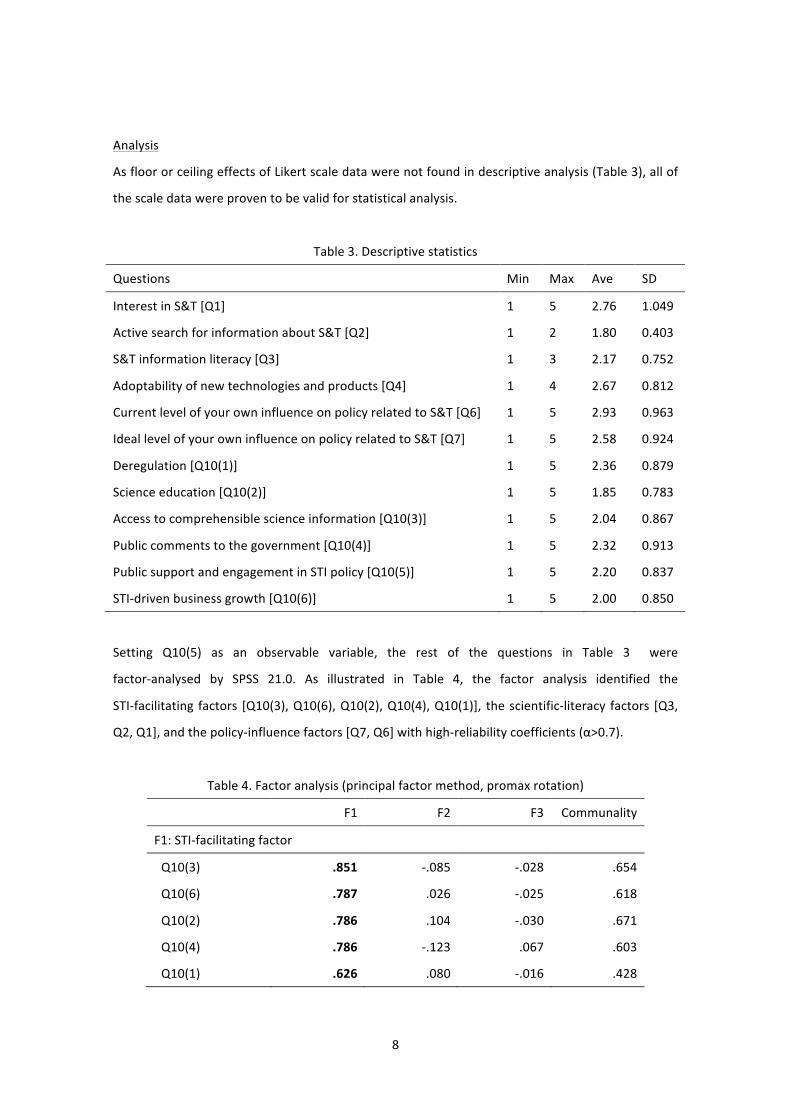
Analysis
AsfloororceilingeffectsofLikertscaledatawerenotfoundindescriptiveanalysis(Table3),allof
thescaledatawereproventobevalidforstatisticalanalysis.
Table3.Descriptivestatistics
Questions Min Max Ave SD
InterestinS&T[Q1] 1 5 2.76 1.049
ActivesearchforinformationaboutS&T[Q2] 1 2 1.80 0.403
S&Tinformationliteracy[Q3] 1 3 2.17 0.752
Adoptabilityofnewtechnologiesandproducts[Q4] 1 4 2.67 0.812
CurrentlevelofyourowninfluenceonpolicyrelatedtoS&T[Q6] 1 5 2.93 0.963
IdeallevelofyourowninfluenceonpolicyrelatedtoS&T[Q7] 1 5 2.58 0.924
Deregulation[Q10(1)] 1 5 2.36 0.879
Scienceeducation[Q10(2)] 1 5 1.85 0.783
Accesstocomprehensiblescienceinformation[Q10(3)] 1 5 2.04 0.867
Publiccommentstothegovernment[Q10(4)] 1 5 2.32 0.913
PublicsupportandengagementinSTIpolicy[Q10(5)] 1 5 2.20 0.837
STI-drivenbusinessgrowth[Q10(6)] 1 5 2.00 0.850
Setting Q10(5) as an observable variable, the rest of the questions in Table 3 were
factor-analysed by SPSS 21.0. As illustrated in Table 4, the factor analysis identified the
STI-facilitating factors [Q10(3),Q10(6),Q10(2),Q10(4),Q10(1)], thescientific-literacy factors [Q3,
Q2,Q1],andthepolicy-influencefactors[Q7,Q6]withhigh-reliabilitycoefficients(α>0.7).
Table4.Factoranalysis(principalfactormethod,promaxrotation)
F1 F2 F3 Communality
F1:STI-facilitatingfactor
Q10(3) .851 -.085 -.028 .654
Q10(6) .787 .026 -.025 .618
Q10(2) .786 .104 -.030 .671
Q10(4) .786 -.123 .067 .603
Q10(1) .626 .080 -.016 .428

9
F2:Science-literacyfactor
Q3 .009 .722 -.031 .508
Q2 -.103 .718 -.093 .427
Q1 .102 .585 .129 .495
Q4 .062 .302 .195 .210
F3:Policy-influencefactor
Q7 -.001 -.008 .817 .660
Q6 -.032 -.018 .705 .466
Factorloading 4.259 1.677 1.190
Contribution 34.769 10.749 6.642
Coefficientα .874 .709 .722
The stepwise multiple linear regression analysis, considering the above three factors as
independentvariablesandQ10(5)asadependentvariable,showedthattheSTI-facilitatingfactor
(F1) and the policy-influence factor (F3) are statistically significant at the 0.1% level, but the
science-literacyfactor(F2)isnotstatisticallysignificant(p=0.085).Reflectingthisresult,thesecond
stepwisemultiplelinearregressionanalysismorepreciselyidentifiedfourindependentvariablesas
statistically significant at the 0.1% level: (1) deregulation [Q10(1)], (2) access to comprehensible
scienceinformation[Q10(3)],(3)publiccommentstothegovernment[Q10(4)],and(4)STI-driven
businessgrowth[Q10(6)](Table5).
Table5.Factorsinpublicengagement
Independentvariable Coefficient Significance
Q10(1) .099 .000
Q10(3) .163 .000
Q10(4) .223 .000
Q10(6) .427 .000
Q6 .059 .014
Q7 .095 .032
R2 .661
R2adjusted .658
Fvalue 284.338 0.000
10
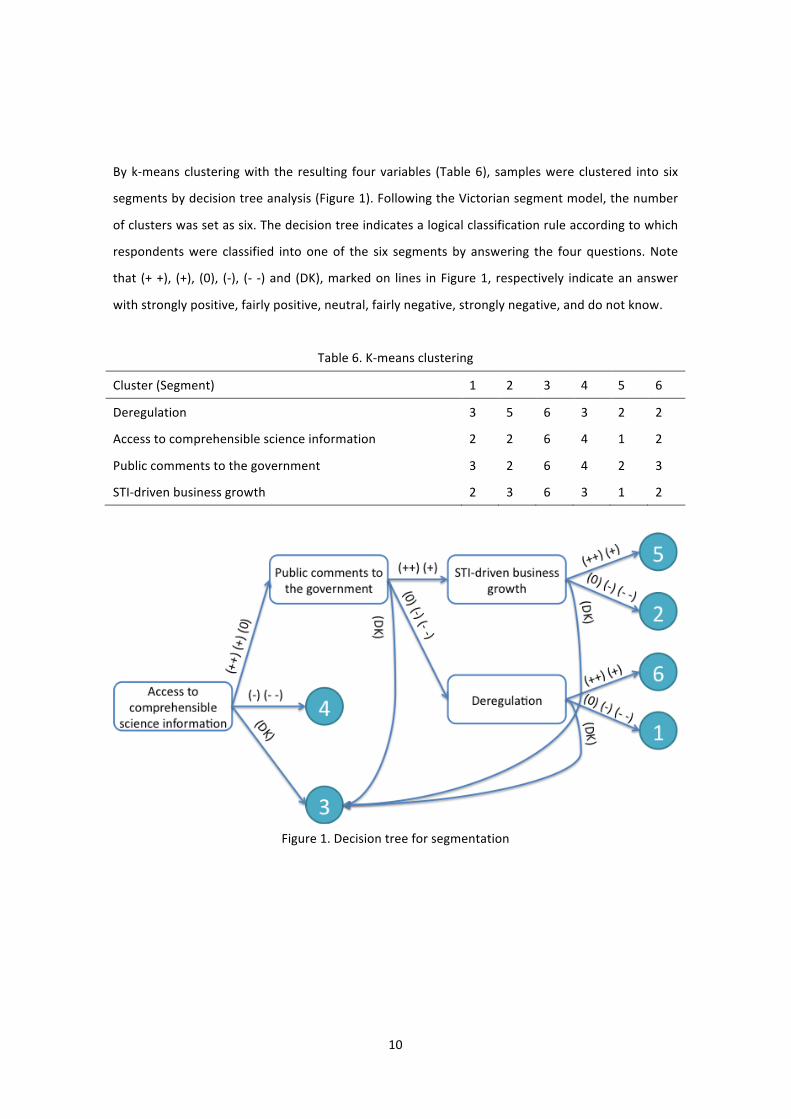
Byk-meansclusteringwith the resulting fourvariables (Table6), sampleswereclustered intosix
segmentsbydecisiontreeanalysis(Figure1).FollowingtheVictoriansegmentmodel,thenumber
ofclusterswassetassix.Thedecisiontreeindicatesalogicalclassificationruleaccordingtowhich
respondentswere classified intooneof the six segments by answering the four questions.Note
that (++), (+), (0), (-), (- -)and (DK),markedon lines inFigure1, respectively indicateananswer
withstronglypositive,fairlypositive,neutral,fairlynegative,stronglynegative,anddonotknow.
Table6.K-meansclustering
Cluster(Segment) 1 2 3 4 5 6
Deregulation 3 5 6 3 2 2
Accesstocomprehensiblescienceinformation 2 2 6 4 1 2
Publiccommentstothegovernment 3 2 6 4 2 3
STI-drivenbusinessgrowth 2 3 6 3 1 2
Figure1.Decisiontreeforsegmentation
11
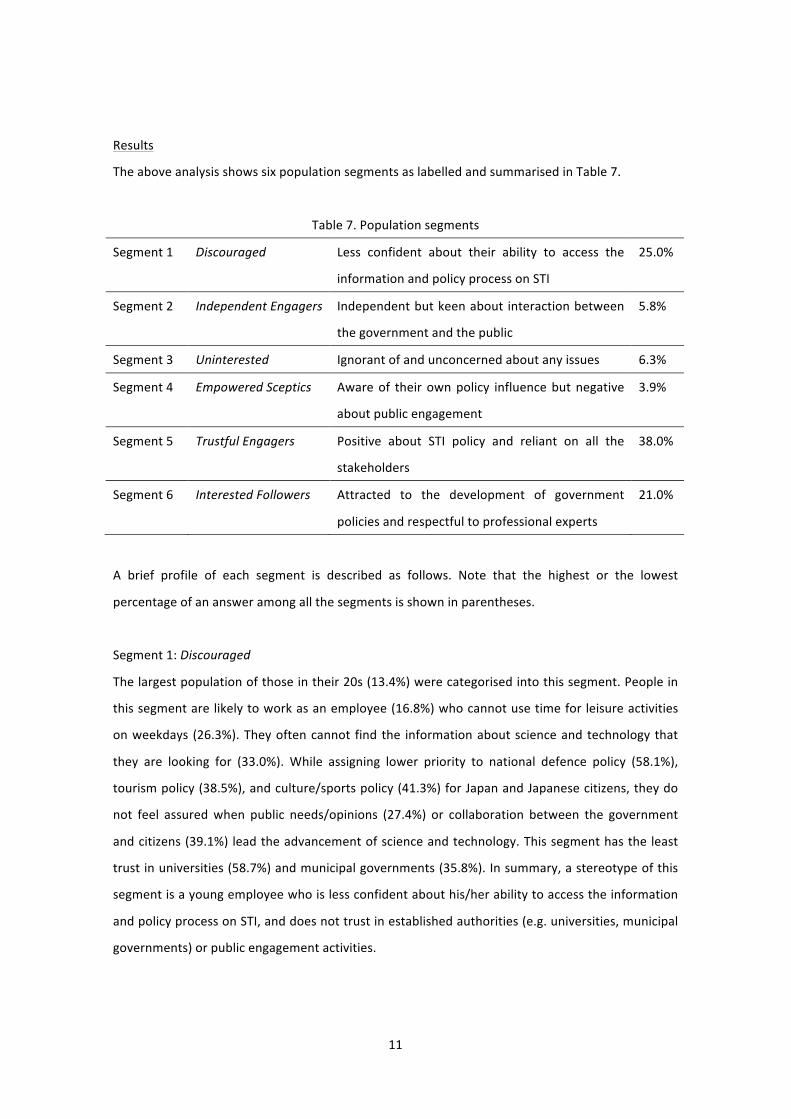
Results
TheaboveanalysisshowssixpopulationsegmentsaslabelledandsummarisedinTable7.
Table7.Populationsegments
Segment1 Discouraged Less confident about their ability to access the
informationandpolicyprocessonSTI
25.0%
Segment2 IndependentEngagers Independentbutkeenabout interactionbetween
thegovernmentandthepublic
5.8%
Segment3 Uninterested Ignorantofandunconcernedaboutanyissues 6.3%
Segment4 EmpoweredSceptics Awareof their ownpolicy influencebutnegative
aboutpublicengagement
3.9%
Segment5 TrustfulEngagers Positive about STI policy and reliant on all the
stakeholders
38.0%
Segment6 InterestedFollowers Attracted to the development of government
policiesandrespectfultoprofessionalexperts
21.0%
A brief profile of each segment is described as follows. Note that the highest or the lowest
percentageofanansweramongallthesegmentsisshowninparentheses.
Segment1:Discouraged
Thelargestpopulationofthoseintheir20s(13.4%)werecategorisedintothissegment.Peoplein
thissegmentarelikelytoworkasanemployee(16.8%)whocannotusetimeforleisureactivities
onweekdays (26.3%).Theyoftencannot find the informationaboutscienceandtechnology that
they are looking for (33.0%). While assigning lower priority to national defence policy (58.1%),
tourismpolicy(38.5%),andculture/sportspolicy(41.3%)forJapanandJapanesecitizens,theydo
not feel assuredwhen public needs/opinions (27.4%) or collaboration between the government
andcitizens(39.1%)leadtheadvancementofscienceandtechnology.Thissegmenthastheleast
trustinuniversities(58.7%)andmunicipalgovernments(35.8%).Insummary,astereotypeofthis
segmentisayoungemployeewhoislessconfidentabouthis/herabilitytoaccesstheinformation
andpolicyprocessonSTI,anddoesnottrustinestablishedauthorities(e.g.universities,municipal
governments)orpublicengagementactivities.

12
Segment2:IndependentEngagers
This segment has self-employed workers in commercial, manufacturing, and service industries
(10.7%),aswellasotherindustries(10.7%).Theyoftenusetheradioasaninformationsourcefor
science and technology (22.7%). They observe science and technology developed by universities
(53.3%)andscienceandtechnologyinformationprovidedbyleadingJapanesecompanies(24.0%)
asnottrustable.Theyalsofeelthattherearetoomany issuesforJapan inpolicymaking(82.7%),
but they allocated budget based on their personal point of view instead of a policymaker’s
viewpoint(62.7%).Thissegmentisthemostkeentoreceiveacopyofthissurveyresult(58.7%).In
summary,astereotypeofthissegment isaself-employedworkerwho israther interested inthe
interactionbetweenthegovernmentandthepublic.
Segment3:Uninterested
Females(80.2%)andindividualsintheir70s(53.8%)dominatethissegment,whilepeopleintheir
20s,30sand40sareleastlikelytobeclassedinthissegment.Mostofthemlivewiththeirchildren
(86.8%)inasmallcity(34.0%)andtendtoundertakelabourwork(33.3%).Theydonotfrequently
go outwith their friends and acquaintances (42.5%). They have time for leisure activities in the
daytime onweekdays (42.5%), but do not visit a specific place. They are the least interested in
scienceand technology (24.5%),and the leastactive in searching for informationonscienceand
technology(1.9%).Theyalsodonotactivelyusenewtechnologiesorproducts(28.3%).Theydonot
indicate any policies as important, and any organizations as trustable to developing science and
technologyortoprovidesuch information. Insummary,astereotypeofthissegment isa female
homemakerinher70s,whoisignorantofandunconcernedwithanyissues–whetherSTI-related,
policy-related,ornot.
Segment4:EmpoweredSceptics
Thissegmentlargelyconsistsofbachelors(42.4%).Italsohasrelativelyhigh-income(between6-8
million yenper year)workers (24.2%).Mostofpeople in this segmentobserve that theydonot
have enough opportunities to deepen interest in and understanding of science and technology
(64.2%).Whiletheyarefairlyinterestedinscienceandtechnology,theyseemlessinterestedinany
kind of public policy. Their distrust of policy is also evident from the figure that, among all the
segments,theytrustleastincollaborationbetweenthegovernmentandleadingcompaniesforthe
development of science and technology (39.4%) and the government for the dissemination of
information on science and technology (21.4%). They do not even trust in scientists for the
13
dissemination of information (45.5%). In summary, a stereotype of this segment is a relatively
educated,high-incomeworkerwho isawareofhis/herownpolicy influence,but feelsnegatively
about ongoing public engagement activities, reflecting the general distrust in policy and science
experts.
Segment5:TrustfulEngagers
Thissegmentispolarisedbetweenlow-income(between2-4millionyen/year)households(29.2%)
and high-income (between 10-15 million yen/year) households (4.2%). It also has the lowest
percentageof thosewhodonot frequentlygooutwith their friendsandacquaintances (26.7%).
People in this segment find sufficient opportunities for public engagement in science and
technology (42.1%), while actively searching for information on science and technology by
themselves (23.1%). They utilise various information sources, including TV (88.6%), newspapers
andmagazines(70.2%),andlibraries(12.3%).Theyalsobelievethattheyhave(40.1%)andshould
have (65.5%) theirown influenceon issues related to scienceand technology. In their view, any
kindofpolicyistobeprioritisedandanykindoforganization,person,orcollaborationistobewell
performed in the development of science and technology. Science education is oneof themost
promisingwaystoadvanceSTI (92.8%).Thebudgetallocationsimulationmadethemthinkabout
thegovernmentpolicy(65.2%),throughwhichthey,aspolicymakers,thinkthattherearetoomany
unnecessary policies (41.8%) and the budget is too limited for the number of issues (73.8%). In
summary, a stereotype of this segment is positive about STI policy and reliant on all of the
stakeholders.
Segment6:InterestedFollowers
Males(60.6%)and individuals intheir30s(16.7%)arethemajorpopulationofthissegment.This
segmenthasthelowestrateofrespondentswhohavechildren(68.2%).Peopleinthissegmentare
likelytohavevisiteddifferent leisurefacilities,suchasamusementparks(35.6%),sportsgrounds
(31.8%),museums (27.3%)andpachinko (13.6%). Theyalsohavevarious information sourceson
science and technology, such as the internet (60.6%), books (28.0%), promotions at companies,
advertisements, catalogues (20.5%), and symposium, lectures, and events at universities and
researchinstitutions(10.6%).Theyareclearlyinterestedinscienceandtechnology(56.8%),being
confidentinfindinginformationtheywerelookingfor(22.7%).Forthem,universitiesarereliablein
the development of science and technology (78.0%) and trust well-known scientists in the
dissemination of information (89.4%). They express a relatively neutral attitude toward
14
policymaking, but face difficulty in budget allocation (90.2%). In summary, a stereotype of this
segment isasingleman inhis30s,whohasrelativelyamplesparetimeforhisown.Havinghigh
interestandliteracyinscienceandtechnology,heisattractedtothedevelopmentofgovernment
policiesandrespectfultoprofessionalexperts.
Discussion
Theaboveresults illustratethattherearedifferentviewsonpublicengagement inSTIpolicyand
suggest that the government should takedifferent approaches todifferent population segments
forthisengagement.Forinstance,trustfulengagers(Seg.5)andindependentengagers(Seg.2)are
thosewhowillinglyparticipateinconventionalengagementpolicies,whereasthegovernmentmay
needtoprovidethediscouraged(Seg.1)withtangibleinformationtostimulatebasicinterestand
impress interested followers (Seg. 6) with the policy relevance of public engagement. For
empoweredsceptics (Seg.4)andtheuninterested (Seg.3), thegovernmentmustbepatientand
continuetotrytomaketheminformed,interestedandinvolvedinSTIpolicy.Itisnoteworthythat
only four questions are sufficient to characterise the six population segments for public
engagement in STI policy. Despite reservations that evidence is just a source for policymaking
(Nutley,Walter&Davies2007),theterm‘evidence’incorporatesuncertainandambiguousrealities
incertainpolicyagendasforwhichpublicopinioncanbemobilised(Pawson2011;Pawson&Wong
2013). By broadening the range of data collected, opening up diverse perspectives in policy
appraisal(Rafolsetal.2012),andfacilitatingreflexiveandrelationallearning(Felt&Wynne2007;
Chilvers&Kearnes2016),thissegmentmodeldemonstratespracticalfeasibility,globalapplicability,
andmethodologicalextendibility.
Acknowledgements
This study is basedon the ‘Framework for BroadPublic Engagement in Science, Technology and
InnovationPolicy’ (PESTI)project fundedbytheResearch InstituteofScienceandTechnology for
Society(RISTEX)inJapan.ThepublicationofthisarticlehasbeengreatlymotivatedbytheSciREX
CenterattheNationalGraduateInstituteforPolicyStudies(GRIPS).Theauthorswouldalsoliketo
thankNoriko Suzuki andNobuya Fujiwara for their statistical elaboration (Suga et al. 2016) and
PESTImembersfortheirpracticalapplicationofthissegmentmodel.

15
Annex
1. Surveyquestionnaire
2. Infographicsofthesurveyoverview
3. Infographicsofthepopulationsegments
References
Asano,H.(2010)BasisofLatestMarketingScience[inJapanese].Kodansha.
Banks,G.(2009)“Evidence-basedpolicymaking:Whatisit?Howdowegetit?”ANUPublicLecture
Series.ProductivityCommission,Canberra.
Bauer, M.W., Allum, N. & Miller, S. (2007) “What can we learn from 25 years of PUS survey
research? Liberating and expanding the agenda,” Public Understanding of Science 16(1):
79-95.
Caplan,N. (1979)“The two-communities theoryandknowledgeutilization,”AmericanBehavioral
Scientist22(3):459-470.
Castell, S.,Charlton,A.,Clemence,M.,Pettigrew,N.,Pope,S.,Quigley,A.,Shah J.N.&Silman,T.
(2014)PublicAttitudestoScience2014:MainReport.URNBIS/14/P111,IpsosMORI.
Chilvers,J.&Kearnes,M.,eds.(2016)RemakingParticipation:Science,EnvironmentandEmergent
Publics.Routledge.
Ernø-Kjølhede, E. & Hansson, F. (2011) “Measuring research performance during a changing
relationshipbetweenscienceandsociety,”ResearchEvaluation20(2):131-143.
Felt,U.&Wynne,B.(2007)ScienceandGovernance:TakingEuropeanKnowledgeSocietySeriously.
ReportoftheExpertGrouponScienceandGovernancetotheScience,EconomyandSociety
Directorate,Directorate-GeneralforResearch.Brussels:EuropeanCommission.
Glasby,J.&Beresford,P. (2006)“Whoknowsbest?Evidence-basedpracticeandtheserviceuser
contribution,”CriticalSocialPolicy26(1):268-284.
Godin, B. & Doré, C. (2005)Measuring the Impact of Science: Beyond the Economic Dimension.
UrbanisationINRS,CultureetSociété.HelsinkiInstituteforScienceandTechnologyStudies.
Gough,D.(2007)“Weightofevidence:aframeworkfortheappraisalofthequalityandrelevance
ofevidence,”ResearchPapersinEducation22(2):213-228.
Head, B.W. (2008) “Three lenses of evidence-based policy,” Australian Journal of Public
Administration67(1):1-11.
Head, B.W. (2010) “Reconsidering evidence-based policy: key issues and challenges,” Policy and
Society29(2):77-94.
16
Head,B.W.(2013)“Evidence-basedpolicymaking—speakingtruthtopower?”AustralianJournalof
PublicAdministration72(4):397-403.
Hennen, L. (2015) “Increasing public engagement in R&I: outcomes of the Engage2020 project,”
presented at Engaging Society in Responsible Research and Innovation: What’s Next?,
Brussels,November9,2015.
Jasanoff,S.(2005)DesignonNature.PrincetonUniversityPress.
Leigh,A.(2009)“Whatevidenceshouldsocialpolicymakersuse?”EconomicRoundup1:27-43.
Lipsky,M.(1971)“Socialscientistsandtheriotcommission,”AnnalsoftheAmericanAcademyof
PoliticalandSocialScience394(1):72-83.
Nelson, R.R. (1974) “Intellectualizing about the moon-ghetto metaphor: a study of the current
malaiseofrationalanalysisofsocialproblems,”PolicySciences5(4):375-414.
Kano, K. (2014) “Toward achieving broad public engagement with science, technology, and
innovation policies: trials in JAPAN Vision 2020,” International Journal of Deliberative
MechanismsinScience3(1):1-23.
Kano,K.,Suga,M.,Yoshizawa,G.,Kudo,M.,Mizumachi,E.,Goto,T.&Ebina,K.(2016)“Engaging
thepublic inSTIpolicymaking:usingsegmentationmethodasan indicator for scienceand
society,” presented at OECD Blue Sky III: Towards the Next Generation of Data and
Indicators,19-21September,Ghent,Belgium.
Kotler,P.&Lee,N.R.(2007)SocialMarketing:InfluencingBehaviorsforGood,3rded.Sage.
Lasswell, H.D. (1951) “The policy orientation,” pp. 3-15 in Lerner, D. & Lasswell, H.D. (eds.) The
PolicySciences.StanfordUniversityPress.
Maenami, H., Yoshizawa, G. & Kano, K. (2016) “‘Interactive public comment’ for regional policy
makingandevaluation[inJapanese],”JapaneseJournalofRegionalPolicyStudies16:38-47.
Mingers, J. (2008) “Management knowledge and knowledgemanagement: realism and forms of
truth,”KnowledgeManagementResearch&Practice6(1):62-76.
Moedas, C. (2015) “Open innovation, open science, open to theworld,” speech given atANew
Start for Europe: Opening Up to an ERA of Innovation, 22 June 2015. Available at
http://europa.eu/rapid/press-release_SPEECH-15-5243_en.htm
Moore,G.A.(2014)CrossingtheChasm:MarketingandSellingDisruptiveProductstoMainstream
Customers,3rded.HarperCollinsPublishers.
Neresini, F.&Bucchi,M. (2011) “Which indicators for thenewpublic engagementactivities?An
exploratorystudyofEuropeanresearchinstitutions,”PublicUnderstandingofScience20(1):
64-79.
17
Nissen, S. (2014) “The Eurobarometer and the process of European integration:methodological
foundations and weaknesses of the largest European survey,” Quality & Quantity 48(2):
713-727.
Nutley, S., Walter, I. & Davies, H.T.O. (2003) “From knowing to doing: a framework for
understandingtheevidence-into-practiceagenda,”Evaluation9(2):125-148.
Pardo, R. & Calvo, F. (2002) “Attitudes toward science among the European public: a
methodologicalanalysis,”PublicUnderstandingofScience11(2):155-195.
Parsons,W.(2002)“Frommuddlingthroughtomuddlingup.Evidencebasedpolicy-makingandthe
modernisationofBritishGovernment,”PublicPolicyandAdministration17(3):43-60.
Pawson,R.,Wong,G.&Owen,L.(2011)“Knownknowns,knownunknowns,unknownunknowns:
thepredicamentofevidence-basedpolicy,”AmericanJournalofEvaluation32(4):518-546.
Pawson,R.&Wong,G. (2013)“Publicopinionandpolicy-making,”SocialPolicy&Administration
47(4):434-450.
Rafols, I.,Ciarli, T., vanZwanenberg,P.&Stirling,A. (2012) “Towards indicators for ‘openingup’
science and technology policy,” Proceedings of 17th International Conference on Science
andTechnologyIndicators,pp.675-682.
Rhodes, R.A.W. (1996) “The new governance: governing without government,” Political Studies
44(4):652-667.
Rogers,E.(1983)DiffusionofInnovation.NewYork:FreePress.
Rowe, G., Horlick-Jones, T., Walls, J. & Pidgeon, N. (2005) “Difficulties in evaluating public
engagement initiatives: reflections on an evaluation of the UKGMNation? public debate
abouttransgeniccrops,”PublicUnderstandingofScience14(4):331-352.
Rowe,G.,Horlick-Jones,T.,Walls,J.,Poortinga,W.&Pidgeon,N.F.(2008)“Analysisofanormative
framework forevaluatingpublicengagementexercises: reliability,validityand limitations,”
PublicUnderstandingofScience17(4):419-441.
Rycroft-Malone, J., Seers, K., Titchen, A., Harvey, G., Kitson, A. &McCormack, B. (2004) “What
countsasevidenceinevidence-basedpractice?”JournalofAdvancedNursing47(1):81-90.
Sanz-Menéndez, L., Van Ryzin, G.G. & del Pino, E. (2013) “Citizens’ support for government
spendingonscienceandtechnology,”ScienceandPublicPolicy41(5):611-624.
Sebba, J. (2004) “Developing evidence-informed policy and practice in education,” pp. 34-43 in
Thomas, G. & Pring, R. (eds.) Evidence-Based Practice in Education. Maidenhead: Open
UniversityPress.
Sellar, S. & Lingard, B. (2014) “The OECD and the expansion of PISA: new global modes of

18
governanceineducation,”BritishEducationalResearchJournal40(6):917-936.
Shonkoff, J.P. (2000)“Science,policy,andpractice: threecultures insearchofasharedmission,”
ChildDevelopment71(1):181-187.
Smith, W.R. (1956) “Product differentiation and market segmentation as alternative marketing
strategies,”JournalofMarketing21(1):3-8.
State of Victoria (2008) Community Interest and Engagement with Science and Technology in
VictoriaResearchReport-June2007,preparedfortheVictorianDepartmentofInnovation,
IndustryandRegionalDevelopment.Availableat
http://dsdbi.vic.gov.au/__data/assets/pdf_file/0018/1005444/2007-research-report.pdf
Suga,M.,Suzuki,N.,Fujiwara,N.,Yoshizawa,G.,Kudo,M.&Kano,K.(2016)Developmentofanew
segmentation for broad public engagement in science, technology and innovation policy:
fromanopinionpollonscience,technologyandinnovation[inJapanese].VentureReview,in
preparation.
Torgerson, D. (1986) “Interpretive policy inquiry: a response to its limitations,” Policy Sciences
19(4):397-405.
Tsipouri, L. (2012) “Comparing innovation performance and science in society in the European
memberstates,”ScienceandPublicPolicy39(6):732-740.
Vigier,P.(2007)“Towardsacitizen-driveninnovationsysteminEurope:agovernanceapproachfor
aEuropeaninnovationagenda,”Innovation20(3):191-202.
Wesselink,A.,Colebatch,H.&Pearce,W. (2014)“Evidenceandpolicy:discourses,meaningsand
practices,”PolicySciences47(4):339-344.
Young,K.,Ashby,D.,Boaz,A.&Grayson,L. (2002)“Social scienceandtheevidence-basedpolicy
movement,”SocialPolicy&Society1(3):215-224.
1
No. 0077
Awareness survey on life and science & technology
December 2013
(Survey planned by) Institute for Integrated Cell-Material Sciences, Kyoto University
Science Communication Group
(Survey implemented by) Central Research Services, Inc.
Branch No. Point No. Target No. Inspected by
(1-7) (8-10)=101
Q1. [Answer sheet 1] How much are you interested in science and technology? Please select only one. (11)
1 2 3 4 5 6
(a) (b) (c) (d) (e)
Very interested Quite
interested
Neither
interested nor
disinterested
Not very
interested
Not interested
at all
Don’t know
Q2. Do you actively search for information about science and technology? (12)
1 Yes 2 No 3 Don’t know
Q3. [Answer sheet 2] When you have looked for information about science and technology in the past,
have you generally been able to find what you were looking for? Please select the closest answer. (13)
1 (a) Yes, and it tends to be easy to understand
2 (b) Yes, but it is often difficult to understand
3 (c) No, I often can’t find what I am looking for
4 Don’t know
Q4. [Answer sheet 3] Which of the following statements would you say best describes how you feel
about new technology and products? Please select one. (14)
1 (a) I always try new technologies and products before anyone else does
2 (b) I always use new technologies and products after observing some people
who try them
3 (c) I always use new technologies and products after observing most of
the people around me try them
4 (d) I do not actively use new technologies or products
5 Don’t know
Go to Q5, Q5SQ in the following page.
Go to Q6 in the
following page.

2
(For those who answered “Don’t know” in Q5 and Q5S and Q4.)
Q5. [Answer sheet 4] Do the following items 1) – 3) raise your expectation for science and technology,
or science, technology and innovation policy? Please mark for individual item. Consider science,
technology and innovation as creating intellectual/cultural value based on scientific findings and
inventions, and innovation that develops and connects this knowledge with economic, social and
public value. Firstly, does “Civil perspective is incorporated into the policy” raise your
expectation? (Note on survey: Mark for item 1) – 3) individually.)
(a)
(b)
(c)
(d)
(e)
1) Incorporating a civil perspective
into the policy・・・・・・・・・・・・・・・・・・・・・・・・・・ …1… …2… …3… …4… …5… …6… (15)
2) Creating a structure for citizens to
participate in policy-making・・・・・・・・・ …1… …2… …3… …4… …5… …6… (16)
3) Citizens can feel that the policies
they need are implemented・・・・・・・・・・ …1… …2… …3… …4… …5… …6… (17)
Q5SQ. Please write anything else you expect of science and technology or science, technology and
innovation. If not, please circle “No.”
2 No
(18)
(To all respondents)
Q6. [Answer sheet 5] How much influence if any, do you feel you personally have on policy making
about science and technology issues that are important to you? Please select one. (19)
1 2 3 4 5
(a) (b) (c) (d)
A great deal A fair amount Not very much None at all Don’t know
Q7. [Answer sheet 6] How much influence if any, do you think you personally should have on policy
making about science and technology issues that are important to you? Please select one. (20)
1 2 3 4 5
(a) (b) (c) (d)
A great deal A fair amount Not very much None at all Don’t know
Neutral
Don’t kn
ow
Not very m
uch
Not at all
It does
very much.
It does a
little
3
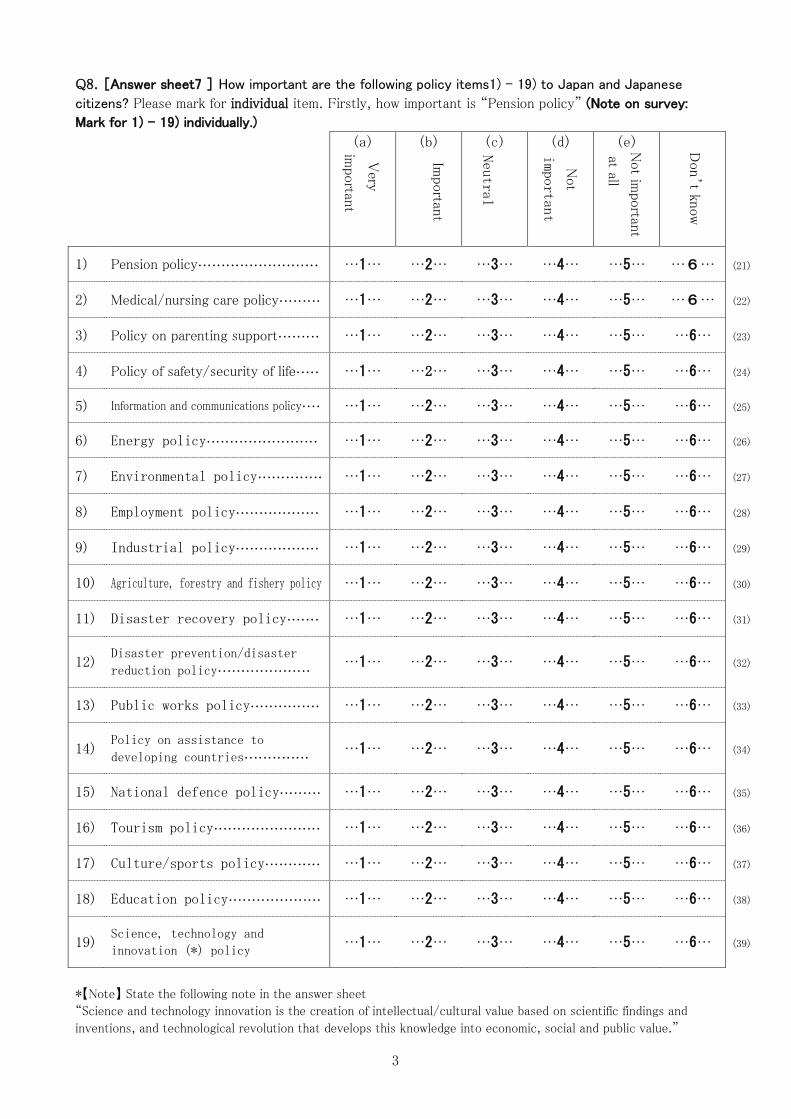
Q8. [Answer sheet7 ] How important are the following policy items1) – 19) to Japan and Japanese
citizens? Please mark for individual item. Firstly, how important is “Pension policy” (Note on survey:
Mark for 1) – 19) individually.)
(a)
(b)
(c)
(d)
(e)
1) Pension policy・・・・・・・・・・・・・・・・・・・・・・・・・・ …1… …2… …3… …4… …5… …6… (21)
2) Medical/nursing care policy・・・・・・・・・ …1… …2… …3… …4… …5… …6… (22)
3) Policy on parenting support・・・・・・・・・ …1… …2… …3… …4… …5… …6… (23)
4) Policy of safety/security of life・・・・・ …1… …2… …3… …4… …5… …6… (24)
5) Information and communications policy・・・・ …1… …2… …3… …4… …5… …6… (25)
6) Energy policy・・・・・・・・・・・・・・・・・・・・・・・・ …1… …2… …3… …4… …5… …6… (26)
7) Environmental policy・・・・・・・・・・・・・・ …1… …2… …3… …4… …5… …6… (27)
8) Employment policy・・・・・・・・・・・・・・・・・・ …1… …2… …3… …4… …5… …6… (28)
9) Industrial policy・・・・・・・・・・・・・・・・・・ …1… …2… …3… …4… …5… …6… (29)
10) Agriculture, forestry and fishery policy …1… …2… …3… …4… …5… …6… (30)
11) Disaster recovery policy・・・・・・・ …1… …2… …3… …4… …5… …6… (31)
12) Disaster prevention/disaster
reduction policy・・・・・・・・・・・・・・・・・・・・ …1… …2… …3… …4… …5… …6… (32)
13) Public works policy・・・・・・・・・・・・・・・ …1… …2… …3… …4… …5… …6… (33)
14) Policy on assistance to
developing countries・・・・・・・・・・・・・・ …1… …2… …3… …4… …5… …6… (34)
15) National defence policy・・・・・・・・・ …1… …2… …3… …4… …5… …6… (35)
16) Tourism policy・・・・・・・・・・・・・・・・・・・・・・・ …1… …2… …3… …4… …5… …6… (36)
17) Culture/sports policy・・・・・・・・・・・・ …1… …2… …3… …4… …5… …6… (37)
18) Education policy・・・・・・・・・・・・・・・・・・・・ …1… …2… …3… …4… …5… …6… (38)
19) Science, technology and
innovation (*) policy …1… …2… …3… …4… …5… …6… (39)
*【Note】 State the following note in the answer sheet
“Science and technology innovation is the creation of intellectual/cultural value based on scientific findings and
inventions, and technological revolution that develops this knowledge into economic, social and public value.”
Neutral
important
at all
importan
t
Very
Importan
t
Not
Not im
portan
t
Don’t kn
ow
4
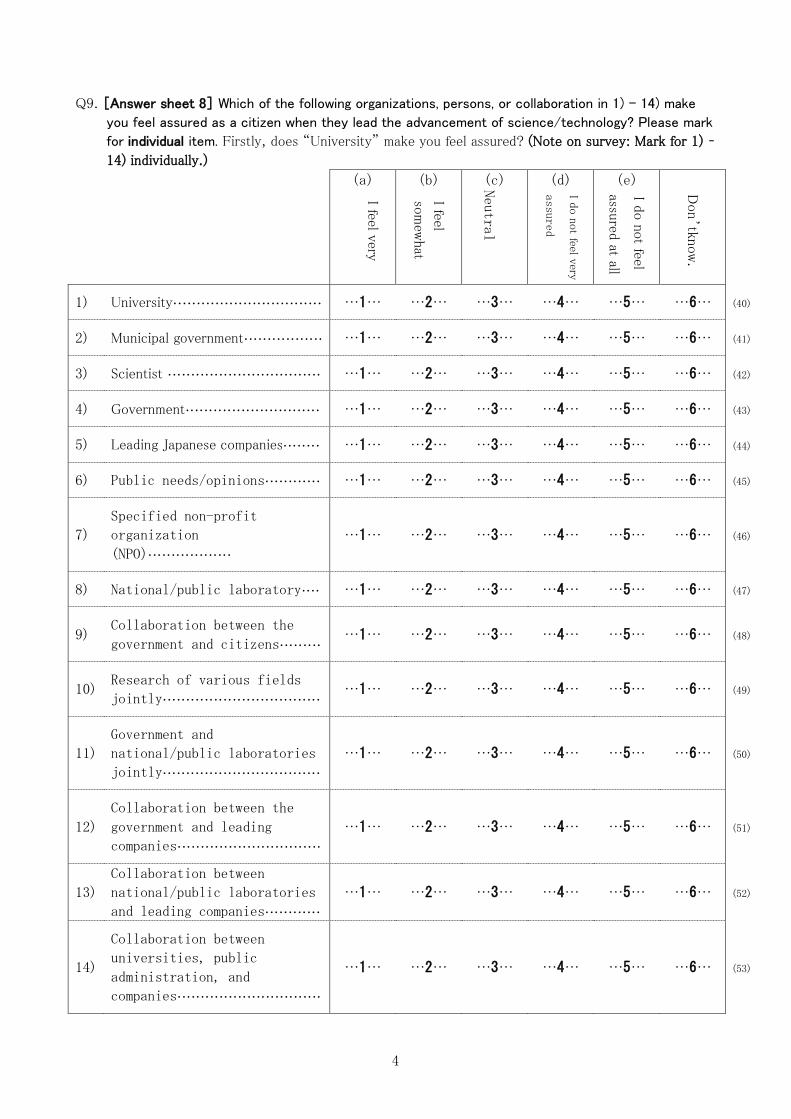
Q9. [Answer sheet 8] Which of the following organizations, persons, or collaboration in 1) - 14) make
you feel assured as a citizen when they lead the advancement of science/technology? Please mark
for individual item. Firstly, does “University” make you feel assured? (Note on survey: Mark for 1) –
14) individually.)
(a)
(b)
(c)
(d)
(e)
1) University・・・・・・・・・・・・・・・・・・・・・・・・・・・・・・・・ …1… …2… …3… …4… …5… …6… (40)
2) Municipal government・・・・・・・・・・・・・・・・・ …1… …2… …3… …4… …5… …6… (41)
3) Scientist ・・・・・・・・・・・・・・・・・・・・・・・・・・・・・・・・・ …1… …2… …3… …4… …5… …6… (42)
4) Government・・・・・・・・・・・・・・・・・・・・・・・・・・・・・ …1… …2… …3… …4… …5… …6… (43)
5) Leading Japanese companies・・・・・・・・ …1… …2… …3… …4… …5… …6… (44)
6) Public needs/opinions・・・・・・・・・・・・ …1… …2… …3… …4… …5… …6… (45)
7)
Specified non-profit
organization
(NPO)・・・・・・・・・・・・・・・・・・
…1… …2… …3… …4… …5… …6… (46)
8) National/public laboratory・・・・ …1… …2… …3… …4… …5… …6… (47)
9) Collaboration between the
government and citizens・・・・・・・・・ …1… …2… …3… …4… …5… …6… (48)
10) Research of various fields
jointly・・・・・・・・・・・・・・・・・・・・・・・・・・・・・・・・・・ …1… …2… …3… …4… …5… …6… (49)
11)
Government and
national/public laboratories
jointly・・・・・・・・・・・・・・・・・・・・・・・・・・・・・・・・・・
…1… …2… …3… …4… …5… …6… (50)
12)
Collaboration between the
government and leading
companies・・・・・・・・・・・・・・・・・・・・・・・・・・・・・・・
…1… …2… …3… …4… …5… …6… (51)
13)
Collaboration between
national/public laboratories
and leading companies・・・・・・・・・・・・
…1… …2… …3… …4… …5… …6… (52)
14)
Collaboration between
universities, public
administration, and
companies・・・・・・・・・・・・・・・・・・・・・・・・・・・・・・・
…1… …2… …3… …4… …5… …6… (53)
Neutral
assu
red
assured at all
I feel very
I do no
t feel very
Don’tkn
ow.
I feel
som
ewhat
I do no
t feel
5
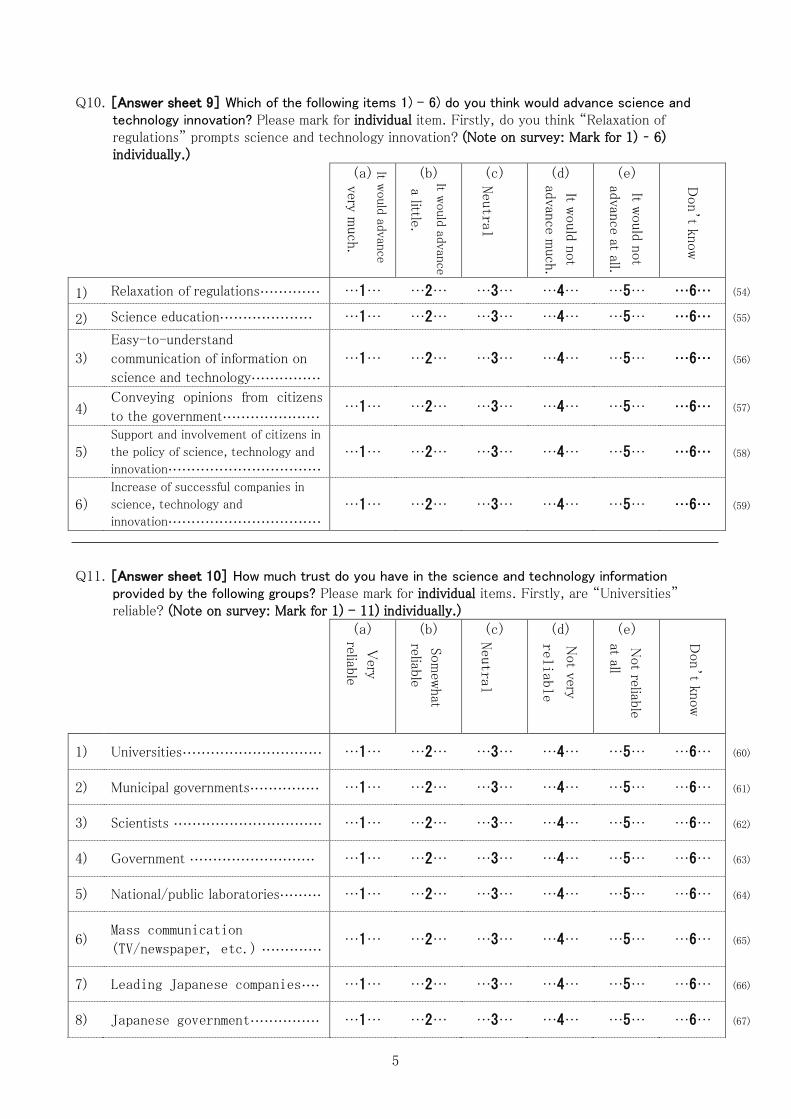
Q10. [Answer sheet 9] Which of the following items 1) – 6) do you think would advance science and technology innovation? Please mark for individual item. Firstly, do you think “Relaxation of regulations” prompts science and technology innovation? (Note on survey: Mark for 1) – 6) individually.)
(a)
(b)
(c)
(d)
(e)
1) Relaxation of regulations・・・・・・・・・・・・・ …1… …2… …3… …4… …5… …6… (54)
2) Science education・・・・・・・・・・・・・・・・・・・・ …1… …2… …3… …4… …5… …6… (55)
3)
Easy-to-understand
communication of information on
science and technology・・・・・・・・・・・・・・・
…1… …2… …3… …4… …5… …6… (56)
4) Conveying opinions from citizens
to the government・・・・・・・・・・・・・・・・・・・・・ …1… …2… …3… …4… …5… …6… (57)
5) Support and involvement of citizens in
the policy of science, technology and
innovation・・・・・・・・・・・・・・・・・・・・・・・・・・・・・・・・・ …1… …2… …3… …4… …5… …6… (58)
6) Increase of successful companies in
science, technology and
innovation・・・・・・・・・・・・・・・・・・・・・・・・・・・・・・・・・ …1… …2… …3… …4… …5… …6… (59)
Q11. [Answer sheet 10] How much trust do you have in the science and technology information
provided by the following groups? Please mark for individual items. Firstly, are “Universities” reliable? (Note on survey: Mark for 1) - 11) individually.)
(a)
(b)
(c)
(d)
(e)
1) Universities・・・・・・・・・・・・・・・・・・・・・・・・・・・・・・ …1… …2… …3… …4… …5… …6… (60)
2) Municipal governments・・・・・・・・・・・・・・・ …1… …2… …3… …4… …5… …6… (61)
3) Scientists ・・・・・・・・・・・・・・・・・・・・・・・・・・・・・・・・ …1… …2… …3… …4… …5… …6… (62)
4) Government ・・・・・・・・・・・・・・・・・・・・・・・・・・・ …1… …2… …3… …4… …5… …6… (63)
5) National/public laboratories・・・・・・・・・ …1… …2… …3… …4… …5… …6… (64)
6) Mass communication
(TV/newspaper, etc.) ・・・・・・・・・・・・・ …1… …2… …3… …4… …5… …6… (65)
7) Leading Japanese companies・・・・ …1… …2… …3… …4… …5… …6… (66)
8) Japanese government・・・・・・・・・・・・・・・ …1… …2… …3… …4… …5… …6… (67)
Neutral
advan
ce much.
advan
ce at all.
Don’t kn
ow
very much.
It would
advan
ce
It would
not
It would
advan
ce
It would
not
reliable
Neutral
reliable
at all
reliable
Very
Not very
Don’t kn
ow
Som
ewhat
Not reliab
le
a little.

6
9) Global companies・・・・・・・・・・・・・・・・・・・・ …1… …2… …3… …4… …5… …6… (68)
10)
Popular TV shows on science and
technology (“Galileo,”
“Kasouken-no-onna,” “Emergency
ward 24,” “Jin,”
etc.) ・・・・・・・・・・・・・・・・・・・・・・・・・・・・・・・・・・・・・
…1… …2… …3… …4… …5… …6… (69)
11)
Well-known scientists (Dr
Koichi Tanaka, Dr Masatoshi
Koshiba, Dr Toshihide Masukawa,
etc.) ・・・・・・・・・・・・・・・・・・・・・・・・・・・・・・・・・・・・
…1… …2… …3… …4… …5… …6… (70)
(8-10)=102
Q12. [Answer sheet 11] Assume Japan’s budget for policymaking is 10. If you are a person in charge of
policymaking, how would you allocate the budget to the following policies 1) – 19)? Please state a
number 0 – 10 to make the total 10. Please give whole numbers. Also note that “0” means that no
budget is given to the policy.
1) Pension policy・・・・・・・・・・・・・・・・・・・・・・・・・・・・・・・・・・・・・・・・・・・・・・・・・ (11-13)
2) Medical/nursing care policy・・・・・・・・・・・・・・・・・・・・・・・・・・・・・・・ (14-16)
3) Policy on parenting support・・・・・・・・・・・・・・・・・・・・・・・・・・・・・・・ (17-19)
4) Policy of safety/security of life・・・・・・・・・・・・・・・・・・・・・・・・・・・・ (20-22)
5) Information and communications policy・・・・・・・・・・・・・・・・・ (23-25)
6) Energy policy・・・・・・・・・・・・・・・・・・・・・・・・・・・・・・・・・・・・・・・・・・・・・・・ (26-28)
7) Environmental policy・・・・・・・・・・・・・・・・・・・・・・・・・・・・・・・・・・・・ (29-31)
8) Employment policy・・・・・・・・・・・・・・・・・・・・・・・・・・・・・・・・・・・・・・・・・ (32-34)
9) Industrial policy・・・・・・・・・・・・・・・・・・・・・・・・・・・・・・・・・・・・・・・・・ (35-37)
10) Agriculture, forestry and fishery policy・・・・・・・・・・ (38-40)
11) Disaster recovery policy・・・・・・・・・・・・・・・・・・・・・・・・・・・・・・ (41-43)
12) Disaster prevention/disaster reduction policy・・・ (44-46)
13) Public works policy・・・・・・・・・・・・・・・・・・・・・・・・・・・・・・・・・・・・・ (47-49)
14) Policy on assistance to developing countries・・・・ (50-52)
15) National defence policy ・・・・・・・・・・・・・・・・・・・・・・・・・・・・ (53-55)
16) Tourism policy・・・・・・・・・・・・・・・・・・・・・・・・・・・・・・・・・・・・・・・・・・・・・ (56-58)
17) Culture/sports policy・・・・・・・・・・・・・・・・・・・・・・・・・・・・・・・・・・ (59-61)

7
18) Education policy・・・・・・・・・・・・・・・・・・・・・・・・・・・・・・・・・・・・・・・・・・ (62-64)
19) Science and technology innovation (*) policy ・・・ (65-67)
Ensure to have whole numbers, and that the total of 1) – 19) is “10.”.
(Note on survey: If the total of 1) - 19) is not “10” or if the numbers include small numbers,
ask the question again as much as possible. Note that “0” means that no
budget is given.)
X Don’t know (68)
Q13. [Answer sheet 12] As you answered Q12 as if you are a person in charge of policymaking, what
did you feel or think? Please mark for individual items. Firstly, what did you think about “It is
difficult to allocate budget from the viewpoint of policymaker”? (Note on survey: mark 1) – 9)
individually.)
(a)
(b)
(c)
(d)
(e)
1)
It is difficult to allocate budget
from the viewpoint of
policymaker・・・・・・・・・・・・・・・・・・・・・・・・・・・・・
…1… …2… …3… …4… …5… …6… (69)
2) More budget should be allocated
to human resources・・・・・・・・・・・・・・・・・・・・ …1… …2… …3… …4… …5… …6… (70)
3) It made me think of the
government’s policies・・・・・・・・・・・・・・・・ …1… …2… …3… …4… …5… …6… (71)
4) We should allocate budget for the
future・・・・・・・・・・・・・・・・・・・・・・・・・・・・・・・・・・・・・ …1… …2… …3… …4… …5… …6… (72)
5) There are too many unnecessary
policies・・・・・・・・・・・・・・・・・・・・・・・・・・・・・・・・・・・ …1… …2… …3… …4… …5… …6… (73)
6) They are all necessary policies・・・・・ …1… …2… …3… …4… …5… …6… (74)
7) There are too many issues for
Japan・・・・・・・・・・・・・・・・・・・・・・・・・・・・・・・・・・・・・・ …1… …2… …3… …4… …5… …6… (75)
8) Budget is too limited for the
number of issues ・・・・・・・・・・・・・・・・・・・・・・ …1… …2… …3… …4… …5… …6… (76)
9)
I allocated budget from my
personal point of view, instead of
policymaker’s viewpoint ・・・・・・・・・・・・・
…1… …2… …3… …4… …5… …6… (77)
Neutral
disagree
Don’t kn
ow
agree
Stro
ngly
Stro
ngly
Agree
Disagree

8
Q13SQ. Please write any other things that you felt or thought while making the budget allocation from
the viewpoint of policymaker. If not, state “No.”
2 No
(78)
Q14. [Answer sheet 13] Do you think you are quick to catch on to a trend? Please select one. (79)
1 2 3 4 5 6
(a) (b) (c) (d) (e)
I think I am
very quick.
I think I am
quick.
Neutral
I don’t think I
am quick.
I don’t think I
am quick at all.
Don’t know
Q15. [Answer sheet 14] Do you go out with your friends and acquaintances? Please select only one. (80)
1 2 3 4 5 6
(a) (b) (c) (d) (e)
Very
frequently
Frequently Neutral Not frequently Very rarely Don’t know
Q16. [Answer sheet 15] When do you use time for leisure activities such as your hobby, culture
lessons and other amusement? Please select all the relevant answers. (81)
1 (a) Daytime between
Monday to Friday
5 (e) Evening on Saturdays
2 (b) Daytime on Saturdays 6 (f) Evening on Sunday and public holidays
3 (c) Daytime on Sunday and
public holidays
7
(g) Never (I cannot take time for leisure.)
4 (d) Evening between
Monday to Friday
8
Don’t know
Q17. [Answer sheet 16] What leisure facilities you have visited in the past one year using your leisure
time? Please select all the relevant answers. (82,83)
1 (a) Library 11 (k) Theme parks and leisure facility including Tokyo
Disneyland, Universal Studios Japan
2 (b) Aquarium/Zoo
3 (c) Botanical garden 12 (l) Pachinko
4 (d) Science museum 13 (m) Horse race/motorboat race/bicycle race
5 (e) Museum 14 (n) Temple or shrine
6 (f) Art museum 15 (o) Pool or gym
7 (g) Movie theatre 16 (p) Sports ground for baseball, soccer, tennis, etc.
8 (h) Theatre 17 (q) Sports stadium
9 (i) Children’s center 18 (r) Other (In specific )
10 (j) Amusement park 19 (s) None of the above
20 Don’t know

9
Q18. [Answer sheet 17] Where do you usually come across information or news on science and
technology? Please select all the relevant answers. (84,85)
1 (a) TV 8 (h) Symposium, lectures, events at universities and
research institutions
2 (b) Radio 9 (i) Promotion event at companies, advertisement,
catalogues
3 (c) Internet 10 (j) Conversations with family and friends
4 (d) Newspaper, magazine 11 (k) Other (In specific )
5 (e) Books 12 (l) None in particular
6 (f) Science
museum/museum 13
Don’t know
7 (g) Library
Q19. [Answer sheet 18] There are opportunities for scientists and engineers to introduce science and
technology in a comprehensive way through experiences at science museums and museums, or
open house of laboratories, lectures and science cafés. In addition, TV programs and articles on
science and technology are introduced on TV, the Internet, newspapers and magazines. Do you
think these opportunities are sufficient to deepen interest and understanding on science and
technology? (86)
1 2 3 4 5
(a) (b) (c) (d)
Strongly
agree
Tend to agree Tend to disagree Strongly
disagree
Don’t know

10
(8-10)=103
Lastly, we would like to ask about yourself in order to analyse your answers statistically.
F1. Gender (Researcher makes a judgment) (11)
1 Male 2 Female
F2. [Answer sheet 19] Which one of the following age groups do you belong to? (12,13)
1 (a) 16 - 19 6 (f) 40 - 44 11 (k) 65 - 69
2 (b) 20 - 24 7 (g) 45 - 49 12 (l) 70 - 74
3 (c) 25 – 29 8 (h) 50 - 54 13 (m) 75 - 79
4 (d) 30 - 34 9 (i) 55 - 59 14 (n) 80 and over
5 (e) 35 - 39 10 (j) 60 - 64
F3. [Question 20] What is your educational background? Consider graduated if you are still in school or
left school without diploma. (14)
1 2 3 4 5 6
(a) (b) (c) (d) (e)
Elementary/junior
high school
(and old-
education-system
elementary school)
High school
(and old-
education-system
junior high school)
Two-year
college/
vocational
school
University
(and old-
education-system
high school)
Graduate
school
Don’t
know
To F5 To F5
F4. (For those who selected ”c” – “e” at F3)
[Answer sheet 21] What is your expertise? Please select only one. (15,16)
1 (a) Science and Engineering
(Physics)
7 (g) Medical
2 (b) Science and Engineering
(Chemistry)
8 (h) Dentistry
3 (c) Science and Engineering
(Biology)
9 (i) Medicine
4 (d) Science and Engineering
(Geology)
10 (j) Other than (a)-(i)
5 (e) Science and Engineering
(Mathematics)
11 Don’t know
6 (f) Agriculture, forestry and
fishery

11
F5. (To all respondents)
[Answer sheet 22] Where did you mainly live until the age of 15? Please select one from the
following category. (17)
1 (a) Major city
2 (b) Suburbs or outskirts of major city
3 (c) Medium-sized city in rural area
4 (d) Town or village in rural area
5 Don’t know

12
F6. [Answer sheet 23] What is your current occupation? Please select one main occupation from the
following list. (18,19)
1 (a) Agriculture, forestry, and fishery
industry (Self-owned)
2 (b) Agriculture, forestry, and fishery
(Family employee)
3 (c) Commercial, manufacturing and
service industries (Self-owned)
4 (d) Commercial, manufacturing and
service industries (Member of
family employee)
5 (e) Freelance (Self-owned)
6 (f) Freelance (Member of family
business)
7 (g) Management position(Employee)
8 (h) Specialist / Technical work
(Employee)
9 (i) Clerical work (Employee)
10 (j) Labor work (Employee)
11 (k) Homemaker (Unemployed)
12 (l) Student (Unemployed)
13 (m) Other (Unemployed)
14 Don’t know To F8
F7. [Answer sheet 24](For those who selected ”k” - ”m” at F6)
What is the occupation you have had the longest period of time? Please select only one from the
following list. (20,21)
1 (a) Agriculture, forestry, and
fishery (Self-owned)
8 (h) Specialist / Technical work
(Employee)
2 (b) Agriculture, forestry, and
fishery (Member of family
business)
9 (i)
Clerical work (Employee)
3 (c) Commercial, manufacturing and
service industries (Self-owned)
10 (j) Labor work (Employee)
4 (d) Commercial, manufacturing and
service industries (Member of
family business)
11 (k)
Homemaker (Unemployed)
5 (e) Freelance (Self-owned) 12 (l) Student (Unemployed)
6 (f) Freelance (Member of family
business)
13 (m) Other (Unemployed)
7 (g) Management position
(Employee)
14 (n) I have never worked before.
15 Don’t know
To F8

13
F8. (To all respondents)Do you have any children? (22)
1 Yes 2 No Go to F10 on the next page.
F9. [Answer sheet 25](For those who selected “Yes” at F8)
Please select current educational status of all of your children. Please select all the relevant items. (23,24)
1 (a) Pre-school 7 (g) Vocational school
2 (b) Lower grade at elementary
school
8 (h) Two-year college
3 (c) Middle grade at elementary
school
9 (i) University
4 (d) Higher grade at elementary
school
10 (k) Graduate school
5 (e) Junior high school 11 (l) Working
6 (f) High school 12 (m) Other (In specific )
13 Don’t know

14
F10. (To all respondents)
[Answer sheet 26] What is the approximate pre-tax income of your entire household per year? (25)
1 (a) Less than 2 million yen 5 (e) Between 8 – 10 million yen
2 (b) Between 2 – 4 million yen 6 (f) Between 10 – 15 million yen
3 (c) Between 4 – 6 million yen 7 (g)) Over 15 million yen
4 (d) Between 6 – 8 million yen 8 Don’t know
F11. We will be publishing the results of this survey on the Internet, and we will be happy to send a copy
to the respondents who are interested. Would you like to receive a copy? (26)
1 Yes 2 No
That completes the survey. Thank you very much for your cooperation.

1Awareness survey on life and science & technology
2,000
887
120000000
800000
No. of sample
No. of valid responses
About
About
1.0%
32.4%
1.1%
Don’t knowNot interested at all
Not very interested
Neither interested nor disinterested
Quite interested
Very interested9.5%
34.0%
32.0%
17.0%
6.3%1.1%
Q1 Q2 Q3How much are you interested in science and technology?
Q6How much influence if any, do you feel you personally have on policy making about science and technologyissues that are important to you?
Q7How much influence if any, do you think you personally should have on policy making about science and technology issues that are important to you?
N/A
Don’t know
No
Yes19.5%
76.6%
2.9%
1.0%N/A0.0%
N/A
Don’t know
No, I often can’t find what I am looking for
Yes, but it is often di�cult to understand
Yes, and it tends to be easy to understand14.1%
27.1%
25.4%
32.4%
1.1%
N/A N/ADon’t know
None at all
Not very much
A fair amount
A great deal7.0%
25.6%
39.0%
24.7%
3.7% Don’t know
None at all
Not very much
A fair amount
A great deal6.0%
49.2%
30.8%
8.9%
5.2%
Q4Which of the following statements would you say bestdescribes how you feel aboutnew technology and products?
N/ADon’t know
I do not actively use new technologies or products
I always use new technologies and products after observing most of the people around me try them
I always use new technologiesand products after observing some people who try them
I always try new technologies and products before anyone else does6.9%
32.6%
43.6%
14.5%
2.4%0.0% 0.0% 0.0%
Do you actively search for information about science and technology?
When you have looked for informationabout science and technology in the past, have you generally been able to find what you were looking for?
Survey public needs/opinions and involvement in science, technology
and innovation policy, to foster the development of a social system
in which citizens can widely participate in the process of policy making.
1 Interest, understanding and information-gathering regarding
science and technology
2 Subjective evaluation of the citizens’ own influence over formation
of policies on science, technology and innovation
3 Various policies in Japan, and citizens’ interest in and evaluation of
science, technology and innovation
4 Organizations/persons/partnerships that contribute to the advancement of
science and technology
5 Attitude to new technologies and new products
6 Lifestyle
* The survey was conducted with the title of “Awareness survey on
life and science & technology.”
SURVEYOVERVIEWOpinion poll on science technology
Objective of the survey
Key items of survey
Design of the survey
Sample planning
Japanese citizens aged 16 and over
No. of points: 140 points
1 Region of survey: The whole country
2 Target of the survey: Japanese citizens aged 16 and over
3 No. of sample: 2,000
4 No. of valid responses: 887 (44.4%)
5 Method of survey: Interview by researcher
6 Period of survey: December 12 – 23, 2013
1 Population: Japanese citizens aged 16 and over
2 No. of sample: 2,000
3 No. of points: 140 points
4 Sampling process: Stratified two-stage random sampling
and innovation

N/A
Don't know
Not important at all
Not important
Neutral
Important
Very important
Science, technology and innovation policy
Education policy
Culture/sports policy
Tourism policy
National defence policy
Policy on assistance to developing countries
Public works policy
Disaster prevention/disaster reduction policy
Disaster recovery policy
Agriculture, forestry and fishery policy
Industrial policy
Employment policy
Environmental policy
Energy policy
Information and communications policy
Policy of safety/security of life
Policy on parenting support
Medical/nursing care policy
Pension policy
Q8 Q9
Q11
Which of the following organizations, persons, or collaboration make you feel assured as a citizenwhen they lead the advancement of science/technology?
How much trust do you have in the scienceand technology information provided by the following groups?
Q13if you are a person in charge of policymaking, what did you feel or think?
25.7
39.9
25.9
4.7
0.7
2.9
0.1
10.9
35.5
37.3
9.7
2.3
4.2
0.1
33.5
36.6
21.0
4.5
0.5
3.7
0.2
16.7
30.4
31.6
13.4
4.6
3.2
16.0
36.9
31.6
9.5
2.5
3.5
0.1
13.9
29.9
40.1
9.7
2.4
4.1
0.0
5.6
26.0
44.6
13.6
3.9
5.9
0.2
27.2
42.8
21.5
3.3
0.6
4.6
0.0
20.3
36.5
31.8
6.0
1.7
3.6
0.1
28.1
43.7
21.0
3.3
0.2
3.6
0.1
27.8
44.9
19.2
3.5
0.7
3.8
0.1
0.1
19.1
39.0
28.1
8.0
2.3
3.5
0.1
25.3
38.4
24.8
5.6
1.5
4.3
0.1
28.1
39.8
23.2
4.4
0.8
3.7
0.0
I do not feelassured at all
I do not feelvery assured
Neutral
I feel somewhat
I feel very
Collaborationbetween universities,
public administration, and companies
Collaboration betweennational/public laboratories
and leading companies
Collaboration betweenthe government and
leading companies
Government and national/public laboratories jointly
Research of variousfields jointly
Collaboration between thegovernment and citizens
National/publiclaboratory
Specified non-profitorganization (NPO)
Publicneeds/opinions
Leading Japanesecompanies
Government
Scientist
Municipalgovernment
University
19.6
52.5
21.0
3.8
0.3
2.7
1.7
2.6
0.0
7.2
42.4
37.3
8.7
0.1
0.3
2.9
28.4
42.8
22.7
2.8
0.0
4.1
2.9
0.5
3.3
23.3
48.9
20.7
3.3
0.0
7.2
3.2
2.5
3.7
4.4
2.8
6.8
35.3
33.6
16.7
0.5
1.2
6.4
12.1
37.1
35.9
7.2
0.1
5.7
6.4
0.3
4.2
39.1
39.2
14.8
2.3
0.1
5.2
24.5
43.4
14.7
0.1
5.9
37.2
39.3
11.3
0.1
3.3
18.6
42.7
24.9
0.1
6.1
34.8
37.2
14.8
0.1
Well-known scientists
Popular TV showson science and technology
Global companies
Japanese government
Leading Japanese companies
Mass communication (TV/newspaper, etc.)
National/public laboratories
Government
Scientists
Municipalgovernments
Universities
44.9
37.9
10.3
3.0
0.5
3.5
0.0
15.1
34.6
37.1
5.2
0.6
7.2
0.2
12.0
41.6
31.3
7.6
1.7
5.9
0.0
29.4
46.3
14.4
2.1
0.6
6.9
0.2
20.6
27.2
33.1
11.4
1.8
5.9
8.1
25.5
38.0
19.1
4.5
4.7
0.1
24.7
47.2
16.9
5.3
0.5
5.3
0.1
24.2
38.6
22.2
7.6
1.0
6.4
0.0
0.0
14.4
36.9
28.7
10.3
2.5
7.2
0.0I allocated budget from
my personal point of view, insteadof policymaker’s viewpoint
Budget is too limitedfor the number of issues
There are too many issuesfor Japan
They are all necessary policies
There are too manyunnecessary policies
We should allocatebudget for the future
It made me think ofthe government’s policies
More budget should beallocated to human resources
It is di�cult to allocate budget from the viewpoint of policymaker
2
How important are the following policyto Japan and Japanese citizens?
N/A
Don't know
Q10Which of the following items do you think would advance science and technology innovation?
[%]
1.1
9.7
15.2
34.5
34.0
5.1
0.3
0.6
6.2
33.9
42.4
15.6
1.2
0.1
0.9
6.2
27.4
39.9
22.3
3.2
0.1
1.2
6.7
18.5
35.1
32.0
6.4
0.1
0.3
9.0
19.3
39.2
27.7
4.3
0.1
0.8
8.6
28.9
37.1
22.8
1.8
0.1Increase of successful
companies in science, technology and innovation
Support and involvement ofcitizens in the policy of science,
technology and innovation
Conveying opinions from citizens to the government
Easy-to-understandcommunication of information
on science and technology
Science education
Relaxation of regulations
N/A
Don't know
It would not advance at all.
It would notadvance much.
Neutral
It would advance a little.
It would advancevery much.
N/A
Don't know
Strongly disagree
Disagree
Neutral
Agree
Strongly agree
71.5
78.0
22.0
4.1
1.8
0.3
0.2
0.1
19.2
2.0
0.3
0.2
0.2
0.0
55.2
30.3
9.7
2.8
1.0
0.7
0.2
51.3
37.8
8.8
1.5
0.2
0.5
0.0
54.5
31.8
10.4
1.7
0.3
1.2
0.1
50.1
38.3
8.9
1.4
0.2
0.9
48.6
34.9
13.0
1.7
0.5
1.1
31.6
43.5
18.9
2.7
0.5
2.8
0.0
34.3
39.5
21.0
3.2
0.5
1.6
0.1
62.6
28.4
7.0
1.0
0.3
0.6
0.1
50.2
37.3
10.0
1.6
0.1
0.7
0.1
22.4
37.0
30.1
6.9
1.7
1.8
0.1
0.2
0.2
26.0
44.9
23.0
3.6
0.5
1.8
0.2
15.4
34.5
35.6
9.8
2.1
2.4
0.1
31.5
35.9
24.6
4.7
1.4
1.7
0.3
14.4
39.2
33.4
8.1
2.9
1.6
0.3
18.2
38.8
31.9
8.0
1.5
1.5
0.2
50.7
34.4
12.0
1.2
0.5
1.0
0.2
29.5
39.5
24.5
2.3
0.6
3.6
0.1
N/A
Don't know
Not reliable at all
Not very reliable
Neutral
Somewhat reliable
Very reliable
[%]
[%]
[%]
[%]
Awareness survey on life and science & technology

Q14
N/ADon’t know
I don’t think I am quick at all.
I don’t think I am quick.
Neutral
I think I am quick.
I think I am very quick.5.5%
22.5%
37.5%
26.7%
7.4%
0.2%0.0%
0.0%0.0%
Q15
N/ADon’t knowVery rarely
Not frequently
Neutral
Frequently
Very frequently9.2%
33.7%
24.5%
25.5%
7.1%
Q17What leisure facilities you have visited inthe past one year using your leisure time?
Q18Where do you usually come across informationor news on science and technology?
Q19There are opportunities for scientists and engineers to introduce science and technology in a comprehensive way through experiences at science museums and museums, or open house of laboratories, lectures and science cafés. In addition, TV programs and articles on science and technology are introduced on TV, the Internet, newspapers and magazines. Do you think these opportunities are su�cient todeepen interest and understanding on science and technology?
Q16
N/A
Don't know
Never (I cannot take time for leisure.)
Evening on Sundays and public holidays
Evening on Saturdays
Evening between Monday to Friday
Daytime on Sundays and public holidays
Daytime on Saturdays
Daytime between Monday to Friday
3
N/A
Don't know
None of the above
Other
Sports stadium
Sports ground for baseball, soccer, tennis, etc.
Pool or gym
Temple or shrine
Horse race/motorboat race/bicycle race
Pachinko
Theme parks and leisure facility includingTokyo Disneyland, Universal Studios Japan
Amusement park
Children’s center
Theatre
Movie theatre
Art museum
Museum
Science museum
Botanical garden
Aquarium/Zoo
Library
N/A
Don't know
None in particular
Other
Conversations with family and friends
Promotion event at companies, advertisement, catalogues
Symposium, lectures, events at universities and research institutions
Library
Sciencemuseum/museum
Books
Newspaper, magazine
Internet
Radio
TV
N/A
Don’t know
Tend to disagree
Strongly disagree
Tend to agree
Strongly agree
Do you think you are quick to catch on to a trend?
Do you go out with your friendsand acquaintances?
When do you use time for leisure activitiessuch as your hobby, culture lessons and other amusement?
33.1%
38.3% 83.2%
14.2%
40.0%
60.7%
17.5%
7.4%
9.5%
5.4%
13.8%
20.6%
0.3%
5.2%
0.1%
0.0%
9.7%
27.5%
45.4%
10.6%
6.7%
0.1%
32.9%
14.8%
13.8%
19.3%
29.8%
44.3%
15.8%
7.6%
25.1%
24.5%
9.0%
3.8%
40.0%
17.7%
23.3%
13.6%
6.2%
11.2%
0.3%
0.0%
34.3%
46.1%
17.1%
16.9%
12.9%
15.6%
1.5%
0.3%
Awareness survey on life and science & technology

4
F1Gender
FemaleMale 46.8% 53.2%
F2Which one of the following age groups do you belong to?
20-2
416
-1925
-29
30-34
35-3
940-4
4
45-49
50-54
55-5
960-6
465
-69
70-74
75-7
980 a
nd ove
r
5.2%
4.5%
3.9%
4.6%
6.0%
8.8%
6.9%
7.6%
9.6%
10.6
%
8.7%
10.8
%
6.5%
6.3%
What is your educational background?
Don’t k
now
N/AGraduat
e sch
ool
Univers
ity
Two-y
ear c
olleg
e/
vo
catio
nal sc
hool
High sc
hool
Elemen
tary
/junior
high sc
hool
12.3
%
43.6
%
19.5
%
22.2
%
2.1%
0.1%
0.1%
F3
(and o
ld-e
ducatio
n-sys
tem
ele
men
tary
schoo
l)
(and o
ld-e
ducatio
n-sys
tem
junior
high sc
hool)
(and o
ld-e
ducatio
n-sys
tem
high
schoo
l)
F5Where did you mainly live until the age of 15?
N/ADon’t k
now
Town o
r villa
ge
in
rura
l are
a
Medium
-size
d city
in
rura
l are
a
Subur
bs or
ou
tskirt
s of m
ajor c
ity
Major c
ity
14.0
%
9.7%
37.2
%
38.6
%
0.2%
0.3%
F6What is your current occupation?
N/ADon’t k
now
Other
(Unem
ployed
)
Studen
t (Unem
ployed
)
Homem
aker
(Unem
ployed
)
Labor
wor
k (Em
ployee
)
Clerica
l wor
k (Em
ployee
)
Special
ist /
Tech
nical w
ork (
Employ
ee)
Manag
emen
t pos
ition(
Employ
ee)
Freela
nce (M
ember
of fa
mily
busines
s)
Freela
nce (S
elf-o
wned)
Comm
ercia
l, man
ufactu
ring
an
d ser
vice i
ndustrie
s (Mem
ber of
fam
ily em
ployee
)
Comm
ercia
l, man
ufactu
ring
an
d ser
vice i
ndustrie
s (Self
-owned
)
Agricu
lture
, fore
stry
, and fi
sher
y (Fa
mily
employ
ee)
Agricu
lture
, fore
stry
, and fi
sher
y indust
ry(S
elf-o
wned)
2.1
%
1.4
%
4.3
%
1.7
%
3.9
%
0.7
%
4.3
%
13.0
%
10
.3%
14
.7%
21
.1%
7.2
%
14
.7%
0.1
%0
.7%
F4What is your expertise?
N/ADon’t k
now
Other
than
(P
hysics
)-(Med
icine)
Science
and E
nginee
ring
(Phys
ics)
Science
and E
nginee
ring
(Chem
istry
)
Science
and E
nginee
ring
(Biol
ogy)
Science
and E
nginee
ring
(Geo
logy)
Science
and E
nginee
ring
(Mat
hemat
ics)
Agricu
lture
, fore
stry
an
d fish
ery
Medica
l
Dentis
try
Medici
ne
8.7%
2.1%
2.3%
0.3%
3.6%
1.3%
5.7%
1.5%
2.1%
71.5
%
0.3%
0.8%
(For those who selected ”Two-year college/vocational school ” – “Graduate school” at F3)
Awareness survey on life and science & technology

5
F7What is the occupation you have had the longest period of time?
N/ADon’t k
now
Other
(Unem
ployed
)
Studen
t (Unem
ployed
)
Homem
aker
(Unem
ployed
)
Labor
wor
k (Em
ployee
)
Clerica
l wor
k (Em
ployee
)
Special
ist /
Tech
nical w
ork (
Employ
ee)
Manag
emen
t pos
ition (
Employ
ee)
Freela
nce (M
ember
of fa
mily
busines
s)
Freela
nce (S
elf-o
wned)
Comm
ercia
l, man
ufactu
ring a
nd ser
vice
indust
ries (
Member
of fa
mily
busines
s)
Comm
ercia
l, man
ufactu
ring
an
d ser
vice i
ndustrie
s (Self
-owned
)
Agricu
lture
, fore
stry
, and fi
sher
y
(M
ember
of fa
mily
busines
s)
Agricu
lture
, fore
stry
, and fi
sher
y
(S
elf-o
wned)
I hav
e nev
er w
orke
d bef
ore.
1.0
%1
.0%
1.0
%1
.3%
4.5
%
13.9
%
23
.4%
18
.1%
10
.2%
11.0
%
1.6
%
5.8
%
2.1
%0
.0%
2.4
%
2.6
%
F8Do you have any children?
N/A
75.3% 24.5%
0.2%
Yes No
F10What is the approximate pre-tax income of your entire household per year?
N/ADon’t k
now
Over 1
5 milli
on ye
n
Betwee
n 10 –
15 m
illion
yen
Betwee
n 8 –
10 m
illion
yen
Betwee
n 6 –
8 milli
on ye
n
Betwee
n 4 –
6 milli
on ye
n
Betwee
n 2 –
4 milli
on ye
n
Less t
han 2
milli
on ye
n
10.5
%
25.4
%
15.9
%
11.7
%
5.9%
23.3
%
2.6%
2.0%
2.7%
F9Please select current educational status of all of your children.(For those who selected “Yes” at F8)
Pre-s
choo
l
Lower
grad
e
at
elem
enta
ry sc
hool
Middle gr
ade
at
elem
enta
ry sc
hool
Higher
grad
e
at
elem
enta
ry sc
hool
Junior
high sc
hool
High sc
hool
Vocat
ional
schoo
l
Two-y
ear c
olleg
e
Univers
ity
Graduat
e sch
ool
Wor
king
Other
Don’t k
now
N/A
12.4
%
5.8%
3.3%
5.1%
8.2%
8.7%
1.2%
0.7%
6.0%
0.9%
70.4
%
0.3%
0.0%
0.1%
F13We will be publishing the results of this survey on the Internet and we will be happy to send a copy to the respondents who are interested. Would you like to receive a copy?
N/A
45.9% 53.4%
0.7%
Yes No
Towns a
nd Villa
ges
Small
city
(le
ss th
an 10
0,000 p
epole
)
Medium
-size
d city
(500,0
00 peo
ple or
mor
e)
Major c
ity
(21
larg
est c
ities)
23.1
%
41.7
%
25.1
%
10.0
%
F11City scale
Kyusy
u
Shikoku
Chugoku
KinkiTo
kai
Higash
iyam
a
Hokur
iku
Kanto
Tohok
u
Hokka
ido
3.6%
7.0%
28.0
%
5.5%
4.6%
11.5
%
15.2
%
7.0%
3.2%
14.4
%F12Region
Awareness survey on life and science & technology

Which of the following items 1 – 4 do you think would advance science,
technology and innovation (STI)? Please mark for individual item.
Easy-to understand communication of information
on science and technology
Conveying opinions from citizens to the government
Increase of successful companies in STI
Relaxation of regulations
It would advance very much.
It would advance a little.
Neutral
It would not advance much.
It would not advance at all.
Don't know
A
B
C
D
1
2
3
5
6
4
Q
5 2 6 1 4 3
PESTISEGMENT
What ’ s
A
B
C
D
1 2 3or or
1 2or
1 2or
-
1 2 3or or
1 2or
3 4or 5or
-
1 2 3or or
3 4 5or or
-
1 2or
1 2 3or or
3 4 5or or
-
3 4 5or or
4 5or
-
-
-
Those who chosefor any of the 4 items
6
0SEGMENTPESTI
SEGMENT SEGMENT SEGMENT SEGMENT SEGMENT SEGMENT
PESTI segmentation is a method developed by PESTI *1
to classify people with the degree of “participation in the
science, technology and innovation (STI) policy” into 6 groups
(technically called segments). The people are classified as 5, 2,
6, 1, 4, 3 in the order of degree of “participation in the science,
technology and innovation policy.”The 6 segments are determined by the combination of four
answers: “1-1. Easy-to-understand communication of
information on science and technology,” “1-2. Conveying
opinions from citizens to the government,” “1-3. Increase of
successful companies in STI,” and “1-4. Relaxation of
regulations” to the question “Q1. Which of the following items
do you think would advance STI?.”
PESTI is a research development project launched in 2012 with researchers from six
universities: Kyoto University, Osaka University, Kobe University, Shiga University, Tottori
University and Tezukayama University, with the objective of forming policies that incorporate
citizens’ needs regarding science and technology innovation. It is positioned as a part of JST” Strategic Basic Research Programs (Research and Technology for Society): R&D program of
Science of Science, Technology and Innovation Policy” conducted by the Japan Science and
Technology Agency (JST), the Research Institute of Science and Technology for Society (RISTEX),
and also as a part of The Science for RE-designing Science, Technology and Innovation Policy
(SciREX) which is promoted by the Ministry of Education, Culture Sports, Science and Technology.
The segment no. and the degree of “participation in science and technology innovation policy” do not correspond to each other, as the segment no. was automatically allocated in the process of
developing segments.
A group of people who have the potential to participate in the policy of science and technology
innovation if given a chance.
The combination of segments 5 and 2 is set as “group of people
with participation in STI policy,” the combination of 6 and 1 as
“people with potential participation in the STI policy,” segment 4 as
“people with low participation in the STI policy,” and segment 3 as
“people with no participation in the STI policy.”The result of the opinion poll conducted by PESTI in December
2013 found that the group of people with participation, people with
potential participation, people with low participation and people
with no participation accounted for 49.1%, 35.1%, 3.7% and 12.0%
respectively.
*1
Group with participation 49.1% Group with the potential to participation 35.1%
Group with no participation 12.0%
Group with low participation 3.7%
Designed by TOMITA Makoto, ARASHIN Momoko
*2
*3

1SEGMENTPESTI
Group with the potential
to participation in STI policy
13.4%+20s
Clerical work (Employee)
Other (Unemployed)
33.0%-Temple or shrineDaytime between Monday to Friday
Public needs/opinionsCollaboration between the government and citizens
When you have looked for information about science and technology in the past, have you generally been able to find what you were looking for?
33.0%+No, I often can’t find what I am looking forUniversities
Municipal governments
41.3%-Culture/sports policy
Age
20.2%
179 people
1
When do you use time for leisure activities such as your hobby, culture lessons and other amusement?
What leisure facilities you have visitedin the past one yearusing your leisure time?
How important are thefollowing policy itemsto Japan and Japanese citizens?
How much trust do you havein the science and technologyinformation providedby the following groups?
What is your current occupation?
16.8%+
9.5%-
26.3%-
Which of the following organizations, persons, or collaboration make you feel assured as a citizenwhen they lead theadvancement ofscience/technology?
58.7%-
35.8%-
27.4%-
39.1%-
58.1%-National defence policy
38.5%-Tourism policy
SEGMENTPESTI
XX%+
XX%-
Item name
Item name
The least amount than other segments
The largest amount than other segments
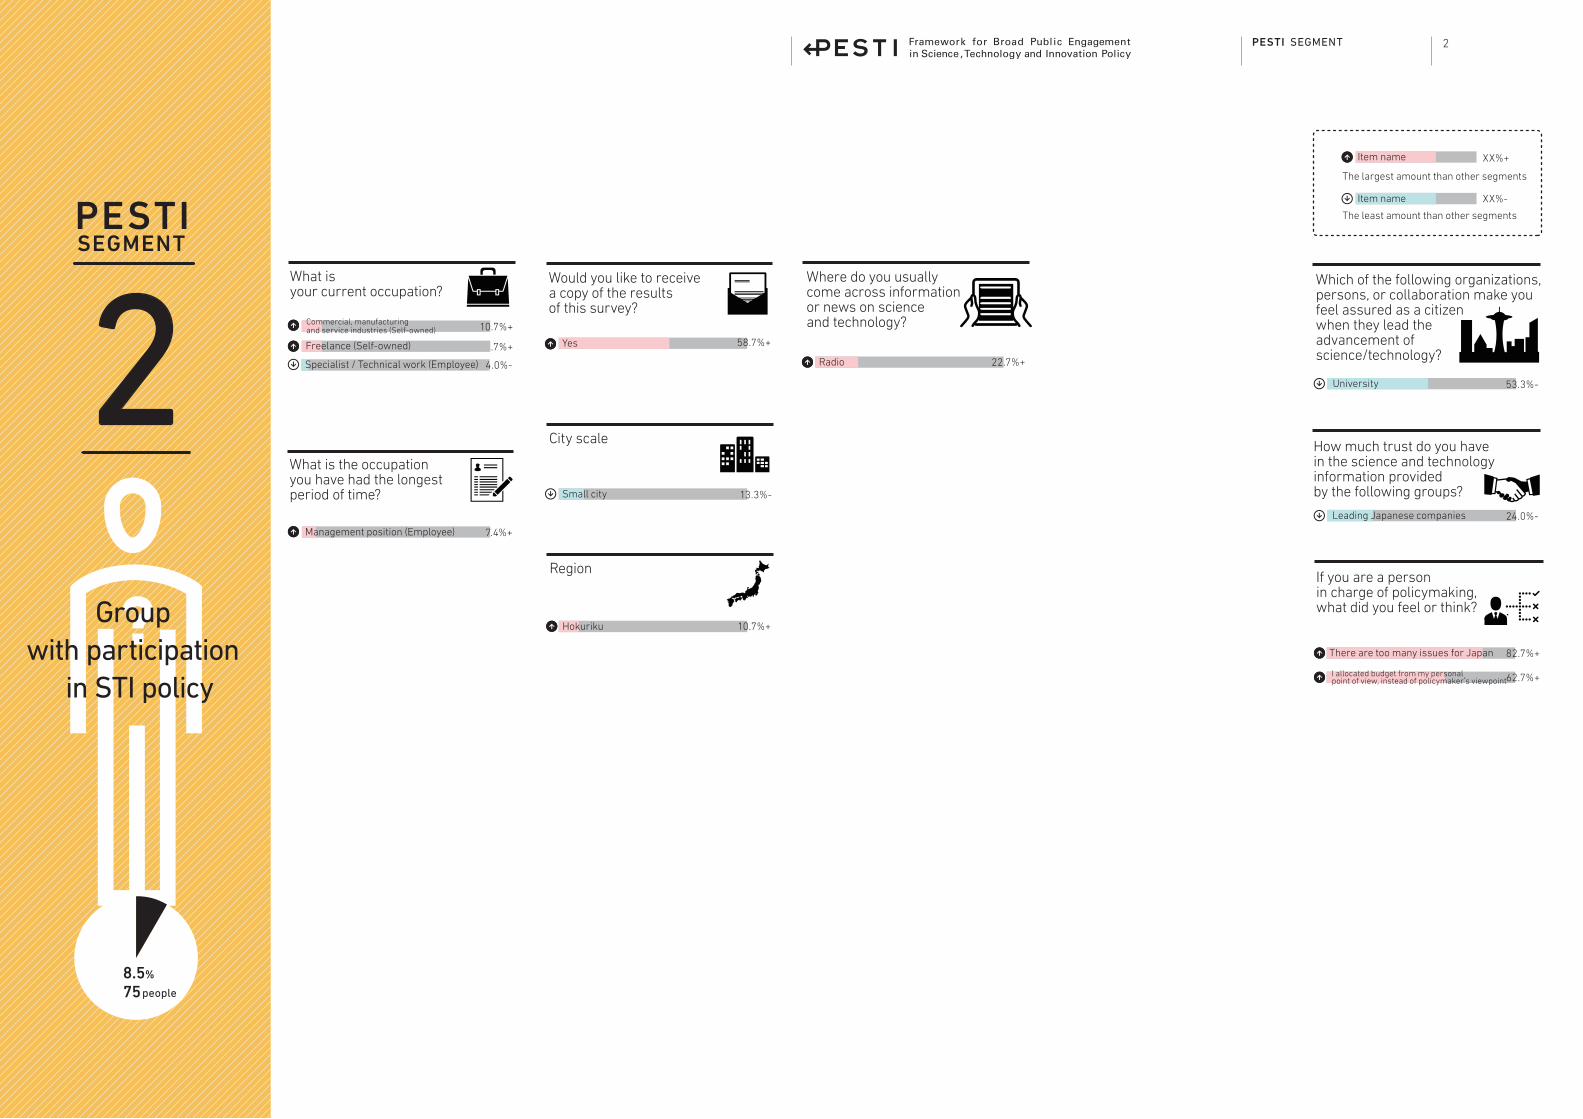
2SEGMENTPESTI
Group with participation
in STI policy
10.7%+Commercial, manufacturing and service industries (Self-owned)
10.7%+Freelance (Self-owned)
7.4%+Management position (Employee)
58.7%+Yes
13.3%-Small city
10.7%+Hokuriku
53.3%-University
62.7%+I allocated budget from my personalpoint of view, instead of policymaker’s viewpoint
82.7%+There are too many issues for Japan
Leading Japanese companies
8.5%
75people
2
Would you like to receive a copy of the results of this survey?
RegionIf you are a personin charge of policymaking, what did you feel or think?
What is your current occupation?
What is the occupationyou have had the longestperiod of time?
City scale
Which of the following organizations, persons, or collaboration make you feel assured as a citizenwhen they lead theadvancement ofscience/technology?
Where do you usuallycome across informationor news on scienceand technology?
24.0%-
22.7%+RadioSpecialist / Technical work (Employee) 4.0%-
How much trust do you havein the science and technologyinformation providedby the following groups?
SEGMENTPESTI
XX%+
XX%-
Item name
Item name
The least amount than other segments
The largest amount than other segments

3SEGMENTPESTI
Group with no participation
in STI policy
47.2%-
3
80.2%+
53.8%+
3.8%-
5.7%-
2.8%-
Female
30s
40s
70s
Elementary/junior high school (and old- education-system elementary school)
University(and old- education-system high school)
Other clerical work(Employee)
Homemaker (Unemployed)
Other (Unemployed)
86.8%+Yes
Suburbs or outskirts of major city
Medium-sized city in rural area
Commercial, manufacturing and service industries (Self-owned)
Labor work (Employee)
Clerical work (Employee)
Student (Unemployed)
20s
Less than 2 million yen
Between 4 – 6 million yen
Between 6 – 8 million yen
Between 2 – 4 million yen
27.4%-Yes
30.2%-Medium-sized city
34.0%+Small city
4.7%-Tokai
8.5%+Shikoku
42.5%+Not frequently
Daytime between Monday to Friday
21.7%-Library
20.8%-Aquarium/Zoo
2.8%-Science museum
7.5%-Museum
19.8%-Art museum
22.6%-Movie theatre
6.6%-Theatre
12.3%-Amusement park
12.3%-Theme parks and leisure facility including Tokyo Disneyland, Universal Studios Japan
21.7%-I always use new technologies and products after observing some people who try them
9.4%-Sports ground for baseball, soccer, tennis, etc.
33.0%+None of the above
6.6%-Pool or gym
70.8%-
10.4%-
TV
Internet
45.3%-Newspaper, magazine
3.8%-Books
0.9%-Library
0.9%-Symposium, lectures, events at universities and research institutions
5.7%-Promotion event at companies, advertisement, catalogues
22.6%+None in particular
Evening on Saturdays
30.2%-Government
36.8%-Leading Japanese companies
37.7%-National/public laboratory
Research of various fields jointly
Popular TV shows on science and technology
Well-known scientists
52.8%-Governmentand national/public laboratories jointly
37.7%-Collaboration between national/public laboratories and leading companies
43.4%-Collaboration between universities, public administration, and companies
16.0%-Specified non-profit corporation (NPO)
It is difficult to allocate budget from the viewpoint of policymaker
More budget should be allocated to human resources
It made me think of the government’s policies
We should allocate budget for the future
There are too many unnecessary policies
There are too many issues for Japan24.5%-
1.9%-
Interested
Search for information
VSEG5(The least interesting)
VSEG3(The second interesting )
28.3%+I do not actively use new technologies or products
43.4%-Disagree
18.9%-Having influence
32.1%-Should have influence
45.3%-Science education
National/public laboratories
Leading Japanese companies
Japanese government
Global companies
88.7%-Pension policy
93.4%-Medical/nursing care policy
70.8%-Policy on parenting support
82.1%-Policy of safety/security of life
52.8%-Information and communications policy
66.0%-Energy policy
68.9%-Environmental policy
68.9%-Employment policy
50.9%-Industrial policy
61.3%-Agriculture, forestry and fishery policy
80.2%-Disaster recovery policy
37.7%-Policy on assistance to developing countries
72.6%-Education policy
47.2%-Science, technology and innovation policy12.0%
106 people
Interest in science and technology? SEGMENT
VICTORIAGender & age
What is youreducational background?
Where did you mainlylive until the age of 15?
Would you like to receive a copy of the results of this survey?
When do you use time for leisure activities such as your hobby, culture lessons and other amusement?
Do you go out with your friends and acquaintances?
Region
What leisure facilities you have visitedin the past one yearusing your leisure time?
Do you think opportunitiesare sufficient to deepeninterest and understandingon science and technology?
How important are thefollowing policy itemsto Japan and Japanese citizens?
About science and technology
If you are a personin charge of policymaking, what did you feel or think?
What is the approximate pre-tax income of your entirehousehold per year?
How doyou feel aboutnew technology and products?
Which do you think would advance science, technology and innovation ?
What isyour current occupation?
What is the occupationyou have had the longestperiod of time?
Do you have any children?
City scale
Which of the following organizations, persons, or collaboration make you feel assured as a citizenwhen they lead theadvancement ofscience/technology?
Where do you usually come across information or news on science and technology?
About science and technology issues that are important to you.
2.8%-
33.0%+
28.3%+
3.8%-
51.9%+
36.8%+
5.7%-
5.8%+
33.3%+
13.0%-
1.4%-
24.5%+
5.7%-
5.7%-
17.0%-
F2.5%+
9.4%-
1.9%-
46.2%+
18.9%-
56.6%-
50.9%-
28.3%-
28.3%-
24.5%-
67.9%-
27.4%-
34.0%-
45.3%-
32.1%-
53.8%-
8.5%+Higashiyama
How much trust do you havein the science and technologyinformation providedby the following groups?
SEGMENTPESTI
XX%+
XX%-
Item name
Item name
The least amount than other segments
The largest amount than other segments

Group with low participation
in STI policy
42.4%+University (and old- education-system high school)
6.1%+Agriculture, forestry, and fishery (Family employee)
24.2%+Between 6 – 8 million yen
Collaboration between the government and leading companies
Budget is too limited for the number of issues
64.2%+Disagree
45.5%-Scientists
21.2%-Government
15.2%+Not policy on parenting support
12.1%+Not policy of safety/security of life
12.1%+Not information and communications policy
6.1%+Not environmental policy
9.1%+Not employment policy
12.1%+Not industrial policy
6.1%+Not disaster recovery policy
15.2%+Not disaster prevention/disaster reduction policy
21.2%+Not public works policy
27.3%+Not policy on assistance to developing countries
18.2%+Not national defence policy
39.4%+Not tourism policy
27.3%+Not culture/sports policy
12.1%+Nou education policy
9.1%+Not science, technology and innovation policy
4SEGMENTPESTI
3.7%
33 people
4
What is youreducational background?
What isyour current occupation?
What is the approximate pre-tax income of your entirehousehold per year?
Do you think opportunitiesare sufficient to deepeninterest and understandingon science and technology?
Interestin science and technology? SEGMENT
VICTORIA
VSEG1(The third ) 17.3%-
How important are thefollowing policy itemsto Japan and Japanese citizens?
Which of the following organizations, persons, or collaboration make you feel assured as a citizenwhen they lead theadvancement ofscience/technology?
39.4%-
If you are a personin charge of policymaking, what did you feel or think?
42.4%-
How much trust do you havein the science and technologyinformation providedby the following groups?
SEGMENTPESTI
XX%+
XX%-
Item name
Item name
The least amount than other segments
The largest amount than other segments

5SEGMENTPESTI
Group with participation
in STI policy
29.2%+Between 2 – 4 million yen
4.2%+Between 10 – 15 million yen
3.6%-Hokuriku
26.7%-Not frequently
Information about science and technology
23.1%+Actively search for information
19.2%+Aquarium/Zoo
6.1%-Pachinko
88.6%+
70.2%+
TV
Newspaper, magazine
12.3%+Library
59.3%+Municipal government
80.5%+Scientist
64.1%+Leading Japanese companies
57.9%+Public needs/opinions
44.6%+Specified non-profit corporation (NPO)
84.1%+National/public laboratory
77.3%+Collaboration between the government and citizens
85.5%+Research of various fields jointly
85.8%+Government and national/public laboratories jointly
73.8%+Collaboration between the government and leading companies
79.1%+Collaboration between national/public laboratories and leading companies
83.6%+Collaboration between universities, public administration, and companies
61.0%+Government
It made me think of the government’s policies
There are too many unnecessary policies
13.9%-VSEG5(The least )
42.1%+Agree
40.1%+
65.5%+
Science education
81.6%+Universities
61.6%+Municipal governments
84.1%+Scientists
52.9%+Government
82.5%+National/public laboratories
27.9%+Mass communication (TV/newspaper, etc.)
58.5%+Leading Japanese companies
54.9%+Japanese government
62.7%+Global companies
95.5%+Pension policy
99.4%+Medical/nursing care policy
92.8%+Policy on parenting support
95.5%+Policy of safety/security of life
81.9%+Information and communications policy
94.2%+Energy policy
95.5%+Environmental policy
92.5%+Employment policy
87.7%+Industrial policy
83.8%+Agriculture, forestry and fishery policy
96.9%+Disaster recovery policy
94.2%+Disaster prevention/disaster reduction policy
73.3%+Public works policy
63.8%+Policy on assistance to developing countries
77.7%+National defence policy
67.7%+Tourism policy
71.6%+Culture/sports policy
92.5%+Education policy
81.9%+Science, technology and innovation policy
38.4%+Popular TV shows on science and technology
Budget is too limited for the number of issues
40.6%
359
5
Interest in science and technology? SEGMENT
VICTORIA
Region
What leisure facilities you have visitedin the past one yearusing your leisure time?
Do you think opportunitiesare sufficient to deepeninterest and understandingon science and technology?
How important are thefollowing policy itemsto Japan and Japanese citizens?
If you are a personin charge of policymaking, what did you feel or think?
What is the approximate pre-tax income of your entirehousehold per year?
Which of the following organizations, persons, or collaboration make you feel assured as a citizenwhen they lead theadvancement ofscience/technology?
Where do you usuallycome across informationor news on scienceand technology?
About science and technology issues that are important to you.
65.2%+
41.8%+
73.8%+
92.8%+
How much trust do you havein the science and technologyinformation providedby the following groups?
Do you go out with your friends and acquaintances?
Which do you think would advance science and technology innovation?
SEGMENTPESTI
Having influence
Should have influence
people
XX%+
XX%-
Item name
Item name
The least amount than other segments
The largest amount than other segments

6SEGMENTPESTI
Group with the potential
to participation in STI policy
Male
Elementary/junior high school (and old- education-system elementary school)
68.2%-Yes
Suburbs or outskirts of major city
Town or village in rural area
30s
TokaiMuseum
Amusement park
Pachinko34.8%-Municipal government
90.2%+It is difficult to allocate budget
56.8%+Interested
12.1%+VSEG2(The most interesting)
Internet
BooksSymposium, lectures, events at universities and research institutions
Promotion event at companies, advertisement, catalogues
22.7%+Yes, and it tends to be easy to understand
7.6%+Not pension policy
Sports ground for baseball, soccer, tennis, etc.
14.9%
132people
6
Interest in science and technology? SEGMENT
VICTORIAGender & age
What is youreducational background?
Where did you mainlylive until the age of 15?
Region What leisure facilities you have visitedin the past one yearusing your leisure time?
How important are thefollowing policy itemsto Japan and Japanese citizens?
If you are a personin charge of policymaking, what did you feel or think?
Do you have any children?
Which of the following organizations, persons, or collaboration make you feel assured as a citizenwhen they lead theadvancement ofscience/technology?
Where do you usuallycome across informationor news on scienceand technology?
60.6%+
28.0%+
10.6%+
20.5%+
17.4%+27.3%+
35.6%+
13.6%+
31.8%+
60.6%+
16.7%+
6.8%-
15.9%+
30.3%-
About science and technology
When you have looked for information about science and technology in the past, have you generally been able to find what you were looking for?
78.0%+University
89.4%+Well-known scientists
How much trust do you havein the science and technologyinformation providedby the following groups?
SEGMENTPESTI
XX%+
XX%-
Item name
Item name
The least amount than other segments
The largest amount than other segments