UNDERSTANDING THE INFLUENCE OF THE...
154
UNDERSTANDING THE INFLUENCE OF THE ELECTRODE MATERIAL ON MICROBIAL FUEL CELL PERFORMANCE by David V. P. Sanchez B.S. in Civil Engineering, University of Portland, 2006 M.S. in Civil Engineering, University of Pittsburgh, 2010 Submitted to the Graduate Faculty of Swanson School of Engineering in partial fulfillment of the requirements for the degree of Doctor of Philosophy University of Pittsburgh 2013
Transcript of UNDERSTANDING THE INFLUENCE OF THE...

UNDERSTANDING THE INFLUENCE OF THE ELECTRODE MATERIAL ON
MICROBIAL FUEL CELL PERFORMANCE
by
David V. P. Sanchez
B.S. in Civil Engineering, University of Portland, 2006
M.S. in Civil Engineering, University of Pittsburgh, 2010
Submitted to the Graduate Faculty of
Swanson School of Engineering in partial fulfillment
of the requirements for the degree of
Doctor of Philosophy
University of Pittsburgh
2013
ii
UNIVERSITY OF PITTSBURGH
SWANSON SCHOOL OF ENGINEERING
This dissertation was presented
by
David V. P. Sanchez
It was defended on
May 30, 2013
and approved by
Kyle J. Bibby, PhD, Assistant Professor, Department of Civil and Environmental Engineering
Kelvin B. Gregory, PhD, Associate Professor, Department of Civil and Environmental
Engineering Carnegie Mellon University
Leonard W. Casson, PhD, Associate Professor, Department of Civil and Environmental
Engineering
Kent Harries, PhD, Associate Professor, Department of Civil and Environmental Engineering
Dissertation Co-Director: Radisav D. Vidic, PhD, Professor, Department of Civil and
Environmental Engineering
Dissertation Co-Director: Minhee Yun, PhD, Associate Professor, Department of Electrical
and Computer Engineering

iii
Copyright © by David V. P. Sanchez
2013

iv
In this thesis, I deploy sets of electrodes into microbial fuel cells (MFC), characterize their
performance, and evaluate the influence of both platinum catalysts and carbon-based electrodes
on current production. The platinum work centers on improving current production by
optimizing the use of the catalyst using nano-fabrication techniques. The carbon-electrode work
seeks to determine the influence of the bare electrode on biofilm-anode current production.
The development of electrodes for MFCs has boomed over the past decade, however,
experiments aimed at identifying how catalyst deposition methods and electrode properties
influence current production have been limited. The research conducted here is an attempt to
expand this knowledge base for platinum catalysts and carbon electrodes. In the initial chapters
(4 and 5), I discuss our attempt to decrease catalyst loadings while increasing current production
through the use of platinum nanoparticles. The results demonstrate that incorporating platinum
nanoparticles throughout the anode and cathode is an efficient means of increasing MFC current
production relative to surface deposition because it increases catalyst surface area.
The later chapters (chapters 6 and 7) develop an understanding of the importance of electrode
properties (i.e. surface area, activation resistance, conductivity, surface morphology) by
electrochemically evaluating well-studied anode-respiring pure cultures on different carbon
UNDERSTANDING THE INFLUENCE OF THE ELECTRODE MATERIAL ON
MICROBIAL FUEL CELL PERFORMANCE
David V. P. Sanchez, Ph.D.
University of Pittsburgh, 2013

v
electrode architectures. Two different architectures are produced by using tubular and platelet
shaped constituent materials (i.e. carbon fibers and graphene nanoplatelets) and the
morphologies of the electrodes are varied by altering the size of the constituent material.
The electrodes are characterized and evaluated in MFCs using either Shewanella oneidensis MR-
1 or Geobacter sulfurreducens as the innoculant because their bioelectrochemical physiologies
are the most documented in the literature. Using the electrochemical results, the electrode
characterizations and previous studies on their physiology I am able to extrapolate that it is the
difference in the electrode morphology that significantly alters current production. For the
carbon fiber, smaller constituent materials create a tighter mesh and spacing that is more
amenable to biofilm colonization and increases current production. In the second experiment, the
larger graphene-nanoplatelet constituents provided a morphology that better promoted biofilm-
growth, after the initial colonization, which enabled significantly higher current production.

vi
TABLE OF CONTENTS
PREFACE ................................................................................................................................. XVI
1.0 INTRODUCTION ........................................................................................................ 1
1.1 WHAT IS A MICROBIAL FUEL CELL? ....................................................... 4
1.2 TECHNOLOGY PERSPECTIVE ..................................................................... 6
2.0 BACKGROUND .......................................................................................................... 8
2.1 FUEL CELL ELECTROCHEMISTRY............................................................ 8
2.1.1 Overpotentials .................................................................................................. 8
2.1.2 The Effect of Catalysts on Electron Transfer ............................................. 10
2.1.3 The Effect of Electrode Properties on Electrochemical Reactions ........... 10
2.2 MICROBIAL FUEL CELL BACTERIA ........................................................ 11
2.2.1 Substrates and Strains .................................................................................. 11
2.3 EXTERNAL ELECTRON TRANSFER (EET) MECHANISMS ................ 12
2.3.1 Direct Electron Transfer ............................................................................... 12
2.3.2 Mediated Electron Transfer ......................................................................... 12
2.3.3 Conduction-based Electron Transfer .......................................................... 13
2.4 BIOFILM-ANODE ............................................................................................ 14
2.5 APPLICATION OF MODIFIED ELECTRODES TO IMPROVE
MICROBIAL FUEL CELL PERFORMANCE .............................................................. 15
vii
3.0 SCOPE AND OBJECTIVES .................................................................................... 17
3.1 PRELIMINARY EVALUATION OF PLATINUM LOADING ................... 18
4.0 EVALUATING THE EFFECT OF INCREASING PLATINUM SURFACE
AREA ON MFC CURRENT DENSITY BY INCOPORATING PT NANOPARTICLES
INTO THE BIOFILM-ANODE AND MEASURING CURRENT PRODUCTION ............ 20
4.1 SUMMARY ........................................................................................................ 20
4.2 INTRODUCTION ............................................................................................. 21
4.3 MATERIALS AND METHODS ...................................................................... 23
4.3.1 Synthesis of Pt-loaded carbon nanofiber mat ............................................. 23
4.3.2 Electrochemical activation of Pt nanoparticles........................................... 24
4.3.3 Microbial fuel cell setup ................................................................................ 24
4.3.4 Measurements ................................................................................................ 25
4.4 RESULTS AND DISCUSSION ........................................................................ 26
4.5 CONCLUSIONS ................................................................................................ 39
5.0 EVALUATING THE EFFECT OF INCREASED PLATINUM SURFACE
AREA ON THE CATHODE REACTION BY INCOPORATING PT NANOPARTICLES
INTO THE CATHODE AND MEASURING MASS-SPECIFIC CURRENT DENSITY .. 41
5.1 SUMMARY ........................................................................................................ 41
5.2 INTRODUCTION ............................................................................................. 42
5.2.1 Mass transfer limitations and oxygen reduction kinetics .......................... 44
5.2.2 Nanostructured Electrodes ........................................................................... 46
5.3 MATERIALS AND METHODS ...................................................................... 47
5.3.1 Electrode Fabrication Procedure ................................................................. 47

viii
5.3.2 Characterization of SWNT-nPt electrode ................................................... 48
5.3.2.1 SEM ...................................................................................................... 49
5.3.2.2 Raman Spectroscopy ........................................................................... 49
5.3.2.3 TEM ...................................................................................................... 49
5.3.3 Microbial fuel cell (MFC) System ................................................................ 50
5.3.3.1 Anode .................................................................................................... 50
5.3.3.2 Cathode ................................................................................................ 51
5.4 RESULTS AND DISCUSSION ........................................................................ 51
5.5 CONCLUSIONS ................................................................................................ 61
6.0 THE EFFECTS OF CARBON ELECTRODE SURFACE MORPHOLOGY ON
BIOFILM-ANODE PERFORMANCE (BY SHEWANELLA ONEIDENSIS MR-1) USING
A TUBULAR ELECTRODE CONSTITUENT MATERIAL ................................................ 63
6.1 SUMMARY ........................................................................................................ 64
6.2 INTRODUCTION ............................................................................................. 64
6.3 MATERIALS AND METHODS ...................................................................... 68
6.3.1 Electrode characterization ............................................................................ 68
6.3.2 Cell cultures.................................................................................................... 68
6.3.3 Micro-Electrolysis Cell (MEC) Operation .................................................. 69
6.3.4 SEM................................................................................................................. 70
6.4 RESULTS ........................................................................................................... 70
6.4.1 Current production ....................................................................................... 70
6.4.2 Cyclic voltammograms .................................................................................. 72
6.4.3 SEM -images for biofilm colonization ......................................................... 74

ix
6.4.4 Morphology of sterile electrodes .................................................................. 76
6.5 DISCUSSION ..................................................................................................... 78
6.5.1 Differences in current production ................................................................ 78
6.5.2 Biofilm-based electron transfer .................................................................... 78
6.5.3 Comparison of electroactive surface area and kinetics using CVs ........... 79
6.5.4 Differences in electrode conductivity ........................................................... 80
6.5.5 Toxicity ........................................................................................................... 81
6.5.6 Biofilm formation .......................................................................................... 85
6.5.7 Impact of electrode morphology .................................................................. 86
6.6 CONCLUSION .................................................................................................. 87
7.0 THE EFFECTS OF CARBON ELECTRODE SURFACE MORPHOLOGY ON
BIOFILM-ANODE PERFORMANCE (BY GEOBACTER SULFURREDUCENS) USING
PLATELETS AS A CONSTITUENT MATERIAL (GRAPHENE-NANOPLATELETS) . 88
7.1 SUMMARY ........................................................................................................ 89
7.2 INTRODUCTION ............................................................................................. 90
7.3 MATERIALS AND METHODS ...................................................................... 93
7.3.1 Electrodes ....................................................................................................... 93
7.3.2 Culture and Media ........................................................................................ 94
7.3.3 Microbial Fuel Cell Assembly and Operation ............................................ 95
7.3.4 Electrochemical Measurements.................................................................... 96
7.3.5 SEM Images ................................................................................................... 96
7.4 RESULTS AND DISCUSSION ........................................................................ 97
7.4.1 Electrode characterizations .......................................................................... 97

x
7.4.2 Current Density ............................................................................................. 98
7.4.3 Cyclic Voltammetry ..................................................................................... 101
7.4.4 Electrochemical Impedance Spectroscopy (EIS) ...................................... 104
7.4.5 SEM Images ................................................................................................. 107
7.5 CONCLUSION ................................................................................................ 110
8.0 SUMMARY AND OUTLOOK ............................................................................... 111
8.1 FUTURE WORK ............................................................................................. 113
APPENDIX A. ELECTRODE DESIGN, FABRICATION AND CHARACTERIZATION
..................................................................................................................................................... 115
BIBLIOGRAPHY ..................................................................................................................... 122

xi
LIST OF TABLES
Table 1. Active surface area calculated from Hads peak in 0.1 M H2SO4, the maximum current density, and ratio of area forward peak to backward peak of Pt/CNFs in methanol oxidation before and after electrochemical activation. Xuyen, Sanchez et al. 2010. Diffusion-limited reduction of organometallic compound on carbon nanofiber mat for catalytic applications. Journal of Materials Chemistry 20, 5468-5473. Reproduced by permission of The Royal Society of Chemistry. ............................................................ 35
Table 2. Electrode Properties for Carbon Microfiber Paper and Carbon Nanofiber Mats ........... 81
Table 3. Electrode Properties for Graphene-Nanoplatelet electrodes. .......................................... 97
Table A1. Electrode characterization techniques……………………………………………..... 118
xii
LIST OF FIGURES
Figure 1. Microbial Fuel Cell schematic showing the biofilm-anode (left), and the cathode (right).2 .......................................................................................................................... 4
Figure 2. Polarization curve used to illustrate the typical potential losses in a fuel cell. Potential
losses can be calculated by subtracting the upper (upper line) and lower (bottom line) bounds straddling each region. The three main designations given to the resistances in an electrolytic cell are activation overtpotential, ohmic losses/drop ,and mass transfer overpotential. .................................................................................................................. 9
Figure 3. Preliminary evaluation of the effect of platinum thickness on current density. Platinum
was deposited via electron-beam evaporation and was tested according to methods in Park et al.48 ................................................................................................................... 19
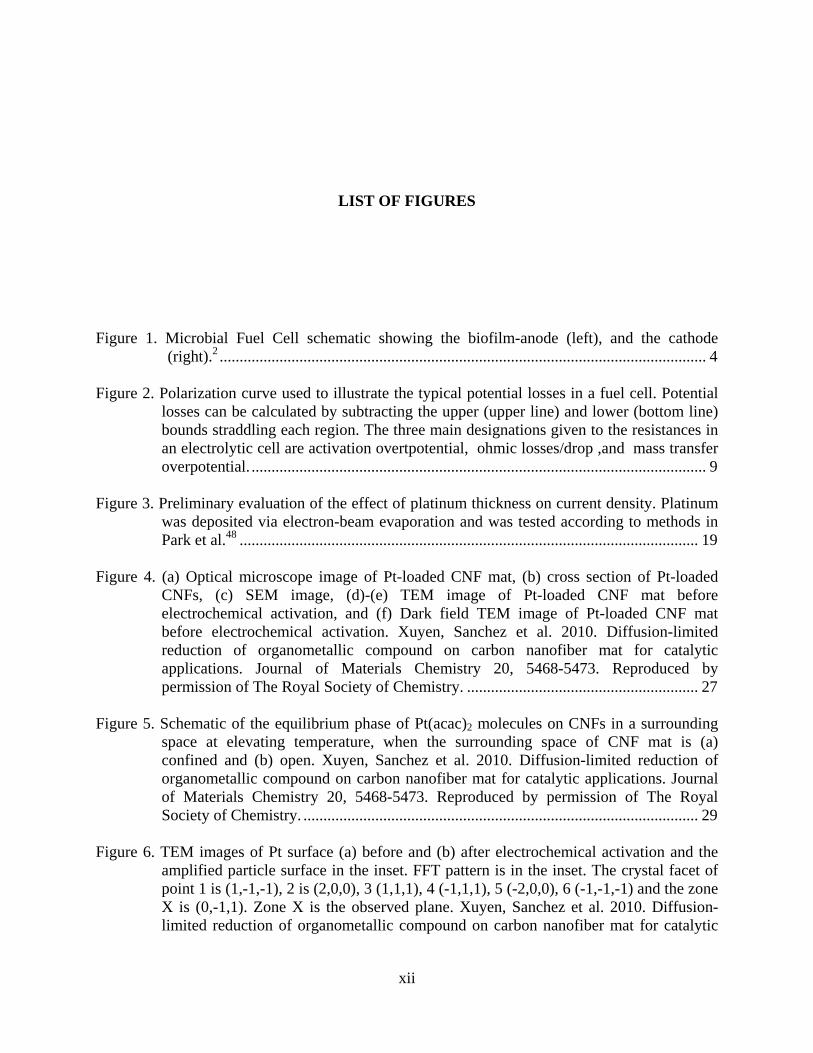
Figure 4. (a) Optical microscope image of Pt-loaded CNF mat, (b) cross section of Pt-loaded
CNFs, (c) SEM image, (d)-(e) TEM image of Pt-loaded CNF mat before electrochemical activation, and (f) Dark field TEM image of Pt-loaded CNF mat before electrochemical activation. Xuyen, Sanchez et al. 2010. Diffusion-limited reduction of organometallic compound on carbon nanofiber mat for catalytic applications. Journal of Materials Chemistry 20, 5468-5473. Reproduced by permission of The Royal Society of Chemistry. .......................................................... 27
Figure 5. Schematic of the equilibrium phase of Pt(acac)2 molecules on CNFs in a surrounding
space at elevating temperature, when the surrounding space of CNF mat is (a) confined and (b) open. Xuyen, Sanchez et al. 2010. Diffusion-limited reduction of organometallic compound on carbon nanofiber mat for catalytic applications. Journal of Materials Chemistry 20, 5468-5473. Reproduced by permission of The Royal Society of Chemistry. ................................................................................................... 29
Figure 6. TEM images of Pt surface (a) before and (b) after electrochemical activation and the
amplified particle surface in the inset. FFT pattern is in the inset. The crystal facet of point 1 is (1,-1,-1), 2 is (2,0,0), 3 (1,1,1), 4 (-1,1,1), 5 (-2,0,0), 6 (-1,-1,-1) and the zone X is (0,-1,1). Zone X is the observed plane. Xuyen, Sanchez et al. 2010. Diffusion-limited reduction of organometallic compound on carbon nanofiber mat for catalytic
xiii
applications. Journal of Materials Chemistry 20, 5468-5473. Reproduced by permission of The Royal Society of Chemistry. .......................................................... 32
Figure 7. (a) Cycle voltammetry of Pt/CNFs in 0.1 M H2SO4 at RT. Potential sweep rate is 50
mV/s. (b) Differential pulse voltammetry of Pt-loaded CNFs in 1 M methanol and 0.5 M H2SO4 before (dotted line) and after (solid line) electrochemical activation. Xuyen, Sanchez et al. 2010. Diffusion-limited reduction of organometallic compound on carbon nanofiber mat for catalytic applications. Journal of Materials Chemistry 20, 5468-5473. Reproduced by permission of The Royal Society of Chemistry. .............. 34
Figure 8. (a) The principle of the mediator-less microbial fuel cell. (b) Current density of the Pt-
loaded CNF mat, the electrochemical (EC) activated Pt-loaded CNFs mat, and the e-beam deposited-Pt/carbon microfiber paper electrode on the anode compartments at a fuel flow rate of 3 rpm. (c) Current density of the Pt-loaded CNFs and the electrochemical activated Pt-loaded CNF electrode on the anode compartments at a fuel flow rate of 3 rpm, 10 rpm, and 15 rpm. Xuyen, Sanchez et al. 2010. Diffusion-limited reduction of organometallic compound on carbon nanofiber mat for catalytic applications. Journal of Materials Chemistry 20, 5468-5473. Reproduced by permission of The Royal Society of Chemistry. .......................................................... 37
Figure 9. Schematic diagram of a microbial fuel cell (MFC) system. As bacteria (yellow rods)
consume glucose, the produced free electrons flow from the anode to cathode via the electrical circuit while protons are transferred from anode to cathode through a proton exchange membrane (Nafion). Reprinted with permission from Sanchez et al. 2010. Carbon Nanotube/Platinum (Pt) Sheet as an Improved Cathode for Microbial Fuel Cells. Energy & Fuels 24, 5897-5902. Copyright 2010 American Chemical Society. 43
Figure 10. SEM images of a fractured surface of SWNT-nPt matrix at low (A) and high
magnifications. The images illustrate the fibrous nature of the electrode and that the platinum nanoparticles are not highly agglomerated. Reprinted with permission from Sanchez et al. 2010. Carbon Nanotube/Platinum (Pt) Sheet as an Improved Cathode for Microbial Fuel Cells. Energy & Fuels 24, 5897-5902. Copyright 2010 American Chemical Society. ...................................................................................................... 52
Figure 11. Raman spectra of SWNT samples with and without platinum nanoparticles. The
samples were measured using 633nm laser excitation. This image shows that there is no notable shift in the G,G’, and D bands between SWNTs with and without platinum nanoparticles. Reprinted with permission from Sanchez et al. 2010. Carbon Nanotube/Platinum (Pt) Sheet as an Improved Cathode for Microbial Fuel Cells. Energy & Fuels 24, 5897-5902. Copyright 2010 American Chemical Society................................................................................................................................... 53
Figure 12. TEM images of SWNT-nPt samples at (A) low magnification, (B) medium
magnification, (C) high magnification, and (D) magnification of inset in B. The images show 4-10nm platinum nanoparticles evenly dispersed in the SWNT matrix. Reprinted with permission from Sanchez et al. 2010. Carbon Nanotube/Platinum

xiv
(Pt) Sheet as an Improved Cathode for Microbial Fuel Cells. Energy & Fuels 24, 5897-5902. Copyright 2010 American Chemical Society. ...................................... 55
Figure 13. Current density profiles from a Microbial Fuel Cell employing (A) SWNT-nPt
pluronic acid (■) and SWNT-nPt Triton-X (●)anodes with e -beam Pt (1000 Å ) cathodes and (B) SWNT-nPt Triton X electrodes loaded with Pt (0.5mg/cm2) (▲) as the anode and cathode. The results are superimposed on each other in Figure 6B. Note that changing the cathode from an e-beam Pt electode (1000 Å) to a SWNT-nPt electrode improved the current density ~an order of magnitude. Reprinted with permission from Sanchez et al. 2010. Carbon Nanotube/Platinum (Pt) Sheet as an Improved Cathode for Microbial Fuel Cells. Energy & Fuels 24, 5897-5902. Copyright 2010 American Chemical Society. ........................................................... 57
Figure 14. Cyclic scans of SWNT-nPt and e-beam Pt (1000 Å) electrodes illustrating effect of
each electrode on the oxygen reduction reaction. At a scan rate of 2mV/s in a range of -0.2V to 1.2V (vs Ag/AgCl) the SWNT-nPt demonstrated superior performance. Reprinted with permission from Sanchez et al. 2010. Carbon Nanotube/Platinum (Pt) Sheet as an Improved Cathode for Microbial Fuel Cells. Energy & Fuels 24, 5897-5902. Copyright 2010 American Chemical Society. .................................................. 59
Figure 15. SEM image of the biofilm accumulated on the SWNT-nPt anode surface in a
microbial fuel cell. Most of the bacteria are rod shaped which was consistent throughout the sample. Reprinted with permission from Sanchez et al. 2010. Carbon Nanotube/Platinum (Pt) Sheet as an Improved Cathode for Microbial Fuel Cells. Energy & Fuels 24, 5897-5902. Copyright 2010 American Chemical Society. ......... 60
Figure 16. Amperometric data from a MEC inoculated with Shewanella oneidensis MR-1.
Current production by carbon nanofiber mats/CNF (red) and carbon microfiber paper/CMF (blue) was monitored over a 4 week period. ........................................... 71
Figure 17. Cyclic voltammograms for carbon nanofiber mats/CNF (red) and carbon microfiber
paper/CMF (blue) at Day 2 (top) and Day 15 (bottom) of the experiment. Day 15 was chosen because of the difference in current production. Electrode replacement took place after the CV. CVs were scanned from -0.7V to +0.3V vs Ag/AgCl at 2mV/s.. 73
Figure 18. SEM images of increasing magnification of anodes evaluated in an MEC for 2 weeks
and inoculated with Shewanella oneidensis MR-1. Images of both carbon nanofiber mat/CNF images (A and B) and carbon microfiber paper/CMF (C and D) were taken after elect rodes were fixed in paraformadelhyde solution. Images indicate the presence of a biofilm on the CNF electrodes. Bacteria are highlighted in (A and B). A magnified image of a single bacterium found on the CNF biofilm electrode is also shown (E). ................................................................................................................... 75
Figure 19. SEM images of increasing magnification of pristine carbon nanofiber mats (Images A,
C, and E) and carbon microfiber paper (Images B, D, and F). ................................... 77

xv
Figure 20. Energy Dispersive X-ray (EDX) Spectra of both carbon nanofiber mats and carbon microfiber paper. The quantitative results are in the right hand column. Both samples recorded spectra indicating that there was no presence of any trace metals or known bacterial toxins. ........................................................................................................... 82
Figure 21. Current Density from MFCs inoculated with Geobacter sulfurreducens. GNP-
50μm(blue) and GNP-1μm (red) were tested for a duration of three weeks with FeCN as the catholyte. Maximum current densities are 0.8mA/cm2 and 0.5mA/cm2 for GNP-50μm and GNP-1μm respectively. ............................................................ 99
Figure 22. Cyclic Voltammograms from MFCs inoculated with Geobacter sulfurreducens. CVs
taken before inoculation and at peak current production are shown for (A) GNP-50μm and (B) GNP-1μm with graphical fit of Nernst-Monod model shown in green. Inset (C) compares the Nernst-Monod fits from both (A) and (B) and describes the biofilm electrode evolution in terms of half-saturation potential Eka (volts) and biofilm conductivity kbio (mS/cm). ........................................................................ 102
Figure 23. Electrochemical Impedance Spectra of the anode before inoculation. Spectra was
generated using an excitation signal amplitude of 10mV with an initial frequency of 300kHz and a final frequency of 0.1Hz. Figure inset is a depiction of the Randles circuit used to model the spectra where Rs = solution resistance, Cdl = doubly layer capacitance, and Rp = polarization resistance. ........................................................ 106
Figure 24. SEM Images of sterile graphene-nano-platelet electrodes used to demonstrate
differences in surface morphology. (A) GNP-1μm (B) Magnified image of GNP-1μm (C) GNP-50μm (D) magnified image of GNP-50μm and (E) large scale image of the electrode material as a whole. ....................................................................... 108

xvi
PREFACE
Looking back at my time here at the University of Pittsburgh I am humbled by the
generosity and privileges I have been afforded. I pray for the grace and virtue to continually pay
it forward. I would like to thank my co-advisors Dr. Minhee Yun and Dr. Radisav Vidic for
allowing me to pursue interdisciplinary research and for their support and guidance. I want to
thank my committee members Dr. Kelvin Gregory, Dr. Kyle Bibby, and Dr. Kent Harries for
their time, invaluable insight and suggestions and express my gratitude to the Mascaro Center
for Sustainable Innovation’s IGERT program, the National Science Foundation Graduate
Research Fellowship Program and the Alfred P. Sloan Foundation’s NACME program for the
financial and logistical support they’ve consistently provided throughout my studies .
I have received an extensive amount of support from multiple collaborators and
colleagues and I want to thank them for their help namely; Xuyen Nguyen and Dr. Younghee
Lee from Sungkyunkwan University in Suwon, South Korea, Mikhail Kozlov and Dr. Ray
Baughman at the University of Texas-Dallas, Dr. Jeff Lawrence, Dr. Kristen Butella, and Brian
Goddard from Pitt Biosciences, Dr. Jeff Gralnick at the University of Minnesota, Dr. Kelly
Nevin, Trevor Woodward, Dr. Nikhil Malvenkar and Dr. Derek Lovley from the University of
Massachusetts-Amherst, Dr. Ho Il Park, Dr. Yushi Hu, Dr. Innam Lee, Dr. Dave Perello, Dan
Jacobs, and Jiyong Huang from the Nanoelectronics Device Laboratory and the other IGERT
fellows in my program.

xvii
Finally, from the bottom of my heart, I would like to thank God, my family and my
friends who have supported me throughout my journey with love and encouragement. To
Grandma and Grandpa Kotla, Nana and Grandpa Sanchez, Mom, Dad, siblings, cousins, aunts,
uncles, nieces, nephews, Godchildren and friends, Si Yu’us Ma’ase. This dissertation is
dedicated to Our Blessed Mother in honor of all of you, our ancestors and all those generations
still to come.

1
1.0 INTRODUCTION
Using bacterial biofilms as catalysts to convert our waste into electricity is an attempt to
tap into a natural wastewater-energy nexus to produce both clean energy and clean water. A
microbial fuel cell (MFCs) is a technology used to harness this process because wastewater often
contains more energy than is used to treat it. As a result, improving MFC technology to generate
electricity via the degradation of our organic waste, could decrease our energy costs for treating
wastewater (i.e. less aeration in wastewater treatment), transform a waste stream into an energy
feedstock and convert a wastewater treatment plant into a net energy producer. This would
fundamentally change the sector currently responsible for 2% of our national energy
consumption.1
While the current state of the art for MFCs is insufficient for wastewater treatment
applications, the benefits of improving our fundamental understanding of biofilm-anodes expand
well beyond MFC development. The interaction between electricity producing biofilms and
electrodes will allow researches from various fields such as material science, chemistry,
biophysics, and environmental engineering to extrapolate these concepts to improve other
biotechnologies (i.e. environmental sensing, remote power generation, and bioremediation) all of
which are crucial to the future of water quality monitoring and treatment.

2
Two of the main research objectives associated with the development of MFCs are
increasing current production and understanding the influence of the bare electrode on the
biofilm-electrode interface. In this thesis, I focus on increasing the efficient use of a metal
catalyst using nanofabrication methods and on understanding what aspects of the bare carbon
electrode are most important for biofilm-electrode current production. For the catalyst, I chose
platinum as a catalyst because it is a common fuel cell catalyst and it has been characterized
sufficiently (i.e. well defined cyclic voltammograms, catalyst poisons are known). While it is
impractical from a cost perspective save for space missions, the following studies and fabrication
methods can serve as a foundation for future aimed at understanding the role of a metal catalyst
in an MFC electrode or as a framework for optimizing inexpensive alternatives.
I employ different deposition methods (e.g. e-beam evaporation, adsorption and
sublimation, co-deposition) to load platinum onto the electrode in order to determine what
aspects of the catalyst (location, thickness, and surface area) are most important for current
production from the biofilm-anode and the cathode. I use material characterization methods to
confirm the nature of our deposits and evaluate the electrodes in MFCs. When the effect of
changing the thickness of the surface deposited platinum is shown to be negligible the focus
shifts to efficiently increasing the surface area of platinum through the use of nanoparticles
incorporated throughout the electrode. The metric used to determine whether I am increasing the
efficient use of the catalyst is the mass-specific current density (current/mg of Pt).
In order to understand what aspects (i.e. surface area, activation resistance, conductivity,
surface morphology) of the bare electrode are most important for biofilm-anode current
production I use carbon-based electrodes whose constituent material sizes could be modified.
Carbon is chosen because it is relatively abundant, is inexpensive, has many phases, is generally

3
non-toxic and can be manipulated to have different surface areas. Being able to adjust the size of
the constituent material is important because it allows one to start engineering the electrode.
However, it is important to note that changing the size of the constituent material often results in
changes to the electrode surface area, electron transfer kinetics, electrode conductivity, and
electrode surface morphology. The challenge of isolating the effects of each of these parameters
on biofilm-anode current production is compounded by the fact that the physiologies of the
bacteria that form the biofilm are not completely understood and that the complexity of a
biofilm’s physiological profile increases with increasingly mixed communities. I address these
challenges by using dissimiliatory-metal-reducing bacteria whose physiologies have been
extensively studied in bioelectrochemical systems such as microbial fuel cells. I chose
Shewanella oneidensis MR-1 and Geobacter sulfurreducens because the nature of their electron
transfer mechanisms to electrodes are well documented in the literature and the numerous studies
on their physiology in bioelectrochemical systems provide an insight into the formation and
health of the biofilm-anode. Along with electrochemical techniques (i.e. amperometry and cyclic
voltammetry) and experimental designs that take into account biofilm kinetics,
bioelectrochemistry, and the physiology of the respective strain this is important to
understanding how the electrode is interfacing with the biofilm and influencing the current
production from the biofilm-anode.
4
1.1 WHAT IS A MICROBIAL FUEL CELL?
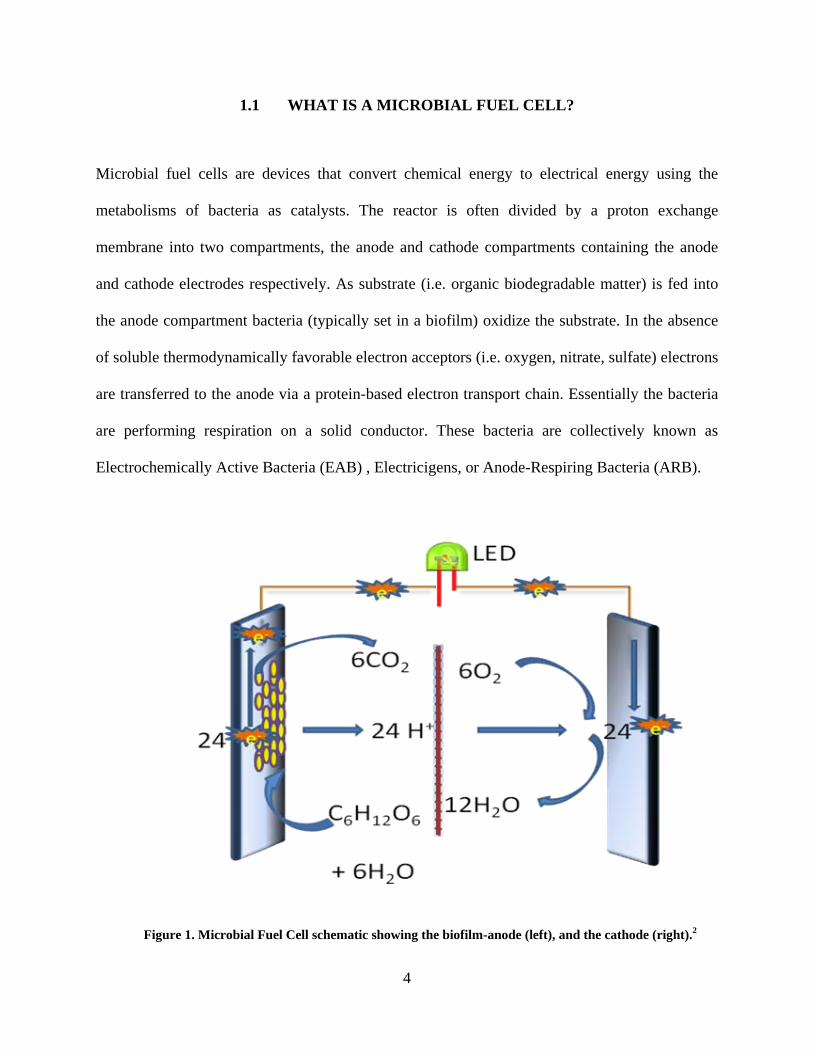
Microbial fuel cells are devices that convert chemical energy to electrical energy using the
metabolisms of bacteria as catalysts. The reactor is often divided by a proton exchange
membrane into two compartments, the anode and cathode compartments containing the anode
and cathode electrodes respectively. As substrate (i.e. organic biodegradable matter) is fed into
the anode compartment bacteria (typically set in a biofilm) oxidize the substrate. In the absence
of soluble thermodynamically favorable electron acceptors (i.e. oxygen, nitrate, sulfate) electrons
are transferred to the anode via a protein-based electron transport chain. Essentially the bacteria
are performing respiration on a solid conductor. These bacteria are collectively known as
Electrochemically Active Bacteria (EAB) , Electricigens, or Anode-Respiring Bacteria (ARB).
Figure 1. Microbial Fuel Cell schematic showing the biofilm-anode (left), and the cathode (right).2

5
The initial discovery of this bio-electrochemical phenomenon by James Potter took place
in 1911. 3 He monitored the electrical effects associated with fermentation by constructing a
galvanic cell based on platinum wires and a pure culture of yeast. He measured the potential
difference and discovered the first bio-based battery. The bio-electrochemical concept was
presented again in the literature in 1931 by Cohen who was able to generate 35 volts but only
2mA with his reactors.4 The study of this phenomenon then cycled with scientific breakthroughs
and technology demand. For example, advances in battery science and NASA’s goal of waste to
energy production for space missions spurred research during the 1960s. 5 The concept attracted
some interest in the 1970s6-7 but faded as the costs of fossil fuel based energy decreased
dramatically. In the 1980’s and early 90’s H.P. Benetto reignited MFC research as a way to
produce energy in developing countries8-11. Research was fairly small scale until the late 90’s
saw a surge in MFC research as the issues of climate change and energy came into focus. Since
then there has been a major convergence of various disciplines in MFC research; namely
material science, environmental engineering, electrical engineering, biophysics, microbial
physiology, genetics and electrochemistry. Contributions from scientists and engineers of all
backgrounds have pushed the knowledge base and made the study of MFCs a truly
interdisciplinary endeavor.

6
1.2 TECHNOLOGY PERSPECTIVE
Oftentimes MFCs are compared to hydrogen fuel cells which are ubiquitous in the literature.
And while it is easy to see that current densities for hydrogen fuel cells are 2-3 orders of
magnitude greater than those produced by MFCs 12 it is also important to note that the two
technologies differ greatly in operating conditions and applications 13-14. MFCs operate at
ambient temperature and pressure and utilize a variety of substrates as their fuel source. As a
result, MFCs are more versatile and can better serve to convert our wastewater, which contains
energy equivalent to ~2% of total US electricity demand, to electricity 1, 15 .
Recent reports suggest that creating an MFC with a consistent power output of 1 kW/m3
(volume of the reactor) would allow the technology to be economically viable for wastewater
treatment application 14, 16. A quick comparison would show that deployed waste-to-energy
technologies such as converting methane gas from an anaerobic digester to electricity via
combustion, assuming 40% conversion efficiency, produces 1.5kW /m3 of reactor per kg COD
removed. 16-17. Given relatively equal power outputs the competitive advantage will be given to
the technology with a lower implementation/capital costs. Therefore understanding the role that
materials play in the performance of MFCs is critical for MFC development and for scaling up
operations 18 that will be both economically viable and competitive.
Finally, understanding the effect of catalyst/electrode architectures on biofilm-electrode
interactions will provide a framework to evaluate novel materials and or deposition methods.
This fundamental research is not only essential for improving MFC performance but also has
implications for the development of biotechnologies in medicine, bioremediation, and water

7
quality. The biofilm-electrode may also serve as a tool to enhance our understanding of
fundamental phenomena in microbiology, biophysics, electronics, and bio-electrochemistry.

8
2.0 BACKGROUND
2.1 FUEL CELL ELECTROCHEMISTRY
2.1.1 Overpotentials
The deployment of MFCs is hindered by low power generation. These low current densities
restrain the technology from being economically viable. The low current densities are due mainly
to the internal resistance of the reactors. This internal resistance can be defined as the collective
resistance experienced as electrons and protons travel from substrate, through the fuel cell to the
terminal electron acceptor 14. This internal resistance can be graphically explained via the
polarization curve ( I-V curve) in the following figure.
9
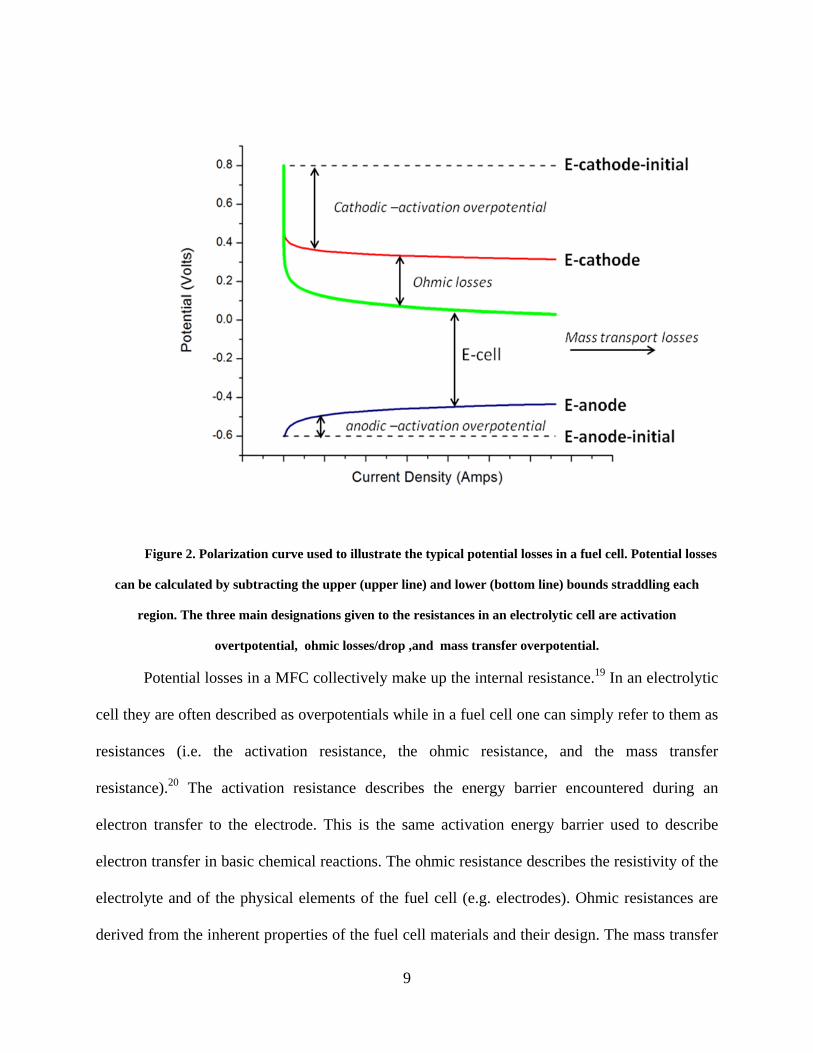
Figure 2. Polarization curve used to illustrate the typical potential losses in a fuel cell. Potential losses
can be calculated by subtracting the upper (upper line) and lower (bottom line) bounds straddling each
region. The three main designations given to the resistances in an electrolytic cell are activation
overtpotential, ohmic losses/drop ,and mass transfer overpotential.
Potential losses in a MFC collectively make up the internal resistance.19 In an electrolytic
cell they are often described as overpotentials while in a fuel cell one can simply refer to them as
resistances (i.e. the activation resistance, the ohmic resistance, and the mass transfer
resistance).20 The activation resistance describes the energy barrier encountered during an
electron transfer to the electrode. This is the same activation energy barrier used to describe
electron transfer in basic chemical reactions. The ohmic resistance describes the resistivity of the
electrolyte and of the physical elements of the fuel cell (e.g. electrodes). Ohmic resistances are
derived from the inherent properties of the fuel cell materials and their design. The mass transfer

10
resistance describes the resistance imposed upon the fuel cell at high current densities. As the
fuel/substrate diffuses toward the electrode there is a reaction rate at which the mass transport of
the fuel/substrate cannot keep up with the rate at which it is being consumed at the electrode.
This resistance, derived from the concentration of the electrolyte and its diffusivity, is generally
described as the mass transfer resistance.
2.1.2 The Effect of Catalysts on Electron Transfer
Catalysts, typically bound on the electrode, are used to reduce the activation resistance
experienced by electrons during electron transfer to or from the electrode. Catalysts are used for
both anodic and cathodic reactions. A catalyst typically reduces the activation energy barrier for
electron transfer by enabling a more efficient reaction setup, electron transfer, and reaction
termination (e.g. dissociation of the target molecule, increased formation of reactive species,
increased coordination between donor and acceptor). Typically, catalysts increase reaction rates
by addressing the rate-limiting step and increasing the availability of a catalyst may increase the
reaction rate. Though catalysts are not consumed in the reaction they can undergo poisoning
when its reactive sites bond with another compound and prevent it from reacting with the target
substrate. Catalysts are also subject to physical stresses that may remove it from the electrode.
2.1.3 The Effect of Electrode Properties on Electrochemical Reactions
The rate of a basic electrochemical reaction on a bare electrode (i.e. without a catalyst) will be
influenced by the electron transfer kinetics between the target compound and the electrode, the

11
total available reactive surface area of the electrode and the conductivity of the electrode. Some
electrode materials are able to catalyze reactions and reduce the activation resistance for electron
transfer while most increase performance by increasing the total available reactive surface area.
In MFCs, carbon-based electrodes are often used and performance enhancements have been
largely attributed to the increase in surface area (e.g. carbon nanotubes, graphene). As for
conductivity, it is largely determined by the density of the material. The conductivity of an
electrode is a function of areal wt (i.e. mass/geometric area) so that a larger areal weight will
increase the conductivity of the electrode and reduce the ohmic resistance.
2.2 MICROBIAL FUEL CELL BACTERIA
2.2.1 Substrates and Strains
Understanding and determining the flow of electrons from substrate to bacterium to anode
requires information about a cell’s physiology and energetics. These can vary for each bacterial
strain. As bacterial communities diversify, which is the case in the majority of environmental
contexts, quantifying the flux of electrons is increasingly difficult because of competition
amongst bacteria, electron sinks (methanogens), and poorly quantified mechanisms. The ability
of bacteria to generate electricity from a variety of substrates adds to the complexity especially
since researchers have generated power using fermentable and non-fermentable substrates, a
variety of bacterial strains and mixed communities 21. As a result, the community dynamics of a
biofilm make it increasingly difficult to measure and model electron flux and electrochemical

12
reactions. Consequently, efforts to qualify the effect of community structure on MFC
performance or use well-studied pure cultures in MFC experiments are becoming increasingly
important 22-23 .
2.3 EXTERNAL ELECTRON TRANSFER (EET) MECHANISMS
2.3.1 Direct Electron Transfer
Direct electron transfer assumes that bacteria arrange their outer membranes to be adjacent and
physically connected to the anode electrode 24. The fundamental assumption here is that the
proximity of the bacteria to the electrode is necessary for electron transfer. Some have suggested
that this mechanism is impractical for describing all anode reactions because MFC biofilms were
shown to sustain bacteria more than 10 μm from the electrode 25 and that this EET model could
not kinetically account for the high current densities (i.e. 10A/m2) reported by the literature. 25
2.3.2 Mediated Electron Transfer
Mediated electron transfer, which has been documented in various papers 26-28, occurs when
bacteria use chemical redox mediators to transfer electrons. In short, bacteria would reduce a
mediator (i.e. thionine, methyl viologen, methyl blue, humic acid, neutral red) 29-30 which
diffuses to the anode, is oxidized, and then diffuses back to the cell to be reduced. Newman and

13
Kolter demonstrated this for the pure culture of Shewanella oneidensis 31. Another study
suggested that some bacteria are able to use mediators produced by foreign bacteria to transfer
electrons. 32 The key to this mechanism is that you have a soluble mediator diffusing back and
forth between bacteria and electrode. Given this EET model, the main limitations for electricity
production would be the concentration of the mediators and the mass transport resistance that
would be experienced at high current densities. However, while it has been proven that this is a
valid EET model it also does not kinetically account for the high current densities reported in the
literature.
2.3.3 Conduction-based Electron Transfer
Conduction-based electron transfer implies that bacteria are able to conduct electrons to the
anode via the biofilm matrix 33. A cursory review suggests that bacteria are able to do this via a
network of bionanowires 34-41 or sequestered riboflavins 27. Technically, conduction based
transfer could use the same mechanisms used in mediated transfer however the mediators would
be fixed and conjugated in the biofilm. Richter et al. demonstrated that Geobacter
sulfurreducens used a conductive network of non-diffusing intermediates to transfer electrons to
the anode 42. Research is currently addressing how complex bacterial networks are able to
transfer electrons in biofilms that can be as thick as 80µm 25 but the more important aspect is that
the conduction-based electron transfer model has thus far been the basis for understanding the
biofilm-anode and that it kinetically accounts for the highest current densities reported in the
literature. 25

14
2.4 BIOFILM-ANODE
In an MFC the biofilm-anode provides the framework for conversion of a chemical substrate to
electricity. The biofilm metabolizes the substrate and transfers the resulting electrons to the
anode via a series of protein-based redox reactions. The amount of electricity actually generated
from these reactions depends on the efficiency with which a bacterium’s outer membrane
proteins or cytochromes transfer electrons to the anode. This efficiency is affected by 1) the
metabolic efficiency of the bacteria metabolism and its electron transport chain and 2) the
activation resistance between the electron transport chain and the anode. Although genetic
engineering may improve the metabolic efficiency of the electron transport chain, it cannot
optimize the anode, the terminal electron acceptor within the biofilm-anode. However, the
activation resistance experienced in the terminal electron transfer could be improved by
engineering a better connection between the electron transport chain and the anode through the
use of a catalyst or a modified electrode. This is supported by the fact that protein-protein
interactions have evolved to be efficient but protein-electrode interactions continue to be
understood and developed. 43-45.
MFC research can often focus on one aspect of the biofilm-anode (the biofilm or the
electrode) leaving the other much less developed. As researchers continue to understand both the
microbiological and electrochemical aspects of the biofilm-anode it is important to capitalize on
these developments simultaneously. For example, in a pure culture details about the bacterial

15
metabolism help to evaluate the substrate conversion efficiency and the nature of its electron
transport chain given a specific electron acceptor. At the same time an in-depth characterization
of the electrode (i.e. catalyst and or base electrode) enables one to thoroughly evaluate electron
transfer efficiency from the electron transport chain to the anode using electrochemical
techniques such a cyclic voltammetry. The field would benefit a great deal by combining pure
cultures that have been well-characterized in a bioelectrochemical context with well designed
electrodes in experiments.
2.5 APPLICATION OF MODIFIED ELECTRODES TO IMPROVE MICROBIAL
FUEL CELL PERFORMANCE
In an attempt to use modified electrodes to improve MFC performance it is useful to think of the
biofilm-anode as a tri-composite material. The electrode and catalyst form the initial composite
and the anode respiring biofilm, which adds the biological material, acts as the final extension of
the electrode. Given this schematic, it is easy to see that the electrode/catalyst materials might
significantly influence electron transfer kinetics, ohmic resistance, mass transport resistance and
biofilm colonization. These all have consequences for electricity production and in the case of
the biofilm-anode, the long term growth and maintenance of the biofilm.
Catalyst and electrode materials such as conductive polymers, porphyrins, and non-noble
metals have been used to improve current production in MFCs. 46 Further review shows that

16
most of the electrodes that have been used in MFCs to date were carbon based and have enabled
some of the highest current densities in the literature. While many experiments have used various
electrodes of different geometry and compositions in MFCs over the past 20 years 47-50, fewer
have taken advantage of new nanofabrication and characterization techniques to focus on which
specific catalyst and electrode properties (e.g. location of the catalyst, amount of catalyst, surface
area of the catalyst and the electrode, electrode conductivity, electrode surface morphology) to
improve MFC current production. These new nano-techniques present the ability to tailor
electrode properties for more focused experiments.
For example, metals, such as platinum (Pt), have been used in MFCs to increase current
densities. However, it is difficult to determine whether electrode fabrication should focus on
increasing surface coverage, surface area to volume ratio, Pt layer thickness or electrode
conductivity. Certainly, understanding how a well known catalyst like Pt or carbon-based
electrodes affects performance will provide a foundation for the development of novel and
innovative MFC electrodes48, 51-54 using the host of other materials49, 52-59 that have been shown
to influence performance.
17
3.0 SCOPE AND OBJECTIVES
Many articles in the literature suggest that the use of catalysts and modified electrodes would
improve current density by using a catalyst to decrease the activation resistance or modifying the
electrode material to increase surface area. The research conducted and described below is an
attempt to optimize the use of a platinum catalyst using nanofabrication methods and to
determine which carbon electrode properties (i.e. surface area, activation resistance, electrode
conductivity, electrode surface morphology) most influence MFC current production. The
question to be answered is how does one efficiently use a catalyst in MFC electrodes and which
aspects of the bare electrode significantly influence the current output of MFCs. While the initial
experiments focus on the evaluating novel nanoparticle-based deposition methods to decrease
platinum loading while increasing current density, the latter experiments seek to compliment the
research by designing experiments aimed at identifying which properties (i.e. surface area,
activation resistance, electrode conductivity, surface morphology) of the carbon electrode enable
high current production from the biofilm-anode. The scope of the dissertation research is limited
to a study of a platinum catalyst and carbon-based electrodes. The two main objectives were to:
1.) Employ nanofabrication methods (e.g. e-beam deposition, co-deposition of
nanoparticles) to vary platinum deposition onto electrodes and evaluate how they
increase the mass specific current density (Amps/mg Pt) of platinum in MFCs.
18
2.) Determine which properties (i.e. surface area, activation resistance, electrode
conductivity, and surface morphology) of the carbon electrodes most significantly
enable high current production from a biofilm- anode using Shewanella oneidensis
MR-1 and Geobacter sulfurreducens.
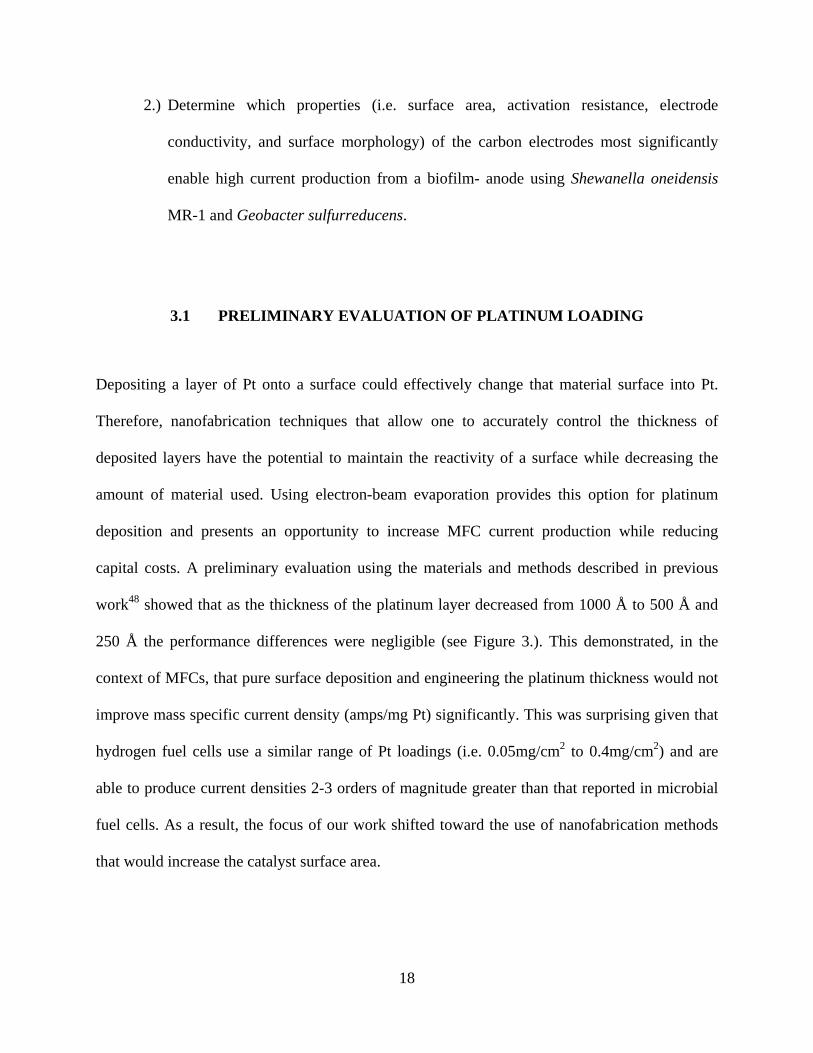
3.1 PRELIMINARY EVALUATION OF PLATINUM LOADING
Depositing a layer of Pt onto a surface could effectively change that material surface into Pt.
Therefore, nanofabrication techniques that allow one to accurately control the thickness of
deposited layers have the potential to maintain the reactivity of a surface while decreasing the
amount of material used. Using electron-beam evaporation provides this option for platinum
deposition and presents an opportunity to increase MFC current production while reducing
capital costs. A preliminary evaluation using the materials and methods described in previous
work48 showed that as the thickness of the platinum layer decreased from 1000 Å to 500 Å and
250 Å the performance differences were negligible (see Figure 3.). This demonstrated, in the
context of MFCs, that pure surface deposition and engineering the platinum thickness would not
improve mass specific current density (amps/mg Pt) significantly. This was surprising given that
hydrogen fuel cells use a similar range of Pt loadings (i.e. 0.05mg/cm2 to 0.4mg/cm2) and are
able to produce current densities 2-3 orders of magnitude greater than that reported in microbial
fuel cells. As a result, the focus of our work shifted toward the use of nanofabrication methods
that would increase the catalyst surface area.
19
Figure 3. Preliminary evaluation of the effect of platinum thickness on current density. Platinum was
deposited via electron-beam evaporation and was tested according to methods in Park et al.48
20
4.0 EVALUATING THE EFFECT OF INCREASING PLATINUM SURFACE AREA
ON MFC CURRENT DENSITY BY INCOPORATING PT NANOPARTICLES INTO
THE BIOFILM-ANODE AND MEASURING CURRENT PRODUCTION
Given the preliminary evaluation of Pt loadings I hypothesized that incorporating platinum
nanoparticles into the electrode would increase current density because of the increase in
available surface area. Collaborating with Sungkyunkwan Advanced Institute of Nanotechnology
at Sungkyunkwan University in Suwon, South Korea (SKKU) we focused on efficiently
fabricating an electrode with platinum nanoparticles, validating its electrochemical performance,
and testing the electrode in a MFC alongside the e-beam platinum electrode (1000 Å thickness)
that was evaluated in the preliminary studies.
4.1 SUMMARY
We used a simple and efficient method of synthesizing highly electrocatalytic Pt
nanoparticles on a carbon nanofiber mat. Platinum acetylacetonate (Pt(acac)2) molecules were
adsorbed on functionalized carbon nanofibers and further reduced to Pt nanoparticles by
diffusion-limited sublimation in a confined space. Pt nanoparticles were formed with sizes of 2.9
± 0.4 nm and a loading yield of 100 %. Using electrochemical activation in the form of cyclic
voltammetry we obtained high active surface area Pt nanoparticles and confirmed formation of
21
specific crystalline facets. The methanol oxidation current density per mg Pt of Pt-loaded carbon
nanofiber sample was about 60 times as high as the commercially available (E-tek) sample and
superior to other existing samples. We then used the Pt-loaded carbon nanofiber mat as the anode
in a microbial fuel cell. The activated Pt nanoparticles are believed to mediate the electrons from
the bacterial matrix to the carbon nanofiber mat. The electrochemically activated electrode
showed a significantly higher current density (0.6 A/m2) than the untreated sample and higher
than an e-beam deposited Pt/Toray carbon paper that was previously tested showing that the
increase in the reactive surface area of platinum using our methods increases MFC current
density. An additional benefit to the method described here is that the long-term stability at the
reported current was four times (150 hours) longer than the reported values. We believe that this
method can be practically applied to load the organometallic compound-based catalyst on
various carbon-based supports.
4.2 INTRODUCTION
In mediator-less microbial fuel cell systems, Pt has shown an ability to increase efficient
electricity generation.60 However, preparing a catalyst with large surface area and high activity
has been a critical barrier to development.61-62 There have been many well-known methods for
loading Pt catalysts on powder supports in liquid phase such as stirring,61 sonochemistry,63-64
supercritical liquid,65 and microwave treatment.66-68 Yet these methods have not been used in
three-dimensional supports. Typically, incorporation of an additional binder is required to form
three-dimensionally structured supports for catalyst applications.61-62 As a consequence, the

22
advantages of both high porosity and good electrical conductivity of the supports have been
obscured due to the presence of the binder. The most recent approaches for designing electrodes
of three-dimensional scaffolds use TiO2/PVP fibers62, 69 and SiO2 nanoparticles as a glue between
carbon particles.61 However, due to the high resistivity of the support, these approaches are not
practical for applications which require highly conductive supports, for instance, in fuel cells.
In another aspect, most of the methods for loading Pt nanoparticles on the support in
solution-phase use linkers, protective agents, and reductants, by which the size, shape, and
density of the nanoparticles can be controlled to improve the catalyst activity.63, 70-72 In such
cases, the particle surfaces are often partially deactivated due to the remaining linkers and
protective agents.63, 72 Thus, it is better to find another method that can activate the catalyst
surface prior to the fabrication of the unit cell.
The purpose of this experiment was threefold: i) to design a simple and efficient method
for constructing uniformly distributed Pt nanoparticles on a carbon nanofiber (CNF) mat that has
high electrical conductivity and porosity, ii) to activate surfaces of Pt nanoparticles and evaluate
the electrochemical activity and mass-specific current density by examining methanol oxidation
on the electrode and iii) to use this electrode to evaluate whether the increased surface area of
platinum nanoparticles increases current density in MFCs.
In our approach, the Pt(acac)2 was absorbed on an acid-treated electrospun polyimide
based-CNF mat. The Pt-loaded CNF mat was then reduced into Pt nanoparticles of ~ 3 nm by
heat treatment under Ar ambient in a confined space to preserve the sublimated Pt(acac)2
molecules. Unlike the previous works,62-63, 69 no capping agent, reductant, or linker was used to
control the size of Pt nanoparticles. Using a simple electrochemical cyclic scanning activation, a
clean and fully activated surface of Pt nanoparticles was obtained. As a consequence, the mass-
23
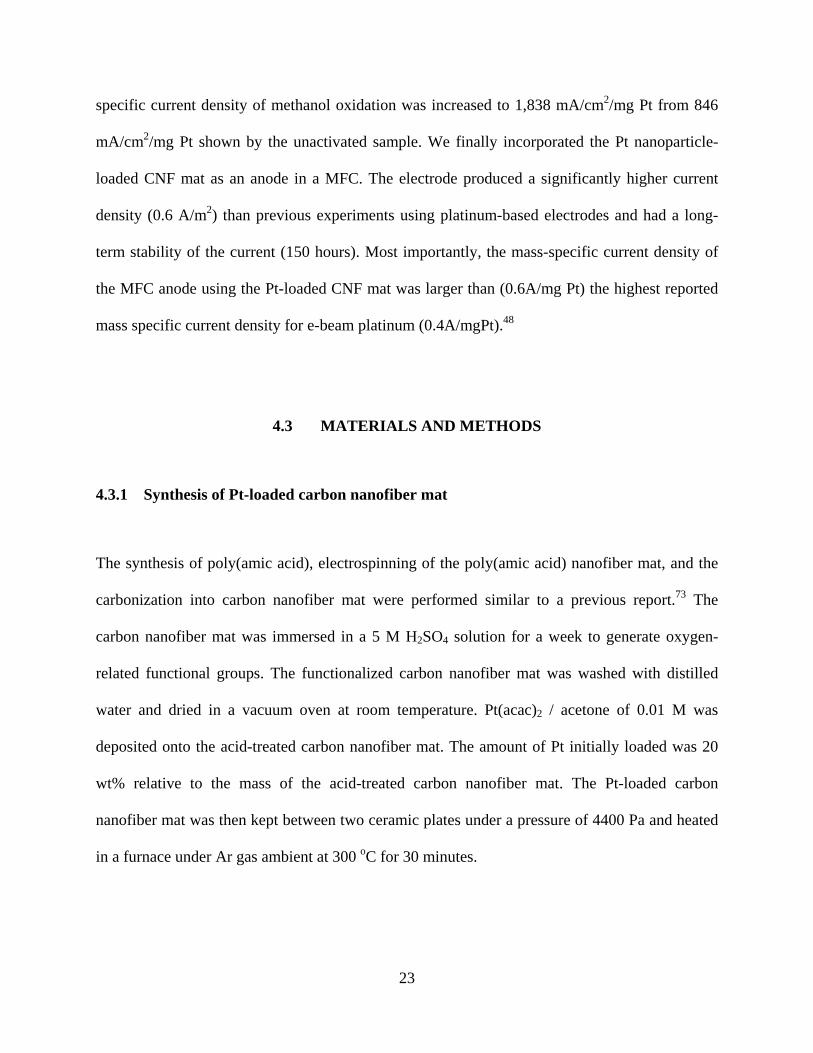
specific current density of methanol oxidation was increased to 1,838 mA/cm2/mg Pt from 846
mA/cm2/mg Pt shown by the unactivated sample. We finally incorporated the Pt nanoparticle-
loaded CNF mat as an anode in a MFC. The electrode produced a significantly higher current
density (0.6 A/m2) than previous experiments using platinum-based electrodes and had a long-
term stability of the current (150 hours). Most importantly, the mass-specific current density of
the MFC anode using the Pt-loaded CNF mat was larger than (0.6A/mg Pt) the highest reported
mass specific current density for e-beam platinum (0.4A/mgPt).48
4.3 MATERIALS AND METHODS
4.3.1 Synthesis of Pt-loaded carbon nanofiber mat
The synthesis of poly(amic acid), electrospinning of the poly(amic acid) nanofiber mat, and the
carbonization into carbon nanofiber mat were performed similar to a previous report.73 The
carbon nanofiber mat was immersed in a 5 M H2SO4 solution for a week to generate oxygen-
related functional groups. The functionalized carbon nanofiber mat was washed with distilled
water and dried in a vacuum oven at room temperature. Pt(acac)2 / acetone of 0.01 M was
deposited onto the acid-treated carbon nanofiber mat. The amount of Pt initially loaded was 20
wt% relative to the mass of the acid-treated carbon nanofiber mat. The Pt-loaded carbon
nanofiber mat was then kept between two ceramic plates under a pressure of 4400 Pa and heated
in a furnace under Ar gas ambient at 300 oC for 30 minutes.
24
4.3.2 Electrochemical activation of Pt nanoparticles
In order to activate the Pt nanoparticles, the Pt-loaded carbon nanofiber mat was directly
immersed into a 0.1 M H2SO4 solution. A three-electrode cell with a Pt mesh counter electrode
and a Ag/AgCl KCl saturated reference electrode was used to perform voltage scans. The voltage
was scanned by cyclic voltammetry (Bio-Logic SA-Model VSP # 0073, France) from -0.23 to +1
V with a scan rate of 50 mV/s. This cycle was repeated 10 times.
4.3.3 Microbial fuel cell setup
The anode and cathode compartments of the microbial fuel cell were separated by a cation
exchange membrane (Nafion-112; Dupont, Wilmington, DE). The anode compartment was
supplied with nitrogen sparged fuel to maintain anaerobic conditions and the cathode
compartment was supplied with air-saturated water. Both compartments contained an electrode
(1.0 × 4.0 cm2). Cathodes for all fuel cells were e-beam Pt (1000 Å thickness) deposited carbon
papers; deposition was made using an e-beam evaporator (VE-180, Thermoionics Laboratory,
Inc., Port Townsend, WA). The anodic biofilm was enriched from an anaerobic sludge taken
from the Franklin Township Municipal Sanitary Authority in Pittsburgh. The fuel cell was
inoculated using an artificial waste water containing 50 mM phosphate buffer (pH 7.0), glucose
and glutamate fuel,74 trace mineral solution,75 and a salt solution.76 The flow rate of the fuel
supplied to the anode was adjusted from 1 to, 3 to 15 rpm (1 rpm = 2.25 ml/ min). Current
density was monitored via a keithley meter connected to a personal computer.

25
4.3.4 Measurements
For transmission electron microscope (TEM) analysis, the prepared Pt-loaded carbon nanofiber
mat was ground into small fragments. This powder was dissolved in ethanol and sonicated in a
bath-type sonicator (Power Sonic 505, Hwashin) for up to a minute to get individually dispersed
nanofibers. This solution was then dropped on a carbon TEM grid and dried in a vacuum
furnace. The transmission electron microscope used was a field emission JEM 2010F (JEOL)
operated at 200 kV. The corresponding Fourier transform patterns were obtained during TEM
analysis. A scanning electron microscope (SEM, JEOL JSM6700F) was used to observe the
morphology of the Pt-loaded carbon nanofibers. Thermogravimetric analysis (TGA) was used to
measure the amount of Pt loading in the carbon nanofiber mat. The samples were ground and
dispersed in isopropanol by sonication and then dropped on a glassy carbon electrode with a 4
mm diameter. The measurement of catalytic activity was performed in methanol 1 M/ H2SO4 0.5
M. The methanol / H2SO4 solution was bubbled with N2 gas for 30 min to remove molecular
oxygen right before the measurement. An E-tek sample of 20 wt% Pt on Vulcan XC-72 (lot
#JJ121506) was used for comparison. The voltage was scanned from -0.225 V to +1.15 V vs
Ag/AgCl KCl sat using differential pulse voltammetry (pulse height; 3 mV, pulse width; 1 ms,
step height; 0.5 mV, step time; 100 ms) at room temperature. Scanning was conducted until the
curve was saturated to a stable state.

26
4.4 RESULTS AND DISCUSSION
The Pt-loaded CNF mat (4 x 5 cm2) is shown in Figure 4a. The CNF mat was closely packed, as
can be seen from the cross section (Figure 4b). The CNF mat was a highly permeable porous
material and its conductivity was 15 S/cm. Pt nanoparticles were uniformly distributed on the
nanofiber surface (Figure 4c). The size of the Pt nanoparticles was 2.9 ± 0.4 nm, measured from
X-ray diffraction. They were monodispersed on the surface of CNFs with a negligible amount of
aggregation which contrasts previous reports that some of the Pt nanoparticles were embedded in
bulk (Figure 4d,e).63, 77-78 A dark field (HAADF) TEM image of Pt-loaded CNF was also taken
to avoid the overlapping of Pt nanoparticles above and below the CNF surface. Excellent
uniformity of Pt nanoparticles was observed in Figure 4f. It is of note that due to the high
permeability of the CNF mat, the Pt nanoparticles decorated the surface of CNFs located deep in
the mat, as shown in Figure 4c. Typically, the conductivity of the supports is degraded due to the
use of functional groups to enhance adhesion of Pt to the supports.63 In our case, however, the
conductivity of the CNF mat was not degraded after Pt loading due to their direct adsorption on
the surface of the nanofibers.

27
Figure 4. (a) Optical microscope image of Pt-loaded CNF mat, (b) cross section of Pt-loaded CNFs,
(c) SEM image, (d)-(e) TEM image of Pt-loaded CNF mat before electrochemical activation, and (f) Dark
field TEM image of Pt-loaded CNF mat before electrochemical activation. Xuyen, Sanchez et al. 2010.
Diffusion-limited reduction of organometallic compound on carbon nanofiber mat for catalytic applications.
Journal of Materials Chemistry 20, 5468-5473. Reproduced by permission of The Royal Society of Chemistry.
28
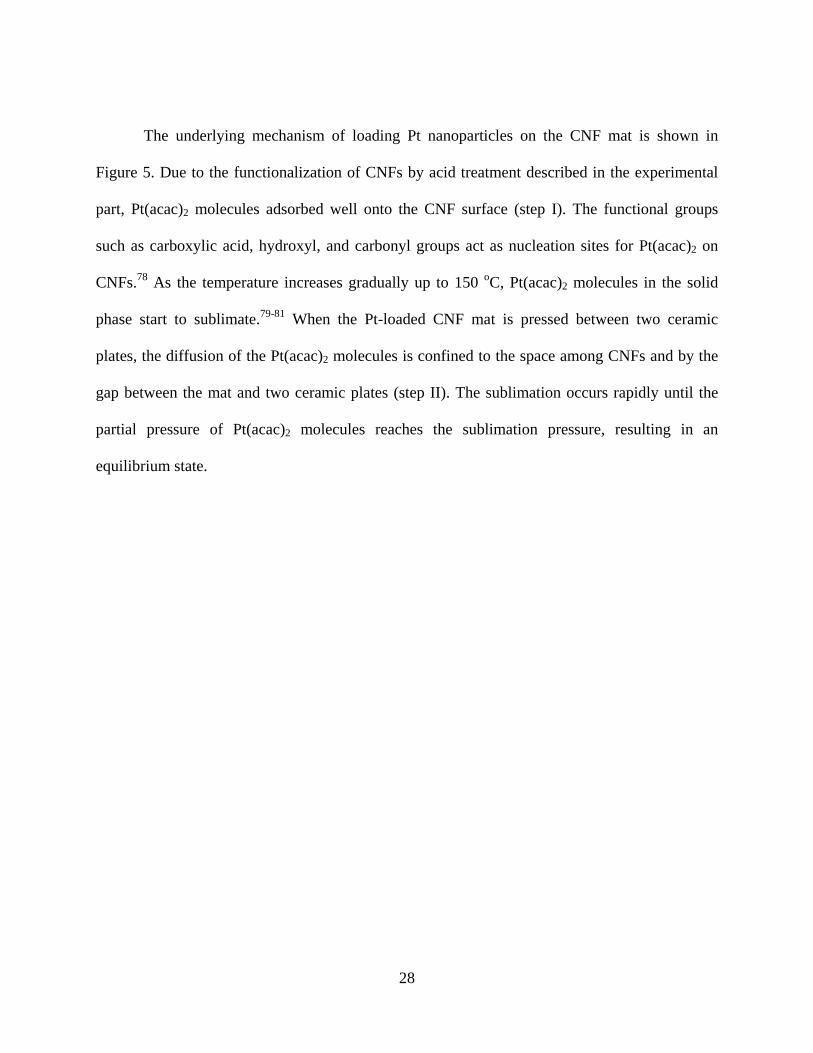
The underlying mechanism of loading Pt nanoparticles on the CNF mat is shown in
Figure 5. Due to the functionalization of CNFs by acid treatment described in the experimental
part, Pt(acac)2 molecules adsorbed well onto the CNF surface (step I). The functional groups
such as carboxylic acid, hydroxyl, and carbonyl groups act as nucleation sites for Pt(acac)2 on
CNFs.78 As the temperature increases gradually up to 150 oC, Pt(acac)2 molecules in the solid
phase start to sublimate.79-81 When the Pt-loaded CNF mat is pressed between two ceramic
plates, the diffusion of the Pt(acac)2 molecules is confined to the space among CNFs and by the
gap between the mat and two ceramic plates (step II). The sublimation occurs rapidly until the
partial pressure of Pt(acac)2 molecules reaches the sublimation pressure, resulting in an
equilibrium state.

29
Figure 5. Schematic of the equilibrium phase of Pt(acac)2 molecules on CNFs in a surrounding space
at elevating temperature, when the surrounding space of CNF mat is (a) confined and (b) open. Xuyen,
Sanchez et al. 2010. Diffusion-limited reduction of organometallic compound on carbon nanofiber mat for
catalytic applications. Journal of Materials Chemistry 20, 5468-5473. Reproduced by permission of The
Royal Society of Chemistry.

30
Due to the confined space, the amount of sublimated Pt(acac)2 is small compared to the
remaining solid phase of Pt(acac)2 on the CNF mat. Although more Pt(acac)2 molecules are
sublimated at an elevated temperature according to the Clausius-Clapeyron relation, the
increasing amount of Pt(acac)2 in the gas phase is negligible. This is in contrast with the case of
the open space in which the sublimated Pt(acac)2 molecules diffuse away. As the temperature
rises above 150 oC, the Pt(acac)2 molecules decompose leaving Pt nanoparticles behind (step III).
The confined space preserves the majority of Pt(acac)2 adsorbed onto the mat from
sublimating. TGA revealed that the nominal amount of Pt loaded (20 wt%) was reduced to 19.55
wt% after reduction, demonstrating the efficiency of reducing the adsorbed Pt(acac)2 molecules
in a confined space. This is excellent when contrasted with the case of the open space, where the
amount of Pt nanoparticles was only about 4.5 wt%. Ultimately, controlling the kinetics of Pt
precursors by diffusion-limited reduction not only minimizes the complication of procedures
such as the use various agents or time consuming tasks,62 but also produces a uniform
distribution of Pt nanoparticles through the porous mat. This is because the Pt(acac)2 molecules
were immobilized by the functional groups uniformly over the mat and then subsequently
reduced into nanoparticles.
We note that the geometry of the CNF mat was perfectly preserved during acid and heat
treatment, and the conductivity of the CNF mat was not degraded. These observations are
characteristic of methods that control the kinetics of Pt precursors, while keeping the support in a
static state. One such method was previously demonstrated for growing a catalyst on a polymer
membrane.62

31
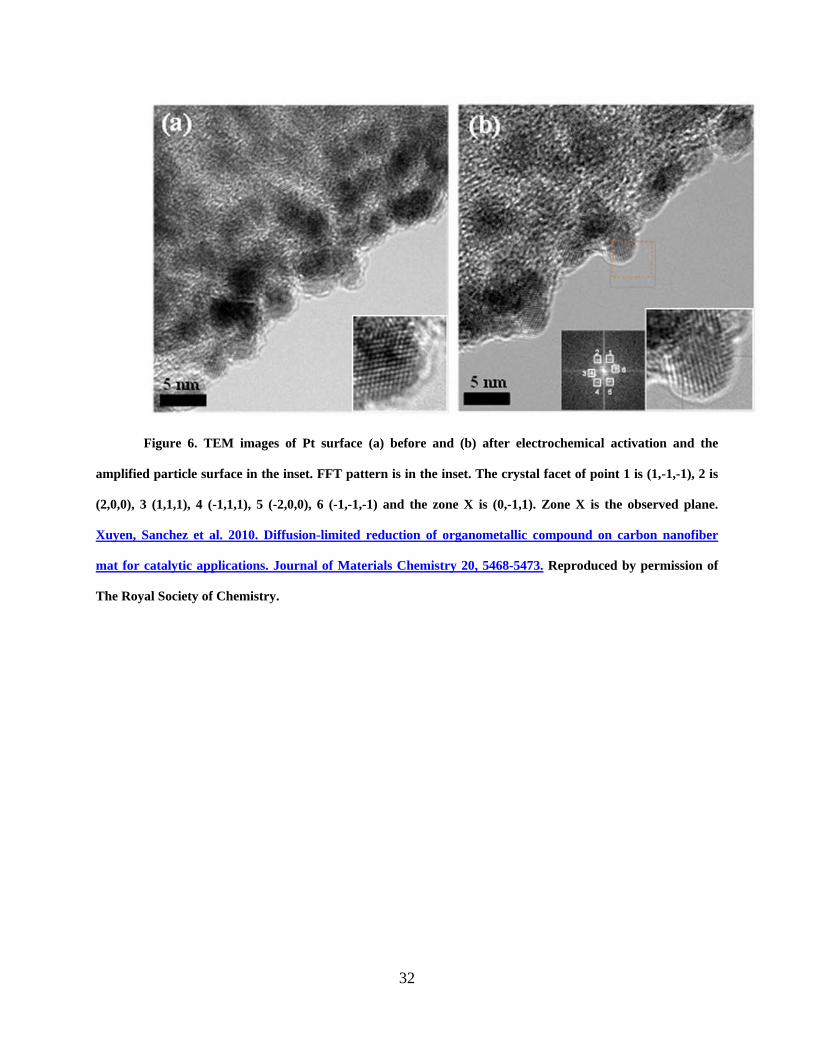
The sample was then activated electrochemically as described in the experimental section
(step IV). The effect of electrochemical activation on the Pt-loaded CNFs in acid solution can be
observed in the high-resolution TEM images (Fig. 2). The Pt nanoparticles were formed by heat
treatment under Ar ambient when the (acac) ligands decomposed and evolved into either the gas
phase or adsorbed fragments.80 The adsorption of these fragments onto the surface of Pt
nanoparticles cannot be avoided due to the high surface energy of Pt nanoparticles.82 This may
result in the outer layer of the Pt nanoparticles being covered by a form of hydrocarbon groups or
oxygen-containing species. This was confirmed in the high-resolution TEM images shown in
Fig. 2a. The inset clearly shows the presence of a thin film on the Pt nanoparticle. In order to
remove these contaminants, we chose a method of electrochemical cyclic scanning activation. It
has been shown that an applied potential is required to remove the hydrocarbon and oxygen-
containing species on Pt surfaces in acid solution.82-84
A wide range of applied potential from -0.23 V to +1 V was chosen to remove all of these
complexes and/or convert neutral Pt atoms. After a cyclic scanning process of ten cycles from -
0.23 to +1 V in H2SO4 solution, the surfaces of the Pt particles were cleaned completely as
shown in the inset of Figure 6b. The related fast-Fourier transformed (FFT) pattern of the
selected Pt nanoparticle in the inset is also shown in the inset. The hexagonal spots indicated by
the numbers of the FFT pattern are indicative of the different facets, as shown in the figure
caption. This is congruent with a previous report that the electrochemical treatment of Pt surfaces
can generate various facets of Pt surfaces to enhance the catalyst efficiency.
32
Figure 6. TEM images of Pt surface (a) before and (b) after electrochemical activation and the
amplified particle surface in the inset. FFT pattern is in the inset. The crystal facet of point 1 is (1,-1,-1), 2 is
(2,0,0), 3 (1,1,1), 4 (-1,1,1), 5 (-2,0,0), 6 (-1,-1,-1) and the zone X is (0,-1,1). Zone X is the observed plane.
Xuyen, Sanchez et al. 2010. Diffusion-limited reduction of organometallic compound on carbon nanofiber
mat for catalytic applications. Journal of Materials Chemistry 20, 5468-5473. Reproduced by permission of
The Royal Society of Chemistry.
33
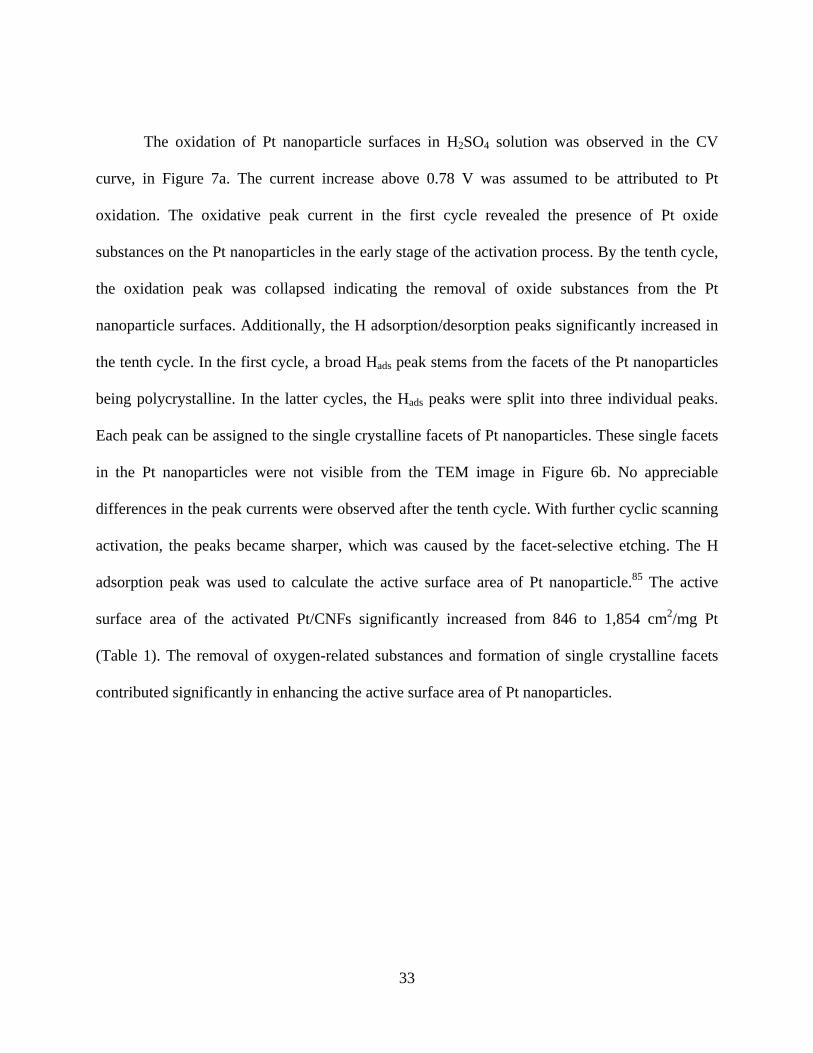
The oxidation of Pt nanoparticle surfaces in H2SO4 solution was observed in the CV
curve, in Figure 7a. The current increase above 0.78 V was assumed to be attributed to Pt
oxidation. The oxidative peak current in the first cycle revealed the presence of Pt oxide
substances on the Pt nanoparticles in the early stage of the activation process. By the tenth cycle,
the oxidation peak was collapsed indicating the removal of oxide substances from the Pt
nanoparticle surfaces. Additionally, the H adsorption/desorption peaks significantly increased in
the tenth cycle. In the first cycle, a broad Hads peak stems from the facets of the Pt nanoparticles
being polycrystalline. In the latter cycles, the Hads peaks were split into three individual peaks.
Each peak can be assigned to the single crystalline facets of Pt nanoparticles. These single facets
in the Pt nanoparticles were not visible from the TEM image in Figure 6b. No appreciable
differences in the peak currents were observed after the tenth cycle. With further cyclic scanning
activation, the peaks became sharper, which was caused by the facet-selective etching. The H
adsorption peak was used to calculate the active surface area of Pt nanoparticle.85 The active
surface area of the activated Pt/CNFs significantly increased from 846 to 1,854 cm2/mg Pt
(Table 1). The removal of oxygen-related substances and formation of single crystalline facets
contributed significantly in enhancing the active surface area of Pt nanoparticles.

34
Figure 7. (a) Cycle voltammetry of Pt/CNFs in 0.1 M H2SO4 at RT. Potential sweep rate is 50 mV/s.
(b) Differential pulse voltammetry of Pt-loaded CNFs in 1 M methanol and 0.5 M H2SO4 before (dotted line)
and after (solid line) electrochemical activation. Xuyen, Sanchez et al. 2010. Diffusion-limited reduction of
organometallic compound on carbon nanofiber mat for catalytic applications. Journal of Materials
Chemistry 20, 5468-5473. Reproduced by permission of The Royal Society of Chemistry.

35
Differential pulse voltammetry was used to investigate the catalytic activity of the Pt
nanoparticles for methanol oxidation. In order to see the catalytic effects from the Pt
nanoparticles exclusively, the current contribution from the CNF support was subtracted. Figure
7b shows the cyclic-voltammetry curves of Pt-loaded CNFs before and after electrochemical
activation. The curves describe the current contributed exclusively from methanol oxidation from
the Pt nanoparticles.
Table 1. Active surface area calculated from Hads peak in 0.1 M H2SO4, the maximum current
density, and ratio of area forward peak to backward peak of Pt/CNFs in methanol oxidation before and after
electrochemical activation. Xuyen, Sanchez et al. 2010. Diffusion-limited reduction of organometallic
compound on carbon nanofiber mat for catalytic applications. Journal of Materials Chemistry 20, 5468-5473.
Reproduced by permission of The Royal Society of Chemistry.
Hads peak Methanol oxidation
Samples Active surface area (cm2/mg Pt)
Im (mA/cm2/mgPt)
Af/Ab
Pt/CNFs 846 926 3.4
Activated Pt/CNFs 1,854 1,838 3.7

36
The pristine Pt-loaded CNF sample exhibited an oxidation current of 926 mA/cm2/mg Pt
in Figure 7b (dotted line). The advantages of a monodispersed size of 2.9 nm nanoparticles, a
high loading of Pt, the uniform distribution without embedment of the Pt nanoparticles, and the
high electrical conductivity of the support all contributed to the high performance of the
electrode. However, after electrochemical activation, the peak current and thus mass-specific
current density was significantly improved to 1,838 mA/cm2/mg Pt from 926 mA/cm2/mg Pt.
The increased active surface area of Pt nanoparticles, as evidenced from the ratios of active
surface area (see Table 1.), produced this higher methanol oxidation current. The peak position
of the forward scan was 0.76 V vs Ag/AgCl KCl sat for both samples. In both cases, the forward
current showed a rather broad peak, whereas the backward current showed a sharp peak. The
broad peak of the forward scan was due to several intermediate steps of oxidation of methanol.86-
88 With the backward scan, some of the un-reacted intermediate methanol derivatives produced
during the forward scan continued further reactions to generate CO2 which is the final product.89
In our case, a sharp peak in the backward scan was observed. The peak area ratio (Af/Ab) was
enhanced from 3.4 to 3.7 after electrochemical activation. We conclude here that electrochemical
cyclic scanning activation of the Pt-loaded CNFs offers a higher catalytic activity than the
pristine sample.
To test the catalytic activity of Pt nanoparticles on CNF mats and its effect on anode
performance, we tested them in a MFC (Figure 8a). In MFCs, catalysts are typically used to
decrease the internal resistance. In particular they are used to address overpotentials and improve
the performance of the biofim-anode.52, 90-91 The innoculant used was anaerobic sludge from
Franklin Township Municipal Wastewater Treatment plant.

37
Figure 8. (a) The principle of the mediator-less microbial fuel cell. (b) Current density of the Pt-
loaded CNF mat, the electrochemical (EC) activated Pt-loaded CNFs mat, and the e-beam deposited-
Pt/carbon microfiber paper electrode on the anode compartments at a fuel flow rate of 3 rpm. (c) Current
density of the Pt-loaded CNFs and the electrochemical activated Pt-loaded CNF electrode on the anode
compartments at a fuel flow rate of 3 rpm, 10 rpm, and 15 rpm. Xuyen, Sanchez et al. 2010. Diffusion-limited
reduction of organometallic compound on carbon nanofiber mat for catalytic applications. Journal of
Materials Chemistry 20, 5468-5473. Reproduced by permission of The Royal Society of Chemistry.

38
Figure 8b shows the current densities of the Pt-loaded CNF mat, an electrochemically
activated Pt-loaded CNF mat, and an e-beam deposited Pt/carbon paper electrode in a microbial
fuel cell at a fuel flow rate of 3 rpm. For 40 hours, the current densities of both the unactivated
and activated Pt-loaded CNF mat continuously increased while the e-beam deposited Pt/carbon
microfiber paper sample exhibited smaller current densities. Specifically, the current densities of
the unactived and activated Pt-loaded CNF mat at 40 hours were 4 times and 10 times higher
than that of the e-beam deposited Pt/carbon carbon paper, respectively. The difference in
catalytic activity can be attributed to the high surface area and activity of Pt nanoparticles. The
electrochemical activation of the Pt nanoparticles increased the current density twice compared
to the untreated sample. The Pt nanoparticles are likely promoting electron transfer between the
bacteria and the carbon support by decreasing the activation overpotential. As the fuel flow rate
was elevated, the slope of the current density curve increased. The flow rate increases and
current measurements were performed for 160 hours, as shown in Figure 8c. The fiber mat
allowed the fuel flow rate to reach as high as 15 rpm. From about 90 to 155 hours, the current
density of Pt-loaded CNF mat and the current density of the electrochemically activated Pt-
loaded CNF mat were saturated at 0.17 and 0.6 A/m2, respectively. Similar current densities were
previously reported for continous flow reactors.18, 92 Although the media was changed at several
steps, marked by arrows in the figure, the current rapidly recovered and maintained the saturated
value for both samples. In addition, the electrochemically activated Pt-loaded CNF mat was
tested further after being exposed to air for ten days. It still showed the high current density of
about 0.57 A/m2. This trend proves that the clean Pt nanoparticles play an important role in
harvesting electrons from bacteria metabolic reactions. Finally the mass-specific current density
of the activated Pt-loaded CNF mat (0.6A/mgPt) in the MFC was larger than the highest reported

39
mass-specific current density for e-beam evaporated Pt electrodes (0.4A/mgPt)48 confirming that
an increasing catalyst surface area is necessary for increasing MFC current density.
4.5 CONCLUSIONS
In conclusion, the diffusion-limited reduction process preserved Pt(acac)2 molecules on the CNF
mat until Pt(acac)2 molecules were decomposed into Pt nanoparticles. A high loading yield,
uniform distribution, and a uniform size of Pt nanoparticles were obtained. The subsequent
electrochemical activation of Pt nanoparticles removed the contaminants (e.g. residual (acac)
ligands) and generated specific facets to enhance the active surface area of Pt nanoparticles. This
was observed via TEM, Hads measurements and methanol oxidation tests. The effect of the new
electrode on MFC current density was then evaluated.
Using the new electrode MFC current density was increased relative to the e-beam Pt electrode,
with the device producing a current of up to 0.6 A/m2 with a long-term stability of up to 150
hours. The recorded mass-specific current density was (0.6A/mgPt) and was larger than the
highest reported mass-specific current density reported for e-beam evaporated Pt electrodes
(0.4A/mg Pt)48 showing an increase by a factor of 1.5. This confirms that increasing the active
surface area of the Pt catalyst using nanoparticles is more efficient at increasing MFC current
density than mere Pt surface deposition. More importantly, the results suggest that increasing
active surface area of the Pt catalyst is necessary for increasing current production despite the
fact that Pt loadings for MFCs are comparable to hydrogen fuel cells yet MFC current densities
are significantly smaller. Finally, this research demonstrates a practical nanoparticles-based

40
deposition method that can be applied to load various organometallic compound-based catalysts
on various carbon-based supports for future MFC research.
41
5.0 EVALUATING THE EFFECT OF INCREASED PLATINUM SURFACE AREA
ON THE CATHODE REACTION BY INCOPORATING PT NANOPARTICLES INTO
THE CATHODE AND MEASURING MASS-SPECIFIC CURRENT DENSITY
After demonstrating that incorporating Pt nanoparticles into the anode increases MFC current
density we focused on whether the increased surface area of Pt nanoparticles could improve the
cathodic oxygen reduction rate. The oxygen reduction reaction has a high activation
overpotential and previous MFC experiments 48, 93 have shown that incorporating platinum onto
the cathode electrode improved performance. The difference is that while we sought to
efficiently increase the Pt catalyst surface area to increase MFC current density we also did so
trying to eliminate the use of binders and mediators that would increase costs and potentially
contaminate the catalyst.50
5.1 SUMMARY
This section of the dissertation describes the characterization and evaluation of a single wall
carbon nanotube (SWNT) sheet electrode with infused platinum nanoparticles (nPts) as a cathode
in a microbial fuel cell. The design is intended to increase electrode efficiency by increasing the
surface area to volume ratio of Pt and thus the available surface area of the catalyst. The
electrode fabrication procedure is an extension of the conventional bucky-paper like fabrication

42
technique to a two-component system and incorporates nPt throughout the thickness of the
sample. The electrodes were characterized via scanning electron microscopy (SEM), Raman
spectroscopy, transmission electron microscopy (TEM), and cyclic voltammetry (CV). Our
characterizations confirmed the architecture of the electrodes and the current density from our
MFC increased significantly, approximately an order of magnitude, when an e-beam evaporated
platinum cathode was replaced with this SWNT-nPt sheet electrode. The enhancement of
catalytic activity can be associated with the increase of Pt surface area in the active cathode layer
as shown by the increase in mass-specific current density of Pt by a factor of 4. Our data clearly
suggest that nanoparticles co-deposited into layers of nanotubes can more efficiently catalyze the
cathodic reaction than electrodes that efficiently deposit Pt on its surface.
5.2 INTRODUCTION
In order to become a viable source of renewable energy, MFCs require an increase of
current densities relative to their abiotic counterparts.12, 94 The increase of current density
requires a decrease of the internal resistance (often characterized by ohmic losses), an
improvement of proton transport out of the biofilm, and a reduction of overpotentials for both
anodic95 and cathodic reactions.90, 96

43
Figure 9. Schematic diagram of a microbial fuel cell (MFC) system. As bacteria (yellow rods)
consume glucose, the produced free electrons flow from the anode to cathode via the electrical circuit while
protons are transferred from anode to cathode through a proton exchange membrane (Nafion). Reprinted
with permission from Sanchez et al. 2010. Carbon Nanotube/Platinum (Pt) Sheet as an Improved Cathode for
Microbial Fuel Cells. Energy & Fuels 24, 5897-5902. Copyright 2010 American Chemical Society.
44
Addressing the issues for both anode respiration and the oxygen reduction reactions can
significantly affect MFC performance. For example, cathodic performance was shown to
improve greatly by augmenting proton transport with buffers, using low pH catholyte solutions,
and incorporating platinum (Pt) or other catalysts into cathodes.54 However, to attain high current
densities platinized MFC electrodes have typically used high Pt surface loading (>0.4mg/cm2),12
expensive binders (i.e. Nafion)55 and artificial mediators (i.e. FeCN). Increasing current
densities by loading Pt efficiently, increasing the available surface area of Pt and eliminating
binders and artificial mediators are the steps needed to make MFCs an industrially viable
technology.
5.2.1 Mass transfer limitations and oxygen reduction kinetics
The high overpotentials of cathodic reactions in oxygen-based microbial fuel cells12 originate
from i) the concentration overpotential caused by inadequate proton transport to the cathode and
ii) the surface overpotential, a consequence of the 4- electron transfer needed for oxygen
reduction (see Equation 1). 93
(1) O2 + 4H+ + 4e- → 2H2O
The rate-determining reaction on a modified cathode was shown to change from 4e-/4H+
to 4e-/2H+ with a variation of pH. As pH increased the oxygen reduction potential decreased.
Negative slopes of 59mV/pH and 29mV/pH for pH below and above97 respectively, were
demonstrated for cathodes with surface catalysts.93 As a quick illustration, open-circuit
potentials of ~0.6V, ~0.33V, and ~0.27V were shown for a carbon foil electrode with a CoTMPP
(cobalt tetramethoxyphenylporphyrin) catalyst at pHs of ~1,~7, ~9.3 respectively.93
45
Additionally, the rate determining reactions (i.e. four electron and two electron transfers
for oxygen reduction) have been studied in alkaline media using bulk platinum and are shown in
Equations 2 and 3 respectively98 :
(2) O2 + 2H2O + 4e- → 4OH-
(3) O2 + H2O + 2e- → HO-2 + OH-
Since the concentration of protons at neutral pH is about 3 orders of magnitude lower
than the concentration of oxygen in air saturated water (~9mg/L) and 4 protons per oxygen
molecule are needed for the cathodic reaction to occur (Equation 1), a proton mass transfer
limitation can typically be expected in MFCs. Torres et al. and Zhao et al. defined proton mass
transfer limitations for both bio-anodic (proton generating) and cathodic (proton consuming)
reactions.93, 95 These mass transfer limitations can be reduced by the addition of concentrated
phosphate buffer to the anolyte or acid to the catholyte. Only when proton mass transfer
limitations are removed are oxygen mass transfer limitations realized. For example, under acidic
conditions and a high catalyst loading of (1 mg/cm2 ) Zhao et al. demonstrated a mass transfer
limitation for oxygen. Ultimately, cathode performance primarily depends on the proton
concentration so that the oxygen reduction rate increases with a decreasing pH and or an
increasing buffer concentration.
Enhancing the reactivity at the cathode is important since oxygen reduction requires a 4
electron transfer. Fortunately, the reactivity can be improved via the addition of catalysts such as
Pt. For neutral pH solutions, which are preferred for MFCs, a higher catalyst loading correlates
with an increased rate of oxygen reduction and higher current densities,93 To demonstrate the

46
trade-off between maintaining a neutral pH and adding a catalyst it was shown that as the Pt
loading increased from 0.5 mg/cm2 to 2 mg/ cm2 the current density in a pH neutral solution with
a phosphate buffer concentration of 0.1M increased from 45% to 74% of the value recorded for a
solution at pH 3 with 0.5M phosphate buffer.93
5.2.2 Nanostructured Electrodes
Nanostructured carbon-based materials, nanotubes in particular, can have high surface area to
volume ratio, mechanical strength, high electrical conductivity, and catalytic properties. As a
result, nanomaterials can be beneficial to MFC performance if they are used for electrodes
instead of conventional bulk graphite.99-100 Considering that carbon nanotubes can be assembled
into highly porous macroscopic paper-like sheets similar to carbon microfiber mats from Toray
Industries48 the scalability issues for nanotube sheet fabrication can be similar. In fact, carbon
nanotube sheets can presently be manufactured from liquid-dispersed carbon nanotubes, using a
process similar to that used for making ordinary paper.
MFCs utilizing nanostructured electrodes have yielded promising results. Park et al.
showed that electron beam (e-beam) Pt deposition improves the performance of plain carbon
paper from Toray Industries,48 Sharma et al. reported the impact of noble nanoparticles and
artificial mediators on improving current density,91 and Zou et al. improved MFC performance
using polypyrrole coated nanocomposites.59 These and other examples demonstrate the ability of
catalysts to decrease activation overpotentials, and the utility of high surface-to-volume ratio
electrode structures for improving MFC performance.
The concept of incorporating nPt into the cathode is motivated by the fact that reducing
oxygen at the cathode in fuel cells is a relatively slow reaction that can be improved with a
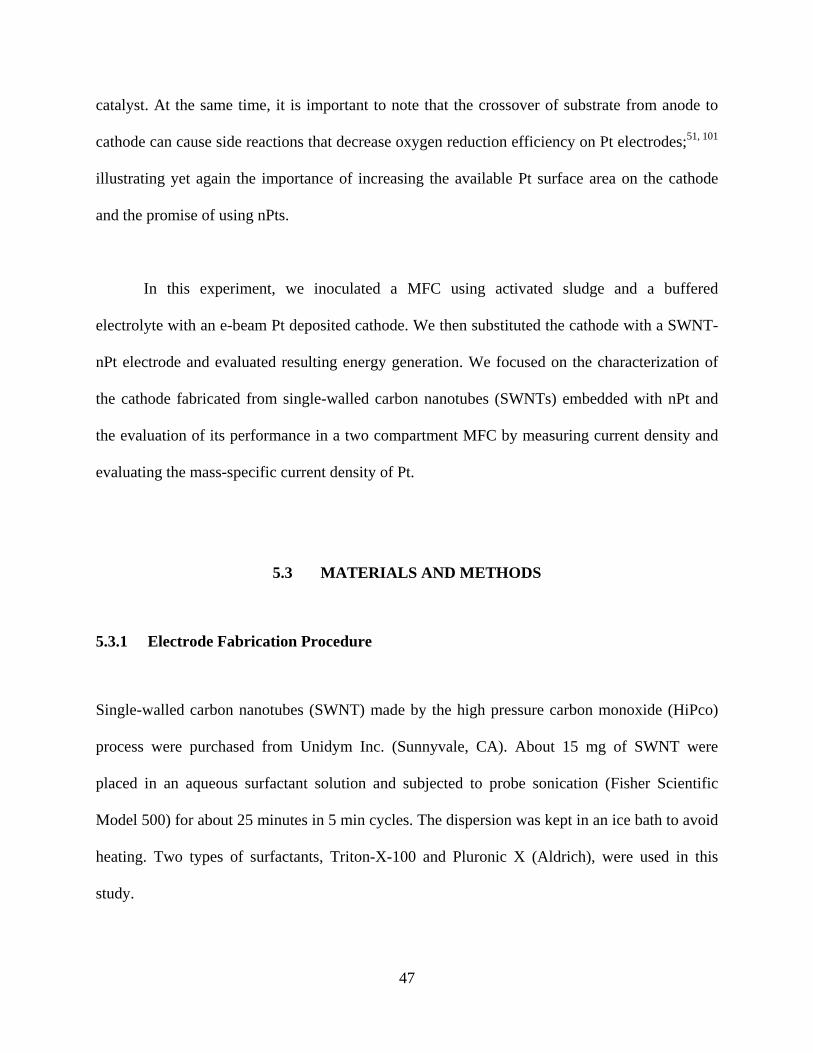
47
catalyst. At the same time, it is important to note that the crossover of substrate from anode to
cathode can cause side reactions that decrease oxygen reduction efficiency on Pt electrodes;51, 101
illustrating yet again the importance of increasing the available Pt surface area on the cathode
and the promise of using nPts.
In this experiment, we inoculated a MFC using activated sludge and a buffered
electrolyte with an e-beam Pt deposited cathode. We then substituted the cathode with a SWNT-
nPt electrode and evaluated resulting energy generation. We focused on the characterization of
the cathode fabricated from single-walled carbon nanotubes (SWNTs) embedded with nPt and
the evaluation of its performance in a two compartment MFC by measuring current density and
evaluating the mass-specific current density of Pt.
5.3 MATERIALS AND METHODS
5.3.1 Electrode Fabrication Procedure
Single-walled carbon nanotubes (SWNT) made by the high pressure carbon monoxide (HiPco)
process were purchased from Unidym Inc. (Sunnyvale, CA). About 15 mg of SWNT were
placed in an aqueous surfactant solution and subjected to probe sonication (Fisher Scientific
Model 500) for about 25 minutes in 5 min cycles. The dispersion was kept in an ice bath to avoid
heating. Two types of surfactants, Triton-X-100 and Pluronic X (Aldrich), were used in this
study.

48
Approximately 0.1g Triton-X-100 in 50 mL of water was added to the SWNT
dispersions. Sonication continued for ~5-10 minutes until a good dispersion was achieved, thus
allowing for the uniform addition of ~15 mg nPt (Aldrich Platinum black HiSPEC 1000) . The
solution was diluted with one liter of water and a decanting-method was used to repeat the
process. The whole solution was then filtered through a vacuum filter apparatus with a 47mm
diameter filter (Millipore, 10-micron MITEX PTFE membrane filters). After filtration, 1000 mL
of water was passed through the filter until all foam disappeared. A second 1000 ml solution of
30% methanol was passed through the filter. The methanol solutions were diluted to ensure that
methanol would not react directly with oxygen in the air using Pt in the carbon nanotube paper as
a catalyst. The vacuum was released and the vacuum filtration apparatus was disassembled.
Immediately, another 10-micron MITEX PTFE membrane filter was placed on top of the carbon
nanotube sheet forming a “sandwich”. The whole vacuum filtration apparatus was reassembled
and the vacuum was continually applied for one hour. The purpose of enclosing carbon nanotube
paper between two membranes was to maintain a flat and uncurled sheet. After air-drying for an
additional hour, the membrane filter was peeled off. The process was also conducted using
Pluronic-X in place of Triton–X-100. The carbon nanotube paper with nPt was then used as the
anode and or cathode of the MFC. It is important to note that the size and shape of the SWNT-
nPt sheet prepared in this way is limited only by the size and shape of the membrane filter used.
5.3.2 Characterization of SWNT-nPt electrode
In this study SWNT-nPt electrodes were characterized using three different methods: scanning
electron microscopy (SEM), Raman spectroscopy, and transmission electron microscopy (TEM).

49
5.3.2.1 SEM
In order to ensure that the nPt had not completely agglomerated throughout the sample or on the
surface of the SWNT-nPt sheet, SEM images were taken of the electrode surface and from
fractured sample using a LEO 1530VP field emission microscope. Electrode samples were cut at
random positions and viewed in a scanning electron microscope at different magnifications for
the surface analysis.
5.3.2.2 Raman Spectroscopy
Raman spectroscopy provides spectra between 100 cm-1 and 3500cm-1 for 633nm laser excitation
which was used to characterize the SWNTs in the electrodes and to detect the presence of
contaminants, such as surfactants or organic residue from the production of carbon nanotubes, in
the electrodes. A Jobin Yvon LabRam HR800 Raman Microscope was used.
5.3.2.3 TEM
To confirm the distribution and sizes of nPt in the SWNT-nPt matrix, a small sample (~0.25 cm2)
was sonicated in isopropyl alcohol for a total of 35 minutes. Water in the sonication bath was
exchanged every 7 minutes to avoid temperature increase in the solution. A sample of the
isopropyl alcohol solution containing SWNT-nPT was deposited on a lacey carbon TEM grid
and dried. Images were taken at several magnifications using JEOL 2100F TEM/STEM machine
at 200kV. The images were used to determine the size of the nPt and the relative dispersion.

50
5.3.3 Microbial fuel cell (MFC) System
A dual compartment MFC, separated by a Nafion proton exchange membrane (Nafion-112;
Dupont, Wilmington, DE)102 was used with each compartment holding a 4 cm x 1cm electrode.
An external resistor (10 Ω) was used as a fixed load and the potential across the resistor was
measured with a Keithley meter (Model 2701 DMM, Keithley Instruments, Inc. Cleveland, OH)
and collected via a personal computer.48 Influent was pumped into the reactor using a peristaltic
pump (Watson-Marlow 323S Bredel, Watson-Marlow Inc. Wilmington, MA) and attached
cassette (Watson Marlow 314MC cassette) at a rate of 3 rpm using marprene tubing with a 2.79
mm bore. The anode compartment was continuously sparged with nitrogen throughout the
experiment.
5.3.3.1 Anode
Glucose(50ppm), glutamic acid (50ppm), and phosphate buffer (100mM, pH 7.5) were added to
a media consisting of a trace element and salt solution described previously.103 Each reactor was
inoculated with activated sludge (biomass taken from the aeration tank in a wastewater treatment
plant) from ALCOSAN wastewater treatment plant (Pittsburgh, PA) and was recycled through
the reactors until current was generated. Substrate was then fed in continuously until a significant
amount of current was produced. The start-up procedure lasted about 1 week after which cathode
testing commenced. After testing in the MFC was complete, anodes were extracted and imaged
using SEM (SEM; e-LiNE, Raith GmbH, Germany) to ensure the accumulation of a biofilm.

51
5.3.3.2 Cathode
The cathode was fed with air-saturated water containing phosphate buffer and the same salt
solution as in the anolyte. The influent was pumped using the same setup described above. For
the first part of the experiment,1000Å Pt was deposited on plain Toray carbon paper (TGPH-120,
E-tek, Somerset, NJ) using an e-beam evaporator (VE-180, Thermionics Laboratory). This
electrode containing e-beam deposited Pt was inserted as the cathode. E-beam deposited Pt
electrodes were used as a base for comparison because they were previously tested in MFCs.48 It
is also important to note that e-beam evaporation does not deposit Pt throughout the thickness of
the sample. The e-beam Pt deposited electrodes (1000 Å) in the cathode compartment were used
in operation for 2 days and were then replaced by a SWNT-nPt sheet electrode in order to
evaluate relative performance. The MFC was again operated for a day after the replacement.
Samples of both SWNT-nPt and e-beam Pt (1000 Å) electrodes, 1cm2 in size, were placed in a
100mM phosphate buffer solution, an Ag/AgCl reference electrode, and a 2cm2 e-beam Pt
counter electrode. The solution was continuously sparged with air. Cyclic voltammetry was
performed on each cathode individually using a CH Instruments 1040A potentiostat at a scan rate
of 2mV*s-1 in the range of -0.2V to 1.2V (vs Ag/AgCl).
5.4 RESULTS AND DISCUSSION
The SEM image in Figure 10A shows the uniform architecture of the SWNT-nPt matrix at the
micro scale. Assemblies of SWNT bundles were seen throughout the thickness of the sample.
Figure 10B at higher magnification shows the uneven topography and high surface area that we
expected.
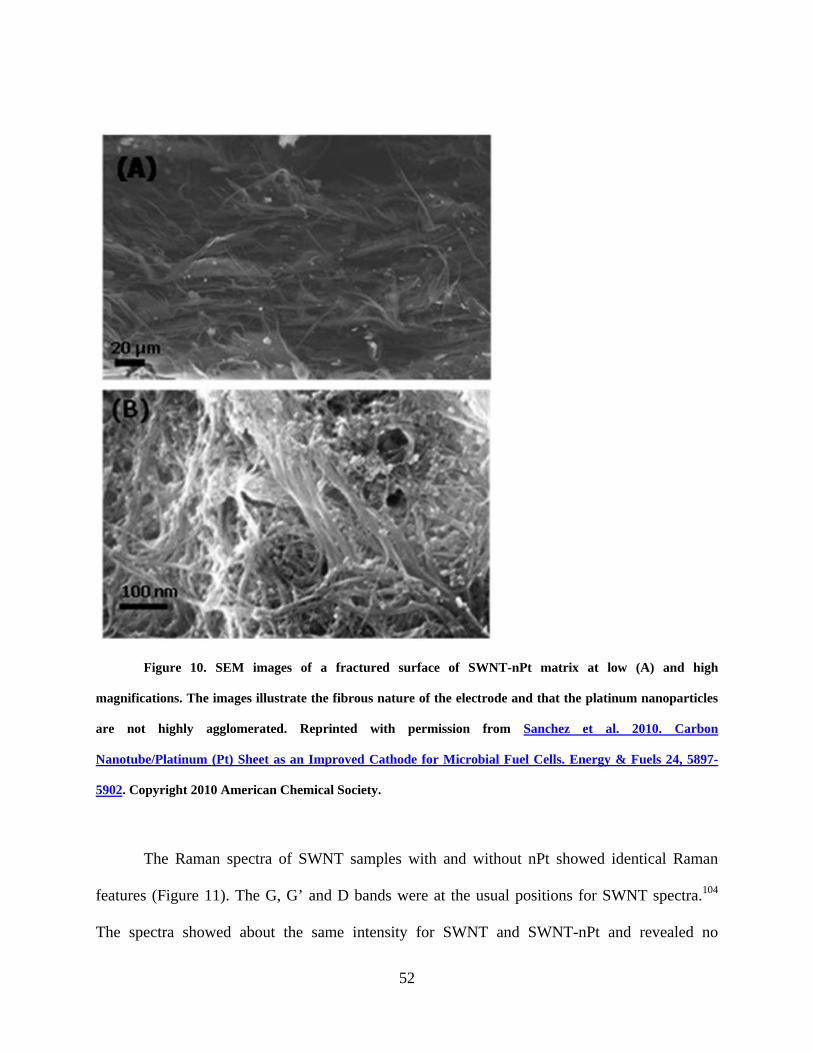
52
Figure 10. SEM images of a fractured surface of SWNT-nPt matrix at low (A) and high
magnifications. The images illustrate the fibrous nature of the electrode and that the platinum nanoparticles
are not highly agglomerated. Reprinted with permission from Sanchez et al. 2010. Carbon
Nanotube/Platinum (Pt) Sheet as an Improved Cathode for Microbial Fuel Cells. Energy & Fuels 24, 5897-
5902. Copyright 2010 American Chemical Society.
The Raman spectra of SWNT samples with and without nPt showed identical Raman
features (Figure 11). The G, G’ and D bands were at the usual positions for SWNT spectra.104
The spectra showed about the same intensity for SWNT and SWNT-nPt and revealed no

53
significant shifting or broadening of the peaks. The dominant peak near 1580cm-1 is
characteristic of SWNT and typically relates to the phonon modes.104 These spectra indicate a
consistency in the process of electrode fabrication. Most importantly, the material did not change
during the process and no contaminant, such as surfactant used to disperse SWNTs or organic
material from source carbon nanotubes, was found.
Figure 11. Raman spectra of SWNT samples with and without platinum nanoparticles. The samples
were measured using 633nm laser excitation. This image shows that there is no notable shift in the G,G’, and
D bands between SWNTs with and without platinum nanoparticles. Reprinted with permission from Sanchez
et al. 2010. Carbon Nanotube/Platinum (Pt) Sheet as an Improved Cathode for Microbial Fuel Cells. Energy
& Fuels 24, 5897-5902. Copyright 2010 American Chemical Society.

54
The TEM images in Figure 12 illustrate the size and distribution of nPt throughout the
SWNT sheet. Relatively complete coverage of the SWNTs with nPt can be seen in Figure 12A.
The distribution of these nPt throughout the SWNT matrix was such that nPts were clearly
separated and well distributed with rare occurrences of agglomeration. Sizes of nPt were
between 4-10nm and were confirmed with images of increasing magnification shown in Figure
12B,C and D.

55
Figure 12. TEM images of SWNT-nPt samples at (A) low magnification, (B) medium magnification,
(C) high magnification, and (D) magnification of inset in B. The images show 4-10nm platinum nanoparticles
evenly dispersed in the SWNT matrix. Reprinted with permission from Sanchez et al. 2010. Carbon
Nanotube/Platinum (Pt) Sheet as an Improved Cathode for Microbial Fuel Cells. Energy & Fuels 24, 5897-
5902. Copyright 2010 American Chemical Society.

56
Figure 13A shows the difference in anodic performance for the SWNT with embedded
nPt made with different surfactants; e-beam Pt (1000Å) electrodes were used as cathodes. It is
important to note that e-beam Pt (1000Å) cathodes were previously shown to increase current
density (~0.2 A/m2) when substituted for plain carbon cathodes. This serves as our performance
reference for improving the cathode electrode with nPts. The shapes of the current density
profiles in Figure 13A were similar to each other and the difference in performance of the two
electrodes was small. The shape of the current densities/voltage discharge seen in Figure 13A
and B are similar to those reported previously.59 The initial discharge is typically followed by a
plateau of the current density which could be due to activation overpotentials of the biofilm
anode and/or slow diffusion of reduced mediators that may be in the biofilm. To test the
reactivity of the cathode the influent pump for the cathode was shut off for 5 hours to decrease
the oxygen reduction rate but allow charge (i.e. reduced mediators and or proteins) to accumulate
within the biofilm anode as bacteria continued to consume the substrate. The shut-off period
occurred from hours 22 to 27 in Figure 13A, which resulted in the increase in charge in the
biofilm anode. As the influent pump for the cathode was re-started at the 27th hour to increase
the oxygen concentration in the cathode a second peak discharge occurred (Figure 13A). This
peak discharge confirms the accumulation of charge in the biofilm anode and characterizes the
reactivity of the cathode.
57
Figure 13. Current density profiles from a Microbial Fuel Cell employing (A) SWNT-nPt pluronic
acid (■) and SWNT-nPt Triton-X (●)anodes with e-beam Pt (1000 Å ) cathodes and (B) SWNT-nPt Triton X
electrodes loaded with Pt (0.5mg/cm2) (▲) as the anode and cathode. The results are superimposed on each
other in Figure 6B. Note that changing the cathode from an e-beam Pt electode (1000 Å) to a SWNT-nPt
electrode improved the current density ~an order of magnitude. Reprinted with permission from Sanchez et
al. 2010. Carbon Nanotube/Platinum (Pt) Sheet as an Improved Cathode for Microbial Fuel Cells. Energy &
Fuels 24, 5897-5902. Copyright 2010 American Chemical Society.

58
In Figure 13B the e-beam Pt cathode that is coupled with the lower performing anode
(SWNT-nPt-Triton X) is swapped for a SWNT-nPt- Triton X cathode. The discharge peak and
current density plateau are then increased by almost an order of magnitude. This is most
interesting when we examine the Pt loading for each electrode. The loading for an e-beam
evaporated Pt electrode at 1000Å thickness is 0.215mg/cm2 and the Pt loading for the SWNT-nPt
electrode is more than double that amount (0.576mg/cm2). However, when we conservatively
compare the mass-specific current densities (Amps/ mg Pt) the SWNT-nPt-Triton-X electrode
(0.1A/m2 / 0.576mg) outperforms the e-beam Pt cathode (0.01A/m2 /0.215mg) by a ratio of 4:1.
Cyclic voltammograms (CVs) for both SWNT-nPt and e-beam evaporated Pt (1000Å)
electrodes are provided in Figure 14. The reaction rate for oxygen reduction on SWNT-nPt when
compared to the e-beam Pt electrode is significantly higher than for the e-beam evaporated Pt
(1000Å) electrode. The results are consistent over the 4 cycles.

59
Figure 14. Cyclic scans of SWNT-nPt and e-beam Pt (1000 Å) electrodes illustrating effect of each
electrode on the oxygen reduction reaction. At a scan rate of 2mV/s in a range of -0.2V to 1.2V (vs Ag/AgCl)
the SWNT-nPt demonstrated superior performance. Reprinted with permission from Sanchez et al. 2010.
Carbon Nanotube/Platinum (Pt) Sheet as an Improved Cathode for Microbial Fuel Cells. Energy & Fuels 24,
5897-5902. Copyright 2010 American Chemical Society.

60
The SEM image in Figure 15 confirms the accumulation of a biofilm on the anode. The
bacteria are rod-shaped and seen throughout the sample. The top left of the image shows a
putative bionanowire traversing the biofilm105 which were scattered throughout the sample.
Figure 15. SEM image of the biofilm accumulated on the SWNT-nPt anode surface in a microbial
fuel cell. Most of the bacteria are rod shaped which was consistent throughout the sample. Reprinted with
permission from Sanchez et al. 2010. Carbon Nanotube/Platinum (Pt) Sheet as an Improved Cathode for
Microbial Fuel Cells. Energy & Fuels 24, 5897-5902. Copyright 2010 American Chemical Society.
61
5.5 CONCLUSIONS
In this chapter, I present the preparation of MFC cathodes using SWNT-nPt dispersions and their
characterizations. The fabrication method used for this SWNT-nPt cathode is an extension of the
conventional bucky-paper fabrication technique for a multi-component system and it combines
nPts and SWNTs into filter sheets. The electrodes were characterized with SEM, Raman
spectroscopy, and TEM confirming nPt size, the even dispersion of nPt and the composition and
structure of our electrode. These characterizations confirmed a successful integration of the two
components; SWNT and nPt.
More importantly, the novel electrode improved the cathodic reaction rate in MFCs by
increasing the current density by approximately an order of magnitude when used to replace an
e-beam Pt (1000Å) cathode. These findings suggest that when the cathode is under kinetic
control (i.e. mass transfer is not limiting) the oxygen reduction reaction can be effectively and
more efficiently catalyzed by smaller Pt constituents (nPt) that are deposited throughout the
electrode as opposed to solely on the surface. Increasing the surface area of platinum by using
nanoparticles and maintaining an even distribution of those nanoparticles within an SWNT
matrix increases MFC current density and the mass-specific current density of Pt 4-fold.
Finally, the electrode fabrication and catalyst deposition method determine the catalyst
surface area available for the oxygen reduction reaction and are paramount to improving the
oxygen reduction rates in MFC cathodes and ultimately MFC current density. Nanoparticles
intermixed with SWNTs hold great potential to improve the cathodic reaction in MFCs. As a

62
result future research directions include decreasing the nPt loading, using non-noble metal
nanoparticles, and long term feasibility studies.
In the previous two sections, the incorporation of platinum nanoparticles as a catalyst
onto CNF mats and SWNTs demonstrated the significance of increasing MFC current density by
using nanofabrication methods to increase Pt surface area in MFC electrodes. This is surprising
when we extrapolate from the mass-specific current densities of hydrogen fuel cells
(2000mA/cm2/ mg Pt) the amount of Pt that would be necessary to maintain high current
densities in MFCs (i.e. 0.5μg Pt for 1 mA/cm2). In other words, when we consider the fact that
MFC Pt catalyst loadings are similar to those used to produce current densities 2-3 orders of
magnitude greater via hydrogen fuel cells, it is surprising that increasing Pt surface area is still a
an effective method to significantly increasing MFC current density.

63
6.0 THE EFFECTS OF CARBON ELECTRODE SURFACE MORPHOLOGY ON
BIOFILM-ANODE PERFORMANCE (BY SHEWANELLA ONEIDENSIS MR-1) USING
A TUBULAR ELECTRODE CONSTITUENT MATERIAL
The previous two chapters determined that increasing catalyst surface area, by way of
incorporating platinum nanoparticles, increases both anodic and cathodic contributions to MFC
current density. In wanting to determine how the whole electrode (catalyst/electrode) influences
the bio-electrochemical reaction it is then essential that the influence of the bare electrode on the
bioelectrochemical reaction in MFCs also be investigated. In the following experiment I examine
the effect of carbon fiber properties on anode-respiration by Shewanella oneidensis MR-1. A
pure culture is chosen to reduce the complexity of the biofilm-anode’s physiological profile (e.g.
elimination of methanogenesis, bacterial competition, and additional electron sinks). This
particular strain is chosen since its bioelectrochemical physiology is well documented in the
literature. For example, both its mediated and direct electron transfer mechanisms to an electrode
have been determined and electrochemically evaluated (e.g. it uses riboflavin as a mediator and it
is oxidized at -0.41V vs Ag/AgCl)27 thus enabling one to electrochemically determine how the
bacteria are interacting with the electrode.

64
6.1 SUMMARY
The formation of biofilm-electrodes is crucial for microbial fuel cell current production because
optimal performance is often associated with thick biofilms. However, the influence of the
electrode structure and morphology on biofilm formation is only beginning to be investigated.
This study provides an analysis of the effects of electrode morphologies on a pure culture of
anode-respiring bacteria. Specifically, the effects of carbon electrode materials (i.e. carbon
microfibers and nanofibers) with drastically different morphologies on biofilm anode respiration
by a pure culture (Shewanella oneidensis MR-1) were examined. Results showed that carbon
nanofiber mats had ~10 fold higher current than carbon microfiber paper and that the increase
was not due to an increase in electrode reactive surface area, conductivity, or a decrease in the
activation resistance stemming from the reduction in the size of the constituent material. Cyclic
voltammograms reveal that electron transfer from the carbon nanofiber mats was biofilm-based
which suggests that decreasing the diameter of the constituent carbon material from a few
microns to a few hundred nanometers is beneficial for electricity production solely because the
electrode surface of carbon nanofibers is more amenable to biofilm formation by Shewanella
oneidensis MR-1.
6.2 INTRODUCTION
The bare anode of a microbial fuel cell (MFC) receives electrons from bacteria, serves as the
substratum for bacteria to attach and initiate biofilm formation and provides the scaffold on
which it grows.106-107 In many cases, the formation and size of the biofilm are directly correlated

65
to high current production by a MFC.25, 107-108 Therefore, understanding how the electrode
structure and morphology might influence the formation and size of a biofilm in a biofilm-anode
is paramount for the development of any biofilm-electrode based technology.
Several studies have reported that changing the structure (e.g. graphite rod, graphite
foam, woven graphite) of the anode resulted in an increase in current production.47, 109-112 These
studies focused on how the electrodes influenced the electrochemical reaction or increased the
available/reactive surface area thus providing a foundation for later investigation into how
electrodes effected biofilm formation and growth.14, 19, 90 Observations from these studies led to
the modification of anodes in order to further increase reactive surface area47, 49, 58-59, 113-114 and or
decrease overpotentials, a conventional approach borrowed from catalytic fuel cell research.52-53,
56, 101, 115-118 For example, Logan et al.113 showed that increasing the overall surface area by
employing a graphite electrode brush increased current density by ~2.5 times compared to a
carbon cloth anode. At the same time however, Dewan et al.119 found that current densities for
electrodes with a larger surface area cannot always be directly extrapolated using the current
densities generated by smaller electrodes. Additionally, Dewan et al. found that power densities
scale with the logarithm of the projected surface area. As a result, anodes that serve as the
substratum for electricity-producing biofilms may need to incorporate more than just a higher
surface area or decreased activation overpotential. Perhaps anode selection should also account
for factors that may influence the bio-electrochemical reaction indirectly, such as an anode
surface morphology that impacts the onset and growth of the biofilm.

66
Given the size of a typical bacterium (1-3μm), increasing the surface area to volume ratio
of the material does not necessarily increase the surface area available for bacterial respiration
after some threshold.47 However, changes at the micro and nanometer scale affect the surface
morphology of the electrode that bacteria and their biofilms attach to and grow on. Changes in
surface morphology have already been shown to affect biofilm growth120-122 and several studies
have correlated changes in electrode structure and biofilm-anode performance of mixed
cultures.123-124 In order to build upon these findings, and to eliminate the possibility that
differences in performance were due to differences in the physiological profile of the mixed
culture it is important to investigate whether changes in electrode surface morphology influence
the ability of an electrode to spur biofilm formation in a pure culture and thus increase biofilm-
anode current production.
The interface between a biofilm and an anode cannot be understood by evaluating the
individual components (i.e. a bacterial species or electrode material). As a result, determining an
electrode’s effect on biofilm formation requires simultaneous evaluation of the electrode’s
properties and an understanding of the physiology of the bacteria in an electrochemical context.
While one can easily measure the conductivity of an electrode and subjectively evaluate its
surface morphology, accounting for the physiology of the bacteria is more challenging since a
change in the environmental conditions can trigger different mechanisms of extra-cellular
electron transfer (EET) in the bacteria.27, 125
Studies on EET in a pure culture like Shewanella oneidensis MR-1 facilitate the
determination of which EET mechanism is being used. For example, Marsili et al.27 revealed that

67
riboflavin is the shuttle being used by S. oneidensis during mediated electron transfer and
showed that it is oxidized at a specific potential. This helps to explain its ability to respire the
electrode as a planktonic biomass.26 Additionally, Baron et al.125 showed that S. oneidensis
employs direct electron transfer at a distinctly different potential. Their use of cyclic
voltammograms (CVs) of the anodes provide a way to reasonably identify, based on the
reduction potential, which EET mechanism (mediated or direct electron transfer from a biofilm)
is being used and to what extent. While the shape of cyclic voltammograms for reversible
electron transfer for soluble mediators (i.e. riboflavin) is widely established,20 the presence of
direct electron transfer from a biofilm and how it manifests itself in CVs for microbial fuel cells
is a more recent discovery.33, 126
Engineering electrodes for optimal biofilm-anodes can be improved by examining the
effects of electrode properties on biofilm-anode formation and by devising experiments that
incorporate the fundamental physiological findings in the literature,27, 125 biofilm kinetics,95, 127
and bioelectrochemistry. Given that several engineering or modification studies have shown
significant changes in biofilm colonization and formation when surface morphologies were
changed for mixed cultures,122-124, 128-129 it is only appropriate to examine how this might affect
the biofilm-electrode interface of a pure culture in which the electrode surface uniquely serves as
both the substratum and the terminal electron acceptor. Using a pure culture removes any
inconsistencies regarding the physiological profile of the community, the presence of scavengers,
metabolic pathways that serve as electron sinks (e.g. methanogenesis), and the community
dynamics associated with bacterial competition.

68
Here the effect of changing the morphology of the anode surface (i.e. decreasing the
diameter of the electrode’s constituent material) on anode respiration/current production by S.
oneidensis MR-1 is studied. Experiments were repeated twice however, only two sets of
electrodes are described below. Amperometry was used to monitor current production over time,
CVs were used to account for its electron transfer mechanisms and, the differences between
electrode materials were qualified using scanning electron microscopy (SEM), conductivity
measurements and, areal weight measurements.
6.3 MATERIALS AND METHODS
6.3.1 Electrode characterization
Plain Toray carbon paper (PTCP), (TGPH-120, E-tek, USA), or carbon microfiber paper (CMF)
and carbon nanofiber (CNF) mats (Applied Sciences, PR-19-XT-HHT) were used as anodes in
this study. 1cm2 electrodes were cut from each sample and weighed to determine areal weight.
Electrode conductivity was measured using a standard 4-point probe measurement.130 Electrodes
were soaked in 1M sulfuric acid for at least 1 hr prior to installing in the reactor.
6.3.2 Cell cultures
Shewanella oneidensis MR-1 (ATCC 70050) was cultured aerobically in Luria-Bertani (LB)
broth from a frozen stock and transferred to a medium with 20mM D-L lactic acid as the electron

69
donor. The medium also contained (per liter): 1.5g of NH4Cl, 0.92 (NH4)2SO4, 10ml vitamin
solution, 10ml trace element solution, and 100mM phosphate buffer (pH 7.5). Phosphate buffer
was made using sodium phosphate dibasic (Na2HPO4) and monopotassium phosphate (KH2PO4).
The media was autoclaved and made anoxic by sparging with N2 gas. Vitamin solution
contained (per liter): 2.1g biotin, 2.2g folic acid, 11g pyridoxine hydrochloride, 8g thiamine HCl,
5g riboflavin, 7g nicotinic acid, 7g calcium D-(+)-pantothenate, 0.7g vitamin B12, 5g p-
aminobenzoic acid, and 5g thioctic acid. Trace element solution contained (per liter): 0.018g
Na2SeO3, 0.11g NiSO4-6H2O, 0.2g Na2WO4-2H2O, 2.14g nitrilotriacetic acid, 0.1g MgSO4-
7H2O, 0.1g MnSO4-H2O, 0.36 NaCl, 0.01g FeSO4-7H2O, 0.179g CoCl2-6H2O, 0.53g CaCl-
2H2O, 0.2g ZnSO4-7H2O, 0.2g CuSO4-5H2O, 0.01g AlK(SO4)2-12H2O, 0.009g H3BO3, and
0.098g Na2MoO4.
6.3.3 Micro-Electrolysis Cell (MEC) Operation
The single-chamber 1-L reactor contained three working electrodes (each 1cm2) positioned
equidistant from a single Ag/AgCl reference electrode and a counter electrode (6cm2). The
counter electrode was made of PTCP with a 1000 Å thick layer of platinum deposited onto its
surface via electron beam evaporation.48 A CH Instruments 1040A multi-channel potentiostat
was used to maintain a potential of +0.043V vs. Ag/AgCl for each working electrode. Current
was measured and recorded every 100 seconds (amperometric measurements). CV scans were
conducted on a range from -0.7 to 0.3V at a rate of 2mV/s. The reactor was sparged with N2 gas
and wrapped in aluminum foil during operation. The addition of fuel included injecting 10 ml of
100mM lactic acid with 10ml trace element solution and 10ml vitamin solution. The reactor was
stirred with a magnetic stir bar at 60rpm.

70
The experiments were initiated using sterile medium described above. After 2 days of
abiotic operation, 10ml of LB media containing Shewanella oneidensis MR-1 was inoculated
into the reactor. After two weeks of operation the anodes in the reactor were sacrificed for SEM
images. The anodes were removed from the MEC, rinsed with phosphate buffer, and placed in a
4% paraformaldehyde solution for ~15min, rinsed with de-ionized water and placed in a petri
dish. These fixed electrodes were then set aside for imaging. The paraformaldehyde solution was
made by adding 4g of paraformaldehyde to 70 ml of de-ionized water, heating the solution to
70˚C, adding drops of 1N NaOH until the solution cleared, adding 9 ml of 1M phosphate buffer
after the solution cooled and refrigerating it overnight.
6.3.4 SEM
Prior to examination, the fixed electrodes were sputtered with palladium using a Cressington
Sputter Coater (108 Auto) for 30 seconds. Images of the anodes were taken before and after
MEC operation for comparison. Images were taken using a JSM-6510LV SEM set at 20kV.
6.4 RESULTS
6.4.1 Current production
The differences in current production between CNF and CMF working electrodes were
monitored amperometrically (Figure 16). The CNF electrode generated several times more

71
current than CMF throughout the experiment and is comparable to current generation from
previous experiments. (29) The superior performance by CNF is confirmed by the fact that it
exhibited a ~10-fold increase in current over that of CMF and that after the substitution of new
electrodes into the MEC on day 15, current production by both CNF and CMF returned to the
same levels exhibited prior to electrode replacement. Again, current production by CNF was
substantially higher.
Figure 16. Amperometric data from a MEC inoculated with Shewanella oneidensis MR-1. Current
production by carbon nanofiber mats/CNF (red) and carbon microfiber paper/CMF (blue) was monitored
over a 4 week period.

72
6.4.2 Cyclic voltammograms
Cyclic voltammetry was performed on both electrodes on day 2 and on day 15. On day 2, the
voltammograms for CMF and CNF are similar in amplitude and shape (Figure 17). However, the
voltammograms taken on day 15 (Figure 17B) show that CNF is trending more towards a
Nernst-Monod sigmoidal curve33, 126 while CMF maintains a similar shape to that exhibited on
day 2. After fitting the CV data taken on day 15 to the Nernst Monod Model (Figure 17B) it is
easy to see that the CV for CNF correlates better to the Nernst-Monod sigmoidal shape than the
CV for CMF.

73
Figure 17. Cyclic voltammograms for carbon nanofiber mats/CNF (red) and carbon microfiber
paper/CMF (blue) at Day 2 (top) and Day 15 (bottom) of the experiment. Day 15 was chosen because of the
difference in current production. Electrode replacement took place after the CV. CVs were scanned from -
0.7V to +0.3V vs Ag/AgCl at 2mV/s.

74
6.4.3 SEM -images for biofilm colonization
SEM images were used to demonstrate biofilm colonization on electrodes. Images in Figure 18
show a distinct qualitative difference in the amount of biofilm formed on CNF mats versus CMF.
Micrographs of the CNF electrode reveal a biofilm as well as outlines of individual cells (Figure
18A and B) and are similar to other micrographs of S. oneidensis MR-1 biofilms on
electrodes.131 On the other hand very little cell colonization or growth was observed on the CMF
electrodes (Figure 18C and D). Figure 18E is a magnification of a single bacterium found on the
CNF biofilm-electrode.

75
Figure 18. SEM images of increasing magnification of anodes evaluated in an MEC for 2 weeks and
inoculated with Shewanella oneidensis MR-1. Images of both carbon nanofiber mat/CNF images (A and B)
and carbon microfiber paper/CMF (C and D) were taken after elect rodes were fixed in paraformadelhyde
solution. Images indicate the presence of a biofilm on the CNF electrodes. Bacteria are highlighted in (A and
B). A magnified image of a single bacterium found on the CNF biofilm electrode is also shown (E).

76
6.4.4 Morphology of sterile electrodes
The electrode features revealed in the micrographs in Figure 19 highlight the morphological
differences between CNF and CMF. The CNF mat shows a woven matrix of carbon nanofibers
set upon a carbon scaffolding (Figure 19A) while CMF exhibits more of a rigid interlinked
structure (Figure 19B). The typical diameter of the carbon fibers used in CMF are ~10μm while
the carbon nanofibers are ~200nm in diameter (Figure 19D and E). Carbon nanofibers are more
flexible and the carbon microfibers are linear and rigid. It is important to note the difference in
morphology at the scale of a single bacterium when comparing electrodes in Figure 19 because
the electrode features, relative to the size of the bacteria (i.e. 1-3 μm), are orders of magnitude
different. CMF exhibits a constituent material (microfiber) with a serrated surface that is much
larger (i.e. 10 μm) than a single bacterium. On the other hand, CNF exhibits a constituent
material much smaller (i.e. 200 nm) than a single bacterium. In addition to these
characterizations, physical and electrical properties of both electrodes are listed in the Table 2.

77
Figure 19. SEM images of increasing magnification of pristine carbon nanofiber mats (Images A, C,
and E) and carbon microfiber paper (Images B, D, and F).

78
6.5 DISCUSSION
6.5.1 Differences in current production
The shapes of the I-t (current vs. time) curves throughout the experiment are identical and differ
primarily in magnitude, with CNF producing current up to a factor of 10 more. The length of
time given to the bacteria to colonize the electrode and generate current is well beyond times
allotted in various experiments for biofilm formation suggesting that the time allowed for
bacteria to agglomerate on the surface is not an issue. 125, 131 However, determining whether the
current was generated by a biofilm or a planktonic mass is important and can be elucidated using
CV.
6.5.2 Biofilm-based electron transfer
CVs for an anode-respiring biofilm will exhibit different shapes than CVs for a planktonic
biomass using mediators. Biofilms using conduction based electron transfer will have a
voltammogram with a sigmoidal profile 33, 126 while mediated electron transfer (planktonic
biomass) will often show simple oxidation and reduction peaks.19
The shapes of the voltammograms taken on day 15 (Figure 17) show that CNF is trending
toward a sigmoidal curve, like that of the Nernst-Monod model, while the shape of the
voltammogram for CMF shows no significant changes from day 2. The fact that CNF correlates
better with its Nernst-Monod model fit suggests that it formed a more complete conducting
biofilm-electrode than CMF. Specifically, the sigmoidal profile generated by CNF on the

79
forward scan and the decrease of the reduction peak on the reverse scan support this trend in the
CNF voltammogram. The fact that most of the current for CNF is generated above the redox
potential of riboflavin (-0.41V vs Ag/AgCl) also supports the idea that mediated transfer was not
responsible for the increase in current production. This suggests that electricity from the CNF
electrode is being produced by electron transfer from a biofilm. The SEM images in Figure 18
confirm that CNF has formed a substantial biofilm on its surface relative to CMF.
6.5.3 Comparison of electroactive surface area and kinetics using CVs
There is no indication in the CVs (Figure 17) that CNF has a significant advantage because it has
more electroactive surface area. If the increased current production by the CNF electrode were
merely a function of surface area, the shape of the voltammogram for both electrodes would be
identical differing only in the magnitude of current production. In other words, the shapes of the
voltammograms would look the same, but the voltammogram for CNF would be shifted up
vertically because of higher current production.
Since a kinetic advantage is often obtained from electron transfer for materials that are
similar in size with its reductant (i.e. cytochromes or mediators)132 it is important to account for
the size disparity between the constituent materials for the electrodes (i.e. the size difference
between carbon nanofibers and carbon microfibers). If the voltammogram for the CNF electrode
is shifted horizontally to the left, relative to the voltammogram of the CMF electrode, this would
indicate that CNF is more efficient than CMF at catalyzing the reaction. In the voltammograms
of Figure 17 (top), the horizontal positions for the onset of current are identical; neither electrode
displayed a kinetic advantage (i.e. no large decrease in the activation overpotential). In other

80
words, the similarity between the voltammograms taken on day 2 (Figure 17 (top)) suggests that
neither electrode possessed improved catalytic properties.
As a result, the advantage of using CNF is not due to higher specific surface areas (i.e.
higher concentration of active sites) or faster kinetics. This may mean that other factors (i.e.
electrode conductivity and electrode morphology) contributed to the increased current production
and biofilm formation on CNF.
6.5.4 Differences in electrode conductivity
Electrode conductivity is a function of areal weight (mass/geometric surface area). A more
densely packed material (i.e. higher areal weight) translates into a smaller resistance to current
(i.e. high conductivity). CMF has a larger areal weight and a higher conductivity yet it is CNF
that produces more biofilm and more current. It seems that the smaller conductivity of CNF does
not affect the formation and performance of its biofilm-electrode.
A recent study by Malvankar et al.133 showed, for Geobacter sulfurreducens, that there is
a direct correlation between conductivity of the biofilm and current production. They observed
biofilm conductivities as high as 0.5 S/m. In our studies, CNF showed a conductivity of 1,300
S/m while CMF had a conductivity of ~15,500 S/m (see Table 2.) The differences in these values
support the idea that the conductivities for CNF and CMF have no significant effect on
differences in current production because both conductivities were substantially greater than the
highest reported biofilm conductivities and because the electrode that performed better, CNF,
had the lower conductivity. Additionally, even with electrode materials with higher resistivities
Chen et al.123 was able to generate much higher current densities with mixed cultures suggesting
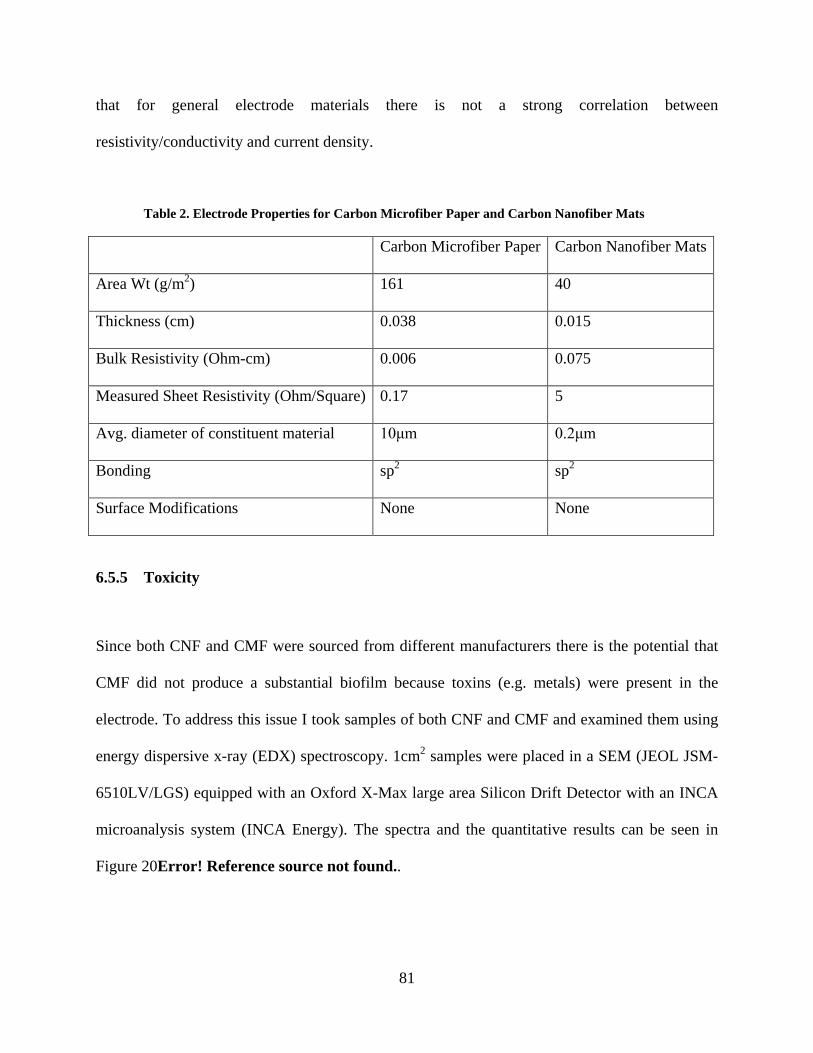
81
that for general electrode materials there is not a strong correlation between
resistivity/conductivity and current density.
Table 2. Electrode Properties for Carbon Microfiber Paper and Carbon Nanofiber Mats
Carbon Microfiber Paper Carbon Nanofiber Mats
Area Wt (g/m2) 161 40
Thickness (cm) 0.038 0.015
Bulk Resistivity (Ohm-cm) 0.006 0.075
Measured Sheet Resistivity (Ohm/Square) 0.17 5
Avg. diameter of constituent material 10μm 0.2μm
Bonding sp2 sp2
Surface Modifications None None
6.5.5 Toxicity
Since both CNF and CMF were sourced from different manufacturers there is the potential that
CMF did not produce a substantial biofilm because toxins (e.g. metals) were present in the
electrode. To address this issue I took samples of both CNF and CMF and examined them using
energy dispersive x-ray (EDX) spectroscopy. 1cm2 samples were placed in a SEM (JEOL JSM-
6510LV/LGS) equipped with an Oxford X-Max large area Silicon Drift Detector with an INCA
microanalysis system (INCA Energy). The spectra and the quantitative results can be seen in
Figure 20Error! Reference source not found..
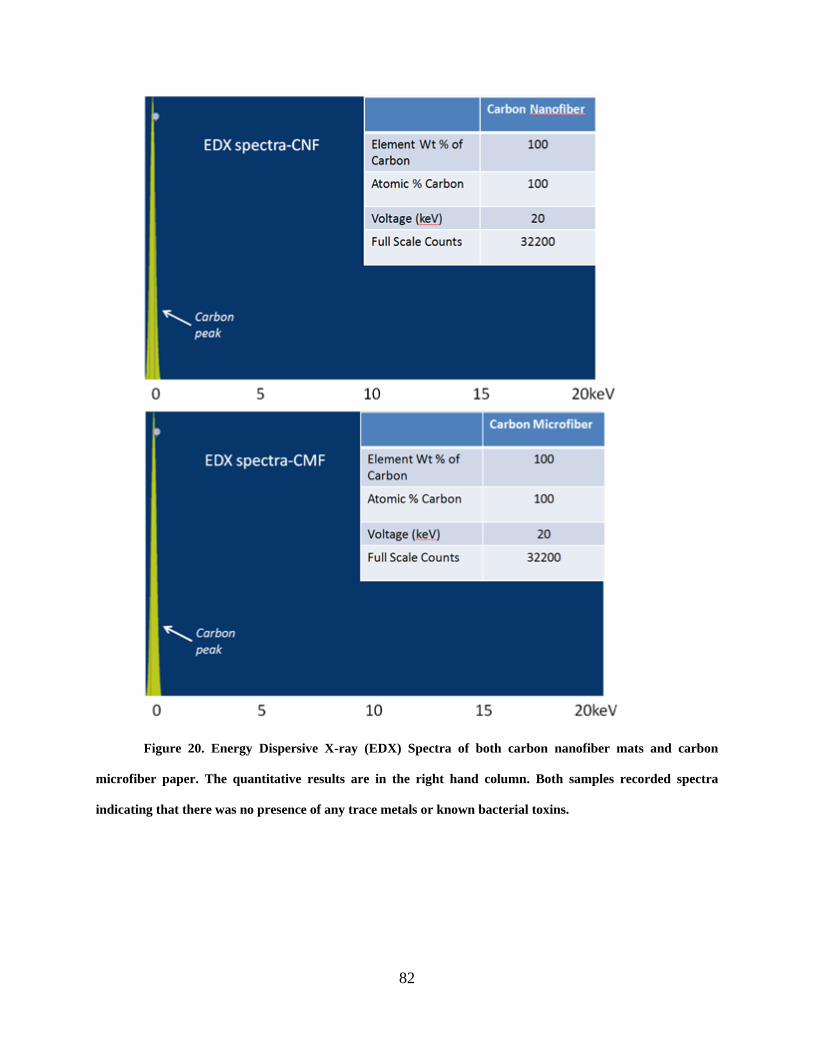
82
Figure 20. Energy Dispersive X-ray (EDX) Spectra of both carbon nanofiber mats and carbon
microfiber paper. The quantitative results are in the right hand column. Both samples recorded spectra
indicating that there was no presence of any trace metals or known bacterial toxins.

83
The spectra shown for both CMF and CNF illustrate that the samples were made of carbon. Both
the elemental weight percentage and the atomic percentage of the samples were 100% carbon
and there were no trace elements or stray peaks, particularly from metals such as Fe(III), Co(III),
U(VI), Tc(VII), V(V), Ag(I) all of which can serve as electron acceptors for Shewanella
oneidensis MR-1 134-135 and some of which have been shown to be toxic to Shewanella
oneidensis MR-1 in high concentrations (175μM for Cr(IV), 100μM for Ag(I), and 0.5-20mM
Co).136-138 However, it is important to note that the sensitivity of EDX is approximately 0.1%
suggesting that the presence of additives may be present below this concentration.139
An examination of the manufacturing process showed that CNF was grown via chemical vapor
deposition (CVD) using an iron (Fe) catalyst. Technical data on CNF ( www.apsci.com) showed
that the electrodes are made of pure carbon and the amount of iron catalyst present in the carbon
nanofibers, after they are graphitized (i.e. heated to 3000˚C), is less than 100ppm or 0.01%.
On the other hand, CMF paper is a carbon-carbon composite and its manufacturing process does
not use a catalyst or known toxins and any resins used are carbonized by the process. The fibers
are made by the carbonization and graphitization of carbon precursors (i.e. polyacrylonitrile)140-
141 through which non-carbon atoms are excluded (~1600°C) and the orientation of the basal
planes and stiffness of the fibers improved (> 2000°C).142 In other words the carbon is distilled
via pyrolysis and reordered using heat as opposed to grown using CVD. Technical information
on the manufacturer’s website (www.toray.com) lists that fibers can have a combined sodium
(Na) and potassium (K) concentration of up to 50ppm. Additional inquiries to both the suppliers
and Toray Industries revealed that that an elemental analysis of the carbon paper showed 0.2μg/g
of barium (Ba). The presence of Ba is assumed to originate from the water-intensive
papermaking process since Ba is commonly found in finished waters.143 All other elements tested

84
for (i.e. Cd, Cr, Pb, Ar, Se, Hg) were below the detection limits. (Toray Industries Tacoma, WA,
personal communication).
Given the Ba concentration of 0.2μg/g , the size of the electrodes (1cm2) and that the areal wt. of
CMF (161g/m2, see Table 2) means that a total of 3.22ng/L (2.3x10⁻¹¹ M) of Ba would
potentially be present in the reactor. Since this concentration is four orders of magnitude less
than the mean Ba concentration of US surface waters (43μg/L)143, there is no report in the
literature of toxicity of barium on Shewanella oneidensis MR-1, and Toray carbon paper is
commonly used as an electrode in MFCs,144 I assumed that the concentration was negligible and
that it posed no toxicity issues for Shewanella oneidensis MR-1. Addtionally, since the salts used
for the phosphate buffer in this experiment (see Materials and Methods) provided a much higher
concentration (mM range) of Na and K in the solution, I assumed as well that the 50ppm
concentration in CMF would also present no toxicity issues for Shewanella oneidensis MR-1.
Finally, given CNF’s areal wt. of 40g/m2 (see Table 2) and the potential presence of
50ppm of Fe means that for the 1cm2 CNF electrode an additional 0.4μg (7nM) could be
available to the CNF biofilm. When compared to the Fe provided by the addition of the trace
element solution (0.1mg FeSO4-7H2O in 10mL or 0.36μM for the 1L reactor), the additional Fe
provided by the CNF electrode to Shewanella oneidensis MR-1, if available to the bacteria, is
assumed to be negligible.

85
6.5.6 Biofilm formation
The drastic differences in biofilm formation by S. oneidensis MR-1 (see Figure 18) are less
surprising when we consider that it can also respire electrodes as a planktonic biomass and that
single physical mutations to S. oneidensis MR-1 have been shown to have profound effects on
biofilm formation. For example, previous studies of biofilm formation by S.oneidensis MR-1
showed that the presence of the flagellum, swimming motility, presence of a mannose-sensitive
hemagglutinin type IV pilus, and pilus retraction played a significant role in the ability for S.
oneidensis MR-1 to form a biofilm. Specifically, the lack of a flagellum decreased the
concentration of biomass (decreased biofilm formation), the lack of motility prevented the
formation of a pronounced three dimensional biofilm architecture (bulk structure), the mutants
defective in mannose-sensitive hemagglutinin type IV pilus biosynthesis had defects in initial
attachment and the mutant defective in pilus retraction displayed poor propagation of the biofilm.
131 In addition, another study showed that mutants lacking the gene pilD (indicated in Type IV
pilin production) and the protein secretion genes gspG and gspD produced less current in MFCs
relative to the wild-type S. oneidensis MR-1. The images of the electrodes used in those
microbial fuel cell experiments with the mutant lacking pilD revealed a lack of biofilm as
compared to the wild- type.145 These previous studies provide a foundation from which to
investigate how morphology affects different phases of biofilm formation at a molecular and
genetic level but, more importantly they highlight that small changes in how a cell interacts with
its environment can have significant consequences for the entire biofilm. As the change in an
substratum structure has affected biofilm formation in studies with mixed cultures 122-124 it is
important to examine the differences in electrodes morphology here for this pure culture.

86
6.5.7 Impact of electrode morphology
A single bacterium of S. oneidensis MR-1 attaching to the surface of CNF would be in contact
with multiple nanofibers (Figure 19 (a), (c), (e)) but would cover only a portion of a single
microfiber of CMF (Figure 19 (b), (d), (f)). Since the bacteria adhere to the features of the
electrode it is important that the space between the features of each electrode be within a distance
that bacteria can effectively collaborate. This distance, while not established quantitatively, has
been shown to influence biofilm formation in medical studies.122 That same influence is
mimicked here as the tighter spacing/morphology of the CNF electrode spurs on better biofilm
formation.
Ultimately, the CNF electrode generated more current (Figure 16), exhibited a
voltammogram that showed the current was being generated by a biofilm (Figure 17), and
showed substantial coverage by bacteria when examined under a SEM after the experiment
(Figure 17). Since the electrodes were exposed in the same reactor at the same time, differences
in current production are best explained by differences in the nature of the electrode materials.
The advantage typically associated with CNF is the increased surface area146 , better
kinetics 147, and high conductivity 148. In this case however, the advantage of using CNF
electrodes was its electrode surface morphology that was more amenable to bacterial
colonization and biofilm formation. This supports the novel idea that adjusting the size of the
electrode constituent material to one that is more amenable for bacterial colonization and growth
was important because it produced a more substantial biofilm-anode and led to an increased
current production.
87
6.6 CONCLUSION
In this experiment, S. oneidensis MR-1 produced significantly more current with CNF than
CMF. The examination of sterile electrodes showed that CNF and CMF differed in morphology,
surface area, size of the constituent material, and conductivity. After accounting for differences
in surface area, size of the constituent material, and electrode conductivity the results suggests
surprisingly that the morphology (i.e. tighter spacing/size of the features) of the electrode surface
of CNF is what enables the formation of electricity producing biofilms by S. oneidensis MR-1
relative to CMF. It may be that CNF morphology provides a preferential surface for colonization
or a more habitable environment for biofilm growth yet these are subjects for future biofilm
studies. In either case, changing the electrode morphology seems to play an important role in
biofilm-electrode formation and current production for Shewanella onedensis MR-1.

88
7.0 THE EFFECTS OF CARBON ELECTRODE SURFACE MORPHOLOGY ON
BIOFILM-ANODE PERFORMANCE (BY GEOBACTER SULFURREDUCENS) USING
PLATELETS AS A CONSTITUENT MATERIAL (GRAPHENE-NANOPLATELETS)
In order to further validate the claim that electrode surface morphology plays a significant role in
the performance of a biofilm-anode I chose to test the hypothesis using a different carbon-based
constituent material for the electrode. I chose a plate-based nanomaterial (graphene-
nanoplatelets) as the constituent for the electrode and decided to use Geobacter sulfurreducens
as the innoculant. Geobacter sulfurreducens was chosen because it typically produces a
substantial amount of current and its bio-electrochemical physiology has been well studied. The
use of a different electrode constituent material would afford us a completely different
morphology type and the higher performing bacterial strain would serve to magnify differences
in biofilm-anode current production. Additionally the materials used in this experiment were
sourced from the same manufacturer and fabricated in the same way thus eliminating the need to
address differences in material chemistry.

89
7.1 SUMMARY
The use of nano-materials, like graphene, as electrodes is an important development in
bioelectrochemical research. Given an electrode material, anode-respiring bacteria will typically
optimize their metabolism and biofilm structure and produce current. However, different
electrodes produce different optimized biofilms and not all optimized biofilms are equal in mass
and current production. Determining how electrodes affect biofilm-electrode current production
is crucial for technology development, especially for new materials like graphene. Graphene-
nanoplatelet-based electrodes provide an opportunity to determine whether increases in current
density from graphene type materials are a result of its heightened reactivity, increased surface
area, or if general parameters such as surface morphology play a significant role. More
importantly graphene-nanoplatets allow us to examine the effect of the morphology on biofilm-
electrode performance from a plate-based electrode constituent material.
Here I examine the effect of electrode morphology (i.e. altering the size of graphene-
nanoplatelets) on biofilm-electrode current production in a microbial fuel cell inoculated with
Geobacter sulfurreducens. Using current production profiles, cyclic voltammetry,
electrochemical impedance spectroscopy, the Nernst-Monod conduction model and the current
understanding of bioelectrochemical physiology of Geobacter sulfurreducens I am able to
determine that surface morphology, more than surface area, plays a fundamental role in current
production by biofilm-electrodes that use graphene nanoplatelets.

90
7.2 INTRODUCTION
Since increases in performance (i.e. current production) can be attributed to an increase in
surface area, electrode reactivity, electrode surface morphology, or the bacterial physiology,
isolating what significantly affects current production from biofilm-electrodes, especially when
using highly productive strains such as Geobacter sulfurreducens, remains a complex challenge
and an important aspect of bioelectrochemical research.
Multiple studies have demonstrated that the modification of electrodes can improve
performance (i.e. current production or acetate synthesis) of biofilm-electrodes.47, 109, 111, 149The
use of conductive polymers 53, porphyrins 54-55, metal catalysts48, 52, 56, and different carbon based
electrodes109, 150-151 have all shown increased current densities in their respective systems. Even
for electrodes based on the same material there have been differences in biofilm-electrode
current production.124
Many of these studies have attributed increased current density to an enhanced
electrochemical activity (e.g. reduction in the activation energy barrier) 52, 152-154or an increase in
surface area113. As a result, there has been a particular focus on employing nano-materials such
as carbon nanotubes 117, 155, nanostructured polymers156, and nanoparticles2, 152 in order to take
advantage of their enhanced electrical, physical, and chemical properties that would increase
91
both surface area and reactivity. One material presently being studied for use in bio-
electrochemical systems is graphene.151
The promise of graphene, introduced as an engineering material in 2004157, is a primary
focus for nano-materials because of its superior physical and electrical properties. Its heightened
electrical conductivity, mechanical strength, and chemical reactivity have a host of research
groups studying different applications.158 Graphene is a single atom-thick layer of carbon which
makes it very versatile for engineering applications. Coupled with the fact that it is a carbon-
based material of which there is an abundant supply, this material could potentially enhance
current production from biofilm-electrodes cost effectively.
Biofilms grown on graphene-based electrodes could potentially take advantage of its high
conductivity and reactivity159 to decrease both the ohmic and electron transfer resistances.160-161
Graphene has already been used to develop sensors162 and increase biofilm conductivity.163 It
has been incorporated into bio-cathodes 163, used as an anode sponge151, generated by the
reduction of graphene oxide by Shewanella164, and used as a biosensor.162
The major issue with understanding graphene’s effect on biofilm-electrode performance
is that it is difficult to distinguish between the contributions from its reactivity, increased surface
area and surface morphology. The challenge of isolating the influence of each of the electrode’s
properties in a complex bio-electrochemical system is compounded by the fact that the bio-
electrochemical physiology for most bacterial strains continues to be understood165 and that it
changes with environmental conditions.166 Despite the findings in the literature, the variations

92
between experiments (e.g. catalyst and electrode materials, fuel cell setup, bacterial strain,
operational conditions) make it difficult to determine what is fundamentally happening between
the bacteria and electrode.
In order to better understand the benefits of incorporating nano-materials such as
graphene into biofilm-electrodes, it is important to determine whether graphene enhances
biofilm-electrode current production via its heightened reactivity, increased surface area or
surface morphology. One can tease out these different effects by combining electrode
fabrication methods that allow the alteration of the constituent material size and a bacterial
strain, whose physiology is well-documented,165-167 in a MFC experiment. Using graphene nano-
platelets which can be manipulated to control for platelet size, bulk resistivity, surface area, and
pressed into a paper electrode presents one such option.
Studies on the bio-electrochemical physiology of Geobacter sulfurreducens provide
important insights such as the fact that biofilm expansion and not increased colonization is the
primary contributor for increased current generation during the initial stages of biofilm-electrode
development. Additionally, it was shown that following initial attachment, growth rates on
electrodes are similar to those of planktonic cells respiring Fe (III)-citrate thus precluding that
the electrode is deficient as an electron acceptor.166 Another finding suggests that electron
transfer between cells and the electrode is not the limiting step in the electron transfer process
because the diffusional limitation seen in the electron transfer analysis is indicative of the
transfer of electrons to the biofilm-electrode interface being slower than the transfer across the
interface.166 These findings, along with the use of the aforementioned graphene-nanoplatelet

93
electrodes, can enable one to learn how graphene-nano platelets affect biofilm-anode current
production in MFCs.
Here I evaluate the effect of graphene nano-platelets on MFC performance using
Geobacter sulfurreducens. When simultaneously tested under the same conditions graphene
nano-platelet electrodes that differ mainly in the size of the constituent platelets manifested
differences in current production. Cyclic voltammetry (CV) was used to qualitatively monitor the
evolution of the biofilm-anode while Electrochemcial Impedance Spectroscopy (EIS) was used
to determine the solution and polarization resistance. From these results I found that the
electrode with less surface area performs significantly better and are able to extrapolate that the
surface morphology is responsible for the differences in performance.
7.3 MATERIALS AND METHODS
7.3.1 Electrodes
Graphene Nano-platelet electrodes were custom designed (see Table 3) and procured
from XG Sciences (Lansing MI, USA). The nano-platelets were incorporated into a cellulose
based scaffold to form a paper-like sheet. GNP-50μm was made using H-50 particles and GNP-
1μm was made using C-300 grade particles. Both were manufactured to have the same in-plane
conductivity. GNP-50μm, GNP-1μm and the cellulose paper (control) were evaluated in the
MFCs. The electrodes were cut to 1cm2 squares and used as MFC anodes. MFC cathodes were

94
made of 1 cm2 graphite felt (GC-14, Electrolitica) squares. Platinum wires connected the
electrodes to a Keithley meter.
7.3.2 Culture and Media
NBAF medium
Geobacter sulfurreducens (ATCC: PCA 51573) was initially grown in anoxic NB
medium168 supplemented with 15mM acetate and 40mM fumarate.
FWFA (200ml bottles)
A solution containing (per liter) 2.5g sodium bicarbonate (NaHCO3), 0.25g ammonium
chloride (NH4Cl), 0.06g sodium phosphate monobasic/monohydrate (NaHPO4 x H2O), 0.1g
potassium chloride (KCl), 10mL vitamin mix (45-46), 10mL mineral mix(44), 40mL of 1 M
fumerate solution (C4H4O4), 1.36 sodium acetate tri-hydrate (CHCOONa x 3H2O).
FWA (200ml bottles)
A solution containing (per liter) 2.5g sodium bicarbonate (NaHCO3), 0.25g ammonium
chloride (NH4Cl), 0.06g sodium phosphate monobasic/monohydrate (NaHPO4 x H2O), 0.1g
potassium chloride (KCl), 10mL vitamin mix (45-46), 10mL mineral mix (44), 1.36 sodium
acetate tri-hydrate (CHCOONa x 3H2O).
Geobacter sulfurreducens was grown in NBAF medium and then transferred into FWFA
(10% innoculum) when inoculating the MFCs. After current generation FWA was flowed

95
through the reactor. All solutions were autoclaved and all solutions used as a growth medium
were sparged with 80:20 mix of N2:CO2 gas to maintain anaerobic conditions.
7.3.3 Microbial Fuel Cell Assembly and Operation
The MFCs, with 10ml volumes for both the anode and cathode chambers, were gas
sterilized for 12 hrs using ethylene and assembled in a sterile container. Anode and cathodes
were placed into the MFCs and a proton exchange membrane (Nafion 117, 1.25” x 1.25”) was
inserted between them. A Ag/AgCl reference electrode was inserted into the anode chamber for
electrochemical measurements and a 560 ohm resistor served as the electrical load between the
half-cells. The reactors were connected to a personal computer via a Keithley meter which
collected voltage data every hour.
The growth media (described above) and catholyte were recycled through the reactors
using a peristaltic pump (Cole Parmer) at a rate of 0.5ml/min. After the potential stabilized, the
anode bottles were inoculated with 20ml of PCA 51573 from lab stock culture. When the OD600
(Optical Density at 600nm) reached 0.2 (exponential growth phase) FWFA media was replaced
with FWA media and was pumped through (no recycle) the anode chamber at a reduced rate of
0.1ml/min. The catholyte was composed of a solution containing (per liter) 3.63g Trizma Base
(T6066), 0.25g ammonium chloride (NH4Cl), 0.06g sodium phosphate monobasic/monohydrate
(NaHPO4 x H2O), 0.1g potassium chloride (KCl), and 10mL of 1 M potassium ferricyanide
(C6N6FeK3).

96
7.3.4 Electrochemical Measurements
Electrochemical impedance spectroscopy was used to describe the internal resistance
experienced by each anode. Measurements were taken before inoculation and after current had
reached a maximum. A Solartron Analytical 1252A Frequency Response Analyzer and Solartron
SI 1287 Electrochemical Interface was used to conduct the tests. The working reference and
working electrode leads were shorted and connected to the anode. The reference electrode lead
was connected to the Ag/AgCl electrode placed in the anode chamber and the counter electrode
lead was connected to the cathode. The excitation signal had an amplitude of 10mV with an
initial frequency of 300kHz and a final frequency of 0.1Hz. The electrodes were also evaluated
before and after inoculation using cyclic voltammetry. CV scans were conducted from -0.8V to
0.3V at a scan rate of 10mV/s.
7.3.5 SEM Images
Images of sterile graphene nano-platelet electrodes were taken using a JSM-6510LV
SEM set at 20kV. Magnifications of x45, x 330, and x5000 were captured and used for visual
comparison.
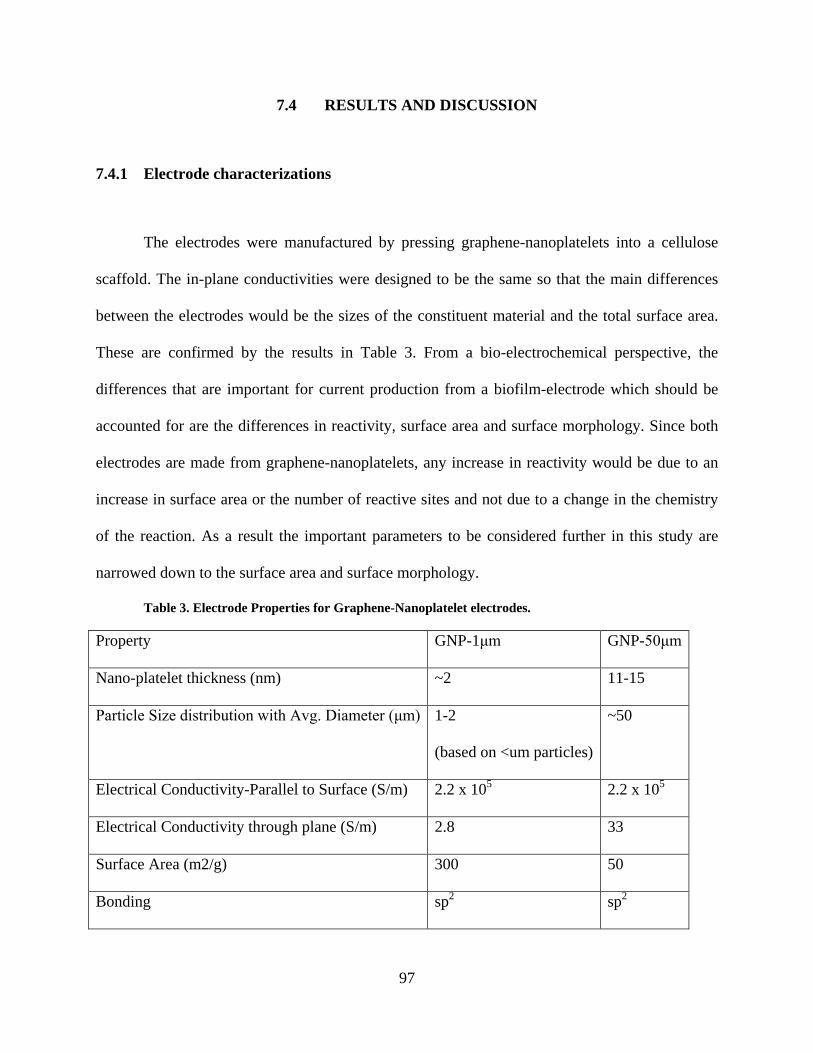
97
7.4 RESULTS AND DISCUSSION
7.4.1 Electrode characterizations
The electrodes were manufactured by pressing graphene-nanoplatelets into a cellulose
scaffold. The in-plane conductivities were designed to be the same so that the main differences
between the electrodes would be the sizes of the constituent material and the total surface area.
These are confirmed by the results in Table 3. From a bio-electrochemical perspective, the
differences that are important for current production from a biofilm-electrode which should be
accounted for are the differences in reactivity, surface area and surface morphology. Since both
electrodes are made from graphene-nanoplatelets, any increase in reactivity would be due to an
increase in surface area or the number of reactive sites and not due to a change in the chemistry
of the reaction. As a result the important parameters to be considered further in this study are
narrowed down to the surface area and surface morphology.
Table 3. Electrode Properties for Graphene-Nanoplatelet electrodes.
Property GNP-1μm GNP-50μm
Nano-platelet thickness (nm) ~2 11-15
Particle Size distribution with Avg. Diameter (μm) 1-2
(based on <um particles)
~50
Electrical Conductivity-Parallel to Surface (S/m) 2.2 x 10⁵ 2.2 x 10⁵
Electrical Conductivity through plane (S/m) 2.8 33
Surface Area (m2/g) 300 50
Bonding sp2 sp2

98
7.4.2 Current Density
Current production, as seen in Figure 21 started within 24 hours after inoculation. Current
rose exponentially over the next few days for both electrodes. After a week of operation GNP-
50μm and GNP-1μm were steadily generating 0.8 mA/cm2 and 0.5 mA/cm2 respectively. The
reactors were inoculated at the same time using the same method and the same strain suggesting
that the differences in current production are due to the differences in the electrode materials. It
is important to note that while GNP-1μm boasted the highest electrode surface area it does not
generate the most current. Also important is the fact that GNP-1μm reached 300 μA/cm2 first, a
point after which it has been shown that cell-doubling, and not further electrode colonization, is
responsible for additional increases in current production.166
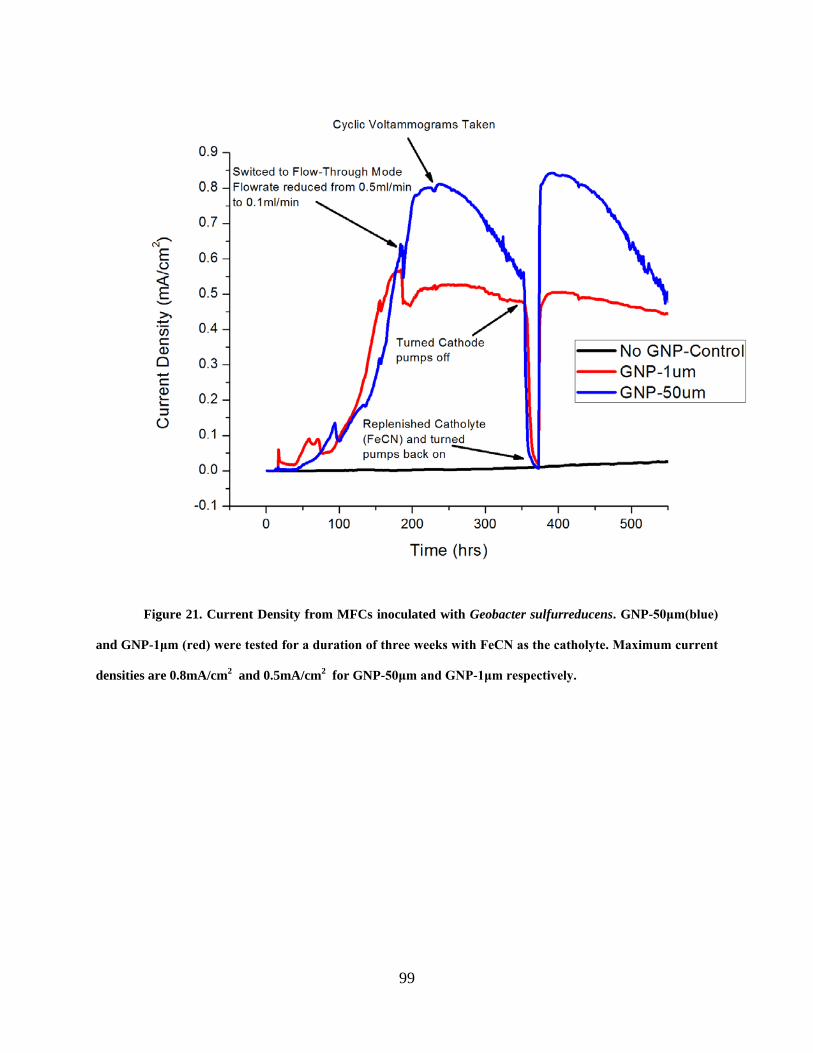
99
Figure 21. Current Density from MFCs inoculated with Geobacter sulfurreducens. GNP-50μm(blue)
and GNP-1μm (red) were tested for a duration of three weeks with FeCN as the catholyte. Maximum current
densities are 0.8mA/cm2 and 0.5mA/cm2 for GNP-50μm and GNP-1μm respectively.

100
The MFCs were run for a total of three weeks. GNP-50μm outperforms GNP-1μm
through the entirety of the experiment, almost doubling the current production from GNP-1μm.
At ~180th hr the MFCs were put into flow through mode. The flowrate was reduced from
0.5ml/min to 0.1ml/min at which point the current production for GNP-1μm leveled off while
current production continued to increase exponentially for GNP-50μm. The reactors were being
fed from the same bottle so differences in media or flow conditions could not explain the
disparity in performance.
It was assumed that the limit to maintaining the highest level of current production would
be the depleting concentration of FeCN in the catholyte. At the ~350th hr the pumps feeding the
catholyte were turned off. The catholyte solution was then replenished and the pumps
reactivated. Immediately, current production recovered for both MFCs. The current density in
the second half of the experiment followed the same discharge profile as the first half thus
confirming that GNP-50μm significantly outperforms GNP-1μm. There are two other important
things to note, 1) replenishing the catholyte enabled GNP-50μm to return to peak current
production, demonstrating that the catholyte was the limiting factor for current production for
GNP-50μm and 2) the current production for GNP-1μm remained constant even after replacing
the catholyte. This demonstrates that the limiting reaction for GNP-1μm was the current
production from the biofilm-anode.

101
7.4.3 Cyclic Voltammetry
The results from all CV measurements are shown in Figure 22. Figure 22A and B show
the CVs before inoculation and during peak current production (~230th hr) for GNP-50μm and
GNP-1μm respectively. The initial CVs were taken when no bacteria were present in the system
so the higher charging current (i.e. capacitance) shown by GNP-50μm is due to the electrostatic
interaction with the solution and not with any interactions of the biofilm-electrode interface.
Since electrostatic interactions did not inhibit biofilm colonization for either electrode, as noted
by the early onset of current production for both electrodes, the shifts in CVs can be used to
examine the expansion of the biofilm on the electrode.
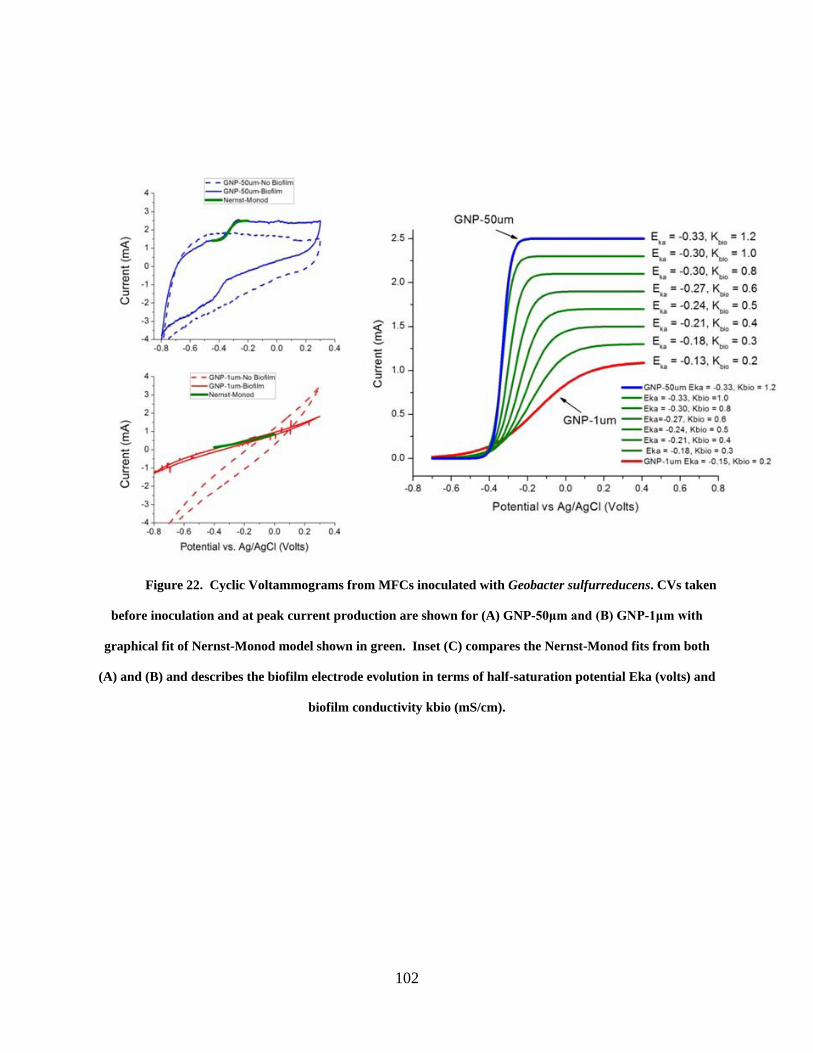
102
Figure 22. Cyclic Voltammograms from MFCs inoculated with Geobacter sulfurreducens. CVs taken
before inoculation and at peak current production are shown for (A) GNP-50μm and (B) GNP-1μm with
graphical fit of Nernst-Monod model shown in green. Inset (C) compares the Nernst-Monod fits from both
(A) and (B) and describes the biofilm electrode evolution in terms of half-saturation potential Eka (volts) and
biofilm conductivity kbio (mS/cm).

103
As a biofilm expands on the anode, current production will increase because of an
increase in the number of respiring bacteria. The growth of bacteria increases the concentration
of redox proteins that functionalize the anode and moves the electrode’s open circuit potential
closer to the mid-point potential of the redox proteins (e.g. outer membrane cytochromes) being
employed by the bacteria. This is illustrated by the fact that the open-circuit potential for both
GNP-1μm and GNP-50μm shifted from positive potentials to about -400mV vs Ag/AgCl at peak
current production.
The development of the biofilm-anode also creates an upward shift in the CV relative to
the initial CV and ultimately, for a fully developed biofilm-anode, turns into a sigmoidal curve
following the Nernst-Monod model.33 This sigmoidal curve is indicative of a biofilm-anode that
is limited or governed by the bacterial metabolism.126 For Geobacter sulfurreducens this
limitation is thought to be a diffusion limitation of electrons to the terminal redox centers.166
The CVs for both electrodes shift to the left during peak current production. The shifts
demonstrate the reduction in the electron transfer resistance and which is expected as a biofilm
expands on the anode.169-170 The decrease in electron transfer resistance is due to the fact that the
number of protein conformational changes decreases with the amount of adsorbed proteins.171
The reason is that as the biofilm grows and the concentration of proteins increases, the proteins
are less likely to denature because of the spatial and electrostatic confinement provided by
surrounding proteins and are thus more likely to be conjugated to the electrode surface. As a
result, as the concentration of proteins attached to the electrode increases both the open circuit
potential and mid-point potential shifts to more negative values (i.e. to the left in the CV). The

104
shift to the left and the sigmoidal curve are more pronounced in Figure 22A for GNP-50μm
indicating the presence of a more developed biofilm and thus explaining the higher current
production.
Each CV during peak current production was graphically fitted with the Nernst-Monod
conduction-based model126 and the values of the half-saturation potential (Eka) and biofilm
conductivity (kbio) were extracted. In Figure 22C both of the modeled CVs are compared. In
addition, the Eka and kbio values were used to linearly interpolate the electrochemical evolution of
the biofilm-anode from the lower performing GNP-1μm to the higher performing GNP-50μm.
This was done since the anodes were not poised at a specific potential. The values are given in
the figure and demonstrate the expected gradual changes for Eka and kbio as a biofilm-anode
develops from the state of GNP-1μm to the state of GNP-50μm. Essentially, as the biofilm-anode
grows the Eka decreases from -0.13V to -0.33V and kbio increases from 0.2 to 1.2 mS/cm. These
changes are expected as a biofilm grows and as proteins (i.e. c-type cytochromes) accumulate at
the bacterial outer membrane 167 or in the biofilm matrix.172 The differences in Eka and kbio values
help qualify and explain the large differences in current production between GNP-50μm and
GNP-1μm and thus confirming the notion that GNP-50μm has a more complete biofilm-anode.
7.4.4 Electrochemical Impedance Spectroscopy (EIS)
EIS was used to measure the distribution of resistances in the MFC before inoculation.
The resulting spectra are shown in Figure 23. Using the simplified Randles cell as an equivalent
circuit model (Figure 23 inset) the solution resistance for the MFCs for both GNP-1μm and

105
GNP-50μm are ~10ohms. The polarization resistances which can be extracted from the y-
intercept of the model spectra show that the resistance for GNP-50μm (~10 ohms) is slightly
smaller than the polarization resistance for GNP-1μm (~50 ohms). These differences can be
attributed to differences in through plane conductivity (~33S/m for GNP-50μm and ~2.8 S/m for
GNP-1μm) and are negligible for several reasons: 1) GNP-1μm was the first electrode to produce
a substantial amount of current (80μA/cm2 at 50th hr in Figure 21.) so the increased polarization
resistance did not inhibit colonization or electron transfer from Geobacter sulfurreducens and 2)
the differences in polarization resistance could not account for the disparity in peak current
production

106
Figure 23. Electrochemical Impedance Spectra of the anode before inoculation. Spectra was
generated using an excitation signal amplitude of 10mV with an initial frequency of 300kHz and a final
frequency of 0.1Hz. Figure inset is a depiction of the Randles circuit used to model the spectra where Rs =
solution resistance, Cdl = doubly layer capacitance, and Rp = polarization resistance.
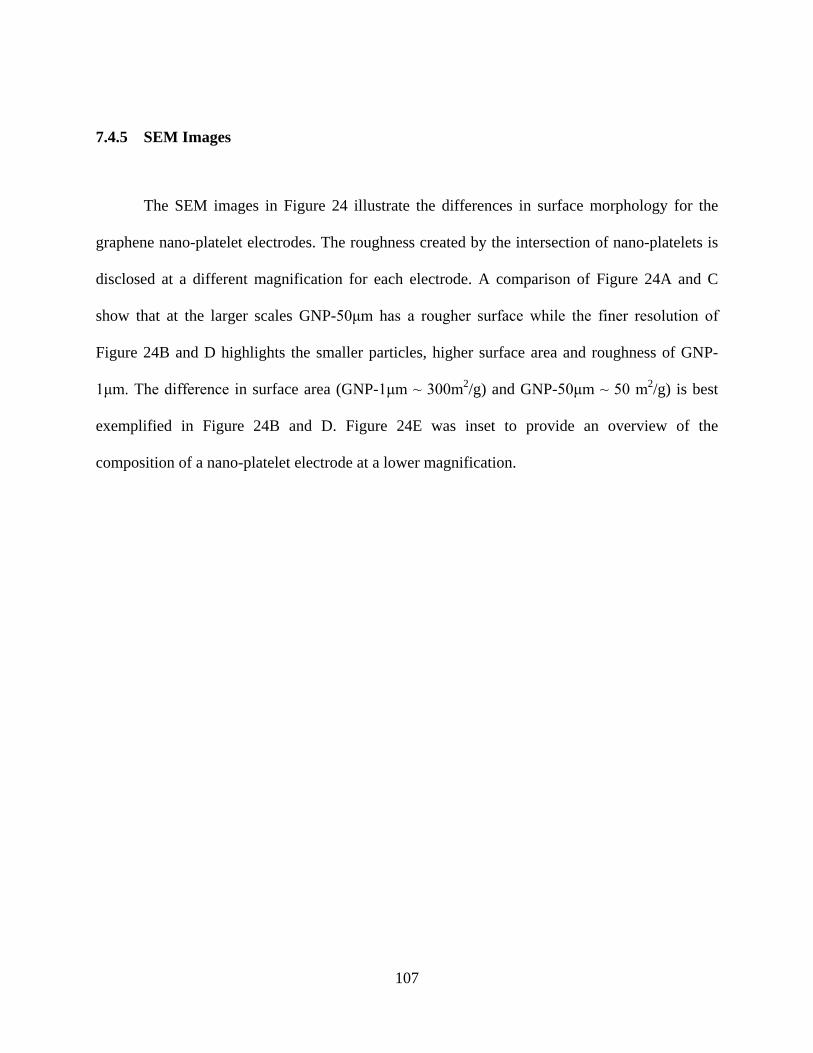
107
7.4.5 SEM Images
The SEM images in Figure 24 illustrate the differences in surface morphology for the
graphene nano-platelet electrodes. The roughness created by the intersection of nano-platelets is
disclosed at a different magnification for each electrode. A comparison of Figure 24A and C
show that at the larger scales GNP-50μm has a rougher surface while the finer resolution of
Figure 24B and D highlights the smaller particles, higher surface area and roughness of GNP-
1μm. The difference in surface area (GNP-1μm ~ 300m2/g) and GNP-50μm ~ 50 m2/g) is best
exemplified in Figure 24B and D. Figure 24E was inset to provide an overview of the
composition of a nano-platelet electrode at a lower magnification.

108
Figure 24. SEM Images of sterile graphene-nano-platelet electrodes used to demonstrate differences
in surface morphology. (A) GNP-1μm (B) Magnified image of GNP-1μm (C) GNP-50μm (D) magnified image
of GNP-50μm and (E) large scale image of the electrode material as a whole.

109
Ultimately, both electrodes were made from graphene-nanoplatelets and tested
simultaneously under the same conditions leaving the explanation for the differences in current
production to be justified by the differences in surface area or surface morphology. The current
production profiles demonstrated that both electrodes had well developed biofilms. Although
GNP-1μm had the highest surface area of graphene exposed it failed to produce the most current
thus demonstrating that surface area was not the limiting factor for these electrodes.
Additionally, after the catholyte was replaced, only GNP-50μm reached the peak current
production of 0.8 mA/cm2 during the three week experiment showing that while GNP-50μm was
cathode limited GNP-1μm was limited by the biofilm-anode reaction.
The shifts in the CV and the graphical use of the Nernst-Monod model to quantify the
differences in half-saturation potential (Eka) and the biofilm conductivity (kbio) confirm that
GNP-50μm had the more complete biofilm-electrode. The EIS results showed similar
polarization resistances but neither resistance inhibited colonization since the open-circuit
potential for both electrodes at peak current production was ~ -400mV vs Ag/AgCl. The results
illustrate that when electrodes are made of a highly reactive plate-shaped material (e.g. graphene-
nanoplatelets) the electrode surface morphology plays a critical role in biofilm-electrode
formation.

110
7.5 CONCLUSION
I presented an analysis of graphene-nanoplatelets electrodes that differed in the size of
the constituent material, surface area, and surface morphology. Testing them simultaneously
under the same MFC conditions I found that the electrode with much less surface area (GNP-
50μm) exhibited a higher current production. Quantifying the solution and polar resistances of
both electrodes with EIS and qualifying the development of the biofilm-electrode in terms of Eka
and kbio (i.e. Nernst-Monod model) I demonstrate that the biofilm on the electrode with less
surface area (GNP-50μm) has a more developed biofilm. After ruling out chemical reactivity and
surface area as reasons for the improved performance I conclude that it is the surface
morphology that plays a critical role in developing a biofilm-electrode for peak performance for
graphene-nanoplatelet electrodes.
111
8.0 SUMMARY AND OUTLOOK
In summary, I have shown that incorporating platinum nanoparticles throughout both the anode
and the cathode electrodes provides a more efficient use of the platinum catalyst, relative to
surface deposition, for increasing MFC current density because it increases the catalyst surface
area. Specifically, the incorporation of platinum nanoparticles increased the mass-specific
current density for the anodic reaction and cathodic reactions by a factor of 1.5 and 4
respectively. The fact that increasing catalyst surface area is an effective method for increasing
MFC current density is surprising given that hydrogen fuel cells produce current densities 2-3
orders of magnitude greater with similar Pt loadings. This is an important consideration for the
field should one pursue MFC catalyst research. The novel nanofabrication methods used to
incorporate platinum nanoparticles throughout the electrode are described in this thesis and can
easily be used as the foundation for further studies with platinum catalysts and or as a framework
for evaluating the efficient use of other potential catalysts in MFCs.
The influence of carbon-based electrodes on MFC performance was also evaluated by
electrochemically characterizing the effect of different electrode constituent materials at the
micro and nano scale (i.e. carbon fibers and graphene-nanoplatelets) using anode-respiring pure
cultures whose physiologies were well-studied in bioelectrochemical systems. The electrode
materials provided two different electrode architectures and their morphology was adjusted by

112
changing the size of the constituent material. Given the bacterial physiology of the pure cultures
(Shewanella oneidensis MR-1 and Geobacter sulfurreducens), MFC results showed that the
surface morphology of the electrodes plays a role in current production from biofilm-anodes. For
Shewanella oneidensis MR-1 it was suggested that the tighter spacing of the electrode
morphology enables both colonization and growth of an anode-respiring biofilm which increased
current production. For Geobacter sulfurreducens the morphology offered by the larger diameter
graphene-nanoplatelets enabled better biofilm growth after the initial colonization relative to the
smaller diameter graphene-nanoplatelets. In both experiments, it was shown for the first time that
the influence of a carbon-based electrode on MFC current production by S. oneidensis MR-1 and
Geobacter sulfurreducens extends beyond the typical electrochemical parameters of electron
transfer kinetics, electron conductivity, and surface area and uniquely includes surface
morphology. These results expand the understanding of the significance of the abiotic electrode
on MFC current production and provide the foundation for further study on biofilm formation
and the optimization of carbon electrode designs to enhance MFC current production.
The study, development and manipulation of bioelectrochemical systems such as microbial fuel
cells (MFCs) has enabled scientists and engineers to electrochemically “plug” into the bacterial
metabolism to generate electricity from organic substrates (e.g. wastewater)19, synthesize
materials/fuels (e.g. microbial electrosynthesis of acetate)173, monitor the remediation of
radioactive waste (e.g. uranium)174-175, and detect contaminants in the environment (e.g.
arsenic)176. At the heart of these technologies is the biofilm-electrode in which a bacterial biofilm
colonizes an electrode/current collector to form a composite material capable of executing the
aforementioned processes in either a respiratory or oxidative role. Given that the biofilm-

113
electrode is the fundamental platform for these applications, it would be important to continue to
develop the understanding of how nanofabrication methods and electrode materials increase
MFC current production and manipulate the biofilm-electrode interface.
8.1 FUTURE WORK
Continuous development for MFCs and bioelectrochemical research will be both fundamental
and applied. Future fundamental work built upon the experiments with platinum should focus on
understanding the chemical interaction between the bacterial electron transport mechanism and
the catalyst. Understanding the chemical interaction will help in minimizing the size of the
catalyst nanoparticles for current production thus increasing the efficient use of catalysts even
further. Applied research can focus on using the nanofabrication methods presented above as a
framework for testing new materials and increasing the efficient use of more inexpensive
alternatives.
Future work with carbon materials should continue exploring the connection between biofilm-
electrode formation and electrode surface morphology. It would be important to first correlate
the size of the constituent material to both biomass on the electrode and current density. After the
most effective size for increasing current density is selected and the amount of biomass
consistently produced by this material has been determined, it would be important to understand
the effect of the spacing between the constituent materials and the ratio of constituent
interconnections to geometric surface area on the three-dimensional morphology of the biofilm
and on total biomass. The size of the constituent material, the spacing between the materials and

114
the ratio of constituent interconnections are suggested because they may be able to adequately
describe the electrode surface morphology in a quantitative form. Moreover, these metrics could
eventually be the design parameters used in optimizing carbon electrode surface morphologies
for biofilm-electrode applications.
From a fundamental perspective, using transcriptomics to see the composition and concentration
of proteins being expressed during biofilm formation of pure cultures would be important. These
studies may be able to isolate which proteins signal for and initiate biofilm colonization during
anode respiration. Subsequently understanding the structure and functions of these proteins could
then allow for a study that examines how these proteins are inhibited or assisted by the
electrostatic and hydrophobic nature of carbon electrode surfaces. These studies could provide a
deeper insight into the rate of colonization and the rate of biofilm growth on carbon-based
electrodes.

115
APPENDIX A
ELECTRODE DESIGN, FABRICATION AND CHARACTERIZATION
A.1 ELECTRODE FABRICATION
The design and fabrication of the platinum carbon electrodes took place in the Nanoelectronics
Device Laboratory (NEDL) and in collaboration with University of Texas-Dallas NanoInstitute
(UTD) and Sungkyunkwan Advanced Institute of Nanotechnology at Sungkyunkwan University
in Suwon, South Korea (SKK). The designs of the electrodes vary mainly in catalyst
concentration and architecture of the carbon substratum. Electrodes were fabricated using the
following methods:
Electron beam evaporation of platinum onto carbon paper from Toray Industries (NEDL)
Using commercially available carbon paper (TGPH-120,E-Tek, USA) and an electron-beam
evaporator (VE-180, Thermionics laboratory inc, USA) a uniform Pt film was deposited with a
thickness in the range of 1000Å to 250Å following a manual procedure provided by the
manufacturer. (www.thermionics.com).

116
Fabrication of carbon nanotubes in a sheet via co-deposition with SWNT (UTD)
Single- wall carbon nanotubes (SWNT) made by the high pressure carbon monoxide (HiPco)
was be sourced from Unidym Inc. (Sunnyvale, CA). 15 mg of SWNT was be placed in aqueous
surfactant solution and subjected to probe sonication (Fisher Scientific Model 500) for about 25
minutes in 5 min cycles. The surfactants used were Triton-X 100 or Pluronic X (Aldrich) and in
concentrations of approximately 0.1g per 50mL of water. An ice batch was used or the bathwater
was changed after each cycle to avoid overheating.
The solution was then diluted with one liter of water and decanted. A vacuum filter apparatus
with a 47mm diameter filter (Millipore, 10-micron MITEX PTFE membrane filters) was used to
filter the solution. A 1000 mL of water was passed through the filter until all foam disappeared
followed by a second 1000 ml solution of 30% methanol. The methanol solutions were dilute to
prevent a methanol oxygen reaction using nPt as the catalyst. The vacuum filtration apparatus
was disassembled, and another 10-micron MITEX PTFE membrane filter was placed on top of
the carbon nanotube sheet to form a “sandwich”. The vacuum apparatus was reassembled and the
vacuum continually applied for one hour to maintain a flat and uncurled sheet. It is important to
note that the size and shape of the SWNT sheet prepared in this way is limited only by the size
and shape of the membrane filter used. It is also important to note that Multi-walled nanotube
sheets can be fabricated in the same way.

117
Carbon nanofiber mat synthesis (SKKU)
Pyromellitic dianhydride (PMDA, Sigma Aldrich) and oxydianiline (ODA) was dried in a
vacuum oven at room temperature. 4g of ODA was dissolved into 21g of DMF solution (99.8%)
and stored at 5°C. 4.4g of PMDA was added to the mixture and stirred using a magnetic stir bar
for 30 minutes. 1 wt% of tri-ethly amine (TEA) was added to the sample to form PAA and was
stored at -5°C to maintain the solution properties. The synthesized PAA/catalyst solution was
electrospun into a nanofiber onto a cylinder covered with aluminum foil and placed 15cm from
the depositing syringe (2cm x 10cm). The PAA nanofiber mat was then converted in polyimide
(PI) using a process previously described in the literature. The PI nanofiber mat was fired and
pressed between two plates of alumina under a 3-sccm argon gas flow at 1000°C and maintained
for 1 hour. This method describes the process of self-fabricating carbon nanofiber sheets
however, there are also viable commercial products that can be used in its place.

118
A.2 ELECTRODE CHARACTERIZATION
Table A1. Electrode Characterization techniques
Technique Objective Equipment Description
1 SEM Evaluate catalyst coverage, electrode
morphology, and biofilm coverage
LEO 1530VP Field emission
microscope
2 AFM Confirm the thickness of Pt PSIA Advanced Scanning Probe XE-
100
3 TEM Examine the distribution of platinum JEOL 2100F TEM/STEM
5 Conductivity Quantify the change in conductivity Signatone 1160 Series) with Signatone
probes (Model S-926) and a
semiconductor device analyzer
(Agilent Tech B1500A)
6 Amp-I-t Compare current density of each
electrode
CH Instruments 1040A multi- channel
Potentiostat
7 CV Compare surface area, electron transfer
kinetics, and rate respiration on each
electrode relative to potential
CH Instruments 1040A multi- channel
potentiostat
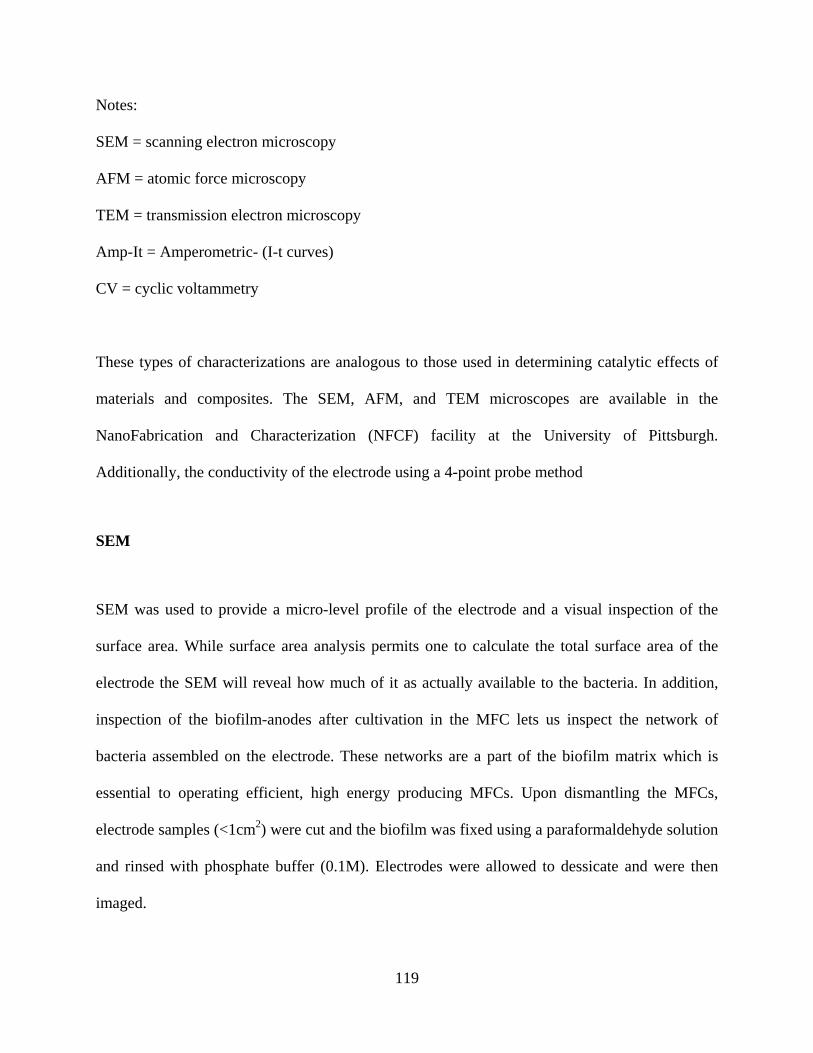
119
Notes:
SEM = scanning electron microscopy
AFM = atomic force microscopy
TEM = transmission electron microscopy
Amp-It = Amperometric- (I-t curves)
CV = cyclic voltammetry
These types of characterizations are analogous to those used in determining catalytic effects of
materials and composites. The SEM, AFM, and TEM microscopes are available in the
NanoFabrication and Characterization (NFCF) facility at the University of Pittsburgh.
Additionally, the conductivity of the electrode using a 4-point probe method
SEM
SEM was used to provide a micro-level profile of the electrode and a visual inspection of the
surface area. While surface area analysis permits one to calculate the total surface area of the
electrode the SEM will reveal how much of it as actually available to the bacteria. In addition,
inspection of the biofilm-anodes after cultivation in the MFC lets us inspect the network of
bacteria assembled on the electrode. These networks are a part of the biofilm matrix which is
essential to operating efficient, high energy producing MFCs. Upon dismantling the MFCs,
electrode samples (<1cm2) were cut and the biofilm was fixed using a paraformaldehyde solution
and rinsed with phosphate buffer (0.1M). Electrodes were allowed to dessicate and were then
imaged.

120
AFM
AFM was used to determine the thickness of the catalyst layer. AFM may also be used to probe
connections within the biofilm and potentially between the bacteria and electrode. Electrodes
can be sampled before and after MFC operations. Electrodes were cut to ~1mm2 , dried and
imaged. Images of dummy wafers were used to monitor the catalyst thickness and the biofilm-
anodes can be prepared similar to SEM samples.
TEM
TEM enabled us to determine size, distribution and adhesion of the catalyst at the nanoscale.
Samples were ground into powders, suspended in ethanol, sonicated, dropped onto a TEM grid
and then imaged. Cross-sectional images help determine the thickness and adhesion of the
catalyst on the electrode and plan view images were used to determine the alignment of the
lattice structures for both catalyst and electrode. Since platinum and carbon have different
densities and packing orders, electron diffraction images are expected to be distinct. Carbon is
expected to exhibit an amorphous ring and platinum will exhibit a polycrystalline structure.
Combining Bright field and Dark field techniques allow one to separate structures that exhibit
specific orientations. Bright field illustrates all structures and dark field illustrates only those that
embody specific orientations.
121
Conductivity
Conductivity of 1cm x 1cm electrode samples were determined using a Probe station (Signatone
1160 Series) with Signatone probes (Model S-926) and a semiconductor device analyzer (Agilent
Tech B1500A). Using the standard 4-probe technique we were able to preclude the contact
resistance from the measurement allowing us a useful and accurate comparison.
A.3 ELECTRODE EVALUATION
Ultimately, the experimental setup (MEC, pure culture, single chamber) and evaluation
techniques control for all relevant parameters that can affect biofilm-anode performance. Each
electrode is adequately profiled and evaluated so as to account for any changes in performance
be it electrochemical or physical. From these results we were able to correlate surface catalyst
loading and physical electrode parameters to MEC performance. These correlations help in
optimizing electrode designs using e-beam evaporation, provide an insight into the effect of
composite electrodes on the biofilm-anode, and provide a framework for understanding novel
materials and or depositions methods.

122
BIBLIOGRAPHY
1. Reinhardt, G., Energy Opportunities in Wastewater and Biosolids. Water Environment Research Foundation 2009.
2. Sanchez, D. V. P.; Huynh, P.; Kozlov, M. E.; Baughman, R. H.; Vidic, R. D.; Yun, M.,
Carbon Nanotube/Platinum (Pt) Sheet as an Improved Cathode for Microbial Fuel Cells. Energy & Fuels 2010, 24 (11), 5897-5902.
3. Potter, M. C., Electrical Effects Accompanying the Decomposition of Organic Compounds.
Proceedings of the Royal Society of London. Series B, Containing Papers of a Biological Character 1911, 84 (571), 260-276.
4. Cohen, B., The Bacterial Culture as an Electrical Half-Cell. J. Bacteriol. Thirty-second
Annual Meeting of the Society of American Bacteriologists 1931, 21 (1), 18-19. 5. Delduca, M. G., Friscoe, J. M. And Zurilla, R. W. , Developments in Industrial Microbiology
American Institute of Biological Sciences 1963, 4, 81-84. 6. Karube, I.; Matsunaga, T.; Tsuru, S.; Suzuki, S., Continous hydrogen production by
immobilized whole cells of Clostridium butyricum. Biochimica et Biophysica Acta (BBA) - General Subjects 1976, 444 (2), 338-343.
7. Karube, I.; Matsunaga, T.; Tsuru, S.; Suzuki, S., Biochemical fuel cell utilizing immobilized
cells of clostridium butyricum. Biotechnology and Bioengineering 1977, 19 (11), 1727-1733.
8. Bennetto, H. P.; Stirling, J. L.; Tanaka, K.; Vega, C. A., Anodic reactions in microbial fuel
cells. Biotechnology and Bioengineering 1983, 25 (2), 559-568. 9. Thurston, C. F.; Bennetto, H. P.; Delaney, G. M.; Mason, J. R.; Roller, S. D.; Stirling, J. L.,
Glucose Metabolism in a Microbial Fuel Cell. Stoichiometry of Product Formation in a Thionine-mediated Proteus vulgaris Fuel Cell and its Relation to Coulombic Yields. J Gen Microbiol 1985, 131 (6), 1393-1401.
123
10. Bennetto, H. P., Electricity Generation by Micro-organisms Biotechnology Education. Biotechnology Education 1990, 1 (4), 163-168.
11. Allen, R.; Bennetto, H., Microbial fuel-cells. Applied Biochemistry and Biotechnology 1993,
39-40 (1), 27-40. 12. Ramani, V., Fuel Cells. The Electrochemical Society Interface 2006, 41. 13. Lovley, D. R., Microbial fuel cells: novel microbial physiologies and engineering
approaches. Current Opinion in Biotechnology 2006, 17 (3), 327-332. 14. Rabaey, K.; Verstraete, W., Microbial fuel cells: novel biotechnology for energy generation.
Trends in Biotechnology 2005, 23 (6), 291-298. 15. Development of a Microbial Fuel Cell for Sustainable Wastewater Treatment (No. U1R06).
Water Environment Research Foundation 2010, U1R06. 16. Pham, T.; Rabaey, K.; Aelterman, P.; Clauwaert, P.; De Schamphelaire, L.; Boon, N.;
Verstraete, W., Microbial Fuel Cells in Relation to Conventional Anaerobic Digestion Technology. Engineering in Life Sciences 2006, 6 (3), 285-292.
17. Van Lier, J. B., High-rate anaerobic wastewater treatment: diversifying from end-of-the-pipe
treatement to resource-oriented conversion techniques. Water Science and Technology 2008, 57, 1137-1148.
18. Logan, B., Scaling up microbial fuel cells and other bioelectrochemical systems. Applied
Microbiology and Biotechnology 2010, 85 (6), 1665-1671. 19. Logan, B. E.; Hamelers, B.; Rozendal, R.; Schroder, U.; Keller, J.; Freguia, S.; Aelterman,
P.; Verstraete, W.; Rabaey, K., Microbial fuel cells: Methodology and technology. Environmental Science and Technology 2006, 40 (17), 5181-5192.
20. Bard, A. J.; Faulkner, L. R., Electrochemical Methods : Fundamentals and Applications.
2nd ed.; John Wiley & Sons Inc.: New York, NY, 2001. 21. Pant, D.; Van Bogaert, G.; Diels, L.; Vanbroekhoven, K., A review of the substrates used in
microbial fuel cells (MFCs) for sustainable energy production. Bioresource Technology 2010, 101 (6), 1533-1543.
22. Lee, H.-S.; Parameswaran, P.; Kato-Marcus, A.; Torres, C. I.; Rittmann, B. E., Evaluation of
energy-conversion efficiencies in microbial fuel cells (MFCs) utilizing fermentable and non-fermentable substrates. Water Research 2008, 42 (6-7), 1501-1510.
23. Parameswaran, P.; Torres, C. I.; Lee, H. S.; Krajmalnik-Brown, R.; Rittmann, B. E.,
Syntrophic interactions among anode respiring bacteria (ARB) and Non-ARB in a

124
biofilm anode: electron balances. Biotechnology and Bioengineering 2009, 103 (3), 513-523.
24. Schroder, U., Anodic electron transfer mechanisms in microbial fuel cells and their energy
efficiency. Physical Chemistry Chemical Physics 2007, 9 (21), 2619-2629. 25. Torres, C. I.; Marcus, A. K.; Lee, H.-S.; Parameswaran, P.; Krajmalnik-Brown, R.;
Rittmann, B. E., A kinetic perspective on extracellular electron transfer by anode-respiring bacteria. FEMS Microbiology Reviews 2010, 34 (1), 3-17.
26. Lanthier, M.; Gregory, K. B.; Lovley, D. R., Growth with high planktonic biomass in
<i>Shewanella oneidensis</i> fuel cells. FEMS Microbiology Letters 2008, 278 (1), 29-35.
27. Marsili, E.; Baron, D. B.; Shikhare, I. D.; Coursolle, D.; Gralnick, J. A.; Bond, D. R.,
Shewanella secretes flavins that mediate extracellular electron transfer. Proceedings of the National Academy of Sciences 2008, 105 (10), 3968-3973.
28. Rabaey, K.; Boon, N.; Höfte, M.; Verstraete, W., Microbial Phenazine Production Enhances
Electron Transfer in Biofuel Cells. Environmental Science & Technology 2005, 39 (9), 3401-3408.
29. Rabaey, K.; Boon, N.; Siciliano, S. D.; Verhaege, M.; Verstraete, W., Biofuel Cells Select
for Microbial Consortia That Self-Mediate Electron Transfer. Appl. Environ. Microbiol. 2004, 70 (9), 5373-5382.
30. Delaney, G. M.; Bennetto, H. P.; Mason, J. R.; Roller, S. D.; Stirling, J. L.; Thurston, C. F.,
Electron-transfer coupling in microbial fuel cells. 2. performance of fuel cells containing selected microorganism - mediator - substrate combinations. Journal of chemical technology and biotechnology. Biotechnology 1984, 34 (1), 13-27.
31. Newman, D. K.; Kolter, R., A role for excreted quinones in extracellular electron transfer.
Nature 2000, 405 (6782), 94-97. 32. Pham, T.; Boon, N.; Aelterman, P.; Clauwaert, P.; De Schamphelaire, L.; Vanhaecke, L.; De
Maeyer, K.; Höfte, M.; Verstraete, W.; Rabaey, K., Metabolites produced by <i>Pseudomonas</i> sp. enable a Gram-positive bacterium to achieve extracellular electron transfer. Applied Microbiology and Biotechnology 2008, 77 (5), 1119-1129.
33. Marcus, A. K.; Torres, C. I.; Rittmann, B. E., Conduction-based modeling of the biofilm
anode of a microbial fuel cell. Biotechnology and Bioengineering 2007, 98 (6), 1171-1182.
34. El-Naggar, M. Y.; Gorby, Y. A.; Xia, W.; Nealson, K. H., The Molecular Density of States
in Bacterial Nanowires. Biophysical Journal 2008, 95 (1), L10-L12.

125
35. Gorby, Y. A.; Beveridge, T. J.; Wiley, W. R., Composition, Reactivity, and Regulation of
Extracellular Metal-Reducing Structures(Nanowires) Produced by Dissimilatory Metal Reducing Bacteria. 2005; p Medium: ED.
36. Gorby, Y. A.; Yanina, S.; Mclean, J. S.; Rosso, K. M.; Moyles, D.; Dohnalkova, A.;
Beveridge, T. J.; Chang, I. S.; Kim, B. H.; Kim, K. S.; Culley, D. E.; Reed, S. B.; Romine, M. F.; Saffarini, D. A.; Hill, E. A.; Shi, L.; Elias, D. A.; Kennedy, D. W.; Pinchuk, G.; Watanabe, K.; Ishii, S. I.; Logan, B.; Nealson, K. H.; Fredrickson, J. K., Electrically conductive bacterial nanowires produced by Shewanella oneidensis strain MR-1 and other microorganisms. Proceedings of the National Academy of Sciences 2006, 103 (30), 11358-11363.
37. Leang, C.; Qian, X.; Mester, T.; Lovley, D. R., Alignment of the c-Type Cytochrome OmcS
along Pili of Geobacter sulfurreducens. Appl. Environ. Microbiol. 2010, 76 (12), 4080-4084.
38. Nakamura, R.; Kai, F.; Okamoto, A.; Newton, Greg j.; Hashimoto, K., Self-Constructed
Electrically Conductive Bacterial Networks13. Angewandte Chemie 2009, 121 (3), 516-519.
39. Ntarlagiannis, D.; Atekwana, E. A.; Hill, E. A.; Gorby, Y., Microbial nanowires: Is the
subsurface “hardwired�? Geophys. Res. Lett. 2007, 34. 40. Reguera, G.; Mccarthy, K. D.; Mehta, T.; Nicoll, J. S.; Tuominen, M. T.; Lovley, D. R.,
Extracellular electron transfer via microbial nanowires. Nature 2005, 435 (7045), 1098-1101.
41. Reguera, G.; Nevin, K. P.; Nicoll, J. S.; Covalla, S. F.; Woodard, T. L.; Lovley, D. R.,
Biofilm and nanowire production leads to increased current in Geobacter sulfurreducens fuel cells. Applied and Environmental Microbiology 2006, 72 (11), 7345-7348.
42. Richter, H.; Nevin, K. P.; Jia, H.; Lowy, D. A.; Lovley, D. R.; Tender, L. M., Cyclic
voltammetry of biofilms of wild type and mutant Geobacter sulfurreducens on fuel cell anodes indicates possible roles of OmcB, OmcZ, type IV pili, and protons in extracellular electron transfer. Energy & Environmental Science 2009, 2 (5), 506-516.
43. Alwarappan, S.; Joshi, R. K.; Ram, M. K.; Kumar, A., Electron transfer mechanism of
cytochrome c at graphene electrode. Applied Physics Letters 2010, 96 (26), 263702-3. 44. Gerasimov, J. Y.; Lai, R. Y., An electrochemical peptide-based biosensing platform for HIV
detection. Chemical Communications 2010, 46 (3), 395-397. 45. Odenthal, K. J.; Gooding, J. J., An introduction to electrochemical DNAbiosensors. Analyst
2007, 132 (7), 603-610.

126
46. Qiao, Y.; Bao, S.-J.; Li, C. M., Electrocatalysis in microbial fuel cells-from electrode material to direct electrochemistry. Energy & Environmental Science 2010, 3 (5), 544-553.
47. Liu, Y.; Harnisch, F.; Fricke, K.; Schröder, U.; Climent, V.; Feliu, J. M., The study of
electrochemically active microbial biofilms on different carbon-based anode materials in microbial fuel cells. Biosensors and Bioelectronics 2010, 25 (9), 2167-2171.
48. Park, H. I.; Mushtaq, U.; Perello, D.; Lee, I.; Cho, S. K.; Star, A.; Yun, M., Effective and
Low-Cost Platinum Electrodes for Microbial Fuel Cells Deposited by Electron Beam Evaporation. Energy & Fuels 2007, 21 (5), 2984-2990.
49. Scott, K.; Rimbu, G. A.; Katuri, K. P.; Prasad, K. K.; Head, I. M., Application of Modified
Carbon Anodes in Microbial Fuel Cells. Process Safety and Environmental Protection 2007, 85 (5), 481-488.
50. Xuyen, N. T.; Sanchez, D. P. V.; Kim, T. H.; Park, H. I.; Yun, M.; Lee, Y. H., Diffusion-
limited reduction of organometallic compound on carbon nanofiber mat for catalytic applications. Journal of Materials Chemistry 2010, 20 (26), 5468-5473.
51. Harnisch, F.; Wirth, S.; Schröder, U., Effects of substrate and metabolite crossover on the
cathodic oxygen reduction reaction in microbial fuel cells: Platinum vs. iron(II) phthalocyanine based electrodes. Electrochemistry Communications 2009, 11 (11), 2253-2256.
52. Rosenbaum, M.; Zhao, F.; Quaas, M.; Wulff, H.; Schröder, U.; Scholz, F., Evaluation of
catalytic properties of tungsten carbide for the anode of microbial fuel cells. Applied Catalysis B: Environmental 2007, 74 (3-4), 261-269.
53. Niessen, J.; Schröder, U.; Rosenbaum, M.; Scholz, F., Fluorinated polyanilines as superior
materials for electrocatalytic anodes in bacterial fuel cells. Electrochemistry Communications 2004, 6 (6), 571-575.
54. Zhao, F.; Harnisch, F.; Schröder, U.; Scholz, F.; Bogdanoff, P.; Herrmann, I., Application of
pyrolysed iron(II) phthalocyanine and CoTMPP based oxygen reduction catalysts as cathode materials in microbial fuel cells. Electrochemistry Communications 2005, 7 (12), 1405-1410.
55. Cheng, S.; Liu, H.; Logan, B. E., Power Densities Using Different Cathode Catalysts (Pt and
CoTMPP) and Polymer Binders (Nafion and PTFE) in Single Chamber Microbial Fuel Cells. Environmental Science & Technology 2005, 40 (1), 364-369.
56. Park; Park, D.; Zeikus; Zeikus, J., Impact of electrode composition on electricity generation
in a single-compartment fuel cell using Shewanella putrefaciens. Applied Microbiology and Biotechnology 2002, 59 (1), 58-61.

127
57. Selembo, P. A.; Merrill, M. D.; Logan, B. E., The use of stainless steel and nickel alloys as low-cost cathodes in microbial electrolysis cells. Journal of Power Sources 2009, 190 (2), 271-278.
58. Yuan, Y.; Kim, S., Polypyrrole-coated reticulated vitreous carbon as anode in microbial fuel
cell for higher energy output. Bulletin of the Korean Chemical Society 2008, 29 (1), 168-172.
59. Zou, Y.; Xiang, C.; Yang, L.; Sun, L.-X.; Xu, F.; Cao, Z., A mediatorless microbial fuel cell
using polypyrrole coated carbon nanotubes composite as anode material. International Journal of Hydrogen Energy 2008, 33 (18), 4856-4862.
60. Schröder, U.; Nießen, J.; Scholz, F., A Generation of Microbial Fuel Cells with Current
Outputs Boosted by More Than One Order of Magnitude. Angewandte Chemie International Edition 2003, 42 (25), 2880-2883.
61. Anderson, M. L.; Stroud, R. M.; Rolison, D. R., Enhancing the Activity of Fuel-cell
Reactions by Designing Three-dimensional Nanostructured Architectures: Catalyst -modified Carbon−Silica Composite Aerogels. Nano Letters 2002, 2 (3), 235-240.
62. Formo, E.; Lee, E.; Campbell, D.; Xia, Y., Functionalization of Electrospun TiO2
Nanofibers with Pt Nanoparticles and Nanowires for Catalytic Applications. Nano Letters 2008, 8 (2), 668-672.
63. Hsin, Y. L.; Hwang, K. C.; Yeh, C.-T., Poly(vinylpyrrolidone)-Modified Graphite Carbon
Nanofibers as Promising Supports for PtRu Catalysts in Direct Methanol Fuel Cells. Journal of the American Chemical Society 2007, 129 (32), 9999-10010.
64. Liu, S.-H.; Yu, W.-Y.; Chen, C.-H.; Lo, A.-Y.; Hwang, B.-J.; Chien, S.-H.; Liu, S.-B.,
Fabrication and Characterization of Well-Dispersed and Highly Stable PtRu Nanoparticles on Carbon Mesoporous Material for Applications in Direct Methanol Fuel Cell. Chemistry of Materials 2008, 20 (4), 1622-1628.
65. Lin, Y.; Cui, X.; Yen, C. H.; Wai, C. M., PtRu/Carbon Nanotube Nanocomposite
Synthesized in Supercritical Fluid: A Novel Electrocatalyst for Direct Methanol Fuel Cells. Langmuir 2005, 21 (24), 11474-11479.
66. Bensebaa, F.; Farah, A. A.; Wang, D.; Bock, C.; Du, X.; Kung, J.; Le Page, Y., Microwave
Synthesis of Polymer-Embedded Pt−Ru Catalyst for Direct Methanol Fuel Cell. The Journal of Physical Chemistry B 2005, 109 (32), 15339-15344.
67. Kim, S. J.; Park, Y. J.; Ra, E. J.; Kim, K. K.; An, K. H.; Lee, Y. H.; Choi, J. Y.; Park, C. H.;
Doo, S. K.; Park, M. H.; Yang, C. W., Defect-induced loading of Pt nanoparticles on carbon nanotubes. Applied Physics Letters 2007, 90 (2).

128
68. Yu, W.; Tu, W.; Liu, H., Synthesis of Nanoscale Platinum Colloids by Microwave Dielectric Heating. Langmuir 1998, 15 (1), 6-9.
69. Li, D.; Mccann, J. T.; Gratt, M.; Xia, Y., Photocatalytic deposition of gold nanoparticles on
electrospun nanofibers of titania. Chemical Physics Letters 2004, 394 (4–6), 387-391. 70. Niesz, K.; Grass, M.; Somorjai, G. A., Precise Control of the Pt Nanoparticle Size by Seeded
Growth Using EO13PO30EO13 Triblock Copolymers as Protective Agents. Nano Letters 2005, 5 (11), 2238-2240.
71. Wen, Z.; Wang, Q.; Li, J., Template Synthesis of Aligned Carbon Nanotube Arrays using
Glucose as a Carbon Source: Pt Decoration of Inner and Outer Nanotube Surfaces for Fuel-Cell Catalysts. Advanced Functional Materials 2008, 18 (6), 959-964.
72. Di Noto, V.; Negro, E.; Gliubizzi, R.; Lavina, S.; Pace, G.; Gross, S.; Maccato, C., A Pt–Fe
Carbon Nitride Nano-electrocatalyst for Polymer Electrolyte Membrane Fuel Cells and Direct-Methanol Fuel Cells: Synthesis, Characterization, and Electrochemical Studies. Advanced Functional Materials 2007, 17 (17), 3626-3638.
73. Xuyen, N. T.; Ra, E. J.; Geng, H.-Z.; Kim, K. K.; An, K. H.; Lee, Y. H., Enhancement of
Conductivity by Diameter Control of Polyimide-Based Electrospun Carbon Nanofibers. The Journal of Physical Chemistry B 2007, 111 (39), 11350-11353.
74. Chang, I. S.; Jang, J. K.; Gil, G. C.; Kim, M.; Kim, H. J.; Cho, B. W.; Kim, B. H.,
Continuous determination of biochemical oxygen demand using microbial fuel cell type biosensor. Biosensors and Bioelectronics 2004, 19 (6), 607-613.
75. A. Balows; H. G. Truper; M. Dworkin; Harder, W.; K. H. Schleifer, The Acetogenic
Bacteria. In:The Prokaryotes. 2 ed.; Springer: New York, 1992. 76. Hoster, H.; Iwasita, T.; Baumgartner, H.; Vielstich, W., Pt-Ru model catalysts for anodic
methanol oxidation: Influence of structure and composition on the reactivity. Physical Chemistry Chemical Physics 2001, 3 (3), 337-346.
77. Suzuki, H.; Shintaku, M.; Sato, T.; Tamano, M.; Mastsuura, T.; Hori, M.; Kaito, C.,
Experimental Evidence of Stability of Pt Clusters on and in Carbon Particles. Japanese Journal of Applied Physics 2005, 44 (19).
78. Xuyen, N. T.; Jeong, H. K.; Kim, G.; So, K. P.; An, K. H.; Lee, Y. H., Hydrolysis-induced
immobilization of Pt(acac)2 on polyimide-based carbon nanofiber mat and formation of Pt nanoparticles. Journal of Materials Chemistry 2009, 19 (9), 1283-1288.
79. Battiston, G. A.; Gerbasi, R.; Porchia, M.; Gasparotto, A., Metal Organic CVD of
Nanostructured Composite TiO2-Pt Thin Films: A Kinetic Approach. Chemical Vapor Deposition 1999, 5 (1), 13-20.
129
80. Fiddy, S. G.; Newton, M. A.; Campbell, T.; Dent, A. J.; Harvey, I.; Salvini, G.; Turin, S.; Evans, J., Particle development and characterisation in Pt(acac)2 and Pt(acac)2/GeBu4 derived catalysts supported upon porous and mesoporous SiO2: effect of reductive environment, and support structure. Physical Chemistry Chemical Physics 2002, 4 (5), 827-834.
81. Utriainen, M.; Kröger-Laukkanen, M.; Johansson, L.-S.; Niinistö, L., Studies of metallic thin
film growth in an atomic layer epitaxy reactor using M(acac)2 (M=Ni, Cu, Pt) precursors. Applied Surface Science 2000, 157 (3), 151-158.
82. Somorjai, G. A.; Blakely, D. W., MECHANISM OF CATALYSIS OF HYDROCARBON
REACTIONS BY PLATINUM SURFACES. Nature 1975, 258 (5536), 580-583. 83. Somorjai, G. A.; Contreras, A. M.; Montano, M.; Rioux, R. M., Clusters, surfaces, and
catalysis. Proceedings of the National Academy of Sciences 2006, 103 (28), 10577-10583.
84. Zoski, C. G., Handbook of Electrochemistry. Elsevier: Amsterdam, The Netherlands, 2007. 85. Sheppard, S.-A.; A. Campbell, S.; R. Smith, J.; W. Lloyd, G.; C. Walsh, F.; R. Ralph, T.,
Electrochemical and microscopic characterisation of platinum-coated perfluorosulfonic acid (Nafion 117) materials[dagger]. Analyst 1998, 123 (10), 1923-1929.
86. Ishikawa, Y.; Liao, M.-S.; Cabrera, C. R., Oxidation of methanol on platinum, ruthenium
and mixed Pt–M metals (M=Ru, Sn): a theoretical study. Surface Science 2000, 463 (1), 66-80.
87. Kua, J.; Goddard, W. A., Oxidation of Methanol on 2nd and 3rd Row Group VIII Transition
Metals (Pt, Ir, Os, Pd, Rh, and Ru): Application to Direct Methanol Fuel Cells. Journal of the American Chemical Society 1999, 121 (47), 10928-10941.
88. Vielstich, W.; Lamm, A.; Gasteiger, H. A., Handbook of Fuel Cells: Fundamentals,
Technology, Applications. Wiley-VCH: England, 2003; Vol. 2, ch. 41, p 3826. 89. Zhao, Y.; Fan, L.; Zhong, H.; Li, Y.; Yang, S., Platinum Nanoparticle Clusters Immobilized
on Multiwalled Carbon Nanotubes: Electrodeposition and Enhanced Electrocatalytic Activity for Methanol Oxidation. Advanced Functional Materials 2007, 17 (9), 1537-1541.
90. Pham, T. H.; Aelterman, P.; Verstraete, W., Bioanode performance in bioelectrochemical
systems: recent improvements and prospects. Trends in Biotechnology 2009, 27 (3), 168-178.
91. Sharma, T.; Mohana Reddy, A. L.; Chandra, T. S.; Ramaprabhu, S., Development of carbon
nanotubes and nanofluids based microbial fuel cell. International Journal of Hydrogen Energy 2008, 33 (22), 6749-6754.

130
92. Ahn, Y.; Logan, B. E., Effectiveness of domestic wastewater treatment using microbial fuel
cells at ambient and mesophilic temperatures. Bioresource Technology 2010, 101 (2), 469-475.
93. Zhao, F.; Harnisch, F.; Schroder, U.; Scholz, F.; Bogdanoff, P.; Herrmann, I., Challenges
and Constraints of Using Oxygen Cathodes in Microbial Fuel Cells. Environmental Science & Technology 2006, 40 (17), 5193-5199.
94. Du, Z.; Li, H.; Gu, T., A state of the art review on microbial fuel cells: A promising
technology for wastewater treatment and bioenergy. Biotechnology Advances 2007, 25 (5), 464-482.
95. Torres, C. I.; Kato Marcus, A.; Rittmann, B. E., Proton transport inside the biofilm limits
electrical current generation by anode-respiring bacteria. Biotechnology and Bioengineering 2008, 100 (5), 872-881.
96. Rozendal, R. A.; Hamelers, H. V. M.; Rabaey, K.; Keller, J.; Buisman, C. J. N., Towards
practical implementation of bioelectrochemical wastewater treatment. Trends in Biotechnology 2008, 26 (8), 450-459.
97. Torres, C. I.; Marcus, A. K.; Rittmann, B. E., Proton transport inside the biofilm limits
electrical current generation by anode-respiring bacteria. Biotechnology and Bioengineering 2008, 100 (5), 872-881.
98. Genies, L.; Bultel, Y.; Faure, R.; Durand, R., Impedance study of the oxygen reduction
reaction on platinum nanoparticles in alkaline media. Electrochimica Acta 2003, 48 (25-26), 3879-3890.
99. Oh, S.-E.; Logan, B. E., Proton exchange membrane and electrode surface areas as factors
that affect power generation in microbial fuel cells. Applied Microbiology and Biotechnology 2006, 70 (2), 162-169.
100. Zhang, M.; Fang, S.; Zakhidov, A. A.; Lee, S. B.; Aliev, A. E.; Williams, C. D.; Atkinson,
K. R.; Baughman, R. H., Strong, Transparent, Multifunctional, Carbon Nanotube Sheets. Science 2005, 309 (5738), 1215-1219.
101. Zhang, T.; Zeng, Y.; Chen, S.; Ai, X.; Yang, H., Improved performances of E. coli-
catalyzed microbial fuel cells with composite graphite/PTFE anodes. Electrochemistry Communications 2007, 9 (3), 349-353.
102. Gil, G.-C.; Chang, I.-S.; Kim, B. H.; Kim, M.; Jang, J.-K.; Park, H. S.; Kim, H. J.,
Operational parameters affecting the performannce of a mediator-less microbial fuel cell. Biosensors and Bioelectronics 2003, 18 (4), 327-334.

131
103. Park, H. I.; Sanchez, D.; Cho, S. K.; Yun, M., Bacterial Communities on Electron-Beam Pt-Deposited Electrodes in a Mediator-Less Microbial Fuel Cell. Environmental Science & Technology 2008, 42 (16), 6243-6249.
104. Dresselhaus, M. S.; Eklund, P. C., Phonons in carbon nanotubes. Advances in Physics
2000, 49 (6), 705 - 814. 105. Torres, C. S. I.; Krajmalnik-Brown, R.; Parameswaran, P.; Marcus, A. K.; Wanger, G.;
Gorby, Y. A.; Rittmann, B. E., Selecting Anode-Respiring Bacteria Based on Anode Potential: Phylogenetic, Electrochemical, and Microscopic Characterization. Environmental Science & Technology 2009, 43 (24), 9519-9524.
106. Bond, D. R.; Lovley, D. R., Electricity Production by Geobacter sulfurreducens Attached
to Electrodes. Appl. Environ. Microbiol. 2003, 69 (3), 1548-1555. 107. Kim, B. H.; Park, H. S.; Kim, H. J.; Kim, G. T.; Chang, I. S.; Lee, J.; Phung, N. T.,
Enrichment of microbial community generating electricity using a fuel-cell-type electrochemical cell. Applied Microbiology and Biotechnology 2004, 63 (6), 672-681.
108. Franks, A. E.; Malvankar, N.; Nevin, K. P., Bacterial biofilms: the powerhouse of a
microbial fuel cell. Biofuels 2010, 1 (4), 589-604. 109. Chaudhuri, S. K.; Lovley, D. R., Electricity generation by direct oxidation of glucose in
mediatorless microbial fuel cells. Nat Biotech 2003, 21 (10), 1229-1232. 110. Reguera, G.; Nevin, K. P.; Nicoll, J. S.; Covalla, S. F.; Woodard, T. L.; Lovley, D. R.,
Biofilm and Nanowire Production Leads to Increased Current in Geobacter sulfurreducens Fuel Cells. Appl. Environ. Microbiol. 2006, 72 (11), 7345-7348.
111. Tsai, H.-Y.; Wu, C.-C.; Lee, C.-Y.; Shih, E. P., Microbial fuel cell performance of
multiwall carbon nanotubes on carbon cloth as electrodes. Journal of Power Sources 2009, 194 (1), 199-205.
112. Li, F.; Sharma, Y.; Lei, Y.; Li, B.; Zhou, Q., Microbial Fuel Cells: The Effects of
Configurations, Electrolyte Solutions, and Electrode Materials on Power Generation. Applied Biochemistry and Biotechnology 2010, 160 (1), 168-181.
113. Logan, B.; Cheng, S.; Watson, V.; Estadt, G., Graphite Fiber Brush Anodes for Increased
Power Production in Air-Cathode Microbial Fuel Cells. Environmental Science & Technology 2007, 41 (9), 3341-3346.
114. Morozan, A.; Stamatin, I.; Stamatin, L.; Dumitru, A.; Scott, K., Carbon electrodes for
microbial fuel cells. Journal of Optoelectronics and Advanced Materials 2007, 9 (1), 221-224.

132
115. Cheng, S.; Logan, B. E., Ammonia treatment of carbon cloth anodes to enhance power generation of microbial fuel cells. Electrochemistry Communications 2007, 9 (3), 492-496.
116. Dumas, C.; Mollica, A.; Féron, D.; Basséguy, R.; Etcheverry, L.; Bergel, A., Marine
microbial fuel cell: Use of stainless steel electrodes as anode and cathode materials. Electrochimica Acta 2007, 53 (2), 468-473.
117. Qiao, Y.; Li, C. M.; Bao, S.-J.; Bao, Q.-L., Carbon nanotube/polyaniline composite as
anode material for microbial fuel cells. Journal of Power Sources 2007, 170 (1), 79-84. 118. Zeng, L.; Zhang, L.; Li, W.; Zhao, S.; Lei, J.; Zhou, Z., Molybdenum carbide as anodic
catalyst for microbial fuel cell based on Klebsiella pneumoniae. Biosensors and Bioelectronics 2010, 25 (12), 2696-2700.
119. Dewan, A.; Beyenal, H.; Lewandowski, Z., Scaling up Microbial Fuel Cells.
Environmental Science & Technology 2008, 42 (20), 7643-7648. 120. Andersson, S.; Nilsson, M.; Dalhammar, G.; Rajarao, G. K., Assessment of Carrier
Materials for Biofilm Formation and Denitrification. Vatten 2008, (64), 201-207. 121. Ebrahimi, S.; Fernández Morales, F. J.; Kleerebezem, R.; Heijnen, J. J.; Van Loosdrecht,
M. C. M., High-rate acidophilic ferrous iron oxidation in a biofilm airlift reactor and the role of the carrier material. Biotechnology and Bioengineering 2005, 90 (4), 462-472.
122. Kappell, G. M.; Grover, J. P.; Chrzanowski, T. H., Micro-scale surface-patterning
influences biofilm formation. Electronic Journal of Biotechnology 2009, 12 (3). 123. Chen, S.; He, G.; Carmona-Martinez, A. A.; Agarwal, S.; Greiner, A.; Hou, H.; Schröder,
U., Electrospun carbon fiber mat with layered architecture for anode in microbial fuel cells. Electrochemistry Communications 2011, 13 (10), 1026-1029.
124. He, G.; Gu, Y.; He, S.; Schröder, U.; Chen, S.; Hou, H., Effect of fiber diameter on the
behavior of biofilm and anodic performance of fiber electrodes in microbial fuel cells. Bioresource Technology 2011, 102 (22), 10763-10766.
125. Baron, D.; Labelle, E.; Coursolle, D.; Gralnick, J. A.; Bond, D. R., Electrochemical
Measurement of Electron Transfer Kinetics by Shewanella oneidensis MR-1. Journal of Biological Chemistry 2009, 284 (42), 28865-28873.
126. Torres, C. S. I.; Marcus, A. K.; Parameswaran, P.; Rittmann, B. E., Kinetic Experiments for
Evaluating the Nernst−Monod Model for Anode-Respiring Bacteria (ARB) in a Biofilm Anode. Environmental Science & Technology 2008, 42 (17), 6593-6597.
127. Rittman, B. E.; Mccarty, P. L., Environmental Biotechnology: Principles and Applications.
McGraw Hill: New York, NY, 2001.
133
128. Katsikogianni, M.; Missirlis, Y. F., Concise review of mechanisms of bacterial adhesion to
biomaterials and of techniques used in estimating bacteria-material interactions. European Cells and Materials 2004, 8, 37-57.
129. Pavithra, D.; Mukesh, D., Biofilm formation, bacterial adhesion and host response on
polymeric implants—issues and prevention. Biomedical Materials 2008, 3 (3), 034003. 130. Maissel, L. I.; Glang, R., Handbook of thin film technology. McGraw-Hill: 1970. 131. Thormann, K. M.; Saville, R. M.; Shukla, S.; Pelletier, D. A.; Spormann, A. M., Initial
Phases of Biofilm Formation in Shewanella oneidensis MR-1. Journal of Bacteriology 2004, 186 (23), 8096-8104.
132. Hirst, J., Elucidating the mechanisms of coupled electron transfer and catalytic reactions by
protein film voltammetry. Biochimica et Biophysica Acta (BBA) - Bioenergetics 2006, 1757 (4), 225-239.
133. Malvankar, N. S.; Tuominen, M. T.; Lovley, D. R., Biofilm conductivity is a decisive
variable for high-current-density Geobacter sulfurreducens microbial fuel cells. Energy & Environmental Science 2012, 5 (2), 5790-5797.
134. Liu, C.; Gorby, Y. A.; Zachara, J. M.; Fredrickson, J. K.; Brown, C. F., Reduction kinetics
of Fe(III), Co(III), U(VI), Cr(VI), and Tc(VII) in cultures of dissimilatory metal-reducing bacteria. Biotechnology and Bioengineering 2002, 80 (6), 637-649.
135. Carpentier, W.; De Smet, L.; Van Beeumen, J.; Brigé, A., Respiration and Growth of
Shewanella oneidensis MR-1 Using Vanadate as the Sole Electron Acceptor. Journal of Bacteriology 2005, 187 (10), 3293-3301.
136. Middleton, S. S.; Latmani, R. B.; Mackey, M. R.; Ellisman, M. H.; Tebo, B. M.; Criddle,
C. S., Cometabolism of Cr(VI) by Shewanella oneidensis MR-1 produces cell-associated reduced chromium and inhibits growth. Biotechnology and Bioengineering 2003, 83 (6), 627-637.
137. Wang, H.; Law, N.; Pearson, G.; Van Dongen, B. E.; Jarvis, R. M.; Goodacre, R.; Lloyd, J.
R., Impact of Silver(I) on the Metabolism of Shewanella oneidensis. Journal of Bacteriology 2010, 192 (4), 1143-1150.
138. Hau, H. H.; Gilbert, A.; Coursolle, D.; Gralnick, J. A., Mechanism and Consequences of
Anaerobic Respiration of Cobalt by Shewanella oneidensis Strain MR-1. Applied and Environmental Microbiology 2008, 74 (22), 6880-6886.
139. Goldstein, J. I.; Newbury, D. E.; Echlin, P.; Joy, D. C.; Lyman, C. E.; Lifshin, E.; Sawyer,
L.; Michael, J. R., Scanning Electron Microscopy and X-ray Microanalysis. 3rd ed.; Kluwer Academic/Plenum Plublishers: New York, NY, 2003.

134
140. Rahaman, M. S. A.; Ismail, A. F.; Mustafa, A., A review of heat treatment on
polyacrylonitrile fiber. Polymer Degradation and Stability 2007, 92 (8), 1421-1432. 141. Campbell Jr, F., Manufacturing Processes for Advanced Composites. Elsevier: New York,
NY, 2004. 142. Liu, J.; Wang, P. H.; Li, R. Y., Continuous carbonization of polyacrylonitrile-based
oxidized fibers: Aspects on mechanical properties and morphological structure. Journal of Applied Polymer Science 1994, 52 (7), 945-950.
143. National Research Council, U. S. Drinking Water and Health; Washington D.C., 1977. 144. Minteer, S. D.; Atanassov, P.; Luckarift, H. R.; Johnson, G. R., New materials for
biological fuel cells. Materials Today 2012, 15 (4), 166-173. 145. Bretschger, O.; Obraztsova, A.; Sturm, C. A.; Chang, I. S.; Gorby, Y. A.; Reed, S. B.;
Culley, D. E.; Reardon, C. L.; Barua, S.; Romine, M. F.; Zhou, J.; Beliaev, A. S.; Bouhenni, R.; Saffarini, D.; Mansfeld, F.; Kim, B.-H.; Fredrickson, J. K.; Nealson, K. H., Current Production and Metal Oxide Reduction by Shewanella oneidensis MR-1 Wild Type and Mutants. Applied and Environmental Microbiology 2007, 73 (21), 7003-7012.
146. Mcdonough, J. R.; Choi, J. W.; Yang, Y.; La Mantia, F.; Zhang, Y. G.; Cui, Y., Carbon
nanofiber supercapacitors with large areal capacitances. Applied Physics Letters 2009, 95 (24).
147. Wu, L.; Zhang, X.; Ju, H., Detection of NADH and Ethanol Based on Catalytic Activity of
Soluble Carbon Nanofiber with Low Overpotential. Analytical Chemistry 2006, 79 (2), 453-458.
148. Ra, E. J.; Raymundo-Piñero, E.; Lee, Y. H.; Béguin, F., High power supercapacitors using
polyacrylonitrile-based carbon nanofiber paper. Carbon 2009, 47 (13), 2984-2992. 149. Zhang, T.; Nie, H.; Bain, T. S.; Lu, H.; Cui, M.; Snoeyenbos-West, O. L.; Franks, A. E.;
Nevin, K. P.; Russell, T. P.; Lovley, D. R., Improved cathode materials for microbial electrosynthesis. Energy & Environmental Science 2013, 6 (1), 217-224.
150. Chen, S.; Hou, H.; Harnisch, F.; Patil, S. A.; Carmona-Martinez, A. A.; Agarwal, S.;
Zhang, Y.; Sinha-Ray, S.; Yarin, A. L.; Greiner, A.; Schroder, U., Electrospun and solution blown three-dimensional carbon fiber nonwovens for application as electrodes in microbial fuel cells. Energy & Environmental Science 2011, 4 (4), 1417-1421.
151. Xie, X.; Yu, G.; Liu, N.; Bao, Z.; Criddle, C. S.; Cui, Y., Graphene-sponges as high-
performance low-cost anodes for microbial fuel cells. Energy & Environmental Science 2012, 5 (5), 6862-6866.

135
152. Fan, Y.; Xu, S.; Schaller, R.; Jiao, J.; Chaplen, F.; Liu, H., Nanoparticle decorated anodes for enhanced current generation in microbial electrochemical cells. Biosensors and Bioelectronics 2011, 26 (5), 1908-1912.
153. Lowy, D. A.; Tender, L. M.; Zeikus, J. G.; Park, D. H.; Lovley, D. R., Harvesting energy
from the marine sediment–water interface II: Kinetic activity of anode materials. Biosensors and Bioelectronics 2006, 21 (11), 2058-2063.
154. Michaelidou, U.; Ter Heijne, A.; Euverink, G. J. W.; Hamelers, H. V. M.; Stams, A. J. M.;
Geelhoed, J. S., Microbial Communities and Electrochemical Performance of Titanium-Based Anodic Electrodes in a Microbial Fuel Cell. Applied and Environmental Microbiology 2011, 77 (3), 1069-1075.
155. Xie, X.; Ye, M.; Hu, L.; Liu, N.; Mcdonough, J. R.; Chen, W.; Alshareef, H. N.; Criddle,
C. S.; Cui, Y., Carbon nanotube-coated macroporous sponge for microbial fuel cell electrodes. Energy & Environmental Science 2012, 5 (1), 5265-5270.
156. Qiao, Y.; Bao, S.-J.; Li, C. M.; Cui, X.-Q.; Lu, Z.-S.; Guo, J., Nanostructured
Polyaniline/Titanium Dioxide Composite Anode for Microbial Fuel Cells. ACS Nano 2007, 2 (1), 113-119.
157. Novoselov, K. S.; Geim, A. K.; Morozov, S. V.; Jiang, D.; Zhang, Y.; Dubonos, S. V.;
Grigorieva, I. V.; Firsov, A. A., Electric Field Effect in Atomically Thin Carbon Films. Science 2004, 306 (5696), 666-669.
158. Geim, A. K.; Novoselov, K. S., The rise of graphene. Nat Mater 2007, 6 (3), 183-191. 159. Sharma, R.; Baik, J. H.; Perera, C. J.; Strano, M. S., Anomalously Large Reactivity of
Single Graphene Layers and Edges toward Electron Transfer Chemistries. Nano Letters 2010, 10 (2), 398-405.
160. Wang, Q. H.; Jin, Z.; Kim, K. K.; Hilmer, A. J.; Paulus, G. L. C.; Shih, C. J.; Ham, M. H.;
Sanchez-Yamagishi, J. D.; Watanabe, K.; Taniguchi, T.; Kong, J.; Jarillo-Herrero, P.; Strano, M. S., Understanding and controlling the substrate effect on graphene electron-transfer chemistry via reactivity imprint lithography. Nature Chemistry 2012, 4 (9), 724-732.
161. Yuan, Y.; Zhou, S.; Zhao, B.; Zhuang, L.; Wang, Y., Microbially-reduced graphene
scaffolds to facilitate extracellular electron transfer in microbial fuel cells. Bioresource Technology 2012, 116 (0), 453-458.
162. Mohanty, N.; Berry, V., Graphene-Based Single-Bacterium Resolution Biodevice and
DNA Transistor: Interfacing Graphene Derivatives with Nanoscale and Microscale Biocomponents. Nano Letters 2008, 8 (12), 4469-4476.

136
163. Zhuang, L.; Yuan, Y.; Yang, G.; Zhou, S., In situ formation of graphene/biofilm composites for enhanced oxygen reduction in biocathode microbial fuel cells. Electrochemistry Communications 2012, 21 (0), 69-72.
164. Salas, E. C.; Sun, Z.; Lüttge, A.; Tour, J. M., Reduction of Graphene Oxide via Bacterial
Respiration. ACS Nano 2010, 4 (8), 4852-4856. 165. Vargas, M.; Malvankar, N. S.; Tremblay, P.-L.; Leang, C.; Smith, J. A.; Patel, P.;
Synoeyenbos-West, O.; Nevin, K. P.; Lovley, D. R., Aromatic Amino Acids Required for Pili Conductivity and Long-Range Extracellular Electron Transport in Geobacter sulfurreducens. mBio 2013, 4 (2).
166. Marsili, E.; Sun, J.; Bond, D. R., Voltammetry and Growth Physiology of Geobacter
sulfurreducens Biofilms as a Function of Growth Stage and Imposed Electrode Potential. Electroanalysis 2010, 22 (7-8), 865-874.
167. Nevin, K. P.; Kim, B.-C.; Glaven, R. H.; Johnson, J. P.; Woodard, T. L.; Methé, B. A.;
Didonato, R. J., Jr.; Covalla, S. F.; Franks, A. E.; Liu, A.; Lovley, D. R., Anode Biofilm Transcriptomics Reveals Outer Surface Components Essential for High Density Current Production in <italic>Geobacter sulfurreducens</italic> Fuel Cells. PLoS ONE 2009, 4 (5), e5628.
168. Coppi, M. V.; Leang, C.; Sandler, S. J.; Lovley, D. R., Development of a Genetic System
forGeobacter sulfurreducens. Applied and Environmental Microbiology 2001, 67 (7), 3180-3187.
169. Borole, A. P.; Aaron, D.; Hamilton, C. Y.; Tsouris, C., Understanding Long-Term Changes
in Microbial Fuel Cell Performance Using Electrochemical Impedance Spectroscopy. Environmental Science & Technology 2010, 44 (7), 2740-2745.
170. Ramasamy, R. P.; Ren, Z.; Mench, M. M.; Regan, J. M., Impact of initial biofilm growth
on the anode impedance of microbial fuel cells. Biotechnology and Bioengineering 2008, 101 (1), 101-108.
171. Malmsten, M., Formation of Adsorbed Protein Layers. Journal of Colloid and Interface
Science 1998, 207 (2), 186-199. 172. Rollefson, J. B.; Stephen, C. S.; Tien, M.; Bond, D. R., Identification of an Extracellular
Polysaccharide Network Essential for Cytochrome Anchoring and Biofilm Formation in Geobacter sulfurreducens. Journal of Bacteriology 2011, 193 (5), 1023-1033.
173. Nevin, K. P.; Hensley, S. A.; Franks, A. E.; Summers, Z. M.; Ou, J.; Woodard, T. L.;
Snoeyenbos-West, O. L.; Lovley, D. R., Electrosynthesis of Organic Compounds from Carbon Dioxide Is Catalyzed by a Diversity of Acetogenic Microorganisms. Applied and Environmental Microbiology 2011, 77 (9), 2882-2886.

137
174. Williams, K. H.; Bargar, J. R.; Lloyd, J. R.; Lovley, D. R., Bioremediation of uranium-contaminated groundwater: a systems approach to subsurface biogeochemistry. Current Opinion in Biotechnology (0).
175. Williams, K. H.; Nevin, K. P.; Franks, A.; Englert, A.; Long, P. E.; Lovley, D. R.,
Electrode-Based Approach for Monitoring In Situ Microbial Activity During Subsurface Bioremediation. Environmental Science & Technology 2009, 44 (1), 47-54.
176. Ju, A., Using electroative bacteria, students design toxin snesor. Cornell Chronicle 2012.