Understanding the fracture systems of the Second … · 2014-12-03 · Understanding the fracture...
55
Understanding the fracture systems of the Second White Specks Fm. Paul MacKay Shale Petroleum Ltd. June 2013
Transcript of Understanding the fracture systems of the Second … · 2014-12-03 · Understanding the fracture...

Understanding the
fracture systems of the
Second White Specks Fm.
Paul MacKay
Shale Petroleum Ltd.
June 2013
Life Cycle of a Resource Play
$
Immature Mature
Un-named Horizons
Second White Specks
Duvernay
Montney
Pembina Cardium
Development Stage
Definition Mode Early Entrant
Low Land Cost Innovator
Manufacture Mode Entry through Corporate Acquisition
Low Cost Operator Continuous Improvement
De-Risk Mode Competitive
High Land Cost Implement Technology
2011
2012
2013
Second White Specks Play
2

3
Stratigraphic Chart Alberta - Cretaceous

Characteristics of a Resource Play
• Application of Technology
• Geochemistry – Total Organic
Content – Thermal Maturity – Generating vs.
Migration
• Over-pressure • Fracture
Development • Thickness • Fluid Distribution (no
water) • Numerous Vertical
Wells • Surface Access
5
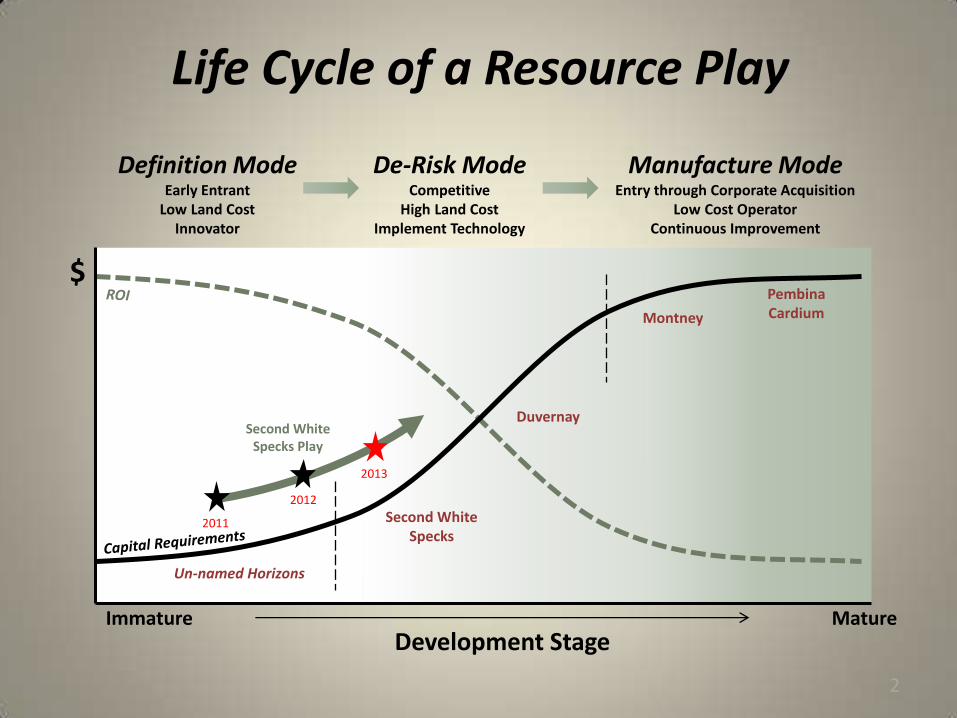
Geochemical Results from Core
Alberta Geological Survey
2 - 4%

The Fundamental Question:
How do fluids move through the crust?
• Requires a pathway
• Requires increased Fluid Pressure
Nano-permeability
vs.
Fracture systems
Pressure Pump
charges adjoining beds
Buoyancy Forces are equal to the density
contrast between the generated hydrocarbons
and formation water. Generally these are not
strong enough to overcome the frictional forces
resisting flow (pore entry pressures).

Increased Fracture Intensity
Increased Fracture Intensity
William Matthews, 2008
Basic Mechanics of Failure
Stress Conditions vs. Strength Characteristics 7

Mohr Diagram:
a critically stressed material
8

How to induce failure
increase s1 s3 s1
s3 s1
s3 s1
decrease s3
decrease s1 and s3
9

s3 s1
Role of Fluid Pressure
s1* s3
*
Increasing Pf
DPf
10

sn
s 3 s1
s
tan n
s1 s1Pf
Strata is critically
stressed
sn
s3 s1
s
tan n
Pf
Fai lu re con diti on
Fai lu re con diti on
s1 s1Pf
Fluid pressure increases
Effective Stress reduced
Failure Conditions
sn
s 3 s1
s
tann
s1 s1Pf
Fluid Escape System fails and
releases fluid
original fluid pressure is
restored
Strata returns to
critically stressed
conditions
11

Coal Type III
Coal Type III
Marine Type I & II
Marine Type I & II
Marine Type I & II
Mixed Type I, II & III
Mixed Type I, II & III
Gas Dominant
(Biogenic)
Oil Dominant
Gas Dominant
Oil Dominant
Detachments Follow
Source Rock (with some exceptions)
No Source
12
Second White Specks

Relationship of Frontal Structures
to the Thrust Belt
Conventional Thrust Play
Unconventional 2WS Play
• Numerous wells • Established Fracture System • Oil Saturated • Extensive Fairway • Overpressured
Overpressure

(Skuce, 1996)
14

Tectonic Domains for the Basement of the
Western Canadian Sedimentary basin
Archean
L. Proterozoic metavolcanics
L. Proterozoic Terranes
Aeromagnetic Data
Ross et al., 1994 Ross et al., 1994

Thermogenic Gas
Biogenic Gas
Pressure Gradient = 1
Second White Specks Pressure vs. Depth
Pressure Gradient
Second White Specks
Pressure gradient of one equivalent to hydrostatic pressure
16

Second White Specks – South-Central Alberta
Fracture Development Fractures enhanced by drape
into Basement Structures
Fractures form during
deformation related to
mountains and oil generation
2WS Oil generating horizon
increases fluid pressure
Thrust Faults follow high
pressure horizon
17
Second White Specks Oil Source for Cardium Fm.
Structurally enhanced
Seismically Identifiable
Fractured Reservoir
Oil Saturated
No Water
Fracture
Fairway
17

Vertical Well
Fractured Reservoirs
A
B

• Porous medium.
• Pressure Gradient in the flow direction (not a direct line)
• k is the permeability along the fluid path
• Incompressible fluid
• Roughness not considered
• Cross-sectional shape not circular
• Permeability is not a physical property
• Permeability ‘averaged’
Darcy’s Law:
Fractured Sandstone - Utah

Well Drainage
(low Pressure)
P1 P2
> P1 P2 >
> P1 P2 >
P1 P2
A
B
B
B
A
A
P2 P1
> P1 P2 >
Well No Drainage
Radial Flow: • Particle A will reach the well bore before particle B • Pressure Front radiates from the well bore as a
function of the radius of the well bore • Drainage is along straight lines towards the well
bore
Elliptical Flow: • Particle A will reach the well bore before particle B • Pressure Front radiates from the well bore as a
function of the radius of the well bore and the difference in permeability between khmax and khmin
• Drainage is along lines perpendicular to the pressure front creating smooth curve drainage trajectory to the well bore
Fracture Flow: • Particle B will reach the well bore before particle A • Pressure Front radiates from the fractures and is a
complex relationship between the matrix permeability and the fracture permeability
• Drainage is along tortuous paths in the reservoir and distance is difficult to determine
• A well not connected to fractures likely will not have flow
P1
P2
Well Drainage
(low Pressure)
Well Drainage
(low Pressure)

fractures
Second White Specks – Highwood River
M. Lamb

Second White Specks – Highwood River

B
A
Conceptual View of a
Fractured Reservoir Plan View
Vertical Well
Drainage (low
Pressure)
Vertical Well
NO Drainage (low
Pressure)

Cardium Horizontals Garrington
Cardium Horizontal Well Results Garrington
• ~120 wells • 88 wells with reported
deviation surveys • 8 wells missed Cardium
sandstone by more than 5 metres
7
2

0.1
1
10
100
1000
10000
1
10
100
1000
10000
100000
1 2 3 4 5 6
Cumm
Cumm
Rate
Rate
Cumul. P10
Cumul. P90
Rate P10
Rate P90
Garrington HZ Wells Cardium
Rat
e (
bb
l/d
)
Cu
mu
lati
ve P
rod
uct
ion
(b
bls
)
50 bopd
250 bopd
time
Production Data

Averaged decline curve
Explanation:
• All horizontal wells in the Cardium from the Garrington Area
• IP(30), IP(90), IP(180), IP(360), IP(540), IP(1080)
• Back Calculate the average rate
• Use Arithmetic Average
0
10
20
30
40
50
60
70
80
90
0 200 400 600 800 1000 1200
Rat
e (
bar
rels
/day
)
Days
Average Production from Cardium Horizontal wells - Garrington

Averaged decline curve
Explanation:
• All horizontal wells in the Cardium from the Garrington Area
• Accumap IP(30), IP(90), IP(180), IP(360), IP(540), IP(1080)
• Back Calculate the average rate
• Use Arithmetic Average
0
10
20
30
40
50
60
70
80
90
0 200 400 600 800 1000 1200
Rat
e (
bar
rels
/day
)
Days
Average Production from Cardium Horizontal wells - Garrington

0
50
100
150
200
250
0
5000
10000
15000
20000
25000
30000
35000
40000
0 200 400 600 800 1000 1200
Cumm
missed Cumm
Rate
missed Rate
Rat
e (
bo
pd
)
Cu
mm
Pro
d (
bar
rels
)
time (days)
Wells within the Cardium Sandstone Dayrate
Wells within the Cardium Sandstone Cumulative Production
Wells within the Shale Dayrate
Wells within the Shale Cumulative Production
Garrington Horizontal Wells Targeted for Cardium

Highwood River
Southern Alberta
Foothills
Second White Specks
Inter-bedded Shale, Siltstone,
and fine-grained Sandstone
oil stain organic rich
silty/sandy
fractured
organic rich
29

Second White Specks (Upper Cretaceous)
Fractures
Lower Shale Section
Highwood River
30

90o calliper
washout
Second White Specks
50 ohms
20 ohms
Bit Size
Oil Generation
Fracture
Zone
Barrons Sandstone
Mannville Low Pressure Gas
Base of Fish Scales
Fluid Migration In
Second White Specks
Calliper
Pres > Phyd
Dec
rea
sin
g P
f D
ecre
asi
ng
Pf

Moderate Washout moderate Fractures
Large Washout Fractures
Large Washout Fractures
Little Washout very minor Fractures
Large Washout Fractures
Low Resistivity High Sw
Low Resistivity High Sw
High Resistivity Generating (?)
High Resistivity Generating (?)
High Resistivity Generating (?)
High Resistivity Generating (?)
Low Resistivity High Sw
Production: 266,000 barrels oil 116 mmcf gas 2,000 barrels wtr

Second White Specks Production +2.3 mmbbls liquids no water
Cardium Production no water other than injected flood water
6-22-36-5W5

Washout for 2WS System 13-16-33-4W5M SSPK
SSPK_A
SSPK_B
SSPK_C
SSPK_D
SSPK_E
BFS
VKNG
Bit
Siz
e
Washout

Washout for 2WS Upper
Increasing Washout
In Gauge

Regional 2nd
White Specks
Base map
Calgary
High River
Crowsnest Pass
Claresholm
Lethbridge

Regional
Aeromagnetic
Data – Southern
Alberta
Reduced to the pole (RTP)
magnetic data
GSC regional magnetic data
compilation, downloadable in
grid form with a 200 m cell size.
37

Calgary
High River
Crowsnest Pass
Claresholm
Lethbridge
Claresholm/Longview (Southern Alberta)
38
Basement
Second White
Specks
Surface
1.3 mmbbls
1.9 BCF
IP +5,000 bopd
39,000 bbls


Mossop et al., 1994

Mossop et al., 1994

Rundle Gp.
42

(Boerner et al., 1999)
Oilsands Deposit
Major Petroleum Migration Pathway
Regional Aeromagnetic
Data

Temperature Data
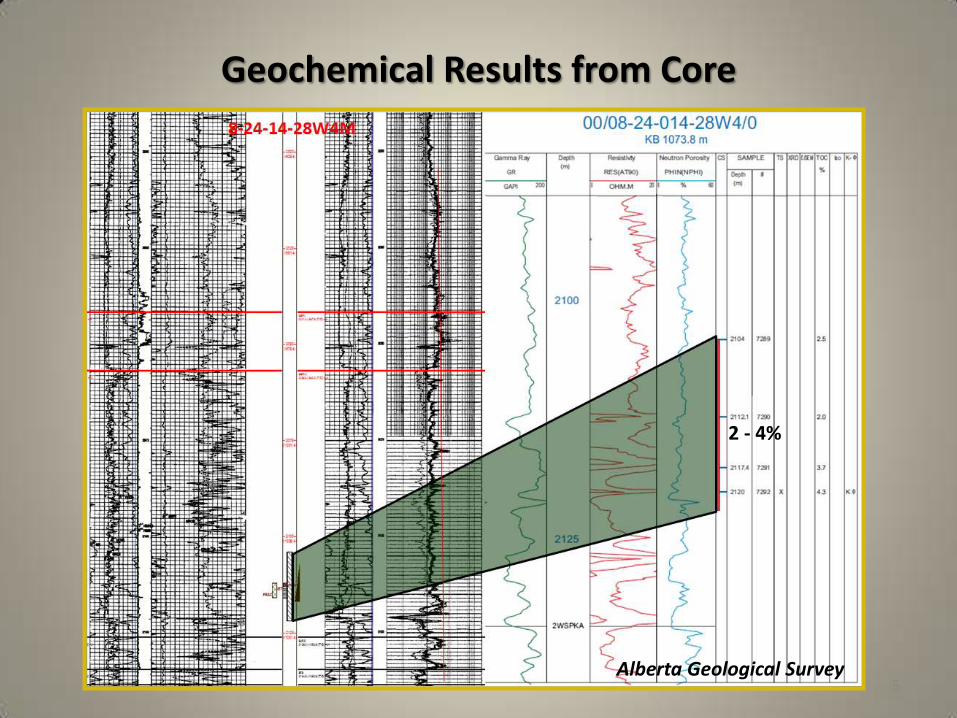
Temperature Gradients
Ts
d1
T1
dT1 dd
T1 - Ts
d1 =
Well 1 Well 2
Ts
d2
T2 Dd = d1-d2
dTr T1 – T2
Dd = Regional Gradient:
dd

d1 d2
d3
d4
Well 1 Well 4 Well 3 Well 2
surface
dep
th
temperature
1
2
3
4
dT dd1
dT dd2
dT dd3
dT dd4
dT dd
dT dd1
dT dd2
dT dd3
dT dd4
= = = dT dd
=
dT dd
• Two ways to calculate thermal gradient
1. Calculate each individual well
2. Calculate regional trend between wells (red)
• If wells at same elevation all gradients will be equal
• Cannot confirm flow between wells
0
10
20
30
40
50
60
70
80
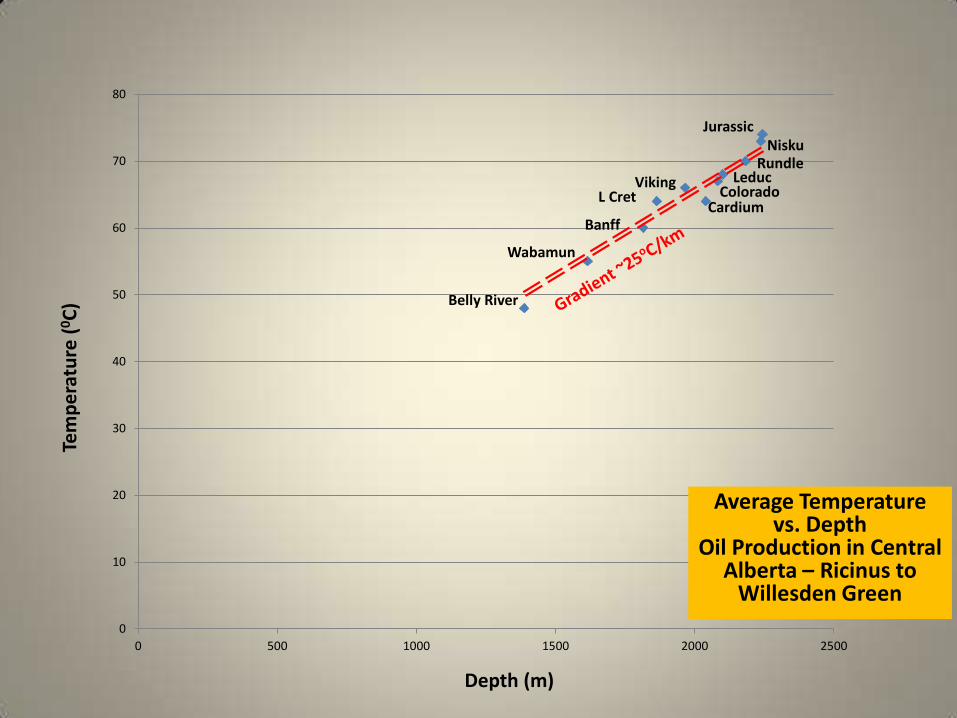
0 500 1000 1500 2000 2500
Belly River
Wabamun
Banff
L Cret Cardium
Viking Colorado
Jurassic Nisku
Rundle Leduc
Average Temperature vs. Depth
Oil Production in Central Alberta – Ricinus to
Willesden Green
Tem
pe
ratu
re (
0C
)
Depth (m)

Average Temperature vs. Depth Oil Production in Southern Alberta
0
10
20
30
40
50
60
70
0 500 1000 1500 2000 2500 3000
Wabamun Cardium
Ellerslie Banff
Barons
Arcs
Livingstone
Detrital
Mannville and Lower Mannville
Average Temperature vs. Depth
Oil Production in Southern Alberta

Medicine Hat High
Matzewan High
Red Deer Low
Change in Thermal
Gradient to Basement Structure
Southern Alberta

d1 d2
d3
d4
Well 1
Well 4
Well 3
Well 2
surface
dep
th
temperature
1
2
3
4
dT dd1
dT dd2
dT dd3
dT dd4
dT dd
dT dd1
dT dd2
dT dd3
dT dd4
< < < dT dd
<
dT dd
• If wells are at different elevation all individual well gradients will
be unequal:
• Provided there is flow between wells
• Flow causes formation T to equilibrate with the seepage point
• Effect is to suppress individual well temperature gradients

d1 d2
d3
d4
Well 1
Well 4
Well 3
Well 2
surface
dT dd1
dT dd2
dT dd3
dT dd4
dT dd d
epth
temperature
1
2
3
4 dT dd
X
4
3
2
1
dT dd
Seep
X X

Thermal Gradient restricted by Formations
Stylized Oil Migration Patterns
Cardium
Lower Colorado
Lower Cretaceous
Jurassic
Rundle
Banff
Wabamun
Nisku
West East
Exshaw
2WS
BFS
Leduc
Ave
rage
Ge
oth
erm
al G
rad
ien
t =
25
.3oC
/km
Upper Colorado
Belly River
18.7oC/km
19.9oC/km
21.2oC/km
22.2oC/km
23.5oC/km
23.7oC/km
23.7oC/km
23.2oC/km
21.4oC/km
24.4oC/km
23.3oC/km
Mature Immature
Thermal Gradients – Central Alberta
Ricinus to Willesden Green
Medicine Hat High
Matzewan High
Red Deer Low

Thermal Gradient restricted by Formations
Stylized Oil Migration Patterns
Cardium
Lower Colorado
Upper Mannville
Lower Mannville
Livingstone
Banff
Wabamun
Arcs
19oC/km
West East
19.6oC/km
14.1oC/km
12.0 – 14.8oC/km
16.0oC/km
14.3oC/km
16.5oC/km
18.0oC/km
12.3oC/km
2WS
BFS
Exshaw
Source Interval
Oil Halo
Mature Immature
Source Interval
Medicine Hat High
Matzewan High
Red Deer Low
Thermal Gradients – Southern Alberta
South Calgary to USA


Resource Target
Petroleum System in South – Central Alberta
Thrust Belt Plains
Regional Migration
To the Oilsands
Biogenic Gas
?
55