Understanding the Effect of Extrusion Processing ...
253
South Dakota State University South Dakota State University Open PRAIRIE: Open Public Research Access Institutional Open PRAIRIE: Open Public Research Access Institutional Repository and Information Exchange Repository and Information Exchange Electronic Theses and Dissertations 2016 Understanding the Effect of Extrusion Processing Parameters on Understanding the Effect of Extrusion Processing Parameters on Physical, Nutritional and Rheological Properties of Soy White Physical, Nutritional and Rheological Properties of Soy White Flakes Based Aquafeed in a Single Screw Extruder Flakes Based Aquafeed in a Single Screw Extruder Sushil Kumar Singh South Dakota State University Follow this and additional works at: https://openprairie.sdstate.edu/etd Part of the Bioresource and Agricultural Engineering Commons Recommended Citation Recommended Citation Singh, Sushil Kumar, "Understanding the Effect of Extrusion Processing Parameters on Physical, Nutritional and Rheological Properties of Soy White Flakes Based Aquafeed in a Single Screw Extruder" (2016). Electronic Theses and Dissertations. 956. https://openprairie.sdstate.edu/etd/956 This Dissertation - Open Access is brought to you for free and open access by Open PRAIRIE: Open Public Research Access Institutional Repository and Information Exchange. It has been accepted for inclusion in Electronic Theses and Dissertations by an authorized administrator of Open PRAIRIE: Open Public Research Access Institutional Repository and Information Exchange. For more information, please contact [email protected].
Transcript of Understanding the Effect of Extrusion Processing ...

South Dakota State University South Dakota State University
Open PRAIRIE: Open Public Research Access Institutional Open PRAIRIE: Open Public Research Access Institutional
Repository and Information Exchange Repository and Information Exchange
Electronic Theses and Dissertations
2016
Understanding the Effect of Extrusion Processing Parameters on Understanding the Effect of Extrusion Processing Parameters on
Physical, Nutritional and Rheological Properties of Soy White Physical, Nutritional and Rheological Properties of Soy White
Flakes Based Aquafeed in a Single Screw Extruder Flakes Based Aquafeed in a Single Screw Extruder
Sushil Kumar Singh South Dakota State University
Follow this and additional works at: https://openprairie.sdstate.edu/etd
Part of the Bioresource and Agricultural Engineering Commons
Recommended Citation Recommended Citation Singh, Sushil Kumar, "Understanding the Effect of Extrusion Processing Parameters on Physical, Nutritional and Rheological Properties of Soy White Flakes Based Aquafeed in a Single Screw Extruder" (2016). Electronic Theses and Dissertations. 956. https://openprairie.sdstate.edu/etd/956
This Dissertation - Open Access is brought to you for free and open access by Open PRAIRIE: Open Public Research Access Institutional Repository and Information Exchange. It has been accepted for inclusion in Electronic Theses and Dissertations by an authorized administrator of Open PRAIRIE: Open Public Research Access Institutional Repository and Information Exchange. For more information, please contact [email protected].

UNDERSTANDING THE EFFECT OF EXTRUSION PROCESSING
PARAMETERS ON PHYSICAL, NUTRITIONAL AND RHEOLOGICAL
PROPERTIES OF SOY WHITE FLAKES BASED AQUAFEED IN A SINGLE
SCREW EXTRUDER
BY
SUSHIL KUMAR SINGH
A dissertation submitted in partial fulfillment of the requirements for the
Doctor of Philosophy
Major in Agricultural, Biosystems, and Mechanical Engineering
South Dakota State University
2016


iii
I would like to dedicate this dissertation to:
My Family Members
Poonam Singha

iv
ACKNOWLEDGEMENTS
First of all I would like to thank Indian Council of Agricultural Research (ICAR),
New Delhi, India for this opportunity to pursue my PhD in USA with ICAR-International
Fellowship 2011-12. My sincere thanks are due to my major advisor Dr. K.
Muthukumarappan for his help in securing admission, constant supervision, guidance and
financial support while carrying out the research work.
I would like to extend my appreciation to all my advisory committee members--
Dr. ZhengRong Gu, Dr. Lin Wei and Dr. Jihong Cole-Dai for their suggestions regarding
my research project, their valuable time, and serving on my committee.
Also, I would like to thank Agricultural Experiment Station, South Dakota State
University, Brookings, USA; Industrial Agricultural Product Center, University of
Nebraska, Lincoln, USA for providing the equipment facility and supplies to conduct
experimental work.
Furthermore, I would like to thank my colleagues for the help given during the
course of experimental work carried out in the laboratory and of course to all other staff
and students of department of Agricultural & Biosystems Engineering at South Dakota
State University for the good working atmosphere, who supported me in any situation
during the completion of my thesis.
I sincerely acknowledge the constant encouragement, co-operation and moral
support of my wife Poonam Singha and friend Umesh Lohani who have attended to many
of my personal problems, difficulties and guided me in completing this work. My deep
gratitude also goes to my parents who have been a constant source of love, concern,
support and strength all these years.

v
TABLE OF CONTENTS
ABBREVIATIONS ........................................................................................................... xi
LIST OF TABLES ........................................................................................................... xiv
LIST OF FIGURES ....................................................................................................... xviii
ABSTRACT .................................................................................................................... xxii
CHAPTER 1 Introduction and Background .................................................................... 1
1.1 Introduction .......................................................................................................... 1
1.2 Objectives ............................................................................................................. 4
1.3 Literature Review ................................................................................................. 6
1.3.1 Protein Sources in Fish Feed......................................................................... 6
1.3.2 Fish Feed Formulation ................................................................................ 10
1.3.3 Soy White Flakes as a Base Material for Fish Feed ................................... 13
1.3.4 Extrusion Technology ................................................................................. 14
1.3.5 Aquafeed Technology ................................................................................. 15
1.3.6 Effect of Feed Parameters ........................................................................... 16
1.3.7 Effect of Extruder Parameters ..................................................................... 22
1.3.8 Fish Feed Extrusion .................................................................................... 25
1.3.9 Modeling and Simulation of Extrusion Studies .......................................... 32
CHAPTER 2 Single Screw Extrusion Processing of Soy White Flakes Based Catla
Feed………….. ................................................................................................................. 42

vi
2.1 Abstract .............................................................................................................. 42
2.2 Introduction ........................................................................................................ 42
2.3 Materials and Methods ....................................................................................... 45
2.3.1 Blend Formulation ...................................................................................... 45
2.3.2 Extrusion Processing ................................................................................... 46
2.3.3 Experimental Design and Analysis ............................................................. 46
2.3.4 Measurement of Physical Properties ........................................................... 47
2.4 Results and Discussion ....................................................................................... 49
2.4.1 Color ........................................................................................................... 49
2.4.2 Pellet Durability Index (PDI) ...................................................................... 50
2.4.3 Bulk Density (BD) ...................................................................................... 51
2.4.4 Water Absorption Index (WAI) and Water Solubility Index (WSI) ........... 51
2.4.5 Unit Density (UD)....................................................................................... 52
2.4.6 Expansion Ratio (ER) ................................................................................. 52
2.5 Conclusions ........................................................................................................ 52
CHAPTER 3 Effect of Extrusion Processing Parameters on Physical Properties of Soy
White Flakes and High Protein Distillers Dried Grains-Based Extruded Aquafeeds ....... 59
3.1 Abstract .............................................................................................................. 59
3.2 Introduction ........................................................................................................ 60
3.3 Materials and Methods ....................................................................................... 62

vii
3.3.1 Blends Preparation ...................................................................................... 62
3.3.2 Extrusion Processing ................................................................................... 63
3.3.3 Experimental Design and Statistical Analysis ............................................ 64
3.3.4 Measurement of Physical Properties ........................................................... 65
3.4 Results and Discussion ....................................................................................... 67
3.4.1 Pellet Durability Index ................................................................................ 67
3.4.2 Bulk Density ............................................................................................... 68
3.4.3 Water Absorption Index .............................................................................. 69
3.4.4 Water Solubility Index ................................................................................ 69
3.4.5 Expansion Ratio .......................................................................................... 71
3.5 Conclusions ........................................................................................................ 71
CHAPTER 4 Effect of Feed Moisture, Extrusion Temperature and Screw Speed on
Properties of Soy White Flakes Based Aquafeed: A Response Surface Analysis ............ 88
4.1 Abstract .............................................................................................................. 88
4.2 Introduction ........................................................................................................ 89
4.3 Materials and Methods ....................................................................................... 91
4.3.1 Feed Blends Formulation ............................................................................ 91
4.3.2 Extrusion Processing ................................................................................... 92
4.3.3 Experimental Design and Statistical Analysis ............................................ 93
4.3.4 Measurement of Physical Properties ........................................................... 94

viii
4.4 Results and Discussion ....................................................................................... 96
4.4.1 Pellet durability index ................................................................................. 96
4.4.2 Bulk density ................................................................................................ 96
4.4.3 Water absorption index and water solubility index .................................... 97
4.4.4 Mass flow rate ............................................................................................. 98
4.4.5 Optimization and validation ........................................................................ 99
4.5 Conclusions ...................................................................................................... 100
CHAPTER 5 Modeling and Optimizing the Effect of Extrusion Processing Parameters
on Nutritional Properties of Soy White Flakes Based Aquafeed Using Response Surface
Methodology…. .............................................................................................................. 116
5.1 Abstract ............................................................................................................ 116
5.2 Introduction ...................................................................................................... 117
5.3 Materials and Methods ..................................................................................... 120
5.3.1 Feed Blends Formulation .......................................................................... 120
5.3.2 Extrusion Processing ................................................................................. 121
5.3.3 Experimental Design and Statistical Analysis .......................................... 122
5.3.4 Measurement of Nutritional Properties ..................................................... 123
5.4 Results and Discussion ..................................................................................... 126
5.4.1 Nutrient Content........................................................................................ 126
5.4.2 Lysine Content .......................................................................................... 127

ix
5.4.3 Trypsin Inhibitor Activity ......................................................................... 128
5.4.4 Optimization and validation ...................................................................... 129
5.5 Conclusions ...................................................................................................... 129
CHAPTER 6 A Viscosity Model for Soy White Flakes Based Aquafeed Dough in a
Single Screw Extruder .................................................................................................... 146
6.1 Abstract ............................................................................................................ 146
6.2 Introduction ...................................................................................................... 146
6.3 Materials and Methods ..................................................................................... 148
6.3.1 Raw materials and feed formulation ......................................................... 148
6.3.2 Experimental design.................................................................................. 149
6.3.3 Extrusion ................................................................................................... 149
6.3.4 Viscosity Measurement ............................................................................. 150
6.3.5 Statistical Analysis .................................................................................... 152
6.4 Results and Discussion ..................................................................................... 152
6.4.1 Viscosity Model ........................................................................................ 152
6.4.2 Effect of Temperature Profile ................................................................... 153
6.4.3 Effect of Screw speed ............................................................................... 154
6.4.4 Effect of SWF Level ................................................................................. 154
6.5 Conclusions ...................................................................................................... 155

x
CHAPTER 7 Rheological Characterization and CFD Simulation of Soy White Flakes
Based Dough in a Single Screw Extruder ....................................................................... 167
7.1 Abstract ............................................................................................................ 167
7.2 Introduction ...................................................................................................... 168
7.3 Materials and Methods ..................................................................................... 170
7.3.1 Materials and dough formulation .............................................................. 170
7.3.2 Extrusion Processing ................................................................................. 171
7.3.3 Rheological Measurements ....................................................................... 172
7.3.4 CFD Simulations ....................................................................................... 174
7.4 Results and Discussion ..................................................................................... 176
7.4.1 Viscosity Model ........................................................................................ 176
7.4.2 Experimental validation ............................................................................ 177
7.4.3 Flow profile ............................................................................................... 177
7.5 Conclusions ...................................................................................................... 178
CHAPTER 8 Conclusions ........................................................................................... 192
CHAPTER 9 Recommendations for Future Work ...................................................... 195
REFERENCES ............................................................................................................... 197

xi
ABBREVIATIONS
a* - Redness/Greenness
ANFs - Anti-nutritional factors
ANOVA - Analysis of variance
b* - Yellowness/Blueness
BD - Bulk density
CCRD - Central composite rotatable design
C-DDGS - Conventional distiller's dried grain with solubles
CDS - Condensed distiller's solubles
CF - Crude fat
CFb - Crude fiber
CFD - Computational fluid dynamics
CGM - Corn gluten meal
CP - Crude Protein
D - Diameter of die nozzle
db - dry basis
DDG - Distiller's dried grain
DDGS - Distiller's dried grain with solubles
DDS - Distiller's dried solubles
df - degree of freedom
DM - Dry matter
EAA - Essential amino acids
EAAI - Essential amino acid index

xii
ER - Expansion ratio
FEM - Finite element meshing
FM - Fish meal
GLM - General linear model
HP-DDG - High protein distiller's dried grains
K - Consistency factor
L - Length of die nozzle
L* - Brightness/Darkness
LSD - Least significant difference
Lys - Lysine
MC - Moisture content
MFR - Mass flow rate
MS - Mean square
n - Flow behavior ondex
NFE - Nitrogen free extract
NSP - Non starch polysaccharides
PDI - Pellet durability index
Q - Volumetric flow rate
R2 - Coefficient of determination
rpm - Revolution per minute
RSM - Response surface methodology
SBM - Soybean meal
SME - Specific mechanical energy

xiii
SPC - Soy protein concentrate
SPI - Soy protein isolate
SWF - Soy white flakes
T - Barrel temperature
TIA - Trypsin inhibitor activity
UD - Unit density
WAI - Water absorption index
wb - wet basis
WSI - Water solubility index
ΔP - Pressure drop
- Apparent viscosity
τ - Shear stress
- Shear rate
app - Apparent shear rate
t - True shear rate

xiv
LIST OF TABLES
Table 1.1 Dietary nutrient requirement for catla (Catla catla) (% dry feed except
otherwise mentioned). ...................................................................................... 35
Table 1.2 Essential amino acid requirements of various species (% protein) †
................ 36
Table 1.3 -3 and -6 fatty acid content in different lipid sources used for fish
feed formulation. † ............................................................................................ 37
Table 1.4 Recommended size of feed for catla (Catla catla) during different
physiological states. †
....................................................................................... 38
Table 1.5 Effect of grind size on processing of extruded feed. †
...................................... 39
Table 1.6 Anti- nutritional factors and their adverse effects in fish. †
.............................. 40
Table 1.7 Effects of processing variables on lysine retention. †
....................................... 41
Table 2.1 Ingredient composition of feed blends.............................................................. 54
Table 2.2 Main effects of SWF content, moisture content of raw material and
temperature profile (on extrudate physical properties). ................................... 55
Table 2.3 Interaction results for SWF content, moisture content of raw material
and barrel temperature on extrudate physical properties (p values). ............... 56
Table 3.1 Blend composition of feed. ............................................................................... 73
Table 3.2 Dimensions of die used in this study. ............................................................... 74
Table 3.3 Independent numerical and categorical variables and their levels. .................. 75
Table 3.4 Experimental design layout. ............................................................................. 76
Table 3.5 Analysis of Variance (ANOVA) for pellet durability index and bulk
density. ............................................................................................................. 77

xv
Table 3.6 Analysis of Variance (ANOVA) for water solubility index and
expansion ratio. ................................................................................................ 78
Table 3.7 Final equation in terms of coded factors after excluding the insignificant
terms for pellet durability index, bulk density, water solubility index
and expansion ratio. ......................................................................................... 79
Table 3.8 Best-fit response surface models for extrudate physical properties. ................ 80
Table 3.9 Treatment combination effects for soy white flakes, moisture content of
raw material, temperature and die on extrudate physical properties. ............... 81
Table 3.10 Treatment combination effects for soy white flakes, moisture content
of raw material, temperature and die on extrudate physical properties
(continued). ...................................................................................................... 82
Table 4.1 Ingredient composition of feed blends............................................................ 101
Table 4.2 Independent numerical and categorical variables and their levels. ................ 102
Table 4.3 Experimental design layout. ........................................................................... 103
Table 4.4 Analysis of Variance (ANOVA) for pellet durability index and bulk
density. ........................................................................................................... 104
Table 4.5 Analysis of Variance (ANOVA) for water absorption index, water
solubility index and mass flow rate. ............................................................... 105
Table 4.6 Final equation in terms of coded factors after excluding the insignificant
terms for pellet durability index, bulk density, water absorption index,
water solubility index and mass flow rate ...................................................... 106
Table 4.7 Best-Fit Response Surface Models for Extrudate Physical Properties. .......... 107

xvi
Table 4.8 Treatment combination effects for soy white flakes, moisture content of
raw material, temperature and screw speed on extrudate physical
properties. ....................................................................................................... 108
Table 4.9 Solutions for optimal conditions and validation. ............................................ 109
Table 5.1 Ingredient composition of blends ................................................................... 131
Table 5.2 Analyzed proximate composition, Lysine and TIA of feed blends ................ 132
Table 5.3 Independent numerical variables and their levels ........................................... 133
Table 5.4 Experimental design layout ............................................................................ 134
Table 5.5 Analysis of variance (ANOVA) for Crude Protein, Crude Fat ....................... 135
Table 5.6 Analysis of variance (ANOVA) for Crude Fiber and Ash ............................. 136
Table 5.7 Analysis of variance (ANOVA) for Lysine content and TIA ......................... 137
Table 5.8 Final equations in terms of coded factors after excluding the
insignificant terms for Lysine, TIA, crude protein, crude fat, crude fiber
and ash content ............................................................................................... 138
Table 5.9 Best-fit response surface models for extrudate nutritional properties ............ 139
Table 5.10 Solutions for optimal conditions and validation ........................................... 140
Table 6.1 Ingredient composition of feed blends............................................................ 156
Table 6.2 Proximate composition of the feed blends (% dry matter). ............................ 157
Table 6.3 Experimental levels of independent variables. ............................................... 158
Table 6.4 Coefficients for the viscosity equation. .......................................................... 159
Table 6.5 Interaction results for soy white flakes content (SWF), temperature (T)
and screw speed (SS) on process parameters (P values). ............................... 160
Table 7.1 Fit parameters used for the model in simulation............................................. 180

xvii
Table 7.2 Dimensions of screw and barrel represented in Figure 7.5. ............................ 181
Table 7.3 Comparison of experimental and computational torque (N-m)
experienced by the screw in the extruder for various process conditions. ..... 182

xviii
LIST OF FIGURES
Figure 2.1 Schematic representation of screw in a single screw extruder ........................ 57
Figure 2.2 Schematic representation of laboratory extruder (Brabender Plasti-
Corder, Model PL 2000) .................................................................................. 58
Figure 3.1 Schematic representation of screw in a single screw extruder ........................ 83
Figure 3.2 Response surface plots of pellet durability index for the effect of soy
white flakes content and temperature at 25 % db moisture content at
different die aspect ratio (L/D), (A) 3.33, (B) 5.83, and (C) 7.25 .................... 84
Figure 3.3 Response surface plots of bulk density for the effect of temperature and
moisture content at 40% db soy white flakes at different die aspect ratio
(L/D), (A) 3.33, (B) 5.83, and (C) 7.25 ............................................................ 85
Figure 3.4 Response surface plots of water solubility index at die aspect ratio
(L/D) of 7.25 for the effect of (A) temperature and soy white flakes
content, (B) temperature and moisture content and (C) moisture and soy
white flakes content.......................................................................................... 86
Figure 3.5 Response surface plots of expansion ratio for the effect of temperature
and moisture content at 40% db soy white flakes at different die aspect
ratio (L/D), (A) 3.33, (B) 5.83, and (C) 7.25. .................................................. 87
Figure 4.1 Schematic representation of a single screw extruder (Brabender Plasti-
Corder, Model PL 2000, South Hackensack, NJ). ......................................... 110
Figure 4.2 Response surface plots of pellet durability index for the effect of (A)
soy white flakes content and temperature at 25% moisture content and

xix
150 rpm, and (B) temperature and screw speed at 35% soy white flakes
content and 25% moisture content. ................................................................ 111
Figure 4.3 Response surface plots of bulk density for the effect of moisture
content and temperature at 35% soy white flakes content and 150 rpm. ....... 112
Figure 4.4 Response surface plots of water absorption index for the effect of (A)
soy white flakes content and moisture content at 125oC temperature and
150 rpm screw speed, and (B) moisture content and screw speed at 35%
level of soy white flakes and 125oC temperature. .......................................... 113
Figure 4.5 Response surface plots of water solubility index for the interaction
effect of soy white flakes content and moisture content at 125oC
temperature and 150 rpm screw speed. .......................................................... 114
Figure 4.6 Response surface plots of mass flow rate for the interaction effect of
temperature and screw speed at 35% soy white flakes content and 25%
moisture content. ............................................................................................ 115
Figure 5.1 Response surface plot of crude protein content in extrudates for the
interaction effect of soy white flakes content and temperature at 25%
moisture content and 150 rpm screw speed. .................................................. 141
Figure 5.2 Response surface plots of crude fiber content in extrudates for the
effect of (a) soy white flakes content and screw speed at 25% moisture
content and 125°C, and (b) temperature and screw speed at 35% soy
white flakes content and 25% moisture content. ............................................ 142

xx
Figure 5.3 Response surface plot of ash content in extrudates for the interaction
effect of moisture content and soy white flakes content 125°C
temperature and 150 rpm screw speed. .......................................................... 143
Figure 5.4 Response surface plots of lysine content in extrudates for the effect of
(a) temperature and soy white flakes content at 25% moisture content
and 150 rpm and (b) moisture content and soy white flakes content at
125°C and 150 rpm. ....................................................................................... 144
Figure 5.5 Response surface plot of trypsin inhibitor activity for the interaction
effect of temperature and soy white flakes content at 25% moisture
content and 150 rpm screw speed. ................................................................. 145
Figure 6.1 (a) Round capillary die and (b) Capillary nozzles having different L/D
ratio ................................................................................................................ 161
Figure 6.2 (a) Schematic representation of an extruder/die configuration and
position of temperature /pressure transducers (b) cross sectional view of
a round capillary die and (c) capillary nozzle ................................................ 162
Figure 6.3 Response surface plot of viscosity for the effect of screw speed and
temperature at 40% soy white flakes ............................................................. 163
Figure 6.4 Response surface plots of specific mechanical energy for the effect of
(A) Screw speed and soy white flakes at 120 oC, (B) Screw speed and
temperature at 40% soy white flakes ............................................................. 164
Figure 6.5 Response surface plot of torque for the effect of temperature and soy
white flakes at 120 rpm .................................................................................. 165

xxi
Figure 6.6 Response surface plot of mass flow rate for the effect of screw speed
and temperature at 40% soy white flakes ....................................................... 166
Figure 7.1 (a) Round capillary die (b) Capillary nozzles having different L/D ratio ..... 183
Figure 7.2 (a) Schematic representation of an extruder/die configuration and
position of temperature/pressure transducers (b) X- sectional view of a
round capillary die and (c) Capillary nozzle .................................................. 184
Figure 7.3 Schematic draw of the extruder and location of the modeled area ................ 185
Figure 7.4 Domain discretization and mesh superposition ............................................. 186
Figure 7.5 Geometrical dimensions of the screws and the barrel. (a) Top view, (b)
Front view ...................................................................................................... 187
Figure 7.6 Viscosity curves of the dough fitted to power law model. Experimental
data and fitted curves (FC) are represented as symbols and lines
respectively .................................................................................................... 188
Figure 7.7 Viscosity curves of the dough fitted to power law model. Experimental
data and fitted curves (FC) are represented as symbols and lines
respectively .................................................................................................... 189
Figure 7.8 XY and XZ plane distribution of the shear rate for different process
conditions. Grey zones represent the location of screws. Images were
taken at time step 40. ...................................................................................... 190
Figure 7.9 XY and XZ plane distribution of the viscosity for different process
conditions. Grey zones represent the location of screws. Images were
taken at time step 40. ...................................................................................... 191

xxii
ABSTRACT
UNDERSTANDING THE EFFECT OF EXTRUSION PROCESSING
PARAMETERS ON PHYSICAL, NUTRITIONAL AND RHEOLOGICAL
PROPERTIES OF SOY WHITE FLAKES BASED AQUAFEED IN A SINGLE
SCREW EXTRUDER
SUSHIL KUMAR SINGH
2016
The rapid expansion of aquaculture has increased the demand for aquafeed. As
fishmeal is expensive, alternative plant based protein sources such as soybean has shown
to be a good alternative for aquafeed production. The present study was done to
investigate the effect of soy white flakes (SWF) as an alternative source of protein in the
production of aquaculture feed through extrusion processing. Ingredient blends
containing different levels of SWF along with distiller dried grains, corn flour, corn
gluten meal, fish meal, vitamin and mineral mix with net protein adjusted to 32% protein
were formulated. The ingredient blends were extruded in single screw extruders and the
properties of extrudates were studied. The experiments conducted includes: 1) effect of
changing the level of SWF (10, 20 and 30%) along with other ingredients, moisture
content (15, 25 and 35%db) and barrel temperature (110, 135 and 170oC) on properties of
extrudates such as color, pellet durability, bulk density, water absorption and solubility
indices, unit density and expansion ratio; 2) effect of changing levels of L/D ratio of die
nozzle (3.33, 5.83 and 7.25), SWF (21, 29, 40, 52 and 59%) along with other ingredients,

xxiii
moisture content (15, 19, 25, 31 and 35%db) and barrel temperature (100, 110, 125, 140
and 150oC) on properties of extrudates such as pellet durability, bulk density, water
absorption and solubility indices and expansion ratio; 3) effect of changing levels of
screw speed (100, 150 and 200 rpm), SWF (20, 35 and 50%) along with other
ingredients, moisture content (20, 25 and 30%) and barrel temperature (110, 125, 140oC)
on properties of extrudates such as pellet durability index, bulk density, water absorption
and solubility indices and mass flow rate; 4) effect of changing levels of SWF along with
other ingredients, moisture content, barrel temperature and screw speed on nutritional
properties of extrudates such as protein content, fat, fiber, ash content, lysine content and
trypsin inhibitor activity and also to optimize the processing conditions to maximize the
nutritional quality; 5) development of a viscosity model incorporating a correction factor
for SWF along with correction factor for temperature and the effect of extrusion
processing parameters on mass flow rate, torque, specific mechanical energy and
viscosity of dough and 6) rheological characterization and CFD simulation of SWF based
dough.
In the initial study, increasing the level of SWF from 10 to 30% resulted in
increase in water absorption index and unit density but decrease in expansion ratio. The
interaction effect of SWF content, moisture content and temperature were significant for
color, pellet durability index, bulk density and expansion ratio. All the extrudates showed
relatively high pellet durability and inclusion of SWF produced less expanded and more
compact textured extrudates.
In the experiment to determine the effect of die dimensions, response surface
methodology was used to find the effect of screw speed, SWF level, moisture content and

xxiv
barrel temperature on the physical properties of extrudates. Quadratic polynomial
regression equations were developed to correlate the product responses and process
variables as well as to obtain the response surfaces plots. The independent variables had
significant (P< 0.05) effects on physical properties of extrudates: (i) higher soy white
flakes content increased the pellet durability index and water absorption index, but
decreased the water solubility index, (ii) higher temperature decreased pellet durability
index, bulk density and water solubility index, (iii) increase in L/D ratio from 3.33 to
7.25 increased the pellet durability index, expansion ratio but decreased the bulk density
of the extrudates.
In the experiments with different screw speed level (100 to 200 rpm) and SWF
levels (20 to 50%), it was observed that increasing screw speed resulted in increase in
pellet durability and mass flow rate but decrease in water absorption index of the
extrudates. The results of the experiments shows that aquaculture feed with high
durability, lower bulk density and lower water absorption and higher solubility indices
can be produced with ingredients mix containing 40% SWF net protein content adjusted
to 32% using single screw extruder.
In the experiment to determine the effect SWF content, moisture content, barrel
temperature and screw speed on the nutritional properties of the extrudates, response
surface methodology was used. Response surface regression models were established to
correlate the nutritional properties of extrudates to the process variables. SWF was the
most significant variable with quadratic effects on most of the nutritional properties. As
level of SWF content was increased from 20 to 50%, there was an increase in lysine
content, TIA, protein content, ash content and decrease in fat and fiber content.

xxv
Increasing temperature resulted in decrease in lysine content and trypsin inhibitor activity
of extrudates.
It was also observed that increase in the soy white flakes content resulted in a
higher mass flow rate, torque and specific mechanical energy and a decrease in the
apparent viscosity. The specific mechanical energy, mass flow rate increased and
viscosity decreased with increase in screw speed. Higher barrel and die temperature led to
decrease in the apparent viscosity of the dough, torque and specific mechanical energy.
The flow of SWF based dough in a single screw extruder was simulated by using
computational fluid dynamics (CFD). Process conditions considered were screw speeds
(40, 80, 120, 160, 200 rpm), barrel temperature (100, 120, 140oC) and SWF contents (30,
40, 50%db). Simulation results were validated quantitatively by experimental data. The
results showed good agreement between experimental and computational results.
Moreover, the flow profiles in the extruder were analyzed by using the influence of screw
speed and level of soy white flakes content. Qualitative behavior of local shear rate and
viscosity along the screw were analyzed and comparisons of different process conditions
have been presented.

1
CHAPTER 1
Introduction and Background
1.1 Introduction
Aquaculture is one of the fastest growing animal food industries. Global fish
production has grown steadily in the last five decades with food fish supply increasing at
an average annual rate of 3.2%, outpacing world population growth at 1.6%. World per
capita apparent fish consumption increased from an average of 9.9 kg in the 1960s to
19.2 kg in 2012 (FAO, 2014).
The expansion of aquaculture production has also increased the demand for
aquafeed supply. Considering the techno-economic feasibility of aquaculture production,
feed cost is a primary concern (Pritchard, 1976). The protein component of aquaculture
diets is the single most important and expensive dietary nutrient which comes largely
from ground, ocean-caught fishmeal due to its easy availability and ideal nutritional value
and biological qualities (Aquaculture Development and Coordination Programme, 1983;
Bautista et al., 1994). As the demand for quality fish protein increases, the available wild
resources of fish meal for aquafeed production would be limited. The rapid expansion of
global demand for aquaculture products, coupled with the depletion of wild fish stocks
has elevated the cost of fishmeal, and consequently, diet prices (Amaya et al., 2007; Lim
and Lee, 2009). Production of a quality aquafeed is greatly related to the feed ingredients’
functionality, biological qualities, pretreatment of the ingredient, and the technological
treatment which is applied to make feed.
Recent researches have focused on the use of alternative protein sources for
aquafeed (Hardy, 2010; Hardy and Masumoto, 1990; Rumsey et al., 1993). The ultimate

2
goal is to eliminate the fish meal inclusion in aqua diets by substituting appropriate
alternative protein sources. Plant-derived protein source appeared to be attractive
alternatives due to its sustainability, availability and relatively low cost. However, the
major challenges faced by aquaculture industry in replacing fish meal with plant-based
protein are poor functionality during the production, presence of some anti-nutritional
factors and lack of essential nutrients.
Many research works on feeding trials using aquafeed with partial replacement of
fishmeal with different animal by-product and plant feedstuff have shown optimum
growth results for various species. An ideal alternative ingredient for fishmeal should
have low starch and fibre content, absence of anti-nutritional factors and high protein
content with balanced amino acid profile, high nutrient digestibility and good palatability.
Plant feedstuffs include coproduct of oilseed processing such as soybean meal, corn
gluten meal etc. and coproduct of ethanol production such as distillers dried grains with
solubles. United States of America is the major producer of soybean comprising 35% of
the total production. Soybean production covers 6% of the world’s arable land. The
global soybean production is projected at 320.5 million tons (USDA, 2016). Soybean
meal, a co product of soybean oil production is easily available and can be used as a
replacement of fishmeal in aquafeed (Amaya et al., 2006; Fallahi et al., 2012; Kaushik et
al., 1995; Webster et al., 1992). The nutritional profile of soybean is close to that of fish
meal. The limitation of using soybean is high fiber content and anti-nutritional factors
present in soybean meal. Soy protein isolate and soy protein concentrate do not have anti-
nutrients but are expensive. Further the presence of phytates decrease the digestibility of
this product. However phytase enzyme can be used to degrade phytates. Attempts have
3
been made such as heat treatment to reduce the anti-nutritional factors of conventional
soybean products and to improve soy utilization in feed industry.
As mentioned above, the other important factor in the production of a quality
aquafeed is the technology of feed manufacturing. Extrusion is commonly used
processing method in food and feed industries. It is a unit operation involving cooking,
forming, mixing and shaping. Its performance is influenced by several variables. The
interaction of high shear and temperature developing inside the extruder with water of the
ingredients drastically affects the molecular structure of the material, mainly due to
gelatinization of starch and denaturation of protein components of the feed blend, which
influences the resulting physiochemical and nutritional properties of the extrudates (Guy,
2001). The main advantages of extrusion processing are: energy efficiency, continuous
high throughput, improved textural and flavor characteristics and expanded products
form. Extruded aquafeed are designed to float or sink based on the fish species
requirement. The advantages of using extruded aquafeed over pelleted ones are presence
of less fines, better durability and floatability.
Soy based aquafeed have shown good results on feeding trial of different fish
species. Dersjant-Li (2002) reported that soy protein isolate can be used to replace 40-
100% fish meal without negative impact on growth performance of shrimp. While
research has been done on feeding trials with soy based diets, there is still more to work
on extrusion processing effects of soy based diets for aqua feed production. The effect of
soy co-products like white flakes in feed composition on the extrudate properties needs to
be investigated.

4
1.2 Objectives
The main objective of this study was to maximize the amount of soy white flakes
that could be incorporated in the production of aquaculture feed through extrusion
technology and to understand the significant impacts of extrusion processing on physical
and nutritional properties of SWF based aquafeed.
The specific objectives of this study were:
1. To study the effect of changing the levels moisture content, temperature profile in the
barrel and SWF content in an ingredient blend containing 31.5% protein on the
properties of extrudates such as color, pellet durability index, bulk density, water
absorption index, water solubility index, unit density and expansion ratio in a single
screw extruder.
2. To study the effect of level moisture content, die dimensions and temperature profile
in the barrel and SWF content in an ingredient blend containing 32.5% protein on the
extrudate properties such as pellet durability index, bulk density, water absorption
and solubility indices and expansion ratio in a single screw extruder.
3. To study the effect of changing the levels moisture content, temperature, screw speed
and SWF content in an ingredient blend containing 32.3% protein on the extrudate
properties such as pellet durability, bulk density, water absorption index, water
solubility index, mass flow rates of extrudates and to optimize the processing
conditions in a single screw extruder.
4. To study the effect of level of moisture content, screw speed, temperature profile in
the barrel and SWF content on extrudate nutritional properties such as nutrient

5
content, lysine content and trypsin inhibitor activity during extrusion processing in a
single screw extruder.
5. To develop a viscosity model by incorporating SWF and temperature as independent
factors in a single screw extruder.
6. To characterize the rheological properties of soy white flakes based dough in a single
screw extruder online by capillary die rheometer and to simulate the rheological
complex fluid flow inside the extruder.
This dissertation is based on the following manuscripts of the research papers:
Chapter 2: Singh, S.K. and Muthukumarappan, K., 2015. Single screw extrusion
processing of soy white flakes based Catla feed. Journal of Food Research,
4(1), p.1. DOI: 10.5539/jfr.v4n1p1
Chapter 3: Singh, S.K. and Muthukumarappan, K., 2014. Effect of different extrusion
processing parameters on physical properties of soy white flakes and high
protein distillers dried grains-based extruded aquafeeds. Journal of Food
Research, 3(6), p.107. DOI: 10.5539/jfr.v3n6p107
Chapter 4: Singh, S.K. and Muthukumarappan, K., 2015. Effect of feed moisture,
extrusion temperature and screw speed on properties of soy white flakes based
aquafeed: a response surface analysis. Journal of the Science of Food and
Agriculture, 96(6), p. 2220-2229. DOI: 10.1002/jsfa.7339
Chapter 5: Singh, S.K. and Muthukumarappan, K., 2016. Modeling and optimizing the
effect of extrusion parameters on nutritional properties of soy white flakes-
based extrudates using response surface methodology. Journal of the Science
of Food and Agriculture. (Manuscript under preparation)

6
Chapter 6: Singh, S.K. and Muthukumarappan, K., 2016. A viscosity model for soy white
flakes based aquafeed dough in a single screw extruder. Journal of Food
Process Engineering. DOI: 10.1111/jfpe.12357
Chapter 7: Singh, S.K. and Muthukumarappan, K., 2016. Rheological characterization
and CFD simulation of soy white flakes based dough in a single screw
extruder. Journal of Food Process Engineering. DOI: 10.1111/jfpe.12368
1.3 Literature Review
1.3.1 Protein Sources in Fish Feed
Protein sources are categorised into animal origin and plant origin. Animal
proteins sources such as fishmeal (FM), meat bone-meal, blood meal (>60%) have higher
protein content than plant protein sources such as soybean meal (>42%). Animal proteins
are considered superior sources to plant proteins because of their balanced amino acid
profile (Li et al., 2004).
The main protein sources used in aqua feed production was primarily fishmeal.
With the rising prices of fishmeal, aquaculture industry is now focusing on plant proteins
as inexpensive source of proteins to minimise production cost.
1.3.1.1 Alternative Plant Based Protein Sources
1.3.1.1.1 Soy White Flakes
The majority of soy product produced comes in the intermediate form of defatted
soy white flakes (SWF). SWF are produced by cleaning, heating and cracking soybeans,
removing the hulls by aspiration; flaking the chips to about 0.25-0.30 mm thickness and
extracting the oil by hexane to 0.5-1.0% oil. While the oil is removed by extraction, the
carotenes are removed as well and the extracted residue gets a typical white color, hence

7
the name white flakes. SWF can then be ground to make soy flour, toasted to make
soybean meal (SBM), or further processed to produce soy protein concentrate (SPC) or
soy protein isolate (SPI). Defatted soy flour usually contains a minimum of 50% protein
on a wet basis (Lusas and Riaz, 1995). SWF can have extremely high protein
dispersibility index value of 95, but can also be produced with protein dispersibility index
values of 20, 70, or 90, depending on the thermal exposure (Lusas and Riaz, 1995).
Therefore, adequate thermal treatments of SWF are recommended for use in carnivorous
fish feeds to reduce protein dispersibility index and anti-nutritional factors.
There is little information about the use of white flakes in aquafeed. Romarheim
et al. (2006) studied the effect of extrusion on nutritional value of soybean meal and
white flakes to replace fishmeal in the extruded diets of rainbow trout. It was reported
that the trypsin inhibitor activity levels in the SBM and SWF diets were reduced to 0.6
and 2.1mg (g/dry matter) after extrusion. Feed intake and feed conversion ratio of trout
was lower for SBM and SWF diets than FM diet. Apparent digestibility of nitrogen was
highest for FM followed by SBM and lastly SWF diets.
1.3.1.1.2 Distiller’s Grain (HP-DDG and DDGS)
Distillers grains is the co-product of ethanol industries. Distillers dried grains and
distillers dried grains with solubles are rich in nutrient content compared to whole corn.
During ethanol making process the residue remaining after distillation is separated into
ethanol and stillage. The stillage contains a solid portion known as distillers grains and
soluble portion known as solubles. The soluble portion also contains a lot of nutrient.
Hence usually in ethanol plant, the soluble fraction is mixed with solid portion and dried.
The dried product is sold as distillers dried grains with solubles (DDGS).

8
During the dry-milling process, three types of co-products including distillers
dried grains (DDG), distillers dried solubles (DDS), and distillers dried grains with
solubles (DDGS) are produced after the starch fermentation and distillation of fermented
mash. The soluble portion of the residual co-product is evaporated and condensed
distillers solubles (CDS) are produced. The solid portion of the remaining fermentation
residue and condensed distillers solubles are both subjected to drying and produce either
distillers dried grains (DDG) or distillers dried solubles (DDS) (Singh et al., 2005). When
these two co-products mixed and dried, distillers dried grains with solubles (DDGS) is
produced.
Recently bio-refinery plants have employed a new technique to increase the
ethanol production yield. In the new dry-milling process, whole corn is fractionated into
several fractions including germ, bran, and endosperm. Germ fraction contains high fat
and phosphorous concentrations in addition to a better essential amino acids profile.
Endosperm fraction is subjected to fermentation and ethanol recovery. Indeed, pre-
removal of the non-fermentable fraction of corn is the main reason for the ethanol yield
increase (Singh et al., 2005). The co-product of this process is DDG, which is high in
protein but low in fat. Typically, conventional DDGS (C-DDGS) contains approximately
30% protein (Rosentrater and Muthukumarappan, 2006; Spiehs et al., 2002). The protein
content of DDG is almost 1.5 times that of C-DDGS; hence, it is called HP-DDG
(Robinson et al., 2008). Moreover, using HP-DDG provides higher available
phosphorous content thus reducing the need for phosphorous supplementation. Robinson
et al. (2008) believed that HP-DDG nutritional values are much more consistent than
those of C-DDGS.

9
1.3.1.1.3 Corn Gluten Meal
Corn gluten meal (CGM) is a co-product of wet milling of corn, in the process of
producing corn syrup. Corn gluten meal is the dried residue from corn after the larger
part of the starch and germ have been removed and the bran separated by the process
employed in the wet milling manufacture of corn starch or syrup, or by enzymatic
treatment of the endosperm (Raven and Walker, 1980).
Corn gluten is an excellent protein source for aquafeed with at least 60% protein
(Morales et al., 1994) which is 97% digestible by trout (Sugiura et al., 1998). Corn gluten
meal can replace 25–40 % of fish meal without adverse impact on growth performance of
trout (Hardy, 2000; Morales et al., 1994). In general, CGM can be added up to 10% in
trout diets. At higher level, it tends to impart yellow color to fish flesh. However, CGM
can be added up to 22.5% in salmon and trout commercial diets by adding canthaxanthin
or astaxanthin which masks the yellow color in fillets and gives natural pink color
(Skonberg et al., 1998).
Pereira and Oliva-Teles (2003) reported that CGM can replace up to 60% fish
meal protein in diets for gilthead sea bream juveniles without any adverse effect on
growth performance. It is reported that CGM can replace up to 40% of fishmeal in the
diet of juvenile Japanese flounder (Kikuchi, 1999). Robinson et al. (2001) reported that
up to 50% CGM can be efficiently utilized by channel catfish, Ictalurus punctatus,
without adverse effect on feed palatability, weight gain, or feed efficiency. Wu et al.
(1995) evaluated the use of corn gluten meal as protein source in tilapia diet and found
that the diets having CGM (and soybean, with or without fishmeal and lecithin) with 32%

10
protein showed better weight gain, higher protein efficiency ratio and better or equal feed
conversion ratios than a commercial feed containing 36% protein with fishmeal.
1.3.2 Fish Feed Formulation
The average protein component in the fish body is 65-75% and is the basic
building nutrient in the fish feed. The dietary protein requirement of fish is much more
than the terrestrial animals. Dietary protein content balancing is the primary importance
in the fish feed formulation. The cost of protein sources accounts more than half of the
feed ingredient cost.
The best quality of fish feed producing maximum growth in fish depends on
1. Quantitative protein content
2. Qualitative protein content
3. Total energy content and digestible energy content
4. Level of intake, feeding method & physiological state of fish
1.3.2.1 Quantitative Protein Requirement
In fish feed formulation two important factors to be considered are percentage of
protein in the ingredient and protein cost. In fish cultivation, as the protein content
increases, the growth rate also increases and reaches a maximum beyond which no
further increase in growth rate was observed. Hence an optimum level of dietary protein
is determined by the relationship between cost of the feed ingredient, nature of farming
operations, capital investment and fish market trends. The optimum level of protein
requirement depending on the physiological state of catla fish is given in the Table 1.1.

11
1.3.2.2 Qualitative Protein Requirement
The qualitative protein requirement is determined by the ratio of the essential
amino acid required by the fish, to the quantity of essential amino acid present in the feed
ingredients. The amino acid requirement of different fish species is given in the Table
1.2. The qualitative requirement of any fish feed is represented by the Essential Amino
Acid Index (EAAI) and is calculated using the equation:
100 100 100 100
.............n
e e e e
a b c jEAAI
ja b c (1.1)
where a …. j are the percentage of EAA in the diet
ae ….je are the percentage of the EAA required
n is the number of terms in the expression
If any of the terms of the form 100a/ae is greater than 100, it is reduced to 100 for the
calculation of EAAI (Jauncey and Ross, 1982).
1.3.2.3 Total and Digestible Energy Content
The total energy content of any fish feed is determined based on the fraction of
protein, lipid and carbohydrate contributing to the dietary energy. The total energy
content is calculated based on the energy content of fractions namely, 4.5 kcal/g for
protein, 9.1 kcal/g for lipid and 4.1 kcal/g for carbohydrate. The digestible energy content
is calculated based on the ratio of the percentage of the different factions really available
to the fish for digestion in the digestive system.
1.3.2.3.1 Protein Energy
Protein is the most expensive source of energy in the fish feed. Hence alternative
economical dietary protein is to be identified for minimizing the feed cost. DDGS is an
important ingredient considered for minimizing the feed cost based on its availability and

12
future scope. The relationship between the protein and energy levels of the feed is
expressed as Protein to Energy ratio (P: E) and usually expressed in mg of protein per
kcal of energy.
1.3.2.3.2 Lipid Energy
The lipid in the fish feed has two principal functions as an energy source and as a
source of essential fatty acid. Fish cannot synthesize ω-3 and ω-6 fatty acids required for
growth and have to be supplemented in the feed. The ω-3 and ω-6 fatty acid content of
some commonly used oil used in the fish feed are given in the Table 1.3.
1.3.2.3.3 Carbohydrate Energy
The carbohydrate content of feedstuff can be divided into digestible carbohydrates
and fiber. Fiber is composed of complex polysaccharides and in the case of plant material
mainly cellulose. Fish do not have digestible enzyme cellulase and thus cannot utilize
cellulose. Hence for fish feed purpose, dietary fiber is considered to be unavailable to fish
as an energy source.
1.3.2.4 Level of Intake, Feeding Method and Physiological State
Depending on the feeding method the fish feeding can be divided into three
namely, programmed feeding, ad libitum feeding and demand feeding. Generally protein
requirement of fries are much higher than the grownup fish. Hence protein content and
size of pellets in a feed material is decided based on the physiological state of fish. For
example, for catla (Catla catla), depending on the physiological state, the commercially
available feeds are manufactured as per Table 1.4.

13
1.3.3 Soy White Flakes as a Base Material for Fish Feed
Soybean products have been of particular interest as a FM replacer due to the
dense nutritional content; however, indigestible, deficient, and anti-nutritional factors
(ANF) components limit the bioavailability of nutrients in soy and other plant products
(Francis et al., 2001; Sinha et al., 2011; Tacon and Jackson, 1985).
Defatted soybean meal (SBM) is one of the most commonly used alternatives to
FM, due to a well-balanced amino acid profile, moderately high protein content,
consistent quality, relatively low cost, and high domestic availability (Sales, 2009).
Compared to FM, SBM has lower methionine, which is considered to be the first limiting
amino acid for fish (Storebakken et al., 2000), while lysine and threonine are also known
to be limiting amino acids in SBM (Gatlin et al., 2007). SBM and other processed
(mechanical, chemical, and/or microbiological) soy products have been used to replace
FM in aquaculture feeds for several species with varying degrees of success (Brown,
2008; Kaushik et al., 1995; Refstie et al., 1997). Experiments which utilized carnivorous
species have revealed limited inclusion levels of dietary SBM (Baeverfjord and
Krogdahl, 1996; Olli et al., 1994b) SPC and SPI with reduced anti-nutritional factors
(such as trypsin inhibitors and phytic acid) and bioavailable protein have been successful,
but high processing costs limits their use as complete FM replacements (Gatlin et al.,
2007). Soy bioprocessing technologies are being optimized to increase protein content,
reduce indigestible components (e.g., oligosaccharides), reduce ANF’s, or improve
digestibility (Refstie et al., 2005).

14
1.3.4 Extrusion Technology
Extruder is a high temperature short time bioreactor that transforms a variety of
raw materials into modified intermediate and finished products. It combines several unit
operations including mixing, cooking, kneading, shearing, shaping and forming (Riaz,
2000, 2007). The advantages of the extrusion cooking are 1) continuous high throughput
processing, 2) energy efficient, 3) processing of relatively dry viscous material, 4)
improves textural and flavor characteristics of food, 5) control of the thermal changes of
food constituents, 6) use of unconventional ingredients and 7) process scale-up.
The extruders used in the food and feed industries can be widely divided into two
namely single screw extruder and twin screw extruder.
1.3.4.1 Single Screw Extruder
The main advantage of single screw extruder over twin screw extruder is, they are
mechanically very simple and therefore costs 1/4th
to ½ of price of similar sized twin
screw extruder. Due to this advantage single screw extruders are used wherever possible
in the industry. Single screw extruder relies on drag flow for conveyance. Hence the mass
must stick to the wall for proper movement inside the barrel. In general higher the friction
forces more efficient is the extruder. An important difficulty faced while using the single
screw extruder is its poor mixing.
The movement and transformation of material in the extruder can be divided into
three sections: feeding, kneading or transition and final cooking zones. The feeding zone
receives preconditioned material and is conveyed to processing zone where free-flowing
amorphous material is worked into dough. The compression ratio is increased to assist in
blending in kneading zone. In the cooking zone, the thermal and mechanical energy input

15
plasticises the material above its melting point. The final screw element reduces the
volumetric displacement and adds compression (Riaz, 2000).
1.3.4.2 Twin Screw Extruder
Based on the direction of rotation the twin screw extruder is divided into counter
rotating and co-rotating extruder. Based on the screw configuration and degree of
intermeshing, twin screw extruder can be divided into fully intermeshing, partially
intermeshing and non-intermeshing extruder (Janssen, 1989; Riaz, 2007).
The main advantage of twin screw extruder over single screw extruder is its
transport mechanism. In a twin screw extruder the material is positively transported by
the ‘C’ shaped channels formed in the screw. This allows the twin screw extruder to use
wide variety of raw materials to obtain wide variations in product properties.
1.3.5 Aquafeed Technology
One of the oldest technologies that have been used for aquafeed production is
pellet milling. Expanders are also being used for aquafeed production. Extruder
technology has been used in aquafeed production for half a century. It has been suggested
that extrusion offers better flexibility in operation than pelletizing technology (Martín,
1999). The advantages of extrusion processing over the pelletizing and expanders are: 1)
controlling the physical properties of the aquafeed such as buoyancy and density of the
feed, water stability, density and porosity, 2) increased bulk density, 3) increased nutrient
density, 4) increased nutrient palatability, 5) inactivation of microorganisms, 6)
enhancing the ingredient digestibility, 7) inactivating anti-nutritional factors and 8)
versatility in production of high protein and fat contents diets.

16
Quality of the food and feed products are related to both physical and nutritional
characteristics of the product. In general extrusion processing involves in several
independent variables (such as temperature, moisture content, blend composition, screw
speed, die size and configuration, screw configuration, etc.) and dependent variables
(such as specific mechanical energy, residence time, torque, pressure, etc.), and thus
interaction effects of these variables induce chemical and physical changes to the
processing ingredients and thus transfers the state of the materials at both macroscopic
and microscopic scale. The complexity of the process indicates that there is a strong
interrelationship between the effect of extrusion processing on physical and nutritional
properties of the feed/food.
Various authors have studied the effect of extruder parameters like screw
configuration, screw speed, temperature of cooking and feed parameters like moisture
content, particle size distribution, starch content, protein content and fat content on the
extrudate quality.
1.3.6 Effect of Feed Parameters
1.3.6.1 Raw Materials Composition
The most used raw materials in the extrusion process are starch and protein-based
materials. The structure of the extruded products may be formed from starch or protein
polymer transformations during the process. The physicochemical changes in
biopolymers that can occur during extrusion cooking include: binding, cleavage, loss of
native conformation, fragmentation, re-association, and thermal degradation. Physical
losses may change the composition of the raw ingredients such as water evaporation

17
(Riaz, 2000). Most of the chemical reactions take place in the high-pressure zone of the
barrel and at the die.
1.3.6.1.1 Starch
The effect of starch quality on the extrudate quality was studied extensively. The
starch granule consists of two glucose polymers: amylose and amylopectin; both play
crucial roles in physicochemical and functional properties of the starch (Caldwell et al.,
2000). According to Colonna et al. (1989), during extrusion processing, amylopectin is
more prone to shear. According to Case et al. (1992), increased screw speed and barrel
temperature significantly influenced the degree of starch gelatinization. Mercier et al.
(1989a), suggested that the interaction effect of application of heat, shear and water
content on the starch granule can destroy the organized molecular structure, also resulting
in less integrity and molecular hydrolysis of the material. Starch gelatinization affects
many extrudate properties, such as water stability, digestibility, and expansion ratio.
However, the extent of starch gelatinization by itself depends on starch type, particle size,
and conditions of the extrusion process (Rokey and Plattner, 2003). The micro and macro
structures and physiochemical alterations of cooked, double extrusion cooked and
retrograded corn starch during a single-screw extrusion processing was studied by
Chinnaswamy et al. (1989).
The micro structural, physiochemical and macro molecular changes in extrusion
cooked and retrograded corn starch was studied by Chinnaswamy et al. (1989). The
experiments were conducted at a constant temperature of 140°C at die section and 80°C
at feed section in a laboratory single screw Brabender extruder. The water solubility,
shear strength, micro structure, x-ray difractograms were studied on a single extrusion

18
cooked, double extrusion cooked and retro graded starch. The expansion ratio dropped
from 12.9 to 4.6 and the gas cell size decreased considerably with retrograded starch
compared to other two starches. Water solubility decreased from 28.7% to 4.7% and the
shear strength increased from 0.64 to 5.24 MPa in retrograded starch compared to other
two starches.
The influence of process condition namely, screw speed, temperature at the
metering zone, and temperature at the die with the wheat flour components such as wheat
starch, vital gluten and wheat flour solubles on extrudate quality was studied by Paton
and Spratt (1984) in a single screw extruder. The interaction effects of the process
condition with wheat flour components were studied in relation to torque, extrudate
viscosity, water absorption index and water solubility index. They reported that the
integral structure of wheat flour particles imparts a greater resistance to water penetration
and cooking than when the individual components exists at random in a composite
formulation. The composite of all three components gave better performance than the
wheat flour alone.
Chinnaswamy and Hanna (1990) conducted experiments at different moisture
content (10-30%) and barrel temperature (110-200°C) with starchy material. They
studied functional properties of extrudates like radial expansion, shear strength, water
solubility of starch, apparent viscosity, macro molecular structure by differential scanning
calorimetry and gel permeation chromatography. They reported that maximum expansion
ratio of 16.4 was obtained with 50% natural amylase. Sodium bicarbonate degraded the
starch molecules to a greater extent compared to sodium chloride and urea. The
physicochemical properties like density, solid density, apparent solid density, expansion

19
ratio, open and closed pore volumes, water absorption index, and water solubility index
of commercially available starch based breakfast cereal was studied by Jones et al.
(2000). The density was measured by volume displacement method; solid density was
measured by helium comparison pycnometer. The expansion ratio was ranged from 1.0 to
17.3 units. The densities of the product ranged from 0.08 to 1.44 g/cm3. The water
solubility and water absorption index ranged from 6.3 to 86.4% and 2.5 to 6.3 g/g
respectively. The effect of feed rate, screw speed and barrel temperature on the starch
gelatinization in a twin screw extruder was studied by Ibanoglu et al. (1996) and they
concluded that barrel temperature had the most pronounced effect on the starch
gelatinization followed by feed rate and screw speed.
1.3.6.1.2 Protein
Proteins have a larger number of chemical groups when compared to
polysaccharides. This indicates that proteins are more reactive (Mitchel and Arêas, 1992)
and undergo many changes during the extrusion process, with the most important being
denaturation (Camire, 2000). Proteins in general are classified, with respect to their
solubility in water, saline solution, alcohol solution and acid or alkaline solutions,
respectively (Pereda et al., 2005).
Thomas et al. (1997) studied the effect of water and steam added in the
preconditioner on the protein quality through protein dispersibility index, nitrogen
solubility index and trypsin inhibitor activity (TIA) of the extruded product. The authors
used a preconditioner to increase temperature and mixing steam and water, so that the
protein quality was maintained after extruding in the extruder. They found that significant
interaction between the water and steam content on protein quality in all the experiments.

20
The screw speed has no significant effect on the protein quality parameters. In another
study conducted by Dahl and Villota (1991) on the effect of extrusion on texturization of
alcohol modified soy flour, less contribution of protein in expansion was reported.
1.3.6.1.3 Lipids
During extrusion processing, lipids exhibit lubrication effects and reduce the
friction between particles in the mix and between the screw and barrel surfaces and the
fluid melt (Guy, 2001). The effect of lipids and processing conditions on degree of starch
gelatinization of extruded pet food was studied by Lin et al. (1997) and found that high
lipid content of the extruding blend can adversely affect the starch gelatinization. The
adverse effect of high moisture content on expansion of the extrudates was also reported.
The same authors, Lin et al. (2000) studied the effect of lipids, processing conditions on
the sensory characteristics of extruded dry pet food and reported that high lipid content
results in lipid oxidation and lower the sensory quality of the extrudates during the
storage. Colonna et al. (1989) reported that reduction of moisture content can control the
expansion of materials containing high lipid content. Some other researchers believed
that the type of starch and lipid present in the raw material greatly influences the
formation of the amylose-lipid complex, with free fatty acids and mono-glycerides
(Camire, 2000; Mitchel and Arêas, 1992).
1.3.6.1.4 Fibers
Dietary fiber consists of fractions of vegetable cells, polysaccharides, lignin, and
associated substances, which are resistant to hydrolysis by enzymes present in the
digestive system of humans. It has been reported that, extrusion cooking of fibers can
produce changes in their structural characteristics and physicochemical properties of

21
fibers and converts the insoluble fibers into soluble fibers (Camire et al., 1990; Guillon et
al., 1992; Larrea et al., 2005).
According to Wang et al. (1993), production of soluble fiber is due to the rupture
of covalent and non-covalent bonds between carbohydrates and proteins associated to the
fiber. In turn it reduces the molecular size that would be more soluble (Fornal et al.,
1987; Wang et al., 1993). Many researchers reported that high dietary fiber content in
extruding materials reduces expansion index of the extrudates (Hsieh et al., 1989; Ilo and
Berghofer, 1999; Vernaza et al., 2009). One of the reasons of this reduction in expansion
index can be due to reduction of starch content as a result of high fiber content in the
extruding materials formula (Colonna et al., 1989). According to Camire et al. (1990),
fibers may bind water more strongly than proteins and starch during extrusion and thus
inhibits water loss at the die exit of the extruder, reducing expansion index.
1.3.6.2 Effect of Moisture Content
Extrusion at low moisture content tends to produce a dense unexpanded product.
As the feed moisture content increase, there will be more expansion due to cooking of
available starch and will produce lighter product. However, as the moisture level
increases to a high level, it reduces the viscosity of the material through the barrel and
makes it more difficult to expand the product (Plattner, 2007b).
Thiébaud et al. (1996) suggested that at a given temperature, higher moisture
contents resulted in less texturized extrudates. High moisture content can reduce the melt
viscosity and weaken the protein–protein interactions. They reported that protein could be
texturized at 140 to 180°C and relatively low moisture content.

22
Extrusion at low moisture content can affect the specific mechanical energy.
According to Guy (2001), moisture content of 15 to 30% increases mechanical energy
and results extrudates with lower density, whereas increased moisture from 50 to 70%
results in products with higher density.
Shukla et al. (2005) reported that when DDGS based feed was extruded in single
screw extruder, the product showed maximum water absorption index (WAI) and water
stability index at 15% initial moisture content of feed than 20% and 11% feed.
1.3.6.3 Effect of Particle Size Distribution
Particle size is important attribute that affect product characteristics. A uniform
particle size ensures adequate hydration and uniform cooking during extrusion. If the
particle size is larger, it does not get cooked properly and degrade the product quality. In
addition to that, it may cause plugging of the die during extrusion. For die opening less
than 3mm, it is recommended to grind the ingredients small enough such that the largest
particle is less than one-third of the die orifice. The benefits of a proper final particle size
are: improved product appearance, reduced chances of die plugged, good water stability
and absorption, lower bulk densities, higher throughput, improved digestibility and
palatability, and improved oil retention. The effect of particle size on bulk density of dog
food extruded in a single screw extruder is illustrated in Table 1.5 (Rokey, 2007).
1.3.7 Effect of Extruder Parameters
1.3.7.1 Effect of Screw Configuration
Several studies have been conducted using single and twin-screw extruders to
evaluate the effect of extruder parameters on extrudate properties. Sokhey et al. (1994)
used corn starch to study the effect of different kinds of screws (screws without mixing

23
elements, screws with one mixing elements and screws with two mixing elements) in a
Brabender single screw extruder. They have studied the performance of the extruder with
specific mechanical energy, radial expansion and over all expansion. They reported that
the screw configuration had no significant effect on specific mechanical energy, and
overall expansion. But significant difference in radial expansion was observed between
the extruded and re-extruded corn starches with different screws.
In another study conducted by Barres et al. (1990), they studied the effect of 5
different screw configurations and varying levels of feeding rate in two different twin-
screw extruders, namely Clextral BC 45 and 72, on water solubility index (WSI) of
starch-based extrudates. It was found that screw with reverse elements greatly influenced
the WSI of the extrudates.
The effect of mixing element on the water solubility and water absorption indices
of cross linked starch was studied by Seker et al. (2004). The mixing element increased
the specific mechanical energy dissipation in to the starch but there was no significant
effect on the water solubility and water absorption indices of cross linked starch in a
single screw extruder.
1.3.7.2 Effect of Barrel Temperature
Extruder barrel temperature is reported to have profound effect on the product
properties depending on the degree of cooking. Extrusion cooking helps to inactivate heat
labile anti-nutrients present in plant proteins (Lucht, 2007). Temperature also plays
significant role in properties of the extrudates mainly due to its effect on expansion.
Generally, expansion does not occur at temperature of less than 100°C.

24
Various researchers studied the effect of temperature on water absorption and
solubility indices of an aquafeed containing distillers dried grains with solubles (DDGS)
during single screw extrusion processing. They reported that increase in processing
temperature from 100 to 150°C resulted in significant increase in water solubility index
and water absorption index of the DDGS based diet extruded in single screw extruder.
Extrusion of similar types of feed was studied by Kannadhason et al. (2009). They
observed that increase in processing temperature from 100-150°C increased the WSI but
decreased WAI and PDI in curvilinear fashion for DDGS and tapioca based diet. In
another study, a decrease in bulk density and increase in radial expansion ratio were
reported with extrusion processing temperature of 120°C (Chevanan et al., 2010).
1.3.7.3 Effect of Screw Speed
The extrusion processing is quite complex and interaction effect of several variables
influence the products of this process. Therefore, in most of the cases, it is not possible
to explain the effect of each variable separately. It is well known that screw speed
governs the mechanical energy input. Increasing screw speed elevates the friction
between the product and screw and thus more mechanical energy is produced. On the
other hand increased screw speed results in inadequate cooking due to shorter residence
time. According to Plattner (2007a), increased SME due to increased screw speed
decreases bulk density. In a single-screw extrusion study for a DDGS-based aquadiet,
similar results were observed by Rosentrater et al. (2009b). The author reported that
increasing the screw speed from 100-150 rpm reduced bulk density and pellet durability
index.

25
1.3.7.4 L/D ratio
The die L/D ratio also affects the extrudate properties. Chevanan et al. (2007a)
reported that increase in the L/D ratio (3.33, 3.33, 3.43, 4.81, 5.83, 7.25 and 10.00) of the
die nozzle resulted in an increase in bulk density, L*, a*, and torque, but a decrease in
unit density, pellet durability, water-absorption index and sinking velocity of the DDGS
based extrudates. However, there was no regular trend for other properties like unit
density, bulk density and pellet durability index evaluated.
1.3.8 Fish Feed Extrusion
Fish feed requires 26-50 % protein depending on the physiological state of fish.
Hence the formulated feed contains high amounts of both starch and protein.
Bandyopadhyay and Rout (2001) studied the effect of flow rate, L/D ratio of barrel and
barrel temperature on the water stability and expansion ratio of the sinking marine shrimp
feed. The best shrimp feed had 90.3% water stability, 0.99 expansion ratio and 1347.9
kg/m3 true density. Rolfe et al. (2001) studied the water stability index, pellet durability
and buoyancy of extruded cat fish feed. Increasing the moisture content resulted in
increased water stability and pellet durability. Reducing the particle size from 700 to 100
μm resulted in increased degree of gelatinization, pellet durability and water stability.
1.3.8.1 Properties of Aquaculture Feed Extrudates
1.3.8.1.1 Physical Properties
The understanding of physical properties of aquafeed is important for formulation
of feed and manipulation of processing variables to get the desired property of aquafeed.
Some of the important physical properties in relation to aquaculture feed are described
below:

26
1.3.8.1.1.1 Bulk Density and Unit Density
The bulk density is defined as mass per unit volume of the material including the
void space. It gives useful information for designing storage containers for extrudates and
raw materials (Ayadi et al., 2011). From an economic point of view, the higher the bulk
density, the better, because it reduces the packaging, storage and transportation costs for a
certain mass of product. The unit density of extrudate depends on the degree of expansion
during extrusion and is an important parameter determining floatability of aquafeed.
Tumuluru and Sokhansanj (2008) reported that the effect of extrusion processing
conditions such as screw speed, barrel temperature, die dimension, and feed moisture
content were significant on bulk density and unit density of the extrudates.
1.3.8.1.1.2 Expansion Ratio
Expansion ratio is defined as the ratio of extrudate diameter to the die diameter
(Onwulata et al., 2001; Zazueta-Morales et al., 2002). Expansion occurs in both radial
and axial directions, at different degrees, depending on the viscoelastic properties of the
melt. During the vaporization of moisture and cooling steps the extrudate experiences a
phase transition from a molten to a rubbery state (Barrett, 2003).
The expansion of the extrudates is related to the state of damage of starch and
gelatinization and protein denaturation. The quantity of starch and protein in the blend
affects expansion property of extrudates (Plattner, 2007b). The pre-processing history of
ingredients in the blend also affects expansion of extrudates; heat denatured proteins
looses the stability to expand (Sørensen et al., 2009).
1.3.8.1.1.3 Pellet Durability

27
Fish feed are subject to several mechanical forces during handling and
transportation. These forces may be classified as impact, compression, and shear. Impact
shatters the pellet surface and any natural cleavage planes in the pellet; compression
forces crush the pellet; shear forces cause abrasion of the edges and surface of the pellet
(Winowiski, 1995). Physiochemical transformation of starch component of the feed blend
in response to the variation of extrusion processing condition significantly impacts the
cohesiveness and durability of the extruded blends against the external pressures
(Chevanan et al., 2007b; Colonna et al., 1989; Rosentrater et al., 2009a).
The durability of extruded pellet is measured in terms of pellet durability index
and is the measure of pellet’s ability to withstand breakage and disintegration in a device
with a tumbling motion (Tumbling Can Tester) or one that simulates vigorous pneumatic
handling (Holmen Pellet Tester). The whole pellets retained by sieving after subjecting a
measured quantity of pellets to the standard testing procedure gives the measure of pellet
durability index (Evans, 1999).
1.3.8.1.1.4 Water Absorption and Solubility Indices
WAI can be defined as the amount of occupied volume (due to starch content of
the material) after swelling up in water. In other words, WAI indicates the part of the
starch which was not affected by the extrusion cooking and maintained its internal
structure (Mason and Hoseney, 1986). Thus, changing the WAI with increasing the screw
speed could be explained by structural modifications of the feed compositions, such as
starch gelatinization and protein denaturation (Badrie and Mellowes, 1991; Rosentrater et
al., 2009a). Water solubility index, on the other hand, can be defined as the portion of
starch that was converted during the extrusion cooking process. Ng et al. (1999)

28
suggested that WAI is inversely related to WSI. In our study, an inverse relationship
between the WAI and WSI was observed.
Jones et al. (2000) used the following procedure to determine the WSI and WAI.
To determine WAI, 2.5 g of finely ground sample was suspended in 30 mL of distilled
water at 30°C in a 50 mL tarred centrifuge tube. The content was stirred intermittently
over a period of 30 min, and then centrifuged at 3000 x g for 10 min. The supernatant
water was transferred into tarred aluminum dishes. The mass of the remaining gel was
weighed, and WAI was calculated as the ratio of gel mass to the sample mass.
WSI was determined as the water soluble fraction in the supernatant, expressed as
percent of dry sample. The WSI was determined from the amount of dried solids
recovered by evaporating the resulting supernatant in an oven at 135°C for 2 h; it was
determined as the mass of solids in the extract to the original sample mass (%).
1.3.8.1.2 Nutritional Properties
Extrusion cooking can cause both beneficial and detrimental effect on nutritional
properties of the feed. According to Singh et al. (2007), the thermo-mechanical effect of
extrusion parameters and processing variables can destruct the anti-nutritional factors,
gelatinize the starch, increase solubility of dietary fiber, and even reduce lipid oxidation.
Bhattacharya et al. (1988) reported that increasing extrusion temperature from
100 to 140˚C improved the degree of inactivation of protease inhibitors in wheat flour.
They also found that the effect of length to diameter ratio and screw speed on protein
digestibility values were insignificant (P <0.05). In another study, it was reported that
increased screw speed could increase the protein digestibility of extruded corn-gluten,

29
because the increase in shear forces in the extruder denatured the proteins more easily
(Bhattacharya and Hanna, 1985).
Fish require some main nutrients such as protein, fat, carbohydrate, vitamins and
minerals; however, these requirements vary by species and age. According to Fenerci and
Şener (2005), fish use proteins as their energy source, but because of the high cost of
proteins, fats and carbohydrates are preferred as energy source in feeds. Proteins must be
used only for growth in fish (Demir, 1996; Şener and Yıldız, 1998).
However, Maillard reactions between protein and sugars can reduce the
nutritional value of the protein, depending on the raw material types, their composition
and process conditions. Several reports had attempted to relate Maillard reaction and
discoloration or browning to loss of lysine (Asp and Björck, 1989; Björck and Asp, 1983;
Cheftel, 1986; Hurrel and Carpenter, 1977). Furthermore, lysine loss has been related to
extrusion process parameters such as raw material, feed moisture, screw speed, extrusion
temperature, die diameter, feed rate, screw compression ratio, torque and pressure, energy
input and pH (Asp and Björck, 1989; Camire et al., 1990).
1.3.8.1.2.1 Anti-Nutritional Factors
Numerous substances are naturally present in plants, not needed for normal
growth but may have protective functions, are called secondary metabolites. These
secondary plant metabolites are also referred to as anti-nutritional factors (ANFs). These
ANFs adversely affect the growth performance of animals when fed on them. They may
affect by reducing protein digestibility, binding to various nutrients or damaging the
intestinal wall, thereby lowering digestive efficiency (Mosenthin and Jezierny, 2010).
They can be divided into two categories: heat-labile and heat-stable ANFs. Heat-labile

30
ANFs include trypsin inhibitors, phytates, lectins, goitrogens and antivitamins. Heat-
stable ANFs include carbohydrate or soluble fiber, saponins, estrogens, allergins, and
lysinoalanine.
The type and content of these ANFs varies considerably among different
feedstuffs: Protease inhibitors and lectins are most significant for legume seeds
(soybeans, peas, faba beans, lupins), tannins are present in rapeseed, faba beans and peas,
whereas glucosinolates and sinapins dominate in rapeseed, alkaloids are important in
lupins, and pyrimidine glycosides can generally be found in faba beans (Mosenthin and
Jezierny, 2010). These ANFs exert various deleterious effects on monogastric animals,
including fish (Table 1.6).
There are number of physical and chemical means of processing methods to
remove the anti-nutrients in plant proteins. These include: heat treatment (cooking,
steaming), soaking, germination, decortication (dehulling), fermentation, selective
extraction, irradiation, enzymatic treatment (Deshpande, 2002; Mosenthin and Jezierny,
2010). Heat-labile anti-nutrients such as protease inhibitors, lectins can be reduced to safe
level by proper thermal processing. However excessive heating can adversely affect the
protein quality of feed.
The major anti-nutritional factor of challenge in soybean is trypsin inhibitor
which is a protease enzyme. To avoid any nutritional problem in animals, it is necessary
to remove at least 85% of the trypsin inhibitor units. This can be easily done by heat
treatment. Moist extrusion (MC>18%), can destroy up to 95% of the trypsin inhibitor
with significant loss of lysine. However, dry extrusion has deleterious effect on lysine.
Moist extrusion is better than dry extrusion and traditional roasting (Rokey, 2007).

31
1.3.8.1.2.2 Available Lysine
According to Singh et al. (2007), lysine is the most limiting essential amino acid
in extruded products. Iwe et al. (2004) reported that increased screw speed (80– 140 rpm)
and a decreased die diameter (10–6 mm) enhanced available lysine retention. They
suggested increasing screw speed increased shear, leading to more severe conditions, but
the reduction in residence time shortened the duration of heat treatment, which resulted in
higher lysine retention. It has been reported that excessive heating leads to a decrease in
amino acid availability, specifically Lysine. The effect of heat treatment on available
lysine of DDGS and SBM were studied by Fernandez and Parsons (1996); McGinnis and
Evans (1947); Warnick and Anderson (1968). In another study conducted for extrusion of
wheat flour (150oC mass temperature, 5 mm die diameter, 150 rpm screw speed),
increasing in feed rate (from 200 to 350 gmin-1
) led to a significant increase in lysine
retention (Björck and Asp, 1983).
In terms of moisture content, several studies reported conflicting results.
According to Cheftel (1986), to maximize lysine retention, for MC <15%, product
temperature should be kept below 180˚C. Björck and Asp (1983) reported that higher
moisture content (15–25%) significantly improves lysine retention. According to Singh et
al (2007), these changes might not be related to a single factor. They suggested that the
role of feed moisture content and the interactions of other parameters on the protein
nutritional quality need further investigation. The effect of extrusion processing variables
on lysine availability is presented in Table 1.7.

32
1.3.9 Modeling and Simulation of Extrusion Studies
Extrusion processing is a very complex process, involving numerous
interdependent input parameters (both process, system parameters) and output
parameters. Process parameters are the operating conditions that can be controlled and
manipulated directly such as raw material characteristics, moisture content, screw speed,
screw configuration, barrel temperature etc. System parameters are influenced by the
process parameters and subsequently affect the output parameters such as residence time,
specific mechanical energy, pressure build up, viscosity of dough etc. Output parameters
includes expansion, bulk density, mechanical properties such as breaking strength, pellet
durability etc., chemical properties such as water solubility index, water absorption index,
nutrient content etc. Various models have been developed to understand the extrusion
process to obtain required product characteristics.
Generally, regression modeling and response surface modeling were employed to
predict output parameters form process parameters in extrusion processing. All the
mathematical modeling by response surface and regression technique is product specific
and machine specific. Response surface modeling is an empirical model building
technique where the physical relationships are not known (Box and Draper, 1987) and is
used to determine the optimum conditions for obtaining the maximum or minimum
response within the operating conditions. Regression modeling is also widely used to
determine the relationship between the input and output variables in extrusion processing.
The relationship between the input and output variables are mostly non-linear in nature.
Hence the non-linear regression equations will contain many cross product terms and
higher order terms. Due to this there is possibility of very large error when there is little

33
variation in the operating conditions. In regression modeling, the mathematical
relationships are established to obtain good results through approximation without
understanding the actual process.
Harper et al. (1971) developed a viscosity model where they incorporated
moisture and temperature effects. Many researchers used this same model to
study the viscosity of dough in extruders (Altomare et al., 1992; Bhattacharya and Hanna,
1986; Harmann and Harper, 1974; Jao et al., 1978; Luxenburg et al., 1985; Remsen and
Clark, 1978). Lam and Flores (2003) introduced a correction factor for the particle size
distribution of the raw ingredients in the viscosity model of dough inside the barrel of a
single screw extruder.
Computational fluid dynamics (CFD) simulation of flow characteristics inside the
extruder may be used to improve the understanding of underlying mechanisms
and provide an insight in to the effects of process parameters. Many researchers have
designed a single screw extruder using Finite Element Meshing (FEM) and CFD.
Dhanasekharan and Kokini (2003) analyzed a computational method based on numerical
simulations to obtain simultaneous scale-up of mixing and heat transfer for single screw
extrusion of wheat dough. Connelly and Kokini (2007) used CFD to study and compare
the mixing ability of single and co-rotating twin screw mixers. El-Sadi and Esmail (2005)
did numerical simulation of flow to investigate the performance of micro pump using
complex liquid. The dispersive mixing efficiency of the plasticized starch in a twin screw
extruder was studied and simulated by Emin and Schuchmann (2013). Computer
simulation of moistened defatted soy flour in a single screw extruder has been performed
by Ghoshdastidar et al. (2000) to predict the dough behavior in an extrusion process.

34
Siregar et al. (2014b) designed and analyzed single screw extruder for processing of
Jatropha seeds using FEM and CFD.
In order to maximize the SWF utilization for production of high quality
aquaculture feed through processing, optimization of extrusion process parameters,
operating conditions and ingredient combinations were very important. Even with
advancement of technologies, extrusion processing is considered to be an art and
understanding the effect of different process parameters on the quality of extruded feed is
very important for scaling up operations and to produce consistent product in large scale
production.

35
Table 1.1 Dietary nutrient requirement for catla (Catla catla) (% dry feed except
otherwise mentioned).
Nutrient Life stage/size class
Larvae Fry Fingerling Grower Broodstock
Crude protein 45% 35-45% 30-40% 30% 33%
Crude lipid 8-10% 8-10% 8-10% 7-9% 14%
Carbohydrate 26% 22-26% <30% 22-26% 20%
Crude Fibre†
- - - - -
†Empirical data not available, general acceptable level 6-10%
Source: ICAR (2006); Singh et al. (2004); Sinha and Sinha (1994)

36
Table 1.2 Essential amino acid requirements of various species (% protein) †
Amino acid Catla Rohu Tilapia Common
carp
Channel cat
fish
Arginine
Histidine
Isoleucine
Leucine
Lysine
Methionine
Phenylalalanine
Threonine
Tryptophan
Valine
5.63
2.38
2.75
4.38
6.86
3.00
4.50
4.50
1.03
3.60
5.75
2.25
3.00
4.63
5.58
2.88
4.00
4.28
1.13
3.75
4.2
1.7
3.1
3.4
5.1
-
-
3.6
1.0
2.8
4.2
2.1
2.3
3.4
5.7
-
-
3.9
0.8
3.6
4.3
1.5
2.6
3.5
5.1
-
-
2.0
0.5
3.0
- Not required
†Source: Lovell (1989); Murthy (2002)

37
Table 1.3 -3 and -6 fatty acid content in different lipid sources used for fish feed
formulation. †
Ingredient -3 -6
Fish oil (Manhaden)
Safflower oil
Soya bean oil
Pollock liver oil
Cuttle fish liver oil
Beef Tallow
38%
3%
7.7%
2.4%
32.3%
Not present
4%
73%
52.8%
0.8%
2.1%
2%
†Source: Jauncey and Ross (1982)

38
Table 1.4 Recommended size of feed for catla (Catla catla) during different
physiological states. †
Life stage Fish size
(g)
Feed type Feed size
(mm)
Feeding rate
(% body weight)
Larvae 1.4 mg Particle <50 µ 400 & 800 in 1st & 2nd
weeks, respectively
Fry 3-4 g Crumble
pellet
0.5 mm. 6-8, 5-6 & 3-4 in 1st,
2nd & 3rd months
Fingerling 10 g Dry pellet 1.5-2.0 mm 3-5 & 1-3 in 1st &
subsequent months
Grower >50 g Dry pellet 2.5-3.0 mm 1-3
Brood stock 2 years plus
(3.0-5.5 kg)
Dry pellet 5 mm 1
†Source: ICAR (2006); Nandi et al. (2001)

39
Table 1.5 Effect of grind size on processing of extruded feed. †
Grind (hammer mill
screen opening)
Bulk density (g/l)
at given rate
SME(kWh/t) at given
rate and bulk density
Rate(kg/h) at given
bulk density
1.5mm 316 46.8 357
800µ 232 42.3 513
†Source: Rokey (2007)

40
Table 1.6 Anti- nutritional factors and their adverse effects in fish. †
Anti-nutrient Sources Effects in fish
Protease inhibitor Soybean, pea, faba bean,
cotton, rapeseed meal
Inhibit the activity of the
proteolytic enzymes trypsin
and chymotrypsin,
and hinder feed protein
utilization
Lectins or
phytohaemagglutinins
Faba beans, pea,lupin,
soybean meal
Affect intestinal mucosa
Glucosinolates Rapeseed meal Retard growth and disrupt the
thyroid function
Phytates Soybean, pea, mustard,
rapeseed meal
Reduce availability of
minerals like phosphorous,
and decrease protein
digestibility
Saponins Sunflower oil meal, lupin
seed meal, pea seed meal
Retard growth and damage
intestinal mucosa of fish
Gossypol Cottonseed Growth depression, intestinal
and other internal organ
abnormalities, and unbalanced
sex ratio in fish.
Tannins Pea, rapeseed, mustard
meal
Interfere with digestion and
retard growth
Non starch
polysaccharides (NSP)
and oligosaccharides
Soybean meal Decrease feed intake and
digestibility
†Source: Francis and Becker (2002)

41
Table 1.7 Effects of processing variables on lysine retention. †
Processing
Parameter
Effects on lysine
retention
Food source References
Screw speed ↑with increasing
screw speed
Defatted soy flour
and sweet potato
flour mixture
Iwe et al. (2004)
Die diameter ↓with increasing die
diameter
Defatted soy flour
and sweet potato
flour mixture
Iwe et al. (2004)
Feed rate ↑with increasing feed
rate
Wheat flour Björck and Asp
(1983)
Feed moisture ↓with increasing
moisture
Cowpea and mung
bean
Pham and Del
Rosario (1984)
↑, increase; ↓, decrease.
†Source: Singh et al. (2007)

42
CHAPTER 2 †
Single Screw Extrusion Processing of Soy White Flakes Based Catla Feed
2.1 Abstract
An initial investigation into the inclusion of soy white flakes (SWF) and high
protein distillers dried grains (HP-DDG) in catla (Catla catla) diet, belonging to the
family Cyprinidae, was conducted using a single screw extruder. Three isocaloric (302
kcal/100 g) ingredient blends containing graded levels of SWF in combination with HP-
DDG and other required ingredients were formulated to contain a net protein content of
31.5% (db). Extrusion processing was then performed using three levels each of SWF
content, moisture content, and temperature gradient keeping a constant screw speed and
die diameter. Effects of these variables on extrudate physical properties including: color,
pellet durability index, bulk density, water absorption index, water solubility index, unit
density and expansion ratio were extensively analyzed. Increasing the level of SWF
resulted in increase in water absorption index and unit density but decrease in expansion
ratio. The interaction effect of SWF content, moisture content and temperature were
significant for color, pellet durability index, bulk density and expansion ratio. All the
extrudates showed relatively high pellet durability and inclusion of SWF produced less
expanded and more compact textured extrudates.
2.2 Introduction
Extrusion is a versatile and very efficient technology that is widely used in food
and feed processing including increasing numbers of ready-to-eat cereals, salty and sweet
snacks, coextruded snacks, indirect expanded products, croutons for soups and salads, an
† Singh, S.K. and Muthukumarappan, K., 2015. Single screw extrusion processing of soy white flakes
based Catla feed. Journal of Food Research, 4(1), p.1. DOI: 10.5539/jfr.v4n1p1

43
expanding array of dry pet foods and fish foods, textured meat-like materials from
defatted high-protein flours, nutritious precooked food mixtures for infant feeding, and
confectionery products (Mercier et al., 1989a). Extrusion cooking is a high-temperature,
short-time process in which starchy and/or proteinaceous food materials are plasticized,
cooked, and in some cases expanded by a combination of moisture, pressure, heating, and
mechanical shear, resulting in molecular transformation and chemical reactions. It
provides a continuous high throughput processing and can be controlled automatically. It
can be used to produce products with various shape, color, texture and appearance.
Protein is the most important nutrient which promotes growth in fishes.
Depending on the fish species, fish feed generally requires protein content of 26% to 50%
(Lovell, 1989). Commonly, high amount of ground marine caught fish as fish meal, are
used to meet the requirement of protein in fishes which contributes significantly to
variable production cost in aquaculture industry. However, decreasing fishmeal supply
relative to demand and increasing costs threaten the sustainability and growth of the
aquaculture industry. Approximately two to six pounds of marine fish are needed for the
production of only one pound of farm fish (Marine Aquaculture Task Force, 2007). As
protein is the costliest among various ingredients in preparation of fish feeds, it is
necessary to search for the alternative protein sources in order to reduce the cost of feeds
(FAO, 2004; Lunger et al., 2007; Renukaradhya and Varghese, 1986). Hence, the goal is
to minimize fish meal inclusion in fish feed by substituting appropriate alternative protein
sources (Hardy and Masumoto, 1990). A number studies of have been done regarding the
efficacy of plant feedstuffs as alternative protein sources in fish feeds (Hossain and
Jauncey, 1989).

44
High protein distillers dried grains (HP-DDG) and soy white flakes (SWF) can be
used as an alternative source of protein. Distillers Dried Grains (DDG) and Distillers
Dried Grains with Solubles (DDGS), a co-product from corn-based dry grind fuel ethanol
manufacturing, is a viable protein source. Typically, DDGS contains approximately 30%
protein (Rosentrater and Muthukumarappan, 2006; Spiehs et al., 2002) whereas DDG
contain 1.5 times more protein that of DDGS and less fat; hence, it is called HP-DDG
(Robinson and Li, 2008). Moreover, HP- DDG provides higher available phosphorous
content thus reducing the need for phosphorous supplementation and its nutritional values
are much more consistent than those of DDGS (Robinson et al., 2008). Fallahi et al.
(2013) reported that inclusion of HP-DDG up to 40% led to the production of more
expanded and floatable extrudates compared to those extrudates containing DDGS for
rainbow trout. Soy is one of the most important protein-rich plants and a source of protein
for aquafeeds (De Francesco et al., 2007; Karalazos et al., 2007; Morris et al., 2005). Use
of soy products like full fatted soybean meal, defatted toasted soybean meal (SBM) and
defatted untoasted soybean meal or soy white flakes (SWF) is becoming common
(Fallahi et al., 2012). Romarheim et al. (2005) found that extrusion of SWF diet increased
the digestibility of protein and all amino acids whereas fishmeal and SBM had no
significant effect on amino acid digestibility. Dersjant-Li (2002) reported that soy protein
isolate can be used to replace 40-100% fish meal without negative impact on growth
performance of shrimp. To date, however, no trials of partial or complete replacement of
fishmeal with SWF and HP-DDG for fish feeds have been conducted.
Therefore, the objectives of this study were to produce feed pellets for catla
(Catla catla) with SWF and HP-DDG inclusions and to examine the effect of various

45
levels of SWF content, moisture content and extruder barrel temperature on physical
properties of the extruded feeds.
2.3 Materials and Methods
SWF were kindly donated by South Dakota Soybean Processors (Volga, SD). Corn
flour was purchased from Cargill Dry Ingredients (Paris, IL). HP-DDG was obtained
from the Dakota Ethanol LLC (Wentworth, SD). Corn gluten meal (CGM) and fishmeal
were purchased from Consumer Supply Distributing Co. (Sioux City, IA). Vitamin-
mineral premix was obtained from Lortscher Agri Service, Inc. (Bern, Kansas, USA).
Soybean oil was obtained from USDA (Brookings, SD).
2.3.1 Blend Formulation
Three isocaloric (302 kcal/100g) blends were formulated to contain a net protein
content of 31.5% (db) and a target fat content of ~ 4.2%. The total energy content for
each blend was determined based on the fraction of protein, fat and carbohydrate
contributing to the dietary energy. The total energy content was calculated based on the
energy content of fractions namely, 4.5 kcal/g for protein, 9.1 kcal/g for lipid and 4.1
kcal/g for carbohydrate. The different ingredients in the blends include SWF (42.5%
protein), HP-DDG (42% protein and 4.5% fat), corn gluten meal, corn flour, fish meal,
soybean oil, and vitamin & mineral mix (Table 2.1). The ingredients were mixed in a
laboratory scale Hobart mixer (Hobart Corporation, Troy, Ohio, USA) for 10 min and
stored overnight at ambient temperature (25oC) for moisture stabilization. The moisture
balancing of the blends was done by adding required quantities of water during mixing.

46
2.3.2 Extrusion Processing
The extrusion processing was performed using a single screw extruder (Brabender
Plasti-Corder, Model PL 2000, South Hackensack, NJ) which was powered by a 7.5 hp
motor with an operating range of screw speeds from 0 to 210 rpm (0 to 22 rad/s). The
extruder had a barrel with length-to-diameter ratio of 20:1 and a barrel diameter (D) of 19
mm. A uniform 19.05 mm pitch screw with compression ratio of 3:1 was used in the
experiments. The clearance (H) between the inner wall of the barrel and screw at die
section is 1.27 mm (0.05 in) and the clearance (3H) between the inner wall of the barrel
and screw at feed section is 3.81mm (0.15 in). A typical screw of a single screw extruder
is shown in Figure 2.1. The length and diameter of the die nozzle was 17.5 mm and 3 mm
(L/D: 5.83), respectively. The extruder barrel was equipped with external band heaters
with provisions to control the temperature of all three zones: feed zone, transition
zone/melting zone, and die sections (Figure 2.2).
The raw materials were fed in feeding zone of the extruder through feed hopper. It
got gelatinized and plasticized under thermal and mechanical stresses generated by the
rotation of screws in melting zone of the extruder. The gelatinized material then enters
the cooking zone where the extruder barrel is fully filled due to pressure generated at die
nozzle. When the process reached the steady state, samples were collected at the die. All
samples were left to dry at ambient temperature (25ºC) for 48 h prior to further analysis.
During the experiment the screw speed of extruder was maintained at 150 rpm.
2.3.3 Experimental Design and Analysis
Experiments were conducted using a full factorial, three-level design, with SWF
content, moisture content, and barrel temperature gradient levels being the independent

47
variables. This resulted in 27 unique extrusion trials for different combinations of three
levels each of SWF content (10%, 20%, and 30%), moisture content (15%, 25%, and
35% db), and temperature gradient (T1-T2-T3) in the barrel (45-110-110 ºC, 45-140-140
ºC, and 45-170-170 ºC), hereafter referred as temperature of 110, 140 and 170ºC. Each
treatment was extruded once and three replicates were determined for all the extrudate
physical properties, except unit density which was measured with ten replicates. All the
collected data were analyzed with SAS v.9 (SAS, 2012). The Proc GLM procedure was
used to determine the main, treatment and interaction effects using a Type I error rate (α)
of 0.05. Post-hoc least significant differences (LSD) tests were used to identify where the
significant differences occurred.
2.3.4 Measurement of Physical Properties
2.3.4.1 Color
A spectrophotometer (LabScan XE, HunterLab, Reston, VA) was used to
determine extrudate color, where L* quantified the brightness/darkness, a* the
redness/greenness and b* the yellowness/blueness of the extrudate samples.
2.3.4.2 Pellet Durability Index (PDI)
Approximately 100 g of extrudates from each blend were manually sieved
(U.S.A. standard testing, ASTM E-11 specification, Daigger, Vernon Hills, IL) to remove
initial fines, and then tumbled in a pellet durability tester (Model PDT-110, Seedburo
Equipment Company, Chicago, IL) for 10 min. Afterwards, the samples were again
sieved, and then weighed on an electronic balance. PDI was calculated as:
100a
b
MPDI
M
(2.1)

48
where, Ma was the mass (g) after tumbling and Mb was the sample mass (g) before
tumbling.
2.3.4.3 Bulk Density (BD)
Bulk density was determined as the ratio of the mass of extrudates that they filled
up to a given bulk volume and measured using a standard bushel tester (Seedburo
Equipment Company, Chicago, IL) following the method recommended by (USDA,
1999).
2.3.4.4 Water Absorption Index (WAI) and Water Solubility Index (WSI)
Extrudates were ground to fine powders using a coffee grinder (Black & Decker®
Corporation, Towson, ML, USA). The ground extrudates (2.5g) was suspended in
distilled water (30 mL) in a tarred 60 mL centrifuge tube. The suspension was stirred
intermittently and centrifuged at 3000g for 10 min. The supernatant was decanted into a
tarred aluminium cup and dried at 135oC for 2 h (AACC, 2000). The weight of the gel
remaining in the centrifuge tube was measured. The WAI and WSI were calculated by:
g
ds
WWAI(unitless )
W (2.2)
where, Wg is the weight of gel (g), and Wds is the weight of dry sample (g).
100ss
ds
WWSI(%)
W
(2.3)
where, Wss is the weight of dry solids of supernatant (g), and Wds is the weight of dry
sample (g).
2.3.4.5 Unit Density (UD) and Expansion Ratio (ER)
The extrudates were cut to a length of ~ 1 inch (25.4 mm) and weighed on an
analytical balance (Adventurer™, Item No: AR 1140, Ohaus Corp. Pine Brook, NJ), then

49
measured with a digital calliper (Digimatic calliper, Model No: CD-6C, Mitutoyo Corp.,
Tokyo, Japan) to determine their diameter. The unit density (UD, g/cm3
) was calculated
as the ratio of the mass M (g) to the volume V (cm3 ) of each measured and weighed
extrudate sample, assuming a cylindrical shape for each extrudate (Rosentrater et al.,
2005).
( / )M
UD g ccV
(2.4)
The radial expansion ratio of the extrudates was measured as the ratio of the diameter of
the extrudates to the diameter of the die orifice.
2.4 Results and Discussion
2.4.1 Color
Change in color of extrudates can be an indication of nutrients degradation during
extrusion processing (Björck and Asp, 1983). Increasing the SWF content from 10% to
30% resulted in 1.2% increase in L* value but 6.9% decrease in a* value and 3.5%
decrease in b* value (Table 2.2). Change in a* value can be due to the difference in color
of the raw material used before extrusion. Decrease in yellowness of extrudate was
expected because raw DDG was yellowish in color; thus, decrease in DDG content or
increase in SWF content (Table 2.1) resulted in a significant decrease in yellowness of
the extrudate. Increasing the moisture content of ingredient blends from 15% to 35%, led
to significant decrease in L* and b* values by 28.0% and 23.0%, respectively. Increasing
moisture content in blends had significant effect on a* value but no particular trend was
observed (Table 2.2). Likewise, increasing extruder barrel temperature from 110 ºC to
170ºC resulted in significant change (p<0.05,
Table 2.3) in L*, a* and b* values but no specific trends were discernible.

50
2.4.2 Pellet Durability Index (PDI)
Pellet durability indicates the mechanical strength of the extrudates. (Rosentrater
et al., 2005). In fact, the extent of heat treatment, along with the level of starch
transformation, protein denaturation, and water content, during the extrusion processing,
influence the pellet durability quality of the extrudates (Rosentrater et al., 2009a). The
main effects of the independent variables on the extrudate pellet durability are presented
in Table 2.2. The effect of changing the level of white flakes, moisture content and
temperature on pellet durability of extrudates was found to be significant (p<0.05,
Table 2.3) but no definite pattern was observed. As depicted in Table 2.2,
increasing SWF inclusion from 10% to 20%, moisture content from 15% to 25% and
temperature from 110ºC to 140ºC decreased PDI by 2.6%, 8% and 3.0%, respectively.
Whereas, further increasing SWF content from 20% to 30%, increasing moisture content
from 25% to 35% and increasing temperature from 140ºC to 170ºC resulted in a
significant increase (α=0.05) by 5%, 12.3% and 2.5% in PDI, respectively. Maximum
and minimum values of PDI were observed as 89.97% and 85.73% at 30% and 20% SWF
content in ingredient blends respectively, 92.27% and 82.15% at 35% and 25% moisture
content of ingredients respectively and 88.99% and 86.28% at 110oC and 140
oC
respectively (Table 2.2). Interaction effect of all independent variables on PDI was
significant, p<0.0001 (
Table 2.3).

51
2.4.3 Bulk Density (BD)
Bulk density influences storage capacity required at the processing plant and
during shipping. Increasing SWF content from 10% to 30% significantly changed
(p<0.05,
Table 2.3) BD of the extrudates but no particular trend was observed. Changing
the level of moisture content from 15% to 35% resulted in a 17% decrease and increasing
the barrel temperature from 110ºC to 170ºC resulted in a 12% decrease in BD. This may
be due to the reason that when the melt exits the die nozzle at high temperature it expands
more and have more volume than the extrudates exiting at low temperature.
2.4.4 Water Absorption Index (WAI) and Water Solubility Index (WSI)
Water absorption index indicates the amount of water immobilized by the
extrudate, while water solubility index indicates the amount of small molecules
solubilized in water (Mezreb et al., 2003). WAI is related to the water activity and
influences the storage stability. Main effects of independent variables on WAI and WSI
are shown in Table 2.2. When percentage of SWF in ingredient mix was increased from
10 to 30%, a significant increase of 7.0% in WAI was found. As the moisture content of
ingredient was increased from 15% to 35% and barrel temperature was increased from
110ºC to 170ºC, WAI increased by 37.5% and 12.3%, respectively (Table 2.2). A similar
trend was observed by Anderson et al. (1969) with extruded sorghum grits. No significant
change was observed for WSI as SWF content was increased from 10% to 30% in
ingredient blends (Table 2.2). When moisture content was increased from 15% to 35%
and barrel temperature was increased from 110ºC to 170ºC a decrease of 14% and an
increase of 4.3% in WSI were observed, respectively (Table 2.2). This may be due to the

52
reason that as the temperature increased, the extent of starch gelatinization increased.
According to Harper (1981), WSI of the extrudate is directly related to the extent of
starch gelatinization that occurs inside the extruder.
2.4.5 Unit Density (UD)
Unit density influences the floatability of the extrudates. As depicted in Table 2.2,
a significant increase of 3.4% in UD of the extruded products was observed when level of
SWF was raised from 10% to 30%. The maximum and minimum unit density values
were 0.95 g/cm3 and 0.85 g/cm
3 observed at 15% and 25% ingredient moisture content,
respectively. The apparent viscosity of the ingredient melt inside the barrel and die is
inversely proportional to the extruder barrel temperature (Bhattacharya and Hanna, 1986;
Harper, 1981). When the ingredient melt having lower viscosity exits through the die, the
produced extrudates tend to expand more, and thus have reduced UD. Increasing the
barrel temperature from 110ºC to 170ºC resulted in a 28% decrease in UD (Table 2.2).
2.4.6 Expansion Ratio (ER)
Changes in the level of SWF content, moisture content of ingredient mix and
temperature had a significant effect on ER of extrudates (
Table 2.3) but no particular trend was observed. Changing the level of SWF
content from 10% to 20%, a significant decrease of 3.4% in expansion ratio was
observed; further increasing of the SWF inclusion to 30% had no effect on ER of the
extrudates (Table 2.2).
2.5 Conclusions
The goals of this study were to produce fish feed pellets with HP-DDG and SWF
inclusions and to examine the effect of various levels of SWF, moisture content and

53
extruder barrel temperature on physical properties of the extruded feeds. Changing the
level of SWF significantly affected extrudate color, pellet durability, bulk density, water
absorption index, unit density and expansion ratio (p<0.05). Increasing the level of SWF
from 10% to 30%, significantly increased the value of WAI from 3.98 to 4.26 and UD
from 0.89 g/cm3 to 0.92 g/cm3 but decreased the value of ER from 1.17 to 1.13 (α=0.05).
Also changing the level of moisture content and temperature had significant effect
(p<0.05) on all physical properties. Increasing moisture content from 15% to 35%
resulted in a 37.5% increase in WAI and 17% and 14% decrease in bulk density and WSI,
respectively. As temperature increased from 110 to 170°C, WAI and WSI increased by
12.3% and 4.3%, respectively. But, there was a decrease in BD by 12% and UD by 28%.
The interaction effect of SWF content, moisture content and temperature (SWF×MC×T)
were found to be significant for color, PDI, BD and ER. All the extrudates showed
relatively high pellet durability, which is important to retaining their physical structure
during transportation and storage. This indicates that utilization of combined SWF and
HP-DDG did not have detrimental effect on pellet durability. Increasing levels of SWF
produced less expanded and more compact textured extrudates. Based on the results
obtained, further research may be conducted to study the effects of increased level of
SWF (more than 30%) with different die dimension on the extrudate quality.

54
Table 2.1 Ingredient composition of feed blends.
Feed ingredients Mass of ingredients (g/100g)
Blend I Blend II Blend III
SWF 10 20 30
HP-DDG 40 30 20
Corn gluten meal 7 7 7
Corn flour 35 35 35
Fish meal 5 5 5
Soybean oil 1 1 1
Vitamin & mineral mix 2 2 2
Total 100 100 100
†SWF – Soy white flakes; HP-DDG – High protein distiller’s dried grains

55
Table 2.2 Main effects of SWF content, moisture content of raw material and temperature profile (on extrudate physical properties).
Variable L* a
* b
* PDI BD WAI WSI UD ER
(-) (-) (-) (%) (g/cc) (-) (%) (g/cc) (-)
SWF (%)
10 41.93b 6.20
a 15.45
a 88.01
b 0.36
c 3.98
b 14.03
ab 0.89
b 1.17
a
(6.11) (0.88) (1.67) (5.30) (0.05) (0.60) (1.51) (0.15) (0.07)
20 42.06b 5.99
b 15.17
b 85.73
c 0.39
a 4.07
b 13.66
b 0.92
a 1.13
b
(6.25) (0.89) (1.89) (6.37) (0.05) (0.67) (1.27) (0.16) (0.12)
30 42.42a 5.77
c 14.91
c 89.97
a 0.38
b 4.26
a 14.21
a 0.92
a 1.13
b
(6.63) (0.92) (2.10) (4.62) (0.04) (0.63) (1.79) (0.19) (0.15)
MC (% db)
15 48.93a 5.19
c 16.61
a 89.28
b 0.42
a 3.39
c 15.39
a 0.95
a 1.15
b
(3.29) (0.80) (0.36) (2.30) (0.02) (0.29) (0.59) (0.14) (0.12)
25 42.31b 6.61
a 16.19
b 82.15
c 0.36
b 4.25
b 13.29
b 0.85
b 1.20
a
(1.76) (0.58) (0.71) (5.33) (0.04) (0.38) (1.04) (0.12) (0.11)
35 35.17c 6.16
b 12.72
c 92.27
a 0.35
c 4.66
a 13.21
b 0.94
a 1.09
c
(2.87) (0.67) (0.91) (3.08) (0.06) (0.39) (1.64) (0.21) (0.10)
T (°C)
110 40.58c 6.30
a 15.20
a 88.99
a 0.41
a 3.81
b 13.81
b 1.07
a 1.10
b
(7.24) (1.21) (2.09) (5.77) (0.02) (0.60) (1.50) (0.12) (0.08)
140 43.34a 5.72
c 14.95
b 86.28
c 0.37
b 4.22
a 13.67
b 0.90
b 1.23
a
(6.85) (0.81) (2.14) (6.61) (0.04) (0.55) (1.62) (0.13) (0.11)
170 42.49b 5.94
b 15.37
a 88.44
b 0.36
c 4.28
a 14.41
a 0.77
c 1.11
b
(4.13) (0.47) (1.37) (4.25) (0.07) (0.67) (1.44) (0.09) (0.11)
†Means with different letters in a column within each independent variable are significantly different (p<0.05) for that independent
variable at p<0.05; values in parentheses are standard deviation. SWF – Soy white flakes; MC – Moisture content of the blend; T-
Barrel temperature.

56
Table 2.3 Interaction results for SWF content, moisture content of raw material and barrel temperature on extrudate physical
properties (p values).
Variable L* a
* b
* PDI BD WAI WSI UD ER
(-) (-) (-) (%) (g/cc) (-) (%) (g/cc) (-)
SWF 0.02 <.0001 <.0001 <.0001 <.0001 0.0004 0.1046 0.0113 <.0001
MC <.0001 <.0001 <.0001 <.0001 <.0001 <.0001 <.0001 <.0001 <.0001
SWF×MC 0.0039 <.0001 0.0004 <.0001 <.0001 0.0431 0.008 <.0001 <.0001
T <.0001 <.0001 <.0001 <.0001 <.0001 <.0001 0.0158 <.0001 <.0001
SWF×T <.0001 <.0001 0.0153 <.0001 <.0001 0.0564 0.0016 0.0334 <.0001
MC×T <.0001 <.0001 <.0001 <.0001 <.0001 0.4202 0.8013 <.0001 <.0001
SWF×MC×T <.0001 <.0001 0.0526 <.0001 <.0001 0.714 0.2371 0.3335 0.0044
†SWF – Soy white flakes; MC – Moisture content of the blend; T- Barrel temperature.

57
Figure 2.1 Schematic representation of screw in a single screw extruder

58
Figure 2.2 Schematic representation of laboratory extruder (Brabender Plasti-Corder,
Model PL 2000)

59
CHAPTER 3 †
Effect of Extrusion Processing Parameters on Physical Properties of Soy White
Flakes and High Protein Distillers Dried Grains-Based Extruded Aquafeeds
3.1 Abstract
Nutritionally balanced ingredient blends for catla (Catla catla), belonging to the
family Cyprinidae, were extruded using single screw extruder. The extrusion was carried
out at five levels of soy white flakes content (21%, 29%, 40%, 52%, and 59%db), five
levels of moisture content (15, 19, 25, 31, and 35% db) and five levels of barrel
temperature (100, 110, 125, 140, and 150ºC) using three different die nozzles (having
L/D ratios 3.33, 5.83, and 7.25).Blends with net protein content of 32.5% contains soy
white flakes, along with high protein distillers dried grains (HP-DDG), corn flour, corn
gluten meal, fish meal, vitamin, and mineral mix. A central composite rotatable design
(CCRD) and response surface methodology (RSM) was used to investigate the
significance of independent and interaction effects of the extrusion process variables on
the extrudates physical properties namely pellet durability index, bulk density, water
absorption and solubility indices and expansion ratio. Quadratic polynomial regression
equations were developed to correlate the product responses and process variables as well
as to obtain the response surfaces plots. The independent variables had significant (P<
0.05) effects on physical properties of extrudates: (i) higher soy white flakes content
increased the pellet durability index and water absorption index, but decreased the water
solubility index, (ii) higher temperature decreased pellet durability index, bulk density
† Singh, S.K. and Muthukumarappan, K., 2014. Effect of different extrusion processing parameters on
physical properties of soy white flakes and high protein distillers dried grains-based extruded
aquafeeds. Journal of Food Research, 3(6), p.107. DOI: 10.5539/jfr.v3n6p107

60
and water solubility index, (iii) increased L/D ratio from 3.33 to 7.25 increased the pellet
durability index, expansion ratio but decreased the bulk density of the extrudates.
3.2 Introduction
In the food producing industries, aquaculture is one of the fastest growing sectors
(FAO, 2012) and plays a pivotal role for the maintenance of commercial fishery markets
(O’Mahoney et al., 2011). In aquaculture, diet is often the single largest operating cost
item and can represent over 50% of the operating costs in intensive aquaculture (El-
Sayed, 1999, 2004). Protein is the most important nutrient of the fish feed. The main
protein source used in aquafeed production is primarily fish meal which is supplied
through the consumption of wild fish stocks. Indubitably, with the increasing rate of
farmed fish production (FAO, 2009) and consequently rising prices of fishmeal (Hardy,
2010), the continued use of fishmeal as the main protein source of the feed will no
longer be ecologically and economically sustainable in the long run. Therefore,
aquaculture industry now is focusing on alternative protein sources such as plant proteins
as inexpensive source of protein to minimize production cost.
Soy white flakes and High Protein - Distiller Dried Grains (HP-DDG) contain
significant amount of protein and are thus a possible alternative source of protein for
aquaculture feeds (Kim et al., 1989; Wu et al., 1994; Wu et al., 1996). Use of soy
products like full fatted soybean meal, defatted toasted soybean meal (SBM) and defatted
untoasted soybean meal or soy white flakes is becoming common (Fallahi et al., 2012).
Romarheim et al. (2005) found that extrusion of soy white flakes diet increased the
digestibility of protein and all amino acids compared to the unextruded soy white flakes
diet probably due to the reduction in trypsin inhibitor activity. Dersjant-Li (2002)

61
reported that soy protein isolate can be used to replace 40-100% fish meal without
negative impact on growth performance of shrimp. Distillers Dried Grains (DDG) and
Distillers Dried Grains with Solubles (DDGS), a co-product from corn-based dry grind
fuel ethanol manufacturing, is also a viable protein source. Research carried out by Wu et
al. (1994); Wu et al. (1996) indicated that tilapia fish can be grown with DDGS, and can
improve the economic viability of aquaculture farms.
Extrusion cooking is widely used in the food and feed industries because of
versatility during processing and the ability to produce various final textural properties
(Mercier et al., 1989b). Extruded aquafeed are designed to floater sink based on the fish
species requirement. One of the important quality parameters for fish feed is floatability
(Bandyopadhyay and Rout, 2001; Rolfe et al., 2001) which depends on the unit density
of extrudates. During extrusion cooking, the extent of expansion affects the unit density
of the extrudates. Expansion can be monitored by changing the nature and type of
ingredients used and the extruder process parameters. In the food industry, puffed
products are often produced by using starch based ingredients, while texturized products
are often produced by using protein based ingredients (Kokini et al., 1992). Extrudate
properties of starch based products depend on the extent of gelatinization occurring
inside the extruder barrel. The formation of elastic melt inside the barrel depends on the
extent of gelatinization. (Case et al., 1992; Ibanoglu et al., 1996; Ilo et al., 1996; Lin et
al., 2000; Sokhey et al., 1994). Expansion occurs due to the flashing of water vapor when
the elastic melt exits through the die nozzle. (Alves et al., 1999; Lam and Flores, 2003).
On the other hand, ingredients with higher protein content shows limited degree of
expansion due to plastic melt formation and protein denaturation inside the extruder

62
barrel. The material is in plastic and homogeneous state and when it exits through the die
nozzle there is a sudden pressure drop resulting in the formation of voids. Due to this
void formation the final product becomes more porous and fibrous textured (Gwiazda et
al., 1987; Prudêncio-Ferreira and Arêas, 1993; Singh et al., 1991). Depending on the type
of species, aquaculture feed requires 26 to 50% protein content (Lovell, 1989).
Extrusion process depends on many factors which includes the pressure developed
inside the die and the degree to which the screw is filled. These variables in combination
with the type and composition of raw ingredients used, affects operational capabilities
(Mercier et al., 1989b). Extruder die too have an impact on the processing conditions. For
example, in case of circular dies, nozzle dimensions (i.e., nozzle diameter and length) will
affect process conditions and performance (Chinnaswamy and Hanna, 1987). In a recent
study, we performed initial investigation of the effect of inclusion of 30% soy white
flakes for the production of feed pellets for catla (Singh and Muthukumarappan, 2014b).
The objective of this study was to examine the effect of varying level of soy white
flakes as the fish meal replacer, barrel temperature, die aspect ratio, and moisture content
on physical properties of soy white flakes and HP-DDG based extrudates.
3.3 Materials and Methods
3.3.1 Blends Preparation
Five isocaloric (302 kcal/100g) different blends were adjusted to a target protein
content of ~ 32.5% db and a target fat content of ~ 3.5%.The total energy content for
each blend was determined based on the fraction of protein, lipid and carbohydrate
contributing to the dietary energy. The total energy content was calculated based on the
energy content of fractions namely, 4.5 kcal/g for protein, 9.1 kcal/g for lipid and 4.1

63
kcal/g for carbohydrate. The ingredient components of the feed blends are provided in
Table 3.1. Soy white flakes was kindly donated by South Dakota Soybean Processors,
Volga, SD. HP-DDG was obtained from the Dakota Ethanol LLC (Wentworth, SD). Corn
gluten meal and fishmeal were purchased from Consumer Supply Distributing Co. (Sioux
City, IA). Corn flour was from Cargill Dry Ingredients (Paris, IL). Vitamin and mineral
premix was obtained from Lortscher Agri Service, Inc. (Bern, Kansas, USA). Soybean oil
was provided from USDA (Brookings, SD). The different ingredients were mixed in a
laboratory model Hobart mixer (Hobart Corporation, Troy, Ohio, USA) for 10 minutes;
the moisture content of the ingredient mix was adjusted by adding required quantities of
water during mixing. The resulting blends were then stored at ambient temperature
overnight until processing.
3.3.2 Extrusion Processing
Extrusion experiments were performed using a single screw extruder (Brabender
Plasti-Corder, Model PL 2000, South Hackensack, NJ), which was powered by a 7.5 hp
motor with an operating range of screw speeds from 0-210 rpm. The extruder had a barrel
length-to-diameter ratio of 20:1 and a barrel diameter of 19 mm. A uniform 19.05 mm
pitch screw with compression ratio of 3:1 was used in the experiments (Figure 3.1). The
screw had a variable flute depth, with a depth at the feed portion of 19.05 mm, and near
the die of 3.81 mm. The raw materials were fed manually to the extruder in constant
quantities. Experiments were conducted using five levels of soy white flakes(21, 29, 40,
52, and 59% db), five levels of temperature gradient in the barrel (45-100-100oC, 45-110-
110oC, 45-125-125
oC, 45-140-140
oC, and 45-150-150
oC) hereafter referred as
temperature of 100, 110, 125, 140, and 150oC, and five levels of moisture content (15, 19,

64
25, 31, and 35% db), for three different die nozzles with various L/D ratios (3.33, 5.83
and 7.25) (Table 3.2). During the experiment the screw speed of extruder was maintained
at 150 rpm.
3.3.3 Experimental Design and Statistical Analysis
In the present study, a central composite rotatable design (CCRD) was used to
evaluate the effect of soy white flakes, moisture content, temperature and L/D of die
nozzle on the physical properties of the extrudate. Pellet durability index, bulk density,
water absorption and solubility indices and expansion ratio of the extrudates were
measured as the response/dependent variables. The measurements were completed in
triplicate, except for expansion ratio, which were measured with ten replications. The
collected data were then analyzed with Proc GLM procedure to determine the treatment
combination effects using SAS v9.3 (SAS Institute, Cary, NC). Then post hoc LSD tests
were used to determine where the specific differences occurred. The experimental design
was developed using Design-Expert 8.0.7.1 (Statease, Minneapolis, MN), which
consisted of 3 numerical independent variables of soy white flakes (X1), moisture content
(X2) and T (X3) each at five levels and one categorical variable of die nozzle
configuration (X4) at three levels. The experimental design points (in coded and actual
values) are shown in Table 3.3. Using Eq. (3.1), the numerical independent variables in
actual form (X1, X2) were converted to their coded form (x1, x2).
(X X )i oxi X
(3.1)
where xi is the dimensionless coded value of the ith
independent variable, and Xi, X0, and
ΔX correspond to the actual value, actual value at the center point, and the step change of
the ith
variable, respectively.

65
For each categorical variable, 20 experiments were performed in randomized
order including six replications at the design center to obtain an accurate estimation of the
experimental error (Table 3.4). The pellet durability index (YPDI), bulk density (YBD),
water absorption index (YWAI), water solubility index (YWSI) and expansion ratio (YER)
were taken as the five responses of the designed experiments. The quadratic polynomial
equation was used to describe the effect of the independent variables in terms of linear,
quadratic and their interactions on the dependent variables as given by Eq. (3.2).
4 4 3 42
1 1 1 1i o i i ii i ij i j
i i i j i
Y b b X b X b X X
(3.2)
where Yi is the predicted response; b0 is the interception coefficient; bi, bii, and bij are
coefficients of the linear, quadratic, and interaction terms; 𝜀is the random error; and Xi is
the independent variables studied. The fitness of the model was evaluated and the
interactions between the independent and dependent variables were identified by using an
analysis of variance (ANOVA) presented in Table 3.5 and Table 3.6. The goodness of fit
of the second order equation was expressed by the coefficient of determination (R2) and
its statistical significance was determined by F-test (Table 3.7). 3D response surfaces
were used to visualize interactive effects of the independent variables.
3.3.4 Measurement of Physical Properties
3.3.4.1 Pellet Durability Index
Approximately 100g of extrudates from each blend were manually sieved (U.S.A.
standard testing, ASTM E-11 specification, Daigger, Vernon Hills, IL) to remove initial
fines, and then tumbled in a pellet durability tester (Model PDT-110, Seedburo
Equipment Company, Chicago, IL) for 10 min. Afterwards, the samples were again

66
sieved, and then weighed on an electronic balance (Explorer Pro, Model: EP4102, Ohaus,
Pine Brook, NJ). Pellet durability index (PDI) was calculated following the Eq. (3.3):
100a
b
MPDI
M
(3.3)
where, Ma was the mass (g) after tumbling and Mb was the sample mass (g) before
tumbling.
3.3.4.2 Bulk Density
Bulk density was determined as the ratio of the mass of extrudates that they filled
up to a given bulk volume and measured using a standard bushel tester (Seedburo
Equipment Company, Chicago, IL) following the method recommended by USDA
(1999).
3.3.4.3 Water Absorption Index and Water Solubility Index
Extrudates were ground to fine powders using a coffee grinder (Black & Decker®
Corporation, Towson, ML, USA). The ground extrudates (2.5g) was suspended in
distilled water (30 mL) in a tarred 60 mL centrifuge tube. The suspension was stirred
intermittently and centrifuged at 3000g for 10 min. The supernatant was decanted into a
tarred aluminums cup and dried at 135ºC for 2 h (AACC, 2000). The weight of the gel
remaining in the centrifuge tube was measured. The water absorption index and water
solubility index were calculated by Eq. (3.4) and (3.5), respectively:
g
ds
WWAI(unitless )
W (3.4)
where, Wg is the weight of gel (g), and Wds is the weight of dry sample (g).
100ss
ds
WWSI(%)
W
(3.5)

67
where, Wss is the weight of dry solids of supernatant (g), and Wds is the weight of dry
sample (g).
3.3.4.4 Expansion Ratio
The radial expansion ratio of the extrudates was measured as the ratio of the
diameter of the extrudates to the diameter of the die orifice.
3.4 Results and Discussion
Response surface methodology (RSM) was used to analyze the relationship
between the dependent and independent variables. The predictive models in coded terms
(i.e., YPDI, YBD, YWSI and YER) are presented in Table 3.7. On the contrary, the final
equations in actual form are defined for each type of categorical factor separately. The
final equations in actual form obtained for pellet durability index (YPDI), bulk density
(YBD), water solubility index (YWSI) and expansion ratio (YER) for each level of categoric
variable (D1, D2 and D3) are given in Table 3.8.
Overall, changing the level of temperature content significantly affected (P<0.05)
all the resulting physical properties. Changing the level of moisture content significantly
affected (P<0.05) all the resulting physical properties except pellet durability index.
Whereas, changing soy white flakes content significantly affected (P<0.05) pellet
durability index, water absorption and solubility indices (Table 3.5 and Table 3.6). The
behavior observed for the treatment combinations were produced due to the various
competing interaction effects (Table 3.9 and Table 3.10).
3.4.1 Pellet Durability Index
The response surface plot presented (Figure 3.2) showed that for all L/D ratio, the
pellet durability index of extrudates increased on increasing soy white flakes content and

68
decreasing temperature. ANOVA showed that moisture content had no significant effect
on pellet durability index and hence response surface plots of interaction effect involving
moisture content are not shown. Lack of fit was not significant relative to the pure error,
which meant the model was well fitted. The regression equation for pellet durability
index in coded and actual form is shown in Table 3.7 and Table 3.8, respectively.
The values of pellet durability index of extruded products under experimental
conditions are presented in Table 3.9 and Table 3.10. The maximum and minimum pellet
durability index values were related to the treatments with 40% soy white flakes, 25%
moisture content, 125°C barrel temperature, 3.33 L/D and 21% soy white flakes, 25%
moisture content, 125°C barrel temperature, 5.83 L/D ratio, respectively.
3.4.2 Bulk Density
The response surface plot presented (Figure 3.3) showed that for all L/D ratio, the
bulk density of extrudates decreased with an increasing of moisture content and
temperature. A significant decrease in bulk density was observed when length to diameter
ratio of die was increased from 3.33 to 7.25. ANOVA showed that soy white flakes had
no significant effect on bulk density and hence response surface plots of interaction effect
involving soy white flakes are not shown. The regression equation for bulk density in
coded and actual form is shown in Table 3.7 and Table 3.8, respectively.
The treatment combination effects of soy white flakes, moisture content,
temperature and L/D ratio on bulk density of extrudates are presented in Table 3.9 and
Table 3.10. The lowest bulk density, 0.32 g/cm3 , was recorded at 29% soy white flakes,
temperature of 140ºC, moisture content of 31%, L/D of 7.25 and at 59% soy white flakes,
temperature of 125ºC, moisture content of 25%, L/D ratio of 7.25; and the highest bulk

69
density of 0.57 g/cm3, was obtained at 40% soy white flakes, temperature of 125°C,
moisture content of 15%, and L/D of 3.33.
3.4.3 Water Absorption Index
Soy white flakes, moisture content and temperature significantly affected the
water absorption index through a linear model (response surface plots were prepared but
not shown due to linear model and to reduce the manuscript size). ANOVA analysis
demonstrated that the linear model was significant (P< 0.05). Increasing the soy white
flakes content from 21% to 52%, there was a significant increase of in water absorption
index. Water absorption index was found to increase when temperature was raised from
100ºC to 150ºC. With extruded corn grits, a similar trend was observed by (Anderson et
al., 1969). Furthermore, water absorption index also increased when moisture content
level of the feed was increased from 15% to 35%. This was in agreement with Williams
et al. (1977) who observed that higher temperature and drier conditions could result in
higher dextrinization, which could lead to a decreased extrudate water absorption index
and higher extrudate water solubility index. According to Mason and Hoseney (1986),
water absorption index indicates the part of the starch that was not affected by the
extrusion cooking and maintained its internal structure. The experimental values of water
absorption index of extrudates under different designed extrusion conditions are
presented in Table 3.9 and Table 3.10.
3.4.4 Water Solubility Index
Changing the level of soy white flakes, moisture content of ingredient mix and
barrel temperature had significant effect (P< 0.05) on water solubility index (Table 3.6).
Williams et al. (1977) reported that there was an inverse relationship between the water

70
absorption index and water solubility index values of the extrudates. Similarly, in this
study the water solubility index at 15% moisture content was higher compared to the
water solubility index at 35% moisture content. Increasing the barrel temperature from
100 to 150 ºC resulted in decrease in water solubility index. In another study, Chevanan
et al. (2007a) reported that there was no significant change in water solubility index of
the DDGS-based extrudates due to the change in extruder barrel temperature. Increasing
the soy white flakes content initially led to a significant decrease in water solubility index
and then further increase in soy white flakes level resulted in slight increase in water
solubility index. An inverse relationship between the water solubility index and water
absorption index values was observed. This observation was in agreement with what
Anderson et al. (1970), Williams et al. (1977) and Fallahi et al. (2012); Fallahi et al.
(2013) reported.
ANOVA analysis showed that quadratic effect of soy white flakes significantly
affected water solubility index and all linear effects including soy white flakes, moisture
content and temperature had significant effect on water solubility index. The interaction
effect of soy white flakes, moisture content and temperature at L/D ratio at 7.25 on water
solubility index was maximum and since L/D ratio does not significantly affect the water
solubility index, the response surface plots of water solubility index at L/D ratio 7.25 are
shown (Figure 3.4). Water solubility index is found to increase when temperature and soy
white flakes content, temperature and moisture content, and moisture content and soy
white flakes content are decreased (Figure 3.4). Lack of fit was not significant relative to
the pure error, which meant the model was well fitted. The regression equation for the

71
empirical relationship between water solubility index and the independent extrusion
processing variables for each L/D ratio is shown in Table 3.8.
3.4.5 Expansion Ratio
The extent of puffing of extruded products is indicated by the expansion ratio. The
response surface plot presented in Figure 3.5 showed that for all L/D ratio, the expansion
ratio of extrudates increased with an increasing moisture content and after reaching a
maximum the expansion ratio decreased with further increasing in moisture content. The
expansion ratio of extrudates increased for L/D ratio 5.83 and 7.25 but decreased for L/D
ratio 3.33 with increase in temperature. ANOVA showed that soy white flakes had no
significant effect on expansion ratio and hence response surface plots of interaction effect
involving soy white flakes are not shown. The regression equation for the relationship
between expansion ratio and independent variables in terms of coded and actual form for
each L/D ratio is shown in Table 3.7 and Table 3.8, respectively. Increasing the level of
moisture content of ingredient mix and temperature had a significant effect on expansion
ratio of extrudates.
The experimental values of expansion ratio of extrudates under different designed
extrusion conditions are shown in Table 3.9 and Table 3.10. The maximum and minimum
expansion ratio were achieved at 52% soy white flakes, 19% moisture content,140ºC, and
7.25 L/D ratio and 40% soy white flakes, 25% moisture content, 150ºC temperature, and
3.33 L/D ratio, respectively.
3.5 Conclusions
This experimental study was conducted to investigate the effect of various
extrusion processing conditions on the soy white flakes and HP-DDG based extrudates.

72
Overall, it can be concluded that increasing the level of soy white flakes from 21% to
59%, resulted in increase of pellet durability and water absorption index. Increasing L/D
ratio from 3.33 to 7.25 resulted in increase in pellet durability index, expansion ratio, but
a decrease in bulk density of the extrudates. The increase in pellet durability indicates
that the aquaculture feed could resist mechanical damage during transportation and
storage. Significant decrease in bulk density (P<0.001) due to increase in L/D ratio is
desirable for storage purpose. Further studies should aim for the production of
aquaculture feed with incorporation of soy white flakes levels between 20% and 60% db
at different screw speeds and should optimize processing conditions.

73
Table 3.1 Blend composition of feed.
Ingredients Blend 1 Blend 2 Blend 3 Blend 4 Blend 5
Soy white flakes 21 29 40 52 59
HP-DDG 39 32 20 9 1
Corn gluten meal 2 2 2 2 2
Corn flour 30 30 30 30 30
Fish meal 5 5 5 5 5
Soybean oil 1 1 1 1 1
Vitamin & mineral mix 2 2 2 2 2
†HP-DDG – High protein distiller’s dried grain

74
Table 3.2 Dimensions of die used in this study.
Die No. Diameter of nozzle (L) Length of nozzle (D) L/D ratio
(mm) (mm) (-)
D1 6 20.0 3.33
D2 3 17.5 5.83
D3 2 14.5 7.25
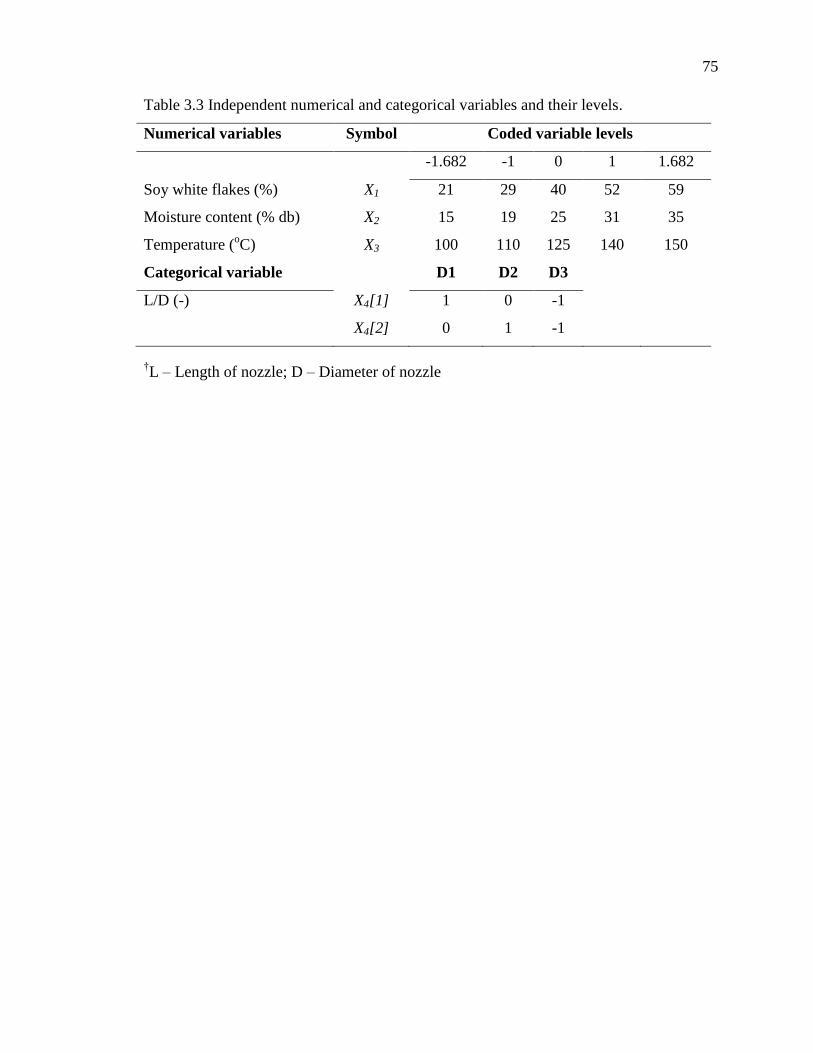
75
Table 3.3 Independent numerical and categorical variables and their levels.
Numerical variables Symbol Coded variable levels
-1.682 -1 0 1 1.682
Soy white flakes (%) X1 21 29 40 52 59
Moisture content (% db) X2 15 19 25 31 35
Temperature (oC) X3 100 110 125 140 150
Categorical variable D1 D2 D3
L/D (-) X4[1] 1 0 -1
X4[2] 0 1 -1
†L – Length of nozzle; D – Diameter of nozzle

76
Table 3.4 Experimental design layout.
Run Coded variables Actual variables Run Coded variables Actual variables
x1 x2 x3 x4 X1 X2 X3 X4 x1 x2 x3 x4 X1 X2 X3 X4
x4[1] x4[2] (%) (% db) (oC) (-) x4[1] x4[2] (%) (% db) (
oC) (-)
1 0 0 -1.682 1 0 40 25 100 D1 31 0 0 0 0 1 40 25 125 D2 2 0 0 0 0 1 40 25 125 D2 32 -1 1 1 0 1 29 31 140 D2
3 -1 -1 1 1 0 29 19 140 D1 33 1 -1 -1 1 0 52 19 110 D1
4 1.682 0 0 1 0 59 25 125 D1 34 0 0 0 -1 -1 40 25 125 D3
5 1 -1 -1 0 1 52 19 110 D2 35 1 1 -1 -1 -1 52 31 110 D3
6 0 0 0 1 0 40 25 125 D1 36 0 0 -1.682 0 1 40 25 100 D2
7 1 1 -1 0 1 52 31 110 D2 37 0 1.682 0 1 0 40 35 125 D1
8 1 -1 1 0 1 52 19 140 D2 38 0 -1.682 0 1 0 40 15 125 D1
9 0 0 0 -1 -1 40 25 125 D3 39 0 0 0 1 0 40 25 125 D1
10 1 -1 1 1 0 52 19 140 D1 40 -1 1 1 1 0 29 31 140 D1
11 -1 1 -1 0 1 29 31 110 D2 41 0 0 0 0 1 40 25 125 D2
12 1 1 1 1 0 52 31 140 D1 42 0 1.682 0 -1 -1 40 35 125 D3
13 0 0 1.682 0 1 40 25 150 D2 43 1.682 0 0 -1 -1 59 25 125 D3
14 -1 -1 -1 0 1 29 19 110 D2 44 -1 -1 1 0 1 29 19 140 D2
15 0 0 0 -1 -1 40 25 125 D3 45 0 0 0 0 1 40 25 125 D2
16 1 -1 1 -1 -1 52 19 140 D3 46 0 0 0 0 1 40 25 125 D2
17 -1 1 -1 1 0 29 31 110 D1 47 0 0 0 1 0 40 25 125 D1
18 0 0 0 -1 -1 40 25 125 D3 48 1 1 1 0 1 52 31 140 D2
19 -1.682 0 0 1 0 21 25 125 D1 49 0 0 0 1 0 40 25 125 D1
20 -1 -1 -1 -1 -1 29 19 110 D3 50 -1 1 -1 -1 -1 29 31 110 D3
21 0 0 0 1 0 40 25 125 D1 51 -1.682 0 0 -1 -1 21 25 125 D3
22 0 -1.682 0 0 1 40 15 125 D2 52 0 0 1.682 -1 -1 40 25 150 D3
23 0 0 -1.682 -1 -1 40 25 100 D3 53 0 1.682 0 0 1 40 35 125 D2
24 -1 -1 -1 1 0 29 19 110 D1 54 0 -1.682 0 -1 -1 40 15 125 D3
25 1.682 0 0 0 1 59 25 125 D2 55 1 1 1 -1 -1 52 31 140 D3
26 0 0 0 -1 -1 40 25 125 D3 56 0 0 0 1 0 40 25 125 D1
27 1 1 -1 1 0 52 31 110 D1 57 1 -1 -1 -1 -1 52 19 110 D3
28 0 0 0 -1 -1 40 25 125 D3 58 -1 -1 1 -1 -1 29 19 140 D3
29 -1.682 0 0 0 1 21 25 125 D2 59 -1 1 1 -1 -1 29 31 140 D3
30 0 0 0 0 1 40 25 125 D2 60 0 0 1.682 1 0 40 25 150 D1

77
Table 3.5 Analysis of Variance (ANOVA) for pellet durability index and bulk density.
Source df Pellet durability index Bulk density
SS MS F value P-value SS MS F value P-value
Model 17 702.94 41.35 6.41 < 0.0001 1.93×10⁻¹
1.13×10⁻²
16.54 < 0.0001
X1 1 77.83 77.83 12.06 0.0012 7.18×10⁻⁴
7.18×10⁻⁴
1.05 0.3117
X2 1 17.18 17.18 2.66 0.1102 9.79×10⁻³
9.79×10⁻³
14.30 0.0005
X3 1 203.67 203.67 31.56 < 0.0001 2.61×10⁻²
2.61×10⁻²
38.06 < 0.0001
X4 2 198.72 99.36 15.40 < 0.0001 1.24×10⁻¹
6.19×10⁻²
90.37 < 0.0001
X12 1 0.58 0.58 0.09 0.7663 5.95×10
-6 5.95×10
-6 0.01 0.9262
X22
1 105.47 105.47 16.35 0.0002 1.28×10⁻²
1.28×10⁻²
18.66 < 0.0001
X32 1 5.40 5.40 0.84 0.3654 4.65×10
-5 4.65×10
-5 0.07 0.7956
X1X2 1 10.60 10.60 1.64 0.2071 5.00×10⁻⁴
5.00×10⁻⁴
0.73 0.3979
X1X3 1 1.64 1.64 0.25 0.6169 1.23×10⁻⁵
1.23×10⁻⁵
0.02 0.8939
X1X4 2 32.82 16.41 2.54 0.0907 5.14×10⁻³
2.57×10⁻³
3.75 0.0316
X2X3 1 1.55 1.55 0.24 0.6270 2.96×10⁻⁴
2.96×10⁻⁴
0.43 0.5146
X2X4 2 7.67 3.84 0.59 0.5565 6.50×10⁻⁴
3.25×10⁻⁴
0.47 0.6254
X3X4 2 40.41 20.20 3.13 0.0540 1.27×10⁻²
6.36×10⁻³
9.29 0.0005
Residual 42 271.01 6.45 - - 2.88×10⁻²
6.85×10⁻⁴
- -
Lack of fit 27 202.96 7.52 1.66 0.1536 2.37×10⁻²
8.76×10⁻⁴
2.58 0.0291
Pure error 15 68.05 4.54 - - 5.10×10⁻³
3.40×10⁻⁴
- -
†df – degree of freedom, SS – Sum of squares, MS – Mean square.

78
Table 3.6 Analysis of Variance (ANOVA) for water solubility index and expansion ratio.
Source df Water solubility index Expansion ratio
SS MS F value P-value SS MS F value P-value
Model 17 22.25 1.31 2.77 0.0037 4.20×10⁻¹
2.50×10⁻²
13.22 < 0.0001
X1 1 2.91 2.91 6.15 0.0172 3.38×10⁻³
3.38×10⁻³
1.82 0.1842
X2 1 3.64 3.64 7.71 0.0082 2.20×10⁻²
2.20×10⁻²
11.65 0.0014
X3 1 6.22 6.22 13.17 0.0008 2.50×10⁻²
2.50×10⁻²
13.71 0.0006
X4 2 0.25 0.12 0.26 0.7700 2.30×10⁻¹
1.10×10⁻¹
61.92 < 0.0001
X12 1 6.12 6.12 12.95 0.0008 5.14×10
-3 5.14×10
-3 2.77 0.1035
X22
1 1.27 1.27 2.68 0.1090 3.10×10⁻²
3.10×10⁻²
16.76 0.0002
X32 1 0.19 0.19 0.41 0.5277 2.20×10
-2 2.20×10
-2 11.94 0.0013
X1X2 1 0.21 0.21 0.45 0.5055 5.12×10⁻³
5.12×10⁻³
2.76 0.1039
X1X3 1 0.61 0.61 1.30 0.2604 8.62×10⁻⁴
8.62×10⁻⁴
0.46 0.4991
X1X4 2 0.05 0.03 0.06 0.9452 1.10×10⁻²
5.74×10⁻³
3.10 0.0557
X2X3 1 0.00 0.00 0.00 0.9927 5.55×10⁻⁴
5.55×10⁻⁴
0.30 0.5871
X2X4 2 1.35 0.68 1.43 0.2501 3.13×10⁻³
1.57×10⁻³
0.84 0.4371
X3X4 2 0.08 0.04 0.09 0.9160 6.50×10⁻²
3.30×10⁻²
17.58 < 0.0001
Residual 42 19.84 0.47 - - 7.80×10⁻²
1.85×10⁻³
- -
Lack of fit 27 15.87 0.59 2.22 0.0541 6.60×10⁻²
2.45×10⁻³
3.16 0.0114
Pure error 15 3.97 0.26 - - 1.20×10⁻²
7.76×10⁻⁴
- -
†df – degree of freedom, SS – Sum of squares, MS – Mean square.

79
Table 3.7 Final equation in terms of coded factors after excluding the insignificant terms for pellet durability index, bulk density,
water solubility index and expansion ratio.
Coded model equations R2 AdjR
2 PredR
2 Adeq. precision
YPDI = +89.91+1.38x1-2.23x3-1.86x4[1]-0.61x4[2]+1.56x22 0.72 0.61 0.36 9.98
YBD = +0.42 - 0.015x2 - 0.025x3 + 0.058x4[1] - 4.89×10-3
x4[2]
+ 1.92×10-3
x1x4[1]+0.013x1x4[2] + 0.02x3x4[1]
+ 2.87×10-3
x3x4[2]+ 0.017x22
0.87 0.82 0.69 19.03
YWSI = +14.07 - 0.27x1 - 0.30x2 - 0.39x3 + 0.38x12 0.53 0.34 -0.09 6.52
YER = +1.19 - 0.023x2 + 0.025x3 - 0.081x4[1] + 0.013x4[2]
- 0.056x3x4[1] + 0.023x3x4[2] - 0.027x22 - 0.023x3
2 0.84 0.78 0.62 14.85
†PDI – Pellet durability index; BD – Bulk density; WAI – Water absorption index; WSI – Water solubility index; ER – Expansion
ratio.

80
Table 3.8 Best-fit response surface models for extrudate physical properties.
L/D Response Surface Model R2
Std.
Deviation
F
Statistic
D1 YPDI = +155.64 + 0.10X1 - 3.14X2 - 0.46X3 + 0.01X1X2 - 1.51×10-3
X1X3 + 2.94×10-3
X2X3 - 8.74×10-4
X12 + 0.05X2
2
+1.57×10-3
X32
0.72 2.54 6.41
YBD = +0.81 + 1.51×10-3
X1 - 0.02X2- 6.48×10-4
X3 - 6.90×10-5
X1X2 + 4.15×10-6
X1X3 - 4.07×10-5
X2X3+ 2.80×10-6
X12
+ 5.20×10-4
X22 + 4.61×10
-6X3
2
0.87 0.026 16.54
YWSI = +30.07 - 0.17X1- 0.41X2 - 0.07X3 + 1.42×10-3
X1X2 - 9.28×10-4
X1X3 - 1.50×10-5
X2X3 + 2.84×10-3
X12 +
5.18×10-3
X22+ 2.96×10
-4X3
2
0.53 0.69 2.77
YER = -0.97 + 0.02X1 + 0.04X2 + 0.02X3 - 2.21×10-4
X1X2 - 3.47×10-5
X1X3 + 5.58×10-5
X2X3 - 8.24×10-5
X12 - 8.11×10
-
4X2
2- 1.01×10
-4X3
2
0.84 0.043 13.22
D2 YPDI = +172.09 + 0.23X1 - 3.29X2 - 0.59X3 + 0.01X1X2 - 1.51×10-3
X1X3 + 2.94×10-3
X2X3- 8.74×10-4
X12 + 0.05X2
2
+1.57×10-3
X32
0.72 2.54 6.41
YBD = +0.82 + 2.45×10-3
X1 - 0.02X2 - 1.80×10-3
X3 - 6.90×10-5
X1X2 + 4.15×10-6
X1X3 - 4.07×10-5
X2X3 + 2.80×10-6
X12
+ 5.20×10-4
X22 + 4.61×10
-6X3
2
0.87 0.026 16.54
YWSI= +27.68 - 0.17X1- 0.33X2 - 0.06X3 + 1.42×10-3
X1X2 - 9.28×10-4
X1X3 - 1.50×10-5
X2X3+ 2.84×10-3
X12 + 5.18×10
-
3X2
2+ 2.96×10
-4X3
2
0.53 0.69 2.77
YER = -1.56 + 0.02X1 + 0.04X2 + 0.03X3- 2.21×10-4
X1X2 - 3.47×10-5
X1X3 + 5.58×10-5
X2X3 - 8.24×10-5
X12 - 8.11×10
-
4X2
2 - 1.01×10
-4X3
2
0.84 0.043 13.22
D3 YPDI = +184.83 + 0.05X1 - 3.31X2 - 0.61X3 + 0.01X1X2 - 1.51×10-3
X1X3 + 2.94×10-3
X2X3 - 8.74×10-4
X12 + 0.05X2
2
+1.57×10-3
X32
0.72 2.54 6.41
YBD = +1.09 + 7.74×10-5
X1 - 0.02X2- 3.51×10-3
X3- 6.90×10-5
X1X2 + 4.15×10-6
X1X3- 4.07×10-5
X2X3 + 2.80×10-6
X12 +
5.20×10-4
X22 + 4.61×10
-6X3
2
0.87 0.026 16.54
YWSI = +28.31 - 0.17X1 - 0.36X2- 0.06X3+ 1.42×10-3
X1X2 - 9.28×10-4
X1X3 - 1.50×10-5
X2X3+ 2.84×10-3
X12 + 5.18×10
-
3X2
2 + 2.96×10
-4X3
2
0.53 0.69 2.77
YER = -1.62 + 0.02X1+ 0.04X2 + 0.03X3 - 2.21×10-4
X1X2 - 3.47×10-5
X1X3 + 5.58×10-5
X2X3 - 8.24×10-5
X12 - 8.11×10
-
4X2
2 - 1.01×10
-4X3
2
0.84 0.043 13.22
†L – Length of nozzle; D – Diameter of nozzle

81
Table 3.9 Treatment combination effects for soy white flakes, moisture content of raw
material, temperature and die on extrudate physical properties.
Treatment PDI BD WAI WSI ER
(%) (g/cc) (unitless) (%) (unitless)
1 90.09±0.1816-18
0.46±0.0112-14
3.62±0.0523-25
14.97±0.114-8
1.06±0.0227-29
2 87.49±0.02 23
0.39±0.0021-22
4.70±0.11 5 13.50±0.39
18-23 1.22±0.01
7-11
3 85.30±0.1026-27
0.49±0.014-6
3.72±0.1021-25
14.83±0.414-11
1.06±0.0127-29
4 85.93±0.79 25
0.47±0.019-11
5.14±0.113-4
13.56±0.2017-22
1.12±0.0118-23
5 97.03±0.132-3
0.48±0.016-9
4.34±0.127-9
14.48±0.257-14
1.131±0.008-22
6 89.75±0.2817-18
0.48±0.008-10
4.81±0.10 5 13.15±0.21
22-24 1.09±0.02
23-27
7 95.61±0.474-5
0.44±0.0114-16
4.64±0.145-6
14.29±0.4010-16
1.07±0.0226-28
8 92.01±0.16 14
0.49±0.014-5
5.39±0.06 2 13.31±0.18
21-24 1.16±0.02
15-18
9 90.94±0.14 15
0.33±0.00 25
4.15±0.1210-15
13.85±0.3815-21
1.32±0.01 2
10 88.00±0.3022-23
0.50±0.02 4 4.23±0.07
8-12 14.43±0.18
7-16 1.03±0.01
30-31
11 90.51±0.6315-16
0.45±0.0113-15
3.54±0.1425-26
14.88±0.324-10
1.08±0.0226-28
12 92.36±0.1113-14
0.49±0.014-7
5.16±0.083-4
13.40±0.3219-24
0.96±0.01 32
13 81.75±0.15 30
0.33±0.01 25
5.30±0.052-3
12.83±0.23 24
1.29±0.022-3
14 90.80±0.17 15
0.38±0.01 22
4.29±0.147-11
13.83±0.2616-21
1.10±0.0121-26
15 92.01±0.21 14
0.34±0.0124-25
5.04±0.14 4 12.94±0.34
23-24 1.28±0.02
3-5
16 90.21±0.2216-17
0.34±0.0124-25
5.59±0.05 1 12.91±0.11
23-24 1.41±0.02
1
17 90.17±0.4216-17
0.47±0.008-11
3.71±0.0822-25
14.57±0.257-13
1.05±0.0028-31
18 93.13±0.2510-12
0.36±0.01 23
4.47±0.016-7
13.262±0.251-24
1.28±0.023-4
19 84.29±0.41 28
0.46±0.0011-13
3.10±0.1328-29
15.19±0.363-6
1.08±0.0025-27
20 97.54±0.19 2 0.47±0.01
10-12 3.15±0.07
28-29 15.27±0.28
3-5 1.15±0.01
16-19
21 90.16±0.2216-17
0.50±0.01 4 3.93±0.14
16-20 14.25±0.18
11-16 1.10±0.01
21-26
22 96.71±0.14 3 0.49±0.00
4-6 3.74±0.07
20-23 14.99±0.07
4-7 1.14±0.01
17-20
23 98.11±0.37 1 0.44±0.01
14-16 3.37±0.09
26-27 15.01±0.08
4-7 1.13±0.01
18-21
24 88.91±0.3820-21
0.54±0.00 2 3.03±0.02
29 15.70±0.12
2-3 1.09±0.01
23-27
25 92.25±0.18 14
0.44±0.0016-18
4.04±0.1213-18
15.77±0.331-3
1.19±0.0211-14
26 93.29±0.0510-12
0.38±0.0121-22
4.12±0.0511-15
14.15±0.2512-17
1.25±0.014-7
27 94.84±0.13 6 0.52±0.00
3 4.03±0.09
14-18 14.46±0.12
7-15 1.02±0.01
31
28 92.87±0.3111-13
0.38±0.00 22
4.34±0.157-10
14.35±0.189-16
1.23±0.026-9
29 83.23±0.18 29
0.41±0.0119-20
3.07±0.09 29
16.26±0.181-2
1.19±0.0211-14
30 89.92±0.3617-18
0.43±0.01 18
4.11±0.1211-16
14.04±0.3513-18
1.19±0.0112-15
†The values with the same superscript for a given property are not significantly different
(P< 0.05). PDI – Pellet durability index; BD – Bulk density; WAI – Water absorption
index; WSI – Water solubility index; ER – Expansion ratio.

82
Table 3.10 Treatment combination effects for soy white flakes, moisture content of raw
material, temperature and die on extrudate physical properties (continued).
Treatment PDI BD WAI WSI ER
(%) (g/cc) (unitless) (%) (unitless)
31 85.77±0.1825-26
0.43±0.01 18
3.91±0.1017-21
14.34±0.169-16
1.23±0.026-10
32 85.12±0.43 27
0.40±0.0120-21
4.15±0.1410-15
14.31±0.339-16
1.21±0.028-12
33 93.55±0.079-10
0.53±0.01 2 3.36±0.08
26-27 15.68±0.07
2-3 1.09±0.01
23-27
34 92.81±0.5012-13
0.35±0.01 24
4.03±0.0414-18
14.34±0.169-16
1.24±0.015-8
35 96.72±0.47 3 0.44±0.01
15-17 4.16±0.08
9-14 14.37±0.40
8-16 1.12±0.02
19-24
36 96.03±0.11 4 0.46±0.00
11-13 3.42±0.01
26-27 15.79±0.21
1-3 1.09±0.01
22-27
37 86.19±0.9624-25
0.47±0.0110-12
4.36±0.197-8
13.84±0.2216-21
1.09±0.0123-27
38 94.59±0.356-7
0.57±0.01 1 3.43±0.07
26-27 15.35±0.25
3-4 1.12±0.01
18-23
39 88.43±0.0621-22
0.48±0.025-8
3.90±0.0617-22
14.35±0.179-16
1.12±0.0119-25
40 92.02±0.16 14
0.47±0.009-11
4.07±0.0412-18
13.34±0.3520-24
1.03±0.0129-31
41 93.06±0.1810-12
0.45±0.0114-16
3.55±0.0624-26
14.73±0.275-12
1.16±0.0015-18
42 93.91±0.298-9
0.37±0.00 23
4.08±0.1512-17
14.41±0.187-16
1.12±0.0120-25
43 93.50±0.099-10
0.32±0.01 26
4.11±0.1711-16
15.34±0.233-5
1.26±0.013-6
44 90.18±0.2016-17
0.40±0.0020-21
3.38±0.0226-27
15.62±0.44 3 1.17±0.00
14-17
45 87.75±0.47 23
0.41±0.01 19
4.05±0.1412-18
14.05±0.2813-18
1.19±0.0210-14
46 89.81±0.2517-18
0.43±0.0117-18
3.97±0.0315-19
14.13±0.1912-17
1.18±0.0213-17
47 83.37±0.66 29
0.47±0.008-11
3.63±0.0523-25
14.59±0.216-13
1.13±0.0118-22
48 92.09±0.06 14
0.39±0.0121-22
4.46±0.046-7
14.01±0.3413-18
1.17±0.0113-17
49 89.61±0.2518-19
0.48±0.017-10
3.53±0.0325-26
14.48±0.147-14
1.08±0.0226-28
50 94.88±0.57 6 0.44±0.01
16-18 3.39±0.06
26-27 15.35±0.43
3-4 1.06±0.01
27-30
51 94.58±0.106-7
0.40±0.0119-20
3.01±0.08 29
16.26±0.211-2
1.17±0.0213-17
52 86.59±0.27 24
0.33±0.01 25
3.89±0.0418-22
14.57±0.217-13
1.28±0.023-4
53 93.40±0.229-11
0.44±0.0015-16
4.39±0.017-8
13.98±0.2613-19
1.03±0.0129-31
54 97.46±0.18 2 0.44±0.00
14-16 3.26±0.04
27-28 16.33±0.38
1 1.18±0.01
13-17
55 95.11±0.315-6
0.33±0.01 25
5.02±0.03 4 14.36±0.35
8-16 1.18±0.02
12-16
56 88.81±0.2420-21
0.46±0.0012-14
3.92±0.0417-20
14.41±0.307-16
1.09±0.0224-27
57 98.37±0.61 1 0.44±0.00
14-16 3.74±0.02
20-24 15.32±0.21
3-5 1.20±0.01
9-13
58 94.24±0.197-8
0.34±0.01 25
3.78±0.0219-23
14.92±0.374-9
1.24±0.016-9
59 85.88±0.22 25
0.32±0.00 26
4.23±0.098-13
14.22±0.0712-16
1.25±0.024-7
60 89.17±0.4319-20
0.48±0.008-10
4.37±0.047-8
13.95±0.1814-20
0.90±0.01 33
†The values with the same superscript for a given property are not significantly different
(P< 0.05). PDI – Pellet durability index; BD – Bulk density; WAI – Water absorption
index; WSI – Water solubility index; ER – Expansion ratio.

83
Figure 3.1 Schematic representation of screw in a single screw extruder

84
Figure 3.2 Response surface plots of pellet durability index for the effect of soy white
flakes content and temperature at 25 % db moisture content at different die aspect ratio
(L/D), (A) 3.33, (B) 5.83, and (C) 7.25

85
Figure 3.3 Response surface plots of bulk density for the effect of temperature and
moisture content at 40% db soy white flakes at different die aspect ratio (L/D), (A) 3.33,
(B) 5.83, and (C) 7.25

86
Figure 3.4 Response surface plots of water solubility index at die aspect ratio (L/D) of
7.25 for the effect of (A) temperature and soy white flakes content, (B) temperature and
moisture content and (C) moisture and soy white flakes content

87
Figure 3.5 Response surface plots of expansion ratio for the effect of temperature and
moisture content at 40% db soy white flakes at different die aspect ratio (L/D), (A) 3.33,
(B) 5.83, and (C) 7.25.

88
CHAPTER 4 †
Effect of Feed Moisture, Extrusion Temperature and Screw Speed on Properties of
Soy White Flakes Based Aquafeed: A Response Surface Analysis
4.1 Abstract
Soy white flakes (SWF) is an intermediate product during soy bean processing. It
is untoasted inexpensive product and contains around 51% of crude protein. It can be a
potential source of protein to replace fish meal for developing aquafeed. Extrusion
process is versatile and is used for the development of aquafeed. Our objective was to
study the effects of inclusion of SWF (up to 50%) and other extrusion processing
parameters such as barrel temperature and screw speed on the properties of aquafeed
extrudates using a single-screw extruder.
Extrudate properties including pellet durability index, bulk density, water
absorption and solubility indices and mass flow rate, were significantly (P<0.05) affected
by the process variables. SWF was the most significant variable with quadratic effects on
most of the properties. Increasing temperature and screw speed resulted in increase in
durability and mass flow rate of extrudates. Response surface regression models were
established to correlate the properties of extrudates to the process variables.
SWF was used as an alternate protein source of fish meal. Our study shows that
aquafeed with high durability, lower bulk density and lower water absorption and higher
solubility indices can be obtained by adding SWF up to 40%.
† Singh, S.K. and Muthukumarappan, K., 2015. Effect of feed moisture, extrusion temperature and screw
speed on properties of soy white flakes based aquafeed: a response surface analysis. Journal of the Science
of Food and Agriculture, 96(6), p. 2220-2229. DOI: 10.1002/jsfa.7339

89
4.2 Introduction
Extrusion cooking is an important food and feed processing operation (Harper,
1981; Paton and Spratt, 1984) and is often used to manufacture aquafeeds. In aquaculture
feed production, the important characteristics which affect the quality of fish feed include
pellet size, shape, bulk density, water absorption and solubility, hardness or softness
(Kazamzadeh, 1989). Extrusion increases the feed digestibility, destroys anti-nutritional
compounds and pathogenic microorganisms in the feed and thus, provides feed
manufacturers with the means to improve the quality of their products (Williams, 1991).
During extrusion processing of starch based products, a relatively elastic melt is formed
inside the barrel which results in a more expanded and crispy product (Alves et al., 1999;
Ilo et al., 1996; Lin et al., 1997). During extrusion processing of protein based products, a
plastic melt is formed inside the barrel and a more porous and textured product is formed
(Gwiazda et al., 1987; Prudêncio-Ferreira and Arêas, 1993; Singh et al., 1991). The extent
of gelatinization of starch based products and the formation of more plastic melt of
protein based products depends on various machine parameters like cooking temperature,
rate of shear, screw speed and residence time inside the barrel (Chevanan, 2007).
Aquaculture is one of the fastest growing sector of agriculture and the most
rapidly expanding markets for manufacturing fish feeds (Riaz, 1997). Aquaculture feed
requires protein content of 26 % to 50 % (Lovell, 1989) and hence formulated feed
contains high amounts of both protein and starch. The main protein sources used in aqua
feed production is primarily fishmeal which is supplied through the consumption of wild
fish stocks. Indubitably, with the increasing rate of farmed fish production (FAO, 2009)
and consequently rising prices of fishmeal (Hardy, 2010), the continued use of fishmeal

90
as the main protein source of the feed will no longer be ecologically and economically
sustainable in the long run. Soy white flakes and High Protein - Distiller Dried Grains
(HP-DDG) contains high amount of protein and are thus a possible alternative source of
protein for aquaculture feeds (Kim et al., 1989; Singh and Muthukumarappan, 2014a, b;
Wu et al., 1994; Wu et al., 1996). Use of soy products like full fatted soybean meal,
defatted toasted soybean meal (SBM) and defatted untoasted soybean meal or white
flakes (WF) is becoming common (Fallahi et al., 2012; Singh and Muthukumarappan,
2014a, b). Romarheim et al. (2005)_ENREF_163 found that extrusion of WF diet
increased the digestibility of protein and all amino acids whereas extrusion of fishmeal
and SBM had no significant effect on amino acid digestibility. Distillers Dried Grains
(DDG) and Distillers Dried Grains with Solubles (DDGS), a co-product from corn-based
dry grind fuel ethanol manufacturing, is also viable protein source. Mjoun and
Rosentrater (2011) used DDGS for the development of good quality extruded aquafeed.
Research carried out by Wu et al. (1994); Wu et al. (1996) indicated that tilapia fish can
be grown with DDGS, and can improve the economic viability of aquaculture farms.
Extensive research has been carried out on the effect of moisture content on the extrudate
properties with various kinds of starch or protein based feed materials (Kim et al., 1989;
Lin et al., 2000; Shukla et al., 2005; Sokhey et al., 1994). The screw speed has a definite
effect on residence time; the extent of pressure developed inside the barrel affects the
physical properties of extrudates (Case et al., 1992). Extensive research work has been
carried out on the effect of feed ingredients parameters and machine parameters on either
starch based or protein based products. Our preliminary study on the effect of soy white
flakes inclusion (up to 30%) and varying barrel temperature from 110oC to 170
oC at

91
constant screw speed (150 rpm) resulted in aqua feed with favorable properties (Singh
and Muthukumarappan, 2014b). In another study, we increased the level of soy white
flakes up to 60%. The effect of soy white flakes content and different die nozzles at
constant speed (150 rpm) were evaluated. A positive effect on the durability and
expansion ratio of aquafeed with increase in die aspect ratio of nozzle was observed
(Singh and Muthukumarappan, 2014a). However, the effect of various levels of screw
speed on the properties of aquafeed was not studied.
Therefore, the objectives of our present study were to understand the effect of extrusion
process parameters such as screw speed, moisture content and barrel temperature using
RSM and adopting Box Behnken design on the properties of aquafeed for Catla (Catla
catla) produced using soy white flakes as a major protein source.
4.3 Materials and Methods
Soy white flake was donated by South Dakota Soybean Processors, Volga, SD.
Corn flour was purchased from Cargill Dry Ingredients (Paris, IL). HP-DDG was
obtained from the Dakota Ethanol LLC (Wentworth, SD). Corn gluten meal and fishmeal
was purchased from Consumer Supply Distributing Co. (Sioux City, IA). Vitamin and
mineral premix was obtained from Lortscher Agri Service, Inc. (Bern, Kansas, USA).
Soybean oil was obtained from USDA (Brookings, SD).
4.3.1 Feed Blends Formulation
Three isocaloric (304 cal g-1
) blends were formulated with a net protein content of
32.3% db. The different ingredients in the blends include HP-DDG, soy white flakes,
corn gluten meal (CGM), corn flour, fish meal, soybean oil, and vitamin-mineral mix
(Table 4.1). The ingredients were mixed in a laboratory scale Hobart mixer (Hobart

92
Corporation, Troy, Ohio, USA) for 10 min and stored overnight at ambient temperature
for moisture stabilization. The moisture balancing of the blends was done by adding
required quantities of water during mixing.
4.3.2 Extrusion Processing
The extrusion processing was performed using a single screw extruder (Brabender
Plasti-Corder, Model PL 2000, South Hackensack, NJ) which was powered by a 7.5-HP
motor with an operating range of screw speeds from 0 to 210 rpm (0 to 22 rad s-1
). A
schematic representation of laboratory scale single screw extruder is shown in Figure 4.1.
The extruder had a barrel with length-to-diameter ratio of 20:1 and a barrel diameter of
19 mm. A uniform 19.05 mm pitch screw with compression ratio of 3:1 was used in the
experiments. The screw had a variable flute depth, with depths at the feed portion of
19.05 mm, and near the die of 3.81 mm. The center of the die assembly was conical, and
tapered from an initial diameter of 6.0 mm to an exit diameter of 3 mm, respectively, at
the discharge opening. The length and diameter of the die was 17.5 mm and 3 mm (l/d =
5.83), respectively. The extruder barrel was equipped with external band heaters with
provisions to control the temperature of all three zones: feed zone, transition
zone/melting zone, and die sections. The material gets gelatinized and plasticized under
thermal and mechanical stresses generated by the rotation of screws in melting zone of
the extruder. The gelatinized material then enters the cooking zone where the extruder
barrel is fully filled due to pressure generated at die nozzle. When the process reached the
steady state, samples were collected at the die. All samples were stored in a conditioned
room prior to further analysis.

93
4.3.3 Experimental Design and Statistical Analysis
Experiments were conducted using Box-Behnken design which was developed
using Design-Expert 8.0.7.1 (Statease, Minneapolis, MN), consisting four numerical
independent variables namely soy white flakes (X1), moisture content (X2), temperature
(X3) and screw speed (X4) each at three levels as shown in Table 4.2. Pellet durability
index, bulk density, water absorption and solubility indices and mass flow rate of the
extrudates were measured as the response/dependent variables. All measurements were
done in triplicate. Using Eq. (4.1), the numerical independent variables in actual form
(X1, X2) were converted to their coded form (x1, x2).
(X X )i oxi X
(4.1)
where xi is the dimensionless coded value of the ith
independent variable, and Xi, X0, and
ΔX correspond to the actual value, actual value at the center point, and the step change of
the ith
variable, respectively.
Twenty nine experiments were performed in randomized order including five
replications at the design center to obtain an accurate estimation of the experimental error
(Table 4.3). The pellet durability index (YPDI), bulk density (YBD), water absorption index
(YWAI), water solubility index (YWSI) and mass flow rate (YMFR) were taken as the five
responses of the designed experiments. A second order polynomial equation was used to
describe the effect of the independent variables in terms of linear, quadratic and their
interactions on the dependent variables as given by Eq. (4.2).
4 4 3 42
1 1 1 1i o i i ii i ij i j
i i i j i
Y b b X b X b X X
(4.2)

94
where Yi is the predicted response; b0 is the interception coefficient; bi, bii, and bij are
coefficients of the linear, quadratic, and interaction terms; 𝜀 is the random error; and Xi is
the independent variables studied. The fitness of the model was evaluated and the
interactions between the independent and dependent variables were identified by using an
analysis of variance (ANOVA) presented in Table 4.4 and Table 4.5. The goodness of fit
of the second order equation was expressed by the coefficient of determination (R2) and
its statistical significance was determined by F-test (Table 4.6). 3D response surfaces
were used to visualize the interactive effects of the independent variables. All the
collected data were analyzed with Microsoft Excel v.2010 and SAS v.9. (SAS, 2012) The
Proc GLM procedure was used to determine the treatment effects using a Type I error
rate (α) of 0.05.
4.3.4 Measurement of Physical Properties
4.3.4.1 Pellet durability index
Approximately 100 g of extrudates from each blend were manually sieved
(U.S.A. standard testing, ASTM E-11 specification, Daigger, Vernon Hills, IL) to remove
initial fines, and then tumbled in a pellet durability tester (Model PDT-110, Seedburo
Equipment Company, Chicago, IL) for 10 min. Afterwards, the samples were again
sieved, and then weighed on an electronic balance (Explorer Pro, Model: EP4102, Ohaus,
Pine Brook, NJ) (ASAE, 2004). PDI was calculated by Eq. (4.3):
100a
b
MPDI
M
(4.3)
where, Ma was the mass (g) after tumbling and Mb was the sample mass (g) before
tumbling.

95
4.3.4.2 Bulk density
Bulk density was determined as the ratio of the mass of extrudates that they filled
up to a given bulk volume and measured using a standard bushel tester (Seedburo
Equipment Company, Chicago, IL) following the method recommended by USDA
(1999).
4.3.4.3 Water absorption index and water solubility index
Extrudates were ground to fine powders using a coffee grinder (Black & Decker
® Corporation, Towson, ML, USA). The ground extrudates (2.5g) was suspended in
distilled water (30 mL) in a tarred 60 mL centrifuge tube. The suspension was stirred
intermittently and centrifuged at 3000g for 10 min. The supernatant was decanted into a
tarred aluminum cup and dried at 135°C for 2 h.(AACC, 2000) The weight of the gel
remaining in the centrifuge tube was measured. The water absorption index and water
solubility index were calculated by Eq. (4.4) and Eq. (4.5) respectively:
g
ds
WWAI(unitless )
W (4.4)
where, Wg is the weight of gel (g), and Wds is the weight of dry sample (g).
100ss
ds
WWSI(%)
W
(4.5)
where, Wss is the weight of dry solids of supernatant (g), and Wds is the weight of dry
sample (g).
4.3.4.4 Mass flow rate
Extrudate samples exiting the die were collected at 30s intervals and weighed
using an electronic balance (PB 5001, Mettler Toledo, Switzerland) to quantify the mass
flow rate.

96
4.4 Results and Discussion
4.4.1 Pellet durability index
Pellet durability indicates the mechanical strength of the extrudates (Rosentrater
et al., 2005). The higher the pellet durability index, the more stable the extrudates will be
during storage, feeding, and handling processes. The response surface plot presented in
Figure 4.2 shows that at low temperature, with increase in soy white flakes content, pellet
durability index initially decreased and after reaching a minimum it increased further.
Similar findings were observed in our previous study (Singh and Muthukumarappan,
2014a). ANOVA showed that moisture content had no significant effect on pellet
durability index and hence response surface plots of interaction effect involving moisture
content are not shown. Lack of fit was not significant relative to the pure error, which
meant the model was well fitted. The regression equation for pellet durability index in
coded and actual form is shown in Table 4.6 and Table 4.7, respectively. The effect of
changing the level of temperature from 110 to 140°C on pellet durability of extrudates
was found to be significant (P<0.05) but no definite pattern was observed. The values of
pellet durability index of extruded products under experimental conditions are presented
in Table 4.8. Pellet durability index is found to be maximum at higher temperature and
lower screw speed. It is believed that the extent of heat treatment, along with the level of
starch transformation as well as water content influence the pellet durability index quality
of the extrudates (Rosentrater et al., 2009a, b).
4.4.2 Bulk density
The targeted fish (Catla) is a surface feeder and a lower bulk density is required to
obtain floating feed (Mjoun and Rosentrater, 2011). Changing the moisture content of

97
ingredient mix had a significant effect on the bulk density (P = 0.0466). Also combined
effect of moisture content and temperature had a significant effect on the bulk density (P
= 0.0328) (Table 4.4). Response surface plot presented in Figure 4.3 shows that lower
bulk density is achieved when moisture content is increased at higher barrel temperature.
At higher barrel temperature and high moisture content the bubble growth is dominant
factor for expansion of the extrudates (Padmanabhan and Bhattachayray, 1989). An
increase in barrel temperature will increase the degree of superheating of water within the
extruder encouraging bubble formation and also a decrease in melt viscosity leading to
reduced density (Ding et al., 2006), which was observed in this work.
ANOVA showed that soy white flakes and screw speed had no significant effect
on bulk density and hence response surface plots of interaction effect involving soy white
flakes and screw speed are not shown. The regression equation for bulk density in coded
and actual form is shown in Table 4.6 and Table 4.7, respectively. The treatment
combination effects of soy white flakes, moisture content, temperature and screw speed
on bulk density of extrudates are presented in Table 4.8.
4.4.3 Water absorption index and water solubility index
When percentage of soy white flakes in ingredient mix was increased from 20%
to 50% the water absorption index initially decreases and then increases as shown in
Figure 4.4(A). When screw speed was increased from 100 rpm to 200 rpm, water
absorption index also decreased. As the moisture content of ingredient was increased
from 20% to 30%, water absorption index increased (Figure 4.4). Water absorption index
or WAI, is related to the extent of starch gelatinization followed by degradation and
dextrinization, which are mainly responsible for water absorption (Bortone, 2004; Gomez

98
and Aguilera, 1984). WAI is also indirectly related to water holding capacity, which thus
affects storage stability of product (Chevanan et al., 2007a). From our result [Figure
4.4(B)], it can be seen that WAI decreased with an increase in screw speed and a decrease
in moisture content which is in agreement with studies conducted by Anderson et al.
(1970); Oikonomou and Krokida (2012). High shear rate (high screw speed) reduces the
availability of undamaged polymer chains. As a result, the availability of hydrophilic
groups which can bind water molecules are low which is responsible for lower values of
WAI (Gomez and Aguilera, 1983).
The experimental results show that WSI of all examined extrudates decreased
with increasing moisture levels from 20% to 30% (Figure 4.5). Water solubility index
(WSI) is generally used as a measure for starch degradation (Einde et al., 2003) which
means that at lower WSI there is minor degradation of starch and this leads to less
numbers of soluble molecules in the extrudates (Hernandez-Diaz et al., 2007). Higher
moisture content in extrusion process can diminish protein denaturation and starch
degradation (Rodriguez-Miranda et al., 2012). Proteins can cross-link with starches
(Fernández-Gutiérrez et al., 2004; Goel et al., 1999), preventing amylose solubilization
and diminishing WSI. Similar findings where WSI decreased with increase in levels of
moisture were also observed by Badrie and Mellowes (1991); Chinnaswamy and Hanna
(1990); Williams et al. (1977). From Figure 4.4(A) and Figure 4.5, it can be inferred that
WAI is inversely related to WSI.
4.4.4 Mass flow rate
One common way to estimate the productivity of an extrusion processing is to
examine the mass flow rate of the output (Ayadi et al., 2013). Mass flow rate in a single

99
screw extruder depends on the drag flow developed by screw rotation, die geometry,
shear rate, diet formulation, moisture content of the feed, viscosity and the pressure flow
generated due to the restriction of the die (Chevanan et al., 2007a; Kannadhason et al.,
2010; Mercier et al., 1989b). The interaction effect of temperature and screw speed is
found to be significant (Table 4.5). Response surface plots presented in Figure 4.6
showed that at higher screw speed, mass flow rate is increased with increase in
temperature level from 110oC to 140
oC. This may be due to decrease in the viscosity of
the melt. Also, mass flow rate was found to increase with increase in the level of screw
speed as shown in Figure 4.6. This may be due to the reason that as the screw speed
increases, the ability to convey the material along the extruder barrel increases and as a
result more mass of extrudates per hour is produced.
ANOVA showed (Table 4.5) that moisture content had no significant effect on
mass flow rate and hence response surface plots of interaction effect involving moisture
effect are not shown. The results were not in agreement with the findings of Chevanan et
al. (2007a) who reported that increasing moisture content from 15% to 25% resulted in a
32.5% decrease in the mass flow rate. The regression equation for the relationship
between mass flow rate and independent variables in terms of coded and actual form is
shown in Table 4.6 and Table 4.7, respectively. The experimental values of mass flow
rate of extrudates under different designed extrusion conditions are shown in Table 4.8.
4.4.5 Optimization and validation
Numerical optimization was carried out in Design Expert v8 considering all five
dependent variables. The optimization resulted in 43 solutions and the top ten solutions
are shown in Table 4.9. Validation of the predicted responses was carried out by

100
extruding the blends at three different optimum conditions as shown in Table 4.9. Good
agreement was found between the predicted and experimental values. The experimental
values for solution #9 were very close to the predicted values. The optimum condition
was: 39.56% SWF, 20% moisture content, 112oC barrel temperature and 195 rpm screw
speed.
4.5 Conclusions
Response surface methodology revealed the significant effects of soy white
flakes, moisture content, barrel temperature and screw speed on the properties of
extruded aquafeed. The effects of soy white flakes on most of the properties of the
extrudates were found to be quadratic; the effects were linear for water solubility effects.
Moisture content and temperature had quadratic effects on the pellet durability index,
where increasing the moisture content and temperature initially decreased and then
increased the pellet durability index. Moisture content, temperature and screw speed all
had linear effect on the water absorption index. Interactive effects of temperature and
screw speeds were found on pellet durability index and mass flow rate. Increase in barrel
temperature produces less compacted extrudates. Increasing screw speed resulted in
increase in pellet durability and mass flow rate but decrease in water absorption index of
the extrudates. This study will be useful in identifying desirable operating conditions for
the production of targeted extruded aqua feed.

101
Table 4.1 Ingredient composition of feed blends.
Feed ingredients Mass of ingredients (g kg-1
dry matter)
Blend I Blend II Blend III
Soy white flakes 200 350 500
HP-DDG 400 250 100
CGM 20 20 2
Corn Flour 300 300 300
Fish meal 50 50 50
Soy bean oil 10 10 10
Vitamin & Mineral mix 20 20 20
†HP-DDG – High protein distiller’s dried grains; CGM – Corn gluten meal

102
Table 4.2 Independent numerical and categorical variables and their levels.
Numerical variables Symbol Coded variable levels
-1 0 1
Soy white flakes (%) X1 20 35 50
Moisture content (% db) X2 20 25 30
Temperature (oC) X3 110 125 140
Screw speed (rpm) X4 100 150 200

103
Table 4.3 Experimental design layout.
Run Coded variables Actual variables
x1 x2 x3 x4 X1 X2 X3 X4
(%) (%db) (oC) (rpm)
1 0 -1 -1 0 35 20 110 150
2 0 1 1 0 35 30 140 150
3 0 0 1 1 35 25 140 200
4 -1 0 0 -1 20 25 125 100
5 0 0 -1 -1 35 25 110 100
6 0 -1 1 0 35 20 140 150
7 0 1 -1 0 35 30 110 150
8 0 0 0 0 35 25 125 150
9 1 0 1 0 50 25 140 150
10 0 0 0 0 35 25 125 150
11 -1 -1 0 0 20 20 125 150
12 -1 1 0 0 20 30 125 150
13 0 0 1 -1 35 25 140 100
14 1 0 0 1 50 25 125 200
15 0 -1 0 -1 35 20 125 100
16 0 1 0 1 35 30 125 200
17 0 0 0 0 35 25 125 150
18 1 1 0 0 50 30 125 150
19 0 0 -1 1 35 25 110 200
20 -1 0 0 1 20 25 125 200
21 0 0 0 0 35 25 125 150
22 -1 0 1 0 20 25 140 150
23 1 -1 0 0 50 20 125 150
24 1 0 0 -1 50 25 125 100
25 0 1 0 -1 35 30 125 100
26 -1 0 -1 0 20 25 110 150
27 0 0 0 0 35 25 125 150
28 1 0 -1 0 50 25 110 150
29 0 -1 0 1 35 20 125 200

104
Table 4.4 Analysis of Variance (ANOVA) for pellet durability index and bulk density.
Source df Pellet durability index Bulk density
SS MS F value P-value SS MS F value P-value
Model 14 395.79 28.27 3.95 0.0074 25298.81 1807.06 2.57 0.0444
X1 1 2.86 2.86 0.40 0.5379 3104.08 3104.08 4.41 0.0544
X2 1 0.11 0.11 0.01 0.9044 3355.57 3355.57 4.76 0.0466
X3 1 27.61 27.61 3.86 0.0697 4.08 4.08 0.01 0.9404
X4 1 17.76 17.76 2.48 0.1376 363.00 363.00 0.52 0.4846
X12 1 112.60 112.60 15.73 0.0014 375.48 375.48 0.53 0.4773
X22
1 124.56 124.56 17.40 0.0009 573.13 573.13 0.81 0.3823
X32 1 140.31 140.31 19.60 0.0006 10565.17 10565.17 15.00 0.0017
X42 1 32.77 32.77 4.58 0.0505 42.74 42.74 0.06 0.8090
X1X2 1 15.43 15.43 2.16 0.1642 342.23 342.23 0.49 0.4972
X1X3 1 3.19 3.19 0.45 0.5152 58.77 58.77 0.08 0.7769
X1X4 1 6.60 6.60 0.92 0.3534 25.01 25.01 0.04 0.8532
X2X3 1 2.77 2.77 0.39 0.5442 3948.05 3948.05 5.61 0.0328
X2X4 1 0.14 0.14 0.02 0.8896 361.00 361.00 0.51 0.4858
X3X4 1 43.76 43.76 6.11 0.0269 2952.13 2952.13 4.19 0.0599
Residual 14 100.23 7.16 - - 9859.69 704.26 - -
Lack of fit 10 87.92 8.79 2.86 0.1617 8968.43 896.84 4.03 0.0959
Pure error 4 12.31 3.08 - - 891.26 222.81 - -
†df – degree of freedom, SS – Sum of squares, MS – Mean square

105
Table 4.5 Analysis of Variance (ANOVA) for water absorption index, water solubility index and mass flow rate.
Source df Water absorption index Water solubility index Mass flow rate
SS MS F value P-value SS MS F value P-value SS MS F value P-value
Model 14 4.35 0.31 5.47 0.0015 19.82 1.42 4.65 0.0034 88.37 6.31 9.36 < 0.0001
X1 1 0.12 0.12 2.13 0.1661 4.65 4.65 15.28 0.0016 0.39 0.39 0.58 0.4576
X2 1 0.65 0.65 11.36 0.0046 5.90 5.90 19.38 0.0006 0.04 0.04 0.07 0.8012
X3 1 0.60 0.60 10.53 0.0059 0.55 0.55 1.81 0.1996 0.05 0.05 0.08 0.7844
X4 1 0.54 0.54 9.53 0.0080 1.22 1.22 4.00 0.0652 69.33 69.33 102.80 < 0.0001
X12 1 1.26 1.26 22.12 0.0003 5.04 5.04 16.55 0.0012 4.38 4.38 6.49 0.0232
X22
1 0.21 0.21 3.69 0.0753 0.09 0.09 0.31 0.5881 1.68 1.68 2.50 0.1364
X32 1 0.21 0.21 3.65 0.0767 0.46 0.46 1.50 0.2416 2.59 2.59 3.84 0.0703
X42 1 0.04 0.04 0.76 0.3985 0.02 0.02 0.08 0.7812 0.53 0.53 0.78 0.3909
X1X2 1 0.01 0.01 0.09 0.7629 0.00 0.00 0.01 0.9314 0.10 0.10 0.15 0.7026
X1X3 1 0.08 0.08 1.36 0.2625 0.02 0.02 0.05 0.8194 0.11 0.11 0.17 0.6866
X1X4 1 0.00 0.00 0.04 0.8423 0.07 0.07 0.21 0.6510 1.38 1.38 2.05 0.1744
X2X3 1 0.14 0.14 2.54 0.1333 0.62 0.62 2.03 0.1758 2.17 2.17 3.21 0.0948
X2X4 1 0.21 0.21 3.75 0.0733 0.31 0.31 1.01 0.3315 0.45 0.45 0.67 0.4282
X3X4 1 0.15 0.15 2.56 0.1317 0.18 0.18 0.59 0.4539 3.18 3.18 4.72 0.0476
Residual 14 0.80 0.06 - - 4.26 0.30 - - 9.44 0.67 - -
Lack of fit 10 0.70 0.07 2.85 0.1626 3.56 0.36 2.04 0.2569 8.53 0.85 3.73 0.1080
Pure error 4 0.10 0.02 - - 0.70 0.17 - - 0.91 0.23 - -
†df – degree of freedom, SS – Sum of squares, MS – Mean square

106
Table 4.6 Final equation in terms of coded factors after excluding the insignificant terms for pellet durability index, bulk density,
water absorption index, water solubility index and mass flow rate
Coded model equations R2 Adj R
2 Pred R
2 Adeq precision
YPDI = +83.70 - 3.31x3 x4 + 4.17x12 + 4.38x2
2 + 4.65x3
2 0.80 0.60 -0.06 6.08
YBD = +369.87 - 16.72x2 - 31.42x2x3 + 40.36x32 0.72 0.44 -0.51 6.41
YWAI = +3.84 + 0.23x2 + 0.22x3 - 0.21x4 + 0.44x12 0.84 0.69 0.19 9.53
YWSI = +14.76 + 0.62x1 - 0.70x2 - 0.88x12 0.82 0.65 0.10 9.58
YMFR = +8.88 + 2.40x4 + 0.89x3 x4 - 0.82x12 0.90 0.81 0.48 13.52
†PDI – Pellet durability index; BD – Bulk density; WAI – Water absorption index; WSI – Water solubility index; MFR – Mass flow
rate.

107
Table 4.7 Best-Fit Response Surface Models for Extrudate Physical Properties.
Response Surface Model R2 Std. Deviation F Statistic P value
YPDI = +473.86 - 1.68X1 - 8.39X2 - 4.19X3 + 0.18X4 + 0.03X1X2 -
3.97×10-3
X1X3 + 1.71×10-3
X1X4 - 0.01X2X3 + 7.57×10-4
X2X4 -
4.41×10-3
X3X4 + 0.02X12 + 0.17X2
2 + 0.02X3
2 + 8.99×10
-4X4
2
0.80 2.68 3.95 0.0074
YBD = +1744.68 - 2.75X1 + 20.20X2 - 28.38X3 + 3.04X4 + 0.12X1X2 -
0.02X1X3 + 3.33×10-3
X1X4 - 0.42X2X3 + 0.04X2X4 - 0.04X3 X4 +
0.03X12 + 0.36X2
2 + 0.18X3
2 + 1.03×10
-3X4
2
0.72 26.54 2.57 0.0444
YWAI = -14.90 - 0.07X1 - 0.15X2 + 0.34X3 - 6.44×10-3
X4 + 4.89×10-4
X1X2
- 6.19×10-4
X1X3 + 3.22×10-5
X1X4 - 2.53×10-3
X2X3 + 9.23×10-
4X2X4 - 2.54×10
-4X3X4 + 1.96×10
-3X1
2 + 7.19×10
-3X2
2 - 7.95×10
-
4X3
2 + 3.26×10
-5X4
2
0.84 0.24 5.47 0.0015
YWSI = +47.65 + 0.25X1 - 0.40X2 - 0.49X3 + 1.16×10-4
X4 + 3.22×10-
4X1X2 + 2.85×10
-4X1X3 + 1.70×10
-4X1X4 + 5.24×10
-3X2X3 -
1.11×10-3
X2X4 + 2.83×10-4
X3X4 - 3.92×10-3
X12 - 4.80×10
-3X2
2 +
1.18×10-3
X32 - 2.45×10
-5X4
2
0.82 0.55 4.65 0.0034
YMFR = +91.74 + 0.17X1 - 0.49X2 - 1.09X3 - 0.19X4 + 2.13×10-3
X1 X2 -
7.52×10-4
X1 X3 + 7.83×10-4
X1 X4 + 9.81×10-3
X2 X3 + 1.34×10-
3X2 X4 + 1.19×10
-3X3 X4 - 3.65×10
-3X1
2 - 0.02X2
2 + 2.81×10
-3X3
2
+ 1.14×10-4
X42
0.90 0.82 9.36 <0.0001

108
Table 4.8 Treatment combination effects for soy white flakes, moisture content of raw
material, temperature and screw speed on extrudate physical properties.
Treatment PDI BD WAI WSI MFR
(%) (kg m-3
) (-) (%) (kg h-1
)
1 93.44±0.03d 391.33±3.60
k 3.23±0.10
o 16.02±0.22
b 9.89±0.05
d
2 88.30±0.09k 361.33±2.91
o 4.29±0.08
de 13.94±0.10
lm 10.15±0.51
d
3 81.05±0.25q 343.00±3.54
q 3.49±0.16
m 15.29±0.09
c 13.23±0.35
a
4 89.78±0.12j 339.67±4.80
q 4.48±0.12
c 12.60±0.04
op 8.04±0.03
i-k
5 92.37±0.12f 415.67±1.71
ef 3.71±0.05
l 15.06±0.06
de 8.16±0.12
ij
6 90.83±0.26h 453.00±0.84
a 4.41±0.08
cd 14.15±0.15
i-k 8.82±0.35
fg
7 94.24±0.17c 425.33±2.17
d 3.86±0.10
jk 14.24±0.12
h-j 8.29±0.18
h-j
8 84.70±0.22n 366.00±2.93
n 4.04±0.08
g-i 14.30±0.09
hi 8.67±0.37
f-h
9 93.58±0.08d 444.67±0.77
b 3.98±0.04
h-j 15.06±0.09
de 8.31±0.31
h-j
10 81.28±0.43q 350.00±1.58
p 3.93±0.02
ij 14.39±0.11
h 9.35±0.15
e
11 92.60±0.28ef 398.33±2.02
j 4.15±0.05
fg 13.77±0.03
mn 7.86±0.56
jk
12 90.87±0.09h 333.67±2.43
r 4.77±0.10
b 12.51±0.10
p 6.37±0.15
l
13 93.34±0.78d 454.64±2.25
a 4.51±0.03
c 14.21±0.06
ij 5.88±0.25
lm
14 90.96±0.05h 401.67±1.59
ij 4.50±0.11
c 14.65±0.07
g 10.39±0.31
cd
15 92.31±0.08fg
413.33±1.38f 4.14±0.11
fg 15.19±0.03
cd 5.78±0.33
m
16 91.97±0.18g 405.67±2.14
hi 4.24±0.08
ef 14.07±0.02
j-l 11.62±0.27
b
17 85.78±0.27l 372.33±1.90
m 3.86±0.03
jk 14.83±0.05
fg 9.13±0.28
ef
18 94.66±0.11b 381.33±1.31
l 4.94±0.04
a 13.79±0.05
mn 7.56±0.50
k
19 93.31±0.05d 412.67±1.89
fg 3.45±0.04
mn 15.29±0.12
c 11.94±0.40
b
20 85.17±0.15m 341.33±2.61
q 4.14±0.04
fg 12.72±0.10
o 10.82±0.19
c
21 84.05±0.19o 391.67±2.72
k 3.74±0.11
kl 15.30±0.04
c 9.10±0.21
ef
22 95.52±0.10a 440.33±0.98
c 4.06±0.04
gh 14.10±0.13
j-l 9.00±0.43
ef
23 88.53±0.21k 409.00±0.27
gh 4.17±0.10
e-g 14.95±0.16
ef 8.41±0.44
g-i
24 90.44±0.19i 390.00±2.39
k 4.75±0.03
b 14.02±0.13
kl 5.26±0.24
n
25 91.17±0.05h 369.00±4.81
mn 4.12±0.02
fg 13.74±0.21
n 6.05±0.08
lm
26 92.92±0.13e 419.67±1.21
e 3.66±0.06
l 14.01±0.09
kl 8.16±0.30
ij
27 82.70±0.35p 369.33±2.66
mn 3.64±0.12
l 15.00±0.14
ef 8.15±0.32
ij
28 94.55±0.09bc
439.33±2.23c 4.14±0.05
fg 14.71±0.16
g 8.15±0.18
ij
29 92.36±0.20f 412.00±1.01
fg 3.34±0.07
no 16.63±0.08
a 10.01±0.11
d
†The values with the same superscript for a given property are not significantly different
(P< 0.05). PDI – Pellet durability index, BD – Bulk density, WAI – Water absorption
index, WSI – Water solubility index, MFR – Mass flow rate.

109
Table 4.9 Solutions for optimal conditions and validation.
Solution # SWF MC Temp SS MFR PDI BD WAI WSI
(%) (%db) (oC) (rpm) (kg h
-1) (%) (kg m
-3) (-) (%)
1 36.15 20.00 114 200 11.00 94.59 404.90 3.18 16.38
2 36.03 20.00 114 200 11.00 94.59 404.86 3.17 16.37
3 36.01 20.00 114 200 10.99 94.45 404.15 3.18 16.36
4 37.10 20.00 114 200 10.99 94.34 404.09 3.21 16.38
5 38.33 20.00 113 200 11.06 95.30 409.43 3.20 16.47
6 38.88 20.02 114 200 10.99 94.32 404.63 3.26 16.40
7 35.07 20.43 113 200 11.07 94.37 406.52 3.16 16.28
8 34.55 20.34 112 200 11.10 95.28 410.47 3.11 16.33
9 39.56 20.00 112 195 10.88 95.52 412.76 3.23 16.49
10 40.47 20.00 110 176 10.37 95.52 417.93 3.23 16.50
Validation
3 36.01 20.00 114 200 10.81 94.98 406.15 3.26 16.39
9 39.56 20.00 112 195 10.92 95.46 411.55 3.21 16.45
10 40.47 20.00 110 176 10.49 95.69 416.31 3.29 16.38
†SWF – Soy white flakes; MC – Moisture content of blends; Temp – Barrel temperature; SS - Screw speed; MFR – Mass flow rate;
PDI – Pellet durability index; BD – Bulk density; WAI – Water absorption index; WSI – Water solubility index.

110
Figure 4.1 Schematic representation of a single screw extruder (Brabender Plasti-Corder,
Model PL 2000, South Hackensack, NJ).

111
Figure 4.2 Response surface plots of pellet durability index for the effect of (A) soy white
flakes content and temperature at 25% moisture content and 150 rpm, and (B)
temperature and screw speed at 35% soy white flakes content and 25% moisture content.

112
Figure 4.3 Response surface plots of bulk density for the effect of moisture content and
temperature at 35% soy white flakes content and 150 rpm.

113
Figure 4.4 Response surface plots of water absorption index for the effect of (A) soy
white flakes content and moisture content at 125oC temperature and 150 rpm screw
speed, and (B) moisture content and screw speed at 35% level of soy white flakes and
125oC temperature.

114
Figure 4.5 Response surface plots of water solubility index for the interaction effect of
soy white flakes content and moisture content at 125oC temperature and 150 rpm screw
speed.

115
Figure 4.6 Response surface plots of mass flow rate for the interaction effect of
temperature and screw speed at 35% soy white flakes content and 25% moisture content.

116
CHAPTER 5
Modeling and Optimizing the Effect of Extrusion Processing Parameters on
Nutritional Properties of Soy White Flakes Based Aquafeed Using Response Surface
Methodology
5.1 Abstract
Thermomechanical effects of extrusion cooking leads to physiochemical changes
that may be either beneficial or detrimental. The effects of extrusion processing on the
nutritional value of food constituents, specifically protein, as well as the ultimate product
are ambiguous. During the process, peptide bonds are hydrolyzed and molecular structure
of protein changes, which can reduce the nutritional value of the protein and amino acids.
Very few studies have focused on the effect of extrusion processing conditions on
nutritional value of aquaculture diets. Our objective was to study the effects of inclusion
of soy white flakes (up to 50%) and other extrusion processing parameters such as
moisture content, barrel temperature and screw speed on the nutritional properties of
aquafeed extrudates using a single-screw extruder and to optimize the processing
conditions. The extrusion was carried out at three level each of soy white flakes (SWF)
content (20%, 35% and 50%), moisture content (20, 25 and 30 % db), barrel temperature
(110, 125 and 140ºC) and screw speed (100, 150 and 200 rpm). Response surface
regression models were established to correlate the nutritional properties of extrudates to
the process variables. Using response surface methodology, extrusion processing was
optimized for the maximum values of the analyzed nutritional properties and minimum
values of trypsin inhibitor activity (TIA). Extrudate nutritional properties including crude
protein, crude fat, crude fiber, ash, lysine content and trypsin inhibitor activity, were

117
significantly (P<0.05) affected by the process variables. SWF was the most significant
variable with quadratic effects on most of the properties. As level of SWF content was
increased from 20 to 50%, there was an increase in lysine content, TIA, protein content,
ash content and decrease in fat and fiber content. Increasing temperature resulted in
decrease in lysine content and trypsin inhibitor activity of extrudates. Our study shows
that aquafeed with maximum lysine content and minimum trypsin inhibitor activity can
be obtained by adding SWF up to 50%.
5.2 Introduction
Aquaculture is one of the fastest growing sector of agriculture and the most
rapidly expanding markets for manufacturing fish feeds (Riaz, 1997). Aquaculture feed
requires protein content of 26% to 50% (Lovell, 1989) and hence formulated feed
contains high amounts of protein. The main protein sources used in aqua feed
production is primarily fishmeal which is supplied through the consumption of wild fish
stocks. Indubitably, with the increasing rate of farmed fish production (FAO, 2009) and
consequent rise in the prices of fishmeal, (Hardy, 2010) the continued use of fishmeal
as the main protein source of the feed will no longer be ecologically and economically
sustainable in the long run. Soybean products and Distiller Dried Grains (DDGs) contains
high amount of protein and are thus a possible alternative source of protein for
aquaculture feeds (Kim et al., 1989; Singh and Muthukumarappan, 2014a, b; Wu et al.,
1994; Wu et al., 1996). Distillers Dried Grains (DDG) and Distillers Dried Grains with
Solubles (DDGS), a co-product from corn-based dry grind fuel ethanol manufacturing, is
also a viable protein source. Many researchers have used DDGS as the base protein
source in aquafeed formulations and evaluated its effect on the nutritional qualities of the

118
aquafeeds (Coyle et al., 2004; Lim et al., 2007; Lim et al., 2009; Robinson and Li, 2008;
Webster et al., 1992; Wu et al., 1996). Mjoun and Rosentrater (2011) used DDGS for the
development of good quality extruded aquafeed. Research carried out by Wu et al.
(1994); Wu et al. (1996) indicated that tilapia fish grown with DDGS can improve the
economic viability of aquaculture farms. Use of soy products like full fatted soybean
meal, defatted toasted soybean meal (SBM) and defatted untoasted soybean meal or
white flakes (WF) is becoming common (Fallahi et al., 2012; Singh and
Muthukumarappan, 2014a, b). Romarheim et al. (2005) found that extrusion of WF diet
increased the digestibility of protein and all amino acids whereas extrusion of fishmeal
and SBM had no significant effect on amino acid digestibility. Some researchers have
explored SBM (Arndt et al., 1999; Arnesen et al., 1989; Fowler, 1980; Krogdahl et al.,
1994; Refstie et al., 2000; Refstie et al., 2001; Reinitz, 1980; Vielma et al., 2000). They
observed that inclusion of more than 25% SBM as the fish meal (FM) replacer in the fish
feed resulted in a significant decrease in fish growth performance. In fact, the lack of
some essential amino acids (EAA), such as lysine and methionine (NRC, 1993) and the
presence of anti-nutritional factors (ANFs), such as trypsin inhibitors (Arndt et al., 1999;
Bureau et al., 1998; Krogdahl et al., 1994) and non-starch polysaccharides (NSPs)
(Arnesen et al., 1989) accounted for much of the reduction in growth performance and
the low digestibility of the SBM-based diets (Dabrowski et al., 1989; Olli and Krogdahi,
1994).
Extrusion processing is the most common and economic technology used in the
aqua-feed industry. It is a very complex process, involving numerous independent
variables (such as temperature, moisture content, blend composition, screw speed, die

119
size and configuration, screw configuration, etc.) and dependent variables (such as
specific mechanical energy, residence time, torque, pressure, etc.) which provide thermal
and shear energy to the extruding materials, inducing chemical and physical changes, and
ultimately transferring the state of the materials at both macroscopic and microscopic
scale. Quality of the food and feed products are related to both physical and nutritional
characteristics of the product. The complexity of the process indicates that there is a
strong interrelationship between the effect of extrusion processing on physical and
nutritional properties of the feed/food. According to Harper (1981), extrusion cooking
can minimize heat degradation of the food nutrients and enhance the digestibility of the
major ingredients, mainly protein and starch.
Although extrusion cooking offers several advantages, its effect on nutrient
retention in the food product is still a major concern. Protein denaturation, starch
gelatinization, lipid oxidation, and Maillard reaction taking place among the ingredients’
components are the main reasons for the change in the nutritional qualities of the
extrudates (Guy, 2001; Tran et al., 2008). While protein denaturation during the extrusion
cooking can boost the protein digestibility, reduce gossypol, and inactivate proteinase
inhibitors (Camire, 1991), overheating causes degradation and reduces the bioavailability
of the protein and essential amino acids like lysine due to Maillard reaction, and loss of
heat-labile vitamins due to exposure to high temperatures (Tran et al., 2008). Since, the
dough containing soy white flakes has been subjected to thermal treatment during the
production; the overheating of soy white flakes during extrusion processing can be
possible which may result in loss of nutrient quality.

120
In our previous studies, we have explored the effect of SWF inclusion on physical
properties of aquafeeds produced by the extrusion cooking process (Singh and
Muthukumarappan, 2014a, b). Very few studies have been conducted focusing on the
effect of extrusion processing conditions on the nutritional value of aquaculture diets.
Optimization of extrusion processing for production of nutritious food has been
conducted by some researchers. Study has been conducted on the optimization of
extrusion processing for physical properties of aquafeed (Singh and Muthukumarappan,
2015) but not on nutritional properties of aquafeeds. Response surface methodology
(RSM) may be employed to optimize critical extrusion processing parameters by
estimating the linear, interactive, and quadratic effects. Thus the objectives of this study
were 1) to understand the effect of extrusion process parameters on nutritional properties
of soy white flakes based extruded diets and 2) to model and optimize the extrusion
process parameters for nutritionally high quality feed using response surface method.
5.3 Materials and Methods
Soy white flakes were donated by South Dakota Soybean Processors, Volga, SD.
Corn flour was purchased from Cargill Dry Ingredients (Paris, IL). HP-DDG was
obtained from the Dakota Ethanol LLC (Wentworth, SD). Corn gluten meal and fishmeal
was purchased from Consumer Supply Distributing Co. (Sioux City, IA). Vitamin and
mineral premix was obtained from Lortscher Agri Service, Inc. (Bern, Kansas, USA).
Soybean oil was obtained from USDA (Brookings, SD).
5.3.1 Feed Blends Formulation
Three isocaloric (304 kcal/100 g) blends were formulated with a net protein
content of 32.3% db. The different ingredients in the blends include HP-DDG, soy white

121
flakes, corn gluten meal (CGM), corn flour, fish meal, soybean oil, and vitamin-mineral
mix (Table 5.1). The ingredients were mixed in a laboratory scale Hobart mixer (Hobart
Corporation, Troy, Ohio, USA) for 10 minutes and stored overnight at ambient
temperature for moisture stabilization. The moisture balancing of the blends was done by
adding required quantities of water during mixing. The analyzed proximate composition
of each blends are given in Table 5.2.
5.3.2 Extrusion Processing
The extrusion processing was performed using a single screw extruder (Brabender
Plasti-Corder, Model PL 2000, South Hackensack, NJ) which was powered by a 7.5-HP
motor with an operating range of screw speeds from 0 to 210 rpm (0 to 22 rad/s). The
extruder had a barrel with length-to-diameter ratio of 20:1 and a barrel diameter of 19
mm. A uniform 19.05 mm pitch screw with compression ratio of 3:1 was used in the
experiments. The screw had a variable flute depth, with depths at the feed portion of
19.05 mm, and near the die of 3.81 mm. The center of the die assembly was conical, and
tapered from an initial diameter of 6.0 mm to an exit diameter of 3 mm, respectively, at
the discharge opening. The length and diameter of the die was 17.5 mm and 3 mm (l/d =
5.83), respectively. The extruder barrel was equipped with external band heaters with
provisions to control the temperature of all three zones: feed zone, transition
zone/melting zone, and die sections. The material gets gelatinized and plasticized under
thermal and mechanical stresses generated by the rotation of screws in melting zone of
the extruder. The gelatinized material then enters the cooking zone where the extruder
barrel is fully filled due to pressure generated at die nozzle. When the process reached the

122
steady state, samples were collected at the die. All samples were stored in a conditioned
room prior to further analysis.
5.3.3 Experimental Design and Statistical Analysis
Experiments were conducted using Box-Behnken design which was developed
using Design-Expert 8.0.7.1 (Statease, Minneapolis, MN), consisting four numerical
independent variables namely soy white flakes (X1), moisture content (X2), temperature
(X3) and screw speed (X4) each at three levels as shown in Table 5.3. Pellet durability
index, bulk density, water absorption and solubility indices and mass flow rate of the
extrudates were measured as the response/dependent variables. All measurements were
done in triplicate. Using Equation (5.1, the numerical independent variables in actual
form (X1, X2) were converted to their coded form (x1, x2).
(X X )i oxi X
(5.1)
where xi is the dimensionless coded value of the ith
independent variable, and Xi, X0, and
ΔX correspond to the actual value, actual value at the center point, and the step change of
the ith
variable, respectively.
Twenty-nine experiments were performed in randomized order including five
replications at the design center to obtain an accurate estimation of the experimental error
(Table 5.4). The lysine content (YLys), trypsin inhibitor activity (YTIA), crude protein (YCP),
crude fat (YCF) crude fiber (YCFb) and ash content (YAsh) were taken as the six responses of
the designed experiments. A second order polynomial equation was used to describe the
effect of the independent variables in terms of linear, quadratic and their interactions on
the dependent variables as given by Equation (5.2.

123
4 4 3 42
1 1 1 1i o i i ii i ij i j
i i i j i
Y b b X b X b X X
(5.2)
where Yi is the predicted response; b0 is the interception coefficient; bi, bii, and bij are
coefficients of the linear, quadratic, and interaction terms; 𝜀 is the random error; and Xi is
the independent variables studied. The fitness of the model was evaluated and the
interactions between the independent and dependent variables were identified by using an
analysis of variance (ANOVA) presented in Table 5.5, Table 5.6 and Table 5.7. The
goodness of fit of the second order equation was expressed by the coefficient of
determination (R2) and its statistical significance was determined by F-test (Table 5.8 and
Table 5.9). 3D response surfaces were used to visualize the interactive effects of the
independent variables.
5.3.4 Measurement of Nutritional Properties
5.3.4.1 Nutrient Analysis
The extrudates were air dried and protein, fiber, fat, ash content were determined
following AOAC official Methods 990.03, 978.10, 920.39, 920.48 respectively (AOAC
International, 2012). Nitrogen free extracts (NFE) was determined as the percentage
weight of sample after deducting moisture, protein, fat, fiber, and ash content. The
protein, fat and ash content were measured in triplicate for all the treatments.
5.3.4.2 Lysine content
The lysine content of the un-extruded and extruded samples was determined
according to the method described in AOAC Official Method 994.12 (AOAC
International, 2012). The method includes 3 main steps of acid hydrolysis using HCl and
separation of amino acid using High Performance Liquid Chromatography (Agilent

124
Technologies 1260) and protein post column derivatization of amino acids using
ninhydrin reagent. A 5 µm, 4 .6 x 110 mm Na amino acid cation exchange column was
used for separation of lysine. The operating conditions used for the separation were: a)
injector volume: 10 µL, b) mobile phase flow rate: 0.6mL/min, c) run time: 40 min. The
operating conditions used for the post column derivatization using ninhydrin reagent
were a) flow rate: 0.30 mL/min, b) runtime: 40 min. The lysine content in the samples are
detected by using multichannel wavelength scanning UV/vis detector at wavelength of
570 nm.
5.3.4.3 Trypsin Inhibitor Activity (TIA)
The trypsin inhibitor activity was determined according to the differential
absorbance method described in (ISO, 2001).
5.3.4.3.1 Extraction of the sample
The extrudates were ground to fine powder with a grinder and sieved through
500µm. About 1±0.001g of the ground sample was extracted with 50 ml of sodium
hydroxide solution of 0.01mol/l (the pH was adjusted to 9.5±0.1) for overnight (15 to
24h). The clear sample extract was diluted to appropriate dilutions range with water so
that 1ml sample could inhibit 40-60% of the trypsin used as standard based on expected
TIA.
5.3.4.3.2 Procedure
For each dilution of sample extract, a corresponding blank solution was
prepared. 5 ml of L-BAPA was added in each tubes. 1ml of diluted sample extract
followed by 2 ml of water was added in the blank sample and sample solution. 1 ml of
acetic acid was added to the blank sample solution only and all the centrifuge tubes were

125
vortexed to mix the contents thoroughly and thereafter placed in water bath at 37°C for
10min. Then 1ml of trypsin solution was added to all the tubes and placed in water bath
at 37°C. The reaction was terminated exactly after 10min±5s by addition of 1ml acetic
acid to centrifuge tubes containing standard and sample. A corresponding blank standard
and standard was also prepared similar to blank sample and sample respectively. Diluted
sample extract was not added in blank standard and standard solution and 3 ml of water
was added instead of 2 ml. The absorbance of the clear solutions relative to water was
measured at 410nm in a 10mm cuvette.
5.3.4.3.3 Calculation of TIA
The inhibition percentage of the sample extracts solutions by the equation:
100r br s bs
r br
( A A ) ( A A )i %
( A A )
(5.3)
where i is the inhibition percentage, in percent, Ar is the absorbance of the solution with
standard, Abr is the absorbance of the blank with standard, As is the absorbance of the
solution with sample;
Abs is the absorbance of the blank with sample. The TIA activity, expressed in mg of
trypsin inhibited per g of sample was calculated as:
1 1 2
100 o
i m f fTIA
% m
(5.4)
where TIA is the trypsin inhibitor activity, in milligrams per gram, i is the inhibition
percentage, in percent, m0 is the mass of the test sample, in grams, m1 is the mass of
trypsin, in milligrams, f1 is the dilution of the sample extract in milliliters, f2 is a
conversion factor (2.8 × 10⁻⁴
) based on the purity and dilution of trypsin. Trypsin
inhibitor activity in blends is given in Table 5.2.

126
5.4 Results and Discussion
5.4.1 Nutrient Content
The results for crude protein, fat, fiber, ash and NFE of extruded samples obtained
from this experiment ranged from 28.08 to 36.00%, 0.83 to 2.59%, 2.01 to 5.40% and
5.33 6.55% respectively. The multiple regression models for predicting the protein, fat,
fiber, ash values showed 92, 60, 85 and 98% and a non-significant F-value of 67.47, 8.99,
5.88 and 38.96 as lack of fit respectively (Table 5.9). The variable which showed
significant influence on protein content and fat content is the levels of SWF content
(P<0.05) (Table 5.5). The regression analysis results (Table 5.5) indicated that the linear
terms of SWF content had a significant (P<0.05) positive effect on protein content and
negative effect on fat content of extrudates. However, interaction between the
independent variables and quadratics terms had no significant effect. The response
surface plots for protein content in extrudates in shown in Figure 5.1
ANOVA showed that SWF content and screw speed had a significant effect
(P<0.05) but moisture content and temperature as an independent variable had no
significant effect on fiber content in all the extrudates (Table 5.6). However, the
interaction effect of moisture and temperature had significant effect on fiber content. The
response graph shows that fiber content decreased with increasing levels of SWF content
and screw speed (Figure 5.2).
The response surface plot generated for ash content in extrudates is shown in
Figure 5.3. The surface shows that with increase in levels of moisture content and SWF
content, ash content in all the extrudates was increased. Table 5.6 shows that there is no
significant effect of temperature and screw speed on ash content.
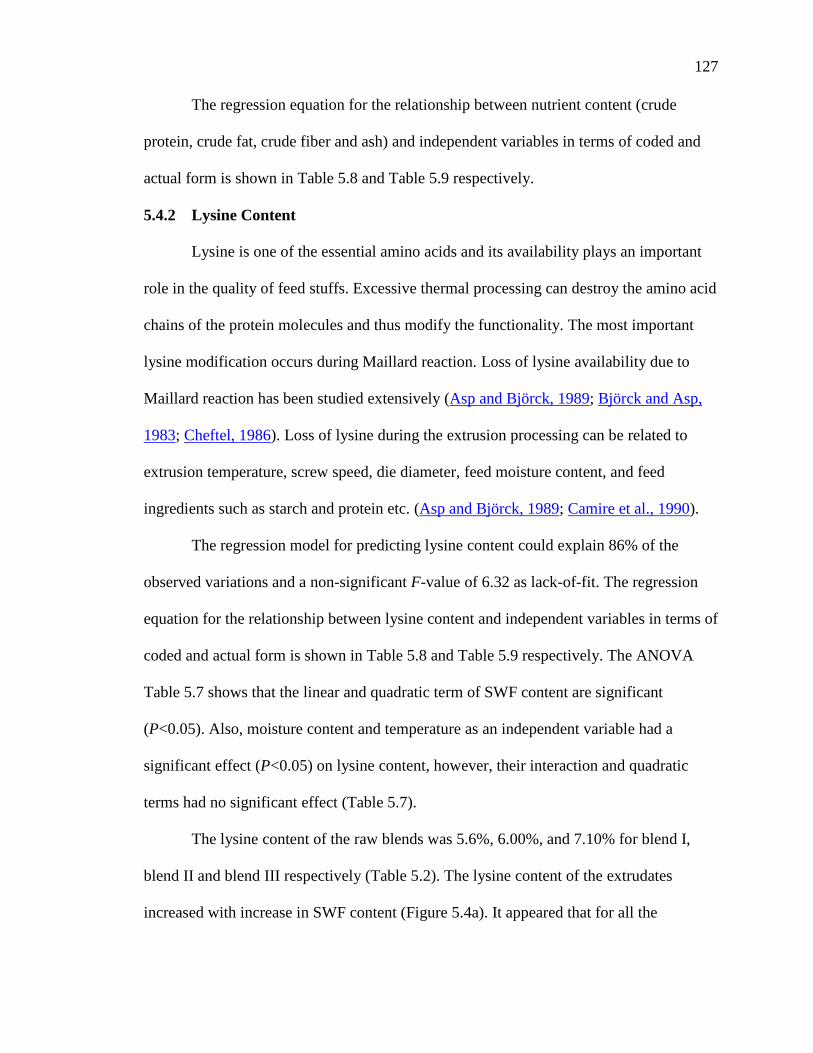
127
The regression equation for the relationship between nutrient content (crude
protein, crude fat, crude fiber and ash) and independent variables in terms of coded and
actual form is shown in Table 5.8 and Table 5.9 respectively.
5.4.2 Lysine Content
Lysine is one of the essential amino acids and its availability plays an important
role in the quality of feed stuffs. Excessive thermal processing can destroy the amino acid
chains of the protein molecules and thus modify the functionality. The most important
lysine modification occurs during Maillard reaction. Loss of lysine availability due to
Maillard reaction has been studied extensively (Asp and Björck, 1989; Björck and Asp,
1983; Cheftel, 1986). Loss of lysine during the extrusion processing can be related to
extrusion temperature, screw speed, die diameter, feed moisture content, and feed
ingredients such as starch and protein etc. (Asp and Björck, 1989; Camire et al., 1990).
The regression model for predicting lysine content could explain 86% of the
observed variations and a non-significant F-value of 6.32 as lack-of-fit. The regression
equation for the relationship between lysine content and independent variables in terms of
coded and actual form is shown in Table 5.8 and Table 5.9 respectively. The ANOVA
Table 5.7 shows that the linear and quadratic term of SWF content are significant
(P<0.05). Also, moisture content and temperature as an independent variable had a
significant effect (P<0.05) on lysine content, however, their interaction and quadratic
terms had no significant effect (Table 5.7).
The lysine content of the raw blends was 5.6%, 6.00%, and 7.10% for blend I,
blend II and blend III respectively (Table 5.2). The lysine content of the extrudates
increased with increase in SWF content (Figure 5.4a). It appeared that for all the

128
extrudates, as the processing temperature increased from 110°C to 140°C, lysine content
decreased significantly (Figure 5.4a). A similar finding was observed by Skrede and
Krogdahl (1985). Also, as moisture content is increased from 20 to 30%, there was a
decrease in lysine content (Figure 5.4b). The results were not in agreement with the
findings of Bjorck et al. (1983); Noguchi et al. (1982), who reported that increase in
moisture content resulted in increase in lysine content.
5.4.3 Trypsin Inhibitor Activity
Soybean contains heat labile anti-nutrient which affects the activity of protease
enzymes in animals. The inclusion of soy product in aquafeed poses challenge due to the
presence of protease inhibitors (trypsin inhibitors). Soybean protease inhibitors cause
reduced protein digestibility (Laskowski and Kato, 1980) and loss of energy and protein
(Nitsan and Liener, 1976; Olli et al., 1994a; Skrede and Krogdahl, 1985). The protease
inhibitors in soy may be readily inactivated or destroyed during feed processing that
involves heat, although the efficiency of inhibition depends on temperature, moisture and
residence time in the extruder (Björck and Asp, 1983; Clarke E and Wiseman, 1999;
Zarkadas and Wiseman, 2005).
The trypsin inhibitor activity of the blends containing 20 to 50% soy white flakes
extruded at different temperature was analyzed. The TIA was highest in the un-extruded
diet. Extrusion reduced TIA in all diets and the maximum reduction achieved in the
extrudates was approximately 40%. Changing the level of soy white flakes content and
processing temperature from 110°C to 140°C had a significant effect on TIA (Table 5.7).
The response surface plot presented in Figure 5.5 shows that lower TIA was achieved
when temperature was increased. Also, TIA of the extrudates is decreased when levels of

129
SWF content was decreased from 50 to 20%. Soy products containing less than 5mg/g
(mg bovine trypsin inhibited/g feed) are thought to have been sufficiently heated for
rainbow trout and Atlantic salmon (Barrows et al., 2007; Olli et al., 1994a). All the
extrudates analyzed had lower TIA than 5mg/g of sample which is indication of adequate
heat processing of soy product included in the blend (Figure 5.5).
ANOVA showed that moisture content and screw speed had no significant effect
on trypsin inhibitor activity and hence response surface plots of interaction effect
involving soy white flakes, moisture content and screw speed are not shown. The
regression equation for trypsin inhibitor activity in coded and actual form is shown in
Table 5.8 and Table 5.9 respectively.
5.4.4 Optimization and validation
Numerical optimization was carried out in Design Expert v8 considering all seven
dependent variables. The optimization resulted in 63 solutions and the top 12 solutions
are shown in Table 5.10. Validation of the predicted responses was carried out by
extruding the blends at three different optimum conditions as shown in Table 5.10. Good
agreement was found between the predicted and experimental values. The experimental
values for solution #11 were very close to the predicted values. The optimum condition
was: 47.55% SWF, 20.01% moisture content, 140°C barrel temperature and 100 rpm
screw speed.
5.5 Conclusions
Experiments were conducted in a single screw extruder to model and optimize the
effect of extrusion processing parameters on nutritional properties of extrudates.
Response surface methodology revealed the significant effects of soy white flakes,

130
moisture content, barrel temperature on the nutritional properties of extruded aquafeed.
The effects of soy white flakes on most of the properties of the extrudates were found to
be quadratic; the effects were linear for crude fat and crude fiber content. As level of
SWF content was increased from 20 to 50%, there was an increase in lysine content, TIA,
protein content, ash content and decrease fat and fiber content. Moisture had a linear
effect on lysine and ash content. Temperature had a linear effect on lysine content and
trypsin inhibitor activity, where increasing the barrel temperature from 110°C to 140°C
decreased the lysine content and TIA in the extrudates. Further reduction of TIA content,
beyond the levels obtained in the present study, could probably be achieved by using
more severe extrusion conditions, but the chemical composition and nutritive value could
then have been negatively affected. Screw speed as an independent variable had no
significant effect on any of the properties studied. However, interactive effects of screw
speed, moisture and temperature had significant effect on fiber content. This study will be
useful in identifying desirable operating conditions for the production of extruded aqua
feed using soy white flakes as an alternative protein source.

131
Table 5.1 Ingredient composition of blends
Feed ingredients Mass of ingredients (g kg−1
dry matter)
Blend I Blend II Blend III
Soy white flakes 200 350 500
HP-DDG 400 250 100
Corn flour 300 300 300
Fish meal 50 50 50
CGM 20 20 20
Vitamin & mineral mix 20 20 20
Soybean oil 10 10 10
†HP-DDG – High protein distiller’s dried grains; CGM – Corn gluten meal

132
Table 5.2 Analyzed proximate composition, Lysine and TIA of feed blends
Chemical composition Blend I Blend II Blend III
Crude protein (% DM) 33.15 34.45 35.74
Crude Fat (% DM) 4.94 4.31 3.69
Crude Fiber (% DM) 3.75 3.24 2.74
Ash (% DM) 5.54 5.80 6.07
NFE (% DM) 52.63 52.19 51.76
Lysine (% protein) 5.60 6.00 7.10
TIA (mg/g) 4.20 4.40 4.50
†DM – Dry matter; NFE – Nitrogen free extract; TIA – Trypsin inhibitor activity

133
Table 5.3 Independent numerical variables and their levels
Numerical variable Symbol Coded variable levels
-1 0 1
Soy white flakes (%) X1 20 35 50
Moisture content (%db) X2 20 25 30
Temperature (°C) X3 110 125 140
Screw speed (rpm) X4 100 150 200

134
Table 5.4 Experimental design layout
Run Coded variable
Actual Variable
x1 x2 x3 x4
X1 (%) X2 (%db) X3 (°C) X4 (rpm)
1 0 0 0 0
35 25 125 150
2 -1 0 0 -1
20 25 125 100
3 -1 -1 0 0
20 20 125 150
4 1 0 -1 0
50 25 110 150
5 0 0 1 1
35 25 140 200
6 0 0 -1 1
35 25 110 200
7 1 0 1 0
50 25 140 150
8 0 -1 0 1
35 20 125 200
9 0 1 1 0
35 30 140 150
10 1 1 0 0
50 30 125 150
11 0 1 0 -1
35 30 125 100
13 -1 0 0 1
20 25 125 200
14 0 0 0 0
35 25 125 150
15 0 -1 1 0
35 20 140 150
16 0 0 0 0
35 25 125 150
17 0 0 -1 -1
35 25 110 100
18 1 0 0 -1
50 25 125 100
19 -1 0 1 0
20 25 140 150
20 0 -1 -1 0
35 20 110 150
21 0 0 1 -1
35 25 140 100
22 -1 0 -1 0
20 25 110 150
23 0 0 0 0
35 25 125 150
24 1 0 0 1
50 25 125 200
25 0 -1 0 -1
35 20 125 100
26 -1 1 0 0
20 30 125 150
27 0 1 0 1
35 30 125 200
28 1 -1 0 0
50 20 125 150
29 0 1 -1 0
35 30 110 150

135
Table 5.5 Analysis of variance (ANOVA) for Crude Protein, Crude Fat
Crude Protein
Crude Fat
Source df SS MS F-value P-value
SS MS F-value P-value
Model 4 124.80 31.20 67.47 < 0.0001
4.13 1.03 8.99 0.0001
X1 1 124.72 124.72 269.71 < 0.0001
3.59 3.59 31.19 < 0.0001
X2 1 0.03 0.03 0.06 0.8162
0.12 0.12 1.06 0.3127
X3 1 0.03 0.03 0.05 0.8180
0.02 0.02 0.17 0.6802
X4 1 0.02 0.02 0.05 0.8289
0.40 0.40 3.51 0.0732
Residual 24 11.10 0.46 - -
2.76 0.12 - -
Lack of Fit 20 7.30 0.36 0.38 0.9331
1.77 0.09 0.36 0.9453
Pure Error 4 3.80 0.95 - -
0.99 0.25 - -
†df , degrees of freedom; SS, sum of squares; MS, mean square.

136
Table 5.6 Analysis of variance (ANOVA) for Crude Fiber and Ash
Crude Fiber
Ash
Source df SS MS F-value P-value
SS MS F-value P-value
Model 14 12.97 0.93 5.88 0.0010
2.43 0.17 38.96 < 0.0001
X1 1 3.17 3.17 20.14 0.0005
2.16 2.16 485.13 < 0.0001
X2 1 0.06 0.06 0.37 0.5526
0.05 0.05 11.80 0.0040
X3 1 0.02 0.02 0.14 0.7138
0.00 0.00 0.29 0.6003
X4 1 1.59 1.59 10.10 0.0067
0.00 0.00 0.17 0.6843
X1² 1 0.62 0.62 3.93 0.0674
0.12 0.12 26.36 0.0002
X2² 1 0.00 0.00 0.02 0.8820
0.00 0.00 0.59 0.4568
X3² 1 2.29 2.29 14.54 0.0019
0.00 0.00 0.06 0.8136
X4² 1 0.00 0.00 0.03 0.8747
0.00 0.00 0.38 0.5473
X1X2 1 0.14 0.14 0.89 0.3625
0.07 0.07 16.16 0.0013
X1X3 1 0.81 0.81 5.11 0.0402
0.00 0.00 0.02 0.8848
X1X4 1 0.89 0.89 5.66 0.0321
0.00 0.00 0.01 0.9314
X2X3 1 1.21 1.21 7.66 0.0151
0.01 0.01 1.45 0.2491
X2X4 1 0.45 0.45 2.86 0.1129
0.00 0.00 0.00 0.9980
X3X4 1 1.91 1.91 12.10 0.0037
0.00 0.00 0.41 0.5306
Residual 14 2.21 0.16 - -
0.06 0.00 - -
Lack of Fit 10 1.54 0.15 0.91 0.5888
0.06 0.01 12.96 0.0124
Pure Error 4 0.67 0.17 - -
0.00 0.00 - -
†df , degrees of freedom; SS, sum of squares; MS, mean square.

137
Table 5.7 Analysis of variance (ANOVA) for Lysine content and TIA
Lysine
TIA
Source df SS MS F-value P-value
SS MS F-value P-value
Model 14 4.63 0.33 6.32 0.0007
3.03 0.22 5.15 0.0021
X1 1 2.54 2.54 48.62 < 0.0001
1.29 1.29 30.63 < 0.0001
X2 1 0.43 0.43 8.18 0.0126
0.00 0.00 0.10 0.7600
X3 1 0.26 0.26 5.03 0.0417
0.63 0.63 14.92 0.0017
X4 1 0.05 0.05 0.86 0.3701
0.16 0.16 3.90 0.0684
X1² 1 1.17 1.17 22.32 0.0003
0.72 0.72 17.11 0.0010
X2² 1 0.08 0.08 1.55 0.2340
0.03 0.03 0.66 0.4310
X3² 1 0.04 0.04 0.76 0.3976
0.00 0.00 0.11 0.7490
X4² 1 0.12 0.12 2.26 0.1549
0.05 0.05 1.21 0.2908
X1X2 1 0.01 0.01 0.17 0.6821
0.00 0.00 0.09 0.7668
X1X3 1 0.01 0.01 0.16 0.6977
0.02 0.02 0.52 0.4817
X1X4 1 0.07 0.07 1.35 0.2652
0.00 0.00 0.02 0.9032
X2X3 1 0.00 0.00 0.08 0.7778
0.06 0.06 1.38 0.2598
X2X4 1 0.05 0.05 0.88 0.3648
0.01 0.01 0.25 0.6258
X3X4 1 0.02 0.02 0.32 0.5789
0.12 0.12 2.77 0.1183
Residual 14 0.73 0.05 - -
0.59 0.04 - -
Lack of Fit 10 0.64 0.06 2.80 0.1664
0.50 0.05 2.16 0.2379
Pure Error 4 0.09 0.02 - -
0.09 0.02 - -
†df , degrees of freedom; SS, sum of squares; MS, mean square, TIA – Trypsin Inhibitor activity

138
Table 5.8 Final equations in terms of coded factors after excluding the insignificant terms for Lysine, TIA, crude protein, crude fat,
crude fiber and ash content
Coded model equation R² Adj R² Pred R² Adeq precision
2
1 2 3 14.98 0.46 0.19 0.15 0.42LysY x x x x 0.86 0.73 0.28 8.01
2
1 3 13.79 0.33 0.23 0.33TIAY x x x 0.84 0.67 0.17 8.58
132.22 3.22CPY x 0.92 0.90 0.89 23.16
11.75 0.55CFY x 0.60 0.53 0.44 10.37
1 4 1 3 1 4 2 3 3 4
2
3
4.26 0.51 0.36 0.45 0.47 0.55 0.69
0.59
CFbY x x x x x x x x x x
x
0.85 0.71 0.35 10.25
2
1 2 1 2 15.64 0.42 0.07 0.13 0.13AshY x x x x x 0.98 0.95 0.86 23.27

139
Table 5.9 Best-fit response surface models for extrudate nutritional properties
Response surface model R² Std. deviation F-statistic P-value
2
1 2 3 113.575 0.116 0.164 0.080 0.0018LysY X X X X 0.86 0.23 6.32 0.0007
2
1 3 18.841 0.076 0.072 0.0015TIAY X X X 0.84 0.21 5.15 0.0021
124.220 0.215CPY X 0.92 0.68 67.47 < 0.0001
11.628 0.036CFY X 0.60 0.34 8.99 0.0001
1 4 1 3 1 4 2 3
2
3 4 3
45.39 0.28 0.17 0.002 0.0006 0.0073
0.0009 0.003
CFbY X X X X X X X X
X X X
0.85 0.40 5.88 0.0010
2
1 2 1 2 14.362 0.056 0.022 0.0017 0.0006AshY X X X X X 0.98 0.07 38.96 < 0.0001

140
Table 5.10 Solutions for optimal conditions and validation
Solution
#
SWF
(%)
MC
(%db)
T
(°C)
SS
(rpm)
Lysine
(% protein)
TIA
(mg/g)
Crude Protein
(%db)
Crude Fat
(%db)
Crude Fiber
(%db)
Ash
(% db)
1 50.00 20.00 140 100 6.30 3.0 35.49 0.96 2.51 6.05
2 50.00 20.10 140 100 6.29 3.0 35.49 0.96 2.49 6.05
3 50.00 20.00 140 101 6.29 3.0 35.49 0.96 2.52 6.05
4 50.00 20.00 140 103 6.28 3.0 35.49 0.97 2.54 6.05
5 50.00 20.46 140 100 6.27 3.0 35.50 0.97 2.42 6.06
6 49.79 20.00 139 100 6.27 3.0 35.44 0.96 2.66 6.04
7 50.00 20.00 140 105 6.27 3.0 35.49 0.98 2.56 6.05
8 48.50 20.00 140 100 6.15 3.0 35.17 1.01 2.73 6.00
9 50.00 20.00 140 115 6.22 3.1 35.48 1.01 2.66 6.05
10 50.00 20.00 135 100 6.25 3.2 35.48 0.94 3.09 6.04
11 47.55 20.01 140 100 6.07 3.0 34.96 1.05 2.81 5.96
12 50.00 24.29 140 100 6.13 3.2 35.53 1.04 1.67 6.17
Validation
9 50.00 20.00 140 115 6.15 3.2 34.40 0.95 3.10 6.25
10 50.00 20.00 135 100 6.30 3.3 35.00 0.94 2.91 5.89
11 47.55 20.01 140 100 6.10 2.9 34.91 1.10 2.85 6.00
12 50.00 24.29 140 100 6.08 3.1 34.20 0.92 2.60 6.01
†SWF, soy white flakes; MC, moisture content of blends; T, temperature; SS, screw speed; TIA, trypsin inhibitor activity; NFE,
nitrogen free extract

141
Figure 5.1 Response surface plot of crude protein content in extrudates for the interaction
effect of soy white flakes content and temperature at 25% moisture content and 150 rpm
screw speed.

142
Figure 5.2 Response surface plots of crude fiber content in extrudates for the effect of (a)
soy white flakes content and screw speed at 25% moisture content and 125°C, and (b)
temperature and screw speed at 35% soy white flakes content and 25% moisture content.

143
Figure 5.3 Response surface plot of ash content in extrudates for the interaction effect of
moisture content and soy white flakes content 125°C temperature and 150 rpm screw
speed.

144
Figure 5.4 Response surface plots of lysine content in extrudates for the effect of (a)
temperature and soy white flakes content at 25% moisture content and 150 rpm and (b)
moisture content and soy white flakes content at 125°C and 150 rpm.

145
Figure 5.5 Response surface plot of trypsin inhibitor activity for the interaction effect of
temperature and soy white flakes content at 25% moisture content and 150 rpm screw
speed.

146
CHAPTER 6 †
A Viscosity Model for Soy White Flakes Based Aquafeed Dough in a Single Screw
Extruder
6.1 Abstract
A viscosity model was developed to study the influence of soy white flakes
during extrusion of fish feed and the effect of extrusion processing parameters on mass
flow rate, torque, specific mechanical energy and viscosity of dough inside a single screw
extruder were evaluated. Full factorial design was used for three variables each at three
levels which generated total 27 experimental runs. Round capillary die rheometer was
used to determine the rheological data of the dough within the extruder. It was observed
that increase in the soy white flakes content resulted in a higher mass flow rate, torque
and specific mechanical energy and a decrease in the apparent viscosity. The specific
mechanical energy, mass flow rate increased and viscosity decreased with increase in
screw speed. Higher barrel and die temperature led to decrease in the apparent viscosity
of the dough, torque and specific mechanical energy. The viscosity model developed in
this study can be applied to develop large-scale extrusion models to determine the effect
of soy white flakes on the feed material extrudates.
6.2 Introduction
Feed and food extrusion cooking is a unit operation in which various products are
produced using cereals, oilseeds or other carbohydrate mixtures. Fish feed is one of these
extruded products. Extrusion cooking is a high-temperature short-time process in which
final product is obtained by a combination of several unit operations such as heating,
† Singh, S.K. and Muthukumarappan, K., 2016. A viscosity model for soy white flakes based aquafeed
dough in a single screw extruder. Journal of Food Process Engineering. DOI: 10.1111/jfpe.12357

147
mixing, shearing and forcing the material through a die in a single step. Soy white flakes
(SWF) contains high quantity of protein (42%) and previous laboratory experiments with
soy white flakes have yielded extrudates with physical properties that were found to be
suitable for aquaculture feeds (Singh and Muthukumarappan, 2014a, b; Singh and
Muthukumarappan, 2015). However, for consistent large scale production of aquaculture
feeds using soy white flakes as a protein source, a thorough understanding regarding the
changes occurring inside the extruder is necessary.
During extrusion, the rate and extent of cooking, mixing, shearing and
compressing processes are strongly related to the rheological properties of the raw
materials. Viscosity is one of the most important rheological properties of non-Newtonian
biological materials and is often used for continuous online control of product
characteristics (Chen et al., 1978; Lam and Flores, 2003). The viscosity of the dough
inside extruder barrels has been studied by many authors. For example, the viscosity of
dough of different grains including wheat, corn, and soybean were measured using
straight tube viscometer (Harper et al., 1971), cylindrical dies of different lengths
(Harmann and Harper, 1974), capillary die (Jao et al., 1978), viscoamylograph (Remsen
and Clark, 1978), and capillary rheometer (Luxenburg et al., 1985) attached to food
extruders, and viscosity models have been developed. Even though a number of models
exists, no single model has won universal acceptance. Harper et al. (1971) developed a
viscosity model equation for biological materials as:
1
1exp( / )nK b T (6.1)
where η is the apparent viscosity of the dough inside the barrel (Pa.s), K is a consistency
factor (Pa.sn), is the shear rate (1/s), n is the flow behavior index (dimensionless), T is

148
the product temperature at the barrel (K), b1 is an empirical constant for temperature (K).
Many researchers used this same model to study the viscosity of dough in extruders
(Altomare et al., 1992; Bhattacharya and Hanna, 1986; Harmann and Harper, 1974; Jao et
al., 1978; Luxenburg et al., 1985; Remsen and Clark, 1978). The previous researchers
mainly focused on the effects of shear rate, temperature, moisture content, time-
temperature history, strain history, and starch gelatinization on viscosity. Not many
models show the effect of ingredient levels on viscosity, although the influence of
ingredient levels on the final properties of extrudate has been recognized. Lam and Flores
(2003) introduced a correction factor for the particle size distribution of the raw
ingredients in the viscosity model of dough inside the barrel of a single screw extruder.
To date, however, no study has been attempted to quantify the viscosity of dough
containing relatively high concentrations of soy white flakes.
The objectives of this study were (a) to develop a viscosity model as a function of
shear rate, temperature and level of SWF, and (b) to study the effect of SWF level, screw
speed, and temperature profile on extrusion processing parameters including mass flow
rate, torque, specific mechanical energy and viscosity of the dough.
6.3 Materials and Methods
6.3.1 Raw materials and feed formulation
Soy white flakes were donated by South Dakota Soybean Processors (Volga, SD).
Corn flour was purchased from Cargill Dry Ingredients (Paris, IL). Dried distiller’s grains
with solubles (DDGS) were obtained from POET (Sioux Falls, SD). Corn gluten meal
and fishmeal was purchased from Consumer Supply Distributing Co. (Sioux City, IA).
Vitamin and mineral premix was obtained from Lortscher Agri Service, Inc. (Bern,

149
Kansas, USA). Soybean oil was obtained from USDA (Brookings, SD). Three iso-
nitrogenous blends (hereafter referred to as “dough”) were formulated with a net protein
content of 32.7% db. The different ingredients in the dough include soy white flakes,
DDGS, corn gluten meal (CGM), corn flour, fish meal, soybean oil, and vitamin-mineral
mix (Table 6.1). The ingredients were mixed in a laboratory scale Hobart mixer (Hobart
Corporation, Troy, Ohio, USA) for 10 minutes and stored overnight at ambient
temperature for moisture stabilization. The moisture balancing of the doughs was kept
constant at 25% wb and was done by adding required quantities of water during mixing.
Before extrusion, moisture content of doughs were determined using the method 44-15A
(AACC, 2000). The proximate composition of the feed blends is represented in Table 6.2.
6.3.2 Experimental design
Experiments were conducted using a full factorial design with three variables. The
three independent variables were SWF content, barrel temperature profile and screw
speed of the extruder. Extrusion trials were conducted using three levels of each variable
(Table 6.3) keeping moisture content constant at 25% db for a total of 27 treatments.
6.3.3 Extrusion
To monitor the data necessary for the viscosity measurements, extrusion
processing was performed using a single screw extruder (Brabender Intelli-Torque Plasti-
Corder®, South Hackensack, NJ) at Industrial Agricultural Products Center, University
of Nebraska, Lincoln, NE which was powered by a 7.5-HP motor with an operating range
of screw speeds from 0 to 225 rpm. The extruder had a barrel with length to diameter
ratio of 20:1 and a barrel diameter of 19 mm. A uniform 19 mm pitch screw with
compression ratio of 3:1 was used in the experiments. The extrusion experiments were

150
performed varying screw speed from 80 rpm to 160 rpm. The extruder barrel was
equipped with external band heaters with provisions to control the temperature of all
three zones: feeding zone, metering zone and die zone. The material was fed through the
feed hopper to the feeding zone and conveyed to the metering zone where it gets
gelatinized and plasticized under thermal and mechanical stresses generated by the
rotation of screws. The gelatinized material then enters the die zone where the die section
is fully filled due to pressure generated at die nozzle. The levels of temperature gradient
in the barrel are 45-100-100oC, 45-120-120
oC, 45-140-140
oC hereafter referred to as
temperature of 100, 120, and 140oC. The temperature of the melt was kept same at the
metering zone and die zone of the extruder for each experimental condition. When the
process reached the steady state, samples were collected at the die.
6.3.4 Viscosity Measurement
Rheological data of the dough within the extruder were determined online by a
round capillary die rheometer mounted to the head of the extruder. Figure 6.1(a) presents
the schematic of the round capillary die used in this study. An illustration of the
experimental set–up can be seen in Figure 6.2(a). Material enters the die’s orifice,
converging at a 30o angle to pressure restriction neck [Figure 6.2(b)]. After the material
has reached the main channel, it flows past the flush mounted temperature and pressure
monitoring ports, and is then forced into a capillary nozzle insert [Figure 6.2(c)]. A high
pressure region is generated at the entrance of the nozzle insert and is recorded by the
pressure transducer which was used in the determination of the pressure drop across the
nozzle insert with respect to atmospheric pressure. Three capillary die nozzle inserts, all 2
mm in diameter, were used to determine entrance pressure drops and to perform Bagley

151
corrections. Length/Diameter (L/D) ratios were 10:1, 15:1, and 20:1 [Figure 6.1(b)]. The
rheological properties of the dough were calculated from the pressure drop of the flow in
die. Various shear rates necessary to obtain a viscosity curve were generated by
increasing the screw speed of the extruder from 80 to 160 rpm. Die temperatures were
measured with a thermocouple in melt contact prior to the capillary entrance: pressures
were monitored with a Dynisco pressure transducer at the same position. The temperature
of the rheometer was kept constant as the exit temperature of the dough (i.e. temperature
at the end of the extruder) using a heating jacket. Measurements of pressure drops and
temperatures were made when steady state was reached. The mass flow rate was
measured by weighing the product at the die exit, at given time intervals (30 sec). For
each extrusion condition, i.e. with a given melt temperature and SWF content level, ten
pressure readings were taken. The measurements were repeated for each L/D ratio (L/D =
10, 15 and 20). The shear stress (Pa) can be calculated by Eq. (6.2)
2
PR
L
(6.2)
where ΔP is the pressure drop (Pa) measured across the capillary nozzle insert with
respect to atmospheric pressure having capillary length L (mm) and radius R (mm) = D/2.
By varying the L/D ratios of die nozzle inserts, the appropriate Bagley correction factor
was applied in the calculation of shear stress at the wall of the die to offset the effects of
entrance and exit pressure. The apparent shear rate app (s-1
) was calculated by Eq. (6.3).
3
4app
Q
R
(6.3)

152
where Q is the volumetric flow rate (mm3/s), R is the capillary radius (mm). The
Weissenberg–Rabinowitsch correction was applied to obtain the true shear rate t (s-1
) to
compensate for the non-laminar flow of a viscoelastic biopolymer as follows:
1
34
app
t app
ln
ln
(6.4)
The true viscosity t (Pa.s) was calculated using Eq. (6.5).
t
t
(6.5)
6.3.5 Statistical Analysis
The statistical analysis was performed with the Statistical Analysis System v9.3
(SAS Institute, Cary, NC). Multiple regression analysis (SAS) was used to determine the
parameters of the viscosity equations. Second-order polynomial regression equations
were generated using Design Expert v8 and response surface plots were produced.
6.4 Results and Discussion
6.4.1 Viscosity Model
The experimental data were compared with the data obtained from Eq. (6.1). It
was found that Eq. (6.1) did not closely fit the experimental data (R2
= 0.824), because it
did not consider the soy white flakes influence. When exponential models based on Eq.
(6.1) with a multiplying SWF term were used to describe the data, the R2 decreased and
when exponential models with the reciprocal SWF term were used to describe the data,
the R2 increased. Thus, the viscosity of dough had an inverse relationship with the SWF
level. The empirical model is presented as Eq. (6.6) and its parameters are shown in
Table 6.4. This model includes the effects of SWF, shear rate and temperature on

153
viscosity. Modeling the viscosity comprises estimating the parameters n, b1, and b2 by
multiple linear regression analysis. This was achieved by linearizing the above equation
by taking the natural logarithm on both sides. The results show a shear thinning behavior
(n = 0.95) of proteinaceous dough (~ 32.8 %db), as also reported in (Cervone and Harper,
1978; Harmann and Harper, 1973, 1974; Remsen and Clark, 1978).
1
1 2exp( / )exp( / )nK b T b SWF (6.6)
The reciprocal temperature shows that increase in viscosity was caused by
decreasing product temperature over the range of temperatures studied. These results are
consistent with the results of other studies (Bhattacharya and Hanna, 1986; Chen et al.,
1978; Harper et al., 1971; Kokini et al., 1992). The response surface plot in Figure 6.3
shows the change in viscosity with different screw speed and temperature at 40% SWF
level.
6.4.2 Effect of Temperature Profile
Temperature profile had a significant effect (p<0.05) on the studied extrusion
processing parameters (Table 6.5). The apparent viscosity of the dough decreased as
temperature increased, and was lowest at the highest temperature profile (Figure 6.3).
Similar trends were observed by (Lam and Flores, 2003) during extrusion of fish feed
blends in a single screw extruder. Moreover, the mass flow rate at higher temperatures
was found to be higher, while the torque required to rotate the screw decreased, probably
due to the higher degree of melting at the higher temperatures, which thus resulted in
decreased viscosity of the ingredient melt inside the barrel (Figure 6.5 and Figure 6.6). In
general, viscosity of fluid materials decreases with increasing temperature in an
Arrhenius fashion, so results of this type would be expected in the fully melted feed

154
material and the resulting dough. Because the reduced viscosity facilitated a reduced
torque requirement, as the temperature was increased, the specific mechanical energy
also decreased.
6.4.3 Effect of Screw speed
Screw speed also had a significant effect (p<0.05) on the extrusion parameters
studied in the experiment (Table 6.5). As screw speed increased from 80 to 160 rpm, the
mass flow rate increased (Figure 6.6). This behavior was expected, because drag flow in
extruders has been shown to be directly proportional to screw speed (Harper, 1981), and
higher screw speeds generally result in higher mass flow rates. The apparent viscosity
decreased on increasing the screw speed from 80 rpm to 160 rpm (Figure 6.3), indicating
that the molten dough inside the barrel exhibited shear thinning behavior. Increasing
screw speed reduces viscosity due to increased shear rates and molecular degradation.
Specific mechanical energy was also found to be significant which increased with
increase in screw speed (Figure 6.4).
6.4.4 Effect of SWF Level
The level of SWF content in the ingredient mix had a significant effect (p<0.05)
on all extrusion parameters studied (Table 6.5). Increasing SWF content from 30 to 50%
resulted in a decrease in viscosity. The average protein content of the feed blends was
32.8% (db) and there was no significant difference in protein content between them. But,
the blend containing 30% SWF did have 19.0% higher fiber content, and 18.1% higher
ash content compared to the blend containing 50% SWF (Table 6.2). Increase in SWF in
the blend resulted in an increase in carbohydrates or Nitrogen Free Extract (Table 6.2),
which led to an increased level of gelatinized starch in the ingredient melt inside the

155
barrel during processing. It also led to lower fiber content. These differences in chemical
constituents in itself may have contributed to the decreased apparent viscosity when the
SWF content in the ingredient blend was increased from 30% to 50% (Jin et al., 1994),
and may have also contributed to the competing effects between the various extrusion
processing parameters. Increasing the SWF content from 30% to 50% resulted in a
significant increase in the torque requirements.
6.5 Conclusions
We examined the processing behavior of SWF blends and investigated the
viscosity of developed doughs in the laboratory extruder. Aquaculture feed mixes used in
this study exhibited shear thinning behavior for blends containing SWF up to 50%. By
power law modeling of the observed apparent viscosity during processing, it was
determined that the coefficient for temperature was much higher than the coefficient for
SWF, which indicated that the viscosity of the blends is greatly affected by the level of
temperature. Increasing the SWF content resulted in a higher mass flow rate, torque and
specific mechanical energy. The specific mechanical energy and mass flow rate increased
and viscosity decreased as screw speed increased. At higher temperatures in the barrel
and the die, the viscosity of the dough decreased, which led to a decreased torque
requirement and specific mechanical energy.

156
Table 6.1 Ingredient composition of feed blends.
Feed Ingredients Mass of ingredients (g/100g dry matter)
Blend I Blend II Blend III
Soy white flakes 30 40 50
DDGS 29 15 4
Corn Flour 25 30 33
Fish meal 5 3 0
Corn gluten meal 6 6 6
Vitamin & Mineral mix 2 2 2
Soy bean oil 4 4 5
†DDGS - Distiller’s dried grains with solubles

157
Table 6.2 Proximate composition of the feed blends (% dry matter).
Crude protein Crude fat Ash Crude fiber NFE
(%) (%) (%) (%) (%)
Blend I 32.91 6.03 5.74 3.89 51.42
Blend II 32.72 6.00 5.28 3.55 52.45
Blend III 32.70 5.94 4.70 3.25 53.41
†NFE – Nitrogen Free Extract

158
Table 6.3 Experimental levels of independent variables.
Independent variable 1 2 3
Soy white flakes (%) 30 40 50
Barrel temperature (oC)
† 45-100-100 45-120-120 45-140-140
Screw speed (rpm) 80 120 160
†Feeding zone-metering zone-die zone

159
Table 6.4 Coefficients for the viscosity equation.
Equation
Parameters
Parameter
Estimate
Standard
Error
t for Ho
Parameter = 0 Prob > |t|
ln(K) -290.393 27.4428 -10.58 < 0.0001
(n-1) -0.04113 0.00595 -6.92 < 0.0001
b1 196424 13261 14.81 < 0.0001
b2 -1071.70 214.011 -5.01 < 0.0001
†K – Consistency factor; n – flow behavior index; b1 – empirical constant for temperature;
b2 – empirical constant for soy white flakes

160
Table 6.5 Interaction results for soy white flakes content (SWF), temperature (T) and
screw speed (SS) on process parameters (P values).
Variable Viscosity SME Torque Mass flow rate
(Pa.s) (W-h/kg) (N-m) (kg/h)
SWF < 0.0001 < 0.0001 < 0.0001 < 0.0001
T < 0.0001 < 0.0001 < 0.0001 < 0.0001
SS < 0.0001 < 0.0001 < 0.0001 < 0.0001
SWF×T 0.7666 0.3536 0.0340 0.7252
SWF×SS 0.2109 0.0389 0.3193 0.4747
T×SS < 0.0001 < 0.0001 0.0655 < 0.0001
†SME – Specific mechanical energy

161
Figure 6.1 (a) Round capillary die and (b) Capillary nozzles having different L/D ratio

162
Figure 6.2 (a) Schematic representation of an extruder/die configuration and position of
temperature /pressure transducers (b) cross sectional view of a round capillary die and (c)
capillary nozzle

163
Figure 6.3 Response surface plot of viscosity for the effect of screw speed and
temperature at 40% soy white flakes

164
Figure 6.4 Response surface plots of specific mechanical energy for the effect of (A)
Screw speed and soy white flakes at 120 oC, (B) Screw speed and temperature at 40% soy
white flakes
(A) (B)

165
Figure 6.5 Response surface plot of torque for the effect of temperature and soy white
flakes at 120 rpm

166
Figure 6.6 Response surface plot of mass flow rate for the effect of screw speed and
temperature at 40% soy white flakes

167
CHAPTER 7 †
Rheological Characterization and CFD Simulation of Soy White Flakes Based
Dough in a Single Screw Extruder
7.1 Abstract
Understanding the rheological properties such as shear profile, viscosity of dough
inside the extruder is very important for product development, process control, final
product quality, and scaling up operations. This study aims to characterize the rheological
properties of high protein dough and perform isothermal flow simulation in a complex
geometry for generalized Newtonian fluids. The flow of soy white flakes based dough in
a single screw extruder was simulated by using computational fluid dynamics (CFD).
Process conditions considered were screw speeds (40, 80, 120, 160, 200 rpm), barrel
temperature (100, 120, 140oC) and soy white flakes (SWF) contents (30, 40, 50%db). A
Mesh Superposition Technique was used to reduce the geometrical complexity.
Simulation results were validated quantitatively by experimental data. The results showed
good agreement between experimental and computational results. Moreover, the flow
profiles in the extruder were analyzed by using the influence of screw speed and level of
soy white flakes content. Qualitative behavior of local shear rate and viscosity along the
screw are analyzed and comparisons of different process conditions are presented. The
results of these simulations can be used to optimize processing conditions and also to
improve the product quality of extrudates.
† Singh, S.K. and Muthukumarappan, K., 2016. Rheological characterization and CFD simulation of soy
white flakes based dough in a single screw extruder. Journal of Food Process Engineering. DOI:
10.1111/jfpe.12368

168
7.2 Introduction
Feed and food extrusion cooking is a unit operation in which various products are
produced using cereals, oilseeds or other carbohydrate mixtures. Fish feed is one of these
extruded products. Extrusion cooking is a high-temperature short-time process in which
final product is obtained by a combination of several unit operations such as heating,
mixing, shearing and forcing the material through a die in a single step. Previous
laboratory experiments with soy white flakes have yielded extrudates with physical
properties that may be suitable for aquaculture feeds (Singh and Muthukumarappan,
2014a, b; Singh and Muthukumarappan, 2015). However, for consistent large scale
production of aquaculture feeds using soy white flakes as protein source, a thorough
understanding regarding the changes occurring inside the extruder is necessary. During
extrusion, the rate and extent of cooking, mixing, shearing and compressing processes are
strongly related to the rheological properties of the raw materials. The knowledge of
temperature and shear profiles within the extruder helps in controlling the quality of the
final product (Emin et al., 2011). Different raw materials have different rheological
properties. Hence, understanding the rheology of a melt/dough inside the extruder can
help to optimize product development, process control, product quality, and scale up
processes (Lam and Flores, 2003).
Viscosity is one of the most important rheological properties of non-Newtonian
biological materials. The viscosity of the dough inside extruder barrels has been studied
by many authors. For example, the viscosity of dough of different grains including wheat,
corn, and soybean were measured using straight tube viscometer (Harper et al., 1971),
cylindrical dies of different lengths (Harmann and Harper, 1974), capillary die (Jao et al.,

169
1978), viscoamylograph (Remsen and Clark, 1978), and capillary rheometer (Luxenburg
et al., 1985) attached to food extruders, and viscosity models have been developed.
Harper et al. (1971) developed a viscosity model where they incorporated moisture and
temperature effects. Many researchers used this same model to study the viscosity of
dough in extruders (Altomare et al., 1992; Bhattacharya and Hanna, 1986; Harmann and
Harper, 1974; Jao et al., 1978; Luxenburg et al., 1985; Remsen and Clark, 1978). Lam
and Flores (2003) introduced a correction factor for the particle size distribution of the
raw ingredients in the viscosity model of dough inside the barrel of a single screw
extruder. Singh and Muthukumarappan (2016) incorporated the effect of soy white flakes
in the viscosity model of dough in a single screw extruder. Meuser et al. (1987) suggested
that viscosity (or shear stress) can be used as a variable for continuous on-line control.
However, the rheologically complex flow behavior of melt due to geometrical nature of
single screw extruder having grooved barrel presents many challenges, particularly with
respect to inhomogeneous distribution of the stresses in the flow field. Therefore,
measurement of the exposed stresses in extruders is a very difficult task and remains
challenging.
Computational fluid dynamics (CFD) simulation of flow characteristics inside the
extruder may be used to improve the understanding of underlying mechanisms and
provide an insight in to the effects of process parameters. Many researchers have
designed a single screw extruder using Finite Element Meshing (FEM) and CFD.
Dhanasekharan and Kokini (2003) analyzed a computational method based on numerical
simulations to obtain simultaneous scale-up of mixing and heat transfer for single screw
extrusion of wheat dough. Connelly and Kokini (2007) used CFD to study and compare

170
the mixing ability of single and co-rotating twin screw mixers. El-Sadi and Esmail (2005)
did numerical simulation of flow to investigate the performance of micro pump using
complex liquid. The dispersive mixing efficiency of the plasticized starch in a twin screw
extruder was studied and simulated by Emin and Schuchmann (2013). Computer
simulation of moistened defatted soy flour in a single screw extruder has been performed
by Ghoshdastidar et al. (2000) to predict the dough behavior in an extrusion process.
Siregar et al. (2014a) designed and analyzed single screw extruder for processing of
Jatropha seeds using FEM and CFD. To date, however, no study has been attempted to
simulate the flow of dough containing relatively high concentrations of soy white flakes.
Therefore, the approach of this study is to simulate the non–Newtonian flow of dough in
a single screw extruder by using CFD.
The objectives of this study were to (a) characterize the rheological properties of
soy white flakes based dough in a single screw extruder online by capillary die
rheometer, and (b) simulate the rheological complex fluid flow inside the extruder.
7.3 Materials and Methods
7.3.1 Materials and dough formulation
Soy white flakes were donated by South Dakota Soybean Processors (Volga, SD).
Corn flour was purchased from Cargill Dry Ingredients (Paris, IL). Dried distiller’s grain
with solubles (DDGS) was obtained from the POET (Sioux Falls, SD). Corn gluten meal
and fishmeal was purchased from Consumer Supply Distributing Co. (Sioux City, IA).
Vitamin and mineral premix was obtained from Lortscher Agri Service, Inc. (Bern,
Kansas, USA). Soybean oil was obtained from USDA (Brookings, SD). Three iso-
nitrogenous blends (hereafter referred to as “dough”) were formulated with a net protein

171
content of 32.7% db. The different ingredients in the dough include soy white flakes,
DDGS, corn gluten meal (CGM), corn flour, fish meal, soybean oil, and vitamin-mineral
mix (Table 7.1). The ingredients were mixed in a laboratory scale Hobart mixer (Hobart
Corporation, Troy, Ohio, USA) for 10 min and stored overnight at ambient temperature
for moisture stabilization. The moisture balancing of the doughs was done by adding
required quantities of water during mixing.
7.3.2 Extrusion Processing
To monitor the data necessary for the numerical simulation, extrusion processing
was performed using a single screw extruder (Brabender Intelli-Torque Plasti-Corder®,
South Hackensack, NJ) at Industrial Agricultural Products Center, University of
Nebraska, Lincoln, NE. The extruder was powered by a 7.5-HP motor with an operating
range of screw speeds from 0 to 225 rpm. It had a barrel with length to diameter ratio of
20:1 and a barrel diameter of 19 mm. A uniform 19 mm pitch screw with compression
ratio of 3:1 was used in the experiments. The extrusion experiments were performed
varying screw speed from 40 rpm to 200 rpm. The extruder barrel was equipped with
external band heaters with provisions to control the temperature of all three zones: feed
zone, transition zone/melting zone, and die sections. The material was fed through the
feed hopper to the feeding zone and gets conveyed to the melting zone where it gets
gelatinized and plasticized under thermal and mechanical stresses generated by the
rotation of screws. The gelatinized material then enters the die section. Experiments were
conducted using three levels of soy white flakes (30, 40 and 50%db), three levels of
temperature gradient in the barrel (45-100-100oC, 45-120-120
oC, 45-140-140
oC)
hereafter referred to as temperature of 100, 120, and 140oC keeping moisture content

172
constant at 25% db. The temperature of the melt was kept same at the melting zone and
die section of the extruder for each experimental condition. When the process reached the
steady state, samples were collected at the die.
7.3.3 Rheological Measurements
Rheological data of the dough within the extruder were determined online by a
round capillary die rheometer mounted to the head of an extruder during all the
experiments. Figure 7.1(a) presents the schematic of the round capillary die. An
illustration of the experimental set–up can be seen in Figure 7.2(a). Material enters the
die’s orifice, converging at a 30o angle to a pressure restriction neck [Figure 7.2(b)].
After the material has reached the main channel, it flows past the flush mounted
temperature and pressure monitoring ports, and is then forced into a capillary nozzle
insert [Figure 7.2(c)]. A high pressure region is generated at the entrance of the nozzle
insert and is recorded by the pressure transducer which was used in the determination of
the pressure drop across the nozzle insert with respect to atmospheric pressure. Three
capillary die nozzle inserts, all 2 mm in diameter, were used to determine entrance
pressure drops. Length/Diameter (L/D) ratios were 10:1, 15:1, and 20:1 [Figure 7.1(b)].
The rheological properties of the dough can be calculated from the pressure drop of the
flow in die. Various shear rates necessary to obtain a viscosity curve were generated by
increasing the screw speed of the extruder. Screw speeds ranged from 40 to 200 rpm. Die
temperatures were measured with a thermocouple in melt contact prior to the capillary
entrance: pressures were monitored with a Dynisco pressure transducer at the same
position. The temperature of the rheometer was kept constant as the exit temperature of
the dough (i.e. temperature at the end of the extruder) using a heating jacket.

173
Measurements of pressure drops and temperatures were made when steady state was
reached. The mass flow rate was measured by weighing the product at the die exit, at
given time intervals (30 sec). For each extrusion condition, i.e. with a given melt
temperature, SWF content level approximately ten pressure readings were taken. The
measurements were repeated for each L/D ratio (L/D = 10, 15 and 20). The shear stress
(Pa) can be calculated by Eq. (7.1).
2
PR
L
(7.1)
where ΔP is the pressure drop (Pa) measured across the capillary nozzle insert with
respect to atmospheric pressure having capillary length L (mm) and radius R (mm) = D/2.
By varying the L/D ratios of die nozzle inserts, the appropriate Bagley correction factor
was applied in the calculation of shear stress at the wall of the die to offset the effects of
entrance and exit pressure. The apparent shear rate app (s-1
) was calculated by Eq. (7.2).
3
4app
Q
R
(7.2)
where Q is the volumetric flow rate (mm3/s), R is the capillary radius (mm). The
Weissenberg–Rabinowitsch correction was applied to obtain the true shear rate t (s-1
)
to compensate for the non-laminar flow of a viscoelastic biopolymer as follows:
1
34
app
t app
ln
ln
(7.3)
The true viscosity t (Pa.s) was calculated using Eq. (7.4)
t
t
(7.4)

174
Measured viscosity data were fitted to a power law model, which has been reported by
other authors for extrusion processing of oat, corn, plasticized starch and some protein
doughs (Cervone and Harper, 1978; Harmann and Harper, 1973, 1974; Padmanabhan,
1991; Remsen and Clark, 1978; Vergnes et al., 1993)
1nK (7.5)
where is the viscosity (Pa.s), K is the consistency factor (Pa.sn) and n is the power law
index. Values of n are between 0 and 1 for pseudoplastics. For n < 1, the viscosity
decreases with increasing shear rate; such materials are called shear thinning. Values for
the power law index n and the consistency K were obtained by curve fitting using
ANSYS POLYMAT as shown in Table 7.1.
7.3.4 CFD Simulations
The goal of this study was to analyze the flow behavior in the high shear rate zone
extruder as shown in Figure 7.3. The flow through this section is assumed to be
isothermal in accordance with negligible temperature change of the material at this
region. The rheological data of dough inside the extruder measured with the online
rheometric capillary die is fitted to the Power law viscosity model.
The governing equations regarding a time-dependent, isothermal and
incompressible flow of a generalized Newtonian fluid is
DV
p T gDt
(7.6)
0.V (7.7)

175
where D/Dt is the material derivative,V (ms-1
) is the velocity, p is the pressure,
(kgm3) is the density, g (ms
-2) is the gravity and T (Nm
-2) is the extra stress tensor
defined by:
2T d (7.8)
with the strain rate tensor d (s-1
) and the viscosity (Pa.s). The shear rate (s-1
) is defined
as the square root of the second invariant of the strain rate tensor:
2d : d (7.9)
The CFD code of ANSYS POLYFLOW® 15.0 which is a finite element code primarily
for highly viscous flows was used to calculate the governing equations for determining
the flow patterns in the single screw extruder. The flow in a single screw extruder is three
dimensional and unsteady due to moving part i.e. screw. In this study, to reduce the
complexity of the setup of such a simulation and to avoid the use of a remeshing
algorithm, the mesh superposition technique (Avalosse, 1996) was used. A detailed study
on the requirements for the meshing and the mixed interpolations can be found elsewhere
(Alsteens et al., 2004). The meshing of the screw and the fluid region were conducted
independently in ANSYS ICEM CFD®. The fluid mesh and screw mesh is made up of
148,600 and 87,780 volume elements respectively. The created meshes are then merged
using the tool POLYFUSE. Some portions of the fluid overlap the screw cells in the
resulting mesh (Figure 7.4). The meshes in the clearance between the tip of screws and
the barrel wall had three bricks in order to capture high shear rates. To set boundary
conditions, a fully developed velocity profile (Inflow) was imposed at the inlet section
and zero normal velocity and tangential force were imposed at the outlet section. A non-
slip condition was imposed on the surface of screw and inner surface of the barrel. The

176
geometry of the computational domain was created using SolidWorks® 14.0 and its
geometrical dimensions are represented in Figure 7.5 and listed in Table 7.2. For the time
dependent simulations, a steady state simulation was performed at first. Then, the result
of the steady state simulation was used as an initial velocity field in a time dependent
simulation to obtain a physically relevant initial step. Due to symmetrical geometry, only
half a turn of the screw was simulated. To obtain accurate evolution of flow pattern in
time, 40 time steps were simulated for half a turn of screws.
7.4 Results and Discussion
7.4.1 Viscosity Model
Viscosity model describes the rheological characteristics of the melt inside the
extruder and directly affects the flow behavior. Therefore, the selection of the viscosity
model plays an important role on the accuracy of the simulation results. The dough inside
the extruder is a non-Newtonian fluid and its rheological behavior is very complex,
depending on different parameter such as shear rates, temperature and moisture content
(Morgan et al., 1989). In the present study, a round capillary die rheometer mounted on
the end of the extruder was used to measure the viscosity as described in material and
methods section. Obtained results are given in Figure 7.6 and Figure 7.7 for different
experimental conditions. The symbols represent the measured true viscosities of dough at
varying shear rates. The results show a shear thinning behavior of proteinaceous dough,
as also reported in (Cervone and Harper, 1978; Harmann and Harper, 1973, 1974;
Remsen and Clark, 1978). The Power law model can satisfactorily describe the
rheological behavior of dough at the shear rate range measured (i.e. 700 to 2000 s-1
). As
expected, it can be seen that increasing temperature led to decrease in viscosity. This may

177
be due to the higher degree of melting at the higher temperatures, which thus resulted in
decreased viscosity of the dough inside the extruder.
Furthermore, increase in level of SWF content led to decrease in viscosity as
shown in Figure 7.7. SWF contains less starch as compared to the corn flour and DDGS
in the ingredient mix. Hence increasing the SWF content changed the nutrient
composition, and thus the potential functionality of the ingredients in the dough, and may
have resulted in the lower viscosity.
7.4.2 Experimental validation
For validating the computational simulation of the flow within an extruder, the
torque experienced by the rotating screw was measured. In the present study, torque was
measured by the intelli‐torque drive system. The capillary die rheometer was mounted on
the head of the extruder to monitor simultaneously the rheological behavior of dough.
Obtained rheological data were used to perform the computational simulations of the
flow in extruder. Torque experienced by the screw in the flow domain of the simulation
was compared to the experimental values measured by the drive system. The results
obtained at different experimental conditions are given in Table 7.3 showing good
agreement between experimental and computational values. The deviations in the
experimental values resulted from torque fluctuations during the experiments, whereas
the deviations in computational values show the differences at varying time steps of
simulations.
7.4.3 Flow profile
In this section, the flow profile in the extruder is discussed by using the influence
of SWF content and screw speed. For the viscosity model, the data measured by the

178
capillary die rheometer were fitted to the Power law model as discussed earlier. Figure
7.8 shows the distribution of the local shear rate on XY plane and XZ plane for varying
process conditions. Although the distribution of the local shear rate are similar for all the
process conditions studied, increasing screw speed led to higher shear rates as expected.
Maximum shear rates are generated at the tip of the screws. Figure 7.9 shows the
distributions of the viscosity on XY plane and XZ plane for varying process conditions.
In the experiments performed at constant temperature (140oC), difference in viscosities
were measured when SWF content was varied as depicted in Figure 7.9(c, d, g, h) and (k,
l, o, p). As representative of the flow field on the XY and XZ plane, images at two
different screw speeds were depicted in Figure 7.9. Regardless of minor differences, all
the images show similar distribution of the viscosities. Lower viscosity was observed at
higher screw speed. When the viscosity and shear rate distributions are compared, it can
be seen that at the positions where the viscosity is maximum, shear rates are relatively
low. In contrast, at the positions where the shear rate is very high, the flow is mainly
dominated by less viscous fluid.
7.5 Conclusions
It is highly challenging to analyze flow behavior within an extruder since the
knowledge of various parameters such as the rheological behavior of dough, nature and
strength of the flow with the time of exposure, are required. These challenges can be
overcome by CFD simulation which provides access to local data on flow velocities and
resulting shear stresses. Experiments were performed on a laboratory scale single screw
extruder and capillary die rheometer was used to measure the rheological characteristics
of the dough at the extrusion conditions. The flow of dough in a single screw extruder

179
was simulated by using CFD. In order to validate the simulation, torque experienced by
the rotating screws was compared to the experimental values measured by flush mounted
transducer. The experimental and computational results obtained at different process
conditions were in good agreement. Additionally, the flow profile in the extruder was
analyzed by using the influence of screw speed and SWF content. The results suggest that
high shear zones are generated at the clearances between screws and barrel at which the
flow is dominated by less viscous fluid. Increase in screw speed from 40 to 200 rpm led
to lower shear rate. Moreover, to investigate the influence of SWF content, three levels of
SWF content were simulated. The results show that the increase in SWF content from 30
to 50% led to decrease in viscosity. The results of the simulation can be used to optimize
the extrusion process influenced by complex flows of relatively high concentration of
SWF based aquafeed dough in an extruder and also to improve the product quality.

180
Table 7.1 Fit parameters used for the model in simulation.
Conditions K n
SWF (%db) Temperature (oC) (Pa.s
n) (-)
30 140 925 0.659
40 140 361 0.809
50 140 312 0.830
50 120 8044 0.410
50 100 36372 0.251
†SWF – Soy white flakes; K – Consistency factor; n – Flow behavior index

181
Table 7.2 Dimensions of screw and barrel represented in Figure 7.5.
Dimensions (mm)
A-A' 3.18 Ri 8.22
B-B' 3.18 Ro 9.35
Z-Z' 50.8 Rb 9.5
X-X' 19.5 D 19.5

182
Table 7.3 Comparison of experimental and computational torque (N-m) experienced by the screw in the extruder for various process
conditions.
SWF Temp. Screw speed (rpm)
(% db) (oC) 40
200
T experimental T computational
T experimental T computational
30 140 25.29 ± 0.27 25.63 ± 0.68
12.50 ± 0.32 12.90 ± 0.55
40 140 29.23 ± 0.13 28.81 ± 1.05
16.34 ± 0.11 16.63 ± 0.62
50 140 32.93 ± 0.16 33.35 ± 0.87
18.74 ± 0.19 18.12 ± 0.97
50 120 37.26 ± 0.31 36.60 ± 1.15
21.11 ± 0.30 21.67 ± 0.83
50 100 42.54 ± 0.22 41.87 ± 0.74
23.87 ± 0.24 23.51 ± 1.11
†SWF – Soy white flakes; Temp. – Barrel temperature; T - Torque

183
Figure 7.1 (a) Round capillary die (b) Capillary nozzles having different L/D ratio

184
Figure 7.2 (a) Schematic representation of an extruder/die configuration and position of
temperature/pressure transducers (b) X- sectional view of a round capillary die and (c)
Capillary nozzle

185
Figure 7.3 Schematic draw of the extruder and location of the modeled area

186
Figure 7.4 Domain discretization and mesh superposition

187
Figure 7.5 Geometrical dimensions of the screws and the barrel. (a) Top view, (b) Front
view
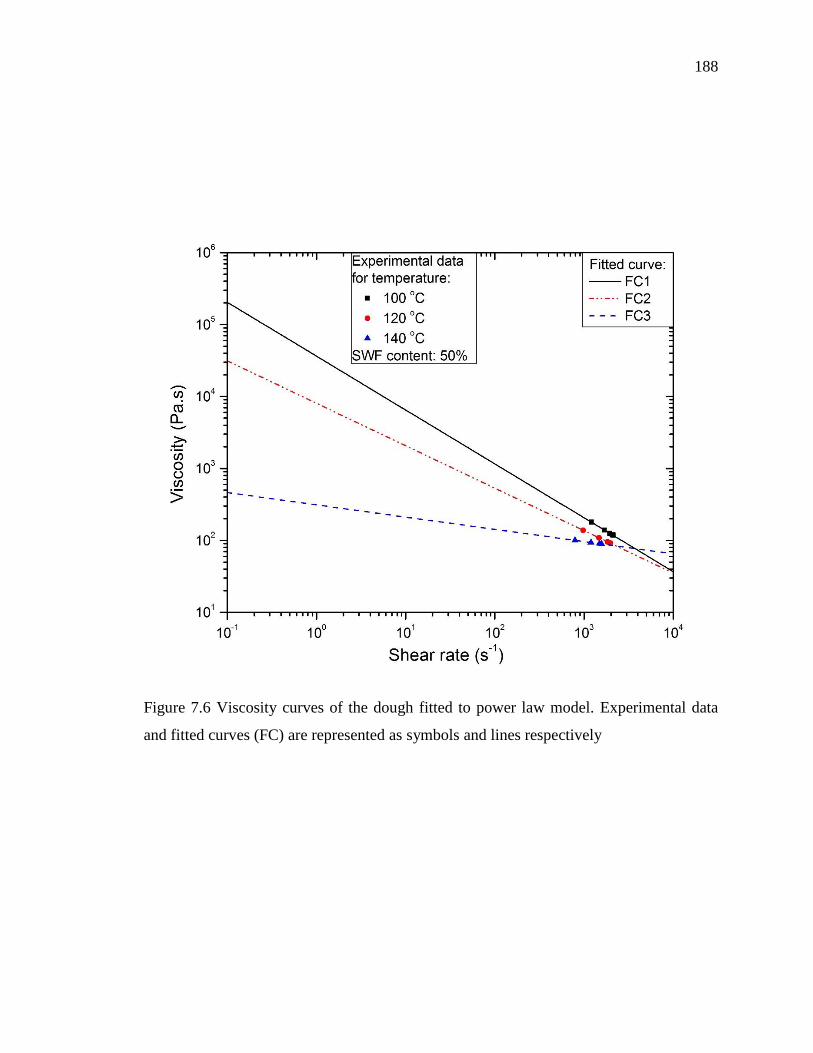
188
Figure 7.6 Viscosity curves of the dough fitted to power law model. Experimental data
and fitted curves (FC) are represented as symbols and lines respectively

189
Figure 7.7 Viscosity curves of the dough fitted to power law model. Experimental data
and fitted curves (FC) are represented as symbols and lines respectively

190
Figure 7.8 XY and XZ plane distribution of the shear rate for different process
conditions. Grey zones represent the location of screws. Images were taken at time step
40.

191
Figure 7.9 XY and XZ plane distribution of the viscosity for different process conditions.
Grey zones represent the location of screws. Images were taken at time step 40.

192
CHAPTER 8
Conclusions
The main goal of this research was to maximize the amount of soy white flakes
(SWF) incorporation as an alternative source of protein in the production of aquaculture
feed and to understand the significant effects of extrusion processing such as ingredient
composition, initial feed moisture content and processing temperature on physical,
nutritional and rheological properties of extrudates. From our studies, we can conclude
that 47% SWF can be used as a potential replacement to fish meal for the production of
aquaculture feeds using a single screw extruder. Desired physical and nutritional
properties of the feed can be achieved with optimum moisture content of 20%(db), barrel
and die temperature of 139°C and screw speed of 198 rpm.
The specific conclusions of the investigation are as follows:
1. In the primary investigation of inclusion of SWF, increasing the level of SWF from
10% to 30%, significantly increased the value of WAI from 3.98 to 4.26 and UD
from 0.89 g/cm3 to 0.92 g/cm
3 but decreased the value of ER from 1.17 to 1.13
(α=0.05). In second study, further increase in the level of SWF content up to 50%
resulted in significant increase in pellet durability and water absorption index.
2. Increasing moisture content from 15% to 35% resulted in a 37.5% increase in WAI
and 17% and 14% decrease in bulk density and WSI, respectively.
3. As barrel temperature increased from 110 to 170°C, WAI and WSI increased by
12.3% and 4.3%, respectively. But there was a decrease in BD by 12% and UD by
28%.

193
4. Increasing L/D ratio from 3.33 to 7.25 resulted in increase in pellet durability index,
expansion ratio, but a decrease in bulk density of the extrudates.
5. Increasing screw speed resulted in increase in pellet durability and mass flow rate
but decrease in water absorption index of the extrudates.
6. SWF, moisture content, barrel temperature had significant effects on the nutritional
properties of extruded aquafeed. As level of SWF content was increased from 20 to
50%, there was an increase in lysine content, TIA, protein content, ash content and
decrease fat and fiber content. Increasing the barrel temperature from 110°C to
140°C decreased the lysine content and TIA in the extrudates.
7. Aquaculture feed mixes used in this study exhibited shear thinning behavior for
dough containing SWF up to 50%. By power law modeling of the observed apparent
viscosity during processing, it was observed, the viscosity of the dough is greatly
affected by the level of temperature. Increasing the SWF content resulted in a higher
mass flow rate, torque and specific mechanical energy. The specific mechanical
energy and mass flow rate increased and viscosity decreased as screw speed
increased. At higher temperatures in the barrel and the die, the viscosity of the dough
decreased, which led to a decreased torque requirement and specific mechanical
energy.
8. The flow of dough in a single screw extruder was simulated by using CFD and
validation of simulation was done by comparing torque values. The results shows
that the experimental and computational values obtained at different process
conditions were in good agreement. Additionally, the flow profile in the extruder
was analyzed by using the influence of screw speed and SWF content. The results

194
suggest that high shear zones are generated at the clearances between screws and
barrel at which the flow is dominated by less viscous fluid. Increase in screw speed
from 40 to 200 rpm led to lower shear rate. Moreover, to investigate the influence of
SWF content, three levels of SWF content were simulated. The results show that the
increase in SWF content from 30 to 50% led to decrease in viscosity. The results of
the simulation can be used to optimize the extrusion process influenced by complex
flows of relatively high concentration of SWF based aquafeed dough in an extruder
and also to improve the product quality.
Overall SWF is a promising protein alternative for the aquaculture industry. Yet,
more research needs to be done to examine nutritional efficacy by conducting feeding
trials. The utilization of SWF in aquafeed will have value addition for soybean processing
industry.

195
CHAPTER 9
Recommendations for Future Work
This research was conducted in order to maximize the amount of soy white flakes
(SWF) incorporation into aquaculture feed particularly for Catla species and to
understand the effects of extrusion processing such as ingredient composition, initial feed
moisture content and processing temperature on physical, nutritional and rheological
properties of extrudates. The results demonstrated that SWF has greater potential to be
used as an alternative source of protein in aquaculture feed production. However, further
studies are required in coordination with the fisheries scientists on feeding trials etc., so
that the benefit of utilizing SWF for extruded aquaculture feed production can be
understood in totality. For this purpose, some of our suggestions for future research
include:
1. The formulations tried in our experiments were aimed at the protein requirement of
Catla fish species. Extrusion trials could be conducted using ingredient mixes with
different levels of SWF and net protein content adjusted to protein requirement of
other fish species.
2. Further studies need to be done in coordination with the fisheries scientists on feeding
trials to examine nutritional efficacy.
3. Further investigations need to be carried out on enrobing of oils on the extrudates in
order to determine the oil absorption capacity and to increase the net energy content
of extrudates containing SWF.

196
4. Experiments need to be conducted to study the effect of extrusion processing on
lectin activity that would help to enhance the inclusion of soy-protein based in aqua
diets.
5. Effect of extrusion on bioavailability of methionine, an essential amino acid for
aquaculture diets, is also recommended.
6. Developing a model to predict the loss of nutrient based on thermal properties of the
aqua diets as a function of extrusion processing parameters would be desirable.
7. Experiments need to be conducted to study the effect of processing parameters on
physical, nutritional and rheological properties of SWF based aquaculture feed in a
twin screw extruder.
8. Studying the effect of screw compression ratio on properties of extrudates in a single
and twin screw extruder would be desirable.

197
REFERENCES
AACC, (2000). Method 44-19, Moisture-Air Oven Method, Drying at 135°C, AACC
Approved Methods, 10th ed. American Association of Cereal Chemists, St. Paul,
MN.
Alsteens, B., Legat, V., Avalosse, T., (2004). Parametric Study of the Mixing Efficiency
in a Kneading Block Section of a Twin-screw Extruder. International Polymer
Processing 19, 207-217.
Altomare, R.E., Anelich, M., Rakos, R., (1992). An experimental investigation of the
rheology of rice flour dough with an extruder coupled slit die rheometer, in:
Kokini, J.L., Ho, C.T., Karwe, M.V. (Eds.), Food Extrusion Science and
Technology. Marcel Dekker, Inc., NewYork.
Alves, R.M.L., Grossmann, M.V.E., Silva, R.S.S.F., (1999). Gelling properties of
extruded yam (Dioscorea alata) starch. Food Chemistry 67, 123-127.
Amaya, E.A., Davis, D.A., Rouse, D.B., (2006). Plant Proteins Effectively Replace
Fishmeal in Shrimp Feed Trial, Global Aquaculture Advocate, pp. 50-51.
Amaya, E.A., Davis, D.A., Rouse, D.B., (2007). Replacement of fish meal in practical
diets for the Pacific white shrimp (Litopenaeus vannamei) reared under pond
conditions. Aquaculture 262(2-4), 393-401.
Anderson, R.A., Conway, H.F., Peplinski, A.J., (1970). Gelatinization of Corn Grits by
Roll Cooking, Extrusion Cooking and Steaming. Starch - Stärke 22(4), 130-135.
Anderson, R.A., Conway, H.F., Pfeifer, V.F., Griffin, E.L., (1969). Roll and Extrusion -
Cooking of Grain Sorghum Grits. Cereal Science Today 14, 372 - 376.

198
AOAC International, (2012). Official Methods of Analysis of AOAC International (19th
ed). AOAC International, Gaithersburg, MD.
Aquaculture Development and Coordination Programme, (1983). Fish feeds and feeding
in developing countries : an interim report on the ADCP Feed Development
Programme. United Nations Development Programme, Food and Agriculture
Organization of the United Nations, Rome.
Arndt, R.E., Hardy, R.W., Sugiura, S.H., Dong, F.M., (1999). Effects of heat treatment
and substitution level on palatability and nutritional value of soy defatted flour in
feeds for Coho Salmon, Oncorhynchus kisutch. Aquaculture 180(1-2), 129-145.
Arnesen, P., Brattas, L.E., Olli, J., Krogdahi, A., (1989). Soybean Carbohydrates Appear
to Restrict the Utilization of Nutrients by Atlantic Salmon (Salmo salar L.), in:
Takeda, M., Watanabe, T. (Eds.), The Current Status of Fish Nutrition in
Aquaculture: The Proceedings of the Third International Symposium on Feeding
and Nutrition in Fish, Tokyo, Japan, pp. 273-280.
Asp, N.G., Björck, I., (1989). Nutritional Properties of Extruded Foods, in: Mercier, C.,
Linko, P., Harper, J.M. (Eds.), Extrusion Cooking. American Association of
Cereal Chemists, St. Paul, pp. 399–433.
Avalosse, T., (1996). Numerical simulation of distributive mixing in 3-D flows.
Macromolecular Symposia 112, 91-98.
Ayadi, F.Y., Fallahi, P., Rosentrater, K.A., Muthukumarappan, K., (2013). Modeling
Single-Screw Extrusion Processing Parameters and Resulting Extrudate
Properties of DDGS-Based Nile Tilapia (Oreochromis niloticus) Feeds. Journal of
Food Research 2, 11 - 18.

199
Ayadi, F.Y., Rosentrater, K.A., Muthukumarappan, K., Brown, M.L., (2011). Twin-
Screw Extrusion Processing of Distillers Dried Grains with Solubles (DDGS)-
Based Yellow Perch (Perca flavescens) Feeds. Food and Bioprocess Technology
5(5), 1963-1978.
Badrie, N., Mellowes, W.A., (1991). Effect of Extrusion Variables on Cassava
Extrudates. Journal of Food Science 56(5), 1334-1337.
Baeverfjord, G., Krogdahl, A., (1996). Development and regression of soybean meal
induced enteritis in Atlantic salmon, Salmo salar L., distal intestine: a comparison
with the intestines of fasted fish. Journal of Fish Diseases 19(5), 375-387.
Bandyopadhyay, S., Rout, R.K., (2001). Aquafeed Extrudate Flow Rate and Pellet
Characteristics from Low-Cost Single-Screw Extruder. Journal of Aquatic Food
Product Technology 10(2), 3-15.
Barres, C., Vergnes, B., Tayeb, J., Valle, G.D., (1990). Transformation of Wheat Flour
by Extrusion Cooking: Influence of Screw Configuration and Operating
Conditions. Cereal Chemistry 67(5), 427- 433.
Barrett, A., (2003). Characterization of Macrostructures in Extruded Products, in:
Breslauer, K.J., Kaletunc, G. (Eds.), Characterization of Cereals and Flours:
Properties, Analysis And Applications. CRC Press, Boca Raton, USA, pp. 369-
386.
Barrows, F.T., Stone, D.A.J., Hardy, R.W., (2007). The effects of extrusion conditions on
the nutritional value of soybean meal for rainbow trout (Oncorhynchus mykiss).
Aquaculture 265(1-4), 244-252.

200
Bautista, M.N., Borlongan, I.G., Catacutan, M.R., Coloso, R.M., Eusebio, P.S., (1994).
Feeds and feeding of milkfish, Nile tilapia, Asian sea bass, and tiger shrimp,
Aquaculture Extension Manual. Southeast Asian Fisheries Development Center,
Tigbauan, Philippines, p. 97.
Bhattacharya, M., Hanna, M.A., (1985). Extrusion Processing of Wet Corn Gluten Meal.
Journal of Food Science 50(5), 1508-1509.
Bhattacharya, M., Hanna, M.A., (1986). Viscosity Modelling of Dough in Extrusion.
International Journal of Food Science & Technology 21, 167-174.
Bhattacharya, S., Das, H., Bose, A.N., (1988). Effect of extrusion process variables on in-
vitro protein digestibility of fish-wheat flour blends. Food Chemistry 28(3), 225-
231.
Björck, I., Asp, N.G., (1983). The Effects of Extrusion Cooking on Nutritional Value —
A Literature Review. Journal of Food Engineering 2(4), 281-308.
Bjorck, I., Noguchi, A., Asp, N.G., Cheftel, J.C., Dahlqvist, A., (1983). Protein
nutritional value of a biscuit processed by extrusion cooking: effects on available
lysine. J Agric Food Chem 31(3), 488-492.
Bortone, E.J., (2004). Extrusion Processing Part I. Ingredient Functionality of Formulas,
Global Aquaculture Advocate, pp. 69-72.
Box, G.E.P., Draper, N.R., (1987). Empirical model-building and response surfaces.
Wiley.
Brown, P.B., (2008). Utilization of Soy Products in Diets of Freshwater Fishes, in: Lim,
C., Lee, C.-S., Webster, C.D. (Eds.), Alternative Protein Sources in Aquaculture
Diets. CRC Press, pp. 225-260.

201
Bureau, D.P., Harris, A.M., Young Cho, C., (1998). The effects of purified alcohol
extracts from soy products on feed intake and growth of chinook salmon
(Oncorhynchus tshawytscha) and rainbow trout (Oncorhynchus mykiss).
Aquaculture 161(1-4), 27-43.
Caldwell, E.F., Fast, R.B., Ievolella, J., Lauhoff, C., Levine, H., Miller, R.C., Slade, L.,
Strahm, B.S., Whalen, P.J., (2000). Unit Operations and Equipment. I. Blending
and Cooking, in: Fast, R.B., Caldwell, E.F. (Eds.), Breakfast Cereals and How
They Are Made, 2nd ed. American Association of Cereal Chemists, St. Paul, MN,
pp. 165-216.
Camire, M.E., (1991). Protein functionality modification by extrusion cooking. Journal of
the American Oil Chemists’ Society 68, 200-205.
Camire, M.E., (2000). Chemical and Nutritional Changes in Food During Extrusion, in:
Riaz, M.N. (Ed.), Extruders in Food Applications. CRC Press, Boca Raton, USA,
pp. 127-147.
Camire, M.E., Camire, A., Krumhar, K., (1990). Chemical and nutritional changes in
foods during extrusion. Critical reviews in food science and nutrition 29(1), 35-
57.
Case, S.E., Hamann, D.D., Schwartz, S.J., (1992). Effect of Starch Gelatinization on
Physical Properties of Extruded Wheat- and Corn-Based Products. Cereal
Chemistry 69, 401-404.
Cervone, N.W., Harper, J.M., (1978). Viscosity of an Intermediate Moisture Dough.
Journal of Food Process Engineering 2, 83-95.

202
Cheftel, J.C., (1986). Nutritional Effects of Extrusion-Cooking. Food Chemistry 20(4),
263-283.
Chen, A.H., Jao, Y.C., Larkin, J.W., Goldstein, W.E., (1978). Rheological Model of Soy
Dough in Extrusion. Journal of Food Process Engineering 2, 337-342.
Chevanan, N., (2007). Investigations on the role of distillers dried grains with solubles
for producing aquaculture feed using extrusion technology. South Dakota State
University, Ann Arbor, p. 283.
Chevanan, N., Muthukumarappan, K., Rosentrater, K.A., Julson, J.L., (2007a). Effect of
Die Dimensions on Extrusion Processing Parameters and Properties of DDGS-
Based Aquaculture Feeds. Cereal Chemistry 84(4), 389-398.
Chevanan, N., Rosentrater, K.A., Muthukumarappan, K., (2007b). Twin-Screw Extrusion
Processing of Feed Blends Containing Distillers Dried Grains with Solubles
(DDGS). Cereal Chemistry 84, 428-436.
Chevanan, N., Rosentrater, K.A., Muthukumarappan, K., (2010). Effects of Processing
Conditions on Single Screw Extrusion of Feed Ingredients Containing DDGS.
Food and Bioprocess Technology 3(1), 111-120.
Chinnaswamy, R., Hanna, M., (1990). Macromolecular and functional properties of
native and extrusion-cooked corn starch. Cereal Chemistry 67(5), 490-499.
Chinnaswamy, R., Hanna, M.A., (1987). Nozzle Dimension Effects on the Expansion of
Extrusion Cooked Corn Starch. Journal of Food Science 52, 1746-1747.
Chinnaswamy, R., Hanna, M.A., Zobel, H.F., (1989). Microstructural, physico-chemical
and macromolecular changes in extrusion-cooked and retrograded corn starch.
Cereal Foods World 34(5), 415-422.

203
Clarke E, Wiseman, J., (1999). Extrusion temperature impairs trypsin inhibitor activity in
soybean meal. Feed Technology 3, 29-31.
Colonna, P., Tayeb, J., Mercier, C., (1989). Extrusion Cooking of Starch and Starchy
Products, in: Mercier, C., Linko, P., Harper, J.M. (Eds.), Extrusion Cooking.
American Association of Cereal Chemists, St. Paul, MN, pp. 247-319.
Connelly, R.K., Kokini, J.L., (2007). Examination of the mixing ability of single and twin
screw mixers using 2D finite element method simulation with particle tracking.
Journal of Food Engineering 79(3), 956-969.
Coyle, S.D., Mengel, G.J., Tidwell, J.H., Webster, C.D., (2004). Evaluation of growth,
feed utilization, and economics of hybrid tilapia, Oreochromis niloticus x
Oreochromis aureus, fed diets containing different protein sources in combination
with distillers dried grains with solubles. Aquaculture Research 35(4), 365-370.
Dabrowski, K., Poczyczynski, P., Köck, G., Berger, B., (1989). Effect of partially or
totally replacing fish meal protein by soybean meal protein on growth, food
utilization and proteolytic enzyme activities in rainbow trout (Salmo gairdneri).
New in vivo test for exocrine pancreatic secretion. Aquaculture 77(1), 29-49.
Dahl, S.R., Villota, R., (1991). Effect of Thermal Denaturation on the Texturization of
Soybean Protein Via Twin-Screw Extrusion. Canadian Institute of Food Science
and Technology Journal 24(3-4), 143-150.
De Francesco, M., Parisi, G., Pérez-Sánchez, J., Gómez-Réqueni, P., Médale, F.,
Kaushik, S.J., Mecatti, M., Poli, B.M., (2007). Effect of High-Level Fish Meal
Replacement by Plant Proteins in Gilthead Sea Bream (Sparus Aurata) on Growth
and Body/Fillet Quality Traits. Aquaculture Nutrition 13, 361-372.

204
Demir, N., (1996). Ihtiyoloji. 2. Baskı istanbul Üniversitesi Yayınlarından Sayı: 3903 Fen
Fakültesi No: 236. Istanbul Universitesi Fen Fakultesi Basımevi, Istanbul.
Dersjant-Li, Y., (2002). The Use of Soy Protein in Aquafeeds, in: Cruz-Suárez, L.E.,
Ricque-Marie, D., Tapia-Salazar, M., Gaxiola-Cortés, M.G., Simoes, N. (Eds.),
Avances en Nutricion Acuicola VI. Memorias del VI Simposium Internacional de
Nutricion Acuicola, 3, Cancún, Quintana Roo, México, pp. 541-558.
Deshpande, S.S., (2002). Handbook of food toxicology. Marcel Dekker, New York.
Dhanasekharan, K.M., Kokini, J.L., (2003). Design and Scaling of Wheat Dough
Extrusion by Numerical Simulation of Flow and Heat Transfer. Journal of Food
Engineering 60, 421-430.
Ding, Q.-B., Ainsworth, P., Plunkett, A., Tucker, G., Marson, H., (2006). The effect of
extrusion conditions on the functional and physical properties of wheat-based
expanded snacks. Journal of Food Engineering 73(2), 142-148.
Einde, R.M., Goot, A.J., Boom, R.M., (2003). Understanding Molecular Weight
Reduction of Starch During Heating-shearing Processes. Journal of Food Science
68(8), 2396-2404.
El-Sadi, H., Esmail, N., (2005). Simulation of complex liquids in micropump.
Microelectronics Journal 36(7), 657-666.
El-Sayed, A.-F.M., (1999). Alternative dietary protein sources for farmed tilapia,
Oreochromis spp. Aquaculture 179, 149-168.
El-Sayed, A.-F.M., (2004). Protein nutrition of farmed tilapia: searching for
unconventional sources, New dimensions in farmed tilapia: proceedings of the
Sixth International Symposium on Tilapia Aquaculture, pp. 364-378.

205
Emin, M.A., Köhler, K., Schlender, M., Schuchmann, H., (2011). Characterization of
Mixing in Food Extrusion and Emulsification Processes by Using CFD, in: Nagel,
W.E., Kröner, D.B., Resch, M.M. (Eds.), High Performance Computing in
Science and Engineering '10. Springer Berlin Heidelberg, pp. 443-462.
Emin, M.A., Schuchmann, H.P., (2013). Analysis of the Dispersive Mixing Efficiency in
a Twin-Screw Extrusion Processing of Starch Based Matrix. Journal of Food
Engineering 115, 132-143.
Evans, A.J., (1999). Measurement of Pellet Quality in Aquaculture Feeds, in: Chang,
Y.K., Wang, S.S. (Eds.), Advances in Extrusion Technology: Aquaculture/Animal
Feeds and Foods. Technomic Publishing Company, Inc., Lancaster, PA, pp. 219-
223.
Fallahi, P., Muthukumarappan, K., Rosentrater, K.a., Brown, M.L., (2012). Twin-screw
Extrusion Processing of Vegetable-based Protein Feeds for Yellow Perch (Perca
flavescens) Containing Distillers Dried Grains, Soy Protein Concentrate, and
Fermented High Protein Soybean Meal. Journal of Food Research 1, 230-246.
Fallahi, P., Rosentrater, K.A., Muthukumarappan, K., Brown, M.L., (2013). Twin-Screw
Extrusion Processing of Rainbow trout (Oncorhynchus mykiss) Feeds Using
Graded Levels of High Protein Corn-Based Distillers Dried Grains (HP-DDG)
and Conventional Distillers Dried Grains with Solubles (DDGS). Journal of Food
Research 2, 118-139.
FAO, (2004). The State of World Fisheries and Aquaculture - 2004. Food and
Agriculture Organization, Rome, Italy.

206
FAO, (2009). The State of World Fisheries and Aquaculture - 2008 (SOFIA). Food and
Agriculture Organization, Rome, Italy.
FAO, (2012). The State of World Fisheries and Aquaculture - 2012 (SOFIA). Food and
Agriculture Organization, Rome, Italy.
FAO, (2014). The State of World Fisheries and Aquaculture - 2014 (SOFIA). Food and
Agriculture Organization, Rome, Italy.
Fenerci, S., Şener, E., (2005). In Vivo and in Vitro Protein Digestibility of Rainbow
Trout (Oncorhynchus mykiss Walbaum, 1972) Fed Steam Pressured or Extruded
Feeds. Turkish Journal of Fisheries and Aquatic Sicences 5(1), 17-22.
Fernández-Gutiérrez, J.A., San Martín-Martínez, E., Martínez-Bustos, F., Cruz-Orea, A.,
(2004). Physicochemical Properties of Casein-Starch Interaction Obtained by
Extrusion Process. Starch - Stärke 56(5), 190-198.
Fernandez, S.R., Parsons, C.M., (1996). Bioavailability of digestible lysine in heat-
damaged soybean meal for chick growth. Poultry Science 75(2), 224-231.
Fornal, Ł., Soral-Śmietana, M., Śmietana, Z., Szpendowski, J., (1987). Chemical
Characteristics and Physicochemical Properties of the Extruded Mixtures of
Cereal Starches. Starch - Stärke 39(3), 75-78.
Fowler, L.G., (1980). Substitution of Soybean and Cottonseed Products for Fish Meal in
Diets Fed to Chinook and Coho Salmon. The Progressive Fish-Culturist 42(2),
87-91.
Francis, G., Becker, K., (2002). Antinutrients in Plant-Derived Fish Feed Ingredients,
Global Aquaculture Advocate, pp. 37-38.

207
Francis, G., Makkar, H.P.S., Becker, K., (2001). Antinutritional factors present in plant-
derived alternate fish feed ingredients and their effects in fish. Aquaculture 199(3-
4), 197-227.
Gatlin, D.M., Barrows, F.T., Brown, P., Dabrowski, K., Gaylord, T.G., Hardy, R.W.,
Herman, E., Hu, G., Krogdahl, Å., Nelson, R., Overturf, K., Rust, M., Sealey, W.,
Skonberg, D., J Souza, E., Stone, D., Wilson, R., Wurtele, E., (2007). Expanding
the utilization of sustainable plant products in aquafeeds: a review. Aquaculture
Research 38(6), 551-579.
Ghoshdastidar, P.S., Ghai, G., Chhabra, R.P., (2000). Computer Simulation of Three-
Dimensional Transport During Moistened Defatted Soy Flour Processing in the
Metering Section of a Single-Screw Extruder. Proceedings of the Institution of
Mechanical Engineers, Part C: Journal of Mechanical Engineering Science 214,
335-349.
Goel, P.K., Singhal, R.S., Kulkarni, P.R., (1999). Studies on interactions of corn starch
with casein and casein hydrolysates. Food Chemistry 64(3), 383-389.
Gomez, M.H., Aguilera, J.M., (1983). Changes in the Starch Fraction During Extrusion-
cooking of Corn. Journal of Food Science 48(2), 378-381.
Gomez, M.H., Aguilera, J.M., (1984). A Physicochemical Model for Extrusion of Corn
Starch. Journal of Food Science 49(1), 40-43.
Guillon, F., Barry, J.-L., Thibault, J.-F., (1992). Effect of autoclaving sugar-beet fibre on
its physico-chemical properties and its in-vitro degradation by human faecal
bacteria. Journal of the Science of Food and Agriculture 60(1), 69-79.

208
Guy, R., (2001). Raw materials for extrusion cooking, in: Guy, R. (Ed.), Extrusion
Cooking - Technologies and Applications. Woodhead Publishing Limited,
Cambridge, UK, pp. 5-28.
Gwiazda, S., Noguchi, A., Saio, K., (1987). Microstructural Studies of Texturized
Vegetable Protein Products: Effects of Oil Addition and Transformation of Raw
Materials in Various Sections of a Twin Screw Extruder. Food Microstructure
6(1), 57-61.
Hardy, R.W., (2000). New Developments in Aquatic Feed Ingredients and Potential of
Enzyme Supplements, in: Cruz -Suárez, L.E., RicqueMarie, D., Tapia-Salazar,
M., Olvera-Novoa, M.A., Civera-Cerecedo, R. (Eds.), Avances en Nutrición
Acuícola V. Memorias del V Simposium Internacional de Nutrición Acuícola, pp.
216-226.
Hardy, R.W., (2010). Utilization of Plant Proteins in Fish Diets: Effects of Global
Demand and Supplies of Fishmeal. Aquaculture Research 41, 770-776.
Hardy, R.W., Masumoto, T., (1990). Specifications for Marine By-Products for
Aquaculture, in: Keller, S. (Ed.), Making Profits out of Seafood Wastes:
Proceedings of the International Conference on Fish By-products. Alaska Sea
Grant College Program, Anchorage, AK, pp. 109-120.
Harmann, D.V., Harper, J.M., (1973). Effect of Extruder Geometry on Torque and Flow.
Transactions of the ASAE 16(6), 1175-1178.
Harmann, D.V., Harper, J.M., (1974). Modeling a Forming Foods Extruder. Journal of
Food Science 39(6), 1099-1104.
Harper, J.M., (1981). Extrusion of Foods. CRC Press, Boca Raton, FL.

209
Harper, J.M., Rhodes, T.P., Wanniger, L.A., (1971). Viscosity Model for Cooked Cereal
Doughs, AICHE Symposium Series. American Institute of Chemical Engineers,
New York, NY, pp. 40-43.
Hernandez-Diaz, J.R., Quintero-Ramos, A., Barnard, J., Balandran-Quintana, R.R.,
(2007). Functional Properties of Extrudates Prepared with Blends of Wheat
Flour/Pinto Bean Meal with Added Wheat Bran. Food Science and Technology
International 13(4), 301-308.
Hossain, M.A., Jauncey, K., (1989). Nutritional evaluation of some Bangladeshi oilseed
meals as partial substitutes for fish meal in the diet of common carp, Cyprinus
carpio L. Aquaculture Research 20, 255-268.
Hsieh, F., Mulvaney, S.S., Huff, H.E., Lue, S., Brent, J., (1989). Effect of dietary fiber
and screw speed on some extrusion processing and product variables.
Lebensmittel Wissenschaft und Technologie 22(4), 204-207.
Hurrel, R.F., Carpenter, K.J., (1977). Maillard reaction in foods, in: Hoyem, T., Kvale, O.
(Eds.), Physical, Chemical and Biological Changes in Food Caused by Thermal
Processing. Elsevier Science Ltd, London, pp. 168–184.
Ibanoglu, S., Ainsworth, P., Hayes, G.D., (1996). Extrusion of Tarhana: Effect of
Operating Variables on Starch Gelatinization. Food Chemistry 57, 541-544.
ICAR, (2006). Handbook of Fisheries and Aquaculture. DIPA, Indian Council of
Agricultural Research, New Delhi.
Ilo, S., Berghofer, E., (1999). Kinetics of colour changes during extrusion cooking of
maize grits. Journal of Food Engineering 39(1), 73-80.

210
Ilo, S., Tomschik, U., Berghofer, E., Mundigler, N., (1996). The Effect of Extrusion
Operating Conditions on the Apparent Viscosity and the Properties of Extrudates
in Twin-Screw Extrusion Cooking of Maize Grits. LWT - Food Science and
Technology 29, 593-598.
ISO, (2001). Animal feeding stuffs - Determination of trypsin inhibitor activity of soya
products. ISO 14902:2001.
Iwe, M.O., van Zuilichem, D.J., Stolp, W., Ngoddy, P.O., (2004). Effect of extrusion
cooking of soy–sweet potato mixtures on available lysine content and browning
index of extrudates. Journal of Food Engineering 62(2), 143-150.
Janssen, L.P.P.M., (1989). Engineering Aspects of Food Extrusion, in: Mercier, C.,
Linko, P., Harper, J. (Eds.), Extrusion Cooking. American Association of Cereal
Chemists, Inc., St. Paul, MN.
Jao, Y.C., Chen, A.H., Lewandowski, D., Irwin, W.E., (1978). Engineering Analysis of
Soy Dough Rheology in Extrusion. Journal of Food Process Engineering 2, 97-
112.
Jauncey, K., Ross, B., (1982). A guide to tilapia feeds and feeding. Institute of
Aquaculture, University of Stirling, Stirling, Scotland.
Jin, Z., Hsieh, F., Huff, H.E., (1994). Extrusion Cooking of Corn Meal with Soy Fiber,
Salt, and Sugar. Cereal Chemistry 71, 227-234.
Jones, D., Chinnaswamy, R., Tan, Y., Hanna, M.A., (2000). Physiochemcial properties of
ready-to-eat breakfast cereals. Cereal Foods World 45(4), 164-168.

211
Kannadhason, S., Muthukumarappan, K., Rosentrater, K.A., (2009). Effects of
Ingredients and Extrusion Parameters on Aquafeeds Containing DDGS and
Tapioca Starch. Journal of Aquaculture Feed Science and Nutrition 1, 6-21.
Kannadhason, S., Rosentrater, K.A., Muthukumarappan, K., Brown, M.L., (2010). Twin
Screw Extrusion of DDGS-Based Aquaculture Feeds. Journal of the World
Aquaculture Society 41, 1-15.
Karalazos, V., Treasurer, J., Cutts, C.J., Alderson, R., Galloway, T.F., Albrektsen, S.,
Arnason, J., MacDonald, N., Pike, I., Bell, J.G., (2007). Effects of fish meal
replacement with full-fat soy meal on growth and tissue fatty acid composition in
Atlantic cod (Gadus morhua). Journal of Agricultural and Food Chemistry 55,
5788-5795.
Kaushik, S.J., Cravedi, J.P., Lalles, J.P., Sumpter, J., Fauconneau, B., Laroche, M.,
(1995). Partial or total replacement of fish meal by soybean protein on growth,
protein utilization, potential estrogenic or antigenic effects, cholesterolemia and
flesh quality in rainbow trout, Oncorhynchus mykiss. Aquaculture 133(3-4), 257-
274.
Kazamzadeh, M., (1989). Fish Feeds Extrusion Technology, Feed Management, pp. 24-
28.
Kikuchi, K., (1999). Partial Replacement of Fish Meal with Corn Gluten Meal in Diets
for Japanese Flounder Paralichthys olivaceus. Journal of the World Aquaculture
Society 30(3), 357-363.

212
Kim, C.H., Maga, J.A., Martin, J.T., (1989). Properties of extruded dried distiller grains
(DDG) and flour blends. Journal of Food Processing and Preservation 13, 219-
231.
Kokini, J.L., Chang, C.N., Lai, L.S., (1992). The Role of Rheological Properties of
Extrudate Expansion, in: Kokini, J.L., Ho, C.-T., Karwe, M.V. (Eds.), Food
Extrusion Science and Technology. Marcel Dekker, Inc., New York, pp. 631-652.
Krogdahl, Å., Lea, T.B., Olli, J.J., (1994). Soybean proteinase inhibitors affect intestinal
trypsin activities and amino acid digestibilities in rainbow trout (Oncorhynchus
mykiss). Comparative Biochemistry and Physiology Part A: Physiology 107(1),
215-219.
Lam, C.D., Flores, R.A., (2003). Effect of Particle Size and Moisture Content on
Viscosity of Fish Feed. Cereal Chemistry 80, 20-24.
Larrea, M.A., Chang, Y.K., Martı́nez Bustos, F., (2005). Effect of some operational
extrusion parameters on the constituents of orange pulp. Food Chemistry 89(2),
301-308.
Laskowski, M., Kato, I., (1980). Protein Inhibitors of Proteinases. Annual Review of
Biochemistry 49(1), 593-626.
Li, M.H., Robinson, E.H., Manning, B.B., (2004). Nutrition, in: Tucker, C.S.,
Hargreaves, J.A. (Eds.), Biology and culture of channel catfish. Elsevier,
Amsterdam ; Boston, pp. 279-323.
Lim, C., Garcia, J.C., Yildirim-Aksoy, M., Klesius, P.H., Shoemaker, C.A., Evans, J.J.,
(2007). Growth Response and Resistance to Streptococcus iniae of Nile Tilapia,

213
Oreochromis niloticus, Fed Diets Containing Distiller?s Dried Grains with
Solubles. Journal of the World Aquaculture Society 38(2), 231-237.
Lim, C., Yildirim-Aksoy, M., Klesius, P.H., (2009). Growth Response and Resistance
toEdwardsiella ictaluriof Channel Catfish,Ictalurus punctatus, Fed Diets
Containing Distiller’s Dried Grains with Solubles. Journal of the World
Aquaculture Society 40(2), 182-193.
Lim, S.-J., Lee, K.-J., (2009). Partial replacement of fish meal by cottonseed meal and
soybean meal with iron and phytase supplementation for parrot fish Oplegnathus
fasciatus. Aquaculture 290(3-4), 283-289.
Lin, S., Hsieh, F., Huff, H.E., (1997). Effects of Lipids and Processing Conditions on
Degree of Starch Gelatinization of Extruded Dry Pet Food. LWT - Food Science
and Technology 30, 754-761.
Lin, S., Huff, H.E., Hsieh, F., (2000). Texture and Chemical Characteristics of Soy
Protein Meat Analog Extruded at High Moisture. Journal of Food Science 65,
264-269.
Lovell, T., (1989). Nutrition and Feeding of Fish. Van Nostrand Reinhold, New York.
Lucht, H.W., (2007). Expander Technology, in: Riaz, M.N. (Ed.), Extruders and
expanders in pet food, aquatic and livestock feeds. Agrimedia, Clenze, Germary,
pp. 91-133.
Lunger, A.N., McLean, E., Craig, S.R., (2007). The effects of organic protein
supplementation upon growth, feed conversion and texture quality parameters of
juvenile cobia (Rachycentron canadum). Aquaculture 264, 342-352.

214
Lusas, E.W., Riaz, M.N., (1995). Soy protein products: processing and use. The Journal
of nutrition 125, 573S-580S.
Luxenburg, L.A., Baird, D.G., Joseph, E.G., (1985). Background Studies in the Modeling
of Extrusion Cooking Processes for Soy Flour Doughs. Biotechnology Progress
1(1), 33-38.
Marine Aquaculture Task Force, (2007). Sustainable Marine Aquaculture: Fulfilling the
Promise; Managing the Risks. Marine Aquaculture Task Force, Takoma, Park,
MD.
Martín, A., (1999). Aquaculture feed manufacturing practice in EU Mediterranean
countries, in: Brufau, J., Tacon, A. (Eds.), Feed manufacturing in the
Mediterranean region: Recent advances in research and technology. Zaragoza :
CIHEAM, pp. 123-128.
Mason, W.R., Hoseney, R.C., (1986). Factors Affecting the Viscosity of Extrusion-
Cooked Wheat Starch. Cereal Chemistry 63(5), 436-441.
McGinnis, J., Evans, R.J., (1947). Amino acid deficiencies of raw and over-heated
soybean oil meal for chicks. Journal of Nutrition 34(6), 725-732.
Mercier, C., Linko, P., Harper, J.M., (1989a). Extrusion Cooking. American Association
of Cereal Chemists, Inc., St. Paul, MN, USA.
Mercier, C., Linko, P., Harper, J.M., (1989b). Extrusion Cooking. American Association
of Cereal Chemists, St Paul, MN.
Meuser, F., Pfaller, W., van Lengerich, B., (1987). Technological aspects regarding
specific change to the characteristic properties of extrudates by HTST-extrusion

215
cooking, in: O’Connor, C. (Ed.), Extrusion Technology for the Food Industry.
Elsevier Applied Science, London.
Mezreb, K., Goullieux, A., Ralainirina, R., Queneudec, M., (2003). Application of image
analysis to measure screw speed influence on physical properties of corn and
wheat extrudates. Journal of Food Engineering 57(2), 145-152.
Mitchel, J.R., Arêas, J.A.G., (1992). Structural changes in biopolymers during extrusion,
in: Kokini, J.L., Ho, C.-T., Karwe, M.V. (Eds.), Food Extrusion: Science and
Technology. Marcel Dekker, New York, pp. 345-360.
Mjoun, K., Rosentrater, K.A., (2011). Extruded aquafeeds containing distillers dried
grains with solubles: effects on extrudate properties and processing behaviour.
Journal of the Science of Food and Agriculture 91(15), 2865-2874.
Morales, A.E., Cardenete, G., De la Higuera, M., Sanz, A., (1994). Effects of dietary
protein source on growth, feed conversion and energy utilization in rainbow trout,
Oncorhynchus mykiss. Aquaculture 124(1-4), 117-126.
Morgan, R.G., Steffe, J.F., Ofoli, R.Y., (1989). A generalized viscosity model for
extrusion of protein doughs. Journal of Food Process Engineering 11, 55-78.
Morris, P.C., Gallimore, P., Handley, J., Hide, G., Haughton, P., Black, A., (2005). Full-
fat soya for rainbow trout (Oncorhynchus mykiss) in freshwater: Effects on
performance, composition and flesh fatty acid profile in absence of hind-gut
enteritis. Aquaculture 248, 147-161.
Mosenthin, R., Jezierny, D., (2010). Nutritional significance of secondary plant
metabolites in pigs and poultry, 19 International Science Symposium on Nutrition
of Domestic Animals, Radenci, pp. 227-236.

216
Murthy, H.S., (2002). Indian major carps, in: Webster, C.D., Lim, C.E. (Eds.), Nutrient
requirements and feeding of finfish for aquaculture. CABI Publishing, New
York,, pp. 262-272.
Nandi, S., Chattopadhyay, D.N., Verma, J.P., Sarkar, S.K., Mukhopadhyay, P.K., (2001).
Effect of dietary supplementation of fatty acids and vitamins on the breeding
performance of the carp Catla catla. Reprod Nutr Dev 41(4), 365-375.
Ng, A., Lecain, S., Parker, M.L., Smith, A.C., Waldron, K.W., (1999). Modification of
cell-wall polymers of onion waste. Carbohydrate Polymers 39(4), 341-349.
Nitsan, Z., Liener, I.E., (1976). Enzymic activities in the pancreas, digestive tract and
feces of rats fed raw or heated soy flour. J Nutr 106(2), 300-305.
Noguchi, A., Mosso, K., Aymard, C., Jeunink, J., Cheftel, J.C., (1982). Maillard reactions
during extrusion-cooking of protein-enriched biscuits. Lebensmittel Wissenschaft
Technologie 15(2), 105-110.
O’Mahoney, M., Mouzakitis, G., Doyle, J., Burnell, G., (2011). A novel konjac
glucomannan-xanthan gum binder for aquaculture feeds: the effect of binder
configuration on formulated feed stability, feed palatability and growth
performance of the Japanese abalone, Haliotis discus hannai. Aquaculture
Nutrition 17, 395-407.
Oikonomou, N.A., Krokida, M.K., (2012). Water Absorption Index and Water Solubility
Index Prediction for Extruded Food Products. International Journal of Food
Properties 15(1), 157-168.
Olli, J.J., Hjelmeland, K., Krogdahl, Å., (1994a). Soybean trypsin inhibitors in diets for
Atlantic salmon (Salmo salar, L): effects on nutrient digestibilities and trypsin in

217
pyloric caeca homogenate and intestinal content. Comparative Biochemistry and
Physiology Part A: Physiology 109(4), 923-928.
Olli, J.J., Krogdahi, Å., (1994). Nutritive Value of Four Soybean Products as Protein
Sources in Diets for Rainbow Trout (Oncorhynchus mykiss, Walbaum) Reared in
Fresh Water. Acta Agriculturae Scandinavica, Section A - Animal Science 44(3),
185-192.
Olli, J.J., Krogdahl, Å., van den Ingh, T.S.G.A.M., Brattås, L.E., (1994b). Nutritive
Value of Four Soybean Products in Diets for Atlantic Salmon (Salmo salar, L.).
Acta Agriculturae Scandinavica, Section A - Animal Science 44(1), 50-60.
Onwulata, C.I., Konstance, R.P., Smith, P.W., Holsinger, V.H., (2001). Co-extrusion of
Dietary Fiber and Milk Proteins in Expanded Corn Products. LWT - Food Science
and Technology 34(7), 424-429.
Padmanabhan, M., (1991). Flow behavior and exit pressures of corn meal under high-
shear–high-temperature extrusion conditions using a slit die. Journal of Rheology
35(3), 315.
Padmanabhan, M., Bhattachayray, M., (1989). Extrudate expansion during extrusion
cooking of foods. Cereal Food World 34, 945–949.
Paton, D., Spratt, W.A., (1984). Component Interactions in the Extrusion Cooking
Process: Influence of Process Conditions on the Functional Viscosity of the
Wheat Flour System. Journal of Food Science 49(5), 1380-1385.
Pereda, J.A.O., Rodríguez, A.I.C., Álvarez, L.F., Sanz, M.L.G., Minguillón, G.D.G.F.,
Perales, L.H., Cortecero, M.D.S., (2005). Tecnologia de alimentos: componentes
dos alimentos e processos. Artmed, Porto Alegre, Brazil.

218
Pereira, T.G., Oliva-Teles, A., (2003). Evaluation of corn gluten meal as a protein source
in diets for gilthead sea bream (Sparus aurata L.) juveniles. Aquaculture Research
34(13), 1111-1117.
Pham, C.B., Del Rosario, R.R., (1984). Studies on the development of texturized
vegetable products by the extrusion process. II. Effects of extrusion variables on
the available lysine, total and reducing sugars. International Journal of Food
Science & Technology 19(5), 549-559.
Plattner, B., (2007a). Density Management and Control, in: Riaz, M.N. (Ed.), Extruders
and expanders in pet food, aquatic and livestock feeds. Agrimedia, Clenze,
Germany, pp. 277-294.
Plattner, B. (2007b). Raw Materials and Their Impact on the Extrusion of Aqua Feeds In
Proceedings of the Conference Name|, Conference Location|.
Pritchard, G.I., (1976). Structured Aquaculture Development with a Canadian
Perspective. Journal of the Fisheries Research Board of Canada 33(4), 855-870.
Prudêncio-Ferreira, S.H., Arêas, J.A.G., (1993). Effect of phospholipid on protein
structure and solubility in the extrusion of lung proteins. Food Chemistry 47, 111-
119.
Raven, P., Walker, G., (1980). Ingredients for Fish Feed Manufacture in the United
States, Fish Feed Technology. Food and Agriculture Organization, Rome.
Refstie, S., Helland, S.J., Storebakken, T., (1997). Adaptation to soybean meal in diets
for rainbow trout, Oncorhynchus mykiss. Aquaculture 153(3-4), 263-272.
Refstie, S., Korsøen, Ø.J., Storebakken, T., Baeverfjord, G., Lein, I., Roem, A.J., (2000).
Differing nutritional responses to dietary soybean meal in rainbow trout

219
(Oncorhynchus mykiss) and Atlantic salmon (Salmo salar). Aquaculture 190(1-2),
49-63.
Refstie, S., Sahlström, S., Bråthen, E., Baeverfjord, G., Krogedal, P., (2005). Lactic acid
fermentation eliminates indigestible carbohydrates and antinutritional factors in
soybean meal for Atlantic salmon (Salmo salar). Aquaculture 246(1-4), 331-345.
Refstie, S., Storebakken, T., Baeverfjord, G., Roem, A.J., (2001). Long-term protein and
lipid growth of Atlantic salmon (Salmo salar) fed diets with partial replacement of
fish meal by soy protein products at medium or high lipid level. Aquaculture
193(1-2), 91-106.
Reinitz, G., (1980). Soybean Meal as a Substitute for Herring Meal in Practical Diets for
Rainbow Trout. The Progressive Fish-Culturist 42(2), 103-106.
Remsen, C.H., Clark, J.P., (1978). A Viscosity Model for a Cooking Dough. Journal of
Food Process Engineering 2, 39-64.
Renukaradhya, K.M., Varghese, T.J., (1986). Protein requirement of the carps, Catla catla
(Hamilton) and Labeo rohita (Hamilton). Proceedings: Animal Sciences 95, 103-
107.
Riaz, M.N., (1997). Using Extrusion to Make Floating and Sinking Fish Feed:
Controlling the Water Stability of Feed, Feed Management, pp. 21-24.
Riaz, M.N., (2000). Extruders in Food Applications. Technomic Publishing Company,
Inc., Lancaster, PA.
Riaz, M.N., (2007). Extruders and Expanders in Pet Food, Aquatic and Livestock Feeds.
Agrimedia, Clenze, Germany.

220
Robinson, E.H., Li, M.H., (2008). Replacement of Soybean Meal in Channel Catfish,
Ictalurus punctatus , Diets with Cottonseed Meal and Distiller’s Dried Grains with
Solubles. Journal of the World Aquaculture Society 39, 521-527.
Robinson, E.H., Li, M.H., Manning, B.B., (2001). Evaluation of Corn Gluten Feed as a
Dietary Ingredient for Pond-Raised Channel Catfish Ictalurus punctatus. Journal
of the World Aquaculture Society 32(1), 68-71.
Robinson, P.H., Karges, K., Gibson, M.L., (2008). Nutritional evaluation of four co-
product feedstuffs from the motor fuel ethanol distillation industry in the
Midwestern USA. Animal Feed Science and Technology 146, 345-352.
Rodriguez-Miranda, J., Delgado-Licon, E., Hernández-Santos, B., Reyes-Jaquez, D.,
Aguilar-Palazuelos, E., Medrano-Roldan, H., Navarro-Cortez, R.O., Castro-
Rosas, J., Gomez-Aldapa, C.A., (2012). The effect of pregelatinized potato starch
on the functional properties of an extruded aquafeed. Journal of Animal
Production Advances 2(7), 335-344.
Rokey, G., Plattner, B., (2003). A Practical Approach To Aqua Feed Extrusion, Feed
Management, pp. 24-27.
Rokey, G.J., (2007). Formulation and Dietary Ingredients, in: Riaz, M.N. (Ed.), Extruders
and Expanders in Pet Food, Aquatic and Livestock Feeds. Agrimedia, Clenze,
Germany, pp. 55-76.
Rolfe, L.A., Huff, H.E., Hsieh, F., (2001). Effects of Particle Size and Processing
Variables on the Properties of an Extruded Catfish Feed. Journal of Aquatic Food
Product Technology 10(3), 21-34.

221
Romarheim, O.H., Aslaksen, M.a., Storebakken, T., Krogdahl, A., Skrede, A., (2005).
Effect of extrusion on trypsin inhibitor activity and nutrient digestibility of diets
based on fish meal, soybean meal and white flakes. Archives of animal nutrition
59, 365-375.
Romarheim, O.H., Skrede, A., Gao, Y., Krogdahl, Å., Denstadli, V., Lilleeng, E.,
Storebakken, T., (2006). Comparison of white flakes and toasted soybean meal
partly replacing fish meal as protein source in extruded feed for rainbow trout
(Oncorhynchus mykiss). Aquaculture 256, 354-364.
Rosentrater, K.A., Muthukumarappan, K., (2006). Corn Ethanol Coproducts: Generation,
Properties, and Future Prospects. International Sugar Journal 108, 648-657.
Rosentrater, K.A., Muthukumarappan, K., Kannadhason, S., (2009a). Effects of
Ingredients and Extrusion Parameters on Aquafeeds Containing DDGS and Potato
Starch. Journal of Aquaculture Feed Science and Nutrition 1(1), 22-38.
Rosentrater, K.A., Muthukumarappan, K., Kannadhason, S., (2009b). Effects of
Ingredients and Extrusion Parameters on Properties of Aquafeeds Containing
DDGS and Corn Starch. Journal of Aquaculture Feed Science and Nutrition 1(2),
44 - 60.
Rosentrater, K.A., Richard, T.L., Bern, C.J., Flores, R.A., (2005). Small-Scale Extrusion
of Corn Masa By-Products. Cereal Chemistry 82, 436-446.
Rumsey, G.L., Hughes, S.G., Winfree, R.A., (1993). Chemical and nutritional evaluation
of soya protein preparations as primary nitrogen sources for rainbow trout
(Oncorhynchus mykiss). Animal Feed Science and Technology 40(2-3), 135-151.

222
Sales, J., (2009). The effect of fish meal replacement by soyabean products on fish
growth: a meta-analysis. The British journal of nutrition 102, 1709-1722.
SAS, (2012). SAS Institute, Inc., Cary, NC.
Seker, M., Saddikoglu, H., Hanna, M.A., (2004). Properties of Cross-Linked Starch
Produced in a Single Screw Extruder With and Without a Mixing Element.
Journal of Food Process Engineering 27(1), 47-63.
Şener, E., Yıldız, M., (1998). Türkiye’de balık yemi üretimi, Doğu Anadolu Tarım
Kongresi, Erzurum, Atatürk Üniversitesi, pp. 1030-1041.
Shukla, C.Y., Muthukumarappan, K., Julson, J.L., (2005). Effect of Single-Screw
Extruder Die Temperature, Amount of Distillers' Dried Grains With Solubles
(DDGS), and Initial Moisture Content on Extrudates 1. Cereal Chemistry 82(1),
34-37.
Singh, K., Garg, S.K., Bhatnagar, A., Kalla, A., (2004). Comparison of five different
practical diets with various concentrations of dietary protein in nursery ponds:
survival and growth of Indian major carp fry. Asian Fisheries Science 17, 21-134.
Singh, R.K., Nielsen, S.S., Chambers, J.V., Martinez-Serna, M., Villota, R., (1991).
Selected Characteristics of Extruded Blends of Milk Protein Raffinate or Nonfat
Dry Milk with Corn Flour. Journal of Food Processing and Preservation 15, 285-
302.
Singh, S., Gamlath, S., Wakeling, L., (2007). Nutritional aspects of food extrusion: a
review. International Journal of Food Science & Technology 42(8), 916-929.
Singh, S.K., Muthukumarappan, K., (2014a). Effect of Different Extrusion Processing
Parameters on Physical Properties of Soy White Flakes and High Protein

223
Distillers Dried Grains-Based Extruded Aquafeeds. Journal of Food Research 3,
107-123.
Singh, S.K., Muthukumarappan, K., (2014b). Single Screw Extrusion Processing of Soy
White Flakes Based Catla Feed. Journal of Food Research 4(1), 1-9.
Singh, S.K., Muthukumarappan, K., (2015). Effect of feed moisture, extrusion
temperature and screw speed on properties of soy white flakes based aquafeed: a
response surface analysis. Journal of the Science of Food and Agriculture.
Singh, S.K., Muthukumarappan, K., (2016). A Viscosity Model For Soy White Flakes
Based Aquafeed Dough In A Single Screw Extruder. Journal of Food Process
Engineering.
Singh, V., Johnston, D.B., Naidu, K., Rausch, K.D., Belyea, R.L., Tumbleson, M.E.,
(2005). Comparison of Modified Dry-Grind Corn Processes for Fermentation
Characteristics and DDGS Composition. Cereal Chemistry 82(2), 187-190.
Sinha, A., Sinha, Y.K.P., (1994). Role of vitamin E in growth of an Indian major carp,
catla (Catla catla). Journal of the Indian Fisheries Association 24, 91-96.
Sinha, A.K., Kumar, V., Makkar, H.P.S., De Boeck, G., Becker, K., (2011). Non-starch
polysaccharides and their role in fish nutrition – A review. Food Chemistry
127(4), 1409-1426.
Siregar, A.N., Ghani, J.A., Haron, C.H.C., Rizal, M., (2014a). Design Analysis of A
Single Screw Extruder For Jatropha Oil Extraction Using Finite Element Method.
Australian Journal of Basic and Applied Sciences 8(19), 315-319.
Siregar, A.N., WanMahmod, W.M.F., Ghani, J.A., Haron, C.H.C., Rizal, M., (2014b).
Design and Analysis of Single Screw Extruder for Jatropha Seeds Using Finite

224
Element Method. Research Journal of Applied Sciences, Engineering and
Technology 7, 2098-2105.
Skonberg, D.I., Hardy, R.W., Barrows, F.T., Dong, F.M., (1998). Color and flavor
analyses of fillets from farm-raised rainbow trout (Oncorhynchus mykiss) fed
low-phosphorus feeds containing corn or wheat gluten. Aquaculture 166(3-4),
269-277.
Skrede, A., Krogdahl, Å., (1985). Heat affects nutritional characteristics of soybean meal
and excretion of proteinases in mink and chicks. Nutrition Reports International
32(2), 479-489.
Sokhey, A.S., Kollengode, A.N., Hanna, M.A., (1994). Screw Configuration Effects on
Corn Starch Expansion During Extrusion. Journal of Food Science 59(4), 895-
896.
Sørensen, M., Stjepanovic, N., Romarheim, O.H., Krekling, T., Storebakken, T., (2009).
Soybean meal improves the physical quality of extruded fish feed. Animal Feed
Science and Technology 149(1-2), 149-161.
Spiehs, M.J., Whitney, M.H., Shurson, G.C., (2002). Nutrient database for distiller’s
dried grains with solubles produced from new ethanol plants in Minnesota and
South Dakota. Journal of Animal Science 80, 2639-2645.
Storebakken, T., Refstie, S., Ruyter, B., (2000). Soy products as fat and protein sources in
fish feeds for intensive aquaculture, in: Drackley, J.K. (Ed.), Soy in Animal
Nutrition. Federation of Animal Science Societies, Savoy, IL, pp. 127-170.

225
Sugiura, S.H., Dong, F.M., Rathbone, C.K., Hardy, R.W., (1998). Apparent protein
digestibility and mineral availabilities in various feed ingredients for salmonid
feeds. Aquaculture 159(3-4), 177-202.
Tacon, A.G.J., Jackson, A.J., (1985). Utilization of conventional and unconventioanl
protein sources in practical fish feeds, in: Cowey, C.B., Mackie, A.M., Bell, J.G.
(Eds.), Nutrition and feeding in fish. Academic Press, London, pp. 131-142.
Thiébaud, M., Dumay, E., Cheftel, J.C., (1996). Influence of Process Variables on the
Characteristics of a High Moisture Fish Soy Protein Mix Texturized by Extrusion
Cooking. LWT - Food Science and Technology 29(5-6), 526-535.
Thomas, M., van Kol, E.M.R.A.H., Tamminga, S., Verstegen, M.W.A., van der Poel,
A.F.B., (1997). Effects of Water, Steam and Shear Conditioning on the Protein
Quality of Soy Grits. Journal of the Science of Food and Agriculture 74(3), 392-
400.
Tran, Q.D., Hendriks, W.H., van der Poel, A.F.B., (2008). Effects of extrusion processing
on nutrients in dry pet food. Journal of the Science of Food and Agriculture 88(9),
1487-1493.
Tumuluru, J.S., Sokhansanj, S. (2008). Optimization of Aqua Feed Pellet Properties using
Genetic Algorithm In Proceedings of the Conference Name|, Conference
Location|.
USDA, (1999). Practical procedures for grain handlers: Inspecting Grain. United States
Department of Agriculture-Grain Inspection, Packers and Stockyards
Administration.

226
USDA, (2016). World Agricultural Supply and Demand Estimates. United States
Department of Agriculture, pp. 1-38.
Vergnes, B., Della Valle, G., Tayeb, J., (1993). A specific slit die rheometer for extruded
starchy products. Design, validation and application to maize starch. Rheologica
Acta 32(5), 465-476.
Vernaza, M.G., Chang, Y.K., Steel, C., (2009). Efeito Do Teor De Farelo De MaracujÁ E
Da Umidade E Temperatura De ExtrusÃo No Desenvolvimento De Cereal
Matinal Funcional OrgÂnico. Brazilian Journal of Food Technology 12(2), 145-
154.
Vielma, J., Mäkinen, T., Ekholm, P., Koskela, J., (2000). Influence of dietary soy and
phytase levels on performance and body composition of large rainbow trout
(Oncorhynchus mykiss) and algal availability of phosphorus load. Aquaculture
183(3-4), 349-362.
Wang, W.M., Klopfenstein, C.F., Ponte, J.G., (1993). Effects of Twin-Screw Extrusion
on the Physical Properties of Dietary Fiber and Other Components of Whole
Wheat and Wheat Bran and on the Baking Quality of the Wheat Bran. Cereal
Chemistry 70(6), 707-711.
Warnick, R.E., Anderson, J.O., (1968). Limiting essential amino acids in soybean meal
for growing chickens and the effects of heat upon availability of the essential
amino acids. Poultry Science 47(1), 281-287.
Webster, C.D., Yancey, D.H., Tidwell, J.H., (1992). Effect of partially or totally
replacing fish meal with soybean meal on growth of blue catfish (Ictalurus
furcatus). Aquaculture 103(2), 141-152.

227
Williams, M.A., (1991). Feed Processing Extruded Starter Pig Feeds, Feed Management,
pp. 20-23.
Williams, M.A., Horn, R.E., Rugala, P.P., (1977). Extrusion: An In-Depth Look at a
Versatile Process, Food Engineering, pp. 99-102.
Winowiski, T.S., (1995). Pellet Quality in Animal Feeds. MITA (P) No: 195/11/95.
American Soybean Association.
Wu, Y.V., Rosati, R., Sessa, D.J., Brown, P., (1994). Utilization of protein-rich ethanol
co-products from corn in tilapia feed. Journal of the American Oil Chemists’
Society 71, 1041-1043.
Wu, Y.V., Rosati, R.R., Brown, P.B., (1996). Effect of Diets Containing Various Levels
of Protein and Ethanol Coproducts from Corn on Growth of Tilapia Fry. Journal
of Agricultural and Food Chemistry 44, 1491-1493.
Wu, Y.V., Rosati, R.R., Sessa, D.J., Brown, P.B., (1995). Evaluation of Corn Gluten
Meal as a Protein Source in Tilapia Diets. Journal of Agricultural and Food
Chemistry 43(6), 1585-1588.
Zarkadas, L.N., Wiseman, J., (2005). Influence of processing of full fat soya beans
included in diets for piglets. I. Performance. Animal Feed Science and
Technology 118(1-2), 109-119.
Zazueta-Morales, J., Martinez-Bustos, F., Jacobo-Valenzuela, N., Ordorica-Falomir, C.,
Paredes-Lopez, O., (2002). Effects of Calcium Hydroxide and Screw Speed on
Physicochemical Characteristics of Extruded Blue Maize. Journal of Food
Science 67(9), 3350-3358.