Volunteering Programme Simon Goff Head of Green Spaces and Amenites

Understanding the drivers of volunteering in culture and sport: analysis of the Taking Part Survey
August 2011

Drivers of volunteering
The CASE programme The Culture and Sport Evidence (CASE) programme is a three-year joint programme of research led by the Department for Culture, Media and Sport (DCMS) in collaboration with the Arts Council England (ACE), English Heritage (EH), the Museums, Libraries and Archives Council (MLA) and Sport England (SE). The National Centre for Social Research was commissioned to produce this report. Authors: John D’Souza Natalie Low Lucy Lee Gareth Morrell Julia Hall

Drivers of volunteering
3
Contents
Section 1: Executive summary 4
Section 2: Overview of volunteering 6
Section 3: Drivers of volunteering 11
Section 4: Patterns of volunteering 17
Section 5: References 23
Appendix A: Explanatory variables used in the modelling 26
Appendix B: Results of the regression analysis 29
Appendix C: Results of latent class analysis 37

Section 1: Executive summary The National Centre for Social Research was commissioned to undertake analysis of the Taking Part Survey data to identify the key drivers of volunteering in the sports, arts, heritage and museums, libraries and archives (MLA) sectors, and to develop a typology of individuals who do volunteer. Drivers of volunteering were identified using logistic regression and latent class analysis (LCA) was used to divide volunteers up into different and distinct groups or clusters. The study was commissioned by the Culture and Sport Evidence (CASE) programme, a three-year joint programme of research led by the Department for Culture, Media and Sport (DCMS) in collaboration with the Arts Council England , English Heritage, the Museums, Libraries and Archives Council and Sport England
General drivers of volunteering in culture and sport
The logistic regression analysis found a number of statistically significant factors related to volunteering across all the culture and sport sectors, in particular:
Higher levels of volunteering amongst men, younger people and white people. Most of the volunteering in the sporting and cultural sectors is volunteering in sports, and men predominate in that sector.
Those with better health tended to be more likely to volunteer. Those with a long-term disability that did not limit their day-to-day activities were also more likely to volunteer than those with a limiting long-term illness or disability. The analysis also found that non-smokers were more likely to volunteer.
Higher levels of volunteering were generally associated with lower levels of deprivation – this was found in relation to socio-economic classification, educational qualifications, ACORN classification and car and internet access.
Sector specific drivers of volunteering
Volunteering in the sports sector was higher for those who participate in sports, younger people and men. Volunteering was also higher for people with a long-term illness. Drinking alcohol was also associated with higher levels of volunteering, which may be identifying the more outgoing and sociable who are more likely to get involved in team activities. Volunteering in the arts sector, in contrast, was higher amongst women and older people. In addition, those practising a religion, single people, part-time workers or those not working had higher rates of arts volunteering. The relationship with disability, drinking alcohol, and indicators of higher affluence was similar to that seen for sports volunteering. Volunteers in the heritage sector exhibited many of the same drivers to those in the arts sector. However, health and disability were not related to volunteering in this sector. Relatively few significant drivers were identified for volunteering in museums, libraries and archives. This is likely due to the fact that there were very few in the sample who volunteered in these sectors (0.5%). Many of these drivers are similar to the drivers that Marsh et al. (2010) found for participation in these sectors:

Drivers of volunteering
5
Men, young people and those with no or low academic qualifications are more likely to participate in sport, mirroring the drivers of volunteering in sport.
In contrast, young people and those with lower academic qualifications are less likely to participate in cultural events, mirroring the drivers of volunteering in the cultural sector.
A typology of volunteering
LCA was used to divide volunteers up into four distinct groups. The characteristics of these groups are shown below.
General volunteers
Volunteering, but not in the main culture and sport sectors
•67% of all volunteers
•Activities related to fundraising, organising or running events, and other practical help.
•The majority (60%) mentioned only one task related to their volunteering work.
•Predominantly female and older than the other groups.
Sports volunteers
Volunteering predominately in the sports sector
•14% of all volunteers
• Involved with coaching or tuition (36%), fundraising (36%) and organising or running activities (33%).
•Majority (54%) only mentioned one task as part of their volunteering.
•More likely to be male, younger, and have children than the other groups.
•Much more likely to have participated in any sport in the previous four weeks than other groups. Participating in sport is clearly associated with volunteering for sports.
Multi-activity volunteers
Volunteering in culture and sport sectors and undertaking 5+ tasks
•12% of all volunteers
•Activity levels were high for all tasks: organising/running events (83%), committee membership (80%), fundraising (67%), leading a group (65%).
•Unlike general and sports volunteers, relatively high proportion (31%) volunteered in two or more sectors.
•More likely to be middle age-range, married or cohabiting, have high educational qualifications, have professional NS-SEC classification.
•Reflecting their high levels of volunteering activity, multi-activity volunteers also had high (often the highest) levels of participation for different arts and heritage events.
•Most likely to agree that they had some influence over the quality of their local environment and local cultural facilities.
Arts and heritage volunteers
Volunteering in the arts (59%), heritage (35%) or both arts and heritage (4%)
•7% of all volunteers
•More likely than any other group to volunteer in the museum/galleries sector and libraries sector.
•Many (40%) were involved in organising or helping to run an activity or event.
•More likely to be single and without children, and a high proportion lived in London.
•Higher levels of participation in arts and heritage events, and more likely to agree that they were able to influence local cultural facilities.
Section 2: Overview of volunteering
Volunteering policy in the UK
The political profile of volunteering has increased dramatically in recent years. Volunteering has been a central pillar of civic renewal strategies of the previous Labour government, seen as a central act of citizenship and key to developing strong and prosperous communities. From the Millennium volunteers, through vinspired and now National Citizen Service, a range of large-scale centrally organised policy interventions have attempted to further encourage a wider, more diverse group of young people to volunteer and undertake other „pro-social‟ activities. The current Big Society agenda further stresses the value of volunteering, yet marks a change in approach, moving away from centrally managed initiatives to a policy that aims to facilitate increased volunteering by removing some of the barriers to becoming a volunteer and embedding a culture of community action at a local level.
The literature on volunteering
To achieve these broad cross-governmental policy aims, and enable third sector organisations to make the best use of funds in increasingly challenging circumstances, there is an increasing need for robust evidence on what motivates those that volunteer and what deters those who do not. A wealth of research has been conducted on volunteering contributing to theoretical discussions on the definition of volunteering, understanding why different people engage in it and the impact of volunteering on organisations, the economy and wider society. Traditional definitions of volunteering required three criteria to be satisfied: that it be unpaid, undertaken of the volunteer‟s own free will and that it is of benefit to others. While these are core elements of more contemporary understandings, more flexibility is accepted in recent definitions. This is an acknowledgment that volunteering can involve some financial reward or incentive so long as unpaid time is also involved or that volunteering can be undertaken as core parts of courses or programmes. In fact, Ellis Paine et al. (2010) argue that the three core principles should be seen as continuum, along which we determine whether a particular activity can be deemed as volunteering. Research has also generated a body of knowledge on who volunteers and in what circumstances. Volunteering has often been concentrated amongst more wealthy sections of the population, those with spare time and skills and experience to share such as older people and individuals with an existing interest in the sector in which they volunteer. Those defined by the Cabinet Office as „at risk of social exclusion‟, including those out of work, with a disability, and ethnic minorities, show lower levels of volunteering. Evidence from the Helping Out Survey shows that 32 per cent of this sub group are involved in volunteering compared with 42 per cent amongst other groups (Low et al. 2007). Acknowledgement of the benefits of volunteering to the individual and assessments of the barriers to volunteering for these groups has contributed to the emergence of an additional feature in modern definitions of volunteering: diversity, meaning that volunteering should be open to, and inclusive of, all social groups (Teasdale 2008). Understanding the motivations of volunteers represents a further strand of the literature. Viewing volunteering purely as an altruistic gesture is challenged, with the literature more concerned to recognise and understand that engaging in volunteering often entails an exchange or a transaction: volunteers offer their time, labour or expertise in return for personal gain. This can include, for young people or those finding it difficult to access the labour market, the development of transferable skills increasing their employability. For others it can include social capital, the opportunity to meet new people. It can also satisfy a desire to „give back‟, to repay others or a system or organisation from which volunteers have previously benefited (Ellis Paine et al. 2010, and for young people see NatCen, 2011 forthcoming). Acknowledgement of this transaction has further focused government bodies in making volunteering attractive to a wider audience.
Drivers of volunteering
7
Volunteering in the sport and cultural sectors
Demographics and trends in volunteering Beyond the Taking Part Survey, there is relatively limited robust national data on sport and cultural sector volunteers. A Sport England-funded study in 2002 estimated that there were 5.4 million adults volunteering the sport sector (Taylor 2004). This figure compares to eight million members of voluntary sports clubs affiliated to National Governing Bodies (NGBs). In general, men are more likely to volunteer in sports and exercise (30% compared with 16% of women) (Low et al. 2007) and volunteering roles vary by gender, with men more likely to volunteer as coaches, and women as administrators in sport (Active Adults Survey, 2008/09, Sport Wales 2010). Those aged 35-44 years are more likely than others to volunteer in sports (28% compared with 22% overall), which likely ties into having children involved in sports clubs (see below). Research on the cultural sectors tends to be sub-divided into arts, museums and libraries, and heritage and environment. Russell (2009) details findings from South West England on the make-up of the volunteering population in the heritage sector. Volunteers are evenly split between male and female, with 54 per cent aged over 55 (34% were retired), only eight per cent under 24 and only four per cent unemployed reflecting common assumptions about volunteers. A similar pattern of volunteering was found in the North East of England (Ockenden 2008) where volunteers tend to be from an increasingly narrow section of society, particularly older, retired people. Ockenden‟s research also found that the volunteer population was predominately white. Evidence suggests that volunteers supported by the British Trust for Conservation Volunteers (BCTV) are overwhelmingly white (96%, BEN 2002) and Chakroborti and Garland (2004) argue that this reflects often rural and nationalistic interpretations of Englishness that surround the heritage sector, which may deter ethnic minorities (and, presumably, others) from engaging with the sector. However, this may also reflect the fact that heritage sites are disproportionately located in areas with low levels of ethnic diversity. The picture for heritage volunteering seems to be at odds with that of other sectors not discussed in this report, which draw volunteers from a wider pool (Low et al. 2007, Smith 2002), where the activities involved and the cultures of the organisations may have a broader appeal. Davies‟ (2009) evaluation of the English Heritage education volunteering programme, the objective of which was to involve and support volunteers in specific English Heritage sites found that in 2008/09, the scheme managed 3,000 hours of volunteering. Nearly three-quarters of the people supplying these hours had volunteered for English Heritage previously, nearly half were aged 60 or over, 83 per cent were female and none was from ethnic minorities. The report also found that the majority of participants volunteered regularly rather than on a single occasion: 21 per cent at least once a week and 48 per cent at least once a month. In the environmental sector, Russell (2009) found 42 per cent to volunteer at least once a week, and 31 per cent at least once a month. A report by the Institute of Volunteering Research (2005) sheds light on the profile of volunteers in Museums, Libraries and Archives (MLAs). Similar to the heritage and environment sector, volunteers tend to be older with the proportion of volunteers over 65 increasing from 65 per cent in 2001 to 72 per cent in 2005. Women are more likely to volunteer across MLAs, though the proportion of males is higher in museums (49%) than archives (42%) and in archives than libraries (32%). This sector also struggles to attract people from an ethnic minority background (96% of volunteers were white), though it is noted that a more ethnically diverse volunteer force is present in London and other metropolitan centres.
Types of volunteering The literature provides a number of typologies of approaches to organising volunteering and volunteering activities to help map the sector overall and to understand what drives different groups to volunteer. First, a broad distinction is often made between youth volunteering and adult volunteering. Youth volunteering is considered distinct as it is more likely to involve a developmental element, i.e. young people are encouraged to volunteer while also developing skills, personal qualities and receiving accreditation or incentives. In the sporting sector, Sport England (2010) identifies opportunities for „young leaders‟ offered by NGBs such as volunteer camps, places on committees, organising sporting events, mentoring and schemes linked to further and higher education opportunities. Within adult volunteering other categorisations have been made to help map the activities volunteers undertake. A distinction in approaches to volunteering is found in the literature between formal and informal volunteering, where the former is scheduled and supervised and the latter a more ad hoc commitment from both the volunteer and the recipient organisation. Taylor (2004) suggests that this distinction mirrors a contrast between contemporary volunteering programmes (formal, structured and professionalised) and traditional volunteering (a more ad hoc approach). A government definition of formal volunteering (cited in e.g. Low et al. 2007 and based on Citizenship Survey measures) distinguishes this from informal volunteering in that the former is specifically accessed and delivered via groups, clubs or organisations. An alternative way of viewing volunteering is developed by Davis Smith (2000) that focuses more on the end beneficiary of the volunteering, making a distinction between mutual aid/self-help, philanthropy/service to others, participation, and advocacy and campaigning. A more practical categorisation is made by Lord and Lord (1997) dividing activities undertaken into governance, management and task volunteering. Other typologies tend to be more sector-specific. Adult volunteering in the environmental sector is categorised by Measham and Barnett (2007) into five broad approaches: activism, education, monitoring, restoration and sustainable living describe the aims of an organisation in running a volunteering programme. Further categorisations are made in this sector in relation to the activities undertaken, though there is some overlap with the approaches typology. Volunteer Development Scotland (2006) highlights practical work, biological recording, education and training, and organisational support. There is a range of evidence (Ockenden 2008, Russell 2009, Measham and Barnett 2007) on which activities are most prevalent in the environment and heritage sectors suggesting a predominance of physical and conservation activities as well as wildlife management and monitoring. More general activities such as providing organisational or administrative support, practical help, raising money or providing transport are less prominent in this sector (Russell 2009; see also Low et al. 2007). In the heritage sector, research suggests that there are gender specific patterns in what activities people volunteer for (Russell 2009). Men are more likely to undertake habitat restoration and other practical help as well as management roles. Conversely, women are more commonly involved in wildlife or biological monitoring and organising or running an event. There is also evidence of the kinds of activities volunteers take on in MLAs (IVR 2005). In museums, volunteers are most likely to participate in running an event or offering help and advice. In archives there is a predominance of administrative and clerical work amongst volunteers where as volunteers in libraries spend most of their time visiting people. Drivers of volunteering There is a wealth of research into what drives people to volunteer and some evidence showing that different social groups are influenced by different factors. A number of the issues discussed in previous sections are relevant here. Firstly, that volunteering has become more formalised and is increasingly as much defined by what the individual volunteer can get out of the experience as what

Drivers of volunteering
9
they contribute or how the organisation benefits. Secondly, that those historically less likely to volunteer – younger people, ethnic minorities, and people receiving welfare benefits – are more likely to be attracted if volunteering opportunities are marketed and designed more with them in mind and with more of a focus on the benefits they may receive. A key distinction of drivers is also made between motivations, why people choose to volunteer, and facilitators, what is more likely to make that happen. There are a range of models or typologies of motivations to volunteer. As noted above, traditional understandings of volunteering as a purely altruistic gesture have been refined in line with greater understanding of what volunteers can gain as well reflecting changes in volunteering opportunities to emphasise these benefits. Broad distinctions are often made, therefore, between what volunteers are willing to provide (inputs) and how they are hoping that the volunteering experience will benefit them (outputs). Models that utilise this concept see volunteering as an „exchange‟ acknowledging that altruism and self-interest can co-exist (Street 1994, Godbout 1995, Stebbins 1996). Within that distinction, other literature emphasises the difference between intrinsic and extrinsic (Taylor 2004): for example and altruistic motivation to contribute to wider social or community benefits; self-interest could be the development of skills or qualifications but also be social interaction and meeting new people. There is a recurrent suggestion in the literature that the motivations of young people are more likely to include elements of intrinsic self-interest that relate to personal and career development. Locke (2006) notes the personal advantages young people hope to accrue through volunteering are likely to be of less relevance to older age groups, such as gaining a qualification or early work experience. This does not, however, preclude young people from being motivated by a desire to help or meet others. Locke and others (e.g. Reynolds 2000) also stress that motivations to volunteer do not necessarily remain unchanged. Motivations to sustain volunteering are often related to maintaining variety, accessibility and choice, though they can also develop out of unanticipated benefits. People who are not motivated by altruism or making a difference to the lives of others when deciding to volunteer, may continue volunteering for exactly that reason once the relevance of their original motivation – to meet people or develop skills – has long since been achieved. In addition to motivations, ongoing research with young volunteers by NatCen also shows that a number of practical and context-specific factors actually facilitate the volunteering taking place (NatCen 2011 forthcoming). Time and proximity are key factors in making volunteering happen – the potential volunteer, even if already motivated to volunteer, still requires the spare time to participate and an opportunity to do so located close enough to their home or place of work. Equally, a key facilitator for volunteers is that they are able to meet their expectations and motivations in a setting that is of interest to them or is in a context that they are familiar with. Individuals with an interest in sport or who are keen visitors to museums are more likely to volunteer in those sectors, reflecting the co-existence of altruism and self-interest. The literature does provide some insight into how these drivers manifest themselves in the sporting and cultural sectors. In the environment and heritage sectors, evidence suggests that context specific facilitators, such as a personal interest in nature or in museums, appear to be a key factor. Russell (2009) reviews a range of studies that lead to this conclusion, highlighting the „biological pull‟ some humans have to this type of volunteering or an attachment to a particular place (Measham and Barnett 2007, Smith 2002). Other volunteers have described a wider motivation to improve environmental awareness amongst others (O‟Brien et al. 2008). In terms of personal benefits, the National Trust found that social and team-related benefits were a motivation for becoming a volunteer. Despite this, Measham and Barnett (2007) found self education to be less important that in other sectors. A survey (Russell 2009) backs up this assertion, with the top rated answers for motives for becoming involved included „the cause‟, „desire to improve things‟, and „chance to use existing skills‟. Further down the list came „helping my career‟, „getting a recognised qualification‟ and „to make friends‟. The environment and heritage sectors appear to reflect broader volunteering patterns in the respect that younger people were more likely to say learning skills or gaining a qualification was a motivation, while older people emphasised using their own skills and having the time.

Reiterating points made previously about the lack of diversity among volunteers in this sector, the literature suggests that there is a lack of engagement from the heritage sector with all age groups (Ellis Paine and Davis Smith 2006). In particular, it is noted that while museums do not have enough volunteers nor have they been effective in reaching out to new groups of volunteers (i.e. those who may not have an existing interest in the environment or a link with the institution). However, Taylor (2004) suggests that greater formalisation of roles could encourage or deter potential volunteers depending on their social group and expectations of volunteering. In the sporting sector Nichols (2006) distinguishes „stalwarts‟ (a minority giving the majority of the time) in the sporting sector from other volunteers. Stalwarts‟ motivations are more linked to their children‟s involvement and wanting to improve their experience of sport. Stebbins (1996) has categorised sporting volunteers differently, into four types, based on their motivations and level of involvement as volunteers. The first two types are considered marginal volunteers, „obligers‟ and „role dependees‟ and the second two described as careerists, „altruistic careerists‟ and „self-interested careerists‟ that tend to be volunteers key to the delivery of a particular service or process. Wang (2004) identifies five categories of motivations in the sporting sector that largely follow the distinction make previously between altruism and self-interest and the intrinsic and extrinsic:
altruistic value – personal values and belief in helping others
personal development – challenging self, gaining experience and sharing skills and knowledge
community concern – making a contribution to the community and promoting volunteering
social adjustment – volunteering is important to significant others, family members
ego enhancement – volunteering to feel part of a unique experience
Wang‟s (2004) research shows that the first four constructs are related but distinguishable. Hoye et al. (2008) argue that this supports other findings in the sporting sector that show that the context of volunteering impacts on motivations. As with the environment and heritage sector, interest or participation in voluntary sporting organisations is an important facilitator to enable volunteering to take place. In fact, Atchley (1999) has suggested that a move from participation to volunteering may be understood through continuity theory as an extension of a central life interest. However, a Sport England survey (Taylor et al. 2003) found that only 15 per cent of sports club volunteers were motivated by a desire to stay involved in sport they participated in. A more nuanced understanding of this may be found using Nichols‟ (2006) concept where the continuity is for volunteers to help out where their children participate – the stalwarts. In fact, secondary analysis of the Sport England Omnibus (2002) showed that 51 per cent of volunteers initially became involved because their child took part in sport (Nichols 2006). In this context, volunteering in the sporting sector can also been seen as perhaps further from the idea of an exchange or transaction and more of an expression of shared enthusiasm (Pattie et al. 2004). Overall, the literature suggests that volunteering in the sporting and cultural sectors is driven by a range of motivations and practical facilitators. The patterns of volunteering and the drivers for specific social groups appear to mirror patterns in volunteering in general with younger people more, though not exclusively, motivated by self-interest and older groups by wanting to give back and having the time to be able to do so as well as self-interest through their children. However, broadly speaking it would seem that drivers of volunteering in the sporting and cultural sectors are balanced more towards altruistic or an interest in the sector itself, rather than personal or social development.

Drivers of volunteering
11
Section 3: Drivers of volunteering In this section, we analyse Taking Part to assess what characteristics are associated with different levels of volunteering. We examine volunteering for any of the sports, arts, heritage and museums, libraries and archive (MLA) sectors, both combined and separately for each the sectors. For volunteering across the sectors, the analysis uses the 14,452 interviews carried out for the 2008/09 sweep of Taking Part. However, as the numbers of volunteers (defined as having done any volunteering in the previous twelve months) were very small, particularly for individual sectors (see Table 3.1 below) data from both the 2007/08 and 2008/09 waves of the survey were combined when looking at sector-specific volunteering. Table 3.1: Proportion of volunteers in each of the main analyses Proportion volunteering Population estimate
a Base size
Volunteering in any sector
7.8% 3,258,585 14,452
Sports 5.0% 2,088,837 40,152
Arts 1.6% 668,428 40,152
Heritage 1.0% 417,767 40,152
MLA 0.5% 208,884 40,152 aEstimated using 2008 mid-year population estimates of adults aged 16+ in England from ONS.
We start with simple exploratory analysis to highlight the main features of the data in terms of how volunteering varies between different groups. We then use multivariate analysis techniques (in this case, logistic regression) to look in more detail at the effect of different variables on levels of volunteering. Taking Part includes many potential explanatory variables but careful examination and selection is key to creating a useful statistical model. To inform this choice, we drew heavily on previous studies (e.g. Buraimo et al. 2010, Drever 2010, and Bunting et al. 2008) that identified potential drivers for volunteering and wider participation. We focussed on five main types of information about people: their demographic characteristics, information related to their health and lifestyle, indicators of social stratification, area-level characteristics and finally satisfaction with their local area. (The list of variables used in our modelling is given in Appendix A.)
Levels of volunteering for different groups
Figure 3.1 shows the levels of volunteering varied by sector and sex. It‟s clear from this that volunteering is more prevalent in the sports sector than any of the others and that men are more likely to volunteer in this sector.

Figure 3.1: Volunteering, by sector and sex, 2007/08 and 2008/09 data combined
Appendix A contains detailed tables concerning the relationship between volunteering (in any sporting or cultural sector) and different key groups. Demographic characteristics: Volunteering is related to age (with younger respondents more likely to volunteer), sex (men (9.1%) are more likely to volunteer than women (5.9%)), marital status, and ethnicity (white (7.5%) respondents are more likely to volunteer than Black and minority ethnic (BME) (5.5%) respondents). Health and lifestyle: There is also a strong relationship between volunteering and health or disability. Respondents in bad or very bad health were much less likely to volunteer than average (2.4% compared to 7.4%). However, those with a long-term illness that did not limit their activities were more likely to volunteer (9.7%). Previous studies had found that volunteering is associated with access to a car and access to the internet. Our initial analyses also found a significant relationship with volunteering, although as access varies by income and other measures of well-being, this result should be interpreted with caution. Social stratification: In general, respondents with academic qualifications are more likely to volunteer than those without. Volunteering levels among those with the highest qualifications are significantly higher than among those with level 1 qualifications, trade apprenticeships or other qualifications (although similar to those with level 2 qualifications); and students and those in professional and managerial positions are more likely to volunteer. Respondents living in the social rented sector are also less likely to volunteer. Area-level characteristics: Area-level characteristics, as measured by the ACORN categorisation, showed that volunteering levels are highest in non-deprived areas. Satisfaction with the local area: We found no significant relationship between satisfaction with the local area and volunteering levels.
9.1
6.6
1.5 1.3 0.6
5.9
3.4
1.8
0.8 0.5
0
1
2
3
4
5
6
7
8
9
10
Any cultureor sportsector
Sport Arts Heritage Museums,libraries and
archives
Pe
rce
nta
ge
Men
Women

Drivers of volunteering
13
Identifying the drivers of volunteering
Our exploratory analysis confirms that levels of volunteering vary for different groups. However, as the explanatory variables may also be closely related to each other (e.g. young people are more likely to be single), some of the relationships with volunteering found in the table above may just reflect these inter-linkages. For example, respondents in bad health are much less likely to volunteer than those in good health, as are the elderly compared to those in other age groups. As older people tend to report worse health, it is difficult to know whether health has a relationship to volunteering in its own right or whether this just reflects the different age profile of those in bad health. To get over this limitation, we use multivariate techniques (multiple regression, logistic regression and factor analysis) to examine more closely the relationship between different variables and volunteering. Multivariate techniques can be used to isolate the effect of an individual variable, by holding all other factors constant and taking into account how explanatory factors are related to each other. For this analysis, we selected logistic regression techniques to look at the probability that an individual volunteers, and how this varies with different individual-level and area-level characteristics. Logistic regression is a variation of ordinary regression which is used when the outcome variable is binary (i.e. equal to zero or one), in this case whether or not an individual volunteered. (For fuller details of the modelling technique and procedures see Appendix B.) Our full list of explanatory variables was initially included in the modelling. Any variables that were not found to have a statistically significant relationship to volunteering were excluded from the final model. (An exception was made for age and sex, which were retained in all models whether or not they were found to be significant.) As Taking Part consists of survey data, full account was taken of the sample design (e.g. weighting and clustering) when estimating parameters and errors for the model (see Appendix B). Table 3.2 summarises the statistically significant (at the 95% level) factors found for volunteering across the sports, arts, heritage and MLA sectors. Full details of the model are given in Appendix Table B.1. Broadly speaking, the relationships found in the exploratory analysis are confirmed, in particular:
the higher levels of volunteering for certain demographic groups i.e. men, younger age groups and those of white ethnicity. The multivariate analysis additionally identified higher levels of volunteering amongst people who actively practised a religion (compared to those who were non-practising or had no religion).
the linkages between measures of health/disability and volunteering. The multivariate analysis also identified a significant relationship between volunteering and smoking and drinking behaviour.
that higher levels of volunteering are generally associated with lower levels of deprivation – this was found in relation to socio-economic classification, educational qualifications, ACORN classification of area and car and internet access.
We should note that sports volunteers were much more numerous than the other types of volunteers, hence many of the factors associated with higher sports volunteering are the same as those for volunteering for all the sectors combined.

Table 3.2: Predictors of volunteering in any culture or sport sector Variable Description
Age within sex Men were more likely to volunteer than women; younger people were also more likely to volunteer
Ethnicity White people were more likely to volunteer than people from ethnic minorities
Religion People practicing a religion were more likely to volunteer than those who were non-practicing or not religious (this finding was not apparent in the descriptive analysis).
General health People in good health were more likely to volunteer than those in worse health
Long-term illness
People with a limiting long-term illness that were not limiting were most likely to volunteer
Smoke Non-smokers were more likely to volunteer than smokers
Drinking People who drank alcohol were more likely to volunteer than non-drinkers
NS-SEC category
Students and people in managerial and professional positions were more likely to volunteer than average
Highest qualification
Those with academic qualifications (degree, A levels, or good O levels/GCSEs) were more likely to volunteer than those with apprenticeships or with no qualifications.
Acorn category People living in areas with an ACORN classification of “Moderate Means” or “Hard Pressed” were less likely to volunteer
Access to a car Those in household with access to a car were more likely to volunteer than those with no access
Internet access Those in household with internet access were more likely to volunteer than those with no access
The logistic regression models were also run separately for volunteering in sports, arts, heritage, and MLA sectors. Table 3.3 summarises the factors that were found to be significant across the sectors: it shows which groups had significantly higher volunteering for each sector. . Table 3.3: Predictors of volunteering in specific culture and sport sectors (Bold type indicates a particularly strong relationship, i.e. had the largest coefficients in the model)
Variable Sport Arts Heritage MLA
Age Younger Older Older Older
Sex Male Female
Religion Practicing a religion Practicing a religion Practicing a religion
Marital status Single/separated Single Single
General health Good health Good health
Long-term illness Has an long-term illness, not limiting
Has an long-term illness, not limiting
Smoke Non-smoker
Drinking Drinks alcohol Drinks alcohol Drinks alcohol
NS-SEC category Student/Professional/Managerial
Student/Professional/Managerial
Employment status
Works part-time Works part-time Works part-time or not working
Highest qualification
Academic qualifications
Academic qualifications
Higher education Academic qualifications
Acorn category Advantaged Advantaged
Access to a car Yes Yes
Internet access Yes Yes Yes
Tenure Owner
Structure of household
Live-in children and live-in partner
Drivers of volunteering
15
Sports volunteering Sports volunteering was higher for men, those in younger age groups and those in good health – all of whom are more likely to participate in sports. However, it was also higher for those with a long-term illness, which may reflect people getting involved with sports programmes specifically tackling disability issues or targeted towards this group. Non-smokers were also more likely to volunteer in sports, although drinking alcohol was associated with higher levels of volunteers. The latter measure may be identifying individuals who are more outgoing and sociable, and therefore more likely to get involved in team activities. Several indicators of higher affluence – having a professional/managerial occupation, having academic qualifications, being an owner-occupier and having a car/internet access – were also separately associated with higher levels of volunteering Arts volunteering In direct contrast to sports, volunteering in the arts was higher amongst women and older age groups. There were also new drivers: those practising a religion, those who were single and part-time workers also had higher levels of volunteering. However, the relationship between arts volunteering and health and disability, drinking alcohol, internet access and qualifications was similar to that seen for sports volunteering. Residents of more „advantaged‟ ACORN areas were more likely to volunteer in the arts. Heritage volunteering Many of the drivers of heritage volunteering were similar to those observed for volunteering in the arts. This included higher levels of volunteering for older people, those practising religion, those who were single, those in better health, part-time workers, those drinking alcohol and those with higher qualifications. However, having access to a car was additionally linked to higher levels of heritage volunteering. MLA volunteering Relatively few significant drivers were identified for volunteering in museums, libraries and archives. It is possible that there is no relationship, but also possible that the sample size was not large enough to detect a relationship.
Time spent volunteering
Taking Part also asked respondents about the amount of volunteering they had done over the previous four weeks in each of the main sectors. To analyse these questions we used linear regression to model the amount of time spent volunteering and the explanatory variables already identified. Respondents who had not done any volunteering in the previous four weeks, and those who had only volunteered outside the sports, arts, heritage and MLAs sectors, were excluded from the analysis; and data from the 2007/08 and 2008/09 waves of the survey were combined. Exploratory analysis showed that the major factor influencing the amount of time a respondent spent volunteering was the age of the volunteer. Younger respondents spent less time volunteering. This is shown in shown in Table 3.4 below.

Table 3.4: Time spent volunteering in culture and sport sectors in the previous four weeks Age within sex Mean (hours) Standard deviation (hours)
Male 16-29 8.9 10.1
Male 30-59 13.6 17.2
Male 60+ 16.7 21.8
Female 16-29 10.1 14.3
Female 30-59 12.5 17.4
Female 60+ 15.8 23.1
Total 12.9 17.6
The time spent volunteering was skewed, with a small number of volunteers reporting spending a large amount of time on volunteering, so the data were transformed by taking logarithms. The natural logarithm of the time spent volunteering was modelled as a linear function of the explanatory variables. The details are in Table B.6 of Appendix B. The regression analysis confirmed the result of Table 3.4: that younger respondents spent less time volunteering. It also highlighted two other factors related to the amount of time spent volunteering: drinking alcohol and marital status were associated with the amount of time spent volunteering. Those who drank alcohol spent more time volunteering; while single people spent less time. Due to the small sample sizes (as analysis was confined to those who had done any volunteering in the past four weeks rather than the whole sample), very little could be said about the frequency of volunteering in the individual sectors.

Drivers of volunteering
17
Section 4: Patterns of volunteering Taking Part provides an opportunity to identify and examine the different ways in which people volunteer. In this section, we use a statistical technique called latent class analysis (LCA) to divide volunteers up into different and distinct groups. We then look at the key features of each group: what is different about the individual profiles of these groups and the ways in which they volunteer and participate. Creating typologies in this way can be useful, for example, to target approaches for recruitment or encouraging people to try new activities. LCA works by fitting a statistical model to the data to identify different groups. For each group that is identified, the probability that an individual belongs to that group is calculated. Individuals are then allocated to the group for which this probability is the largest. For this analysis, the groups were defined using the seven questions on which sectors their volunteer work took place in (such as arts, heritage, sports etc.) and the 16 questions on what tasks they undertook as part of their volunteer work (for example, organising or helping to run an activity or event). The list of variables used to define the clusters is given in Tables C.1 and C.2. of Appendix C. In this study, LCA was used to create homogeneous groups who had similar patterns of volunteering. The analysis was run for the 3,536 adults interviewed in the 2008/09 sweep of Taking Part who did any volunteering work over the last 12 months. Note that this analysis includes volunteers involved in any of the sports, arts, heritage and MLA sectors as well as those volunteering outside these sectors (in contrast to Section 3 which concentrates on volunteering within the culture and sport sectors only).
Overview of the groups
Four volunteer groups were identified in the LCA analysis (Figure 4.1). We have broadly classified these as:
1. General volunteers, who made up 67 per cent of volunteers. These people volunteered but not for the main areas of arts, sports, heritage or museums, libraries and archives (so are mainly respondents who were excluded from the analysis in Section 3). Taking Part did not ask which sector these people volunteered in. However, other studies have found that volunteering is common for organisations related to education (e.g. schools or colleges), religion, health or disability, children or young people and local community issues (e.g. Low et al. 2007).
2. Sports volunteers. These made up 14 per cent of volunteers. These were people who reported volunteering in the sports sector but not, in general, in any other sectors.
3. Multi-activity volunteers. People in this group were involved in many different tasks as part
of their volunteering activities, and made up 12 per cent of volunteers. People in this group tended to volunteer across the sports, arts, heritage, and museum sectors.
4. Arts and heritage volunteers were the smallest group, making up seven per cent of
volunteers overall.

Figure 4.1: Prevalence of volunteer groups
Group profiles
In this section we look in turn at each of the groups in more detail. General volunteers This group consisted of people who reported doing some volunteering, but did not, in general, volunteer in the areas of arts, sports, heritage, museums, libraries and archives. Most commonly, they reported volunteering for “any other sector”. Their main types of volunteering related to fundraising, organising and running events and other practical help. A feature of this group is that the majority (60%) mentioned only one task related to their volunteering work. General volunteers were predominantly female and were older on average than the other volunteer groups. Sports volunteers
This group consisted of people who volunteered in the sports sector, but did not volunteer in any of the other areas (i.e. arts, heritage and museums, libraries and archives). They were often involved with coaching or tuition (36%), fundraising (36%) and organising or running activities (33%). The majority (54%) only mentioned one task as part of their volunteering activity. Sports volunteers were predominantly male. They were also younger and more likely to have children in the household than the other groups. Sports volunteers were much more likely to have participated in sport in the previous four weeks than those in the other volunteer groups. Participating in sport is clearly associated with volunteering in the sport sector. However, their participation in arts activities tended to be lower than for the other volunteer groups. Sports volunteers were also more likely to agree that they had some influence over the quality and variety of local sporting facilities. It is possible that the perception of having an influence over local sporting facilities is a driver of volunteering in sport, though the converse, that perceptions of influence are affected by volunteering experience, is also possible.
67%
14%
12%
7%
General
Sports
Multi-activity
Arts and heritage

Drivers of volunteering
19
Multi-activity volunteers
Multi-activity volunteers differed from those in the other groups in that they carried out a multitude of different activities. A very large proportion (95%) undertook five or more tasks as part of their volunteering activities. As a result, activity levels were high for all tasks – in particular organising or running events (83%), committee membership (80%, fundraising (67%), leading a group (65%), advice/counselling (58%) and representation activities (58%). A second characteristic of this group is that while general and sports volunteers tended to volunteer in just one sector, a relatively high proportion of multi-activity volunteers (31%) volunteered in two or more sectors. Multi-activity volunteers were more likely to be in the middle age-range (41% were aged 45-64), to be married or cohabiting, to have high educational qualifications and to have a professional NS-SEC classification. Reflecting their high levels of volunteering activity, multi-activity volunteers also had high (often the highest) levels of participation for different arts and heritage events. This is also the group most likely to agree that they had some influence over the quality of their local environment and local cultural facilities. They were also most likely to have visited libraries, museums and art galleries, and historic sites when growing up. Arts and Heritage volunteers
This was the smallest group found comprising seven per cent of volunteers. Fifty-nine per cent of this group volunteered in the arts, while 35 per cent volunteered in the heritage sector (4.2% volunteered in both the arts and heritage sectors). They were also more likely than any other group to volunteer in the museum/galleries sector and libraries sector. Many (40%) were involved in organising or helping to run an activity or event. Arts and heritage volunteers were more likely to be single and without children, and a high proportion lived in London. However, the size of this group means that this descriptive analysis must be interpreted with caution Arts and heritage volunteers had higher levels of participation in arts and heritage events. They were also more likely to agree that they were able to influence local cultural facilities. As discussed above (in relation to the parallel finding amongst sports volunteers) it is not possible to determine whether feelings of influence over a sector drive levels of volunteering or vice versa. See Tables 4.2 and 4.3 for a full demographic and attitudinal breakdown of each of the groups.

Table 4.1: Key demographics, by group General
Volunteers Sports Multi-activity Arts and
heritage All volunteers
% % % % %
Male 37.1 63.9 49.4 48.5 43.9
Age group
16-24 14.3 26.3 10.2 24.0 16.6
25-44 32.1 37.9 25.1 22.1 31.6
45-64 31.9 28.8 40.6 28.4 32.1
65-74 11.5 5.2 17.7 13.8 11.3
75+ 10.2 1.8 6.4 11.7 8.4
Marital status
Married or de facto
63.7 64.8 73.5 56.3 64.5
Single 22.1 29.5 14.7 33.4 23.4
Widowed 7.4 1.0 5.5 4.3 5.9
Separated or divorced
6.7 4.7 6.3 6.0 6.3
Number of children in the household
None 67.9 58.8 70.0 76.9 67.2
One 12.5 19.9 14.1 12.5 13.9
Two 14.5 16.2 10.7 8.3 13.9
Three or more 5.1 5.0 5.2 2.4 4.9
National Socio-Economic Status
Large employers, managerial and professional occupations
33.8 40.2 51.0 34.4 36.9
Intermediate occupations
17.2 11.9 15.6 18.8 16.2
Small employers and own account workers
8.9 9.6 7.1 8.7 8.8
Lower supervisory and technical occupations
7.5 8.2 9.1 6.9 7.8
Semi routine and routine occupations
20.0 13.9 9.5 15.4 17.4
Never worked or not classified
12.5 16.2 7.7 15.8 12.8

Drivers of volunteering
21
Table 4.3: Participation behaviour and attitudes, by group Variable General
Volunteers Sports Multi-activity Arts and
heritage All
volunteers Not a
volunteer
% % % % % %
Sport
Any sport in last four weeks
57.9 87.2 61.2 56.4 63.2 51.4
Art activities in last 12 months
Exhibition or collection of art, photography or sculpture
28.4 21.7 43.8 34.9 29.5 14.9
Craft exhibition (not crafts market)
18.4 10.8 28.1 20.8 18.4 8.7
Event connected with books or writing
5.6 2.7 15.6 8.4 6.5 2.3
A public art display or installation
16.1 18.4 33.8 24.5 19.2 9.3
Play/drama 31.6 28.5 45.2 44.5 33.6 17.1
Opera/operetta
5.6 5.7 13.4 9.4 6.8 3.0
Classical music concert
12.6 9.5 24.3 21.5 14.1 5.9
Events when growing up
Museums or art galleries
55.9 58.4 70.4 64.9 58.7 50.5
Theatre, dance or classical music performance
48.0 47.9 57.6 58.1 49.8 38.4
Historic sites
56.7 64.1 68.8 67.5 60.2 47.9
Library 73.5 69.2 81.9 71.2 73.6 65.0
Views on influence on locality
Some influence on local sporting facilities
13.0 30.2 24.8 11.7 17.2 9.0
Some influence on
14.0 9.1 26.8 24.8 15.4 8.7

local cultural facilities
Some influence quality of local environment
31.4 27.1 45.9 35.0 32.5 19.8

Drivers of volunteering
23
Section 5: References Atchly, R. (1999) Continuity and adaptation in aging: creating positive experiences (Baltimore: Johns Hopkins University Press) Black Environment Network (BEN) (2002) „Environments for all: baseline review of BTCV‟s work with disadvantaged communities‟ (BTCV: Wallingford) Chakraborti, N. and Garland, J. (2004) „England‟s green and pleasant land? Examining racists prejudice in a rural context‟ Patterns of prejudice 38(4) pp. 383-398 Communities and Local Government (2010) Citizenship Survey: 2009-10 (April 2009 – March 2010), England available at http://www.communities.gov.uk/documents/statistics/pdf/164191.pdf (accessed 22nd March 2011) Davies, K. (2009) „A report on the performance of the English Heritage education volunteering programme‟ available at: http://www.english-heritage.org.uk/publications/volunteer-survey-2009/vol-report.pdf (accessed 22nd March 2011) Davis Smith, J. (2000) „Volunteering and social development‟ Voluntary Action 3(1) pp. 9-23 Ellis Paine, A., and Davis Smith, J. (2006) „Exhibiting Support. Developing volunteering in museums‟ available at: http://www.ivr.org.uk/NR/rdonlyres/05039E60-0CFE-4A91-8ACA-D11FBA1F4201/0/Exhibiting_Support.pdf (accessed 22nd March 2011) Ellis Paine, A., Hill, M. and Rochester, C. (2010) „”A rose by any other name …” Revisiting the question: “what exactly is volunteering?”‟, IVR Working Paper Series, No. 1, available at: http://www.ivr.org.uk/NR/rdonlyres/EDA41448-4B3F-4981-9C84-3CA8DE69D027/0/ArosebyanyothernameFINALJAN11.pdf (accessed 22nd March 2011) Godbout, J. (1995) L’esprit du don (Montreal: Boréal) Hoye, R., Cuskelly, G., Taylor, T. and Darcy, S. (2008) „Volunteer motives and retention in community sport: a study of Australian rugby clubs‟ Australian journal on volunteering 13(2) pp. 40-48 Institute for Volunteering Research (2005) „Volunteering in museums, libraries and archives‟ available at http://www.ivr.org.uk/evidence-bank/evidence-pages/Volunteers+in+Museums.+Key+Findings+and+Issues+from+the+Literature (accessed 22nd March 2011) Locke, F. (2006), Mobiliser les jeunes (âgés de 15 à 34 ans) en milieu rural à Neuve (Community Services Council Newfoundland and Labrador) Lord, B. and Lord, G. (1997) The manual of museum management (The Stationery Office) Low, N., Butt, S., Ellis Paine, A., and Davis Smith, J. (2007) Helping Out - A national survey of volunteering and charitable giving (Office of the Third Sector: London) (http://www.ivr.org.uk/Migrated+Resources%2fDocuments%2fH%2fOTS_Helping_Out.pdf) (accessed 22nd March 2011) Marsh, K., MacKay, S., Morton, D, Parry, W., Bertanou, E., and Sarmah, R. (2010), CASE Report „Understanding the drivers of engagement in culture and sport, technical report‟ available at: http://www.culture.gov.uk/what_we_do_research_and_statistics/5698.aspx.

Measham, T. and Barnett, G. (2007) „Environmental volunteering: motivations, modes and outcomes‟ available at: http://www.csiro.co.uk/files/files/pi52.pdf (accessed 22nd March 2011) Nichols, G. (2006) „Research into sports volunteers: reviewing the questions‟ Voluntary Action: The Journal of the Institute for Volunteering Research 8(1) pp 55-65 National Centre for Social Research (2011 forthcoming) „Formative evaluation of v – the National Young Volunteers‟ Service‟, produced for v in conjunction with the Institute for Volunteering Research, The Third Sector Research Centre and Public Zone O‟Brien, L., Townsend, M. and Ebden, M. (2008) Environmental volunteering: motivations, barriers and benefits (Forestry Commission: Edinburgh) Ockenden, N. (2008) „Environmental volunteering in the North East of England‟ available at: http://www.ivr.org.uk/NR/rdonlyres/12112CB3-759C-4B1B-886C-4E83B61B94A8/0/Env_vol_full_report.pdf (accessed 22nd March 2011) Pattie, C., Seyd, P. and Whiteley, P. (2004), Citizenship in Britain: values, participation and democracy (Cambridge: Cambridge University Press) Reynolds, V. (2000) „The Green Gym‟ Voluntary Action, 2(2) pp. 15-25 Russell, J. (2009) „”Making volunteering easier”: the story of environmental volunteering in South West England‟ available at: http://www.ivr.org.uk/Migrated+Resources%2fDocuments%2fM%2fNatural_England_SW.pdf (accessed 22nd March 2011) Smith, K. (2002) „Modelling the volunteer experience: findings from the heritage sector‟ Voluntary Action 4(2) pp. 9-30 Sport England (2010) Leadership and volunteering: opportunities for young people in sport available at: http://www.sportengland.org/support__advice/children_and_young_people/community_and_club_activities/idoc.ashx?docid=b079507a-b59f-4655-9671-3bf1f3bd0888&version=-1 (accessed 22nd March 2011) Sport Wales (2010) Active Adults Survey, 2008-9 results available at http://www.sportwales.org.uk/research--policy/our-surveys/active-adults-survey.aspx (accessed 22nd March 2011) Stebbins, R. (1996) „Volunteering: a serious leisure perspective‟, Nonprofit and Voluntary Sector Quarterly, 25(2) pp. 211-24 Street, L. (1994), Le bénévolat, source d’expérience de travail. Un moyen de développer et de maintenir les compétences de travail, Direction au soutien aux organismes volontaires (Toronto: Patrimoine canadien) Taylor, P. (2004) „Driving up participation: Sport and Volunteering‟ pp. 103-110 in Sport England, Driving up participation: the challenge for sport; academic review papers commissioned by Sport England as contextual analysis to inform the preparation of the framework for sport in England http://www.sportengland.org/research/understanding_participation.aspx (accessed 22nd March 2011) Taylor, P., Nichols, G., Holmes, K., James, M., Gratton, C., Garrett, R., Kokolakakis, T., Mulder, C. and King, L. (2003) Sports volunteering in England (London: Sport England)

Drivers of volunteering
25
Teasdale, S. (2008) „Volunteering amongst groups deemed of social exclusion‟, IVR Research Bulletin, available at: http://www.ivr.org.uk/Migrated+Resources%2fDocuments%2fS%2fSocial_Exclusion08.pdf (accessed 22nd March 2011) Volunteer Development Scotland (2006) Volunteering and the natural heritage – an audit and review of natural heritage volunteering in Scotland Commissioned Report F05NC07 (unpublished) (Volunteer Development Scotland: Stirling) Wang, P. (2004) „Assessing motivations for sports volunteerism‟, Advances in Consumer Research, 31 pp. 420-25

Appendix A: Explanatory variables used in the modelling A range of variables were considered for inclusion in the regression models of Section 3. We focussed on five main types of information about people: demographic characteristics, information related to their health and lifestyle, indicators of social stratification, area-level characteristics and finally satisfaction with their local area. Some other variables, initially considered as possible explanatory variables, were omitted because they included too many missing values, because they were highly correlated with other variables, or because they would not have been useful in any statistical model due to small category sizes. The variables used, and the proportion volunteering in Sports, Arts, Heritage and MLA (years 2007/8 and 2008/9 combined) are listed in tables A.1 to A.5. Table A.1: Demographic variables used in the modelling Variable Categories Percentage volunteering
Age within sex Male 16-29 10.9
Male 30-59 8.9
Male 60+ 7.6
Female 16-29 7.7
Female 30-59 6.0
Female 60+ 4.2
Ethnicity White 7.5
Not white 5.5
Marital Status Married or de-facto married 7.4
Single 9.1
Widowed 3.1
Separated 5.9
Structure of household No live-in children 7.4
Lone parent with live-in children 4.4
Live-in children and live-in partner 8.0
Religion No religion 8.2
Not practicing 6.7
Practicing 7.9
One-adult household One-adult household 4.9
Multi-adult household 8.0
Tenure Owners 8.4
Social-rented sector 3.5
Private-rented sector 6.8

Drivers of volunteering
27
Table A.2: Health and lifestyle variables used in the modelling Variable Categories Percentage volunteering
General Health Very Good 9.5
Good 7.6
Fair 5.0
Bad or Very Bad 2.4
Limiting long-term illness Long-term illness, not limiting 9.7
Limiting long-term illness, 4.8
No long-term illness 7.9
Smoke Smokes 5.0
Does not smoke 8.1
Drink Drink alcohol 8.2
Does not drink 4.3
Table A.3: Variables related to social stratification used in the modelling Variable Categories Percentage volunteering
Employment status Full-time employed 8.3
Part-time employed 9.1
Unemployed 5.8
NS-SEC PSA category Students and NS-SEC unclassified 13.2
NS-SEC 1-4 9.0
NS-SEC 5-8 4.1
Retirement indicator Retired
Not retired
Highest qualification Higher Education & professional/vocational equivalents
11.0
Other Higher Education below degree level
9.9
A levels, vocational level 3 & equivalents
9.3
Trade Apprenticeships 5.7
5 or more GCSE/O Level grades A* to C and Level 2 equivalents
7.6
Between 1 and 5 GCSE/O Level grade A* to C and Level 1 equivalents
5.3
Other qualifications: level unknown 3.5
No qualifications 2.8
Access to the internet Yes 8.9
No 3.4
Access to a car Yes 8.4
No 3.1

Table A.4: Area-level variables used in the modelling Variable Categories Percentage volunteering
Government Office Region North East 6.6
North West 6.8
Yorkshire and Humberside 6.3
East Midlands 7.6
West Midlands 6.4
East of England 7.6
London 6.7
South East 9.3
South West 8.6
Urban-rural indicator Urban 6.8
Rural 9.8
ACORN category Wealthy Achievers 10.7
Urban Prosperity 7.9
Comfortably Off 7.2
Moderate Means 5.4
Hard-pressed 4.6
Table A.5: Satisfaction with the area Variable Categories Percentage volunteering
Satisfaction with area Not asked 7.4
Very satisfied 8.1
Fairly satisfied 6.9
Neither satisfied nor dissatisfied 7.8
Slightly dissatisfied 5.4
Very dissatisfied 4.6

Drivers of volunteering
29
Appendix B: Results of the regression analysis
1
The logistic regression modelling was undertaken in two stages. First, a stepwise logistic regression model was used to identify the variables that predicted involvement in volunteering. A forward stepwise procedure starts with no variables entered into the regression model, then adds to the model the independent variable with the lowest p-value. The p-values of all the other independent variables are revised according to this new model, and then the procedure is repeated until all variables with p-values less than 0.05 are entered into the model. The stepwise model identified the variables that were significantly related to the outcome variable, narrowing down the range of variables that were entered in the model at the second stage. At the second stage, these variables were entered into a logistic regression model using the complex survey commands in SPSS. This approach allows elements of the sample design (such as the weighting and clustering) to be taken into consideration when generating standard errors. The model was further refined by dropping any variables that were no longer statistically significant (at the 95% level), while keeping in variable “age within sex”. The odds ratios of the statistically significant factors are summarised in tables B.1 to B.5 below. A multiple regression model was fitted to model the amount of time people spent volunteering. The variables “age within sex” and “general health” were both forced into the model, as they were both strongly associated with the propensity to volunteer, and a stepwise procedure was used to identify any other significant terms. The final model is shown in Table B.6. The dependent variable is the logarithm of the amount of time spent volunteering in the last four weeks.
1 The results of the regression analyses are presented in tables showing odds ratios for the final models. The
models show the odds of being in the particular category of the outcome variable (e.g. being a volunteer in the sports sector) for each category of the independent variable (e.g. age and sex categories). Odds are expressed relative to a reference category, which has a given value of 1. Odds ratios greater than 1 indicate higher odds, and odds ratios less than 1 indicate lower odds. Also shown are the p-values for the odds ratios. Where the p-value is less than 0.05, this category is significantly different from the reference category at the 95% level.
To understand an odds ratio we first need to describe the meaning of odds. The definition of odds is similar but significantly different to that of probability. This is best explained in the form of an example. If 200 individuals out of a population of 1000 were in good health, the probability (p) of being in good health is 200/1000, thus p=0.2. The probability of not being in good health is therefore 1-p = 0.8. The odds of being in good health are calculated as the quotient of these two mutually exclusive events. So, the odds in favour of being in good health to not being in good health, is therefore 0.2/0.8=0.25. Suppose that 150 out of 300 people living in social rented housing are in good health compared to 50 out of 150 who live in owner occupied housing. The odds of a person living in social rented housing of being in good health are 0.5/0.5=1.0. The odds of a person living in owner occupied housing of being in good health is 0.3333/0.6666=0.5. The odds ratio of being in good health is the ratio of these odds, 1.0/0.5=2.0. Thus the odds of being in good health are twice as high among people who live in social rented housing (compared to people who live in owner occupied housing – the „reference category‟).

Table B.1: Odds ratios: Any volunteering Variable Categories Coefficien
t Standard error
p-value Odds ratio Marginal effect
Age within sex
Male 16-29 0.65 0.19 0.001 1.91 0.045
Male 30-59 0.39 0.15 0.008 1.48 0.024
Male 60+ 0.30 0.15 0.048 1.35 0.018
Female 16-29 0.37 0.19 0.049 1.45 0.023
Female 30-59 -0.14 0.15 0.352 0.87 -0.008
Female 60+ 0.00 . . 1.00 .
Religion No religion -0.26 0.10 0.015 0.77 -0.013
Not practicing -0.25 0.10 0.008 0.78 -0.014
Practicing 0.00 . . 1.00 .
Ethnicity White 0.37 0.17 0.031 1.44 0.018
General Health
Very Good 0.74 0.26 0.005 2.10 0.046
Good 0.65 0.25 0.010 1.92 0.038
Fair 0.44 0.25 0.078 1.55 0.027
Bad or Very Bad 0.00 . . 1.00 .
Limiting long-term illness
Long-term illness, not limiting 0.27 0.16 0.101 1.31 0.014
Limiting long-term illness 0.00 . . 1.00 .
No long-term illness -0.42 0.14 0.003 0.66 -0.025
Smoke Smokes -0.36 0.11 0.002 1.44 -0.018
Drink Drink alcohol 0.45 0.13 0.001 1.56 0.022
NS-SEC PSA category
Students and NS-SEC unclassified
0.75 0.17 0.000 2.11 0.055
NS-SEC 1-4 0.40 0.10 0.000 1.49 0.022
NS-SEC 5-8 0.00 . . 1.00 .
Access to the internet
Yes 0.31 0.12 0.011 1.36 0.016
Access to a car
Yes 0.77 0.15 0.000 2.15 0.035
Highest qualification
Higher Education & professional/vocational equivalents
0.58 0.16 0.000 1.79 0.037
Other Higher Education below degree level
0.58 0.17 0.001 1.79 0.040
A levels, vocational level 3 & equivalents
0.64 0.16 0.000 1.89 0.043
Trade Apprenticeships 0.00 0.23 0.995 1.00 0.000
5 or more GCSE/O Level grades A* to C and Level 2 equivalents
0.58 0.16 0.000 1.79 0.039
Between 1 and 5 GCSE/O Level grade A* to C and Level 1 equivalents
0.21 0.23 0.369 1.23 0.012
Other qualifications: level unknown
-0.17 0.30 0.573 0.84 -0.009
No qualifications 0.00 . . 1.00 .
ACORN category
“Wealthy Achievers” 0.21 0.14 0.129 1.24 0.012
“Urban Prosperity” 0.15 0.17 0.354 1.17 0.009
“Comfortably Off” -0.02 0.13 0.896 0.98 -0.001
“Moderate Means” -0.19 0.17 0.277 0.83 -0.010
“Hard-pressed” 0.00 . . 1.00 .
Pseudo R-squared (Cox and Snell)=0.040
Drivers of volunteering
31
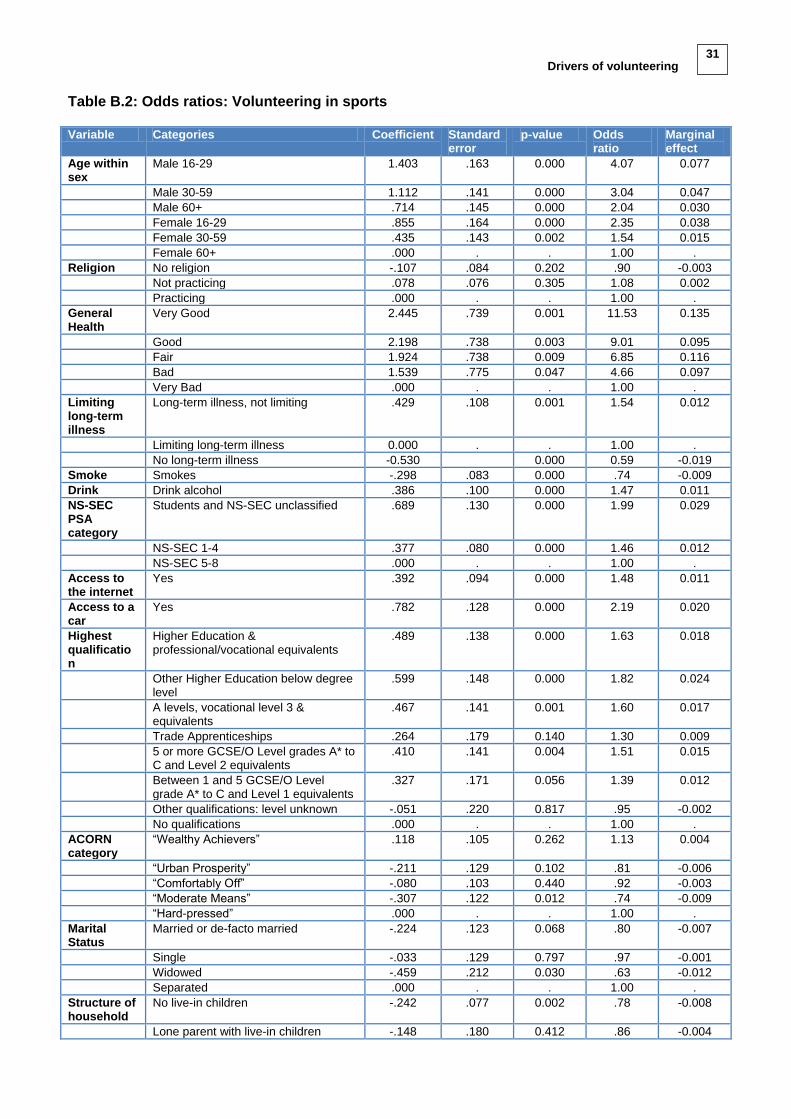
Table B.2: Odds ratios: Volunteering in sports Variable Categories Coefficient Standard
error p-value Odds
ratio Marginal effect
Age within sex
Male 16-29 1.403 .163 0.000 4.07 0.077
Male 30-59 1.112 .141 0.000 3.04 0.047
Male 60+ .714 .145 0.000 2.04 0.030
Female 16-29 .855 .164 0.000 2.35 0.038
Female 30-59 .435 .143 0.002 1.54 0.015
Female 60+ .000 . . 1.00 .
Religion No religion -.107 .084 0.202 .90 -0.003
Not practicing .078 .076 0.305 1.08 0.002
Practicing .000 . . 1.00 .
General Health
Very Good 2.445 .739 0.001 11.53 0.135
Good 2.198 .738 0.003 9.01 0.095
Fair 1.924 .738 0.009 6.85 0.116
Bad 1.539 .775 0.047 4.66 0.097
Very Bad .000 . . 1.00 .
Limiting long-term illness
Long-term illness, not limiting .429 .108 0.001 1.54 0.012
Limiting long-term illness 0.000 . . 1.00 .
No long-term illness -0.530 0.000 0.59 -0.019
Smoke Smokes -.298 .083 0.000 .74 -0.009
Drink Drink alcohol .386 .100 0.000 1.47 0.011
NS-SEC PSA category
Students and NS-SEC unclassified .689 .130 0.000 1.99 0.029
NS-SEC 1-4 .377 .080 0.000 1.46 0.012
NS-SEC 5-8 .000 . . 1.00 .
Access to the internet
Yes .392 .094 0.000 1.48 0.011
Access to a car
Yes .782 .128 0.000 2.19 0.020
Highest qualification
Higher Education & professional/vocational equivalents
.489 .138 0.000 1.63 0.018
Other Higher Education below degree level
.599 .148 0.000 1.82 0.024
A levels, vocational level 3 & equivalents
.467 .141 0.001 1.60 0.017
Trade Apprenticeships .264 .179 0.140 1.30 0.009
5 or more GCSE/O Level grades A* to C and Level 2 equivalents
.410 .141 0.004 1.51 0.015
Between 1 and 5 GCSE/O Level grade A* to C and Level 1 equivalents
.327 .171 0.056 1.39 0.012
Other qualifications: level unknown -.051 .220 0.817 .95 -0.002
No qualifications .000 . . 1.00 .
ACORN category
“Wealthy Achievers” .118 .105 0.262 1.13 0.004
“Urban Prosperity” -.211 .129 0.102 .81 -0.006
“Comfortably Off” -.080 .103 0.440 .92 -0.003
“Moderate Means” -.307 .122 0.012 .74 -0.009
“Hard-pressed” .000 . . 1.00 .
Marital Status
Married or de-facto married -.224 .123 0.068 .80 -0.007
Single -.033 .129 0.797 .97 -0.001
Widowed -.459 .212 0.030 .63 -0.012
Separated .000 . . 1.00 .
Structure of household
No live-in children -.242 .077 0.002 .78 -0.008
Lone parent with live-in children -.148 .180 0.412 .86 -0.004

Live-in children and live-in partner .000 . . 1.00 .
Tenure Owners .333 .105 0.002 1.40 0.010
Social-rented sector .196 .150 0.191 1.22 0.007
Private-rented sector .000 . . 1.00 .
Pseudo R-squared (Cox and Snell)=0.033

Drivers of volunteering
33
Table B.3: Odds ratios: Volunteering in Arts Variable Categories Coefficient Standard
error p-value Odds ratio Marginal
effect
Age within sex
Male 16-29 -0.50 0.27 0.063 0.61 -0.004
Male 30-59 -0.62 0.21 0.003 0.54 -0.006
Male 60+ -0.20 0.17 0.244 0.82 -0.002
Female 16-29 -0.49 0.24 0.037 0.61 -0.004
Female 30-59 -0.39 0.17 0.019 0.68 -0.004
Female 60+ 0.00 . . 1.00 .
Religion No religion -0.25 0.12 0.036 0.78 -0.003
Not practicing -0.73 0.12 0.000 0.48 -0.008
Practicing 0.00 . . 1.00 .
General Health
Very Good 1.04 0.82 0.206 2.82 0.014
Good 1.09 0.81 0.179 2.97 0.013
Fair 0.79 0.82 0.334 2.20 0.011
Bad 0.38 0.85 0.656 1.46 0.005
Very Bad 0.00 . . 1.00 .
Limiting long-term illness
Long-term illness 0.48 0.13 0.000 1.62 0.006
Drink Drink alcohol 0.49 0.16 0.002 1.63 0.005
NS-SEC PSA category
Students and NS-SEC unclassified
0.65 0.22 0.003 1.91 0.009
NS-SEC 1-4 0.28 0.15 .0.053 1.33 0.003
NS-SEC 5-8 0.00 . . 1.00 .
Access to the internet
Yes 0.37 0.16 0.020 1.44 0.004
Highest qualification
Higher Education & professional/vocational equivalents
1.21 0.22 0.000 3.36 0.019
Other Higher Education below degree level
0.79 0.24 0.001 2.20 0.012
A levels, vocational level 3 & equivalents
0.90 0.22 0.000 2.45 0.013
Trade Apprenticeships 0.24 0.36 0.507 1.27 0.003
5 or more GCSE/O Level grades A* to C and Level 2 equivalents
0.75 0.23 0.001 2.12 0.010
Between 1 and 5 GCSE/O Level grade A* to C and Level 1 equivalents
-0.10 0.33 0.766 0.91 -0.001
Other qualifications: level unknown
0.01 0.40 0.985 1.01 0.000
No qualifications 0.00 . . 1.00 .
ACORN category
“Wealthy Achievers” 0.84 0.18 0.000 2.32 0.011
“Urban Prosperity” 0.91 0.20 0.000 2.48 0.014
“Comfortably Off” 0.50 0.18 0.005 1.64 0.006
“Moderate Means” 0.45 0.21 0.037 1.56 0.006
“Hard-pressed” 0.00 . . 1.00 .
Marital Status
Married or de-facto married -0.27 0.19 0.144 0.76 -0.003
Single 0.21 0.21 0.320 1.23 0.002
Widowed -0.48 0.24 0.045 0.62 -0.004
Separated 0.00 . . 1.00 .
Employment status
Full-time employed -0.34 0.15 0.029 0.71 -0.004
Part-time employed 0.25 0.14 0.075 1.29 0.003
Not working 0.00 . . 1.00 .
Pseudo R-squared (Cox and Snell)=0.013

Table B.4: Odds ratios: Volunteering in heritage Variable Categories Coefficient Standard
error p-value Odds ratio Marginal
effect
Age within sex
Male 16-29 -0.97 0.37 0.008 0.38 -0.005
Male 30-59 0.02 0.22 0.917 1.02 0.000
Male 60+ 0.80 0.18 0.000 2.22 0.007
Female 16-29 -1.05 0.30 0.001 0.35 -0.005
Female 30-59 -0.63 0.21 0.002 0.53 -0.004
Female 60+ 0.00 . . 1.00 .
Religion No religion -0.32 0.15 0.035 0.73 -0.002
Not practicing -0.64 0.14 0.000 0.53 -0.004
Practicing 0.00 . . 1.00 .
Drink Drink alcohol 0.70 0.19 0.000 2.01 0.004
Access to a car
Yes 0.73 0.23 0.002 2.07 0.004
Highest qualification
Higher Education & professional/vocational equivalents
1.36 0.21 0.000 3.91 0.014
Other Higher Education below degree level
1.08 0.22 0.000 2.93 0.011
A levels, vocational level 3 & equivalents
0.69 0.24 0.003 2.00 0.006
Trade Apprenticeships -0.13 0.40 0.740 0.88 -0.001
5 or more GCSE/O Level grades A* to C and Level 2 equivalents
0.39 0.26 0.138 1.47 0.003
Between 1 and 5 GCSE/O Level grade A* to C and Level 1 equivalents
0.45 0.36 0.209 1.57 0.004
Other qualifications: level unknown
0.36 0.41 0.391 1.43 0.003
No qualifications 0.00 . . 1.00 .
ACORN category
“Wealthy Achievers” 0.58 0.23 0.010 1.79 0.004
“Urban Prosperity” 0.32 0.27 0.228 1.38 0.002
“Comfortably Off” 0.16 0.23 0.473 1.18 0.001
“Moderate Means” 0.28 0.28 0.303 1.33 0.002
“Hard-pressed” 0.00 . . 1.00 .
Marital Status
Married or de-facto married -0.39 0.20 0.048 0.68 -0.003
Single 0.16 0.22 0.479 1.17 0.001
Widowed -0.05 0.25 0.837 0.95 0.000
Separated 0.00 . . 1.00 .
Employment status
Full-time employed -0.40 0.16 0.015 0.67 -0.003
Part-time employed 0.18 0.18 0.318 1.20 0.001
Not working 0.00 . . 1.00 .
Pseudo R-squared (Cox and Snell)=0.010

Drivers of volunteering
35
Table B.5: Odds ratios: Volunteering in Museums, Libraries and archives Variable Categories Coefficient Standard
error p-value Odds ratio Marginal
effect
Age within sex
Male 16-29 -1.07 0.42 0.012 0.34 -0.002
Male 30-59 -0.91 0.33 0.006 0.40 -0.002
Male 60+ 0.13 0.25 0.604 1.14 0.000
Female 16-29 -1.49 0.39 0.000 0.22 -0.003
Female 30-59 -1.32 0.29 0.000 0.27 -0.003
Female 60+ 0.00 . . 1.00 .
Religion No religion -0.11 0.23 0.627 0.89 0.000
Not practicing -0.79 0.21 0.000 0.45 -0.002
Practicing 0.00 . . 1.00 .
Access to the internet
Yes 0.73 0.25 0.004 2.07 -0.002
Highest qualification
Higher Education & professional/vocational equivalents
1.71 0.34 0.000 5.52 0.009
Other Higher Education below degree level
1.10 0.37 0.003 3.01 0.005
A levels, vocational level 3 & equivalents
1.42 0.35 0.000 4.12 0.007
Trade Apprenticeships -0.21 0.64 0.746 0.81 -0.001
5 or more GCSE/O Level grades A* to C and Level 2 equivalents
0.90 0.37 0.016 2.46 0.004
Between 1 and 5 GCSE/O Level grade A* to C and Level 1 equivalents
0.61 0.47 0.201 1.83 0.002
Other qualifications: level unknown
-1.18 0.77 0.127 0.31 -0.002
No qualifications 0.00 . . 1.00 .
Employment status
Full-time employed -1.03 0.26 0.000 0.36 -0.003
Part-time employed -0.36 0.25 0.155 0.70 -0.001
Not working 0.00 . . 1.00 .
Pseudo R-squared (Cox and Snell)=0.006
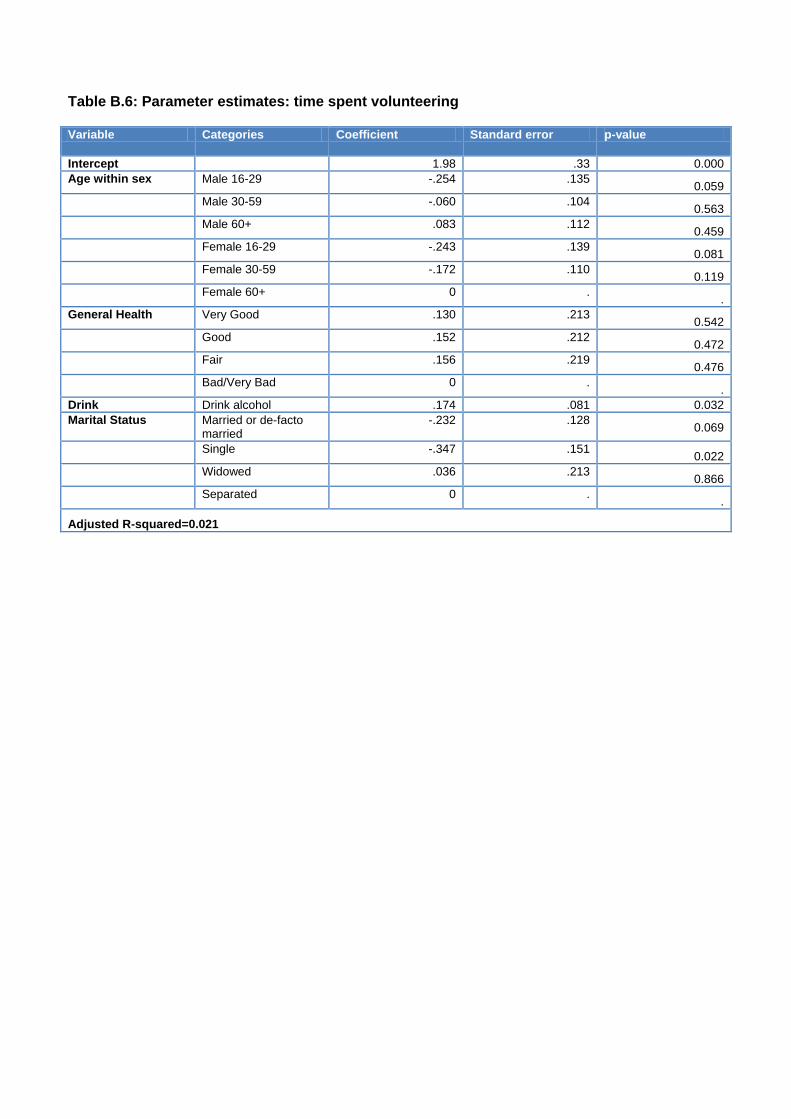
Table B.6: Parameter estimates: time spent volunteering Variable Categories Coefficient Standard error p-value
Intercept 1.98 .33 0.000
Age within sex Male 16-29 -.254 .135 0.059
Male 30-59 -.060 .104 0.563
Male 60+ .083 .112 0.459
Female 16-29 -.243 .139 0.081
Female 30-59 -.172 .110 0.119
Female 60+ 0 . .
General Health Very Good .130 .213 0.542
Good .152 .212 0.472
Fair .156 .219 0.476
Bad/Very Bad 0 . .
Drink Drink alcohol .174 .081 0.032
Marital Status Married or de-facto married
-.232 .128 0.069
Single -.347 .151 0.022
Widowed .036 .213 0.866
Separated 0 . .
Adjusted R-squared=0.021

Drivers of volunteering
37
Appendix C: Results of latent class analysis Taking Part provides an opportunity to examine how volunteering varies among different groups in terms of the sectors participated in and the tasks undertaken, and to describe the key features of these groups. To do this, a statistical technique, Latent Class Analysis (LCA), was used to divide those who did any volunteering work in the last 12 months (3,536 adults) into homogeneous groups. LCA fits a statistical model to the data in an attempt to determine these clusters. The probability of belonging to each cluster can be obtained for each respondent, with individuals allocated to the cluster for which this probability is the largest (modal allocation). In this way, people are assigned to a group in which they are most similar to other members, in respect to their volunteer work – what sectors they worked in and what tasks they undertook as part of this work. Therefore, LCA has been used in this report to create homogeneous groups of participants who have similar patterns of volunteering. The variables used to create the groups were the 7 questions on which sectors their volunteer work belonged to (such as Arts, Heritage, Sports etc) and 16 questions on what tasks they undertook as part of their volunteer work (for example, organising or helping to run an activity or event). The list of variables included in the model are given in Tables 4.1 and 4.2. The LCA analysis found four distinct clusters of individuals in the data. Solutions with three or five clusters were also considered, but the four-cluster solution was regarded as preferable as:
the four-cluster solution produced a new group, not present in the three-cluster solution, which was distinct from the other clusters;
the five-cluster solution produced a new cluster which was not thought to provide additional information from a policy perspective (ie was quite similar to another cluster); and
all four clusters were interpretable. Tables C.1 and C.2 below summarise the classifications of the four clusters Table C.1: Volunteering sector by group Sector General
Volunteers Sports Multi-activity Arts and
heritage All
volunteers
% % % % %
Arts 0.5 1.2 13.5 58.6 6.3
Museum/gallery 0.2 0.0 2.7 10.4 1.2
Heritage 0.3 0.3 16.2 35.3 4.7
Libraries 0.1 0.2 1.5 5.3 0.6
Archives 0.0 0.0 3.6 1.5 0.5
Sport 0.8 100.0 28.6 5.1 21.4
Any other sector 100.0 10.0 74.8 1.2 74.3
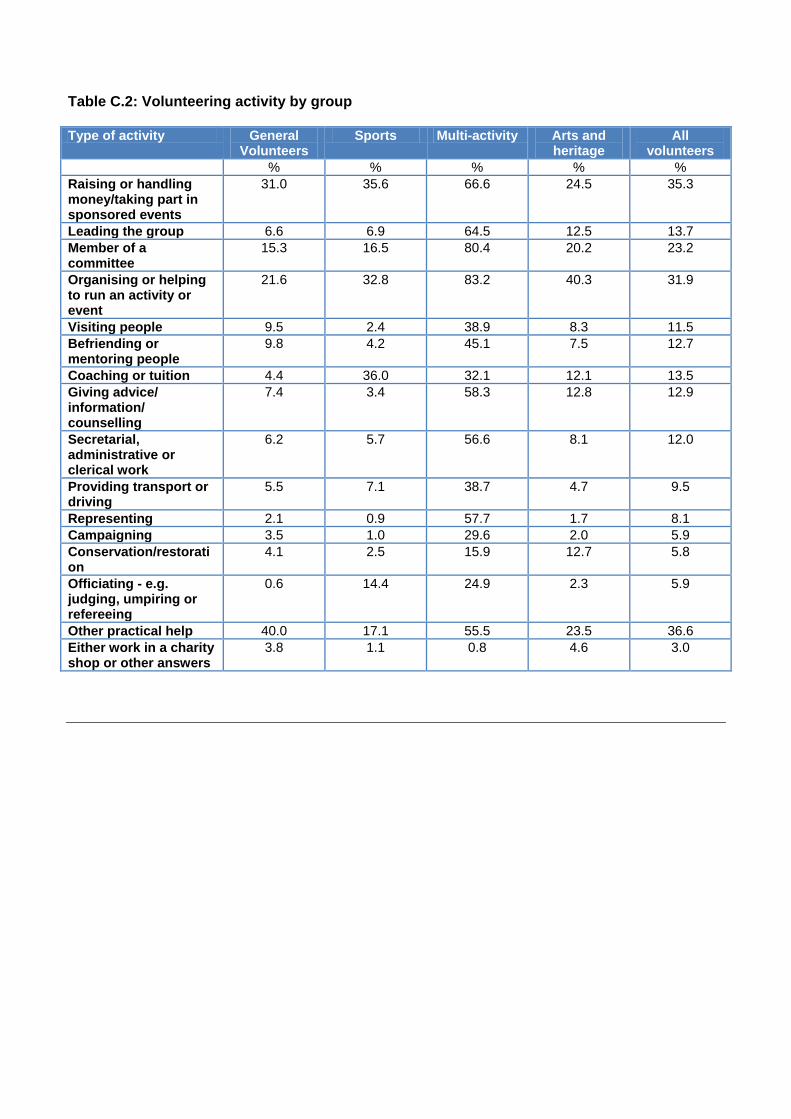
Table C.2: Volunteering activity by group Type of activity General
Volunteers Sports Multi-activity Arts and
heritage All
volunteers
% % % % %
Raising or handling money/taking part in sponsored events
31.0 35.6 66.6 24.5 35.3
Leading the group 6.6 6.9 64.5 12.5 13.7
Member of a committee
15.3 16.5 80.4 20.2 23.2
Organising or helping to run an activity or event
21.6 32.8 83.2 40.3 31.9
Visiting people 9.5 2.4 38.9 8.3 11.5
Befriending or mentoring people
9.8 4.2 45.1 7.5 12.7
Coaching or tuition 4.4 36.0 32.1 12.1 13.5
Giving advice/ information/ counselling
7.4 3.4 58.3 12.8 12.9
Secretarial, administrative or clerical work
6.2 5.7 56.6 8.1 12.0
Providing transport or driving
5.5 7.1 38.7 4.7 9.5
Representing 2.1 0.9 57.7 1.7 8.1
Campaigning 3.5 1.0 29.6 2.0 5.9
Conservation/restoration
4.1 2.5 15.9 12.7 5.8
Officiating - e.g. judging, umpiring or refereeing
0.6 14.4 24.9 2.3 5.9
Other practical help 40.0 17.1 55.5 23.5 36.6
Either work in a charity shop or other answers
3.8 1.1 0.8 4.6 3.0