New Yangon General Hospital University of Medicine(1) Yangon
Understanding Regional Building Characteristics in YangonBased on Digital Building Model
Note:
Understanding Regional Building Characteristics in YangonBased on Digital Building Model
Osamu Murao∗1,†, Takuma Usuda∗2, Hideomi Gokon∗3, Kimiro Meguro∗3,Wataru Takeuchi∗3, Kazuya Sugiyasu∗1, and Khin Than Yu∗4
∗1International Research Institute of Disaster Science, Tohoku University468-1 Aoba, Aramaki, Aoba-ku, Sendai 980-0845, Japan
†Corresponding author, E-mail: [email protected]∗2Former Graduate School Student, Graduate School of Engineering, Tohoku University
∗3Institute of Industrial Science, The University of Tokyo, Japan∗4Yangon Technological University, Myanmar
[Received September 11, 2017; accepted February 1, 2018]
It is indispensable for a government to assess urbanvulnerability to natural disasters such as earthquakesor flood in order to take appropriate disaster mea-sures. However, it is sometimes difficult to obtain nec-essary dataset for cities or regions, especially for devel-oping countries. The authors have been involved in aSATREPS project named “Development of a Compre-hensive Disaster Resilience System and CollaborationPlatform in Myanmar,” which aims to make urbanvulnerability maps for Yangon City based on severaldatasets including building inventory of each ward.However, Yangon City has not catalogued enough datafor the assessment so far. In this context, in order tounderstand and to arrange regional building charac-teristics of the city, this paper explores the possibilityof using digital building model (DBM) data obtainedfrom remote sensing imageries for the urban vulnera-bility assessment.Firstly, a field survey was conducted in SanchaungTownship, and building characteristics such as struc-tural types and the number of stories were analyzed.Therefore, DBM data was prepared for the followingcomparative analysis. Thirdly, additional field surveyswere conducted in Latha and Pabedan Townships, lo-cated in the central business districts in the city. Fi-nally, DBM data and the actual building data obtainedby the surveys were compared to examine the applica-bility of DBM for building collapse risk assessment. Asa result, it was found that DBM data of 3 m- 7 m rep-resent low-rise buildings, and DBM data of more than18 m reflect high-rise buildings.
Keywords: urban vulnerability, Myanmar, building col-lapse risk, remote sensing, DBM
1. Introduction
1.1. Background and Purpose
It is indispensable for a government to assess urbanvulnerability to natural disasters such as earthquakes or
floods in order to take appropriate disaster measures.However, it is sometimes difficult to obtain necessarydataset for cities or regions, especially for developingcountries. Myanmar is such a country, facing recent rapidurbanization; it is therefore necessary to appropriatelymanage future disaster risks for the cities in the country.
Possible disasters in Myanmar are earthquakes, cy-clone, and floods. Especially “earthquake” is an alarm-ing disaster because Naypyidaw, the capital, and Yangonare located in the Sagaing Fault. Earthquakes of morethan M7 has been recorded more than 16 times in the his-tory of Myanmar, including six earthquakes that occurredalong the fault. Proper disaster management is critical forMyanmar to reduce future damage caused by earthquakes.
The authors have been involved in a SATREPS projectnamed “Development of a Comprehensive Disaster Re-silience System and Collaboration Platform in Myanmar,”aiming to make urban vulnerability maps for Yangon Citybased on several datasets including building inventory ofeach ward (Murao et al., 2015 [1]).
The urban seismic vulnerability evaluation of YangonCity, namely building collapse risk assessment, in thisSATREPS project follows the community earthquake riskassessment conducted by the Tokyo Metropolitan Gov-ernment (TMG) (2013) [2] that has, in its forty-year his-tory, defined building collapse risk follows:
Building collapse risk is a measure of the danger ofbuildings collapsing or tilting due to shaking from anearthquake. This risk is measured according to thetype of buildings in the community and ground soilclassification.
In order to apply this earthquake risk assessment toYangon, information on soil conditions, building inven-tory, and building vulnerability functions are necessary(Murao et al., 2016 [3]). However, Yangon City has notcatalogued enough data for such an assessment thus far.Japan International Cooperation Agency (JICA) preparedGIS dataset, explained in section 3.2, with the numberof buildings. This means that we can obtain buildingdata necessary for the building collapse risk evaluation:
Journal of Disaster Research Vol.13 No.1, 2018 125
Murao, O. et al.
namely, the number of buildings in terms of structuraltypes (RC and wooden building at least) and the ratio ofbuilding structural types in each township or ward.
In this context, this research aims to propose a methodto obtain building inventory available to be used for build-ing collapse risk evaluation, for regions or countries thatdo not maintain those dataset as Yangon City. This re-search explores the possibility of using digital buildingmodel (hereafter DBM) data, obtained from remote sens-ing imageries, to understand and arrange regional buildingcharacteristics based on the building type ratio of the city.
1.2. Existing Related ResearchRecently, the improvement and rapid spread of remote
sensing technologies have influenced research on urbandisaster reduction with respect to garnering detailed infor-mation regarding the physical environment such as build-ings or urban fabric. These technologies cover a widerange from damage estimation just after a disastrous eventto post-disaster recovery, or urban vulnerability assess-ment.
Some research groups have considered the use of satel-lite images for emergency response. For example, Koaraiet al. (2008) [4] analyzed large-scale geological hazardsin the case of the Northern Pakistan Earthquake, the Mid-dle Java Earthquake, and the Leyte Landslide by using op-tical high-resolution satellite imagery such as QuickBird,IKONOS, ALOS and SPOT5, and found that 1 m reso-lution stereo images are necessary for recognizing build-ing damages in urban areas. Matsuzaki et al. (2010) [5]conducted visual damage interpretation of buildings dam-aged due to the 2007 Peru Earthquake and compared thefield survey data with QuickBird satellite images and re-ported that the accuracy of the damage grade depends onfactors such as the influence of building shadows, differ-ences in the time of data acquisitions, and local build-ing/environmental conditions. Gokon et al. (2017) [6] de-veloped a method to estimate building damage in tsunami-affected areas using L-band SAR (ALOS/PALSAR) data,focusing on Sendai City and Watari Town affected by the2011 Great East Japan Earthquake and Tsunami.
Satellite imagery have been used for the research fieldof post-disaster recovery to understand urban recoveryprocesses from great disasters. Nakaoka and Nakao(1998) [7] attempted to grasp recovery conditions fromthe 1995 Great Kobe earthquake using hue informationof satellite images. Murao et al. (2004) [8] reported thepost-earthquake urban recovery of Chi-Chi Township af-fected by the 1999 Taiwan Earthquake using a base mapmade from IKONOS image. Following the urban recov-ery research in Chi-Chi, Murao et al. (2013) [9] and Hoshiet al. (2014) [10] conducted field surveys in Pisco, dam-aged due to the 2007 Peru Earthquake, and examined howQuickBird and WorldView-2 were useful in understand-ing the five-year recovery process of Pisco.
Remote Sensing Technology has also been appliedto obtain building information for research on urbanvulnerability. For example, Miura and Midorikawa(2006) [11] created building inventory data in Metro
Manila in the Philippines using building shadows appear-ing in IKONOS satellite images. Shaker et al. (2011) [12]assessed building heights in Cairo, Egypt, from IKONOSsatellite stereo-pair images. Matsuoka et al. (2013) [13]extracted the spatial distribution of building age fromtime-series Landsat satellite images and building heightsfrom ALOS/PRISM stereovision images for earthquakedamage estimation for Lima, Peru, comparing aerial pho-tographs and field survey.
As seen above, various remote sensing technologieshave been used to obtain building inventory in severalcities. However, none of them have been applied to thecharacteristics in Yangon except for some cases. For ex-ample, Sritarapipat and Takeuchi (2015) [14] proposed amethodology to estimate land value and disaster risk areasin Yangon using satellite images of GeoEye-1 and Land-sat 1-7 from 1970 to 2010. This paper attempts to extractregional building characteristics of Yangon City for earth-quake damage assessment based on DBM.
2. Method
With a focus on Yangon, this research aims to ex-tract regional building characteristics in terms of buildingheight using DBM data.
To this end, the following procedure is conducted.First, a field survey is carried out in Sanchaung Town-
ship, a typical residential and commercial district in Yan-gon, to collect building inventory in order to analyzebuilding characteristics. A dataset provided by JICA isused to support the survey.
Second, the possibility of using DBM data to un-derstand regional characteristics is considered. TheDBM data was arranged by Sritarapipat and Takeuchi(2017) [15].
Following the DBM consideration, other field surveysare conducted in Latha, and Pabedan Townships in thecentral business district (hereafter CBD) to collect morebuilding information for the next stage.
Finally, the data on the number of stories of buildingsobtained by the surveys is compared with DBM data toexamine how we can use DBM to extract regional build-ing characteristics.
3. Field Survey and Building Characteristics inSanchaung
3.1. Outline of the Survey
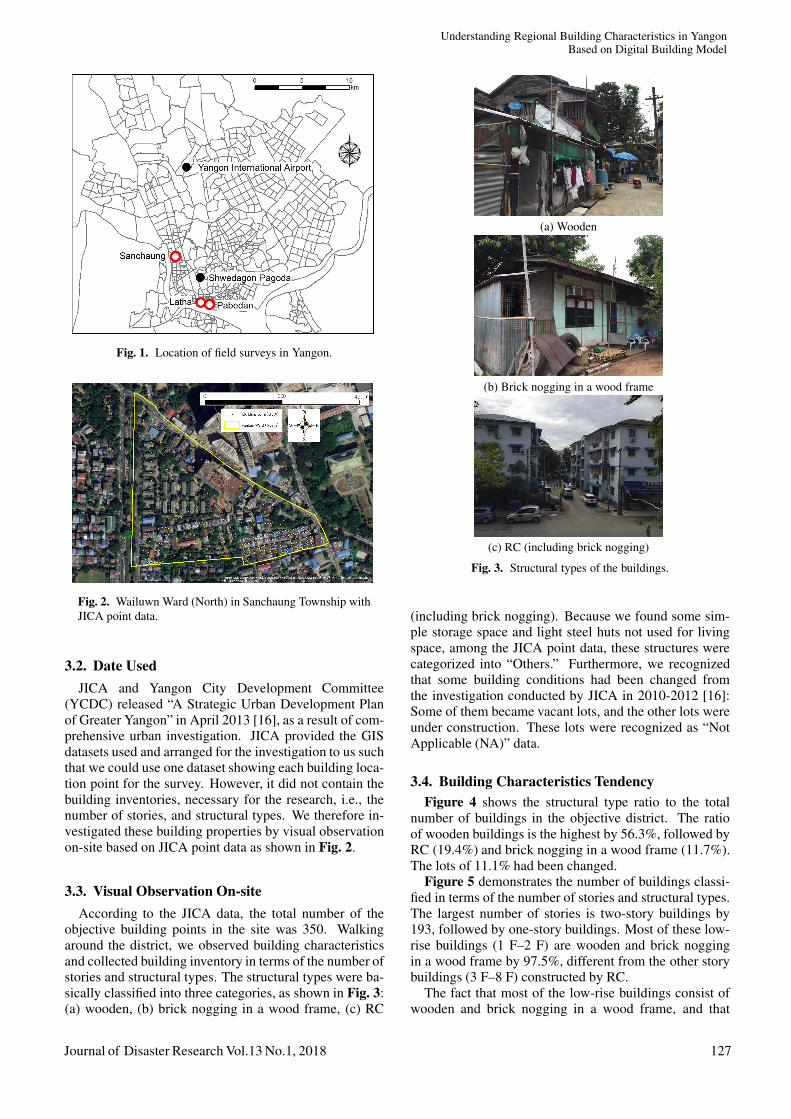
First, the authors conducted a field survey to com-prehensively understand building characteristics and theirtendency in Yangon for the following steps. The surveywas taken in May 2016 in Wailuwn Ward (North) in San-chaung Township (Fig. 1), which is a typical residentialarea in the country, with houses, apartments, temples, aresidential block for public employees, and local marketsfor the communities.
126 Journal of Disaster Research Vol.13 No.1, 2018
Understanding Regional Building Characteristics in YangonBased on Digital Building Model
Fig. 1. Location of field surveys in Yangon.
Fig. 2. Wailuwn Ward (North) in Sanchaung Township withJICA point data.
3.2. Date UsedJICA and Yangon City Development Committee
(YCDC) released “A Strategic Urban Development Planof Greater Yangon” in April 2013 [16], as a result of com-prehensive urban investigation. JICA provided the GISdatasets used and arranged for the investigation to us suchthat we could use one dataset showing each building loca-tion point for the survey. However, it did not contain thebuilding inventories, necessary for the research, i.e., thenumber of stories, and structural types. We therefore in-vestigated these building properties by visual observationon-site based on JICA point data as shown in Fig. 2.
3.3. Visual Observation On-siteAccording to the JICA data, the total number of the
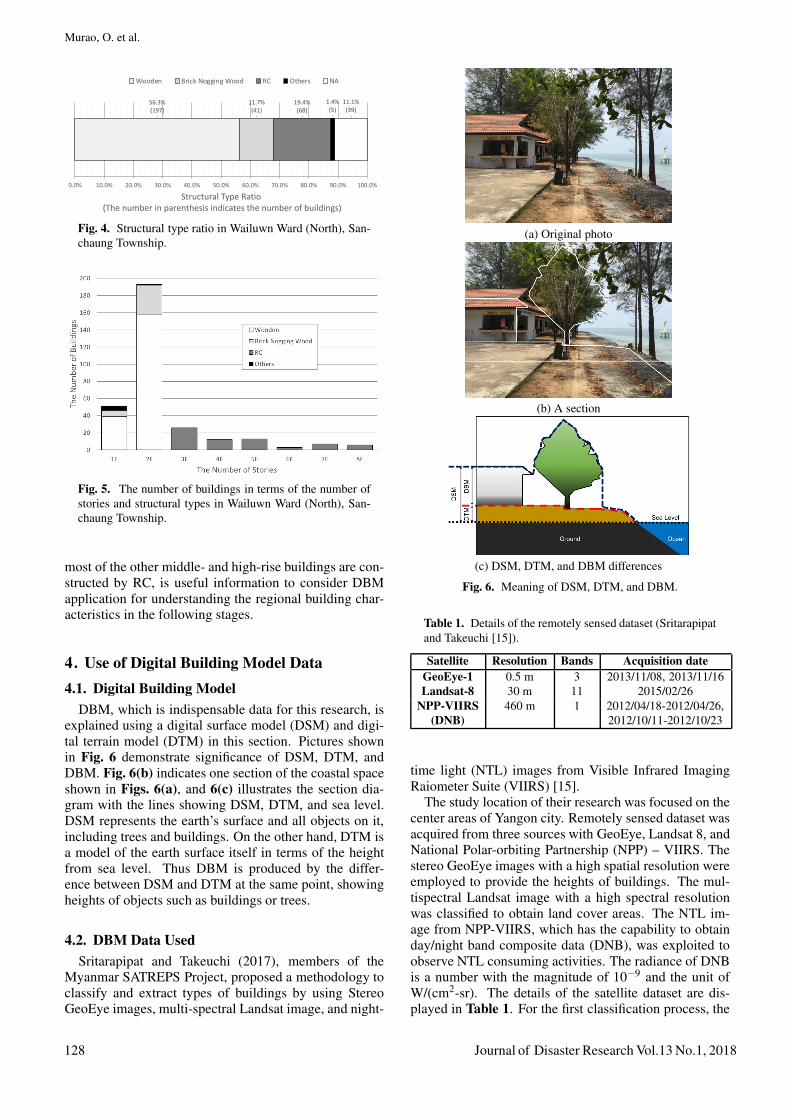
objective building points in the site was 350. Walkingaround the district, we observed building characteristicsand collected building inventory in terms of the number ofstories and structural types. The structural types were ba-sically classified into three categories, as shown in Fig. 3:(a) wooden, (b) brick nogging in a wood frame, (c) RC
(a) Wooden
(b) Brick nogging in a wood frame
(c) RC (including brick nogging)
Fig. 3. Structural types of the buildings.
(including brick nogging). Because we found some sim-ple storage space and light steel huts not used for livingspace, among the JICA point data, these structures werecategorized into “Others.” Furthermore, we recognizedthat some building conditions had been changed fromthe investigation conducted by JICA in 2010-2012 [16]:Some of them became vacant lots, and the other lots wereunder construction. These lots were recognized as “NotApplicable (NA)” data.
3.4. Building Characteristics TendencyFigure 4 shows the structural type ratio to the total
number of buildings in the objective district. The ratioof wooden buildings is the highest by 56.3%, followed byRC (19.4%) and brick nogging in a wood frame (11.7%).The lots of 11.1% had been changed.
Figure 5 demonstrates the number of buildings classi-fied in terms of the number of stories and structural types.The largest number of stories is two-story buildings by193, followed by one-story buildings. Most of these low-rise buildings (1 F–2 F) are wooden and brick noggingin a wood frame by 97.5%, different from the other storybuildings (3 F–8 F) constructed by RC.
The fact that most of the low-rise buildings consist ofwooden and brick nogging in a wood frame, and that
Journal of Disaster Research Vol.13 No.1, 2018 127
Murao, O. et al.
56.3%(197)
11.7%(41)
19.4%(68)
1.4%(5)
11.1%(39)
0.0% 10.0% 20.0% 30.0% 40.0% 50.0% 60.0% 70.0% 80.0% 90.0% 100.0%
Structural Type Ratio(The number in parenthesis indicates the number of buildings)
Wooden Brick Nogging Wood RC Others NA
Fig. 4. Structural type ratio in Wailuwn Ward (North), San-chaung Township.
Fig. 5. The number of buildings in terms of the number ofstories and structural types in Wailuwn Ward (North), San-chaung Township.
most of the other middle- and high-rise buildings are con-structed by RC, is useful information to consider DBMapplication for understanding the regional building char-acteristics in the following stages.
4. Use of Digital Building Model Data4.1. Digital Building Model
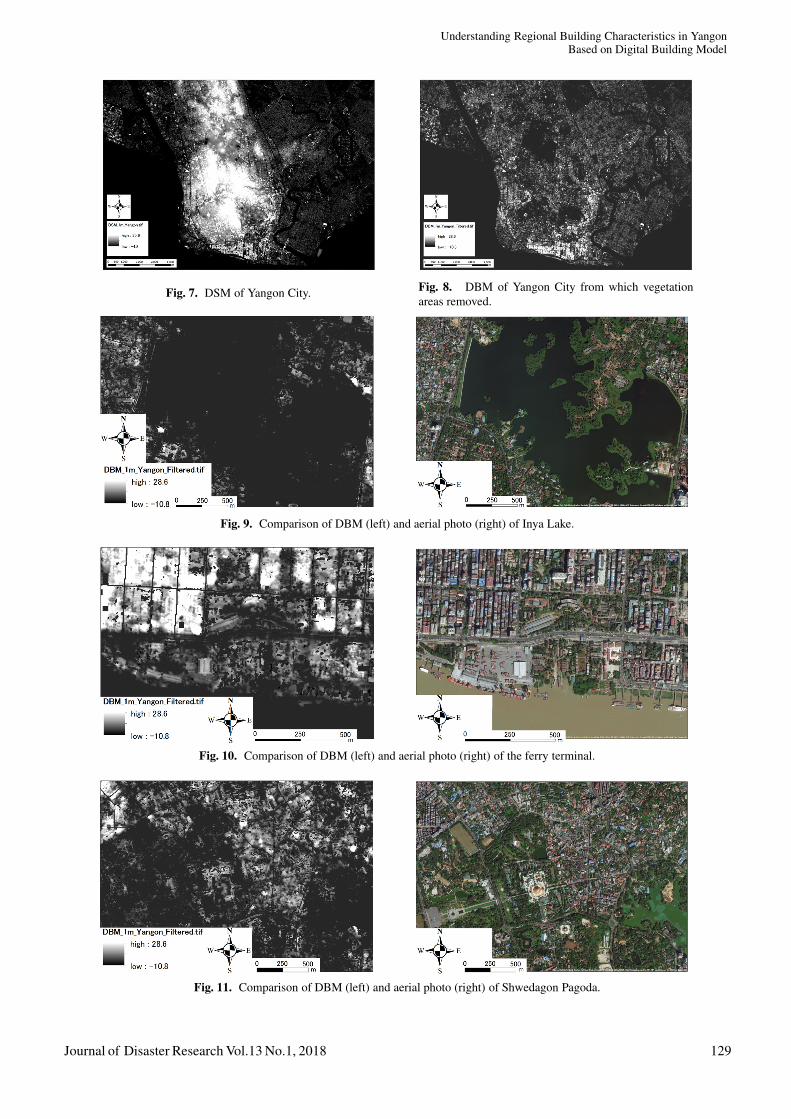
DBM, which is indispensable data for this research, isexplained using a digital surface model (DSM) and digi-tal terrain model (DTM) in this section. Pictures shownin Fig. 6 demonstrate significance of DSM, DTM, andDBM. Fig. 6(b) indicates one section of the coastal spaceshown in Figs. 6(a), and 6(c) illustrates the section dia-gram with the lines showing DSM, DTM, and sea level.DSM represents the earth’s surface and all objects on it,including trees and buildings. On the other hand, DTM isa model of the earth surface itself in terms of the heightfrom sea level. Thus DBM is produced by the differ-ence between DSM and DTM at the same point, showingheights of objects such as buildings or trees.
4.2. DBM Data UsedSritarapipat and Takeuchi (2017), members of the
Myanmar SATREPS Project, proposed a methodology toclassify and extract types of buildings by using StereoGeoEye images, multi-spectral Landsat image, and night-
(a) Original photo
(b) A section
(c) DSM, DTM, and DBM differences
Fig. 6. Meaning of DSM, DTM, and DBM.
Table 1. Details of the remotely sensed dataset (Sritarapipatand Takeuchi [15]).
Satellite Resolution Bands Acquisition dateGeoEye-1 0.5 m 3 2013/11/08, 2013/11/16Landsat-8 30 m 11 2015/02/26
NPP-VIIRS 460 m 1 2012/04/18-2012/04/26,(DNB) 2012/10/11-2012/10/23
time light (NTL) images from Visible Infrared ImagingRaiometer Suite (VIIRS) [15].
The study location of their research was focused on thecenter areas of Yangon city. Remotely sensed dataset wasacquired from three sources with GeoEye, Landsat 8, andNational Polar-orbiting Partnership (NPP) – VIIRS. Thestereo GeoEye images with a high spatial resolution wereemployed to provide the heights of buildings. The mul-tispectral Landsat image with a high spectral resolutionwas classified to obtain land cover areas. The NTL im-age from NPP-VIIRS, which has the capability to obtainday/night band composite data (DNB), was exploited toobserve NTL consuming activities. The radiance of DNBis a number with the magnitude of 10−9 and the unit ofW/(cm2-sr). The details of the satellite dataset are dis-played in Table 1. For the first classification process, the
128 Journal of Disaster Research Vol.13 No.1, 2018
Understanding Regional Building Characteristics in YangonBased on Digital Building Model
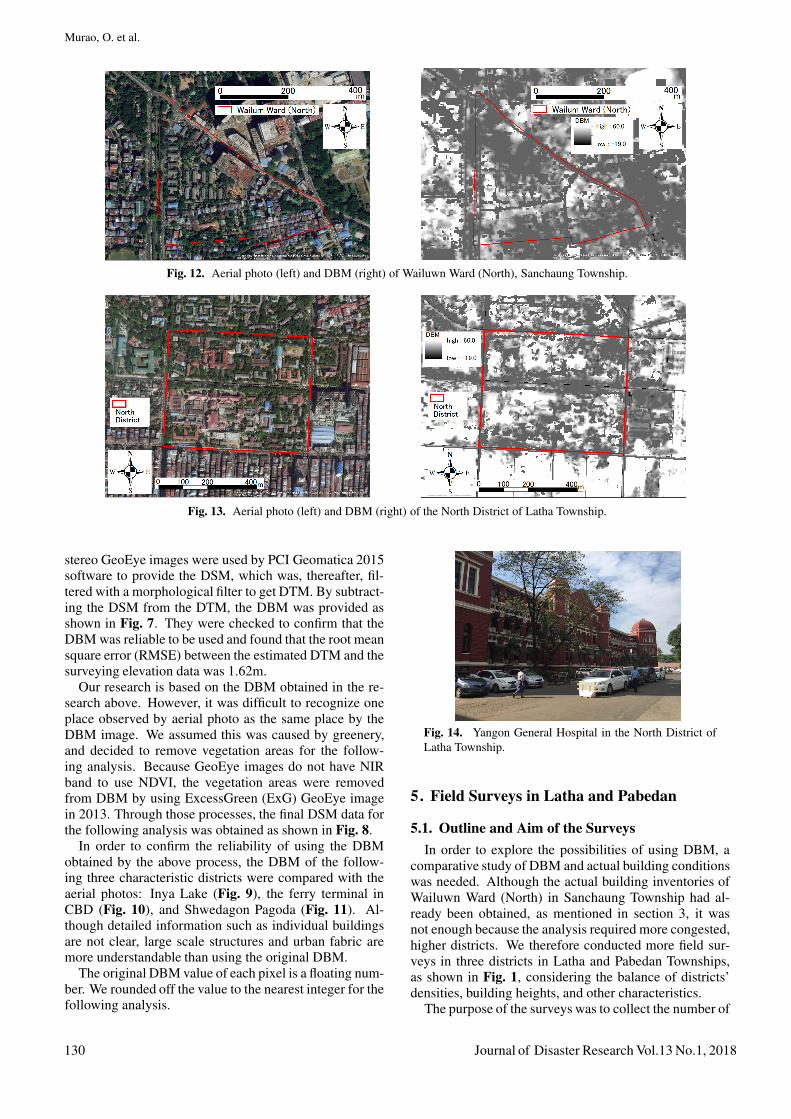
Fig. 7. DSM of Yangon City. Fig. 8. DBM of Yangon City from which vegetationareas removed.
Fig. 9. Comparison of DBM (left) and aerial photo (right) of Inya Lake.
Fig. 10. Comparison of DBM (left) and aerial photo (right) of the ferry terminal.
Fig. 11. Comparison of DBM (left) and aerial photo (right) of Shwedagon Pagoda.
Journal of Disaster Research Vol.13 No.1, 2018 129
Murao, O. et al.
Fig. 12. Aerial photo (left) and DBM (right) of Wailuwn Ward (North), Sanchaung Township.
Fig. 13. Aerial photo (left) and DBM (right) of the North District of Latha Township.
stereo GeoEye images were used by PCI Geomatica 2015software to provide the DSM, which was, thereafter, fil-tered with a morphological filter to get DTM. By subtract-ing the DSM from the DTM, the DBM was provided asshown in Fig. 7. They were checked to confirm that theDBM was reliable to be used and found that the root meansquare error (RMSE) between the estimated DTM and thesurveying elevation data was 1.62m.
Our research is based on the DBM obtained in the re-search above. However, it was difficult to recognize oneplace observed by aerial photo as the same place by theDBM image. We assumed this was caused by greenery,and decided to remove vegetation areas for the follow-ing analysis. Because GeoEye images do not have NIRband to use NDVI, the vegetation areas were removedfrom DBM by using ExcessGreen (ExG) GeoEye imagein 2013. Through those processes, the final DSM data forthe following analysis was obtained as shown in Fig. 8.
In order to confirm the reliability of using the DBMobtained by the above process, the DBM of the follow-ing three characteristic districts were compared with theaerial photos: Inya Lake (Fig. 9), the ferry terminal inCBD (Fig. 10), and Shwedagon Pagoda (Fig. 11). Al-though detailed information such as individual buildingsare not clear, large scale structures and urban fabric aremore understandable than using the original DBM.
The original DBM value of each pixel is a floating num-ber. We rounded off the value to the nearest integer for thefollowing analysis.
Fig. 14. Yangon General Hospital in the North District ofLatha Township.
5. Field Surveys in Latha and Pabedan
5.1. Outline and Aim of the SurveysIn order to explore the possibilities of using DBM, a
comparative study of DBM and actual building conditionswas needed. Although the actual building inventories ofWailuwn Ward (North) in Sanchaung Township had al-ready been obtained, as mentioned in section 3, it wasnot enough because the analysis required more congested,higher districts. We therefore conducted more field sur-veys in three districts in Latha and Pabedan Townships,as shown in Fig. 1, considering the balance of districts’densities, building heights, and other characteristics.
The purpose of the surveys was to collect the number of
130 Journal of Disaster Research Vol.13 No.1, 2018
Understanding Regional Building Characteristics in YangonBased on Digital Building Model
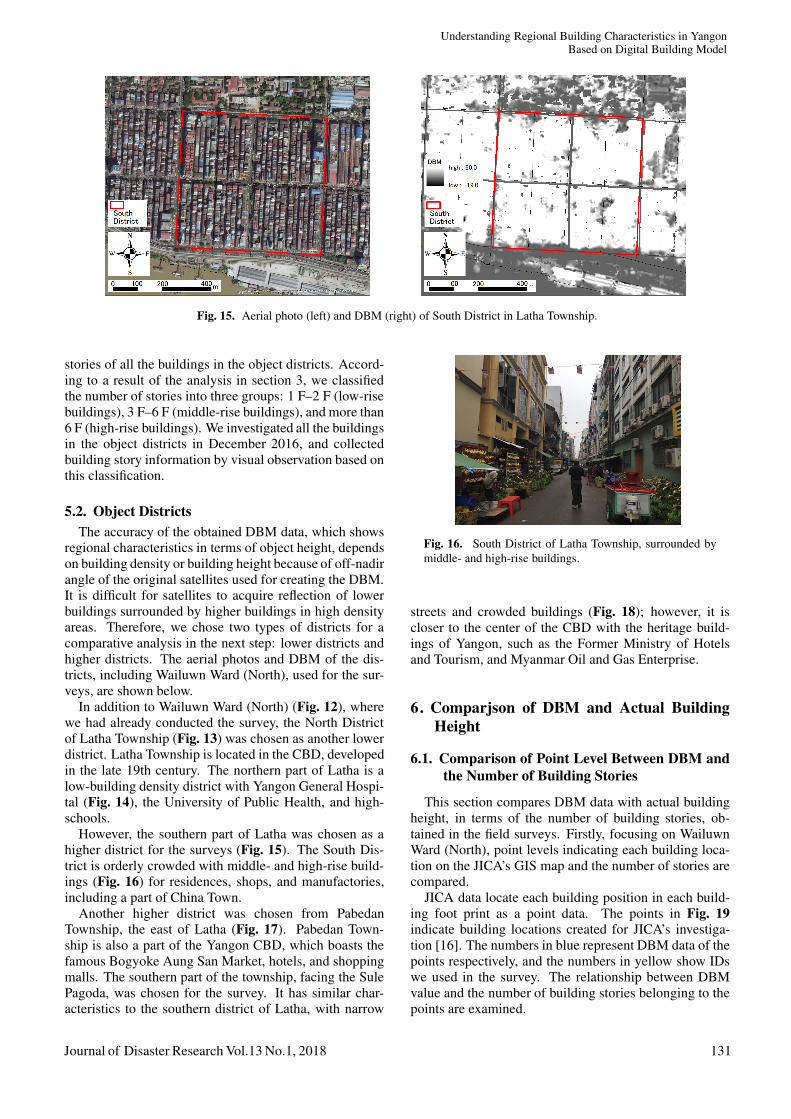
Fig. 15. Aerial photo (left) and DBM (right) of South District in Latha Township.
stories of all the buildings in the object districts. Accord-ing to a result of the analysis in section 3, we classifiedthe number of stories into three groups: 1 F–2 F (low-risebuildings), 3 F–6 F (middle-rise buildings), and more than6 F (high-rise buildings). We investigated all the buildingsin the object districts in December 2016, and collectedbuilding story information by visual observation based onthis classification.
5.2. Object DistrictsThe accuracy of the obtained DBM data, which shows
regional characteristics in terms of object height, dependson building density or building height because of off-nadirangle of the original satellites used for creating the DBM.It is difficult for satellites to acquire reflection of lowerbuildings surrounded by higher buildings in high densityareas. Therefore, we chose two types of districts for acomparative analysis in the next step: lower districts andhigher districts. The aerial photos and DBM of the dis-tricts, including Wailuwn Ward (North), used for the sur-veys, are shown below.
In addition to Wailuwn Ward (North) (Fig. 12), wherewe had already conducted the survey, the North Districtof Latha Township (Fig. 13) was chosen as another lowerdistrict. Latha Township is located in the CBD, developedin the late 19th century. The northern part of Latha is alow-building density district with Yangon General Hospi-tal (Fig. 14), the University of Public Health, and high-schools.
However, the southern part of Latha was chosen as ahigher district for the surveys (Fig. 15). The South Dis-trict is orderly crowded with middle- and high-rise build-ings (Fig. 16) for residences, shops, and manufactories,including a part of China Town.
Another higher district was chosen from PabedanTownship, the east of Latha (Fig. 17). Pabedan Town-ship is also a part of the Yangon CBD, which boasts thefamous Bogyoke Aung San Market, hotels, and shoppingmalls. The southern part of the township, facing the SulePagoda, was chosen for the survey. It has similar char-acteristics to the southern district of Latha, with narrow
Fig. 16. South District of Latha Township, surrounded bymiddle- and high-rise buildings.
streets and crowded buildings (Fig. 18); however, it iscloser to the center of the CBD with the heritage build-ings of Yangon, such as the Former Ministry of Hotelsand Tourism, and Myanmar Oil and Gas Enterprise.
6. Comparjson of DBM and Actual BuildingHeight
6.1. Comparison of Point Level Between DBM andthe Number of Building Stories
This section compares DBM data with actual buildingheight, in terms of the number of building stories, ob-tained in the field surveys. Firstly, focusing on WailuwnWard (North), point levels indicating each building loca-tion on the JICA’s GIS map and the number of stories arecompared.
JICA data locate each building position in each build-ing foot print as a point data. The points in Fig. 19indicate building locations created for JICA’s investiga-tion [16]. The numbers in blue represent DBM data of thepoints respectively, and the numbers in yellow show IDswe used in the survey. The relationship between DBMvalue and the number of building stories belonging to thepoints are examined.
Journal of Disaster Research Vol.13 No.1, 2018 131

Murao, O. et al.
Fig. 17. Aerial photo (left) and DBM (right) of South District in Pabedan Township.
Fig. 18. South District of Pabedan Township, surroundedby middle- and high-rise buildings.
Figure 20 demonstrates a scatter diagram of the rela-tionship. As shown, the correlation between DBM valueand the number of building stories is very low. It can beinferred that a point having a DBM value produced as a re-sult of remote sensing satellite reflection of objects, doesnot always correspond to an actual point because of theoff-nadir angle. This is especially so for high-rise build-ings. The actual surface height of areas hidden by neigh-bor higher buildings is difficult to obtain by satellite. Thisresulted in big gaps shown in the figure. Furthermore,DBM is a dataset produced by the complicated process ofusing DSM and DTM, so it has some uncertainty. There-fore, another idea is needed for the analysis.
6.2. Concept of Comparison Based on DBM AreaRatio
For the next step, this section proposes an area ratio-based comparison, instead of the point level-based com-parison. As earlier mentioned in section 1, the vulnerabil-ity assessment we are aiming at is based on the earthquakerisk assessment conducted by TMG [2]. This methodis to evaluate the number of buildings in a spatial unit,such as neighborhood, that would be damaged by a strongearthquake. Hence, necessary information on the build-ing vulnerability assessment in this project is the numberof buildings in terms of building characteristics. Because
Fig. 19. Points indicating building locations in WailuwnWard (North), Sanchaung: Numbers in blue showing DBM,and in yellow showing ID in the field survey.
The
Num
ber o
f Bui
ldin
g St
orie
s (F)
DBM (m)
Fig. 20. Scatter diagram of the relationship between DBMvalue and the number of building stories for Wailuwn Ward(North).
the JICA GIS data already contains the total number ofbuildings for each ward, a spatial unit for communities inYangon, what we need is the ratio of the number of build-ings to the total number of buildings in an area in terms ofheight, namely the number of building stories. The con-cept of this comparative study is illustrated in Fig. 21.
The top right figure shows an actual building locationimage of an area. In order to calculate the ratio of higher
132 Journal of Disaster Research Vol.13 No.1, 2018
Understanding Regional Building Characteristics in YangonBased on Digital Building Model
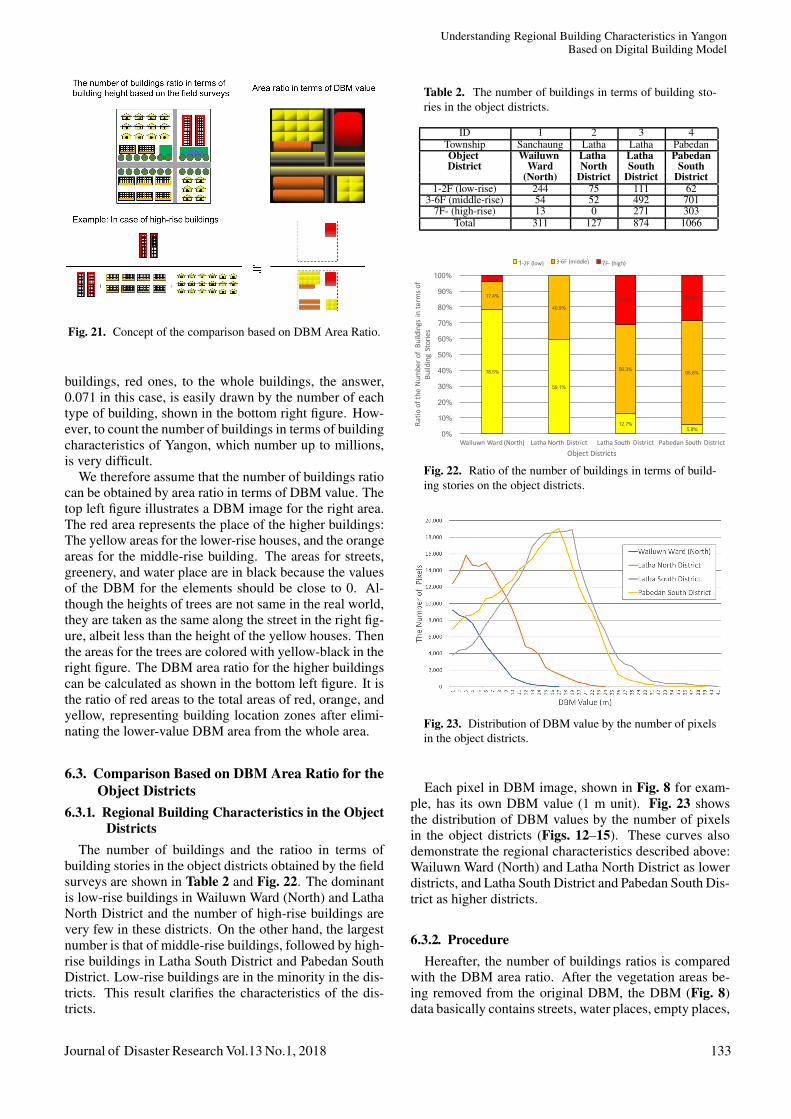
Fig. 21. Concept of the comparison based on DBM Area Ratio.
buildings, red ones, to the whole buildings, the answer,0.071 in this case, is easily drawn by the number of eachtype of building, shown in the bottom right figure. How-ever, to count the number of buildings in terms of buildingcharacteristics of Yangon, which number up to millions,is very difficult.
We therefore assume that the number of buildings ratiocan be obtained by area ratio in terms of DBM value. Thetop left figure illustrates a DBM image for the right area.The red area represents the place of the higher buildings:The yellow areas for the lower-rise houses, and the orangeareas for the middle-rise building. The areas for streets,greenery, and water place are in black because the valuesof the DBM for the elements should be close to 0. Al-though the heights of trees are not same in the real world,they are taken as the same along the street in the right fig-ure, albeit less than the height of the yellow houses. Thenthe areas for the trees are colored with yellow-black in theright figure. The DBM area ratio for the higher buildingscan be calculated as shown in the bottom left figure. It isthe ratio of red areas to the total areas of red, orange, andyellow, representing building location zones after elimi-nating the lower-value DBM area from the whole area.
6.3. Comparison Based on DBM Area Ratio for theObject Districts
6.3.1. Regional Building Characteristics in the ObjectDistricts
The number of buildings and the ratioo in terms ofbuilding stories in the object districts obtained by the fieldsurveys are shown in Table 2 and Fig. 22. The dominantis low-rise buildings in Wailuwn Ward (North) and LathaNorth District and the number of high-rise buildings arevery few in these districts. On the other hand, the largestnumber is that of middle-rise buildings, followed by high-rise buildings in Latha South District and Pabedan SouthDistrict. Low-rise buildings are in the minority in the dis-tricts. This result clarifies the characteristics of the dis-tricts.
Table 2. The number of buildings in terms of building sto-ries in the object districts.
ID 1 2 3 4Township Sanchaung Latha Latha PabedanObject Wailuwn Latha Latha PabedanDistrict Ward North South South
(North) District District District1-2F (low-rise) 244 75 111 62
3-6F (middle-rise) 54 52 492 7017F- (high-rise) 13 0 271 303
Total 311 127 874 1066
Fig. 22. Ratio of the number of buildings in terms of build-ing stories on the object districts.
Fig. 23. Distribution of DBM value by the number of pixelsin the object districts.
Each pixel in DBM image, shown in Fig. 8 for exam-ple, has its own DBM value (1 m unit). Fig. 23 showsthe distribution of DBM values by the number of pixelsin the object districts (Figs. 12–15). These curves alsodemonstrate the regional characteristics described above:Wailuwn Ward (North) and Latha North District as lowerdistricts, and Latha South District and Pabedan South Dis-trict as higher districts.
6.3.2. ProcedureHereafter, the number of buildings ratios is compared
with the DBM area ratio. After the vegetation areas be-ing removed from the original DBM, the DBM (Fig. 8)data basically contains streets, water places, empty places,
Journal of Disaster Research Vol.13 No.1, 2018 133

Murao, O. et al.
Digital Building Model Value
GroundLow-riseBuildings
(1-2F)
Middle-riseBuildings
(3-6F)
High-riseBuildings
(7F-)
2m 5m ≤ p ≤ 8m
GroundLow-riseBuildings
(1-2F)
Middle-riseBuildings
(3-6F)
High-riseBuildings
(7F-)
16m ≤ q ≤ 20m3m
Fig. 24. Adaptation Trial of actual building stories to DBMvalue.
Fig. 25. DBM Map of Wailuwn Ward (North) for boundaryvalue consideration.
Fig. 26. DBM Map of Latha North District for boundaryvalue consideration.
huts, structures, and buildings. Now, assuming that thevalue representing buildings on the DBM map is morethan 2 m, the pixels having less than 3 m, represent-ing streets, empty places, or small structures, are elimi-nated from the original DBM (Figs. 12–15) at first. Onthis assumption, the rest of pixels are for higher objectsrepresenting buildings in the districts, consisting of low-,middle-, and high-rise buildings. This classification ofthree categories in terms of building height should cor-respond to DBM value.
Figure 24 explains the adaptation trial of actual build-ing stories to DBM value for the analysis. As a resultof the above elimination, the data of 3 m and over is therange of the DBM value. The determination of the valuefor the boundaries between low-rise buildings (1 F–2 F),middle-rise buildings (3 F–6 F), and high-rise buildings (7F -) is the research question. Here let the former boundarybe p and the latter be q. Usually the height of one storyis recognized as 3 m. However, most lower-rise build-ings in the districts are not RC buildings with flat roof but
Fig. 27. Comparison of low-rise building ratio and DBMarea ratio in the Lower Districts.
Fig. 28. Comparison of low- and middle- rise building ratioand DBM area ratio in the Higher Districts.
wooden or brick nogging in a wood frame with triangleroof. We thus regard the p value as between 5 m and 8 m,and the q value as between 16 m and 20 m.
According to the difference of regional characteristics,the p value is considered by the study of Wailuwn Ward(North) and Latha North District, and the q value is con-sidered by the study of Latha South District and PabedanSouth District.
6.3.3. Comparative AnalysisBased on the procedure, the building ratio and DBM
area ratio is compared. For the lower building districts,Wailuwn Ward (North) and Latha North District, the pvalue is changed from 5 m to 8 m. Figs. 25 and 26 showthe case of 6 m and 7 m for low-rise buildings as examplesin the both districts respectively. The result of the compar-ison using scatter diagram is shown in Fig. 27 with x-axis
134 Journal of Disaster Research Vol.13 No.1, 2018
Understanding Regional Building Characteristics in YangonBased on Digital Building Model
≤ 0m≤ 1-2m≤ 3-7m≤ 8-18m≤ 19m-
≤ 0m ≤ 1-2m ≤ 3-7m ≤ 8-18m ≤ 19m-
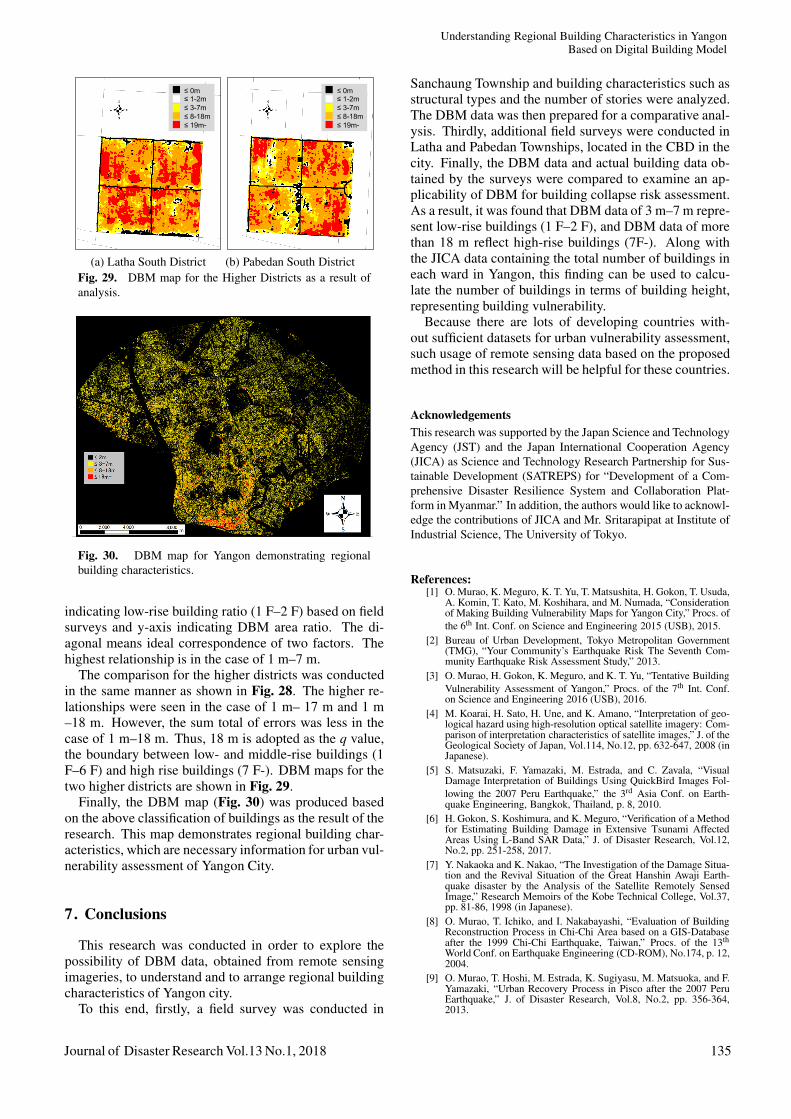
(a) Latha South District (b) Pabedan South DistrictFig. 29. DBM map for the Higher Districts as a result ofanalysis.
Fig. 30. DBM map for Yangon demonstrating regionalbuilding characteristics.
indicating low-rise building ratio (1 F–2 F) based on fieldsurveys and y-axis indicating DBM area ratio. The di-agonal means ideal correspondence of two factors. Thehighest relationship is in the case of 1 m–7 m.
The comparison for the higher districts was conductedin the same manner as shown in Fig. 28. The higher re-lationships were seen in the case of 1 m– 17 m and 1 m–18 m. However, the sum total of errors was less in thecase of 1 m–18 m. Thus, 18 m is adopted as the q value,the boundary between low- and middle-rise buildings (1F–6 F) and high rise buildings (7 F-). DBM maps for thetwo higher districts are shown in Fig. 29.
Finally, the DBM map (Fig. 30) was produced basedon the above classification of buildings as the result of theresearch. This map demonstrates regional building char-acteristics, which are necessary information for urban vul-nerability assessment of Yangon City.
7. Conclusions
This research was conducted in order to explore thepossibility of DBM data, obtained from remote sensingimageries, to understand and to arrange regional buildingcharacteristics of Yangon city.
To this end, firstly, a field survey was conducted in
Sanchaung Township and building characteristics such asstructural types and the number of stories were analyzed.The DBM data was then prepared for a comparative anal-ysis. Thirdly, additional field surveys were conducted inLatha and Pabedan Townships, located in the CBD in thecity. Finally, the DBM data and actual building data ob-tained by the surveys were compared to examine an ap-plicability of DBM for building collapse risk assessment.As a result, it was found that DBM data of 3 m–7 m repre-sent low-rise buildings (1 F–2 F), and DBM data of morethan 18 m reflect high-rise buildings (7F-). Along withthe JICA data containing the total number of buildings ineach ward in Yangon, this finding can be used to calcu-late the number of buildings in terms of building height,representing building vulnerability.
Because there are lots of developing countries with-out sufficient datasets for urban vulnerability assessment,such usage of remote sensing data based on the proposedmethod in this research will be helpful for these countries.
AcknowledgementsThis research was supported by the Japan Science and TechnologyAgency (JST) and the Japan International Cooperation Agency(JICA) as Science and Technology Research Partnership for Sus-tainable Development (SATREPS) for “Development of a Com-prehensive Disaster Resilience System and Collaboration Plat-form in Myanmar.” In addition, the authors would like to acknowl-edge the contributions of JICA and Mr. Sritarapipat at Institute ofIndustrial Science, The University of Tokyo.
References:[1] O. Murao, K. Meguro, K. T. Yu, T. Matsushita, H. Gokon, T. Usuda,
A. Komin, T. Kato, M. Koshihara, and M. Numada, “Considerationof Making Building Vulnerability Maps for Yangon City,” Procs. ofthe 6th Int. Conf. on Science and Engineering 2015 (USB), 2015.
[2] Bureau of Urban Development, Tokyo Metropolitan Government(TMG), “Your Community’s Earthquake Risk The Seventh Com-munity Earthquake Risk Assessment Study,” 2013.
[3] O. Murao, H. Gokon, K. Meguro, and K. T. Yu, “Tentative BuildingVulnerability Assessment of Yangon,” Procs. of the 7th Int. Conf.on Science and Engineering 2016 (USB), 2016.
[4] M. Koarai, H. Sato, H. Une, and K. Amano, “Interpretation of geo-logical hazard using high-resolution optical satellite imagery: Com-parison of interpretation characteristics of satellite images,” J. of theGeological Society of Japan, Vol.114, No.12, pp. 632-647, 2008 (inJapanese).
[5] S. Matsuzaki, F. Yamazaki, M. Estrada, and C. Zavala, “VisualDamage Interpretation of Buildings Using QuickBird Images Fol-lowing the 2007 Peru Earthquake,” the 3rd Asia Conf. on Earth-quake Engineering, Bangkok, Thailand, p. 8, 2010.
[6] H. Gokon, S. Koshimura, and K. Meguro, “Verification of a Methodfor Estimating Building Damage in Extensive Tsunami AffectedAreas Using L-Band SAR Data,” J. of Disaster Research, Vol.12,No.2, pp. 251-258, 2017.
[7] Y. Nakaoka and K. Nakao, “The Investigation of the Damage Situa-tion and the Revival Situation of the Great Hanshin Awaji Earth-quake disaster by the Analysis of the Satellite Remotely SensedImage,” Research Memoirs of the Kobe Technical College, Vol.37,pp. 81-86, 1998 (in Japanese).
[8] O. Murao, T. Ichiko, and I. Nakabayashi, “Evaluation of BuildingReconstruction Process in Chi-Chi Area based on a GIS-Databaseafter the 1999 Chi-Chi Earthquake, Taiwan,” Procs. of the 13th
World Conf. on Earthquake Engineering (CD-ROM), No.174, p. 12,2004.
[9] O. Murao, T. Hoshi, M. Estrada, K. Sugiyasu, M. Matsuoka, and F.Yamazaki, “Urban Recovery Process in Pisco after the 2007 PeruEarthquake,” J. of Disaster Research, Vol.8, No.2, pp. 356-364,2013.
Journal of Disaster Research Vol.13 No.1, 2018 135

Murao, O. et al.
[10] T. Hoshi, O. Murao, K. Yoshino, F. Yamazaki, and M. Estrada,“Post-disaster Urban Recovery Monitoring in Pisco after the 2007Peru Earthquake Using Satellite Image,” J. of Disaster Research,Vol.9, No.6, pp. 1059-1068, 2014.
[11] H. Miura and S. Midorikawa, “Updating GIS Building InventoryData Using High-resolution Satellite Images for Earthquake Dam-age Assessment: Application to Metro Manila, Philippines,” Earth-quake Spectra, Vol.22, No.1, pp. 151-168, 2006.
[12] I. F. Shaker, A. Abd-Elrahman, A. K. Abdel-Gawad, and M. A.Sherief, “Building Extraction from High Resolution Space Imagesin High Density Residential Areas in the Great Cairo Region,” Re-mote Sensing, Vol.3, No.4, pp. 781-791, 2011.
[13] M. Matsuoka, H. Miura, S. Midorikawa, and M. Estrada, “Extrac-tion of Urban Information for Seismic Hazard and Risk Assessmentin Lima, Peru Using Satellite Imagery,” J. of Disaster Research,Vol.8, No.2, pp. 328-345, 2013.
[14] T. Sritarapipat and W. Takeuchi, “Estimating Land Value and Dis-aster Risk in Urban Area in Yangon, Myanmar Using Stereo High-resolution Images and Multi-temporal Landsat Images,” Procs. of36th Asian conference on remote sensing, 2015.
[15] T. Sritarapipat and W. Takeuchi, “Building Classification in YangonCity, Myanmar Using Stereo GeoEye Images, Landsat Image andNight-time Light Data,” Remote Sensing Applications: Society andEnvironment, Vol.6, pp. 46-51, 2017.
[16] Japan Int. Cooperation Agency (JICA) and Yangon City Develop-ment Committee (YCDC), “The Republic of the Union of Myan-mar, A Strategic Urban Development Plan of Greater Yangon, TheProject for the Strategic Urban Development Plan of the GreaterYangon,” 2014, open jicareport.jica.go.jp/pdf/12122511.pdf [ac-cessed October 25, 2015]
Name:Osamu Murao
Affiliation:Professor, International Research Institute ofDisaster Science, Tohoku University
Address:468-1 Aramaki-aza-Aoba, Aoba-ku, Sendai, Miyagi 980-8572, JapanBrief Career:1995-1996 Researcher, Laboratory of Urban Safety Planning, Inc.1996-2000 Research Associate, Institute of Industrial Science, TheUniversity of Tokyo2000-2005 Assistant Professor, The University of Tsukuba2005-2013 Associate Professor, The University of Tsukuba(2005 summer) Visiting Researcher, Graduate Institute of Building andPlanning, National Taiwan University2006 Visiting Scholar, Institute for Crisis, Disaster and Risk Management,George Washington University2009-2010 Fulbright Visiting Scholar2009-2010 Graduate School of Design, Harvard University, and MarineEducation Center, the University of Hawaii at Hilo2013- Professor, Int. Research Institute of Disaster Science, TohokuUniversitySelected Publications:• F. Yamazaki and O. Murao, “Vulnerability Functions for JapaneseBuildings based on Damage Data due to the 1995 Kobe Earthquake,”Implications of Recent Earthquakes on Seismic Risk, Series of Innovationin Structures and Construction, Vol.2, pp. 91-102, Imperial College Press,2000.4.• O. Murao and H. Nakazato,“Recovery Curves for HousingReconstruction in Sri Lanka after the 2004 Indian Ocean Tsunami,” J. ofEarthquake and Tsunami, Vol.4, No.2, pp. 51-60, DOI No:10.1142/S1793431110000765, 2010.6.• O. Murao, T. Hoshi, M Estrada, K Sugiyasu, M. Matsuoka, and F.Yamazaki, “Urban Recovery Process in Pisco after the 2007 PeruEarthquake,” J. of Disaster Research, Vol.8, No.2, pp. 356-364, 2013.3.Academic Societies & Scientific Organizations:• Architectural Institute of Japan (AIJ)• The City Planning Institute of Japan (CPIJ)• Institute of Social Safety Science (ISSS)• Japan Association for Earthquake Engineering (JAEE)• Earthquake Engineering Research Institute (EERI)
Name:Takuma Usuda
Affiliation:Former Graduate School Student, GraduateSchool of Engineering, Tohoku University
Address:6-6 Aramaki-aza-Aoba, Aoba-ku Sendai, Miyagi 980-8579, JapanBrief Career:2011-2015 Department of Civil Engineering and Architecture2015-2017 Graduate School of Engineering, Tohoku University2017- Lixil CorporationSelected Publications:• O. Murao, K. Meguro, K.T. Yu, T. Matsushita, H. Gokon, T. Usuda, A.Komin, T. Kato, M. Koshihara, and M. Numada, “Consideration of MakingBuilding Vulnerability Maps for Yangon City,” Procs. of the 6th Int. Conf.on Science and Engineering 2015 (USB), Yangon, Myanmar, 2015.12.• O. Murao, T. Usuda, K. Sugiyasu, and K. Hanaoka, “Building Damagedue to 2013 Typhoon Yolanda in Basey, the Philippines,” Procs. of the14th Int. Symposium on New Technologies for Urban Safety of MegaCities in Asia (USB), p. 6, Kathmandu, Nepal, 2015.10.Academic Societies & Scientific Organizations:• Architectural Institute of Japan (AIJ)
Name:Hideomi Gokon
Affiliation:Assistant Professor, Institute of Industrial Sci-ence, The University of Tokyo
Address:4-6-1-Be604, Komaba, Meguro-ku, Tokyo 153-8505, JapanBrief Career:2012-2015 Doctoral Course Student, Graduate School of Engineering,Tohoku University2012-2015 JSPS Research Fellow (DC1)2012 Visiting researcher of German Aerospace Center (DLR)2015-present Assistant Professor, Institute of Industrial Science, theUniversity of TokyoSelected Publications:• H. Gokon, S. Koshimura, and M. Matsuoka, “Object-based method forestimating tsunami induced damage using TerraSAR-X data,” Journal ofDisaster Research, Vol.11, No.2, pp. 225-235, 2016.• H. Gokon, J. Post, E. Stein, S. Martinis, A. Twele, M. Muck, C. Geiß, S.Koshimura and M. Matsuoka, “A Method for Detecting DevastatedBuildings by the 2011 Tohoku Earthquake Tsunami Using Multi-temporalTerraSAR-X Data,” Geoscience and Remote Sensing letters, IEEE, 2015.• H. Gokon, S. Koshimura, K. Imai, M. Matsuoka, Y. Namegaya, and Y.Nishimura, “Developing Fragility Functions for the Areas Affected by the2009 Samoa Earthquake and Tsunami,” Natural Hazards and Earth SystemSciences, Vol.14, pp. 3231-3241, 2014.Academic Societies & Scientific Organizations:• Japan Society of Civil Engineers (JSCE)• Architectural Institute of Japan (AIJ)• Japan Association for Earthquake Engineering (JAEE)
136 Journal of Disaster Research Vol.13 No.1, 2018
Understanding Regional Building Characteristics in YangonBased on Digital Building Model
Name:Kimiro Meguro
Affiliation:Professor, Institute of Industrial Science, TheUniversity of Tokyo
Address:4-6-1-Be604, Komaba, Meguro-ku, Tokyo 153-8505, JapanBrief Career:2010 Professor, Graduate School of Interdisciplinary Information Studies,The University of Tokyo2015 The Director of the Japan Association for Earthquake Engineering2016 Special Advisor of Cabinet Office, Government of JapanSelected Publications:• M. Kohiyama, A. S. Kiremidjian, K. Meguro, and M. Ohara, “Incentivesand Disincentives Analysis for Improving Policy for Seismic RiskManagement of Homeowners in Japan,” Natural Hazards Review, ASCE,Vol.9, No.4, pp. 170-178, 2008.• Matsuoka and Nojima, “Building Damage Estimation by Integration ofSeismic Intensity Information and Satellite L-band SAR Imagery,” RemoteSensing, MDPI, Vol.2, No.9, pp. 2111-2126, 2010.• K. Meguro and H. Tagel-Din, “Applied Element Simulation of RCStructure under Cyclic Loading,” Journal of Structural Engineering,ASCE, Vol.127, No.11, pp. 1295-1305, 2001.Academic Societies & Scientific Organizations:• Japan Society of Civil Engineers (JSCE)• Institute of Social Safety Science (ISSS)• Japan Association for Earthquake Engineering (JAEE)• International Association for Earthquake Engineering (IAEE)• World Seismic Safety Initiative (WSSI)• Japan Society for Natural Disaster Science• Japan Society for Active Fault Studies (JSAF)
Name:Wataru Takeuchi
Affiliation:Associate Professor, Institute of Industrial Sci-ence, The University of Tokyo
Address:4-6-1 Komaba, Meguro-ku, Tokyo 153-8505, JapanBrief Career:2010-present Associate Professor, Institute of Industrial Science, TheUniversity of Tokyo 2010-2012 Director, Bangkok office, Japan Societyfor Promotion of Science (JSPS)Selected Publications:• P. Misra, A. Fujikawa, and W. Takeuchi, “Novel Decomposition Schemefor Characterizing Urban Aerosols Observed from MODIS,” RemoteSens., Vol.9, No.8, p. 812, 2017.• T. Sritarapipat and W. Takeuchi, “Urban growth modeling based on themulti-centers of the Rrban Areas and Land Cover Dhange in Yangon,Myanmar,” Journal of Remote Sensing Society of Japan, Vol.37, No.3, pp.248-260, 2017.• M. Adachi, A. Ito, S. Yonemura and W. Takeuchi, “Estimation of GlobalSoil Respiration by Accounting for Land-use Changes Derived fromRemote Sensing Data,” Journal of Environmental Management, Vol.200,pp. 97-104, 2017.Academic Societies & Scientific Organizations:• American Society for Photogrammetry and Remote Sensing (ASPRS)• Japan Society for Photogrammetry and Remote Sensing (JSPRS)
Name:Kazuya Sugiyasu
Affiliation:Assistant Professor, International Research Insti-tute of Disaster Science, Tohoku University
Address:6-6-11 Aramaki-aza-Aoba, Aoba-ku, Sendai, Miyagi 980-8579, JapanBrief Career:2012-2013 Researcher, The University of Tsukuba2013- Assistant Professor, International Research Institute of DisasterScience, Tohoku UniversitySelected Publications:• K. Sugiyasu, Y. Abe, and M. Matsumoto, “Case Study of TsunamiEvacuating Action and Future planning after the 2011 Great East JapanEarthquake, in Iwaki City, Fukushima, Japan,” 16th InternationalSymposium on New Technologies for Urban Safety of Mega Cities inASIA(USMCA-2017), 2p., Nov, 2017.• O. Murao, T. Hoshi, M. Estrada, K. Sugiyasu, M. Matsuoka, and F.Yamazaki, “Urban Recovery Process in Pisco after the 2007 PeruEarthquake,” Journal of Disaster Research, Vol.8, No.2, pp. 356-364,March 2013.• K. Sugiyasu and O. Murao, “Comparative Analysis of theReconstruction Process of Urban facilities in Indonesia based on RecoveryCurves after the 2004 Indian Ocean Tsunami,” Proceedings ofInternational Conference on Sustainable Built Environments(ICSBE-2010), Vol.2, pp. 363-370, Dec, 2010.Academic Societies & Scientific Organizations:• Architectural Institute of Japan (AIJ)• City Planning Institute of Japan (CPIJ)• Institute of Social Safety Science (ISSS)• Japan Association for Earthquake Engineering (JAEE)
Name:Khin Than Yu
Affiliation:Pro-Rector, Yangon Technological University
Address:Pro-Rector Office, Yangon Technological University, Postal code-11011,Gyoegone, Insein Township, Yangon Region, MyanmarBrief Career:1991- 2001 Assistant Professor, Department of Civil Engineering , YangonTechnological University2001-2002 Deputy Director, Department of Technical Promotion andCoordination, Ministry of Science and Technology2005 Professor (Acting Rector), Myanmar Aerospace EngineeringUniversity (MAEU)Academic Societies & Scientific Organizations:• Member, Central Executive Committee, Myanmar Engineering Council• Member, Accreditation Committee, Myanmar Engineering Council• Member, PDP Committee , Myanmar Engineering Council• Member, Water Management Committee, Yangon Region Government• Member, Myanmar National Committee on Large Dams (MNCOLD)• Steering Committee Member, Multi-Stakeholder Forum, AyeyarwadyIntegrated River Basin Management Project
Journal of Disaster Research Vol.13 No.1, 2018 137