UNDERSTANDING PUBLIC-PRIVATE PARTNERSHIPS (P3) … Municipal Policy Journal 105 Understanding...
16
Illinois Municipal Policy Journal, 2017, Vol. 2, No. 1, 103-118 | © Illinois Municipal League 103 UNDERSTANDING PUBLIC-PRIVATE PARTNERSHIPS (P3) THROUGH A THEORETICAL COST COMPARISON MATT CALCAVECCHIA, ERIN BIRKENKOPF AND JOHN FINKE PUBLIC FACILITIES GROUP is study compares three “P3 approaches” for developing social infrastructure, such as municipal buildings, public university facilities and courthouses. It illustrates why officials should consider each approach to fully understand their financial options. e results are particularly important to understanding the benefits of an “American Approach P3,” which involves tax-exempt bonds issued by a not-for-profit organization; this allows the project to be undertaken by a development team outside of the traditional public-works process, while also allowing short-term operations and maintenance contracts to be competitively bid aſter completion. INTRODUCTION Since the 2016 presidential election, public-private partnerships, or “P3s”, have received a significant bump in popularity in the United States. In June 2017, only a few months aſter taking office, President Trump rolled out a $1 trillion infrastructure plan that focuses heavily on P3s as a delivery mechanism for many types of projects. e prominent website, whitehouse.gov, went so far as to claim “e President’s plan will make America dominant by unleashing private sector capital and expertise to rebuild our cities and states.” 1 Gary Cohn, Director of the National Economic Council, added in the New York Times that “We like the template of not using taxpayer dollars to give taxpayers wins.” 2 Missing from much of the analysis were the details that are critical to all P3 projects. Private investors, of course, do not invest in these partnerships without either a financial commitment from the public sector or the ability to charge sufficient fees to those using the infrastructure being created – or perhaps both of the above – to meet their profitability threshold. If they need a commitment from the public body, they may demand such guarantees as lease payments, land donations or the transfer of revenue from assets typically held by a public agency. Municipal officials considering using a P3 approach, therefore, are leſt facing an enormously complex set of choices. Adding to the complexity, many will find it
Transcript of UNDERSTANDING PUBLIC-PRIVATE PARTNERSHIPS (P3) … Municipal Policy Journal 105 Understanding...
Illinois Municipal Policy Journal, 2017, Vol. 2, No. 1, 103-118 | © Illinois Municipal League 103
UNDERSTANDING PUBLIC-PRIVATE PARTNERSHIPS (P3) THROUGH A THEORETICAL COST COMPARISON
MATT CALCAVECCHIA, ERIN BIRKENKOPF AND JOHN FINKE PUBLIC FACILITIES GROUP
This study compares three “P3 approaches” for developing social infrastructure, such as municipal buildings, public university facilities and courthouses. It illustrates why officials should consider each approach to fully understand their financial options. The results are particularly important to understanding the benefits of an “American Approach P3,” which involves tax-exempt bonds issued by a not-for-profit organization; this allows the project to be undertaken by a development team outside of the traditional public-works process, while also allowing short-term operations and maintenance contracts to be competitively bid after completion.
INTRODUCTION
Since the 2016 presidential election, public-private partnerships, or “P3s”, have received a significant bump in popularity in the United States. In June 2017, only a few months after taking office, President Trump rolled out a $1 trillion infrastructure plan that focuses heavily on P3s as a delivery mechanism for many types of projects. The prominent website, whitehouse.gov, went so far as to claim “The President’s plan will make America dominant by unleashing private sector capital and expertise to rebuild our cities and states.”1 Gary Cohn, Director of the National Economic Council, added in the New York Times that “We like the template of not using taxpayer dollars to give taxpayers wins.”2
Missing from much of the analysis were the details that are critical to all P3 projects. Private investors, of course, do not invest in these partnerships without either a financial commitment from the public sector or the ability to charge sufficient fees to those using the infrastructure being created – or perhaps both of the above – to meet their profitability threshold. If they need a commitment from the public body, they may demand such guarantees as lease payments, land donations or the transfer of revenue from assets typically held by a public agency.
Municipal officials considering using a P3 approach, therefore, are left facing an enormously complex set of choices. Adding to the complexity, many will find it
104 Illinois Municipal Policy Journal
Understanding Public-Private Partnerships
difficult or impossible to make even basic comparisons of the financial burden associated with development approaches – or “delivery models”– available to them. Due to the fact that each project has its own political, physical or financial idiosyncrasies, comparing the costs can be a formidable task.
In May 2017, our organization, the Public Facilities Group, published a paper, titled A Theoretical Cost Comparison of P3 and Traditional Public Delivery Models Used in Developing Social Infrastructure, to offer a framework for making such comparisons. This study breaks down the financial components of the three most common delivery methods used for developing social infrastructure projects for local government agencies. The study’s intent is to answer a basic question: if it were possible to develop the same exact building using different development approaches, which development approach produces the building for the least cost to the public client?
The analysis below uses the method outlined in the above publication to evaluate options for financing social infrastructure, which refers to buildings such as city halls, public university facilities, police stations, courthouses, and other facilities that are used by public agencies for their operations. While the national conversation often revolves around traditional infrastructure projects (like the heavily publicized I-55 Managed Lane Project that the Illinois Department of Transportation is currently considering for Chicago), local governments have a strong interest in using P3s for developing smaller projects, including buildings and other public facilities.
We limit our analysis to social infrastructure for two technical reasons. First, it is less challenging to draw a fair comparison of the various approaches for financing social infrastructure than other types of infrastructure. Not only are the lease revenues received by the private partner consistent and predictable – thereby lowering ambiguity – but also the construction costs are not subject to the kind of market risks so widely associated with other kinds of infrastructure projects, such as toll roads or parking meters. Secondly, due to our expertise in the social infrastructure market, we were able to obtain accurate data to compare the costs and benefits of three different approaches.
While the information presented focuses on social infrastructure, many of the overarching concepts can be applied to traditional infrastructure projects. We revisit this topic in the conclusion section, which offers practical advice for local officials.

Illinois Municipal Policy Journal 105
Understanding Public-Private Partnerships
THE DELIVERY MODELS COMPARED
There are essentially three approaches that are often considered for the development of social infrastructure: Traditional Public Delivery; Performance Based or Availability Based P3; and a Tax-Exempt Not-for-Profit P3. The latter is often known as “the American Approach” due to its growing prevalence in this country. In the following section, we review the basic elements of these three approaches.
APPROACH 1: TRADITIONAL PUBLIC DELIVERY
Under the Traditional Public Delivery model, the public sector can select from a variety of delivery approaches, such as Design Bid Build, GC-CM/Construction Manager at Risk and Design Build, to build social infrastructure. Although we will not attempt to explain each one here, it is important to note that, while each differs in application, they can all be grouped in this category for a simple reason: delivery is typically financed using the same financing mechanism – tax-exempt General Obligation Bonds (G.O. Bonds).
G.O. Bonds offer the most advantageous rates and, therefore, may appear to always offer the lowest cost of financing. Nevertheless, there is a major downside: in a typical public delivery model, regardless of the actual approach implemented, it is common to see the construction timeline extended by 25% to 50% over a privately delivered building of comparable quality and complexity. One reason for this is the difficultly for decision makers to reach a consensus on key issues, which is particularly problematic at large governmental agencies, where decisions can drag out for many months.3 The lengthening timeline is costly, of course, extending the construction term and the capitalized interest costs. It also increases overhead and labor costs, rental-equipment expenses, and exposes the project to inflationary risks. Making matters worse, in some cases these costs are multiplied as they cascade downward through each level of subcontractors.
In the Governor George Deukmejian Courthouse: Evaluation of Cost-Effectiveness Report issued by the state of California’s Administrative Office of the Courts (AOC), the AOC determined that the privately delivered Long Beach Courthouse project had been completed nearly two years faster than the publicly delivered San Bernardino Justice Center. This is because the former’s construction process was privately managed, allowing for the various phases to overlap and be fast-tracked. Also, this project used private financing, which is not subject to the timing of state bond sales. Conversely, for the state-financed
106 Illinois Municipal Policy Journal
Understanding Public-Private Partnerships
San Bernardino Justice Center, the delay in financing proved to be a problem – so much so that, according to the report, its “construction start was delayed by nine months because of a cancelled bond sale.”4
In an audit of King County’s Ninth and Jefferson Building, the King County (Washington) Auditor’s office yielded a similar conclusion. The project was first bid as a Traditional Public Delivery (a GC/CM project), but encountered significant cost overruns resulting in a complete cessation of work. King County then restructured the project as a P3 project using the American Approach delivery model. Upon completion, an audit produced by the King County Auditor’s office found significant project savings due to the American Approach model’s use of private-sector development expertise and tax-exempt debt. According to the report, private expertise allowed for a 13% reduction to the overall cost per square foot for the building and parking garage, and “an estimated 50-percent reduction in the cost per square foot for the building itself.”5
These two cases, of course, are not necessarily representative of all projects, and it should be noted that if a public agency is regularly engaged in building projects of a certain nature (or has hired staff with significant experience), the resulting expertise should allow for a relatively fast construction timeline, reducing delays. However, the public sector’s desire for consensus decision making, potential financing delays and the involvement of multiple departments can adversely impact the construction timeline.
APPROACH 2: AVAILABILITY OR PERFORMANCE BASED P3
The second approach considered, the Availability Based P3, leverages many of the benefits of private involvement. As defined by the Performance Based Building Coalition, it has these features6:
• The private partner accepts responsibility to design, build, finance, maintain and, in some cases, operate infrastructure;
• The agreement covering this relationship is for a longer-term, usually 30 – 40 years;
• There is a firm price for the term of the agreement for capital repayment, operating and maintenance, and refurbishment; and
• There is no charge on the title required by the private partner, as they finance the sponsors’ (i.e., the client) promise to make the monthly
Illinois Municipal Policy Journal 107
Understanding Public-Private Partnerships
payments, conditional on the facility being available and performing to agreed standards or Key Performance Indicators (KPI’s).
One of the main attractions of this model is that the public client does not begin payment until construction is complete, and the client is not subject to construction or operations risk. In fact, this entity is not obligated to pay for any part of the facility that is not “available” for use. One downside is that the model uses private equity and conventional debt, which results in a higher cost of financing than tax-exempt debt.
Availability Based proponents acknowledge this point, but argue that savings from the reduced construction timeline and private-sector expertise more than offset the increase in cost. Also, the public client benefits from risk transfer and from a long-term maintenance contract, which relieves the public client from operations and maintenance management. This helps alleviate the problem of deferred maintenance concerns that has led to the erosion of quality of many public facilities.
In 2013, the Long Beach Courthouse in California became the first social infrastructure project completed using the Availability Based P3 model in the United States. The other projects using this approach are also under construction. One is UC Merced in California, which is using the approach to construct new facilities that will double the existing campus size. This project, budgeted at $1.14 billion, should be completed in 2020. The other project is the Long Beach Civic Center, for which the City of Long Beach, in partnership with the Long Beach Port Authority, has committed to the development of a $520 million civic campus.
There are several public university projects currently under construction involving social infrastructure, which are sometimes described as using Availability Based P3s. In these projects, the private developer builds any new facilities required by the deal through a ground lease arrangement with the public university. The private partner owns and operates the facility, frequently taking on operations of other existing student housing facilities, for a specified term. They collect revenue from the student rents and sometimes receive additional subsidies from the school. We have excluded these projects from our analysis for a simple reason: although the development of a new student housing facility could be classified as a “social infrastructure P3,” these projects are more accurately defined as the privatization of university student housing.

108 Illinois Municipal Policy Journal
Understanding Public-Private Partnerships
APPROACH 3: TAX-EXEMPT OR AMERICAN APPROACH P3
The third approach, the American Approach (or New American Approach or American Model), combines private-sector development expertise with the use of tax-exempt lease revenue bond debt, either 63-20 or 501(c)(3) bonds, also referred to as lease revenue bonds, which are two common forms of financing widely used by public and nonprofit organizations. Internal Revenue Service regulation grants a not-for-profit entity access to tax-exempt bonds either through conduit 501(c)(3) bonds or on behalf of 63-20 bonds for qualified activities, including the acquisition or construction of facilities for lease to local government.
This approach operates similarly to the Availability Based P3, with two important distinctions:
• Financing occurs though tax-exempt bonds issued by a not-for-profit organization, allowing the project to be developed by a private-sector development team outside of the traditional public works process, but still achieving the benefit of tax-exempt debt.
• They are short-term, competitively bid operations and maintenance contracts, as opposed to a long-term operations and maintenance package.
This approach also involves tax-exempt Lease Revenue Bonds, which, as the term implies, are issued by the non-profit and paid off by the proceeds from leasing activity. These bonds generally have a slightly higher interest rate than G.O. Bonds, which are typically used in Traditional Public Delivery. Currently, the margin is about 35 basis points.
Advocates for the American Approach argue that the increase in margin is more than made up for by reduced construction timelines and increased efficiencies of private development. The public client is also protected from construction risk. American Approach projects also cover operations and maintenance, but where they differ from the Availability Based P3 is in advocating for short-term, market-driven contracts where the pricing stays competitive and the public client can replace a management firm that is underperforming.
In 1995, The Commodore Duchess, a $7 million campus housing project for the University of Washington, became the first American Approach P3 project to begin development. This was before P3 was regarded as a widely accepted development approach. Since then, at least 37 projects, totaling over $3 billion in development costs, have been developed across the United States using the

Illinois Municipal Policy Journal 109
Understanding Public-Private Partnerships
American Approach delivery model (Figure 1), although none are located in Illinois or its neighboring states.
FIGURE 1P3 Project Locations Involving Municipal Facilities
THE MODEL COMPARISON
In comparing the three delivery models described above, it is important to emphasize that the study we reference is a theoretical comparison. While we have used data from real-world examples, every project is unique. The data inputs we have used to calculate the financial outcomes of each model are well vetted, making this study an accurate representation of how each model would comparatively perform, provided a controlled environment were possible.
Because the Long Beach Courthouse project is the only completed social infrastructure project using the Availability Based P3 model in the United States, we have used specific details of this project to determine many of our
110 Illinois Municipal Policy Journal
Understanding Public-Private Partnerships
data inputs for analyzing the theoretical Availability Based models represented in our comparison. For the Traditional Public Delivery model and the American Approach model, we have used generalized data points based on industry standards that are typical of the market instead of using specific data inputs from an actual completed project.
There are many examples of public facilities built using the American Approach – enough that we can create an accurate hypothetical project that is realistic in its data inputs. The same also applies to Traditional Public Delivery models. While the following tables provide a summary of our findings, it is important to note that in our previously mentioned Theoretical Cost Comparison study, you will find detailed explanations of how we generated the model and determined our data inputs. You can find the original report on our website listed in the reference section.
PROJECT COST ANALYSIS ABSENT OPERATIONS AND MAINTENANCE COSTS
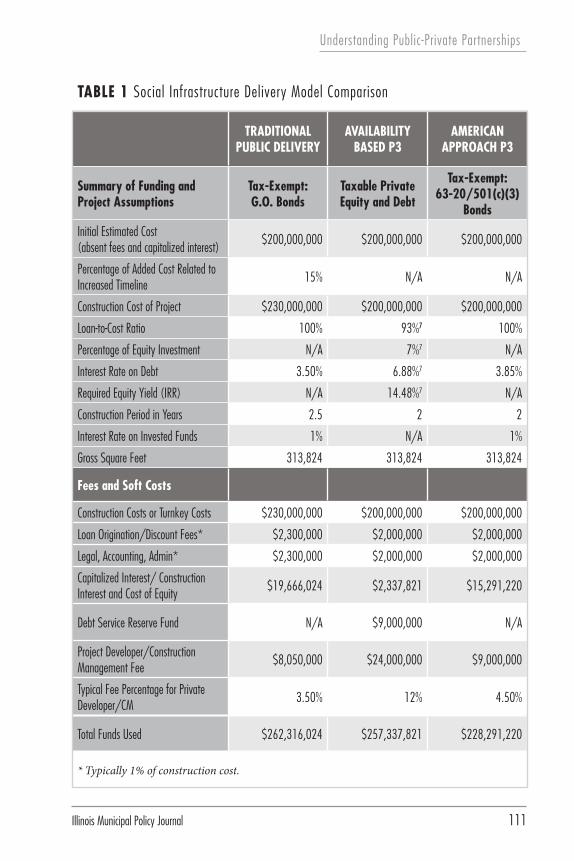
In contrasting the three models, the Traditional Public Delivery model is found to be the most expensive, more than $34 million more expensive than the American Approach. The more favorable interest rate on G.O. Bonds and the lowest private developer/construction manager fee should give the Traditional Public Delivery model the financial advantage. However, the extended development timeline increases costs by 15%, and the increase in term produces a higher capitalized interest cost.
The Availability Based P3 model is $29 million more expensive than the American Approach. Among the reasons for this are the inclusion of the $9 million debt service reserve fund, the increased developer fee of 12%, and the equity and conventional debt costs, respectively at 14.48% and 6.88%.
DEBT SERVICE
While the overall construction cost is often heavily publicized when explaining a project’s budget to city officials, voters and the media, the importance of debt service over the full term of financing is often underappreciated and can dramatically affect the project’s real cost. Our analysis is based on a term of 30 years and annual interest rate of 3.5% for Traditional Public Delivery and 3.85% for the American Approach. For the Availability Based P3, we blended the annual interest rate on debt and the return on equity achieving an annual interest rate of 7.41%.
Illinois Municipal Policy Journal 111
Understanding Public-Private Partnerships
TABLE 1 Social Infrastructure Delivery Model Comparison
TRADITIONAL PUBLIC DELIVERY
AVAILABILITY BASED P3
AMERICAN APPROACH P3
Summary of Funding and Project Assumptions
Tax-Exempt:G.O. Bonds
Taxable Private Equity and Debt
Tax-Exempt:63-20/501(c)(3)
Bonds
Initial Estimated Cost (absent fees and capitalized interest)
$200,000,000 $200,000,000 $200,000,000
Percentage of Added Cost Related to Increased Timeline
15% N/A N/A
Construction Cost of Project $230,000,000 $200,000,000 $200,000,000
Loan-to-Cost Ratio 100% 93%7 100%
Percentage of Equity Investment N/A 7%7 N/A
Interest Rate on Debt 3.50% 6.88%7 3.85%
Required Equity Yield (IRR) N/A 14.48%7 N/A
Construction Period in Years 2.5 2 2
Interest Rate on Invested Funds 1% N/A 1%
Gross Square Feet 313,824 313,824 313,824
Fees and Soft Costs
Construction Costs or Turnkey Costs $230,000,000 $200,000,000 $200,000,000
Loan Origination/Discount Fees* $2,300,000 $2,000,000 $2,000,000
Legal, Accounting, Admin* $2,300,000 $2,000,000 $2,000,000
Capitalized Interest/ Construction Interest and Cost of Equity
$19,666,024 $2,337,821 $15,291,220
Debt Service Reserve Fund N/A $9,000,000 N/A
Project Developer/Construction Management Fee
$8,050,000 $24,000,000 $9,000,000
Typical Fee Percentage for Private Developer/CM
3.50% 12% 4.50%
Total Funds Used $262,316,024 $257,337,821 $228,291,220
* Typically 1% of construction cost.

112 Illinois Municipal Policy Journal
Understanding Public-Private Partnerships
The debt-service calculation results in monthly debt-service payments of $1,177,916 for Traditional Public Delivery, $1,070,248 for the American Approach, and $1,783,862 for the Availability Based P3. The American Approach model has a higher interest rate than Traditional Public Delivery model but maintains the lowest debt service payment of $1,070,248 per month. This is due to the lower construction cost achieved through private-delivery efficiency and an interest rate close to that of the Traditional Public Delivery model. Total annual debt service is $1.29 million less than the Traditional Public Delivery model.
The Availability Based P3 model has the costliest annual finance obligation (debt service plus equity return) due to its higher blended cost of capital of 7.41%. Under the Availability Based P3model, the public agency will pay $8.56 million more per year in annual finance obligation than if they had selected the American Approach or $7.27 million more than if they had chosen the Traditional Public Delivery model.
OPERATIONS AND MAINTENANCE
Based on our debt-service calculations, it would be easy to draw the conclusion that the Availability Based P3 approach is too costly to be considered a viable option for financing public social infrastructure. Advocates of this model, however, argue that one of the primary benefits rests in cost guarantees for the operations and maintenance of the project, which helps alleviate deferred maintenance issues, thereby providing long-term savings.
As readers of this journal know, there are legitimate reasons why public entities suffer from deferred maintenance. For example, money is often channeled away from preventative maintenance projects such as roof repairs and building systems updates due to budget demands related to the immediate needs of the community.
Regardless of the cause, deferred maintenance issues are real and can result in a facility that needs to be replaced prematurely. To address deferred maintenance, the Availability Based P3 uses a long-term operations and maintenance (O&M) package that provides risk transference and guarantees to the public client. The assumption is that the private partner assumes responsibility for operating and maintaining the facility during the life of the debt, which ultimately extends the life of the facility and saves the public client money.

Illinois Municipal Policy Journal 113
Understanding Public-Private Partnerships
We have compared the O&M package used in the Long Beach Courthouse project with typical O&M costs for privately developed and managed buildings of similar complexity and size within the Los Angeles and Long Beach area. The O&M package for Availability Based projects uses an availability payment approach that factors a predetermined O&M fee into the projected costs of operations, which involves long-term maintenance, and concessionaire risk and profit. The cost of utilities and labor are directly passed through to the public agency. The courthouse’s O&M package is a 35-year contract that includes annual inflation adjustments. Due to the fact we cannot predict the direction of future cost changes, we have not included any escalations in our calculations. Our estimates for the American Approach are based on an operations and maintenance package that is competitively bid every 3-5 years.8
OPERATING AND MAINTENANCE COST PER SQUARE FOOT
To make comparisons about O&M costs for each approach, we estimated these expenses per square foot. The Building Owners and Managers Association (BOMA) tracks these costs across the United States. Using the BOMA Market Standard for high-end buildings in the Long Beach/Los Angeles area for 2010, we determined this cost per square foot to be $10.04, which is used as an input in both the American Approach and Traditional Public Delivery models.9
Under the American Approach model, the not-for-profit building owner hires a professional property management firm and employs them under short-term competitively-bid contracts. This incentivizes the firm to meet the public agency’s expectations and ensures that costs are kept at market rates. Short-term competitively bid management contracts are typical of the private sector O&M practice for privately financed, long-term assets. The public client is at risk for any major repairs or replacements to the building after the warranty period has expired; to deal with this risk, a repair and replacement reserve is often maintained. The BOMA rate mentioned above, which is the assigned O&M rate in the scenario we consider, incorporates repairs and replacements in its pricing.
While the O&M cost would not be part of the financing package for a publicly delivered project, the public agency would still be responsible for these costs. It is difficult to ascertain an accurate operations and maintenance cost for publicly operated and managed facilities. For our scenario, we have assumed that the public agency is appropriately and efficiently maintaining the building. As a result, we have assigned the Traditional Public Delivery model the BOMA

114 Illinois Municipal Policy Journal
Understanding Public-Private Partnerships
rate mentioned above. Considering the likelihood of increased costs related to deferred maintenance, however, this is likely below the actual cost, as we would expect this amount to be significantly higher in actual practice.
The Availability Based model’s cost was estimated to be $35.64 per square foot, a figure derived from the Long Beach Courthouse Project Agreement.10 In contrast to the O&M arrangement represented by the two tax-exempt models, the Availability Based P3 operations and maintenance package provides risk guarantees that hold the private partner responsible for faulty or worn-out components of the building. The premiums associated with the transfer of risk and the possibility of bearing responsibility for replacing any faulty or worn-out building components contribute to the higher cost in O&M.
A notable feature of the Availability Based approach is that the O&M contractor is typically present in the planning phase and makes suggestions on materials that would provide for optimal O&M costs over the life of the facility. Premium and higher-cost materials should produce a lower cost in operations and maintenance with a benefit derived by the public agency. However, for the first 30 years of the project, when the building is in its best condition, the savings related to maintaining the building are not realized by the public client who is also paying for the higher quality materials that are incorporated into the construction cost of the project.
Using the assumptions outlined above, therefore, we find that the Availability Based long-term O&M contract is 3.5 times more expensive than the BOMA Market Standard. The result is an annual cost difference of $8 million for our hypothetical project. Please refer to the endnote section for additional discussion of the magnitude of the cost difference.11
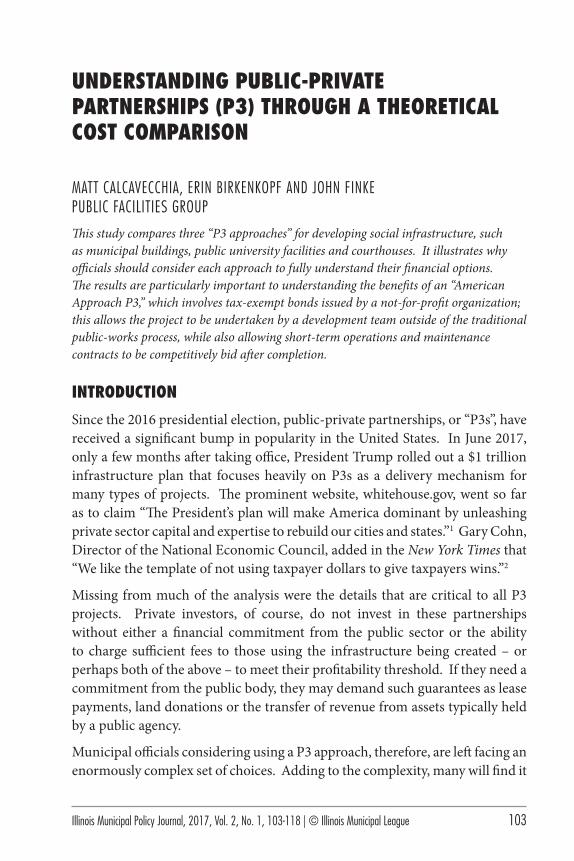
THE FINAL LEASE PAYMENTS
By combining Debt Service and O&M we establish the lease payments for each respective delivery model in our theoretical building (Figure 2). The Availability Based model has an annual lease payment of $32,591,033; the Traditional Public Delivery has an annual lease payment of $17,285,787; and the American Approach P3 has a $15,993,769 payment. In other words, the American Approach model is $1,292,018 less costly per year than the Traditional Public Delivery model and less than half the cost of the Availability Based P3, making it the least costly development model in our comparison.

Illinois Municipal Policy Journal 115
Understanding Public-Private Partnerships
CONCLUSIONS
In the hypothetical analysis evaluated above, the American Approach delivers the project at the lowest cost. Although an attempt was made to use data that reflects the most likely financial scenario, this approach still emerged as the most cost-effective when one lowers the borrowing cost for the Availability Based P3 and reducing its fees, or decreases the Traditional Public Delivery construction timeline. In short, even after evaluating scenarios with different data inputs, none of the models presented have outcomes that change their cost-performance ranking.12 In our analysis, an Availability Based P3 is always the most expensive, Traditional Public Delivery is significantly less expensive, and the American Approach is the least expensive of the three models.
Why does the American Approach outperform the other two? To summarize, the answer lies in both the differing cost of constructing the facility and its financing. When the American Approach is used, there is a significant cost savings achieved as a result of private-sector efficiency and expertise – as well as a reduced development timeline. This approach also benefits from the financial advantages of tax-exempt financing. In other words, it takes the best aspects of private development and of Traditional Public Delivery and combines them to produce a benefit for the public client.
Another factor that is important to consider is that, while a long-term O&M contract that comes with the Availability Based P3 is compelling, the private
FIGURE 2Final Lease Payments
116 Illinois Municipal Policy Journal
Understanding Public-Private Partnerships
sector does not take on financial risk without substantial fees to cover its potential future costs. Whether it is a health insurance premium or an O&M package, the customer pays for that risk transfer; in the case of O&M that cost is typically embedded in the lease payments.
Another advantage of the American Approach, especially for smaller communities, including many Midwestern municipalities, is that this model has a “bottom threshold” (i.e., minimum size) of about $20 million. On projects costing less than $20 million, the increase in financing and issuance costs are not sufficiently offset by timeline reduction and private-sector expertise. Compare this with the Availability Based P3, which has a threshold of $200 million. The dramatically lower threshold means that, for smaller communities, a police station or a city hall is an eligible project for P3 development.
Municipalities in Illinois have been slow to embrace the P3 movement for projects involving new public facilities. Although the City of Chicago has been at the forefront of the movement, particularly with regard to transportation-related projects, the movement has not gained traction as quickly as one might have expected in light of the state government’s financial difficulties. It nonetheless behooves municipal officials to consider some of the creative approaches that are becoming available.
Of course, each community faces its own set of operational, political and financial variables. Our analysis cannot account for all of these local factors, and all projects will differ. Moreover, market conditions and interest rates will certainly change in the years ahead. As a general rule, however, our results show that the American Approach deserves to be part of the “choice set” among local governments exploring private-public partnerships for the creation of social infrastructure.
Matt Calcavecchia and Erin Birkenkopf both hold the title of Vice President at Public Facilities Group. John Finke is President of Public Facilities Group.
1 For more information, please visit https://www.whitehouse.gov/blog/2017/06/08/president-trumps-plan-rebuild-americas-infrastructure.2 For more information, see New York Times article Trump Plans to Shift Infrastructure Funding to Cities, States and Business. Retrieved from https://www.nytimes.com/2017/06/03/us/politics/trump-plans-to-shift-infrastructure-funding-to-cities-states-and-business.html.
Illinois Municipal Policy Journal 117
Understanding Public-Private Partnerships
3 For more information, see Group Decision-Making: Consensus rule versus majority rule. ScienceDirect. Retrieved from http://www.sciencedirect.com/science/article/pii/S2212017313002090.4 For more information, see Administrative Office of the Courts (2014, June). Governor George Deukmejian Courthouse: Evaluation of Cost-Effectiveness Report to the California Legislature as Require by Senate Bill 75, 1. Retrieved from http://www.courts.ca.gov/documents/jc-20140627-itemD.pdf.5 For more information, see King County Auditor’s Office, Final Oversight Report on Ninth and Jefferson Building Project, 9. See Appendix 3. Retrieved from http://publicfacilitiesgroup.org/wp-content/uploads/2017/04/A-THEORETICAL-COST-COMPARISON-OF-P3-MODELS.pdf.6 For more information, see http://www.p3buildings.org/availability-payment-based-public-private-partnerships-p3-a-comparison-to-traditional-delivery-approaches/. 7 For more information, see Administrative Office of the Courts (2014, June). Governor George Deukmejian Courthouse: Evaluation of Cost-Effectiveness Report to the California Legislature as Require by Senate Bill 75, 34. Retrieved from http://www.courts.ca.gov/documents/jc-20140627-itemD.pdf.8 This ensures market rates during the 30-year term of the debt on the project. Also, the American Approach does not employ a concession agreement and the absence of concessionaire risk and profit means the facility is maintained at cost. 9 We used a BOMA report detailing individual O&M costs per square-foot for high-end real estate in the Long Beach/L.A. market in 2010. By adding together typical O&M cost categories we determined the approximate O&M for a theoretical high-end facility similar to the Long Beach Courthouse project. See appendices 6 & 7 of the original report here: http://publicfacilitiesgroup.org/wp-content/uploads/2017/04/A-THEORETICAL-COST-COMPARISON-OF-P3-MODELS.pdf. See also Long Beach Judicial Partners LLC (2010, December). Project Agreement for the Design, Construction, Financing, Operation, Maintenance and Management of the New Long Beach Court Building, 123. Retrieved from https://judicialcouncilwatcher.files.wordpress.com/2012/12/pra990-1.pdf.10 We made this calculation by adding the Base Operating Cost of $33.27 per square foot with Market Operating Charges, such as roads and grounds maintenance, exterior janitorial, elevator systems, security systems and operating insurance. See Long Beach Judicial Partners LLC (2010, December). Project Agreement for the Design, Construction, Financing, Operation, Maintenance and Management of the New Long Beach Court Building, 123. Retrieved from https://judicialcouncilwatcher.files.wordpress.com/2012/12/pra990-1.pdf.11 Stated another way, the product of subtracting $10.04 per square foot from $35.64 per square foot is $25.60 per square foot above what BOMA considers the Market Standard for the L.A./Long Beach area. The significant increase in cost is likely the product of risk premiums and profit, since the public client could conceivably pay for privately managed operations and maintenance at $10.04 per square foot. If they were to invest the remaining $8 million annually, at the end of our 30-year term they would have accrued $241 million (not including interest accrued). That is enough to build the building again.12 For additional hypothetical scenarios that reflect changes in our original assumptions, see A Theoretical Cost Comparison of P3 and Traditional Public Delivery Models Used in Developing Social Infrastructure. Retrieved from http://publicfacilitiesgroup.org/wp-content/uploads/2017/04/A-THEORETICAL-COST-COMPARISON-OF-P3-MODELS.pdf.

118 Illinois Municipal Policy Journal
Understanding Public-Private Partnerships
REFERENCESPublic Facilities Group (2017, May). A Theoretical Cost Comparison of P3 and Traditional Public Delivery Models Used in Developing Social Infrastructure. Retrieved from http://publicfacilitiesgroup.org/wp-content/uploads/2017/04/A-THEORETICAL-COST-COMPARISON-OF-P3-MODELS.pdf.
Administrative Office of the Courts (2014, June). Governor George Deukmejian Courthouse: Evaluation of Cost-Effectiveness Report to the California Legislature as Require by Senate Bill 75. Retrieved from http://www.courts.ca.gov/documents/jc-20140627-itemD.pdf.
Long Beach Judicial Partners LLC (2010, December). Project Agreement for the Design, Construction, Financing, Operation, Maintenance and Management of the New Long Beach Court Building. Retrieved from https://judicialcouncilwatcher.files.wordpress.com/2012/12/pra990-1.pdf.
King County Auditor’s Office (2011, March). Final Oversight Report on Ninth and Jefferson Building Project.