Understanding of microstructures in the HAZ of boron added ...
14
Understanding of microstructures in the HAZ of boron added modified 9Cr-1Mo steels using Gleeble thermal simulation C.R. Das, S.K.Albert # , A.K. Bhaduir and A. Klenk* Materials Development and Technology Group Indira Gandhi Centre for Atomic Research Kalpakkam 603 102, India *MPA Stuttgart, Germany # Corresponding author: Tel./Fax:+91 44 27480118/ 27480075; E-mail:[email protected] 38 th MPA-Seminar October 1 and 2, 2012 in Stuttgart 550
Transcript of Understanding of microstructures in the HAZ of boron added ...

Understanding of microstructures in the HAZ of boron added modified 9Cr-1Mo steels using Gleeble thermal simulation
C.R. Das, S.K.Albert#, A.K. Bhaduir and A. Klenk*
Materials Development and Technology Group Indira Gandhi Centre for Atomic Research
Kalpakkam 603 102, India *MPA Stuttgart, Germany
# Corresponding author: Tel./Fax:+91 44 27480118/ 27480075; E-mail:[email protected]
38th MPA-Seminar October 1 and 2, 2012 in Stuttgart
550

Abstract
Beneficial effect of boron on improving the creep properties and resistance to Type IV cracking
of the ferritic steels is now well established. It has also been shown that boron significantly
influence the ferrite to austenite transformation that takes place in the heat affected zone (HAZ)
of a weld joint of ferritic steel and this in turns alters the HAZ microstructre from those observed
in the boron free steels and thus improving the resistance to Type IV cracking. In the present
study transformation of tempered martensite to austenite for two boron containing 9Cr-1Mo
steels when subjected to different weld thermal cycles were examined. Studies using Differential
Scanning Calorimeter (DSC) carried out on one of the steels showed that both Ac1 and Ac3
temperatures increased with increase in heating rates. Heating and cooling rates in weld
thermal cycles is higher than that could be achieved using a DSC and Gleeble simulation of the
weld thermal cycle showed that transformation temperatures obtained were still higher than that
obtained using a DSC. Examination of the microstructures in the as-simulated condition and
after subjecting to heat treatment of 760°C/3h confirmed there is no grain refinement, normally
expected in a conventional boron free 9Cr-1Mo steel. Subsequently, these steels were given
isothermal heat treatment in a furnace at temperatures of 875 and 900°C for short durations of
5-60 minutes to allow different extents of transformation of tempered martensite to austenite
and their effect on the final microstructures. to fowas Stability of microstructure in boron
containing two modified 9Cr-1Mo steels was studied using Gleeble thermal simulator by varying
peak temperatures from 875 to 1000°C. Results of modified 9Cr-1Mo steel was used for
comparison purpose. Ac1 and Ac3 transformation temperatures are found to be similar as
estimated from the DSC and Gleeble thermal simulator using C strain technique. Lath
martensitic microstructure was observed in both these steels under different peak thermal
cycles. Observation of lath martensite in these heat treated specimens suggests that boron
containing modified 9Cr-1Mo steels are resistant to softening when subjected to thermal cycles
varying from 875 to 1000°C. Though fine grains were observed at the prior austenite grain
boundaries (PAGB) in 875°C/ 5 min heat treated specimen, ever finer grains were observed in
specimen with 60 min hold time at the same temperature but original PAG boundaries remained
prominent even after these thermal cycles.
1.0 Introduction
Type IV cracking in Cr-Mo steel welds is well known; it is due to poor creep properties of the
heat affected zone (HAZ), which in turn, introduces a triaxial state of stress in the welds
resulting in low ductility fracture at the intercritical / fine grained HAZ (ICHAZ /FGHAZ) of the
551

weldment with rupture life much shorter than that of the base metal under identical conditions of
creep testing.[1-3] Hence, the best way, to improve the resistance of this steel to such cracking,
is to improve the creep resistance of the HAZ of weldment made from this steel. Recent studies
of high Cr steels containing controlled addition of boron have shown that the presence of boron
in this steel improves not only creep properties of the base metal but also that of the weldment
by altering the microstructure in the HAZ.[4,5] It has been shown that boron containing steels
exhibit ‘austenite memory effect’ by which HAZ retains the prior austenite grain size of the base
metal in spite of the weld thermal cycle and associated phase transformation.[6-8] Gleeble
thermal simulation studies conducted on boron containing P91 and boron free P91 steels
indicate that during weld heating cycle, tempered martensite transforms into austenite by shear
transformation in the boron containing steel while in boron free steels, transformation is through
nucleation and growth. Thus, it appears that presence of boron influences the ferrite to austenite
transformation during weld thermal cycle and thus improves the resistance to Type IV cracking
of the steel. Hence, it is very much essential to understand the microstructure evolutions in the
HAZs under actual welding thermal cycles. On the other hand, the size of the individual HAZ in
actual weldment is very small. Therefore, physical simulation of specimen in a furnace or in
Gleeble is commonly used to understand microstructure and their effect on mechanical
properties. [9-13]
The physical simulation of HAZ in a furnace at a pre-set temperature can produce more uniform
microstructure over a large specimen. But, actual weld thermal cycle cannot be simulated under
furnace heating / cooling. In order to understand microstructure evolution in boron containing
modified 9Cr-1Mo steels (P91B) under actual weld heating and cooling conditions, Gleeble
thermal simulation can be employed. Therefore, the objective of the present studies is to
investigate the effect of peak temperature on microstructure in Gleeble simulated P91B steels.
Further, effect of hold time on microstructure evolution in P91 and P91B at heat treatment
temperature of 875 and 900°C is also studied in this paper.
2.0 Experimental procedure
Two boron containing modified 9Cr-1Mo steel plates, received from M/s MIDHANI – India, were
designated as P91B1 and P91B2 respectively and were used for the present study. P91B1 and
P91B2 steels were normalized at 1323 and 1373 K for 1h, respectively followed by tempering at
1033 K for 3h and then cooled in furnace. The Ac1 and Ac3 transformation temperatures for
P91B1 and P91B2 steels were estimated using differential scanning calorimetry (DSC) at a
552

heating of 0.016 to 1.6 K s-1. For Gleeble thermal simulation, cylindrical specimens of φ10×100
mm2 were subjected to thermal cycle at peak temperatures of 900, 950, and 1000°C. Following
heating cycle was adopted for this simulation: Heating to 200°C at a heating rate of 20°C / s and
holding at this temperature for 10 s followed by heating to the peak temperature at a heating
rate of 44°C / s. To simulate the preheating condition, commonly used during welding, for this
class of steel, specimens were held at 200°C. The cooling cycle followed is: cooling down to
350°C from the peak temperature at a cooling rate of 7.5°C / s and from 350 to 250°C at 2.5°C /
s followed by natural cooling. During simulation of weld thermal cycle, the variation in diameter
of Gleeble specimens were monitored using LVDT attached to the specimens. Metallographic
specimens were extracted from the center of the thermally simulated Gleeble specimens and
same were subjected to simulated PWHT, followed by polishing up to 0.25 µm using diamond
slurry.
In order to understand the effect of hold time (from 5 to 60 min) on microstructure, coarse PAG
of P91B1 and P91 were used for simulation heat treatment at 875 and 900°C in a furnace.
These steels were previously subjected to normalizing heat treatment at 1150°C for 1h followed
by tempering at 760°C for 3h. Polished specimens were observed under an Optical Microscope
(OM) and scanning electron microscope (SEM) after etching with Villella’s reagent.
3.0 Results and Discussion
3.1 Material
Chemical compositions of two steels used in this study are given in Table 1. From the table, it is
evident that P91B1 steel contains 100 ppm of boron and nitrogen content in the steel is
maintained very low (20 ppm). On the other hand, P91B2 steel contains 60 ppm of boron and
110 ppm of nitrogen. Low nitrogen content is maintained to avoid formation of boron nitride in
the steel, which otherwise will significantly reduces the availability of boron for microstructural
modification and also adversely affect the mechanical properties.[14]
3.2 Transformation temperatures
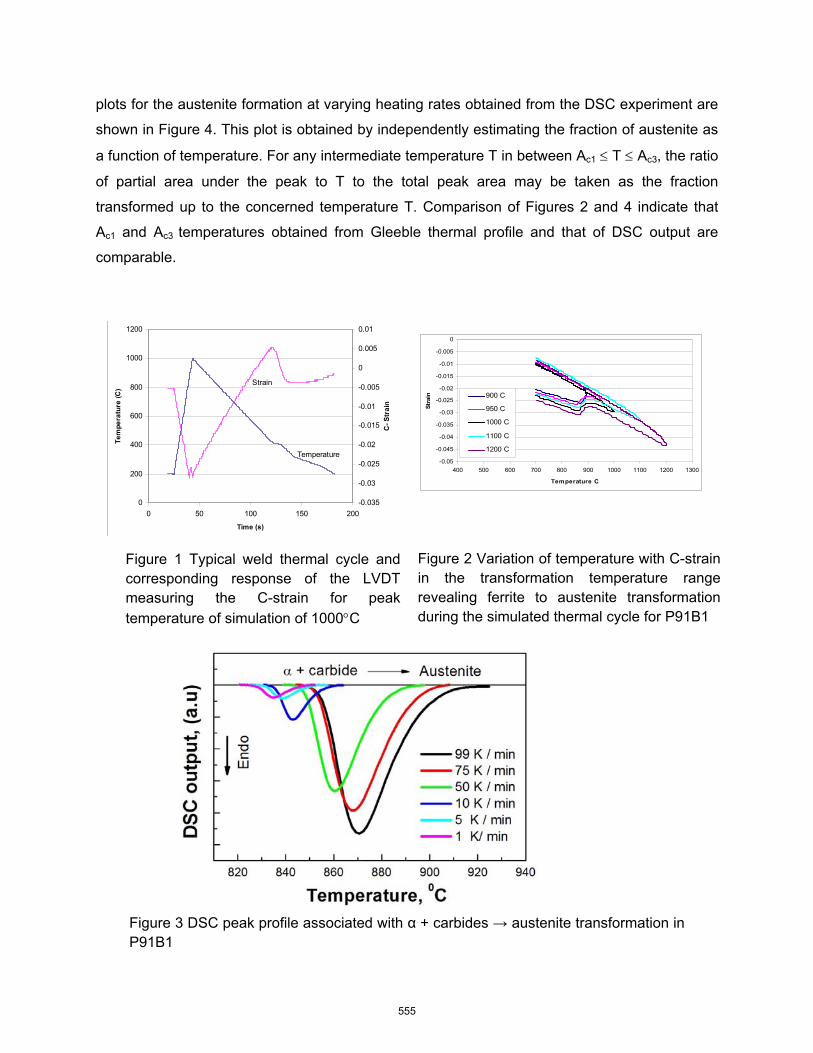
A typical weld thermal cycle for simulation of HAZ microstructure for a peak temperature of
1000°C along with the corresponding changes in the diameter of the specimen measured using
LVDT is shown in Figure 1. During heating part of the thermal cycle, the reading recorded by
LVDT decreases, however when the ferrite to austenite transformation begins, there is an
553
increase in the LVDT reading with increase in temperature as shown by a kink in the curve
close to the end of the heating cycle. With the completion of transformation, the LVDT reading
decreases again with increase in temperature. Subsequently, during cooling part of the weld
thermal cycle, LVDT reading increases with decrease in temperature till the specimen reaches
Ms temperature. Both Ms and Mf temperatures can be estimated from the LVDT reading vs. time
and temperature vs. time curves.
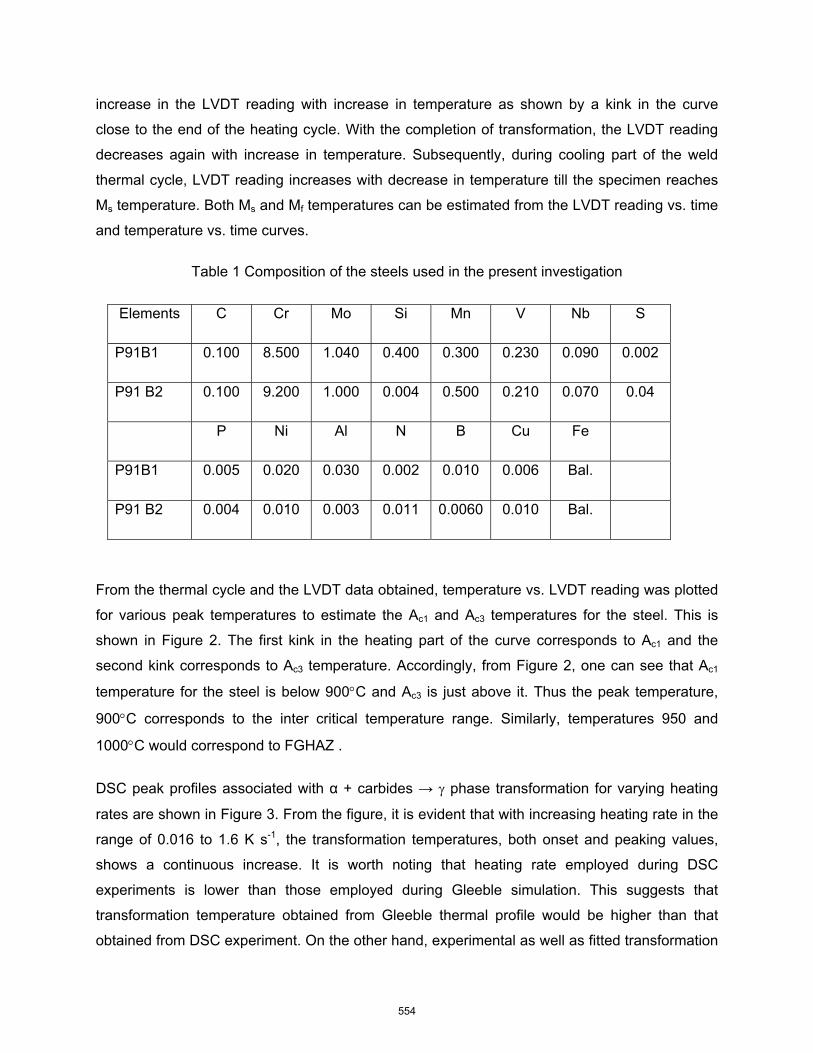
Table 1 Composition of the steels used in the present investigation
Elements C Cr Mo Si Mn V Nb S
P91B1 0.100 8.500 1.040 0.400 0.300 0.230 0.090 0.002
P91 B2 0.100 9.200 1.000 0.004 0.500 0.210 0.070 0.04
P Ni Al N B Cu Fe
P91B1 0.005 0.020 0.030 0.002 0.010 0.006 Bal.
P91 B2 0.004 0.010 0.003 0.011 0.0060 0.010 Bal.
From the thermal cycle and the LVDT data obtained, temperature vs. LVDT reading was plotted
for various peak temperatures to estimate the Ac1 and Ac3 temperatures for the steel. This is
shown in Figure 2. The first kink in the heating part of the curve corresponds to Ac1 and the
second kink corresponds to Ac3 temperature. Accordingly, from Figure 2, one can see that Ac1
temperature for the steel is below 900°C and Ac3 is just above it. Thus the peak temperature,
900°C corresponds to the inter critical temperature range. Similarly, temperatures 950 and
1000°C would correspond to FGHAZ .
DSC peak profiles associated with α + carbides → γ phase transformation for varying heating
rates are shown in Figure 3. From the figure, it is evident that with increasing heating rate in the
range of 0.016 to 1.6 K s-1, the transformation temperatures, both onset and peaking values,
shows a continuous increase. It is worth noting that heating rate employed during DSC
experiments is lower than those employed during Gleeble simulation. This suggests that
transformation temperature obtained from Gleeble thermal profile would be higher than that
obtained from DSC experiment. On the other hand, experimental as well as fitted transformation
554
plots for the austenite formation at varying heating rates obtained from the DSC experiment are
shown in Figure 4. This plot is obtained by independently estimating the fraction of austenite as
a function of temperature. For any intermediate temperature T in between Ac1 ≤ T ≤ Ac3, the ratio
of partial area under the peak to T to the total peak area may be taken as the fraction
transformed up to the concerned temperature T. Comparison of Figures 2 and 4 indicate that
Ac1 and Ac3 temperatures obtained from Gleeble thermal profile and that of DSC output are
comparable.
Temperature
Strain
0
200
400
600
800
1000
1200
0 50 100 150 200
Time (s)
Tem
pera
ture
(C)
-0.035
-0.03
-0.025
-0.02
-0.015
-0.01
-0.005
0
0.005
0.01
C- S
trai
n
Figure 1 Typical weld thermal cycle and corresponding response of the LVDT measuring the C-strain for peak
temperature of simulation of 1000°C
Figure 2 Variation of temperature with C-strain in the transformation temperature range revealing ferrite to austenite transformation during the simulated thermal cycle for P91B1
-0.05
-0.045
-0.04
-0.035
-0.03
-0.025
-0.02
-0.015
-0.01
-0.005
0
400 500 600 700 800 900 1000 1100 1200 1300
Temperature C
Stra
in 900 C
950 C
1000 C
1100 C
1200 C
Figure 3 DSC peak profile associated with α + carbides → austenite transformation in P91B1
555

Figure 4 Transformation plots for different heating rates in P91B1
3.3 Microstructure
The as-simulated microstructure of P91B1 steel for different peak temperatures is shown in
Figure 5 along with normalized and tempered microstructure of the steel (Figure 5a). Figure 5b
is the microstructure after simulation with a peak temperature of 900°C and it consists of a
mixture of tempered martensite and fresh un-tempered martensite, which is formed from the
transformed austenite. As the Ac3 temperature is above 900°C, only partial transformation of
tempered lath martensite to austenite has taken place. However for peak simulation
temperatures of 950 and 1000°C, the microstructure is predominantly lath martensitic. The
comparison of simulated microstructure with the normalized and tempered microstructure shows
that the PAGS in both the cases are comparable. No noticeable grain refinement has taken
place during simulation. Commonly, grain refinement occurs in modified 9Cr-1Mo steel, when
material experiences peak temperature at inter critical as well as just above Ac3 temperature [1-
3]. Microstructure of the as simulated specimens is more clearly revealed under the SEM as
shown in Figure 6. Figure 6 (a) is the photomicrograph for peak simulation of 900°C which is a
mixture of both tempered and freshly formed un-tempered martensite. For peak simulation of
950°C, (Fig. 6b) transformation is almost complete; but not all carbides have dissolved in the
matrix. For peak simulation of 1000°C, which is shown in Figure 6c, in addition to
transformation, dissolution of precipitates is also complete. However, it is important to notice
that the PAGS has not changed for each of the peak temperatures of simulation.
556
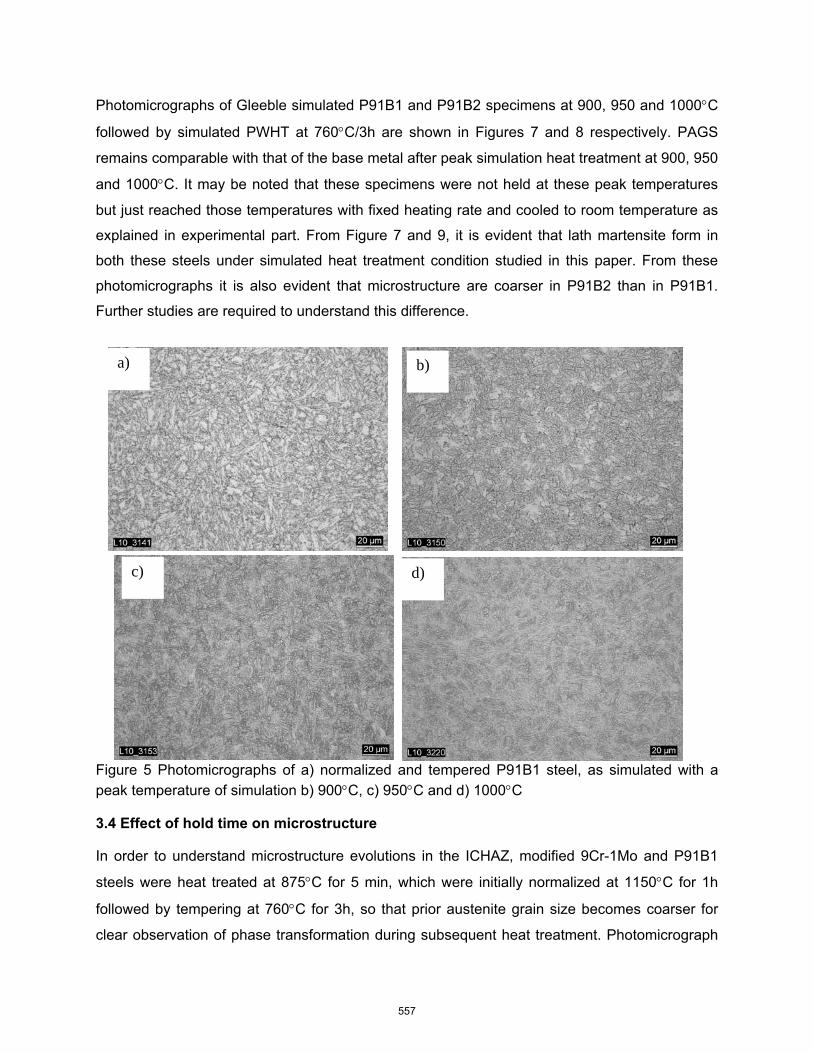
Photomicrographs of Gleeble simulated P91B1 and P91B2 specimens at 900, 950 and 1000°C
followed by simulated PWHT at 760°C/3h are shown in Figures 7 and 8 respectively. PAGS
remains comparable with that of the base metal after peak simulation heat treatment at 900, 950
and 1000°C. It may be noted that these specimens were not held at these peak temperatures
but just reached those temperatures with fixed heating rate and cooled to room temperature as
explained in experimental part. From Figure 7 and 9, it is evident that lath martensite form in
both these steels under simulated heat treatment condition studied in this paper. From these
photomicrographs it is also evident that microstructure are coarser in P91B2 than in P91B1.
Further studies are required to understand this difference.
Figure 5 Photomicrographs of a) normalized and tempered P91B1 steel, as simulated with a
peak temperature of simulation b) 900°C, c) 950°C and d) 1000°C
3.4 Effect of hold time on microstructure
In order to understand microstructure evolutions in the ICHAZ, modified 9Cr-1Mo and P91B1
steels were heat treated at 875°C for 5 min, which were initially normalized at 1150°C for 1h
followed by tempering at 760°C for 3h, so that prior austenite grain size becomes coarser for
clear observation of phase transformation during subsequent heat treatment. Photomicrograph
a)
c) d)
b)
557

of as-simulated (875°C) specimens of both these steels normalized at 1150°C for 1h followed by
tempering at 760°C for 3h are shown in Figure 9(a and b). From Figure 9, it is evident that the
microstructure consists of fine grains without having lath morphology in modified 9Cr-1Mo steel
and lath morphology within the original grain in P91B, after 875°C/5 min heat treatment. Phase
transformation was predominantly observed at the triple point junction in P91B1 (Figure 9(b))
compared to random transformation in P91 under similar heat treatment condition. This
observation suggests that phase transformation is sluggish in P91B1 than in P91. Therefore, it
can be speculated that even for zero hold time at this simulation temperature, microstructure
could have been over tempered in P91 steel. Hence, hold time experiments were continued only
for P91B1 specimens.
a) b)
c)
Figure 6 SEM microsgraphs of Gleeble simulated P91B1 specimenswith peak temperatures of a) 900°C, b) 950°C and c) 1000°C
558

(a) (b)
(c)
Fig. 8 Microstructures of a) normalized and tempered P91B2 steel with a peak temperature
of simulation b) 900°C, c) 950°C and d) 1000°C
(a) (b
(c)
Fig. 7 Microstructures of a) normalized and tempered P91B1 steel, as simulated with a
peak temperature of simulation b) 900°C, c) 950°C and d) 1000°C
559

Fig.10 SEM photomicrograph of normalized and tempered P91B1 steel after holding 20min (b) 40 min and (c) 60 min at peak simulation of temperature 875°C
With increase in hold time at the peak temperature, the region, which transformed into austenite
during heating above Ac1 temperature and transformed back to martensite during cooling,
increased. These results suggest that the transformation behavior in these two steels is
different. It also suggests that boron delays the austenite nucleation as a result; it takes long
PAGB
20 µm
Transformed region
(b)
PAGB
20 µm
Transformed region
Un-Transformed region
(b)
20 µm
Transformed region
(c)
PAGB
Transformed
Over tempered
20 µm
(a)
Un-Transformed region
Transformed region
PAGB
(b)
20 µm
Fig.9 Microstructures a) P91steel and b) P91B1 after hold time of 5 min at peak temperature ofsimulation 875°C
560

hold time for complete transformation in to austenite. Kimmins and Gooch (1983) also reported
austenite nucleation at the PAGB as soon as peak temperature reaches Ac1 temperature. Even
P91B1 specimen which was heat treated at 900°C/5min, showed presence of fine grains inside
the PAG. But PAG boundaries still exist in as-simulated condition, as evident in Figure 11(a).
During simulated tempering at 760°C/3h, reconstituted original grains, with lath martensite in it,
were evident. With progress in hold time at 900°C, austenite grain which formed during heating,
coarsen, but original PAGB remain evident (Figure 12(a) and (b)). During cooling, lath
martensite formed as evident from the as-simulated micrographs (Figure 11(b)). This clearly
suggests that presence of boron helps in remembering the original grain boundaries. This
phenomenon is known as memory effect.[6] Though austenite grains coarsen in P91 steel at
900°C/5min, martensite formed during cooling are not prominent as it was in P91B1 under
similar heat treatment condition (Figure 13).
Fig. 12 SEM photomicrographs of as-simulated P91B1 specimen heat treated at 900°C (a) 20min and (b) 40 min
(a) (b)
Fig. 11 SEM photomicrograph of (a) as-simulated (900°C/5 min.) P91B1 specimenand (b) optical photomicrograph of as simulated and simulated PWHT (760°C/3h)
10 µm 50 µm
(a) (b)
561

Fig. 13 SEM photomicrograph of as-simulated (900°C/5 min.) P91 specimen
4.0 Summary
Boron additions in modified 9Cr-1Mo steel influence ferrite to austenite transformation,
consequently inhibits grain refinement in inter critical region for short duration of hold time. With
increase in hold time, austenite grains coarsen within the original prior austenite, which is
prominently delineated in the micrograph. This suggests that boron helps in memorizing the
original PAGB in modified 9Cr-1Mo steel. On the other hand, microstructure gets refined in P91,
when experienced IC heat treatment.
References
[1] J. Francis, W. Mazur and H.K.D.H. Bhadeshia, Mater. Sci. Tech., 2006, Vol. 22, pp. 1387-
1395
[2] T. Kojima, K. Hayashi and Y. Kajita, ISIJ Int., 1995, Vol. 35, pp. 1284-1290
[3] V. Gaffard, A.F. Gourgues-Lorenzon and J. Besson, ISIJ Int., 2005, Vol. 45, pp. 1915-
1924
[4] F. Abe, Mater. Sci. Eng. A, 2001, Vol. 770, pp. 319-321
[5] P. Mayar, Ph.D. thesis, University of Graz, 2007
[6] T. Shirane, S.Tsukamoto, K.Tsuzaki, Y. Adachi, T. Hanamura, M. Shimizu and F. Abe, IIW
Doc. IX-2246-07, IX-C-1004-07
562
[7] S.T. Kimmins and D.J. Gooch, Metal Sci., 1983, Vol. 17, pp. 519-521
[8] G. Thomas and Y.L. Chen, Metall Mater. Trans. A, 1981, Vol. 12, pp. 933-950
[9] R. Wu, R. Sandstrom and F. Seitisleam, J. Eng. Mater. Tech., 2004, Vol. 126, pp. 87-94.
[10] G. Eggeler, A. Ramteke, M. Coleman, A. Burblies, G. Peter, J. Hald, C. Jefferey, J.
Rantala, M. DeWitte and R. Mohrmann, Int. J. Pressure Vessels Piping, 1994, Vol. 60, pp.
237-257.
[11] S.K. Albert, M. Matsui, T. Watanabe, H. Hongo, K. Kubo and M. Tabuchi, ISIJ Int., 2002,
Vol. 42 pp.1497-1504.
[12] J. Hald and E.M. Lund, Int. Conf. on the Joining of materials JOM-6ed. By O.A. Erhayem,
The European Institute for the Joining of Materials, DTU Helsingor, Denmark, 1993, pp.
317-321.
[13] H. Cerjak, E. Letofsky, F. Schuser, Fourth Int. Conf. on Trends in Welding Research, ASM
International, Metals Park, OH, 1995, pp. 1633-1640.
[14] K. Sakuraya, H. Okada and F. Abe, ISIJ Int., 2006, Vol. 46, pp. 1712-1719
563


![Module 4 Design for Assemblymy.quantum.edu.in/docs/haz,_defects1.pdf · and, is susceptible to produce crack-sensitive microstructures during fusion welding [1]. The class of steel](https://static.fdocuments.us/doc/165x107/5eb59981cd7af9302d7998ad/module-4-design-for-defects1pdf-and-is-susceptible-to-produce-crack-sensitive.jpg)