Understanding International Trade Conference...International Trade Overview Mala Kline....
104
Understanding International Trade Conference Wednesday, November 14, 2018 8:30 a.m. – 3:30 p.m. 1
Transcript of Understanding International Trade Conference...International Trade Overview Mala Kline....
Understanding International Trade ConferenceWednesday, November 14, 2018
8:30 a.m. – 3:30 p.m.
1
International Trade Overview
Mala KlineInternational Trade Macro Analysis Branch
International Trade ConferenceNovember 14, 2018
2International Trade Overview
The U.S. Census Bureau is the official
source for U.S. export and import
goods statistics and is responsible
for issuing regulations governing the
reporting of all export shipments
from the United States.
U.S. Census Bureau
3International Trade Overview
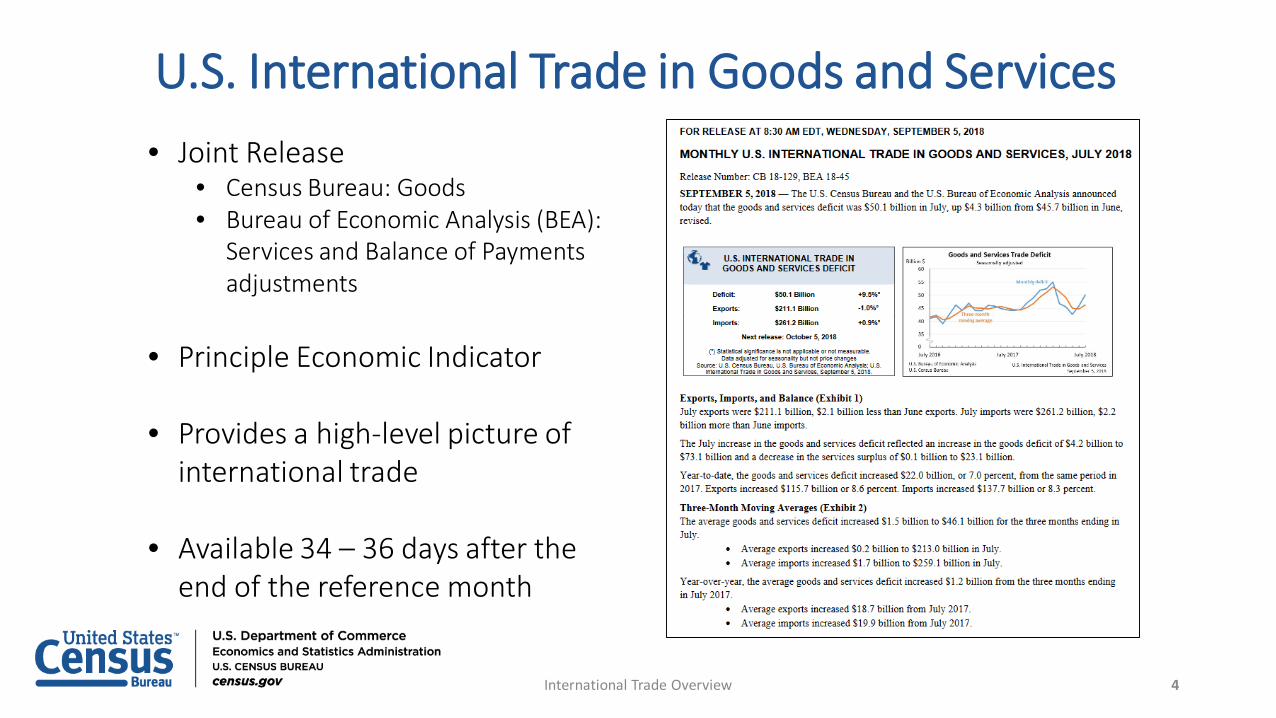
U.S. International Trade in Goods and Services• Joint Release
• Census Bureau: Goods• Bureau of Economic Analysis (BEA):
Services and Balance of Payments adjustments
• Principle Economic Indicator
• Provides a high-level picture of international trade
• Available 34 – 36 days after the end of the reference month
4International Trade Overview
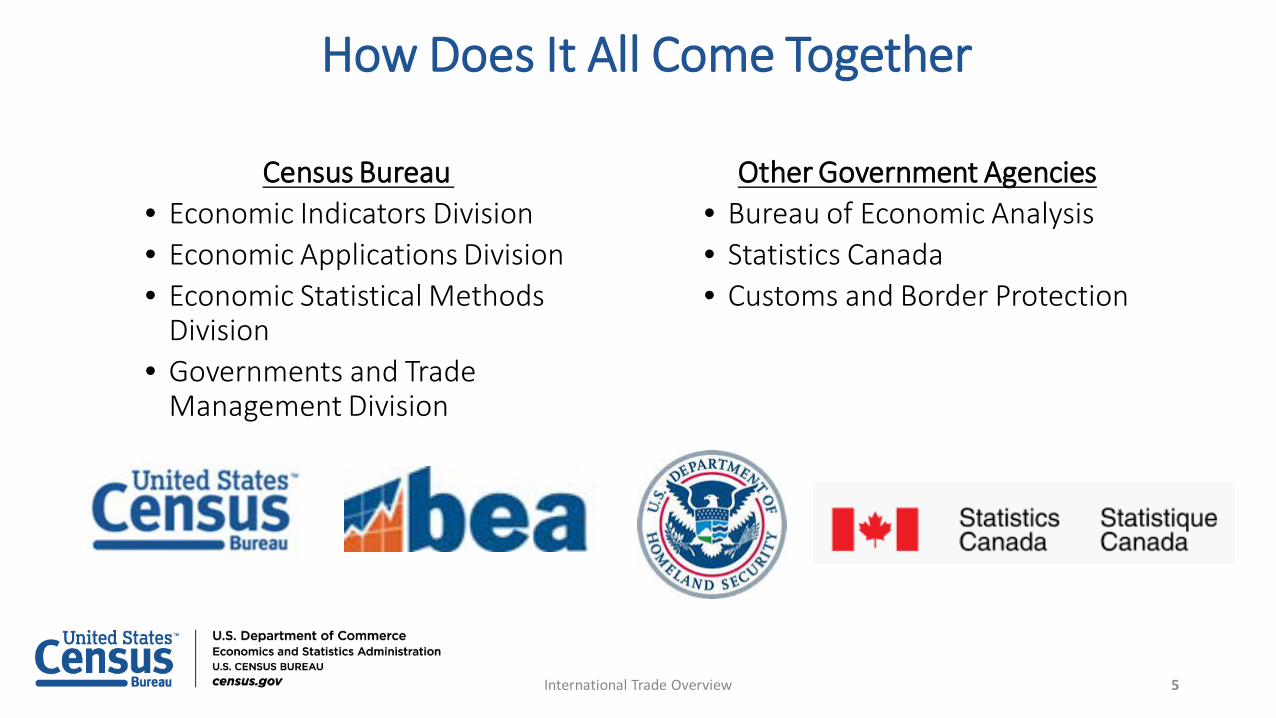
How Does It All Come Together
Census Bureau• Economic Indicators Division• Economic Applications Division• Economic Statistical Methods
Division• Governments and Trade
Management Division
Other Government Agencies• Bureau of Economic Analysis• Statistics Canada• Customs and Border Protection
5International Trade Overview
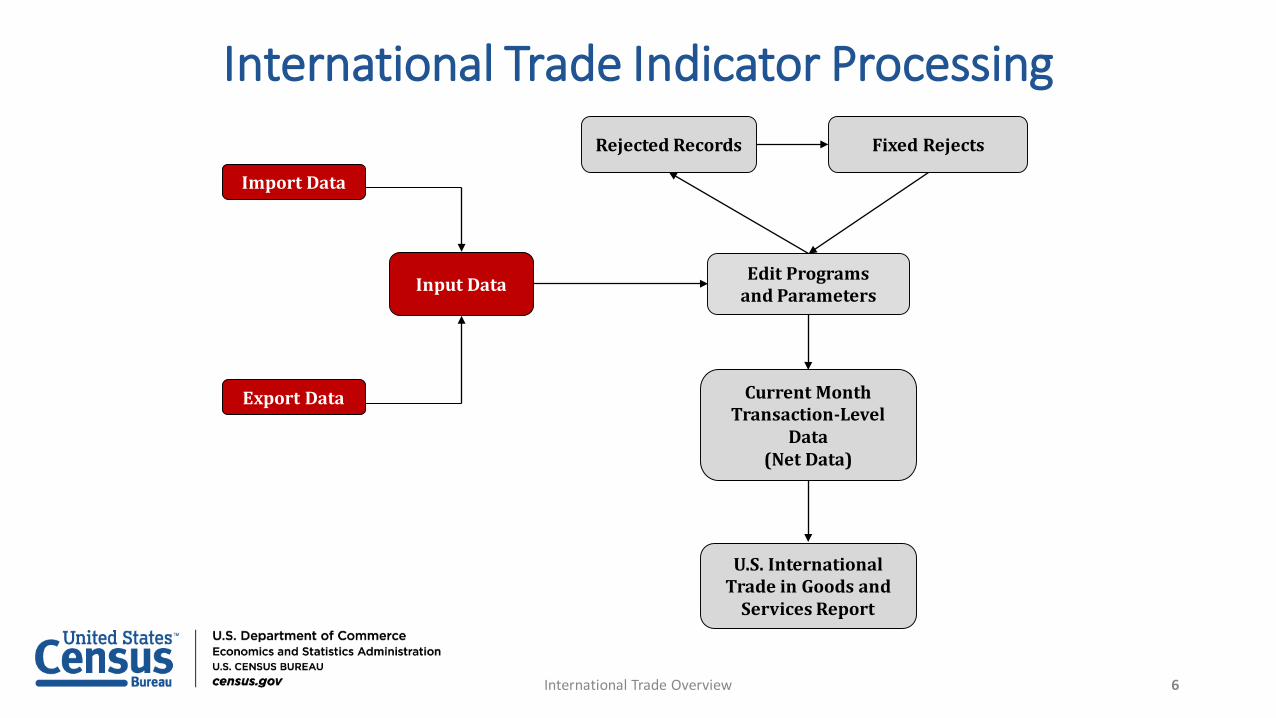
U.S. International Trade in Goods and
Services Report
Current Month Transaction-Level
Data(Net Data)
Edit Programsand Parameters
Fixed RejectsRejected Records
Input Data
Export Data
Import Data
International Trade Indicator Processing
6International Trade Overview
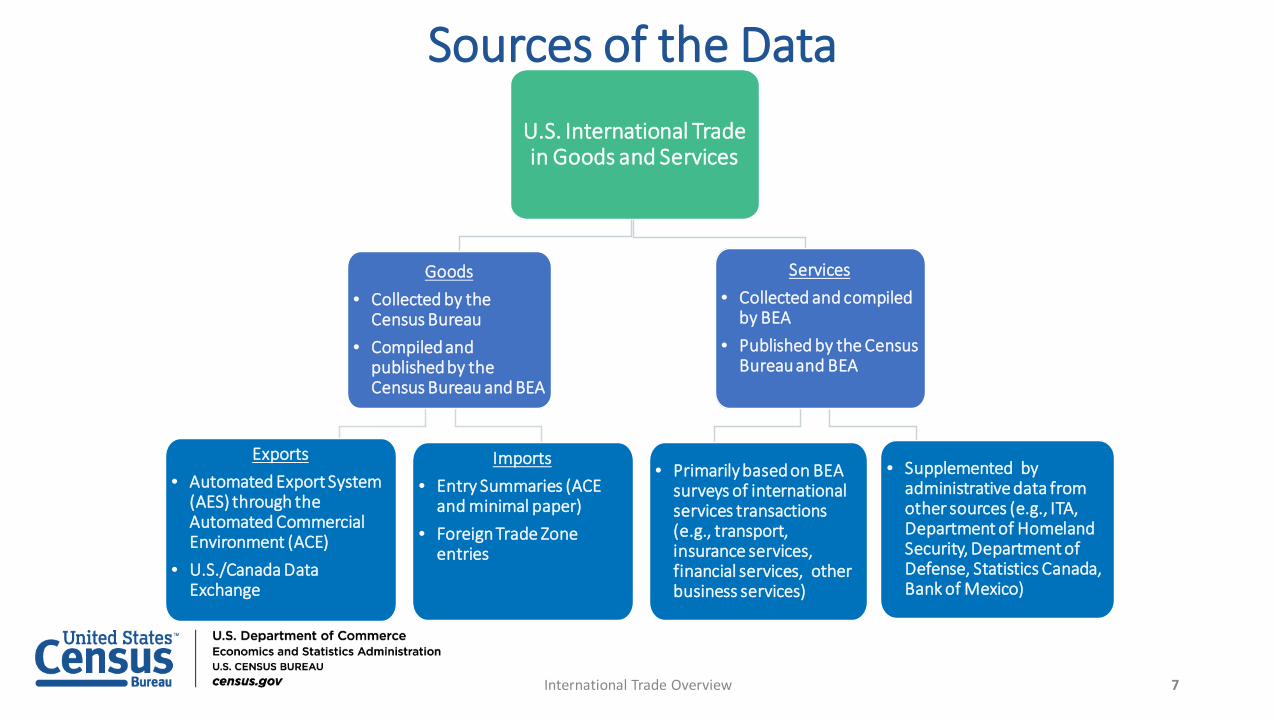
Sources of the DataU.S. International Trade in Goods and Services
• Primarily based on BEA surveys of international services transactions (e.g., transport, insurance services, financial services, other business services)
Exports• Automated Export System
(AES) through the Automated Commercial Environment (ACE)
• U.S./Canada Data Exchange
Imports• Entry Summaries (ACE
and minimal paper)• Foreign Trade Zone
entries
Goods• Collected by the
Census Bureau• Compiled and
published by the Census Bureau and BEA
Services • Collected and compiled
by BEA• Published by the Census
Bureau and BEA
• Supplemented by administrative data from other sources (e.g., ITA, Department of Homeland Security, Department of Defense, Statistics Canada, Bank of Mexico)
7International Trade Overview
Current Month Transaction-Level
Data(Net Data)
Edit Programsand Parameters
Fixed RejectsRejected Records
Input Data
Export Data
Import Data
International Trade Indicator Processing
U.S. International Trade in Goods and
Services Report
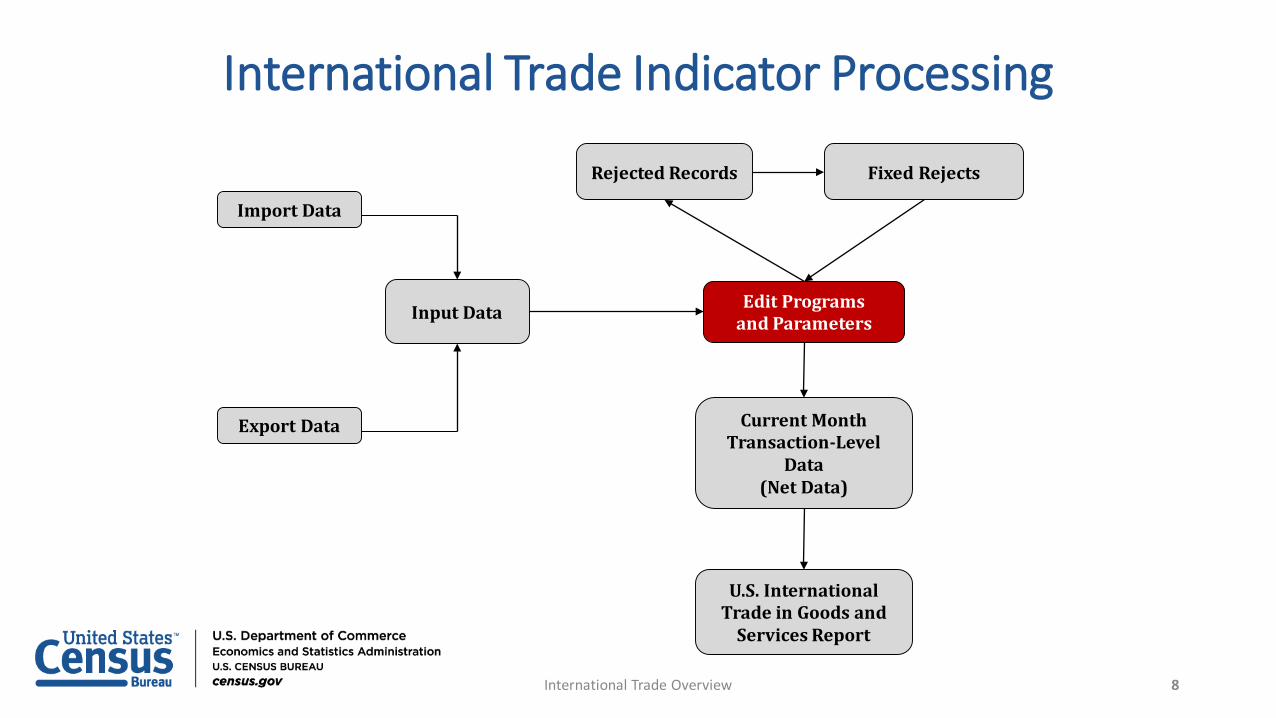
8International Trade Overview
Current Month Transaction-Level
Data(Net Data)
Edit Programsand Parameters
Fixed RejectsRejected Records
Input Data
Export Data
Import Data
International Trade Indicator Processing
U.S. International Trade in Goods and
Services Report
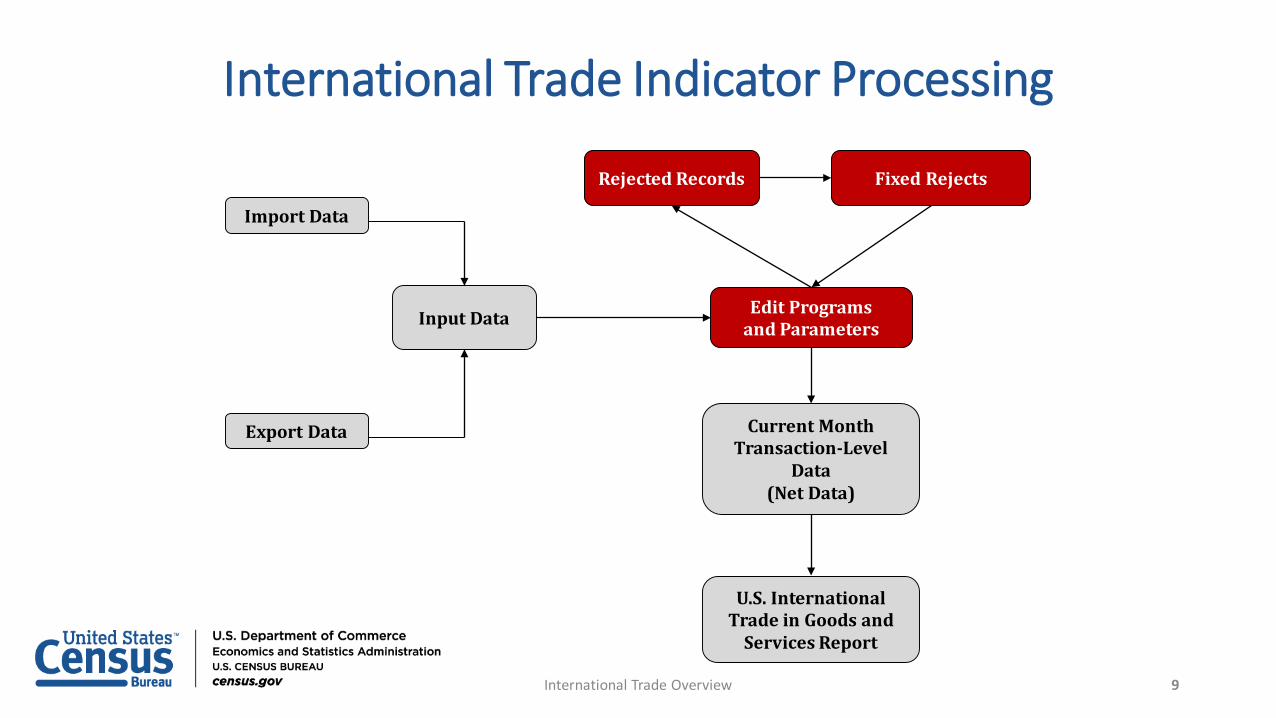
9International Trade Overview
Current Month Transaction-Level
Data(Net Data)
Edit Programsand Parameters
Fixed RejectsRejected Records
Input Data
Export Data
Import Data
International Trade Indicator Processing
U.S. International Trade in Goods and
Services Report
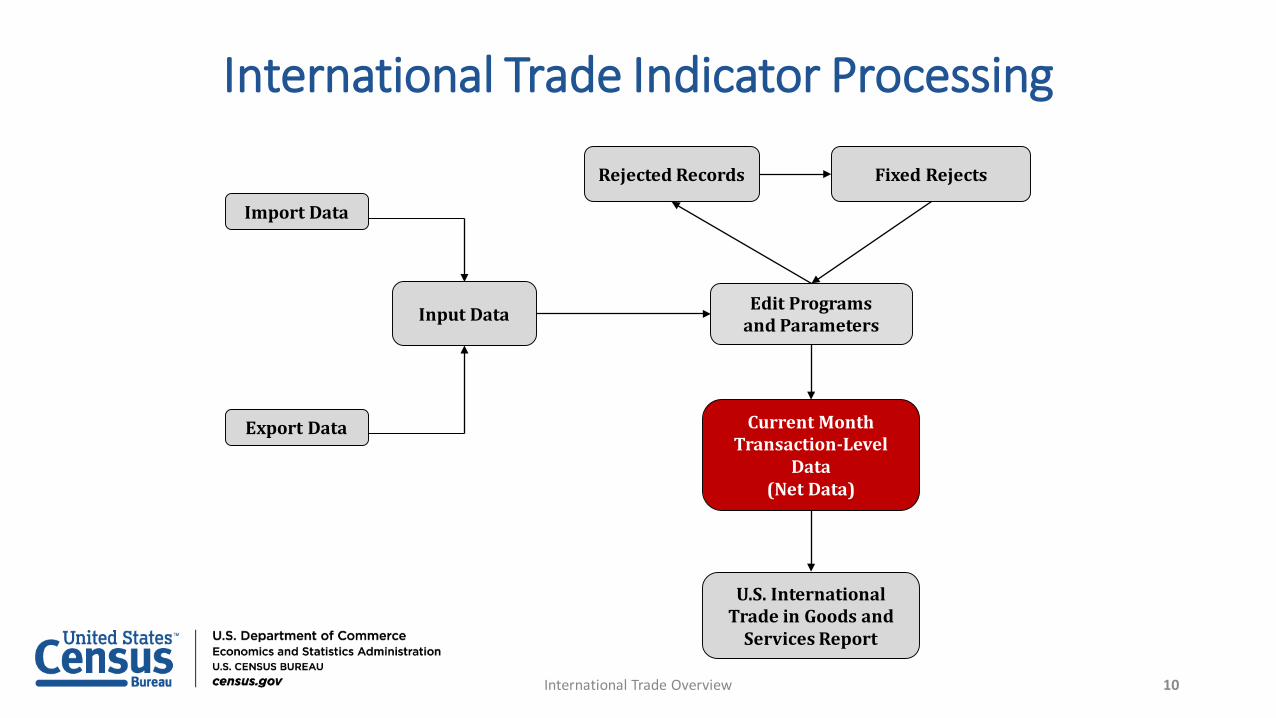
10International Trade Overview
Current Month Transaction-Level
Data(Net Data)
Edit Programsand Parameters
Fixed RejectsRejected Records
Input Data
Export Data
Import Data
International Trade Indicator Processing
U.S. International Trade in Goods and
Services Report
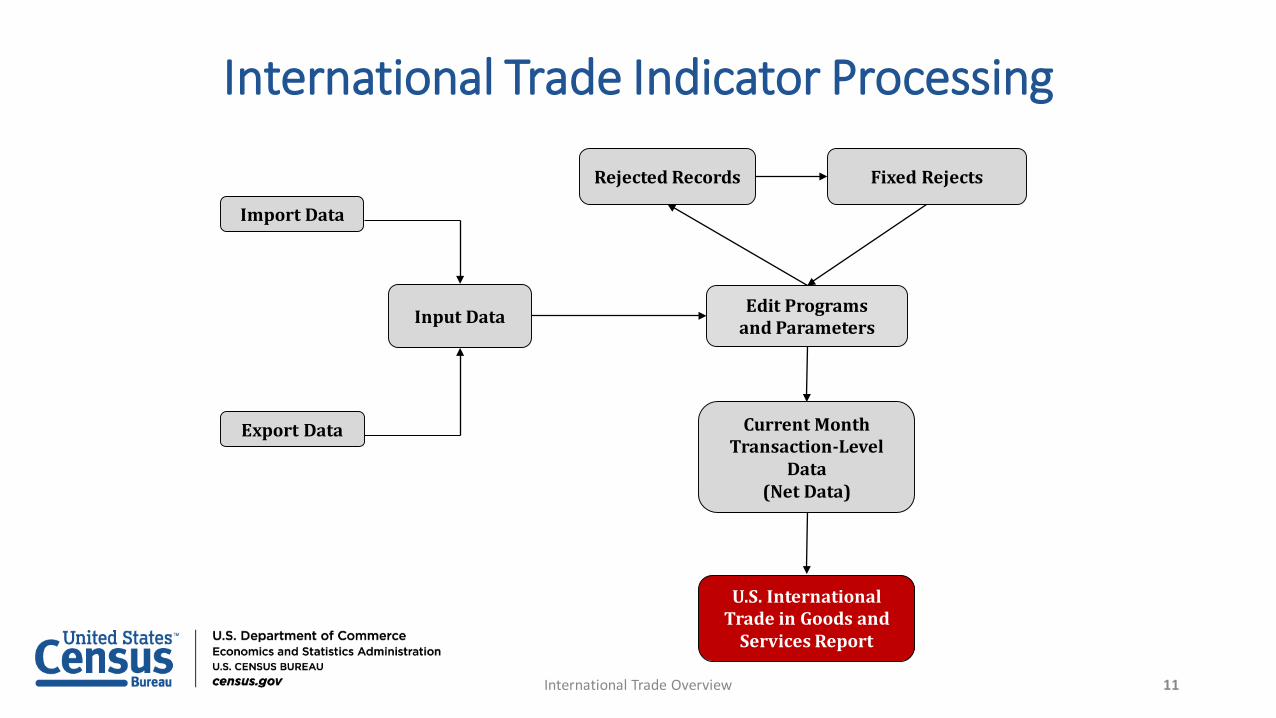
11International Trade Overview
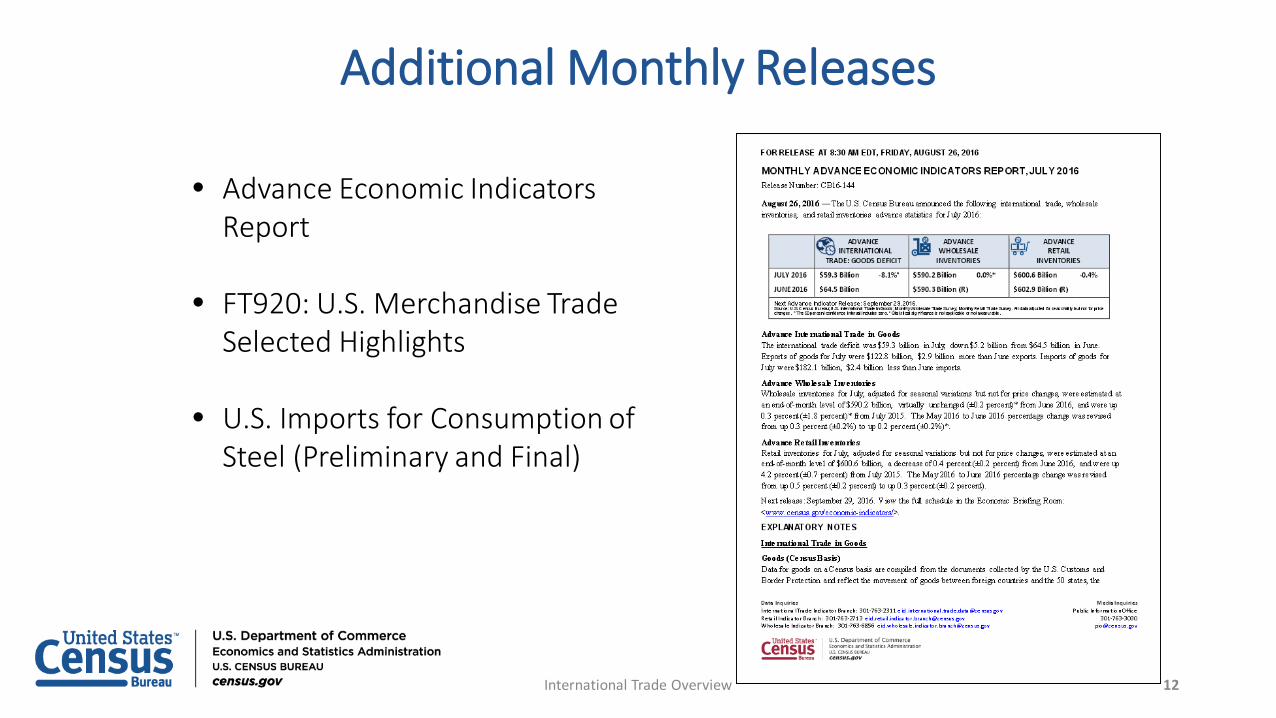
• Advance Economic Indicators Report
• FT920: U.S. Merchandise Trade Selected Highlights
• U.S. Imports for Consumption of Steel (Preliminary and Final)
Additional Monthly Releases
12International Trade Overview
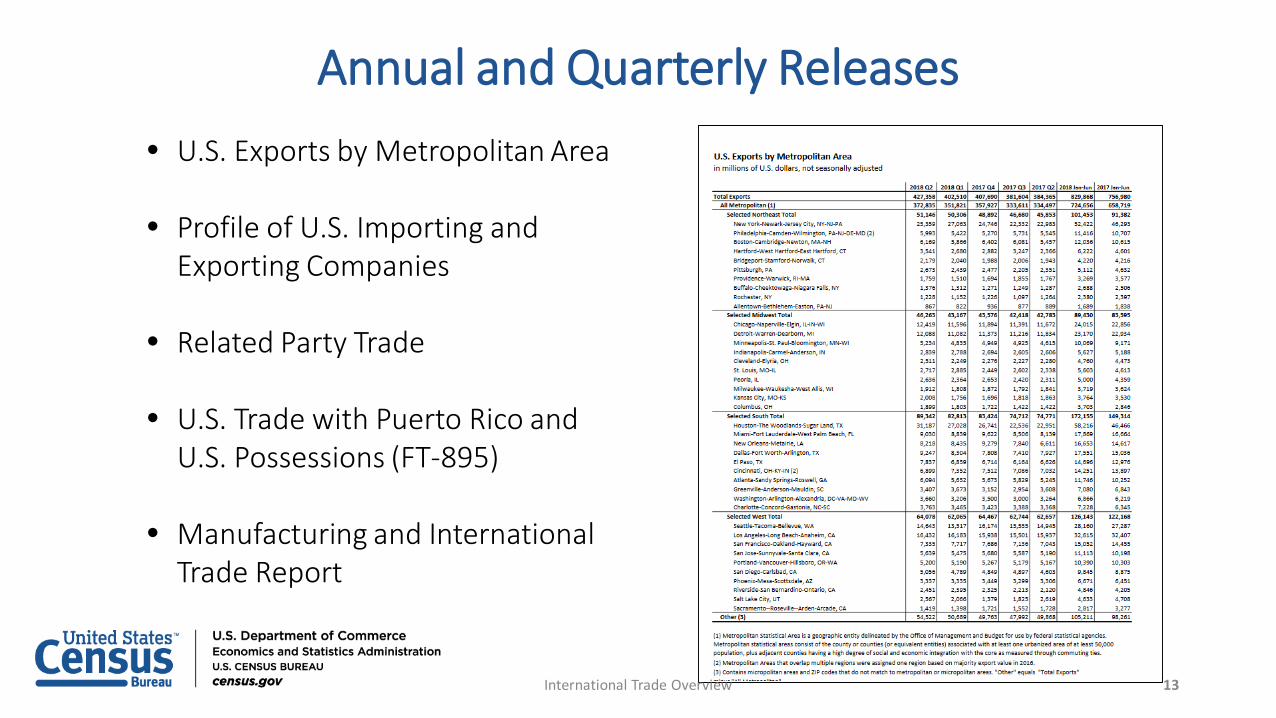
• U.S. Exports by Metropolitan Area
• Profile of U.S. Importing and Exporting Companies
• Related Party Trade
• U.S. Trade with Puerto Rico and U.S. Possessions (FT-895)
• Manufacturing and International Trade Report
Annual and Quarterly Releases
13International Trade Overview
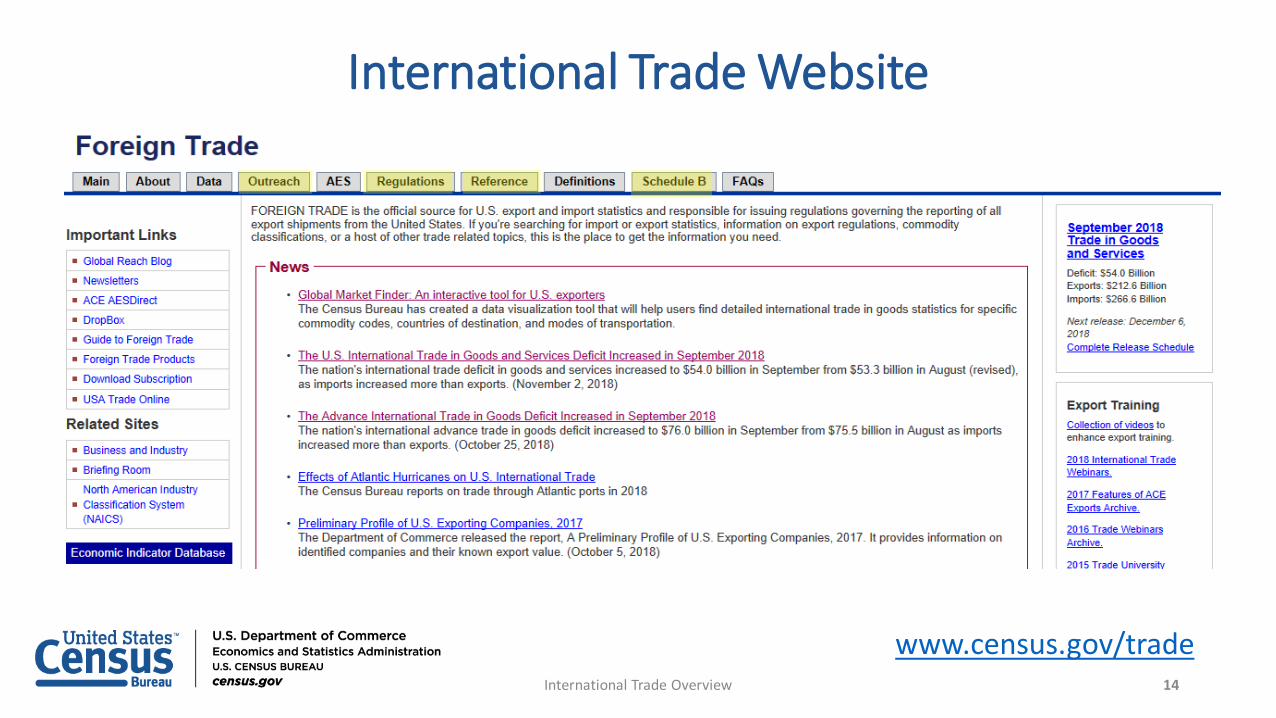
International Trade Website
www.census.gov/trade14International Trade Overview
Major Stakeholders
• Federal Government Agencies• Businesses• Academics• Congress• Policymakers• Journalists• Local and State Governments
15International Trade Overview

QUESTIONS?
16International Trade Overview

17
Omari WoodenEconomic Outreach and Regulations
International Trade ConferenceNovember 14, 2018
Trade Regulations
18Trade Regulations
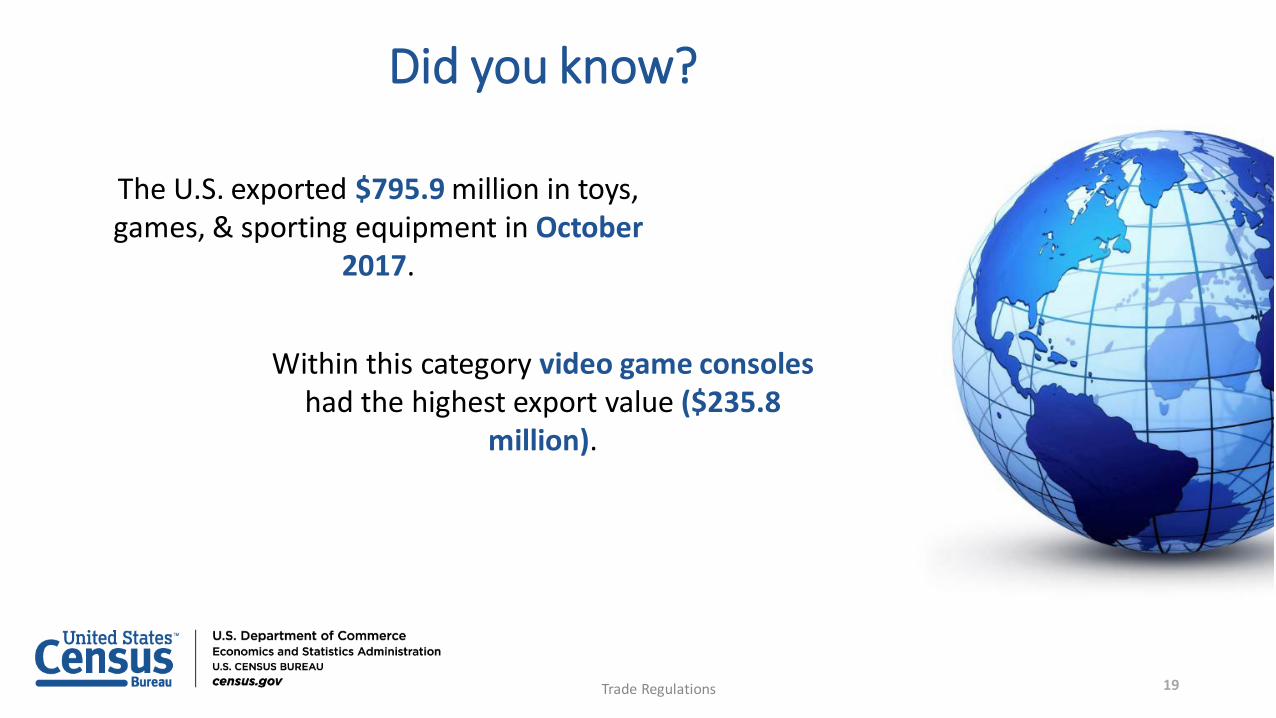
The U.S. exported $795.9 million in toys, games, & sporting equipment in October
2017.
Within this category video game consoleshad the highest export value ($235.8
million).
Did you know?
Trade Regulations 19
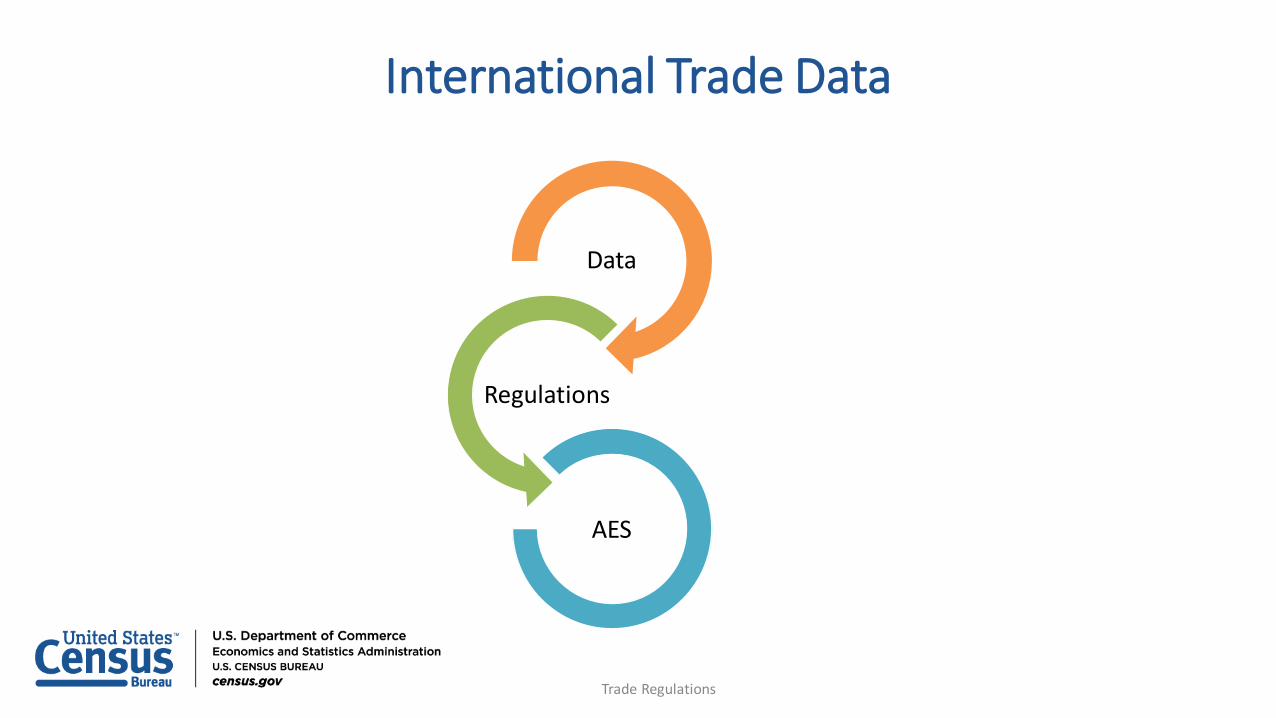
Data
Regulations
AES
International Trade Data
Trade Regulations
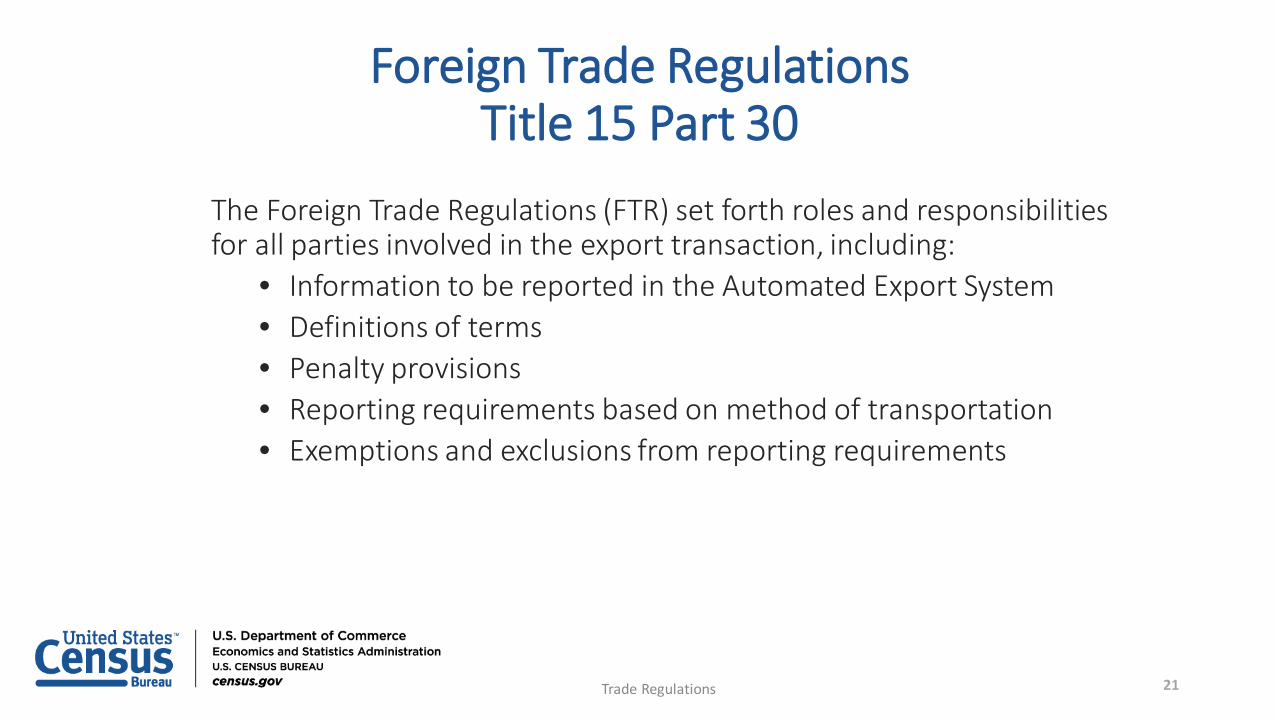
The Foreign Trade Regulations (FTR) set forth roles and responsibilities for all parties involved in the export transaction, including:
• Information to be reported in the Automated Export System• Definitions of terms• Penalty provisions• Reporting requirements based on method of transportation• Exemptions and exclusions from reporting requirements
Foreign Trade RegulationsTitle 15 Part 30
Trade Regulations 21
Statistical
U.S. Census BureauForeign Trade Regulations
Title 15 Code of Federal Regulations, Part 30
Enforcement
Bureau of Industry and SecurityExport Administration Regulations (EAR)
U.S. Customs and Border Protection &Bureau of Immigration and Customs Enforcement
Customs Regulations
Legal Requirements
Trade Regulations 22
International Trade Data System
• Executive Order 13659: Streamlining the Export/Import Process for America’s Businesses (February 19, 2014)
• The trade community is now able to submit export and import information through a “Single Window”
• Automated Commercial Environment (ACE) Reports
Information Sharing
Trade Regulations
The U.S. Principal Party in Interest is the:• U.S. Person or Entity• Primary Beneficiary of Export Shipment
Generally that person can be the:• U.S. Seller• U.S. Manufacturer• U.S. Order Party• U.S. Customs Broker• Foreign Entity*
*Only if in the U.S. at the time the goods were purchased or obtained for export
U.S. Principal Party in InterestFTR 30.3
Trade Regulations 24
ONE U.S. Principal Party in Interest shipping their merchandise, to
ONE Foreign consignee, on
ONE Conveyance moving the product out of the U.S., on
ONE day, and the goods are valued over $2,500 per Schedule B number or the shipment falls under a mandatory filing requirement listed in Section 30.2(a)(1)(iv) of the FTR.
1Tip: The ONE Rule
What Is A Shipment?
Trade Regulations 25
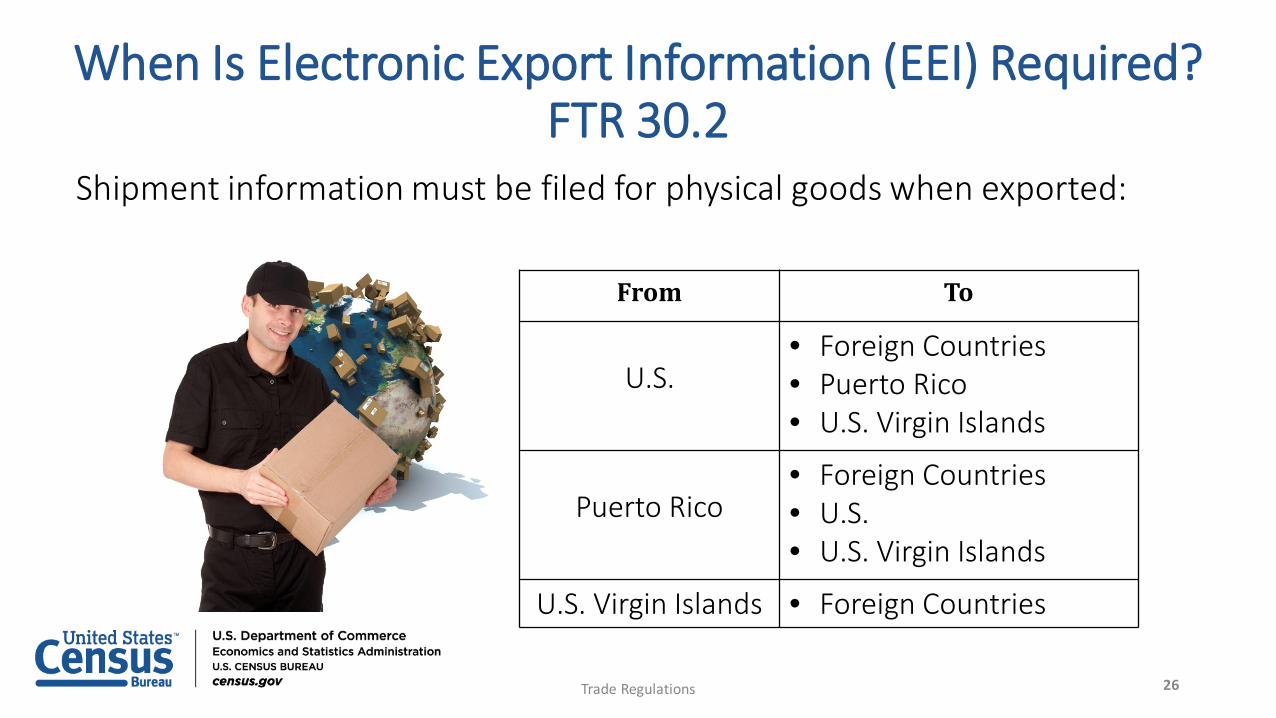
Shipment information must be filed for physical goods when exported:
From To
U.S.• Foreign Countries• Puerto Rico• U.S. Virgin Islands
Puerto Rico• Foreign Countries• U.S.• U.S. Virgin Islands
U.S. Virgin Islands • Foreign Countries
When Is Electronic Export Information (EEI) Required?FTR 30.2
Trade Regulations 26
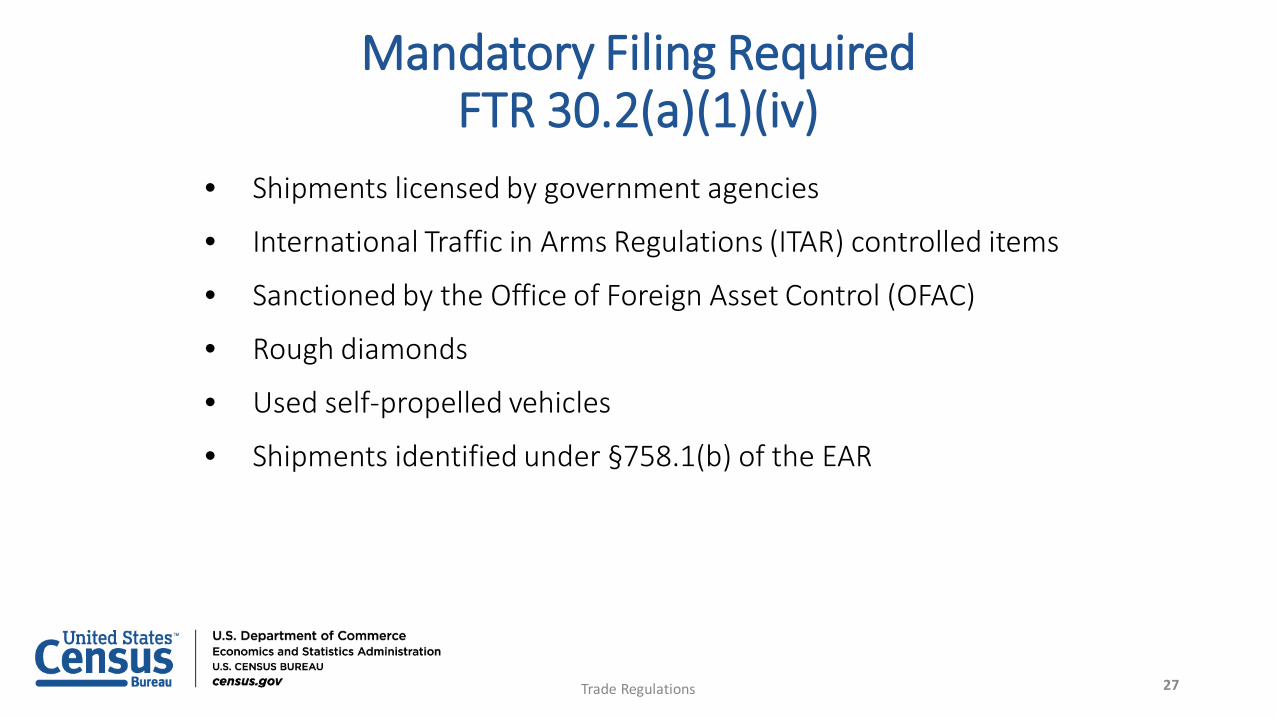
• Shipments licensed by government agencies
• International Traffic in Arms Regulations (ITAR) controlled items
• Sanctioned by the Office of Foreign Asset Control (OFAC)
• Rough diamonds
• Used self-propelled vehicles
• Shipments identified under §758.1(b) of the EAR
Mandatory Filing RequiredFTR 30.2(a)(1)(iv)
Trade Regulations 27
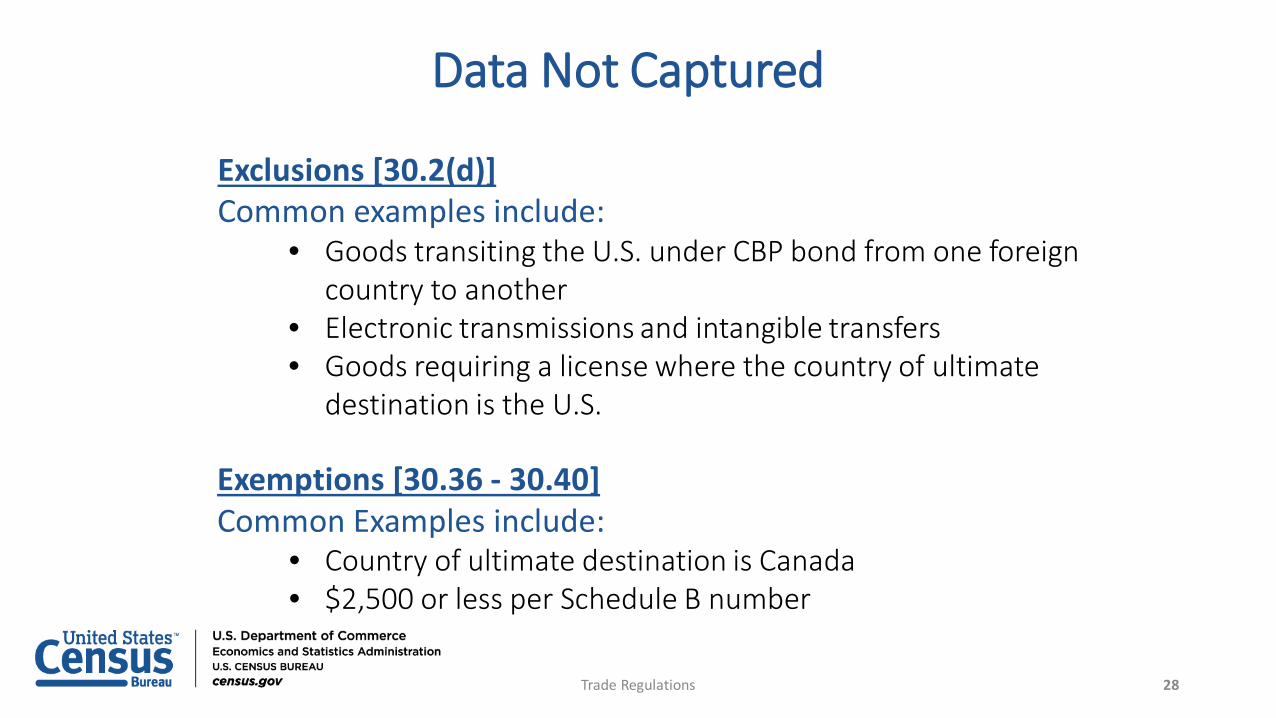
Exclusions [30.2(d)]Common examples include:
• Goods transiting the U.S. under CBP bond from one foreign country to another
• Electronic transmissions and intangible transfers• Goods requiring a license where the country of ultimate
destination is the U.S.
Exemptions [30.36 - 30.40]Common Examples include:
• Country of ultimate destination is Canada • $2,500 or less per Schedule B number
Data Not Captured
28Trade Regulations
29

QUESTIONS?
30Trade Regulations

31
Data Collection
Stephen JacksonAutomated Export System Compliance Team
International Trade ConferenceNovember 14, 2018
Data Collection 32
• What is the AES?
• System Resources and Requirements
• AES Responses
• AES Compliance Reports
Topics
Data Collection 33
Automated Export System (AES)
• AES is the U.S. Customs and Border Protection’s system that processes and stores all Electronic Export Information
• Automated Commercial Environment (ACE) is the single window platform that is used to process import and export filings
– AES was migrated to the ACE platform in 2014
Data Collection 34
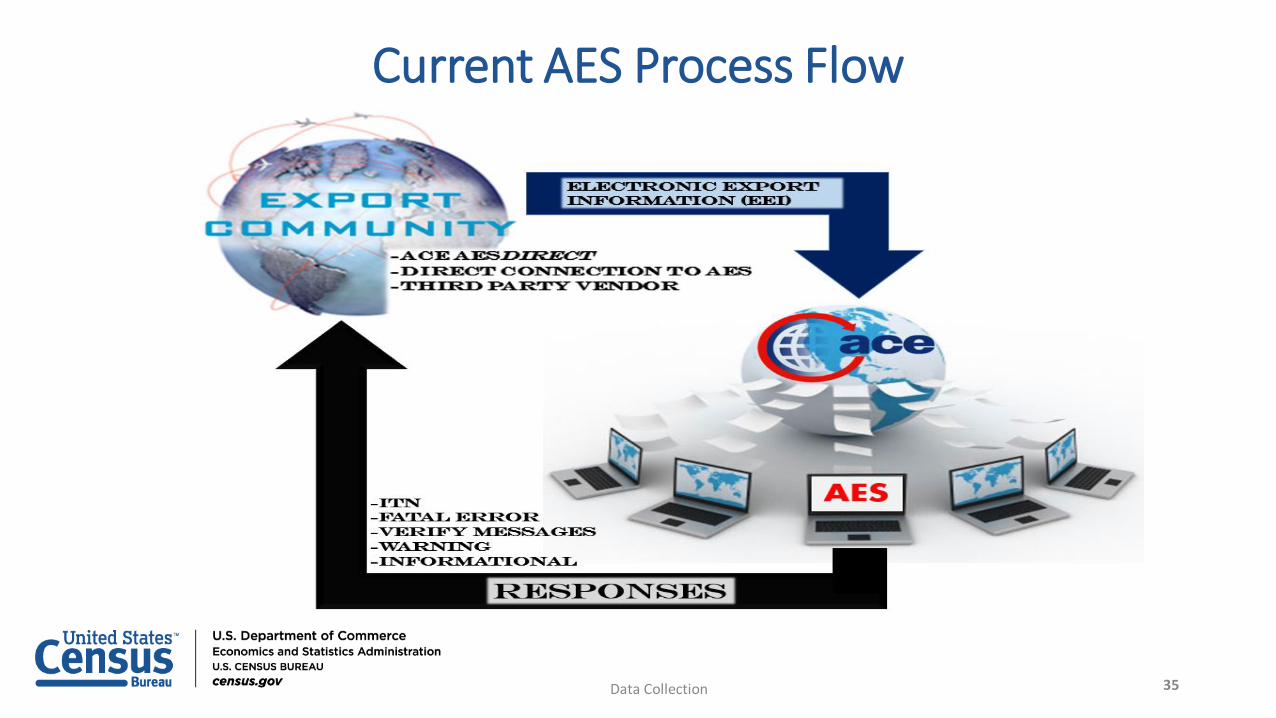
Current AES Process Flow
Data Collection 35
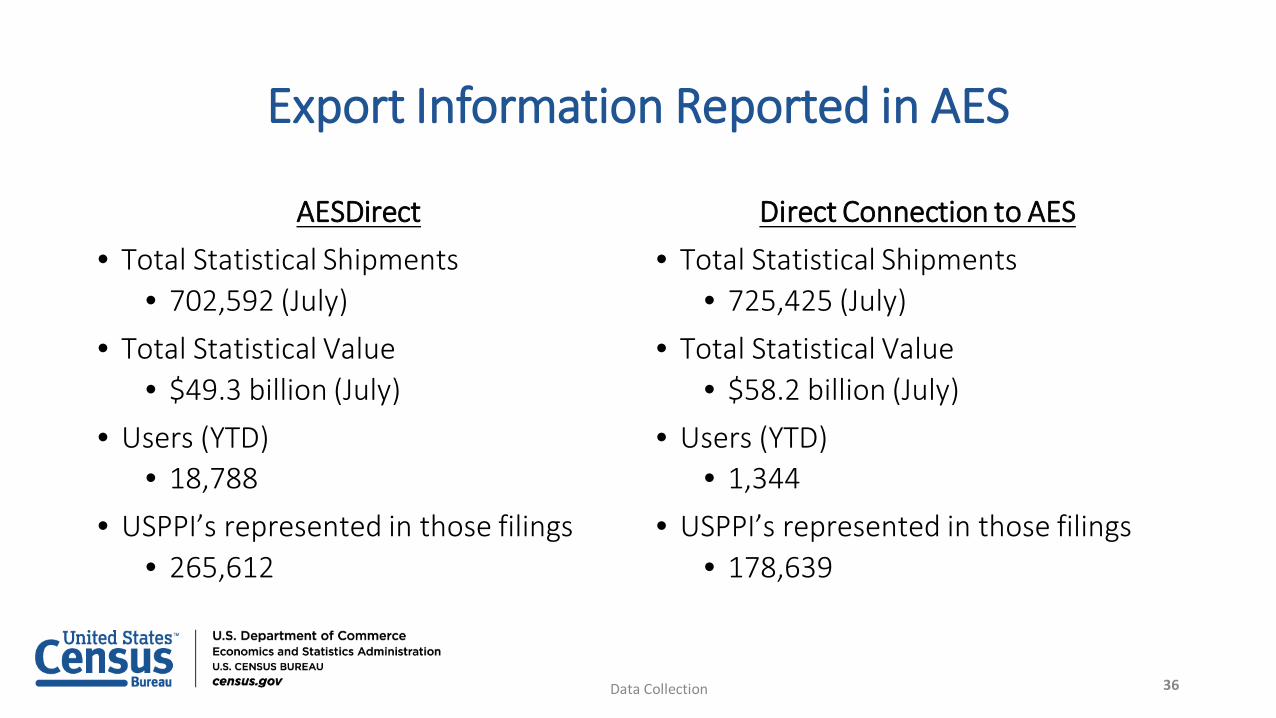
Export Information Reported in AES
AESDirect• Total Statistical Shipments
• 702,592 (July)• Total Statistical Value
• $49.3 billion (July)• Users (YTD)
• 18,788• USPPI’s represented in those filings
• 265,612
Direct Connection to AES• Total Statistical Shipments
• 725,425 (July)• Total Statistical Value
• $58.2 billion (July)• Users (YTD)
• 1,344• USPPI’s represented in those filings
• 178,639
Data Collection 36
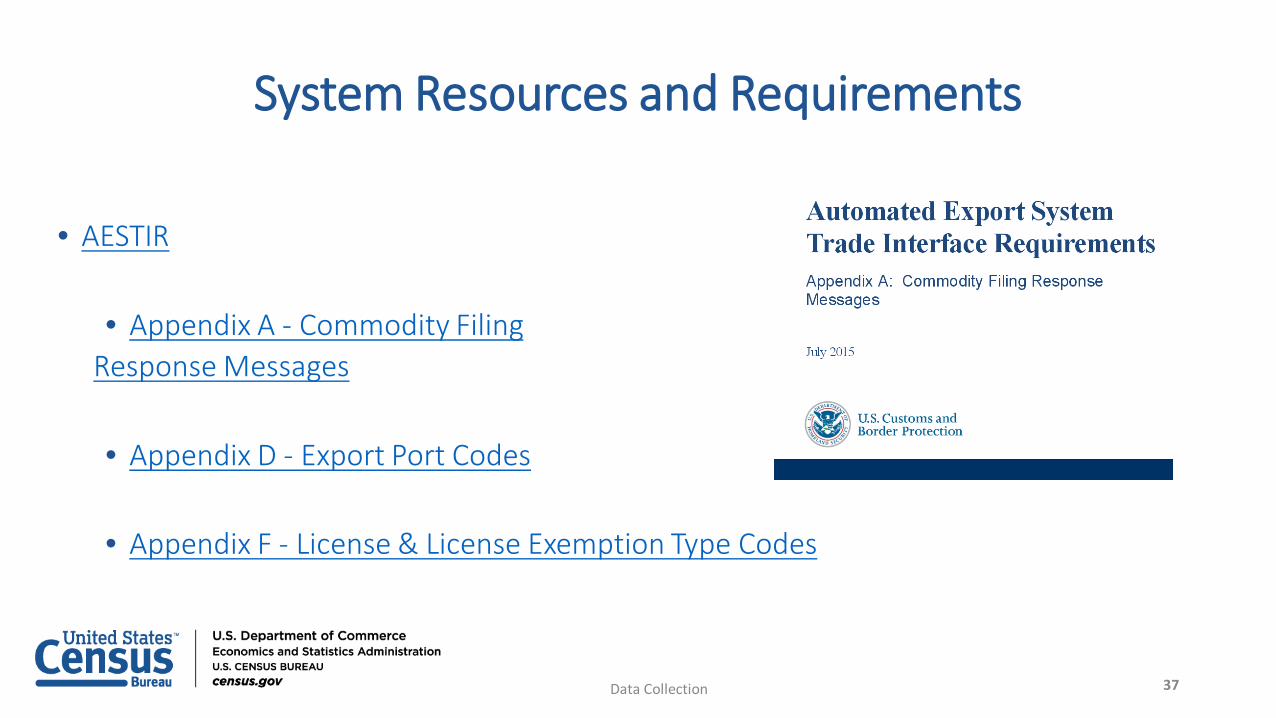
System Resources and Requirements
• AESTIR
• Appendix A - Commodity Filing Response Messages
• Appendix D - Export Port Codes
• Appendix F - License & License Exemption Type Codes
Data Collection 37
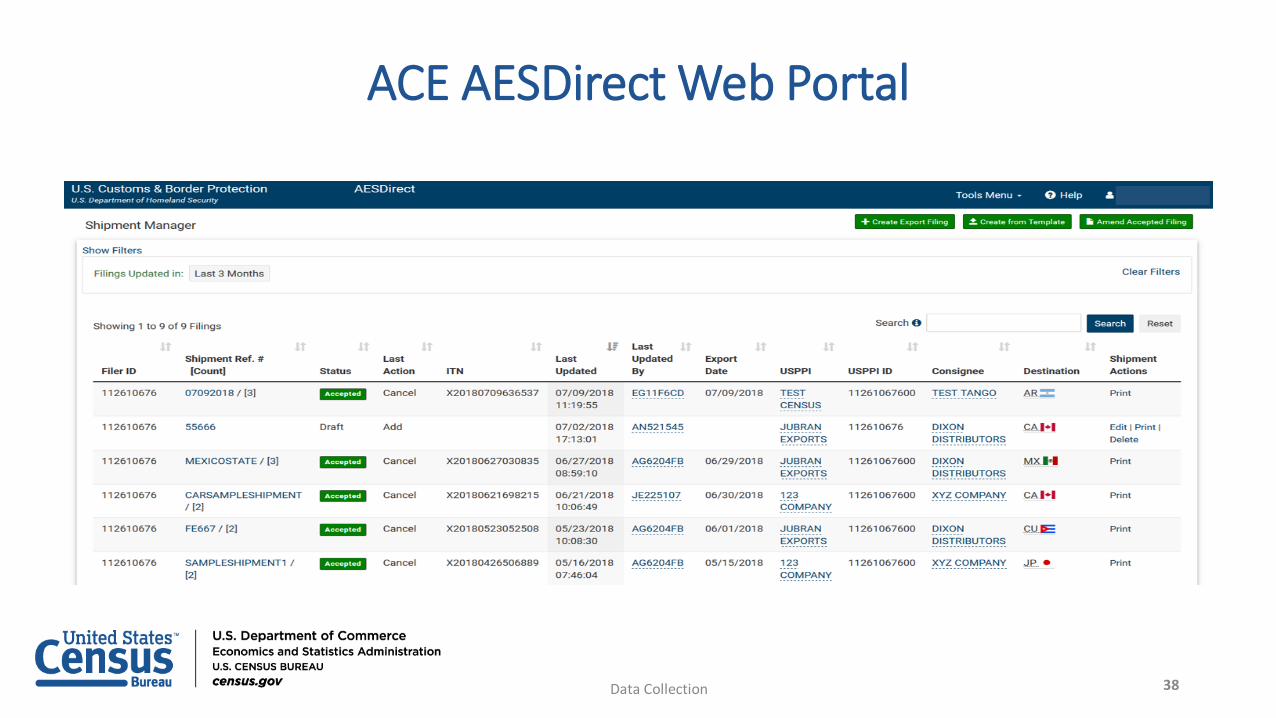
ACE AESDirect Web Portal
Data Collection 38
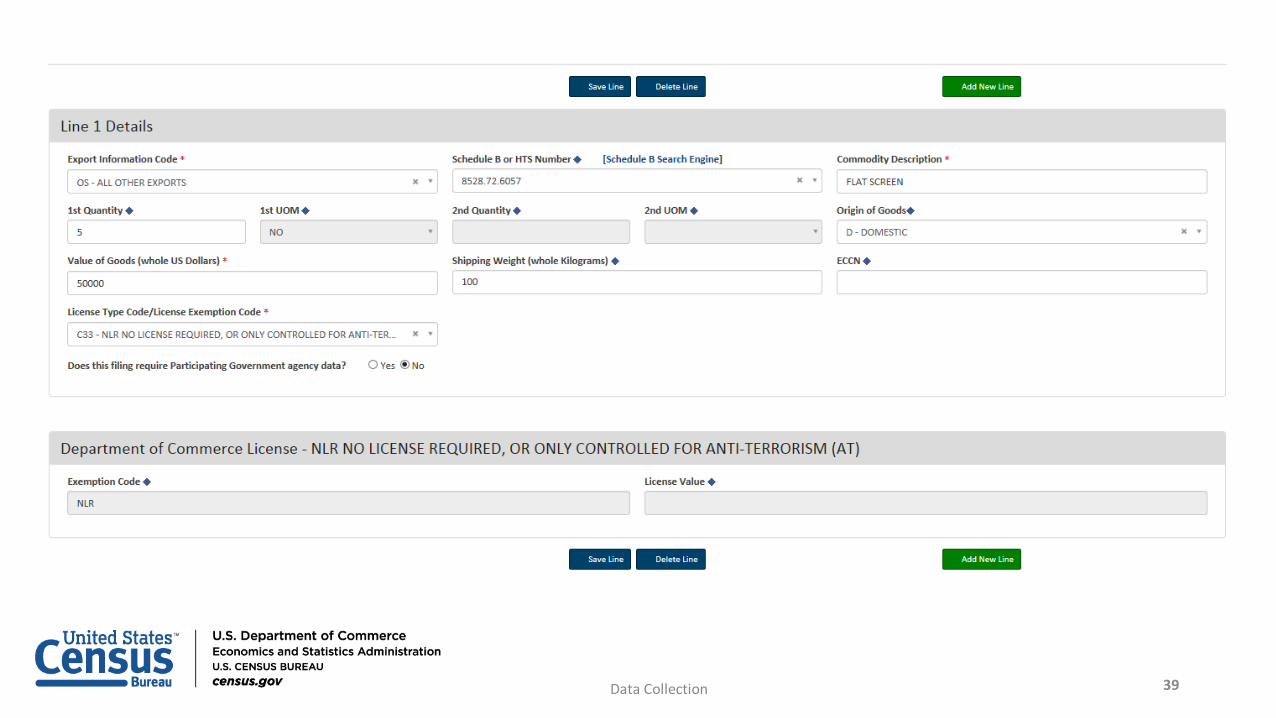
Data Collection 39
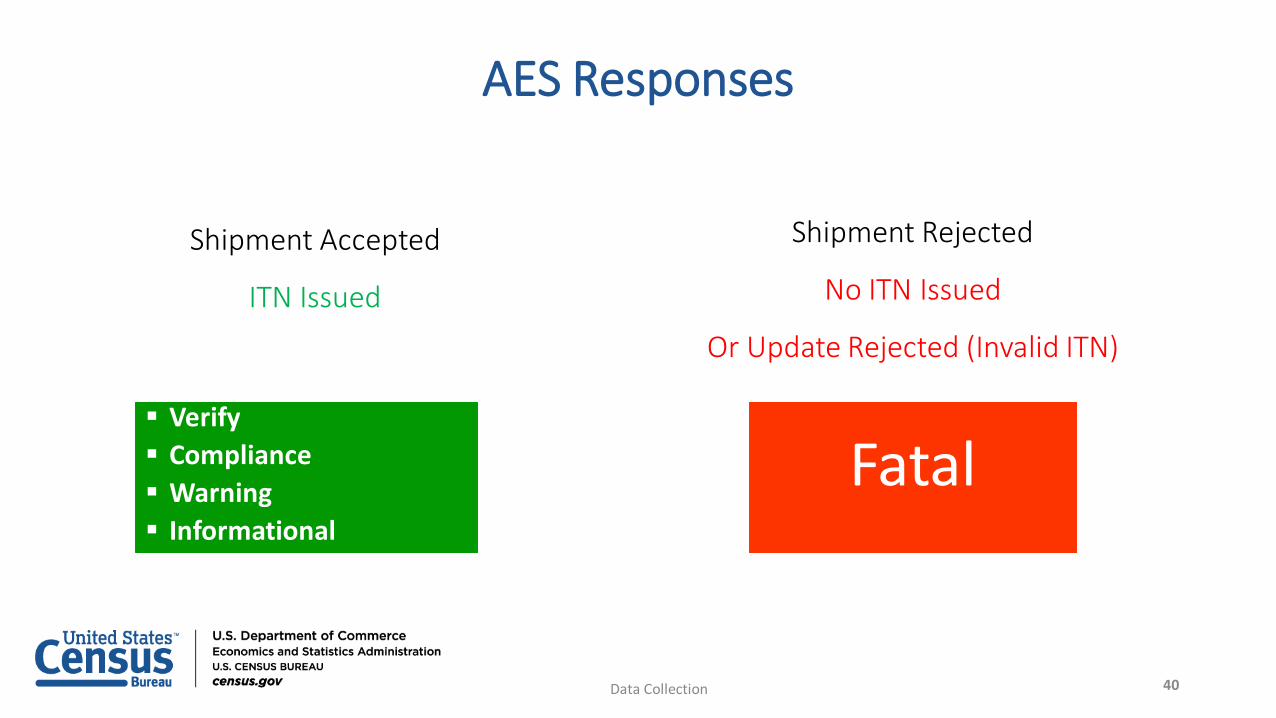
AES Responses
Verify Compliance Warning Informational
Fatal
Shipment Rejected
No ITN Issued
Or Update Rejected (Invalid ITN)
Shipment Accepted
ITN Issued
Data Collection 40
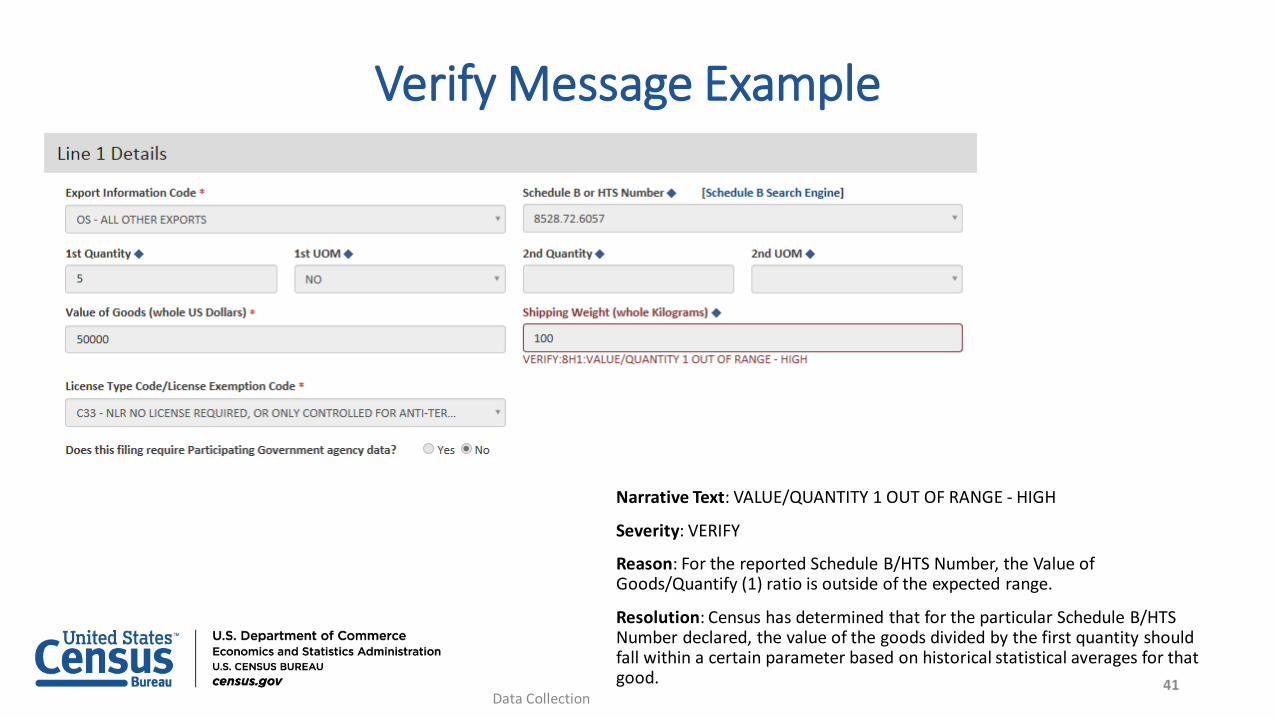
Verify Message Example
Narrative Text: VALUE/QUANTITY 1 OUT OF RANGE - HIGH
Severity: VERIFY
Reason: For the reported Schedule B/HTS Number, the Value of Goods/Quantify (1) ratio is outside of the expected range.
Resolution: Census has determined that for the particular Schedule B/HTS Number declared, the value of the goods divided by the first quantity should fall within a certain parameter based on historical statistical averages for that good.
Data Collection41
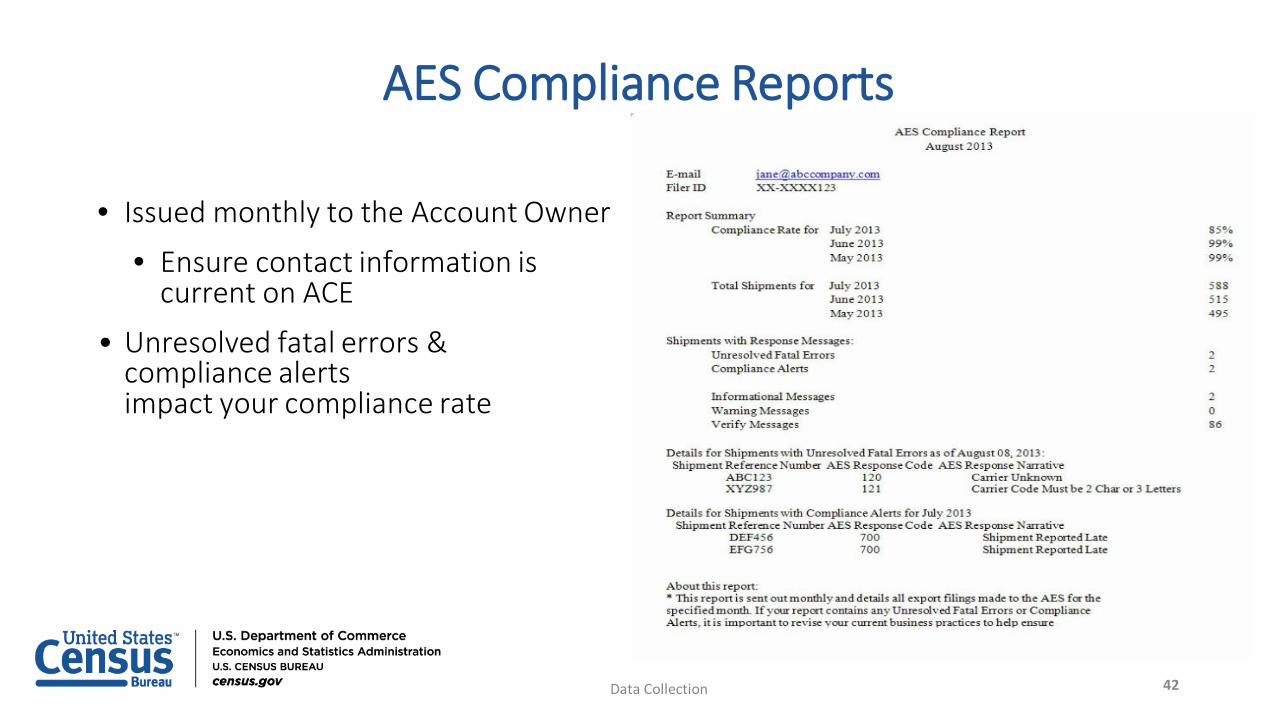
AES Compliance Reports
• Issued monthly to the Account Owner
• Ensure contact information is current on ACE
• Unresolved fatal errors & compliance alerts impact your compliance rate
Data Collection 42
Fatal Error Reports
• Issued if there are Unresolved Fatal Errors remaining from AES Compliance Report
• Issued each week there are outstanding Fatal Errors, until the next AES Compliance Reports are disseminated
• Resolve Fatal Errors - Appendix A
• For shipments that cannot be corrected:
• Send an email to DCB’s Fatal Error Team at [email protected]
• Include: ITN for the shipment that replaced the Fatal Error and the SRN of the shipment that generated the error.
Data Collection 43
QUESTIONS?
44Data Collection

45
United States – CanadaData Exchange
Melissa ScottDivision Coordination Staff
International Trade ConferenceNovember 14, 2018
46US - Canada Data Exchange
• What is the Data Exchange?
• Who is involved?
• Why was it created?
• How does it work?
• Key differences between the U.S. and Canada statistics
47US - Canada Data Exchange
What is the United States – Canada Data Exchange?
Agreement between the governments of the United States and Canada based on a
Memorandum of Understanding (MOU)
48US - Canada Data Exchange
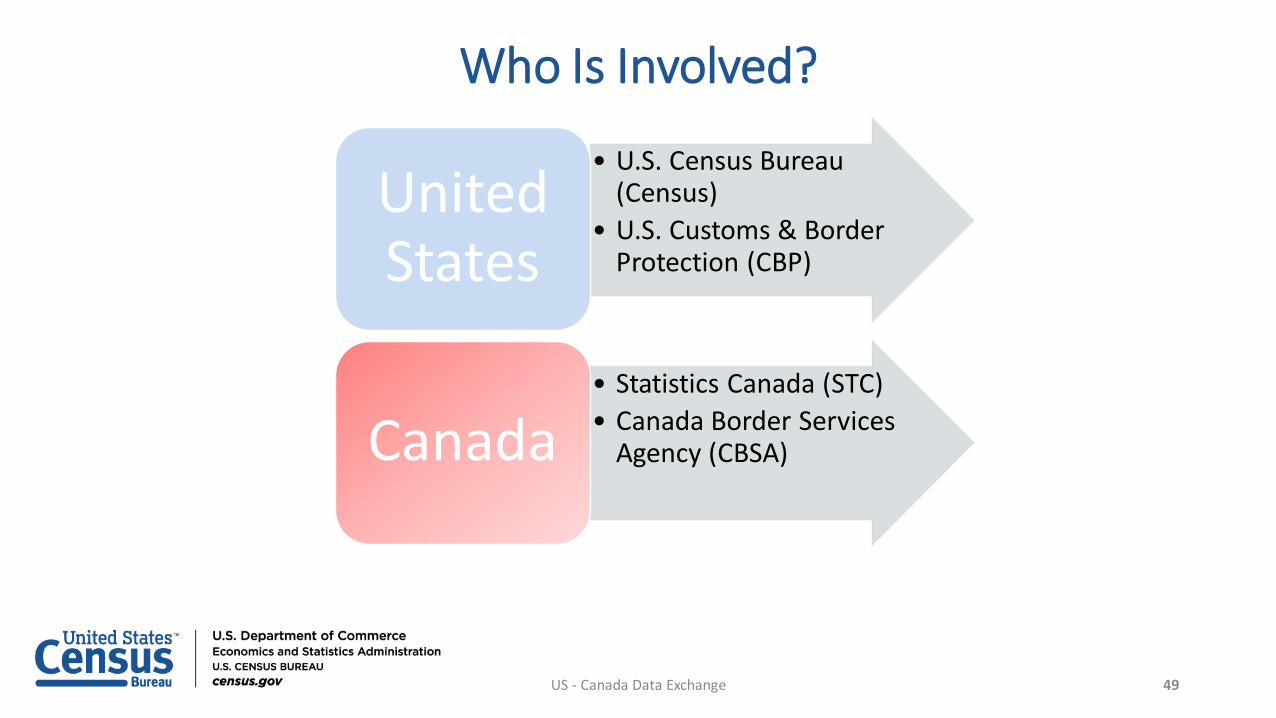
Who Is Involved?
• U.S. Census Bureau (Census)
• U.S. Customs & Border Protection (CBP)
United States
• Statistics Canada (STC)• Canada Border Services
Agency (CBSA)Canada
49US - Canada Data Exchange
Why Was It Created?
• Rise in Export under coverage
Benefits:• Decrease operating costs to processExport Declarations
• Eliminate reporting burden of Exporters
• Location and language of both countries
Why Was it Created?• Rise in Export under coverage – Paper Export Declarations• Other benefits:
• Decreased operating costs to process Export Declarations• Eliminated reporting burden of Exporters• Location and language of both countries
Why Was It Created?
50US - Canada Data Exchange
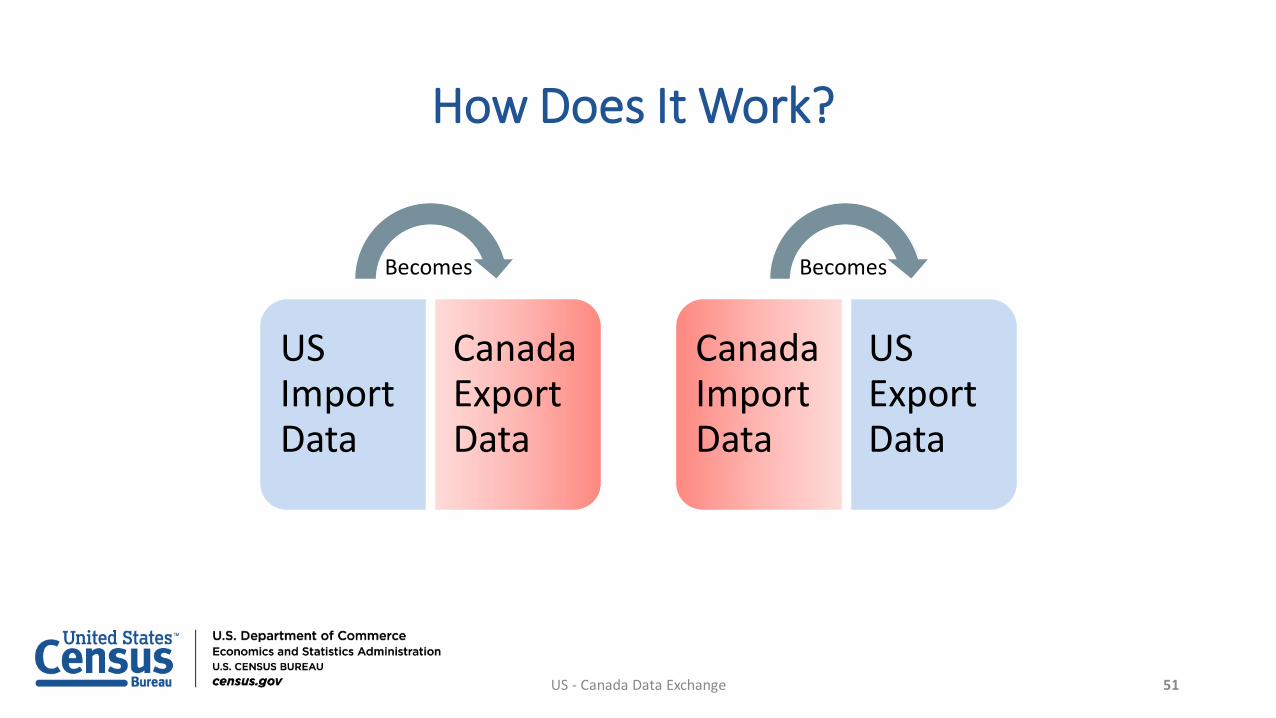
How Does It Work?
Canada Import Data
US Export Data
US Import Data
Canada Export Data
Becomes Becomes
51US - Canada Data Exchange
How Do We Receive Canadian Import Data?
• STC Transmits files twice per month
• The first transmission occurs mid-month• The second transmission is received a week later
52US - Canada Data Exchange
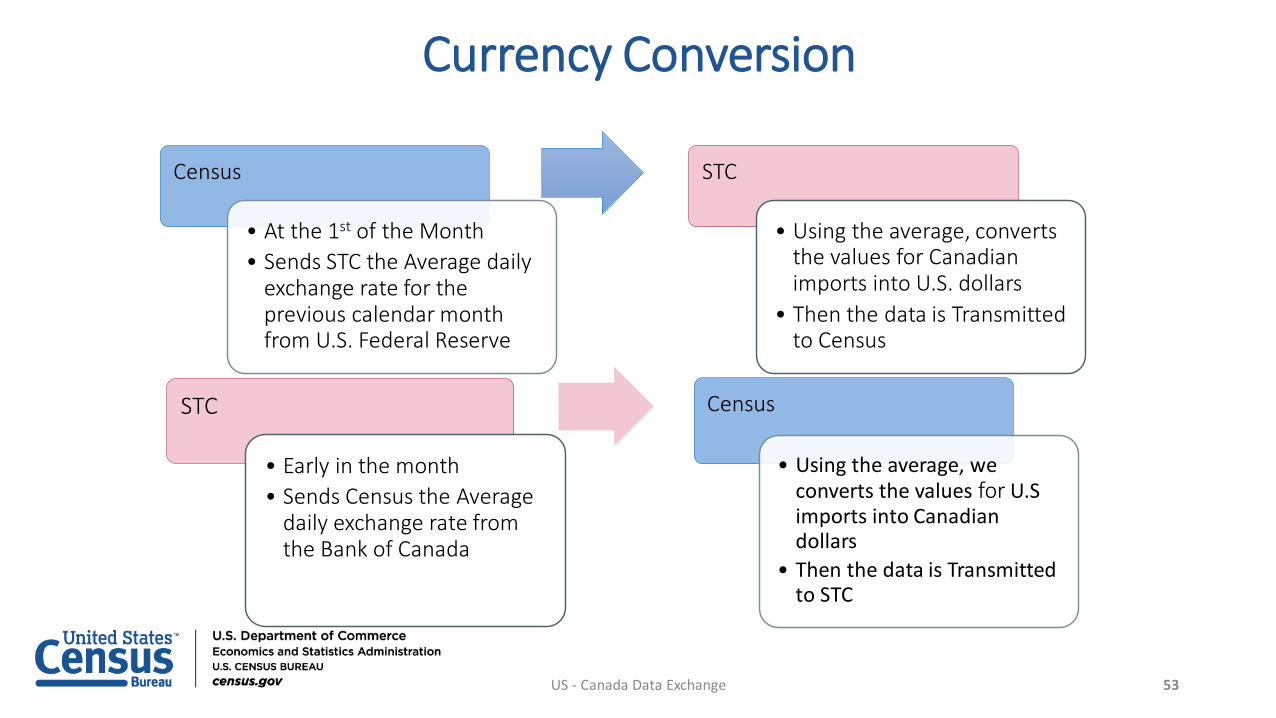
Currency Conversion
Census
• At the 1st of the Month• Sends STC the Average daily
exchange rate for the previous calendar month from U.S. Federal Reserve
STC
• Using the average, converts the values for Canadian imports into U.S. dollars
• Then the data is Transmitted to Census
STC
• Early in the month• Sends Census the Average
daily exchange rate from the Bank of Canada
Census
• Using the average, we converts the values for U.S imports into Canadian dollars
• Then the data is Transmitted to STC
53US - Canada Data Exchange
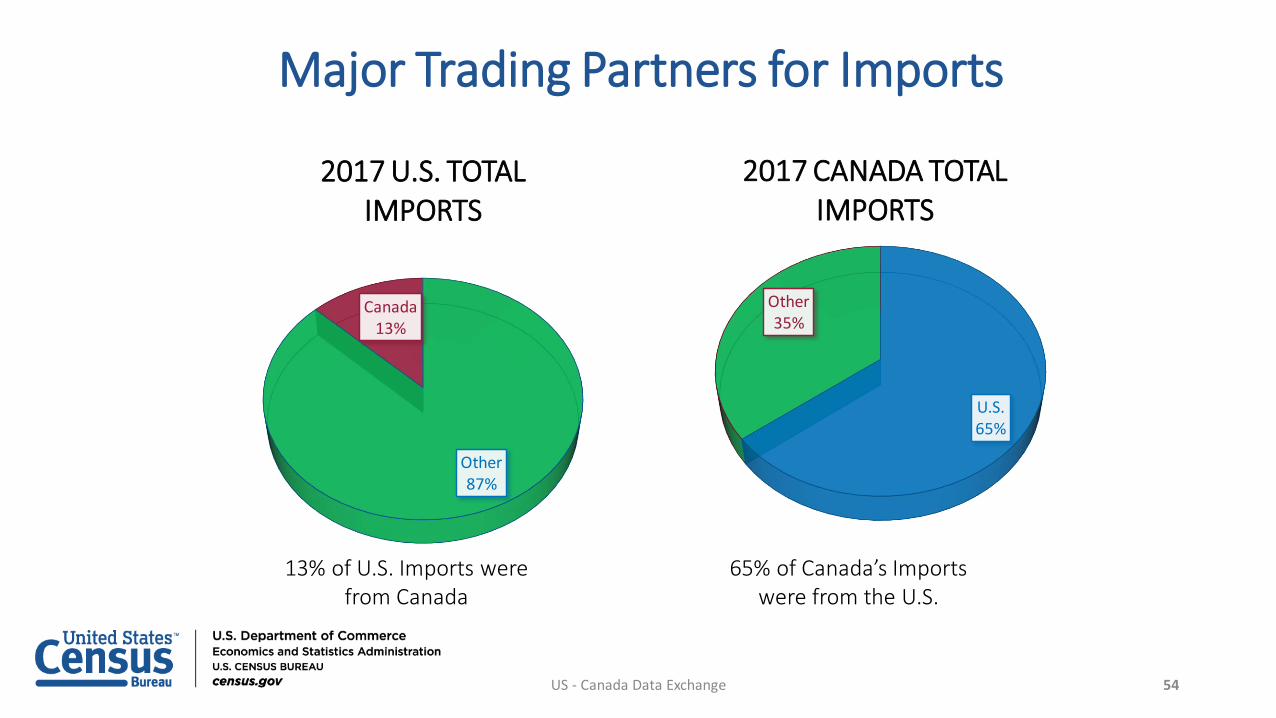
Major Trading Partners for Imports
Other87%
Canada13%
2017 U.S. TOTAL IMPORTS
13% of U.S. Imports were from Canada
65% of Canada’s Imports were from the U.S.
U.S.65%
Other35%
2017 CANADA TOTAL IMPORTS
54US - Canada Data Exchange
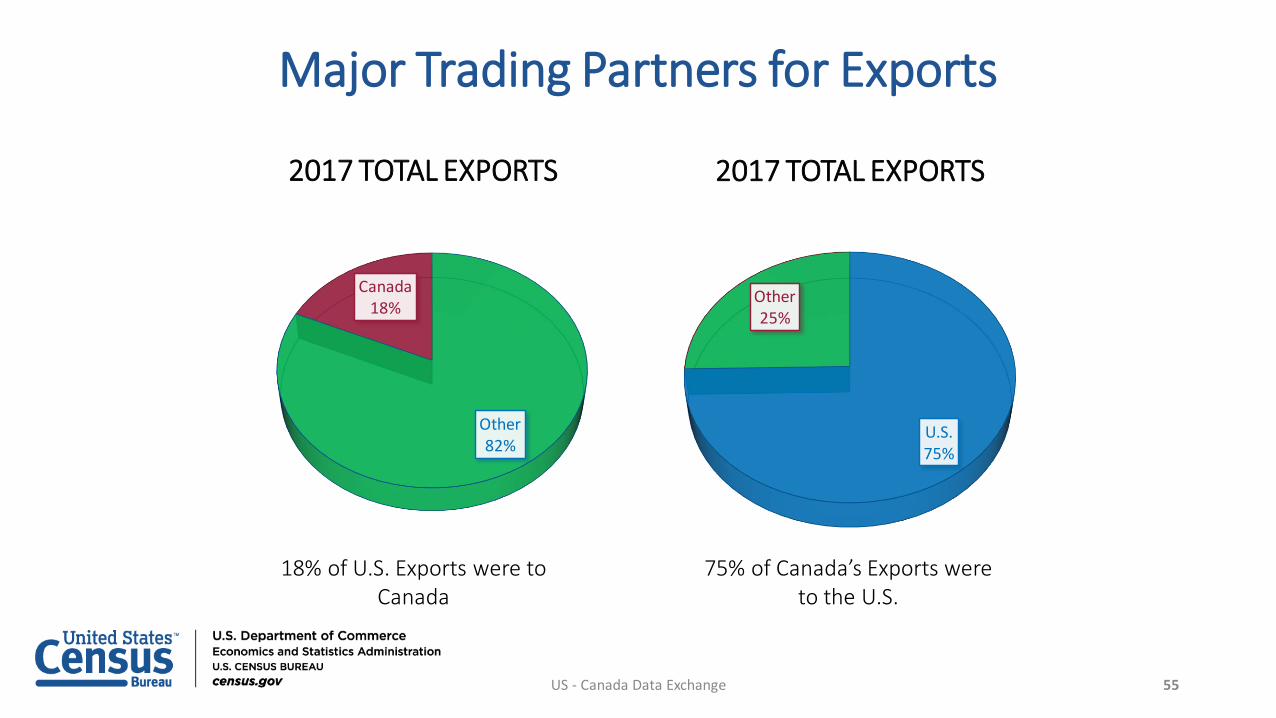
Major Trading Partners for Exports
18% of U.S. Exports were to Canada
75% of Canada’s Exports were to the U.S.
U.S.75%
Other25%
2017 TOTAL EXPORTS
Other82%
Canada18%
2017 TOTAL EXPORTS
55US - Canada Data Exchange
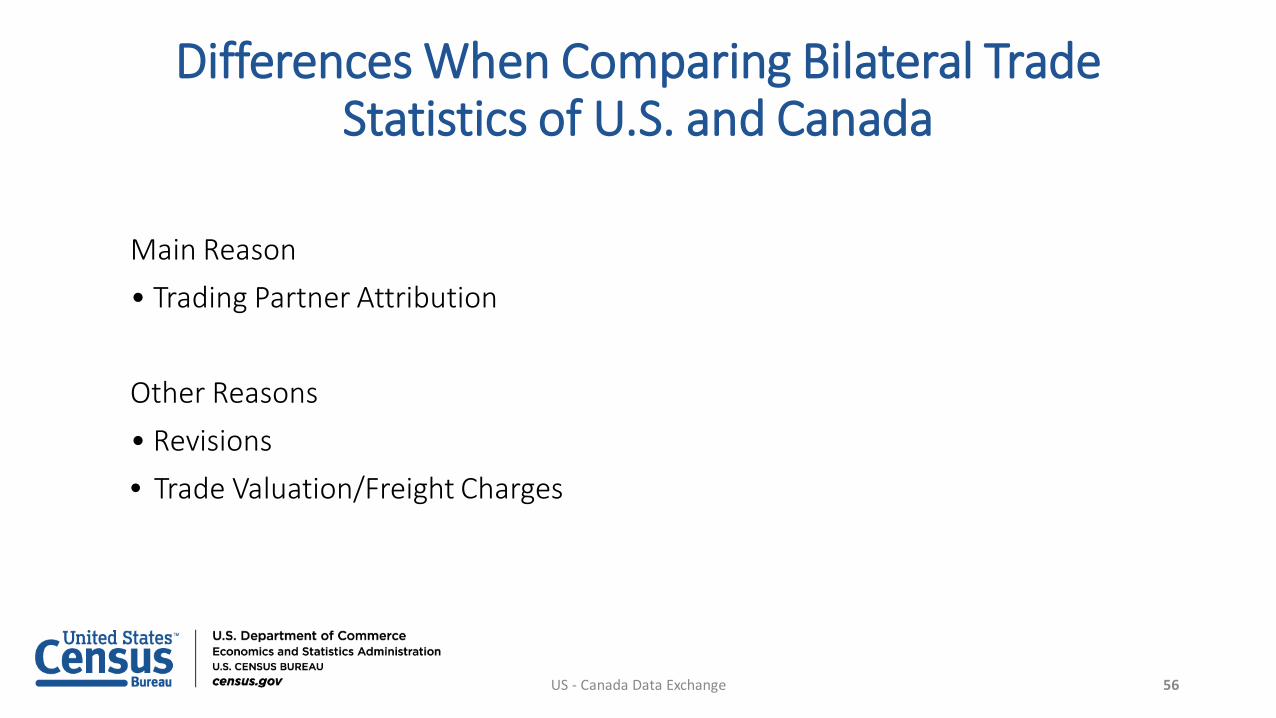
Differences When Comparing Bilateral Trade Statistics of U.S. and Canada
Main Reason• Trading Partner Attribution
Other Reasons• Revisions• Trade Valuation/Freight Charges
56US - Canada Data Exchange
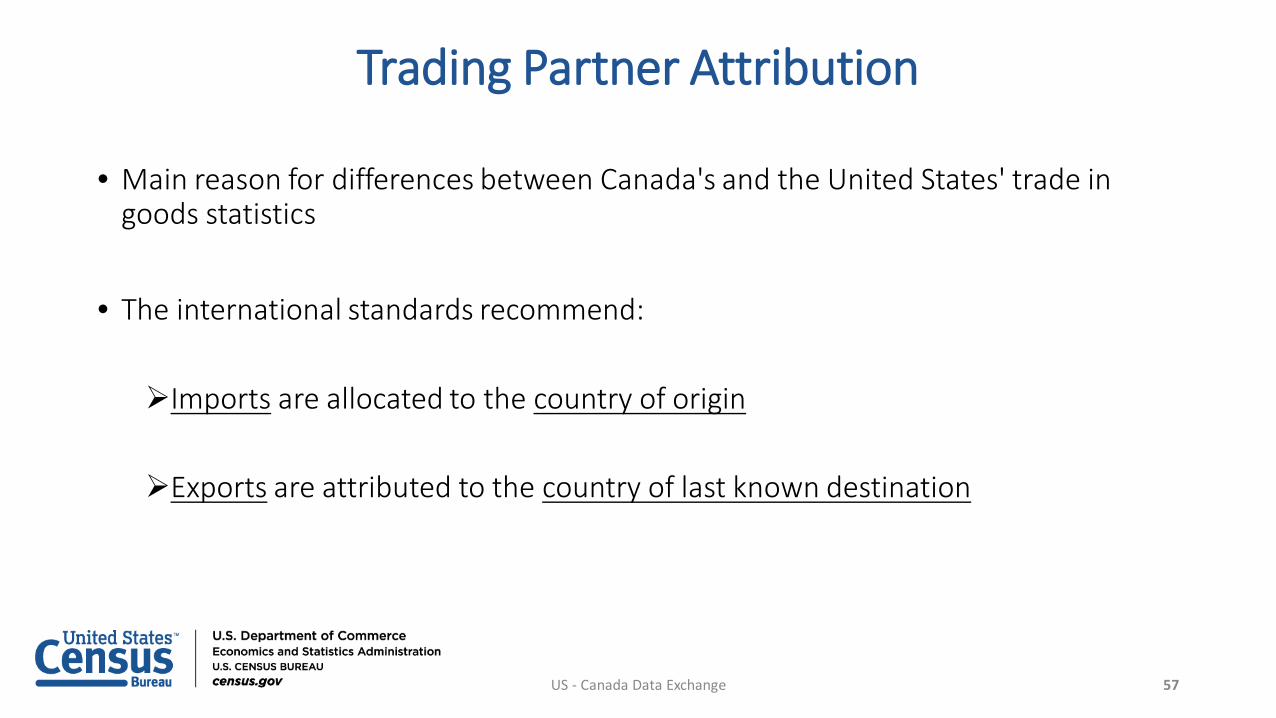
Trading Partner Attribution
• Main reason for differences between Canada's and the United States' trade in goods statistics
• The international standards recommend:
Imports are allocated to the country of origin
Exports are attributed to the country of last known destination
57US - Canada Data Exchange
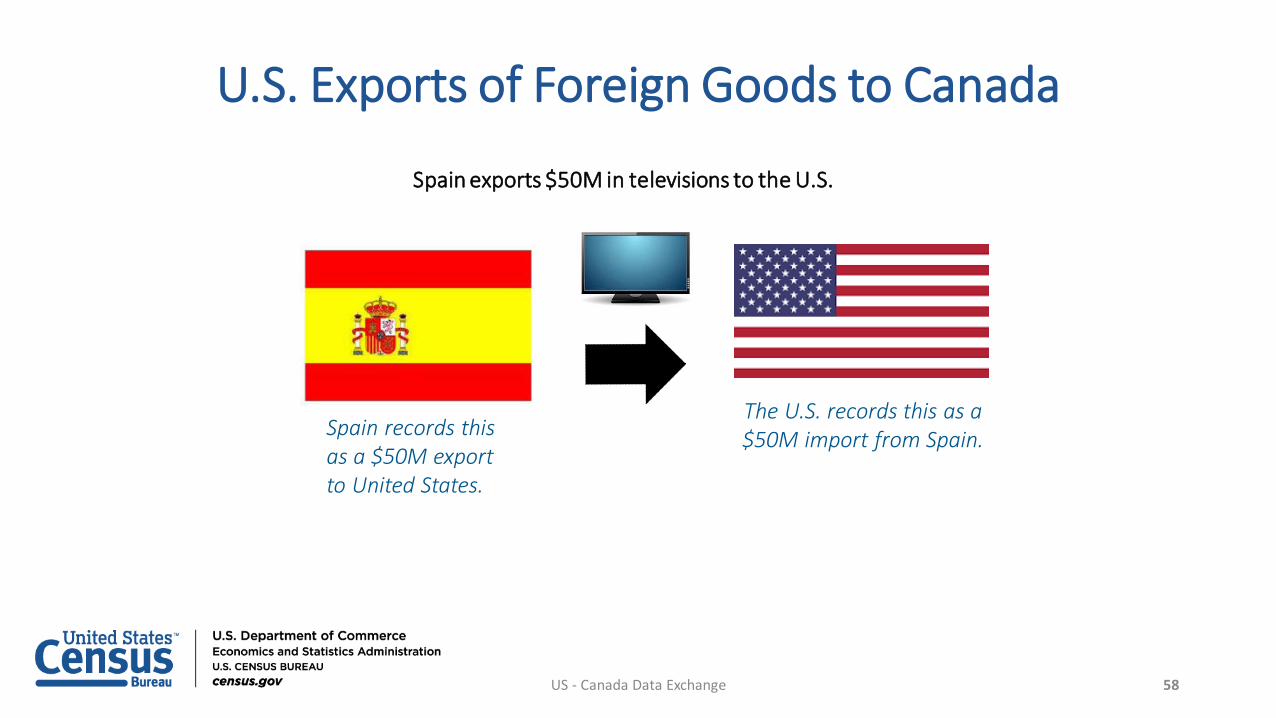
Spain exports $50M in televisions to the U.S.
Spain records this as a $50M export to United States.
The U.S. records this as a $50M import from Spain.
U.S. Exports of Foreign Goods to Canada
58US - Canada Data Exchange
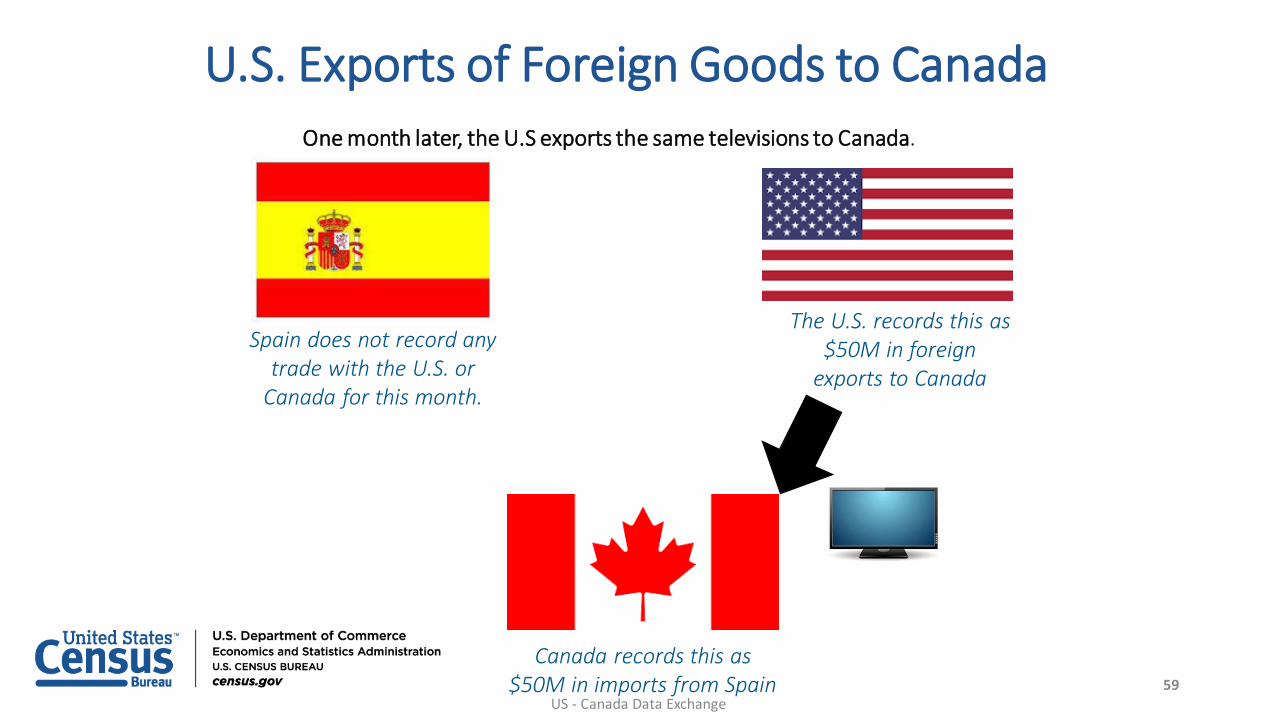
The U.S. records this as $50M in foreign
exports to Canada
Canada records this as $50M in imports from Spain
One month later, the U.S exports the same televisions to Canada.
Spain does not record any trade with the U.S. or
Canada for this month.
U.S. Exports of Foreign Goods to Canada
59US - Canada Data Exchange

Revisions & Trade Valuation• Late receipt of import and export documentation
• Corrections applied to previously submitted customs forms
• Replacement of estimates with actual figures
• Different schedules for the publication of revisions to trade statistics
• Differences in Trade Valuation
60US - Canada Data Exchange

QUESTIONS?
61US - Canada Data Exchange

62
Mayumi EscalanteInternational Trade Indicator Micro Analysis Branch
International Trade ConferenceNovember 14, 2018
Understanding the Harmonized System
63Understanding the Harmonized System
Topics:
• Background information on the Harmonized System
• Commodity classification schedules for International Trade data
• Harmonized System code structure
• Similarities and differences between the Harmonized Tariff Schedule and the Schedule B
• Changes to statistical classification codes
• Export and import code search demonstrations
• Additional classification resources
Understanding the Harmonized System
64Understanding the Harmonized System
Background Information
• The Harmonized Commodity Description and Coding System (HS) is administered by the World Customs Organization (WCO) in Brussels, Belgium
• The HS is organized in broad sections that are subdivided into 97 chapters• The U.S. joined the Harmonized System on January 1, 1989 when the
Harmonized Tariff Schedule of the United States (HTS) replaced the Tariff Schedule of the United States by congressional act
• General [international] and Additional U.S. Rules of Interpretation provide classification guidelines for conformity
• Like the more general HS, the HTS and Schedule B are detailed, hierarchical structures classifying all physical goods in trade for enforcement, duty, quota, and statistical purposes
65Understanding the Harmonized System
Trade Data Classification
The U.S. Census Bureau collects, processes, and publishes international trade data by harmonized commodity code
• Harmonized Tariff Schedule of the United States (HTS)
• 19,000 statistical import codes in 99 chapters
• Schedule B: Statistical Classification of Domestic and Foreign Commodities Exported from the United States
• 9,000 export codes in 98 chapters
66Understanding the Harmonized System
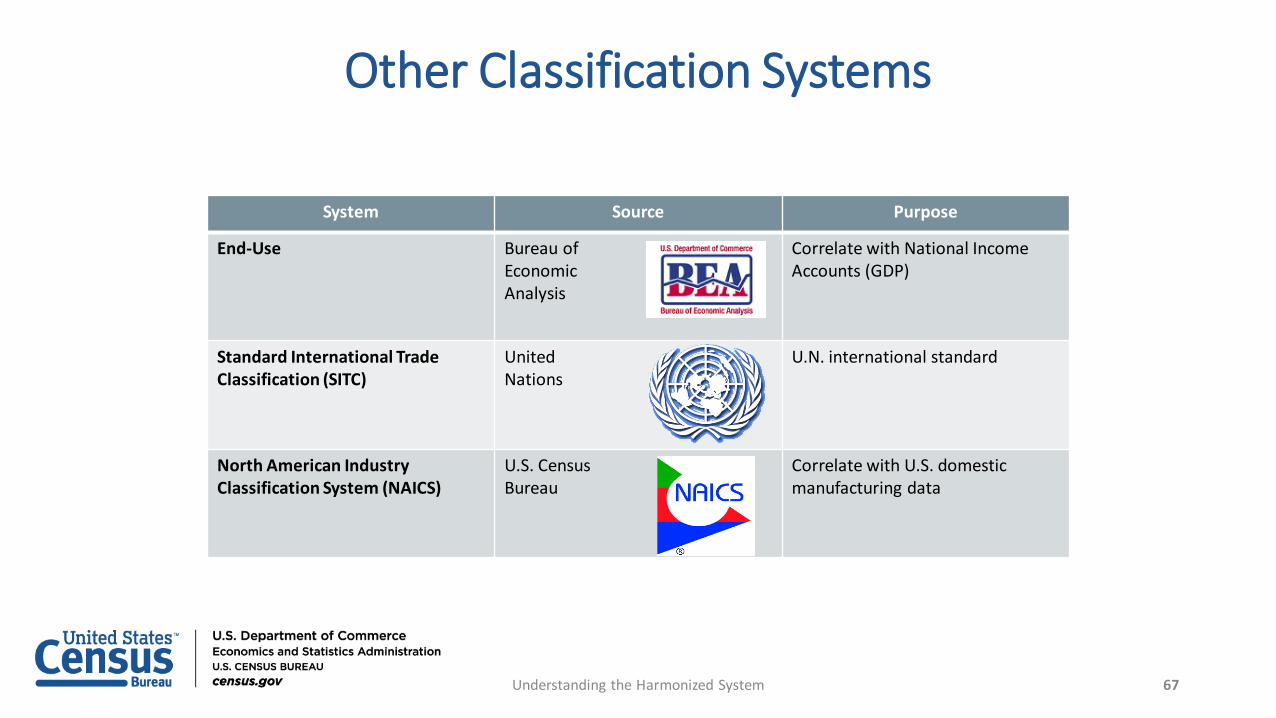
Other Classification Systems
System Source Purpose
End-Use Bureau of Economic Analysis
Correlate with National Income Accounts (GDP)
Standard International Trade Classification (SITC)
United Nations
U.N. international standard
North American Industry Classification System (NAICS)
U.S. Census Bureau
Correlate with U.S. domestic manufacturing data
67Understanding the Harmonized System
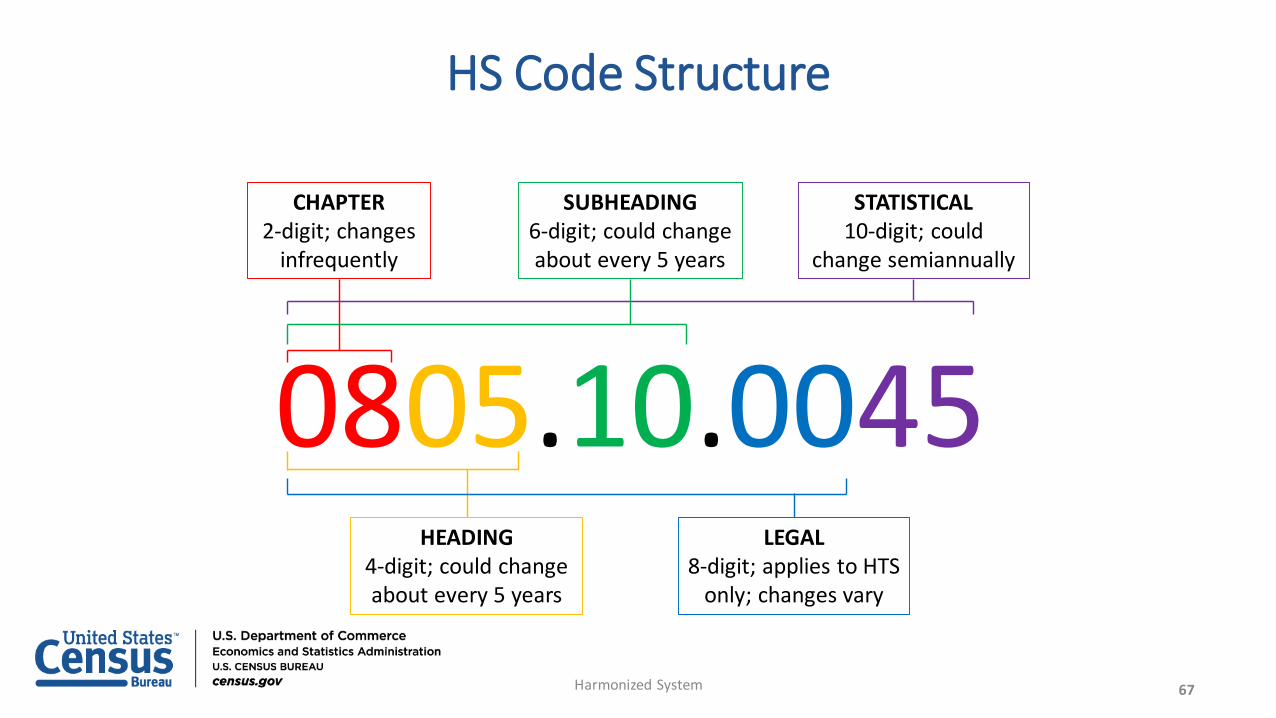
0805.10.0045
CHAPTER2-digit; changes
infrequently
HEADING4-digit; could change about every 5 years
SUBHEADING6-digit; could change about every 5 years
STATISTICAL10-digit; could
change semiannually
LEGAL8-digit; applies to HTS
only; changes vary
HS Code Structure
67Harmonized System
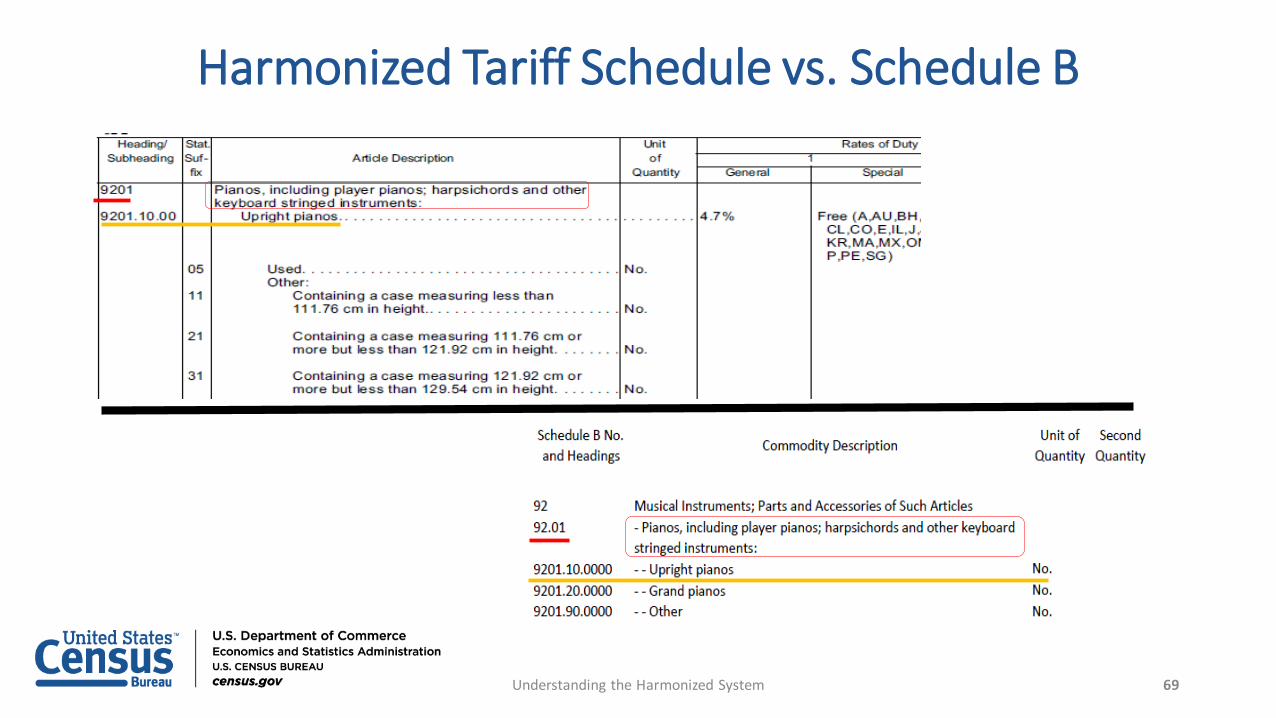
Harmonized Tariff Schedule vs. Schedule B
69Understanding the Harmonized System
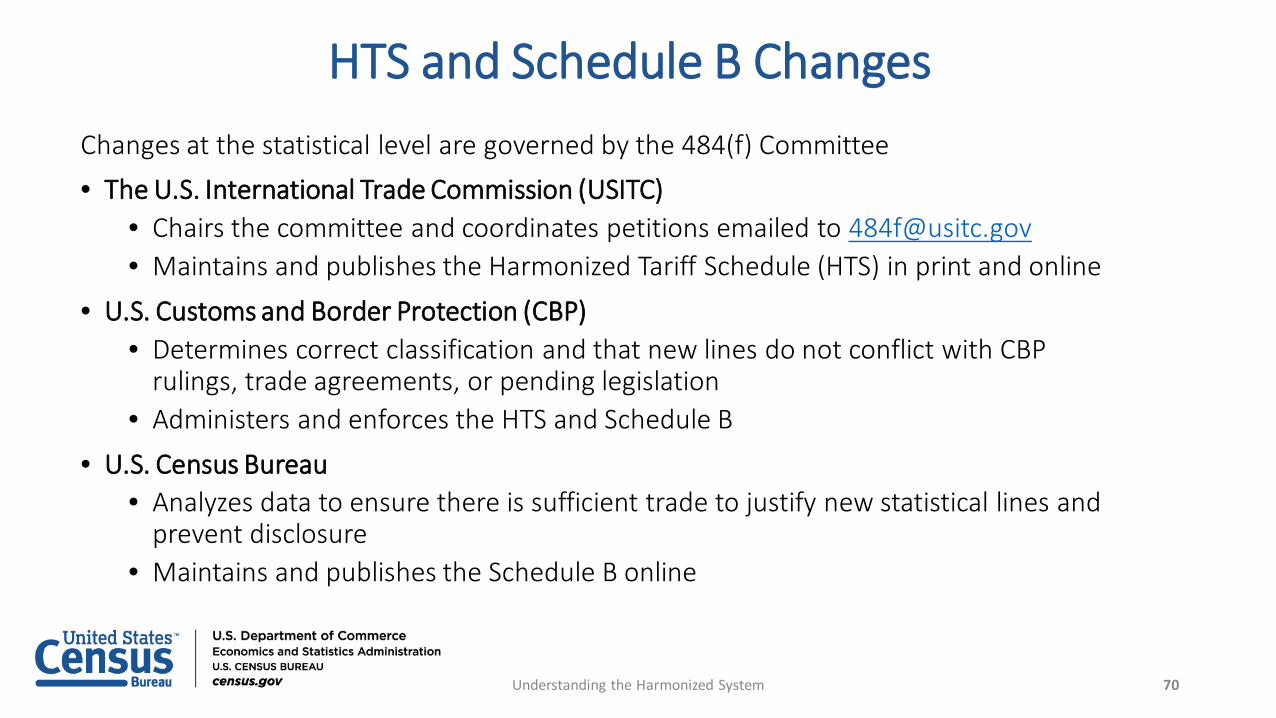
HTS and Schedule B ChangesChanges at the statistical level are governed by the 484(f) Committee• The U.S. International Trade Commission (USITC)
• Chairs the committee and coordinates petitions emailed to [email protected]• Maintains and publishes the Harmonized Tariff Schedule (HTS) in print and online
• U.S. Customs and Border Protection (CBP)• Determines correct classification and that new lines do not conflict with CBP
rulings, trade agreements, or pending legislation• Administers and enforces the HTS and Schedule B
• U.S. Census Bureau• Analyzes data to ensure there is sufficient trade to justify new statistical lines and
prevent disclosure • Maintains and publishes the Schedule B online
70Understanding the Harmonized System
HS Classification Tools (Demo)
U.S. Census Bureau
• Schedule B Search – https://census.gov/scheduleb
• Also Browse Schedule B chapters, Download data user concordance files
U.S. International Trade Commission (USITC)
• HTS Search – https://hts.usitc.gov
71Understanding the Harmonized System
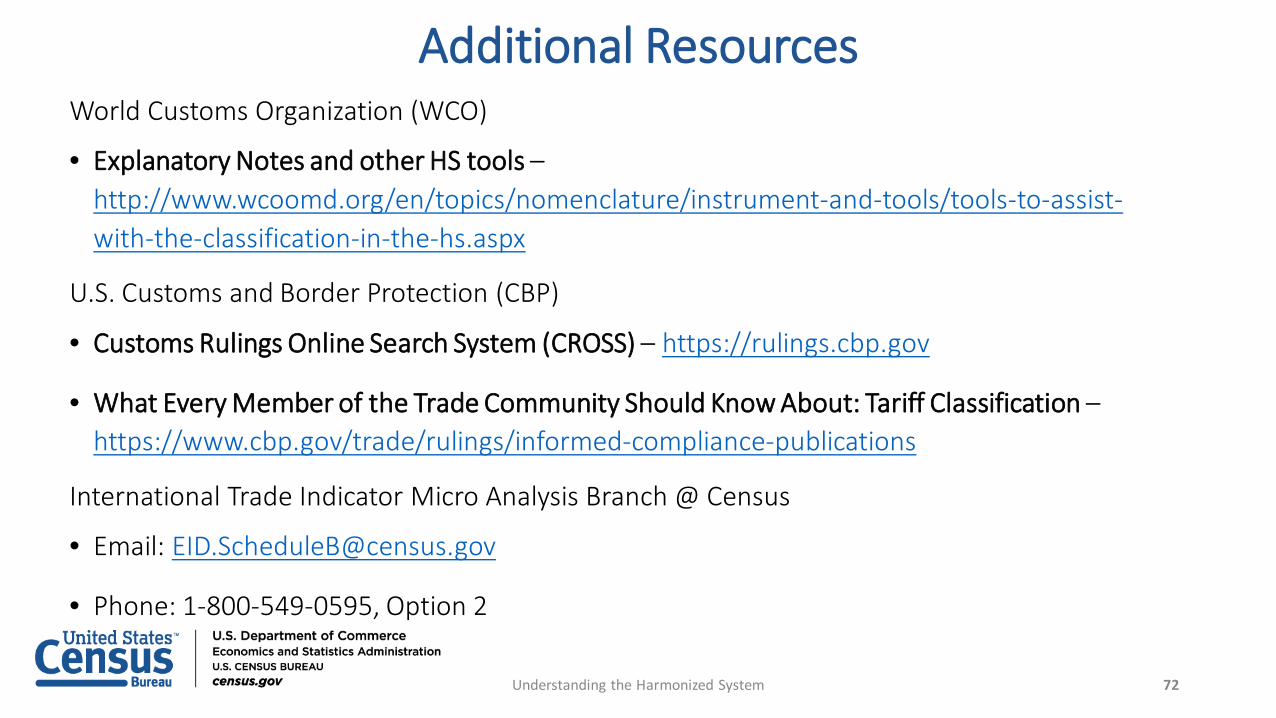
Additional ResourcesWorld Customs Organization (WCO)
• Explanatory Notes and other HS tools –http://www.wcoomd.org/en/topics/nomenclature/instrument-and-tools/tools-to-assist-with-the-classification-in-the-hs.aspx
U.S. Customs and Border Protection (CBP)
• Customs Rulings Online Search System (CROSS) – https://rulings.cbp.gov
• What Every Member of the Trade Community Should Know About: Tariff Classification –https://www.cbp.gov/trade/rulings/informed-compliance-publications
International Trade Indicator Micro Analysis Branch @ Census
• Email: [email protected]
• Phone: 1-800-549-0595, Option 2
72Understanding the Harmonized System
QUESTIONS?
73Understanding the Harmonized System

74
Henock KebedeInternational Trade Indicator Macro Analysis Branch
International Trade ConferenceNovember 14, 2018
USA Trade Online
75USA Trade Online
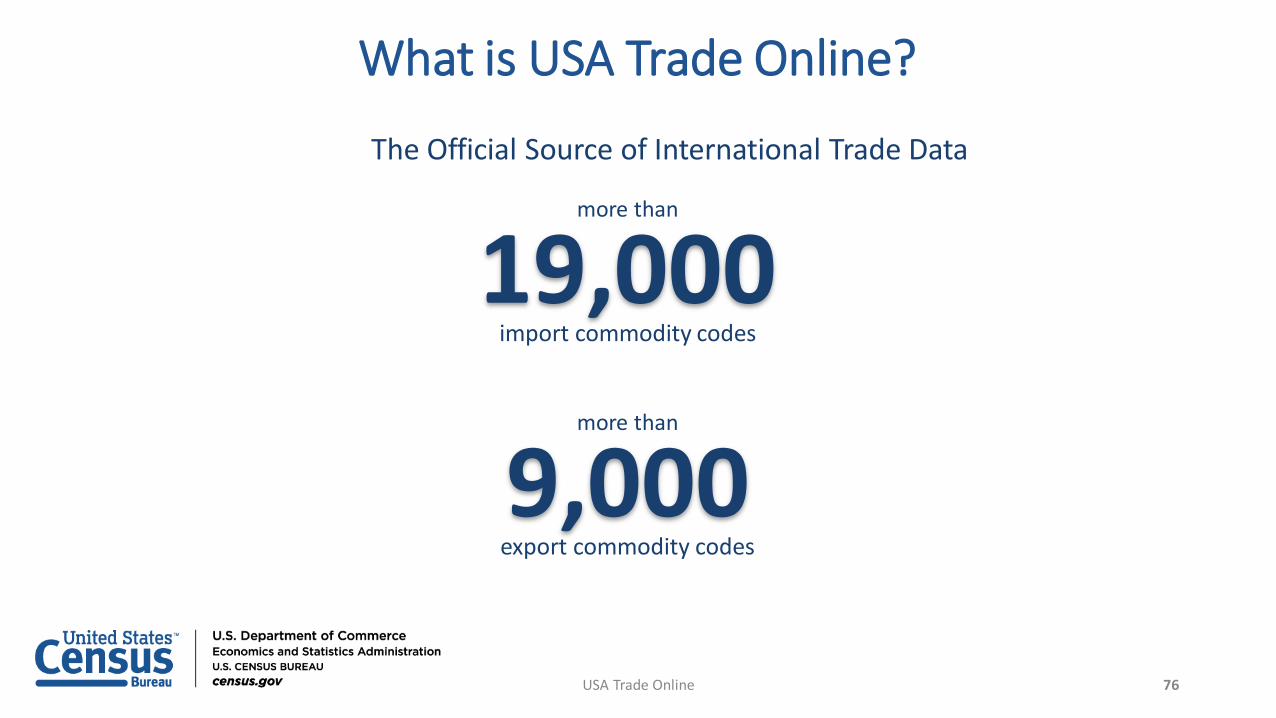
What is USA Trade Online?
more than
9,000export commodity codes
more than
19,000import commodity codes
The Official Source of International Trade Data
76USA Trade Online
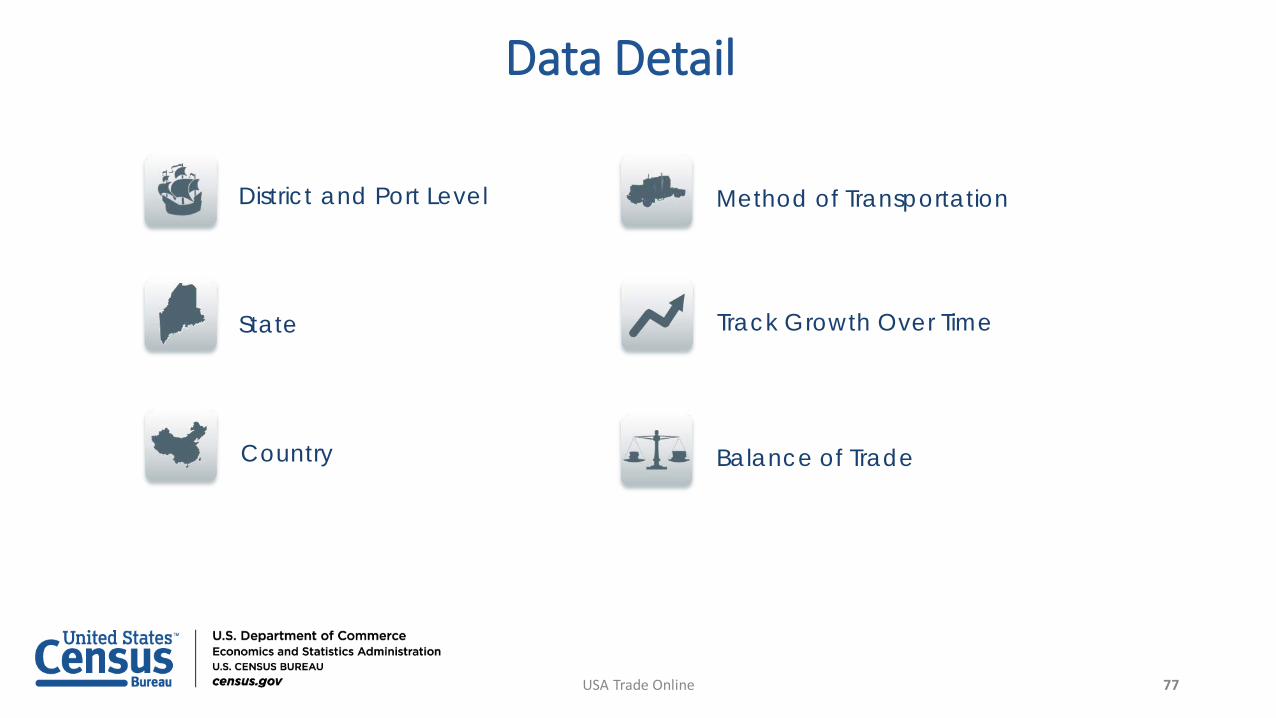
Data Detail
District and Port Level
State
Balance of Trade
Method of Transportation
Track Growth Over Time
Country
77USA Trade Online
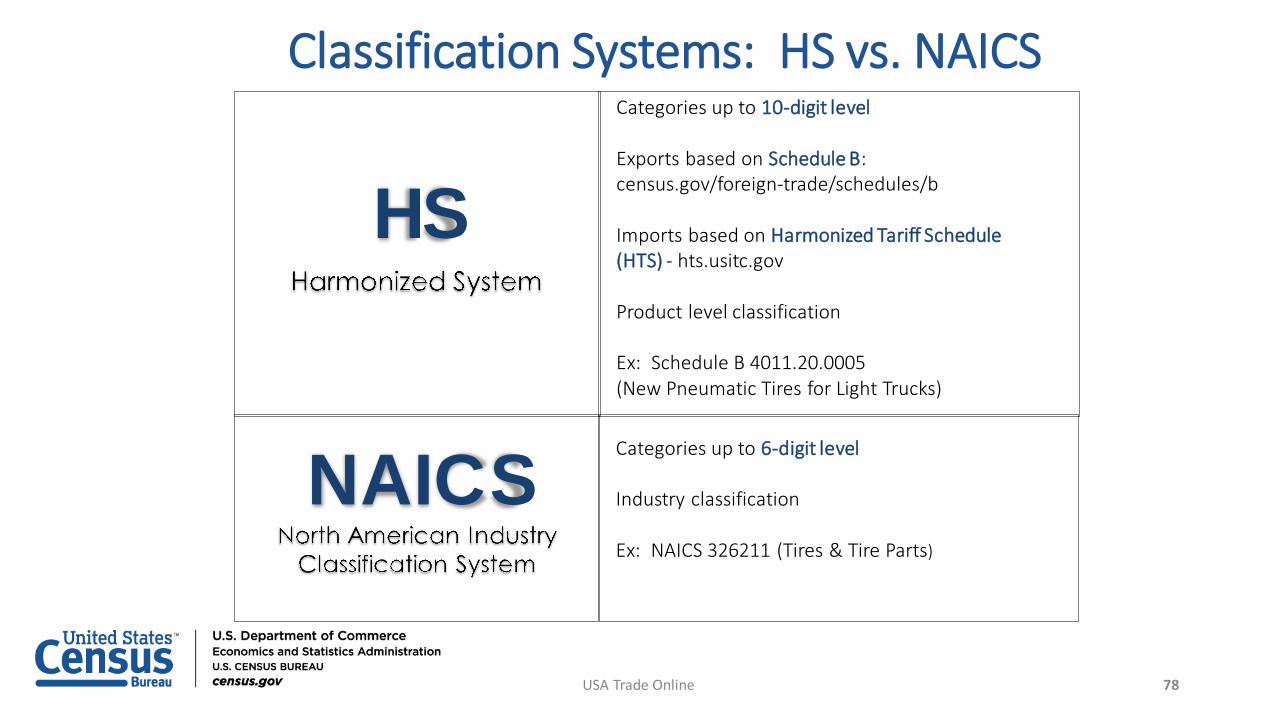
Classification Systems: HS vs. NAICS
HSCategories up to 10-digit level
Exports based on Schedule B: census.gov/foreign-trade/schedules/b
Imports based on Harmonized Tariff Schedule (HTS) - hts.usitc.gov
Product level classification
Ex: Schedule B 4011.20.0005 (New Pneumatic Tires for Light Trucks)
NAICS Categories up to 6-digit level
Industry classification
Ex: NAICS 326211 (Tires & Tire Parts)
78USA Trade Online
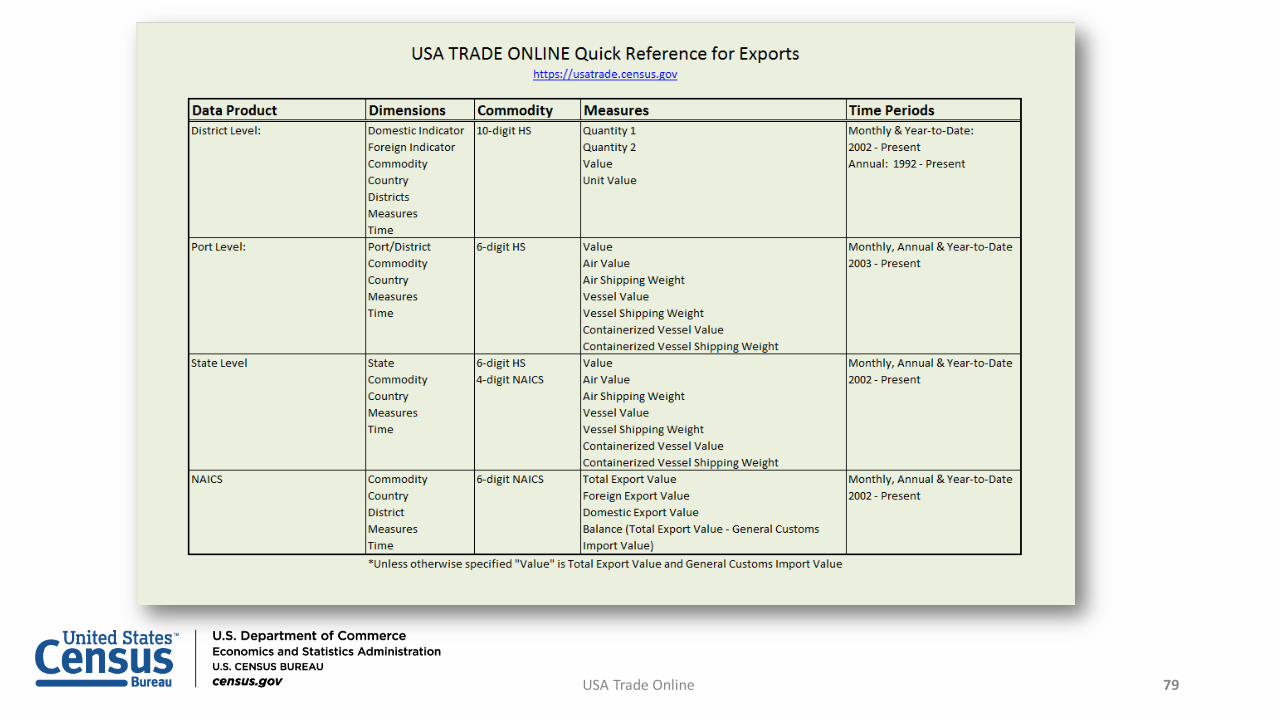
79USA Trade Online
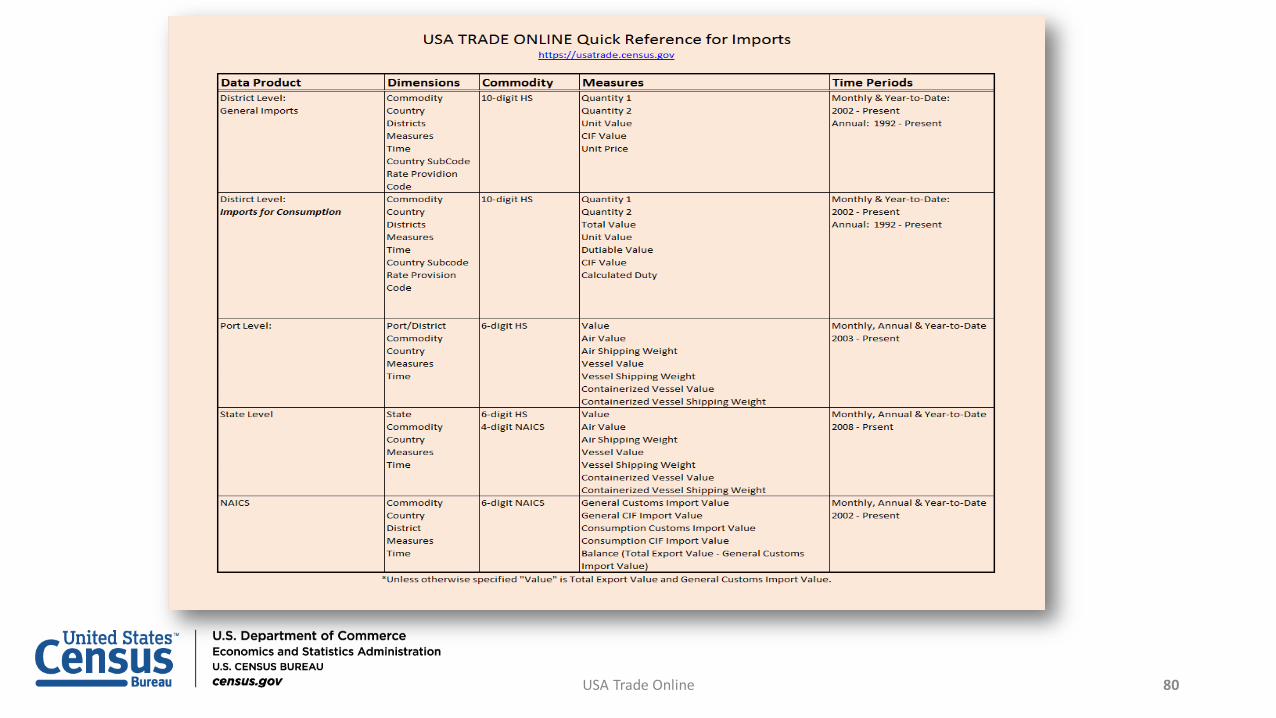
80USA Trade Online
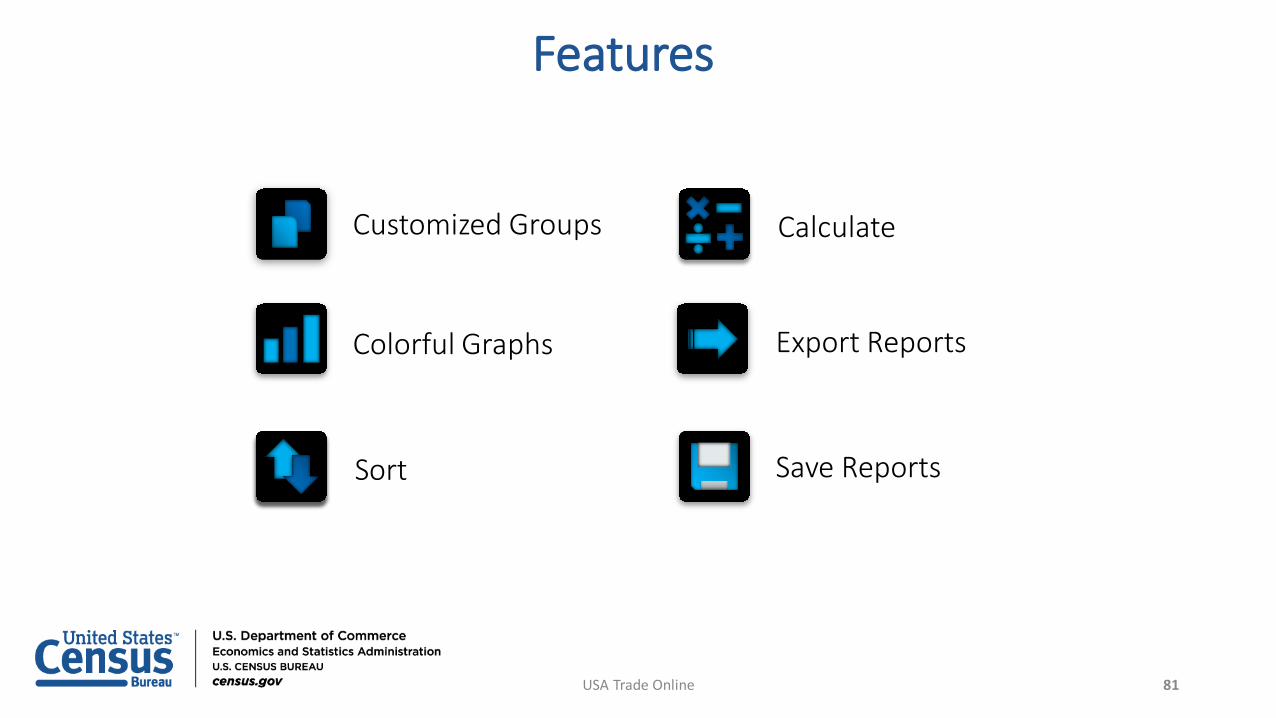
Customized Groups
Export Reports
Save Reports
Colorful Graphs
Sort
Calculate
Features
81USA Trade Online
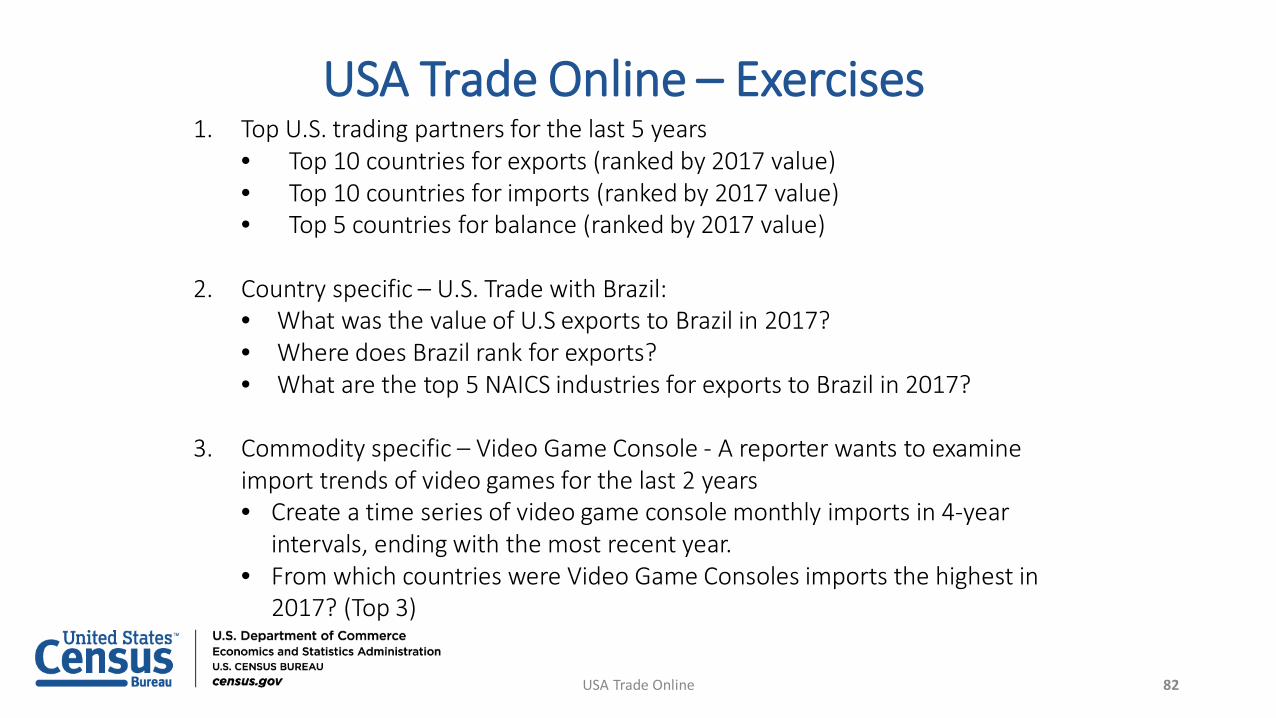
USA Trade Online – Exercises1. Top U.S. trading partners for the last 5 years
• Top 10 countries for exports (ranked by 2017 value)• Top 10 countries for imports (ranked by 2017 value)• Top 5 countries for balance (ranked by 2017 value)
2. Country specific – U.S. Trade with Brazil:• What was the value of U.S exports to Brazil in 2017?• Where does Brazil rank for exports?• What are the top 5 NAICS industries for exports to Brazil in 2017?
3. Commodity specific – Video Game Console - A reporter wants to examine import trends of video games for the last 2 years• Create a time series of video game console monthly imports in 4-year
intervals, ending with the most recent year. • From which countries were Video Game Consoles imports the highest in
2017? (Top 3)
82USA Trade Online
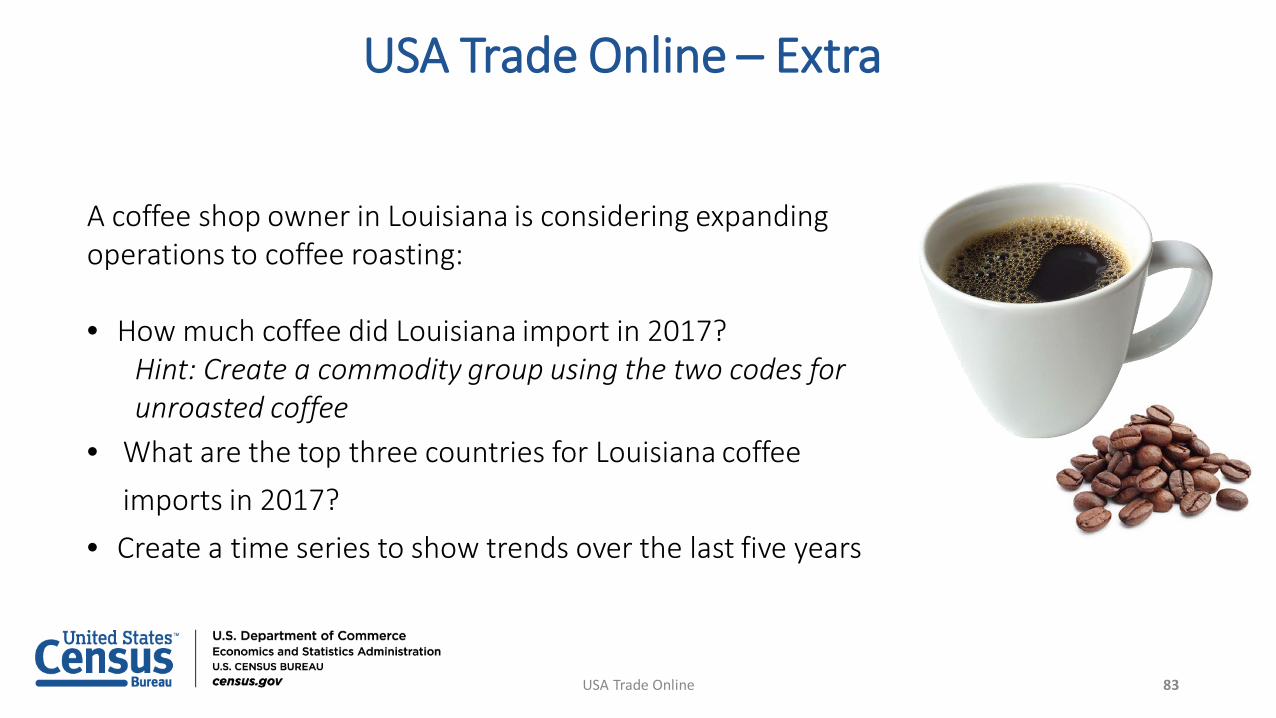
USA Trade Online – Extra
A coffee shop owner in Louisiana is considering expanding operations to coffee roasting:
• How much coffee did Louisiana import in 2017?Hint: Create a commodity group using the two codes for unroasted coffee
• What are the top three countries for Louisiana coffee imports in 2017?
• Create a time series to show trends over the last five years
83USA Trade Online
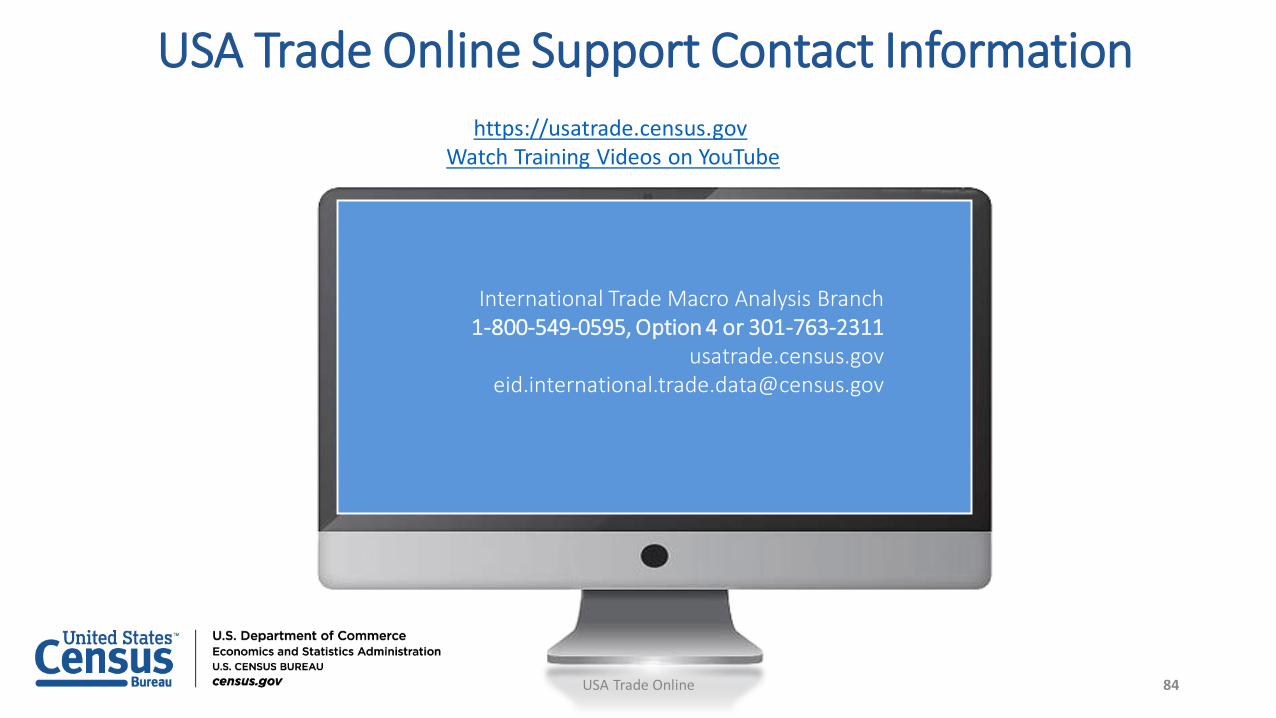
USA Trade Online Support Contact Informationhttps://usatrade.census.gov
Watch Training Videos on YouTube
International Trade Macro Analysis Branch1-800-549-0595, Option 4 or 301-763-2311
84USA Trade Online

QUESTIONS?
85USA Trade Online

86
Business Dynamics of Globally Engaged Firms
Fariha KamalCenter for Economic Studies
International Trade ConferenceNovember 14, 2018
DisclaimerAny opinions and conclusions expressed herein are those of the authors and do not necessarily represent the views of the U.S.
Census Bureau. All results have been reviewed to ensure that no confidential information is disclosed.
87Business Dynamics
Business Dynamics Statistics: Background
• BDS (https://www.census.gov/ces/dataproducts/bds/)• Provides annual measures of business dynamics (such as job creation and destruction,
establishment births and deaths, and firm startups and shutdowns) for the economy and aggregated by establishment and firm characteristics.
• Joint project between Research & Methodology and Economic Programs• Currently available: 1976-2015
• Selected research output• Decker, Haltiwanger, Miranda (2014; 2016); Haltiwanger, Jarmin, Miranda (2013); Fort,
Haltiwanger, Jarmin, Miranda (2013)
88Business Dynamics
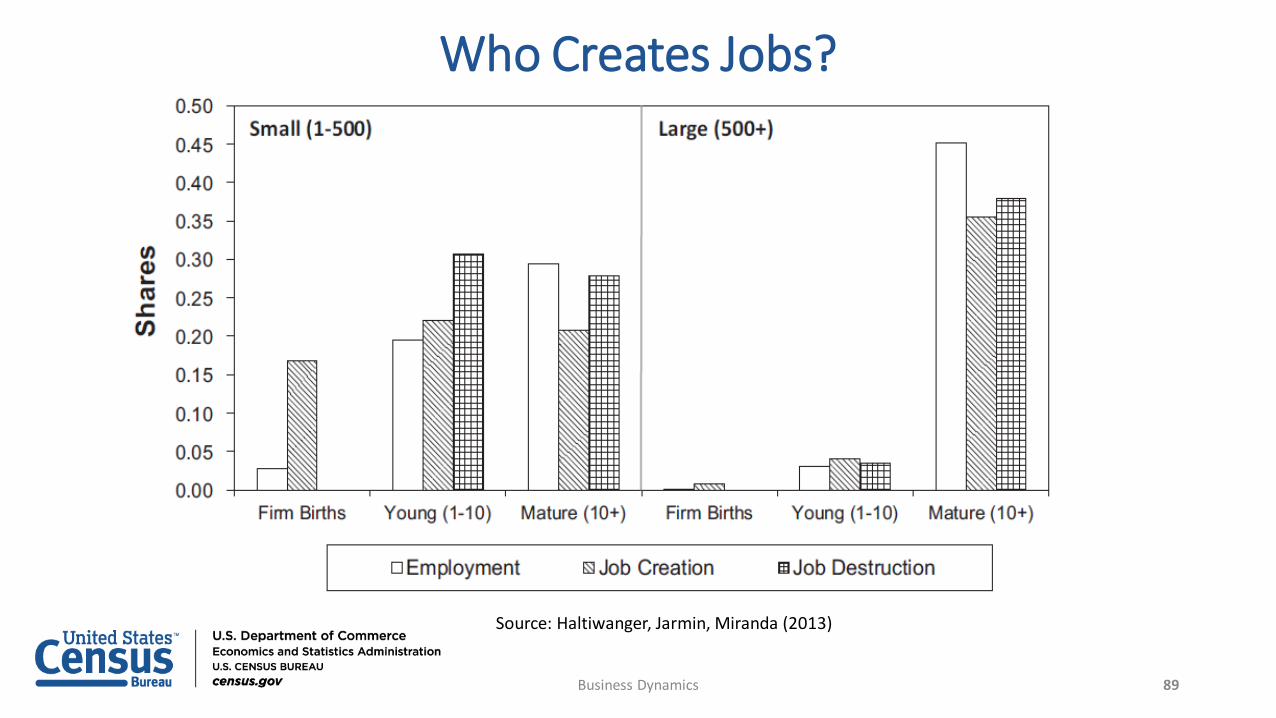
Who Creates Jobs?
Source: Haltiwanger, Jarmin, Miranda (2013)
89Business Dynamics
Motivation• Outsized role of globally engaged firms in the U.S. economy
• Top 1% of US trading firms account for over 80% of total US trade• Of these largest exporters, 90% also import goods and account for 66% of total US
goods imports• Global firms employed 13.8 million U.S. workers in 2007
90Business Dynamics
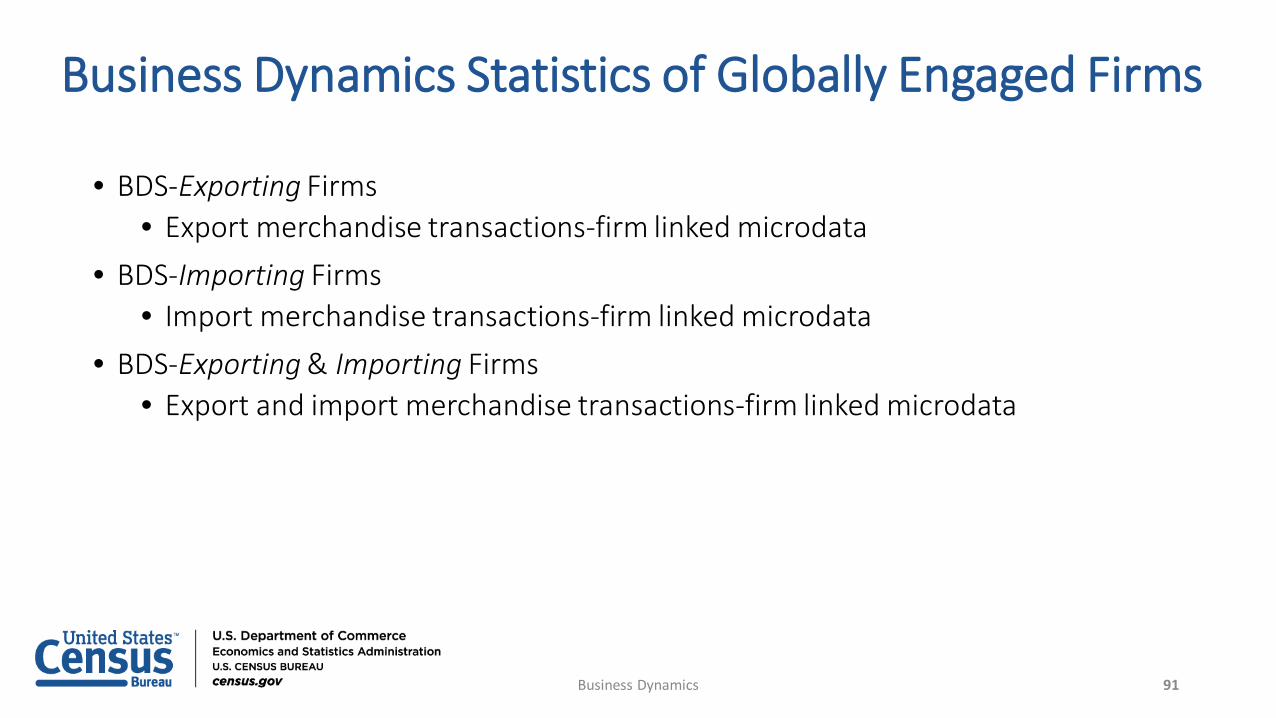
Business Dynamics Statistics of Globally Engaged Firms
• BDS-Exporting Firms• Export merchandise transactions-firm linked microdata
• BDS-Importing Firms• Import merchandise transactions-firm linked microdata
• BDS-Exporting & Importing Firms• Export and import merchandise transactions-firm linked microdata
91Business Dynamics
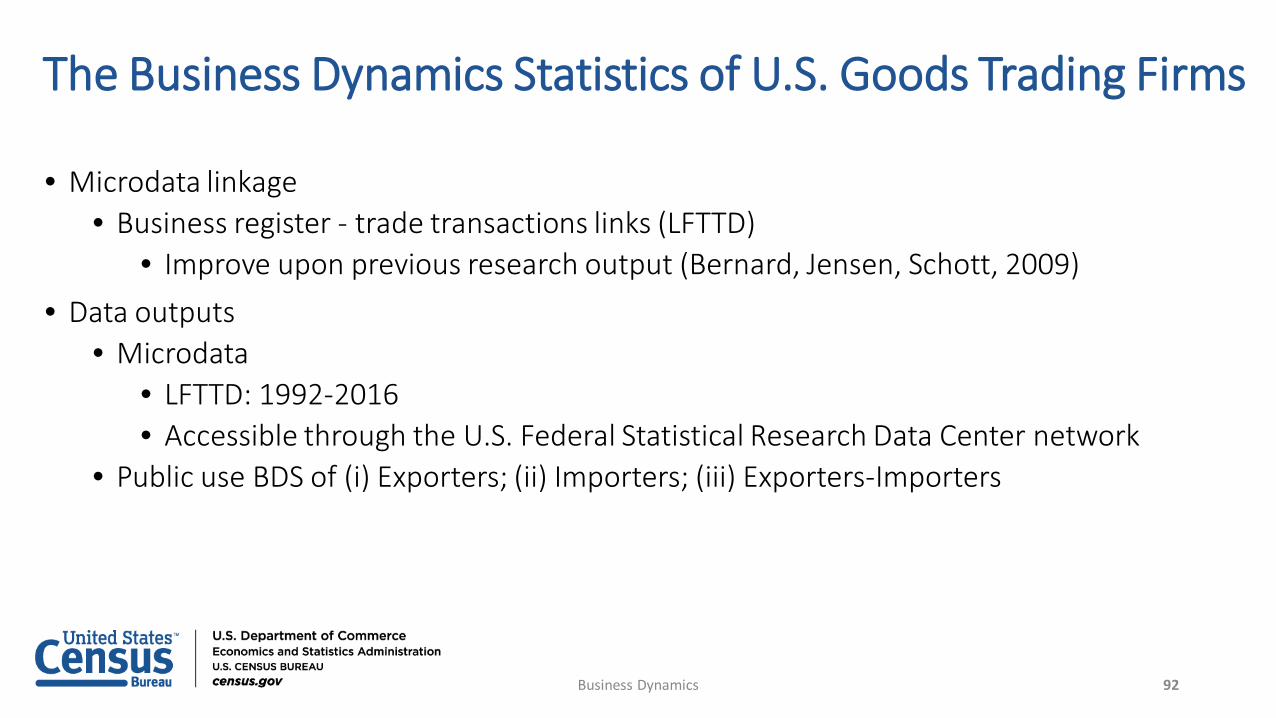
The Business Dynamics Statistics of U.S. Goods Trading Firms
• Microdata linkage • Business register - trade transactions links (LFTTD)
• Improve upon previous research output (Bernard, Jensen, Schott, 2009)• Data outputs
• Microdata• LFTTD: 1992-2016• Accessible through the U.S. Federal Statistical Research Data Center network
• Public use BDS of (i) Exporters; (ii) Importers; (iii) Exporters-Importers
92Business Dynamics
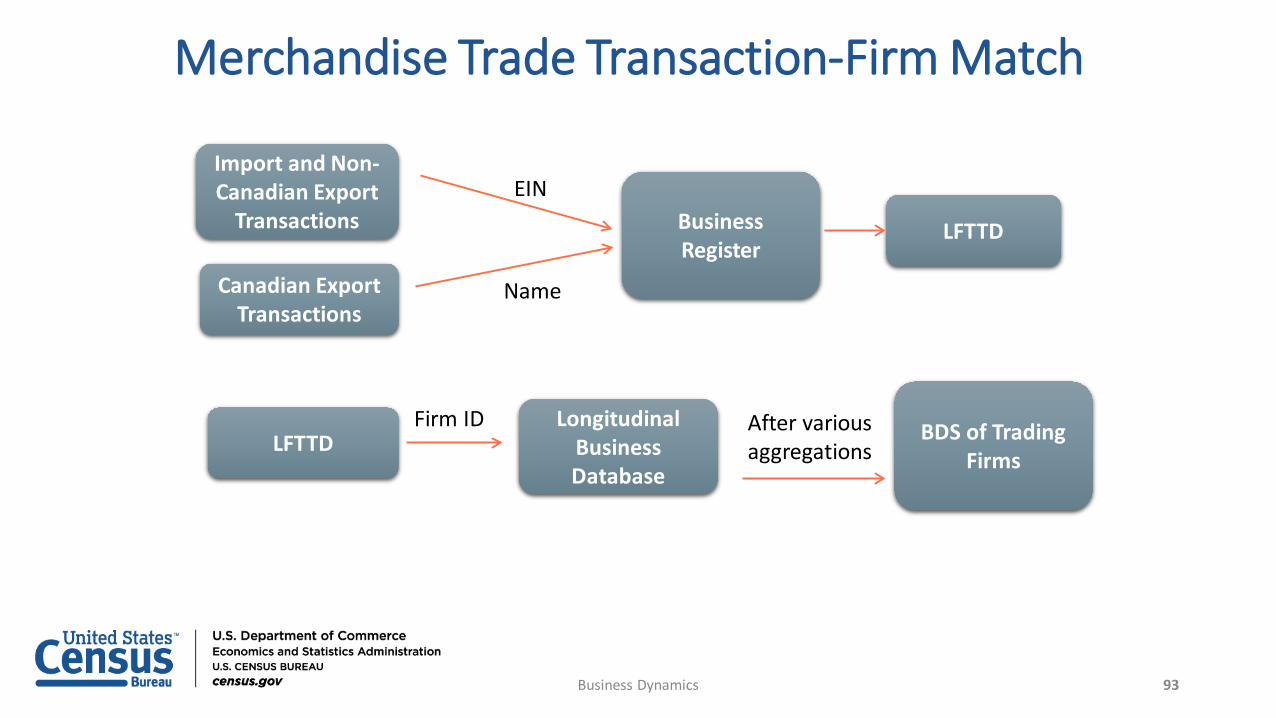
Merchandise Trade Transaction-Firm Match
LFTTD
Import and Non-Canadian Export
Transactions Business Register
NameCanadian Export Transactions
EIN
LFTTDLongitudinal
Business Database
BDS of Trading Firms
After various aggregations
Firm ID
93Business Dynamics
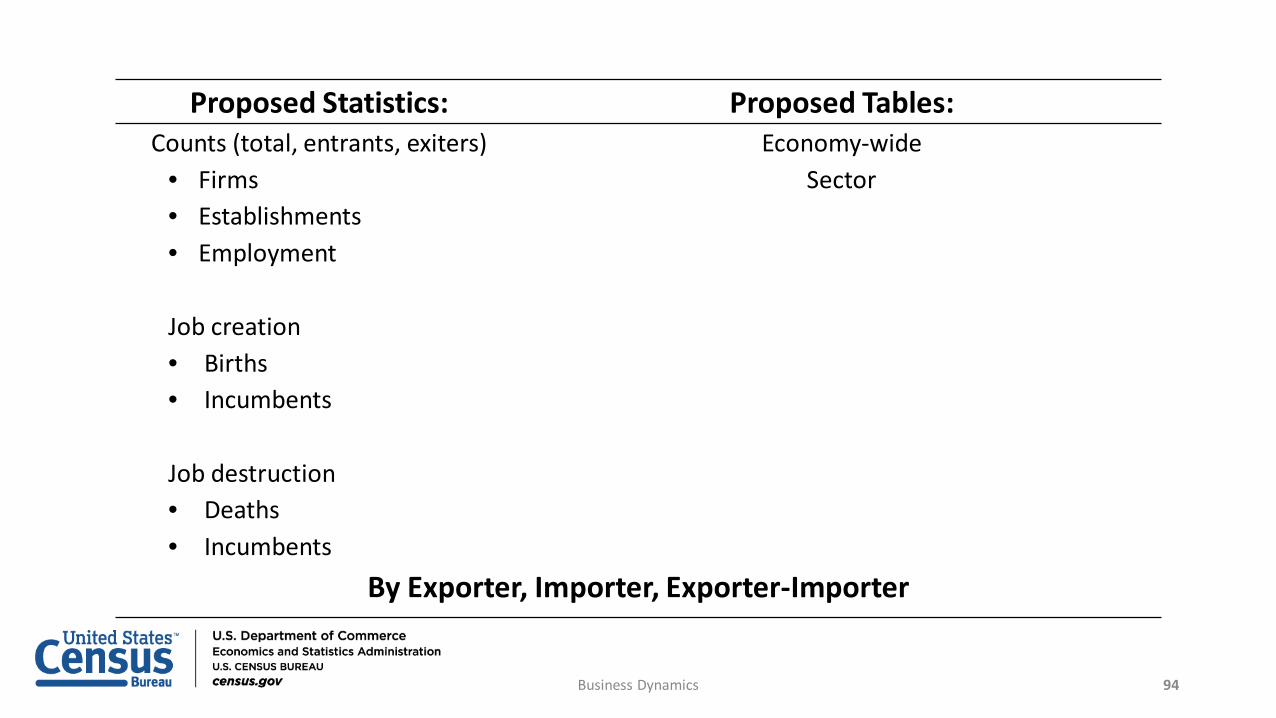
Proposed Statistics: Proposed Tables:Counts (total, entrants, exiters) Economy-wide
• Firms• Establishments • Employment
Sector
Job creation • Births• Incumbents
Job destruction• Deaths• Incumbents
By Exporter, Importer, Exporter-Importer
94Business Dynamics
Selected Statistics for Goods Exporters
All calculations based on beta version; Revisions expected.
95Business Dynamics
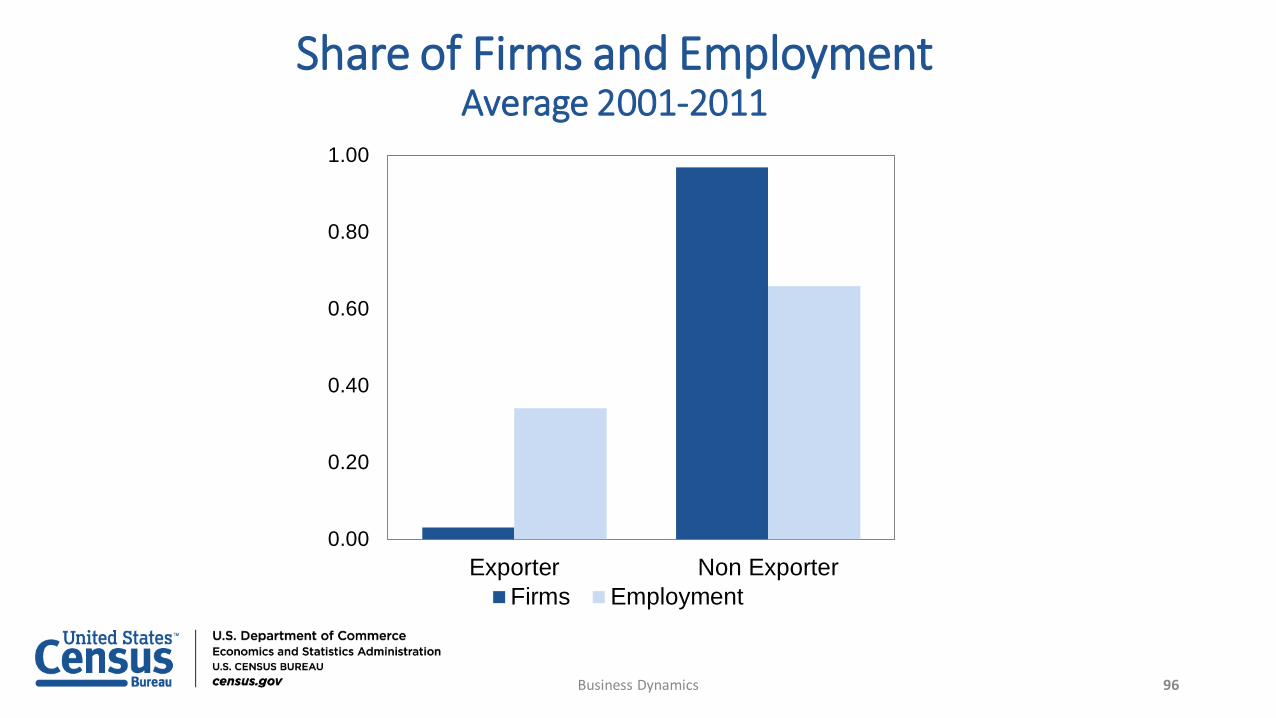
Share of Firms and EmploymentAverage 2001-2011
0.00
0.20
0.40
0.60
0.80
1.00
Exporter Non ExporterFirms Employment
96Business Dynamics
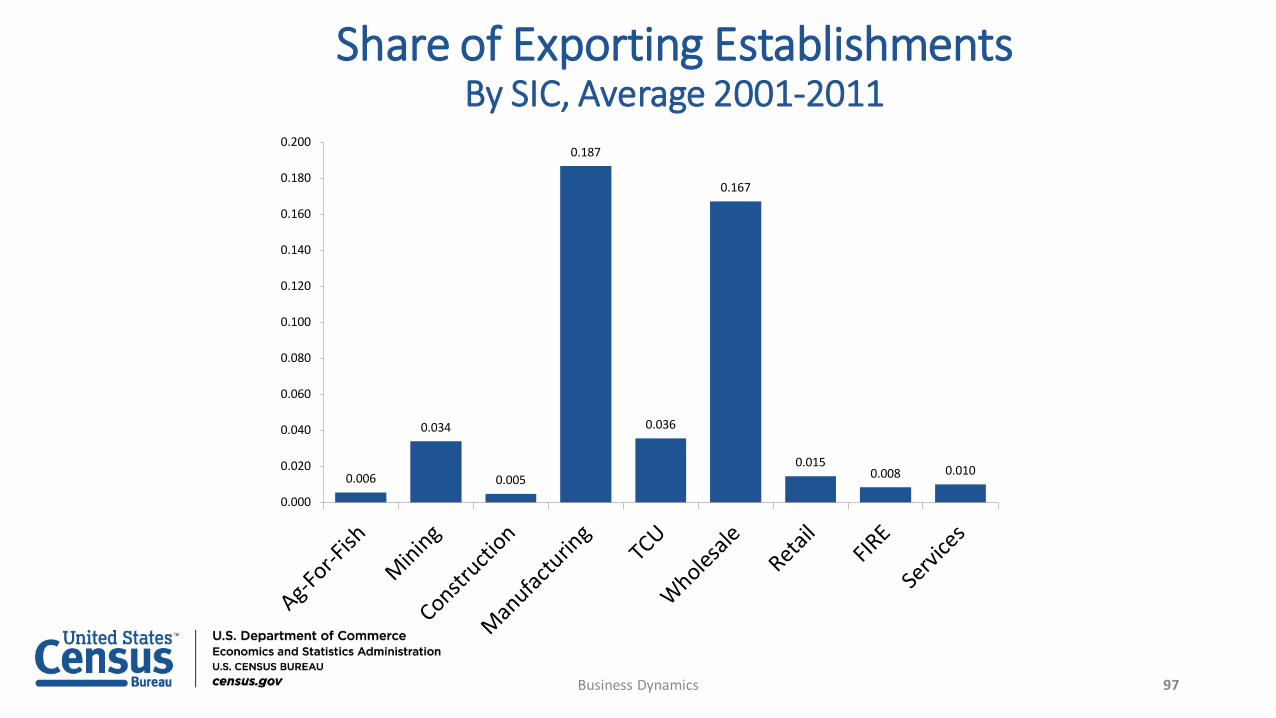
Share of Exporting EstablishmentsBy SIC, Average 2001-2011
0.006
0.034
0.005
0.187
0.036
0.167
0.0150.008 0.010
0.000
0.020
0.040
0.060
0.080
0.100
0.120
0.140
0.160
0.180
0.200
97Business Dynamics
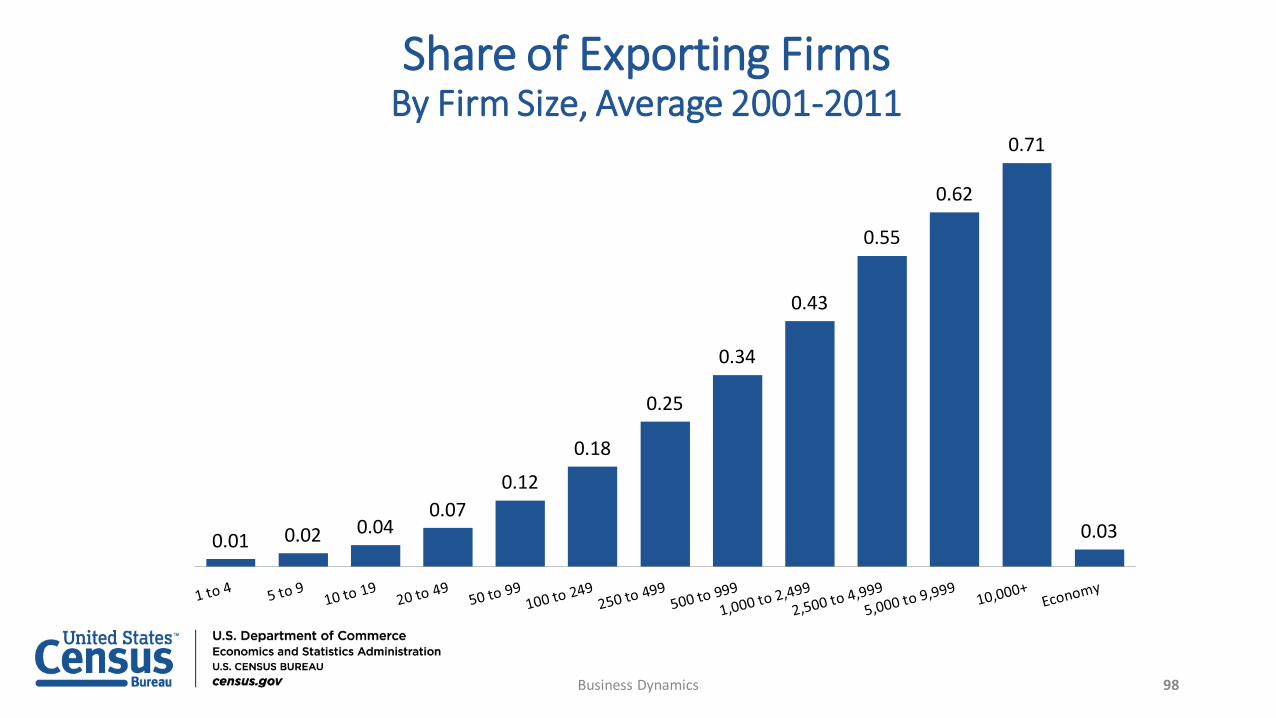
Share of Exporting FirmsBy Firm Size, Average 2001-2011
0.01 0.02 0.040.07
0.12
0.18
0.25
0.34
0.43
0.55
0.62
0.71
0.03
98Business Dynamics
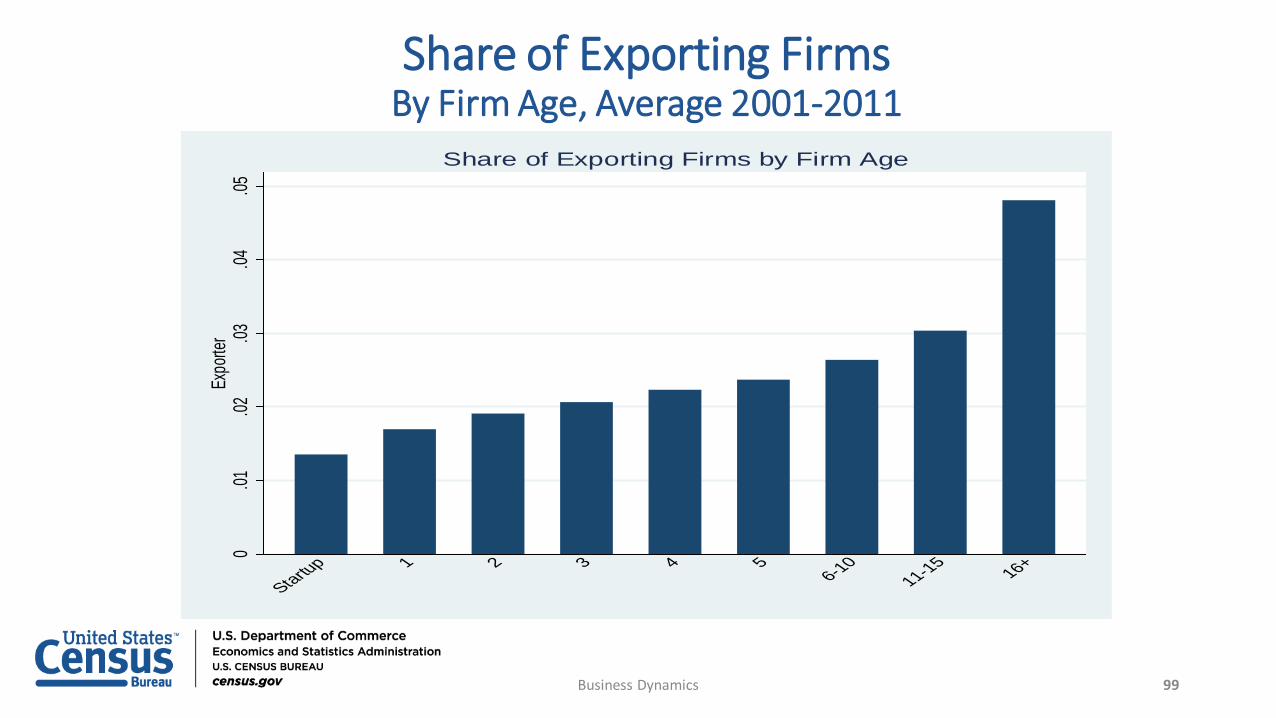
Share of Exporting FirmsBy Firm Age, Average 2001-2011
0.01
.02.03
.04.05
Expo
rter
Startup 1 2 3 4 56-10
11-15 16+
Share of Exporting Firms by Firm Age
99Business Dynamics
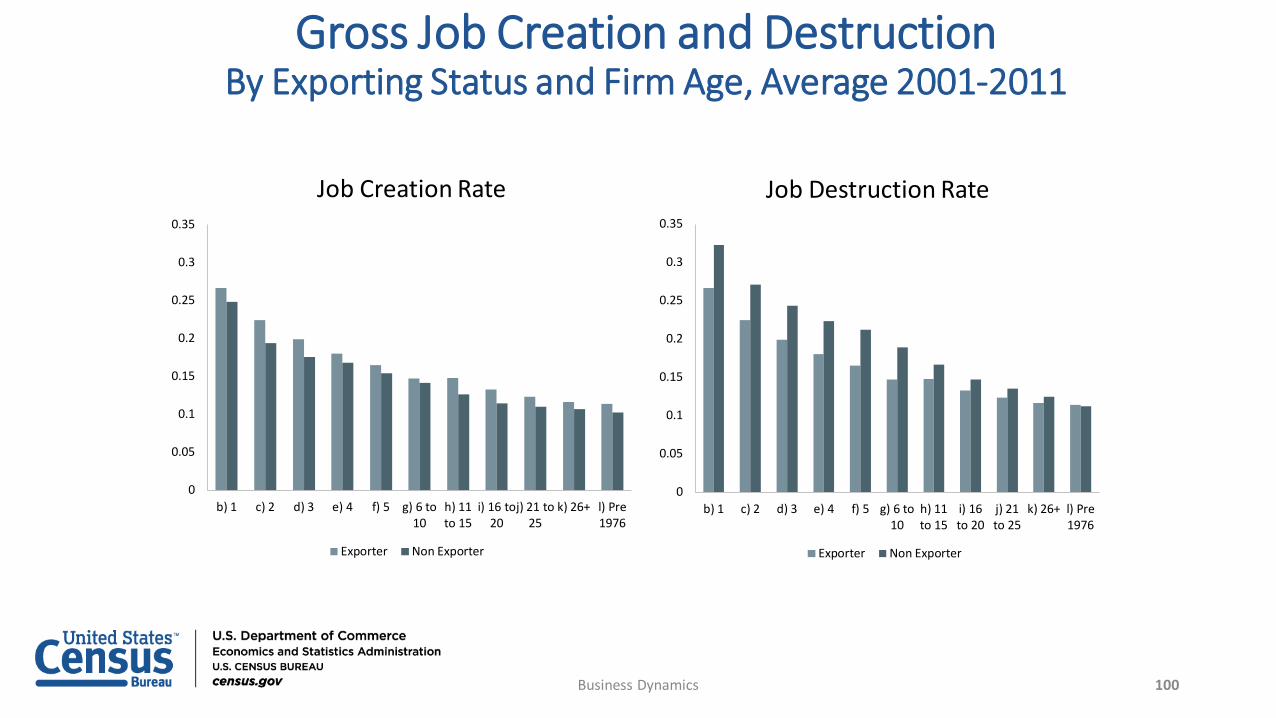
Gross Job Creation and DestructionBy Exporting Status and Firm Age, Average 2001-2011
Job Creation Rate Job Destruction Rate
0
0.05
0.1
0.15
0.2
0.25
0.3
0.35
b) 1 c) 2 d) 3 e) 4 f) 5 g) 6 to10
h) 11to 15
i) 16 to20
j) 21 to25
k) 26+ l) Pre1976
Exporter Non Exporter
0
0.05
0.1
0.15
0.2
0.25
0.3
0.35
b) 1 c) 2 d) 3 e) 4 f) 5 g) 6 to10
h) 11to 15
i) 16to 20
j) 21to 25
k) 26+ l) Pre1976
Exporter Non Exporter
100Business Dynamics
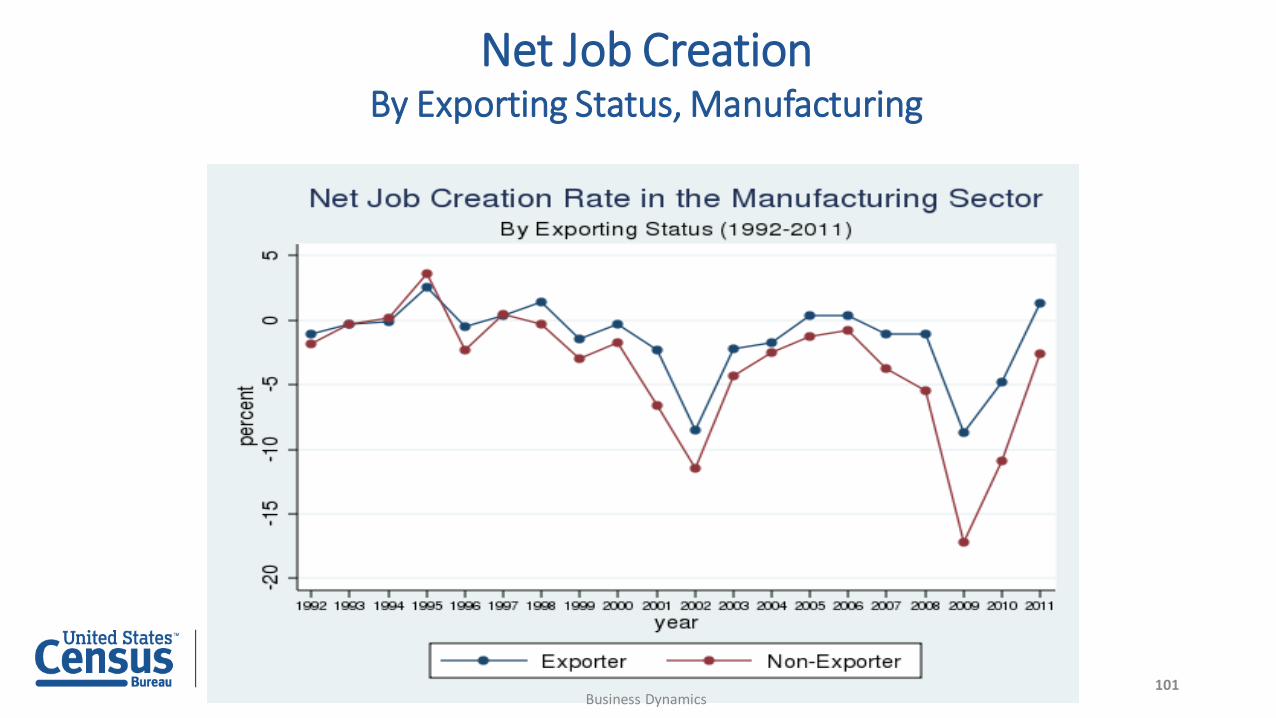
Net Job CreationBy Exporting Status, Manufacturing
101Business Dynamics
Ongoing Work
• Representativeness• Unmatched transactions• Improve coverage of low-value merchandise traders
• Identification of all traders• Trade in services
102Business Dynamics
QUESTIONS?
103Business Dynamics

104