Understanding fiber for profitable ration decisions Goeser - Proceedings - Understandi… ·...
15
Understanding fiber for profitable ration decisions 1 John P Goeser, PhD, PAS & Dipl. ACAN Nutrition Director, Rock River Laboratory, Inc. Adjunct Assistant Professor, University of Wisconsin - Madison, WI, Dairy Science Dept. Consultant, Cows Agree Consulting, LLC Fiber in dairy diets Carbohydrate impact upon animal and ruminant nutrition is not a new focal point for nutritionists. Hall and Mertens (2017) recently reviewed 100 years of carbohydrate research relative to ruminant nutrition. Fiber, defined as Neutral Detergent Fiber (aNDF; Goering and Van Soest, 1970) in dairy nutrition, contributes two major facets of dairy diets. It is important for both physical and energetic aspects. Energetically, fiber theoretically contains equivalent calories per g as do starch and sugars - however a substantial portion of calories in fiber remain locked in undigestible form. Hence, fiber provides the least energy per pound of all nutrients in the total mixed ration (TMR). From a physically effectiveness factor standpoint, fiber is also essential to maintain rumen health and function. It’s important to simultaneously consider both fiber’s physically effective and energetic attributes together, as these are important in their own right but also combined into newer nutrition metrics. Fiber analysis Considerable confusion exists yet today within the industry around fiber analyses. Figure 1 demonstrates the detergent fiber fractions after the detergent system of fiber analysis developed by Prof Peter Van Soest and colleagues (Goering and Van Soest, 1970). Forage analysis laboratories sequentially rinse (like a laundry machine) feed samples with neutral, mildly acidic and then strongly acidic solutions to wash away portions and then weigh back the residue post rinse. Each detergent insoluble fraction is determined by relating the residue weight to original dry matter. There is typically a small amount of ash (for example, soil contamination) contained within each detergent insoluble fraction. Think of this like gravel or sand in your jean pockets after putting them through the wash. This is corrected for by ashing the residue post detergent rinsing. 1 This article has been adapted and modified from that originally published in the Proceedings to the 2018 Four State Dairy Nutrition Conference, Dubuque, IA; then modified further and published in Proc. 2019 Pacific Northwest Animal Nutrition Conference, Boise, ID.
Transcript of Understanding fiber for profitable ration decisions Goeser - Proceedings - Understandi… ·...
Understanding fiber for profitable ration decisions 1
John P Goeser, PhD, PAS & Dipl. ACAN Nutrition Director, Rock River Laboratory, Inc. Adjunct Assistant Professor, University of Wisconsin - Madison, WI, Dairy Science Dept. Consultant, Cows Agree Consulting, LLC Fiber in dairy diets Carbohydrate impact upon animal and ruminant nutrition is not a new focal point for nutritionists. Hall and Mertens (2017) recently reviewed 100 years of carbohydrate research relative to ruminant nutrition. Fiber, defined as Neutral Detergent Fiber (aNDF; Goering and Van Soest, 1970) in dairy nutrition, contributes two major facets of dairy diets. It is important for both physical and energetic aspects. Energetically, fiber theoretically contains equivalent calories per g as do starch and sugars - however a substantial portion of calories in fiber remain locked in undigestible form. Hence, fiber provides the least energy per pound of all nutrients in the total mixed ration (TMR). From a physically effectiveness factor standpoint, fiber is also essential to maintain rumen health and function. It’s important to simultaneously consider both fiber’s physically effective and energetic attributes together, as these are important in their own right but also combined into newer nutrition metrics.
Fiber analysis
Considerable confusion exists yet today within the industry around fiber analyses. Figure 1 demonstrates the detergent fiber fractions after the detergent system of fiber analysis developed by Prof Peter Van Soest and colleagues (Goering and Van Soest, 1970). Forage analysis laboratories sequentially rinse (like a laundry machine) feed samples with neutral, mildly acidic and then strongly acidic solutions to wash away portions and then weigh back the residue post rinse. Each detergent insoluble fraction is determined by relating the residue weight to original dry matter. There is typically a small amount of ash (for example, soil contamination) contained within each detergent insoluble fraction. Think of this like gravel or sand in your jean pockets after putting them through the wash. This is corrected for by ashing the residue post detergent rinsing.
1 This article has been adapted and modified from that originally published in the Proceedings to the 2018 Four State Dairy Nutrition Conference, Dubuque, IA; then modified further and published in Proc. 2019 Pacific Northwest Animal Nutrition Conference, Boise, ID.

Figure 1: The fiber nesting doll. The acid detergent fiber (ADF), neutral and acid detergent insoluble crude protein (NDICP, ADICP), lignin and ash are nested within aNDF. Image Adapted from the March 10, 2018 Hoard’s Dairyman article, “Dairy nutrition’s tribal language: speaking fiber.”
Fiber - Physical attributes
With dairy diets, we typically feed adequate fiber to maintain sound rumen function and metabolism. While at times there may be perception of clinical acidosis or subacute rumen acidosis (SARA), my experience has been that very few of today’s formulated diets are responsible for clinical symptoms. Rather, management factors such as feed delivery timing or feed mixing are more contributing factors toward rumen health and SARA.
To date, there is no accepted “standard” in quantifying physically effective aNDF (peNDF, % of aNDF or DM). Prof Mertens’ work suggested the 1.18 mm size was ideal, and that 21 to 23% of DM was ideal for TMR. Yet work from Penn State and others suggested the 4 mm size may be more accurate in determining effectiveness factor. Both 1.18 and 4 mm sieves are now incorporated within the Penn State particle size separator and the aNDF percentage or particles (% of total) greater than these sizes can be readily determined (Heinrichs, 2013). Of note, the NRC (2001) held back from making recommendations for fiber effectiveness. Rather, the National Research Council committee provided recommendations for forage NDF, % of DM, at varying fiber to NFC (starch and sugar) ratios. Fragility (i.e. alfalfa fiber being more fragile than grass fiber; Allen, 2000) is another concept contributing to fiber’s effectiveness that warrants further exploration but is vaguely understood and characterized today.

Energetic attributes
Starch, sugar and fiber are all carbohydrates, containing the same calorie content, around 4 calories per gram. Both starch and fiber (cellulose) are generally chains of glucose bonded together. Yet the energy available to the cow varies greatly between these two nutrients. The enormous difference in energy available is due both the type of glucose-glucose bond (alpha- vs beta- bond configurations) as well as lignin and cell wall crosslinking that further zippers cellulose into a less digestible complex. In 2014, I surveyed several meta-analyses and summarized fiber and starch digestion data from more recent published lactating cow feeding studies. Total-tract fiber digestion in lactating cows averages about 40 to 50% whereas total-tract starch digestion averages over 90% (Goeser, 2014). Commercial dairy cow apparent fiber and starch digestion, assessed by TMR apparent digestion (TMRD) approach, are similar to published research (Figure 2).
Figure 2: Apparent total-tract fiber digestibility measures for commercial dairies (Rock River Laboratory, Inc; unpublished data since 2015). Organic matter digestibility (% OM), total tract NDF digestibility (% of NDF) and total tract starch digestibility (% of starch) distributions.

In the 2014 summary, the aim was to revisit laboratory fiber and starch digestion measures relative to in vivo apparent digestion results for commercial dairies, ultimately recognizing that 30h in vitro NDF digestion values overestimate real aNDF digestion, thus questioned the value of a 30h NDFD measure.
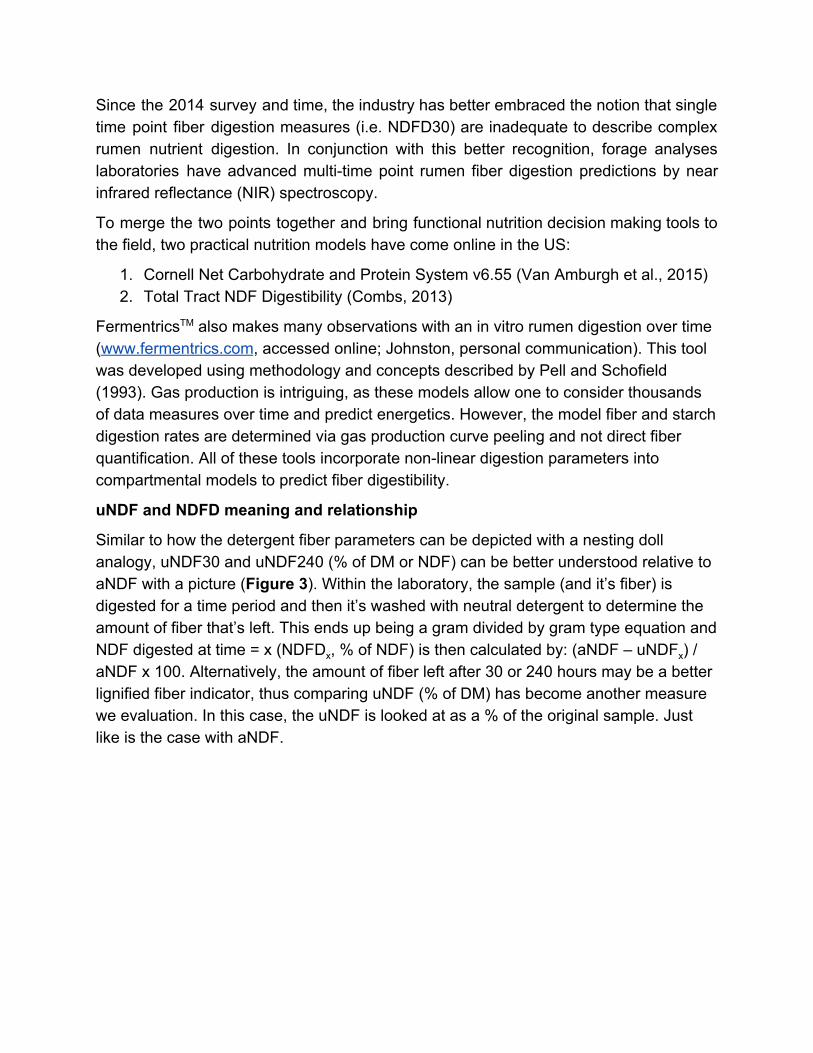
Since the 2014 survey and time, the industry has better embraced the notion that single time point fiber digestion measures (i.e. NDFD30) are inadequate to describe complex rumen nutrient digestion. In conjunction with this better recognition, forage analyses laboratories have advanced multi-time point rumen fiber digestion predictions by near infrared reflectance (NIR) spectroscopy.
To merge the two points together and bring functional nutrition decision making tools to the field, two practical nutrition models have come online in the US:
1. Cornell Net Carbohydrate and Protein System v6.55 (Van Amburgh et al., 2015) 2. Total Tract NDF Digestibility (Combs, 2013)
FermentricsTM also makes many observations with an in vitro rumen digestion over time (www.fermentrics.com, accessed online; Johnston, personal communication). This tool was developed using methodology and concepts described by Pell and Schofield (1993). Gas production is intriguing, as these models allow one to consider thousands of data measures over time and predict energetics. However, the model fiber and starch digestion rates are determined via gas production curve peeling and not direct fiber quantification. All of these tools incorporate non-linear digestion parameters into compartmental models to predict fiber digestibility.
uNDF and NDFD meaning and relationship
Similar to how the detergent fiber parameters can be depicted with a nesting doll analogy, uNDF30 and uNDF240 (% of DM or NDF) can be better understood relative to aNDF with a picture (Figure 3). Within the laboratory, the sample (and it’s fiber) is digested for a time period and then it’s washed with neutral detergent to determine the amount of fiber that’s left. This ends up being a gram divided by gram type equation and NDF digested at time = x (NDFDx, % of NDF) is then calculated by: (aNDF – uNDFx) / aNDF x 100. Alternatively, the amount of fiber left after 30 or 240 hours may be a better lignified fiber indicator, thus comparing uNDF (% of DM) has become another measure we evaluation. In this case, the uNDF is looked at as a % of the original sample. Just like is the case with aNDF.
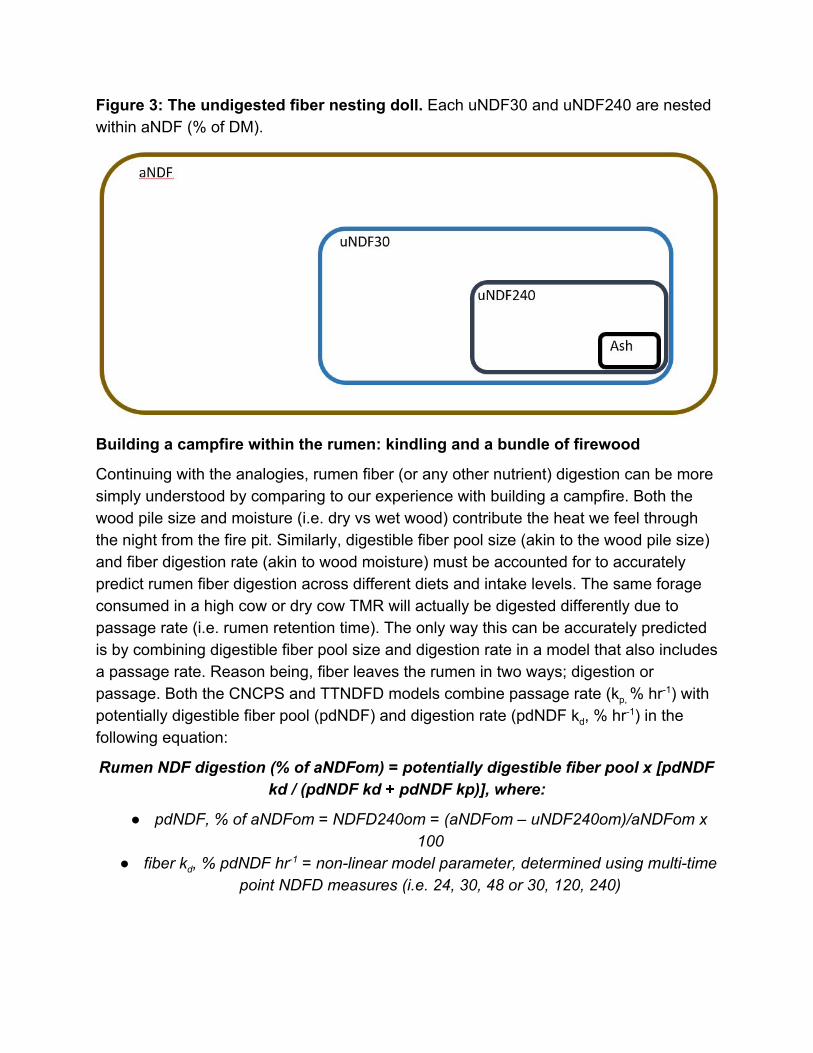
Figure 3: The undigested fiber nesting doll. Each uNDF30 and uNDF240 are nested within aNDF (% of DM).
Building a campfire within the rumen: kindling and a bundle of firewood
Continuing with the analogies, rumen fiber (or any other nutrient) digestion can be more simply understood by comparing to our experience with building a campfire. Both the wood pile size and moisture (i.e. dry vs wet wood) contribute the heat we feel through the night from the fire pit. Similarly, digestible fiber pool size (akin to the wood pile size) and fiber digestion rate (akin to wood moisture) must be accounted for to accurately predict rumen fiber digestion across different diets and intake levels. The same forage consumed in a high cow or dry cow TMR will actually be digested differently due to passage rate (i.e. rumen retention time). The only way this can be accurately predicted is by combining digestible fiber pool size and digestion rate in a model that also includes a passage rate. Reason being, fiber leaves the rumen in two ways; digestion or passage. Both the CNCPS and TTNDFD models combine passage rate (kp, % hr-1) with potentially digestible fiber pool (pdNDF) and digestion rate (pdNDF kd, % hr-1) in the following equation:
Rumen NDF digestion (% of aNDFom) = potentially digestible fiber pool x [pdNDF kd / (pdNDF kd + pdNDF kp)], where:
● pdNDF, % of aNDFom = NDFD240om = (aNDFom – uNDF240om)/aNDFom x 100
● fiber kd, % pdNDF hr-1 = non-linear model parameter, determined using multi-time point NDFD measures (i.e. 24, 30, 48 or 30, 120, 240)
Fiber digestion term dictionary
● aNDF = NDF determined with amylase in the neutral detergent solution ● aNDFom = aNDF corrected for ash ● uNDF = undigested aNDF following a discrete digestion time (i.e. 30 or 240 h) ● iNDF = indigestible aNDF, theoretical value determined only by nonlinear
modelling ● uNDFom = undigested fiber corrected for ash ● NDFD = digested aNDF, expressed as a percent of aNDF ● dNDF = digested aNDF, expressed as a percent of DM ● pdNDF = potentially digestible NDF, % of aNDF or aNDFom ● pdNDF kd = fiber digestion rate, % of pdNDF / hour
Semantics
Often, “kd rate” has been used to describe fiber or starch digestion rates. “kd rate” is grammatically incorrect as the “k” is defined as the rate coefficient and the “d” is defined as digestion. Hence, “kd rate” is redundant and akin to stating, “Digestion rate rate”.
Breeding and managing forages for better NDF digestibility
While uNDF and digestion rate are related to one another, they both can be improved. Reduced lignin forages have lesser uNDF levels and correspondingly greater digestible NDF pools. Reducing uNDF in feeds can be achieved in two ways; 1) diluting the uNDF with more digestible nutrients such as starch, protein or sugar or 2) breeding or managing to lessen the uNDF as a percentage of total aNDF. Brown midrib corn mutants and low-lignin alfalfa varieties improve quality by decreasing uNDF as a percent of total fiber. Beyond lessening uNDF, Prof David Combs (personal communication) has suggested that digestion rate may also be heritable.
In managing forages, harvesting alfalfa and grass crops earlier both lessens uNDF and increases fiber digestion rates. Cross linking within cell walls develops as plants mature and decreases bacterial access to cellulose, thus decreasing both digestion speed and extent. Cut first crop alfalfa each year at 22 to 24” height on the PEAQ stick (Hintz and Albrecht, 1993). Do not assume 28 day cutting intervals result in dairy quality forage. Scout fields starting about 17 days after the prior cutting and monitoring plant maturity every 3 to 5 days then with scissors clipping.
Decision making with specific uNDF or NDFD metrics
With forages harvested or purchased and stored, making decisions solely based upon 30 or 48 h NDFD can now be considered “old school”. Both uNDF (or pdNDF) and the pdNDF kd should be used in decision making, balancing and modeling. The pdNDF kd

should never be interpreted by itself, as it depends upon the uNDF level. However, uNDF values have utility as a better lignification measure.
uNDF
Monitor uNDF240 levels (% of DM) in diets, on a herd by herd basis. To my knowledge, there is not an industry accepted or published benchmark for a certain uNDF level that will limit intakes, however within a herd these metrics can prove valuable to help formulate forage inclusion rates when switching forage sources. Further, uNDF level can be used to project cash flow in certain circumstances. For example, Dr. Sam Fessenden (AMTS technical services; personal communication) has taught to use uNDF (g CHO-C) as a tool to consider when forecasting intake responses on a herd by herd basis. Sam has suggested that diet projections can be compared by using different forages at similar dry matter intakes but further by also comparing the diet scenarios and maintaining CHO-C level relatively constant between diets.
TTNDFD
Prof David Combs (personal communication) has taught to use forage TTNDFD as practical decision making parameter for feed allocation. Feeds with TTNDFD values greater than 45 to 47% (of aNDF) should be allocated to fresh and high performing diets. Feeds with values less than 40% should be directed to heifers and dry cows or later lactation pens.
peuNDF240
Prof Rick Grant and his former graduate student, Wyatt Smith, have assessed both TMR uNDF240 and physically effective factor, and combined these two parameters into peuNDF240 (Grant et al., 2018 and R. Grant, personal communication). To this point, Prof Grant’s group have evaluated data pooled from several experiments at Miner Institute. Diet peuNDF240 appears to be more tightly correlated with dry matter intakes and performance in high producing dairy cattle at the Miner Institute. While field data are lacking currently, our group is in the process of a collaborative research project evaluating field TMR samples for peuNDF240 and to what extent this factor is related to intakes and performance. This project stems from a recent internship field survey, which will be discussed later in this article (Geiser and Goeser, 2019).
Reduced lignin feed impact on farm profitability
Research investigating reduced lignin corn silage, published by both plant breeders and animal scientists, dates back decades and brown-midrib mutations appear to largely impact the pdNDF but not the pdNDF digestion rate (Cherney et al., 1991). The production response often discussed however additional factors beyond milk production per cow per day need to be considered in whole-farm partial budget evaluations. Crop

production costs, yield per acre, and dry matter intake (or feed conversion) need to be incorporated into cash flow projections.
Production response: Prof Ferraretto and Prof Shaver’s meta-analysis approach observed slightly greater than 3 pounds per cow per day milk response for BMR relative to conventional silages. This milk production gain was slightly offset by a significant decrease in butterfat production and approximate 2 pound per cow increase in dry matter intake. Note that in many cases these silages were managed in similar styles, with similar chop lengths which may interact with uNDF.
Forage yield: Data summarized by Prof. Joe Lauer, after evaluating several years of WI hybrid trials, detailed roughly 15 percent less yield with brown-midrib mutant corn hybrids relative to other conventional varieties (Lauer et al., 2016 and prior years; accessed online, http://corn.agronomy.wisc.edu/HT/Default.aspx). Transgenic alfalfa also reported lesser yield when managed in a similar manner to conventional lines. Though the reduced lignin alfalfa though may better maintain quality though with extended cutting intervals (Getachew et al., 2018), thus improving digestible yield or exposure to risk due to delayed harvest conditions.
Disease resistance: Prof Damon Smith (personal communication) has taught that lignin is a plant defense mechanism. Thus, crops with a lesser ability to lignify will likely also be more prone to disease pressure and warrant additional scouting or crop protection. Crop protection inputs should be considered in crop production costs per acre as part of the cash flow projection.
Feed conversion: the balance between intake and performance gain needs to be considered when evaluating reduced lignin feed potential. The aim should be to increase feed conversion efficiency. According to Oba and Allen (1999), a 1-unit gain in forage in vitro rumen NDF digestion corresponds to roughly 0.38 lb increase in DMI and just over 0.55 lb increase in 4% fat corrected milk production per cow per day. With a roughly 2:1 milk to intake increase per unit ivNDFD, theoretically feed conversion should improve via reduced lignin forages assuming ivNDFD increases. Though Ferraretto and Shaver (2015) reported no improvement in feed conversion with brown-midrib corn silage relative to convention following meta-analysis. Again note, in nearly all cases the brown-midrib variety was managed and harvest similar to the conventional hybrid.
Summary: completing the partial budget
Recapping the points discussed here, ensure you incorporate both fiber kd and uNDF in animal performance projections. Consider using the independent pairwise correlations discussed in the case study presented below as well to add to animal response projections. With these relationships in hand,combine forage quality measures with yield and crop production costs for a true partial budget evaluation. The University of
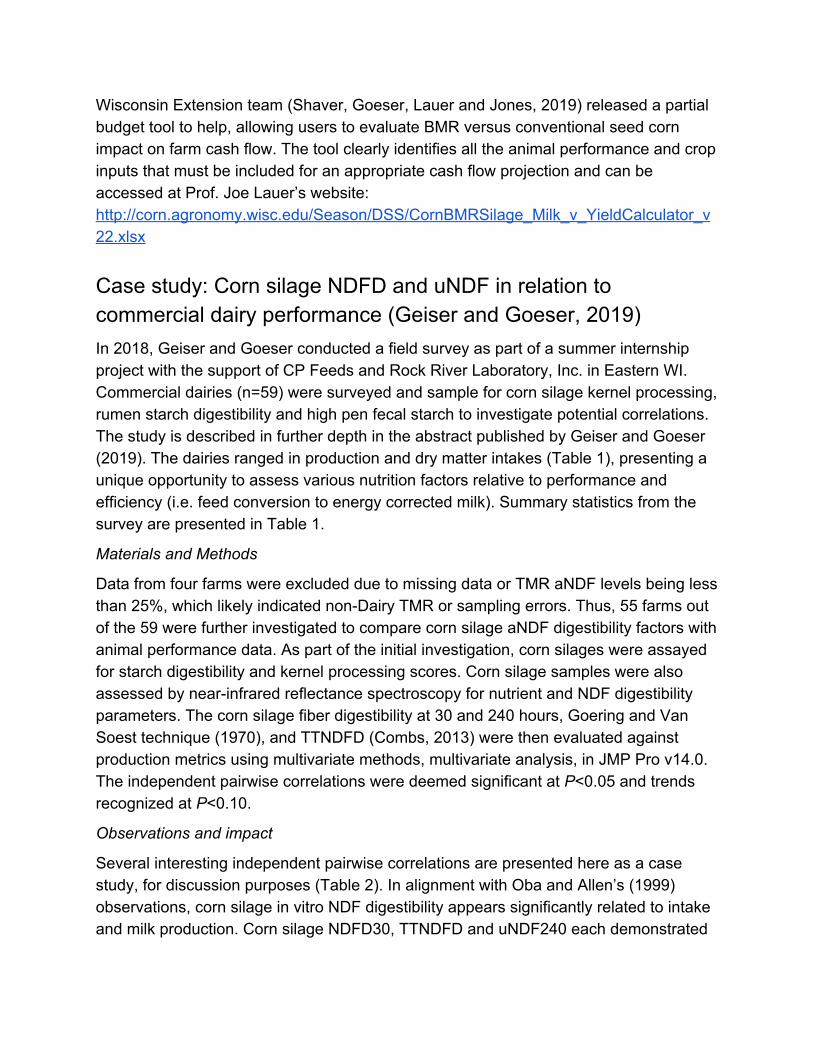
Wisconsin Extension team (Shaver, Goeser, Lauer and Jones, 2019) released a partial budget tool to help, allowing users to evaluate BMR versus conventional seed corn impact on farm cash flow. The tool clearly identifies all the animal performance and crop inputs that must be included for an appropriate cash flow projection and can be accessed at Prof. Joe Lauer’s website: http://corn.agronomy.wisc.edu/Season/DSS/CornBMRSilage_Milk_v_YieldCalculator_v22.xlsx
Case study: Corn silage NDFD and uNDF in relation to commercial dairy performance (Geiser and Goeser, 2019) In 2018, Geiser and Goeser conducted a field survey as part of a summer internship project with the support of CP Feeds and Rock River Laboratory, Inc. in Eastern WI. Commercial dairies (n=59) were surveyed and sample for corn silage kernel processing, rumen starch digestibility and high pen fecal starch to investigate potential correlations. The study is described in further depth in the abstract published by Geiser and Goeser (2019). The dairies ranged in production and dry matter intakes (Table 1), presenting a unique opportunity to assess various nutrition factors relative to performance and efficiency (i.e. feed conversion to energy corrected milk). Summary statistics from the survey are presented in Table 1.
Materials and Methods
Data from four farms were excluded due to missing data or TMR aNDF levels being less than 25%, which likely indicated non-Dairy TMR or sampling errors. Thus, 55 farms out of the 59 were further investigated to compare corn silage aNDF digestibility factors with animal performance data. As part of the initial investigation, corn silages were assayed for starch digestibility and kernel processing scores. Corn silage samples were also assessed by near-infrared reflectance spectroscopy for nutrient and NDF digestibility parameters. The corn silage fiber digestibility at 30 and 240 hours, Goering and Van Soest technique (1970), and TTNDFD (Combs, 2013) were then evaluated against production metrics using multivariate methods, multivariate analysis, in JMP Pro v14.0. The independent pairwise correlations were deemed significant at P<0.05 and trends recognized at P<0.10.
Observations and impact
Several interesting independent pairwise correlations are presented here as a case study, for discussion purposes (Table 2). In alignment with Oba and Allen’s (1999) observations, corn silage in vitro NDF digestibility appears significantly related to intake and milk production. Corn silage NDFD30, TTNDFD and uNDF240 each demonstrated

significant independent pairwise correlations with dry matter intake and energy corrected milk production (ECM, calculated as 12.95 x milk lbs x milk fat % + 7.65 x milk lbs x milk protein % + 0.327 x milk lbs; Table 2). The results suggest a one-unit increase in corn silage NDFD30 or TTNDFD (% of aNDF) are related to 0.45 and 0.62 lb increase in DMI (P<0.01; Figure 4), and 0.98 and 0.78 lb increase in ECM (P<0.05; Figure 5), respectively. Further, a one unit increase in corn silage uNDF240 appeared to correspond to a 0.60 lb decrease in dry matter intake and 1.29 lb decrease in ECM (P<0.05; Figures 4 and 5). Lastly, feed conversion efficiency was evaluated by dividing ECM by dry matter intake and then appeared related to NDFD30 in a trend (P<0.09; Figure 6). This trend suggests a one-unit increase in corn silage NDFD30 could equate to a 0.005 unit increase in FCE. Should this relationship prove real, a 50% (below average) vs 60% (above average) NDFD30 in corn silage would equate a 0.05 unit improvement in ECM feed conversion efficiency. Projecting out to the economic impact with 2019 US average feed costs, this would equate to roughly $0.20 per CWT in reduced feed costs.
These case study observations are numerically greater than those published nearly 20 years ago by Oba and Allen (1999) however suggest that greater responses may exist for commercial dairy cattle today. Note, these case study results do not represent a controlled research experiment thus relationships should be interpreted with caution. Further investigation and research is warranted.
Table 1: Commercial dairy case study: Summary statistics for dairies surveyed by Geiser and Goeser (2018).
Parameter, % DM unless noted n Mean Std Dev 15th perc. 85th perc.
TMR
CP 55 16.80 0.61 16.23 17.49
aNDF 55 28.00 2.56 25.84 30.36
Starch 50 26.44 2.39 23.77 29.03
Percent corn silage 54 36.94 7.86 28.33 44.40
Percent forage 52 57.33 4.95 53.13 62.22
Corn silage
DM 59 33.00 4.40 31.00 38.00
aNDFom 59 37.56 4.10 32.96 40.41
Starch 58 33.28 4.73 30.29 37.61
KPS, % starch < 4.75 mm 59 65.45 6.99 58.91 71.73
isSD0, % starch 59 80.94 9.11 75.37 87.39
isSD7, % starch 59 88.73 3.68 85.88 91.11
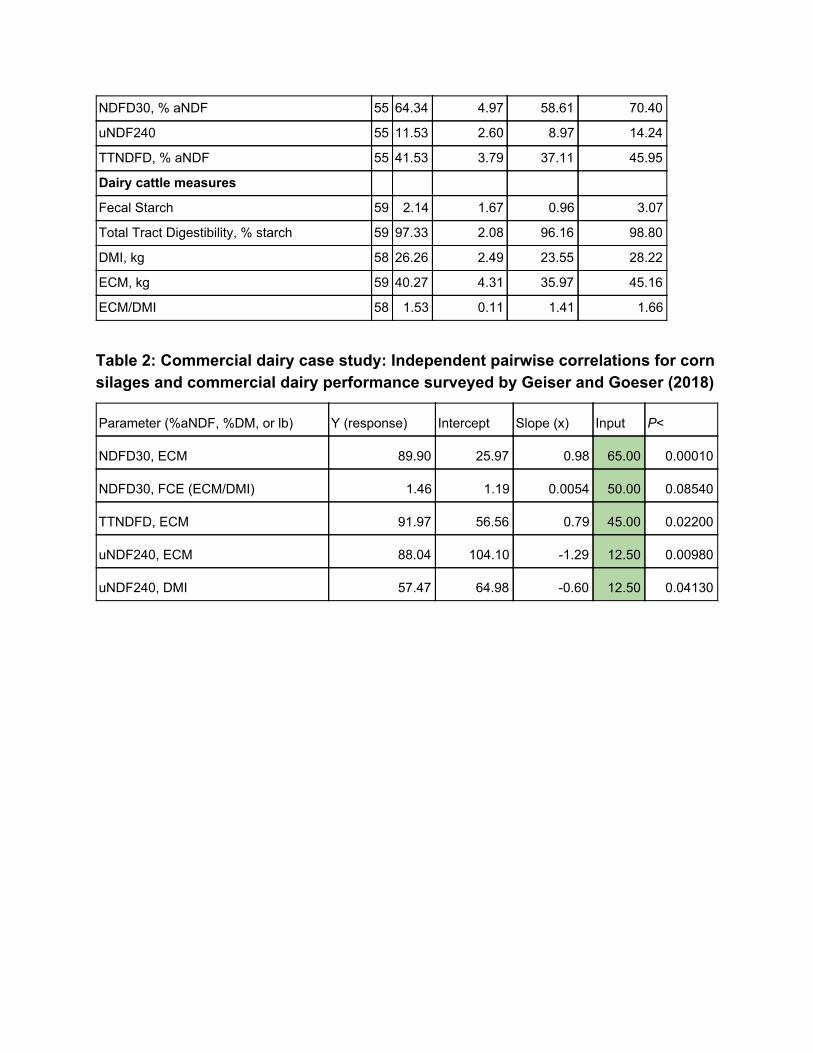
NDFD30, % aNDF 55 64.34 4.97 58.61 70.40
uNDF240 55 11.53 2.60 8.97 14.24
TTNDFD, % aNDF 55 41.53 3.79 37.11 45.95
Dairy cattle measures
Fecal Starch 59 2.14 1.67 0.96 3.07
Total Tract Digestibility, % starch 59 97.33 2.08 96.16 98.80
DMI, kg 58 26.26 2.49 23.55 28.22
ECM, kg 59 40.27 4.31 35.97 45.16
ECM/DMI 58 1.53 0.11 1.41 1.66
Table 2: Commercial dairy case study: Independent pairwise correlations for corn silages and commercial dairy performance surveyed by Geiser and Goeser (2018)
Parameter (%aNDF, %DM, or lb) Y (response) Intercept Slope (x) Input P<
NDFD30, ECM 89.90 25.97 0.98 65.00 0.00010
NDFD30, FCE (ECM/DMI) 1.46 1.19 0.0054 50.00 0.08540
TTNDFD, ECM 91.97 56.56 0.79 45.00 0.02200
uNDF240, ECM 88.04 104.10 -1.29 12.50 0.00980
uNDF240, DMI 57.47 64.98 -0.60 12.50 0.04130

Figure 4: Commercial dairy dry matter intake (lbs. / cow) independent pairwise correlations with NDFD30 (% aNDF), TTNDFD (% aNDF), and uNDF240 (% DM).
Figure 5: Commercial dairy energy corrected milk (lbs. / cow) independent pairwise correlations with NDFD30 (% aNDF), TTNDFD (% aNDF), and uNDF240 (% DM).

Figure 6: Commercial dairy feed conversion efficiency (energy corrected milk, lbs. / dry matter intake, lbs.) independent pairwise correlation with NDFD30 (% aNDF).
References Allen, M. S. 2000. Effects of diet on short-term regulation of feed intake by lactating dairy cattle. J. Dairy Sci. 83:1598–1624.
Cherney, J.H., D.J.R. Cherney, D.E. Akin, and J.D. Axtell. 1991. Potential of brown-midrib, low-lignin mutants for improving forage quality. Adv. Agron. 46:157-198.
Ferraretto, L.F., and R.D. Shaver. 2015. Efects of whole-plant corn silage hybrid type on intake, digestion, ruminal fermentation, and lactation performance by dairy cows through a meta-analysis. J. Dairy Sci. 98:2662-2675. Getachew, G., E. Laca, D. Putnam, D. Witte, M. McCaslin, K. Ortegac and E. DePeters. 2018. The impact of lignin downregulation on alfalfa yield, chemical composition, and in vitro gas production. J Sci Food Agric. 98: 4205–4215. Geiser, J. and J. Goeser. 2019. Abstract: Midwestern US commercial dairy survey results: corn silage kernel processing, rumen starch digestibility and fecal starch content. J Dairy Sci. 102:E Suppl. 1, Pg 371.
Goering, H.K., and P.J. Van Soest. 1970. Forage fiber analyses (Apparatus, reagents, procedures, and some applications). ARS-USDA, Washington, D.C.
Goeser, J.P. 2014. What do cows have to say about fiber and starch digestibility? Proc. 2014 4-State Dairy Nutrition & Management Conference. Dubuque, IA.
Grant, R. 2018. Relationships Between Undigested and Physically Effective Fiber in Lactating Dairy Cows. Proc. 2018 Cornell Nutrition Conf., Syracuse, NY.
Hall, M.B. and D.R. Mertens. 2017. A 100-Year Review: Carbohydrates—Characterization, digestion, and utilization. J Dairy Sci. 100:10078–10093
Heinrichs, J. 2013. The Penn State Particle Separator. Reviewed by: V. Ishler and A. Kmicikewycz. Penn State Extension article. DSE 2013-186.
Hintz, R.W., and K.A. Albrecht. 1991. Prediction of alfalfa chemical composition from maturity and plant morphology. Crop Sci. 31:1561-1565.
Lopes, F., D.E. Cooks, and D.K. Combs. 2015. Validation of an in vitro model for predicting rumen and total-tract fiber digestibility in dairy cows fed corn silages with different in vitro neutral detergent fiber digestibilities at 2 levels of dry matter intake. J Dairy Sci. 98:574-585.
Oba, M., and M.S. Allen. 1999. Evaluation of the importance of the digestibility of neutral detergent fiber from forage: effects on dry matter intake and milk yield of dairy cows. J. Dairy Sci. 82:589-596. Pell, A.N., and P. Schofield. 1993. Computerized monitoring of gas production to measure forage digestion in vitro. J Dairy Sci. 76:1063-1073.
Schalla, A., L. Meyer, Z. Meyer, S. Onetti, A. Schultz, and J. Goeser 2012. Hot topic: Apparent total-tract nutrient digestibilities measured commercially using 120-hour in vitro indigestible neutral detergent fiber as a marker are related to commercial dairy cattle performance. J. Dairy Sci. 95 :5109–5114
Van Amburgh, M.E., E.A. Collao-Saenz, R.J. Higgs, D.A. Ross, E.B. Recktenwald, E. Raffrenato, L.E. Chase, T.R. Overton, J.K. Mills, and A. Foskolos. 2015. The Cornell Net Carbohydrate and Protein System: Updates to the model and evaluation of version 6.5. J Dairy Sci. 98:6361-6380.