Understanding Equity ETFs and the Underlying Indices …€¢DJ-UBS •S&P Dynamic Futures •S&P...
62
McGraw-Hill Understanding Equity ETFs and the Underlying Indices that Drive the Engine Saturday, December 8, 2012 at 10:30 A.M. (IST) For Financial Professionals/Not for Public Distribution Analytic services and products by S&P Dow Jones Indices are the result of separate activities designed to preserve the independence and objectivity of each analytic process. S&P Dow Jones Indices has established policies and procedures to maintain the confidentiality of non-public information received during each analytic process.
Transcript of Understanding Equity ETFs and the Underlying Indices …€¢DJ-UBS •S&P Dynamic Futures •S&P...

McGraw-Hill
Understanding Equity ETFs and the Underlying Indices that Drive the Engine
Saturday, December 8, 2012 at 10:30 A.M. (IST)
For Financial Professionals/Not for Public Distribution
Analytic services and products by S&P Dow Jones Indices are the result of separate activities designed to
preserve the independence and objectivity of each analytic process. S&P Dow Jones Indices has established
policies and procedures to maintain the confidentiality of non-public information received during each analytic
process.

PROPRIETARY. PERMISSION TO REPRINT OR DISTRIBUTE ANY CONTENT FROM THIS PRESENTATION REQUIRES THE WRITTEN APPROVAL OF S&P DOW JONES INDICES.
Disclaimer
S&P Dow Jones Indices emphasizes to participant that Sameer Desai from Goldman Sachs Asset Management and Sunny Ahuja from Sharekhan are guest speakers and are not affiliated with S&P Dow Jones Indices and that S&P Dow Jones Indices is not providing endorsements as to the opinions expressed which are those of the guest speakers for this webinar. S&P Dow Jones Indices offers no guarantees or warranties as to the accuracy and reliability of opinions expressed.
Guest speakers are not affiliated with S&P Dow Jones Indices and S&P Dow Jones Indices does not sponsor, endorse, sell, or promote any product based on an S&P index nor does it make any representation regarding the advisability of investing in the products.
2

McGraw-Hill
Understanding Equity ETFs and the Underlying Indices that Drive the Engine Index Investing
Investing Strategies and styles paving way to Indices
For Financial Professional. Not for Public Distribution PROPRIETARY. Permission to reprint or distribute any content from this presentation requires the written approval of S&P Indices

PROPRIETARY. PERMISSION TO REPRINT OR DISTRIBUTE ANY CONTENT FROM THIS PRESENTATION REQUIRES THE WRITTEN APPROVAL OF S&P DOW JONES INDICES.
Understanding Index Requirement
4
• Why do we need an index?
• Represents the return to an investment strategy in an investment universe
• Can One Set of Indices Meet All Needs?
• No: Indices are used for a myriad of reasons and can be constructed according to varying needs.
• Global investors place different priorities on size, market coverage, stability and liquidity. One suite of indices cannot comprehensively and efficiently measure all of
these criteria without emphasizing one over the other.
• For an index to be most effective, it must not only differentiate between developed and emerging markets, but also take local market idiosyncrasies into consideration.
• Is There a Need to Differentiate Between Tradable and Benchmark Indices?
• Yes: Tradable and benchmark indices fulfill two very distinct needs.
• An index provider must acknowledge which need it is addressing in order to provide an accurate measure of the market:
• When constructing a benchmark index, comprehensiveness and transparency are key.
• When constructing a Tradable index, liquidity of the constituents is key.

PROPRIETARY. PERMISSION TO REPRINT OR DISTRIBUTE ANY CONTENT FROM THIS PRESENTATION REQUIRES THE WRITTEN APPROVAL OF S&P DOW JONES INDICES.
5
•The Index Continuum
The Emerging Role of Index Providers
Licensing & Brand
Management
Back Office
Outsourcing
Design & Calculation
Idea Generation
Collaboration
Transparency &
Education
Traditional Roles
Emerging Roles
Independence
Back office
efficiency
Brand
Trading
expertise
Distribution
Balance sheet
Idea
generation
Index
expertise
Index Providers Issuers

PROPRIETARY. PERMISSION TO REPRINT OR DISTRIBUTE ANY CONTENT FROM THIS PRESENTATION REQUIRES THE WRITTEN APPROVAL OF S&P DOW JONES INDICES.
How Indices are Constructed
Universe Criteria Rebalancing
Equity
Index
Creation
Fixed Income Commodities Real Estate Themes Strategy
•S&P 500
•DJIA
•S&P Global 1200
•S&P/TSX 60
•S&P Europe 350
•S&P/ASX 200
•S&P Nifty
•S&P EM & Frontier
•S&P/LSTA Leverage
Loan 100
•S&P Preferreds
•S&P Municipal Bond
Index Series
•S&P/Citi International
Treasuries
•S&P/ASX Fixed
Income
•S&P GSCI
•DJ-UBS
•S&P Dynamic
Futures
•S&P Natural
Resources
•S&P/Case-Shiller
Home Price Indices
•Property and Real
Estate
•Clean Energy
• Infrastructure
•Water
•Agribusiness
•BRIC
•Risk Control
•Dividend
•Corporate Clusters
•Low Volatility
•Asset Allocation
•S&P GIVI
The above list of indices are not exhaustive and the diagram is for illustrative purposes only.

PROPRIETARY. PERMISSION TO REPRINT OR DISTRIBUTE ANY CONTENT FROM THIS PRESENTATION REQUIRES THE WRITTEN APPROVAL OF S&P DOW JONES INDICES.
7
Investment Strategy
• Growth – looking for the big winners; companies that traditionally have high growing
earnings – High growth equals high stock prices and in turn, high profits – Growth investing is usually considered more risky
This investment strategy offers risk reward ratios that are quite drastic. While the rewards can be very high in growth investing, the risks are high as well.
• Value – Stocks with expected higher intrinsic values than currently priced by the market. – Shares that are attractively priced, relative to the earnings or the internal value
of the company – or, in some cases, relative to the market. – Price of these companies will eventually rise to reflect the true value.
Many consider value investing safer than growth investing, since prices of value stocks tend to be less volatile
• Income
– Most conservative and easy to understand – Target companies that consistently pay high stock dividends – Looks for companies that tend to be large and well-established
Often known as defensive investing because it tends to protect the trader

PROPRIETARY. PERMISSION TO REPRINT OR DISTRIBUTE ANY CONTENT FROM THIS PRESENTATION REQUIRES THE WRITTEN APPROVAL OF S&P DOW JONES INDICES.
8
– Classes of assets -Equity, bonds, Commodities, cash, etc – Conservative: Capital Preservation, Heavy allocation to fixed return assets
– Moderate : Protecting current assets along with achieving long term investment growth
– Aggressive : Maximise potential returns at a higher risk
– Strategic An asset mix providing the optimal balance between expected risk and return for a long-term investment horizon. Some exposure to equity and then offset it with a certain percentage fixed income that‟s suitable as per the age or risk tolerance
– Tactical Try to ride the tide and buy into asset classes that are on the move. Riskier as it takes an active approach and not well suited for long term investments.
– Core and Satellite A hybrid of both the strategic and tactical allocations. Made of two components
– A core holding of stocks, bonds, or index funds making up anywhere from 50-80% of your total portfolio.
– Satellite allocation which may implement more of a tactical approach which allows to still scope out opportunities in the market
– Geographic
• Country focus
• Region Focus : Emerging, developed
Asset Allocation
The diagram given is for illustrative purposes only.

PROPRIETARY. PERMISSION TO REPRINT OR DISTRIBUTE ANY CONTENT FROM THIS PRESENTATION REQUIRES THE WRITTEN APPROVAL OF S&P DOW JONES INDICES.
9
Equity Indices
• Investment Strategy Indices Growth
– S&P 500 Growth Index – S&P Mid Cap 4000 Growth – S&P Small Cap 600 Growth – S&P Target Risk Growth Index
Income – S&P High Yield Dividend Aristocrats – S&P International Dividend Opportunities – S&P Emerging Markets Dividend opportunities Index – S&P Global Dividend Opportunities Index
Value – S&P 500 Value Index – S&P Mid Cap 400 Value – S&P Small Cap 6000 Value
The above list of indices are not exhaustive.

PROPRIETARY. PERMISSION TO REPRINT OR DISTRIBUTE ANY CONTENT FROM THIS PRESENTATION REQUIRES THE WRITTEN APPROVAL OF S&P DOW JONES INDICES.
10
Style Performance
20.00
40.00
60.00
80.00
100.00
120.00
140.00
Dec-06 Dec-07 Dec-08 Dec-09 Dec-10 Dec-11
S&P 500 Growth
S&P 500 Value
S&P Global Dividend Opportunities Index
The Charts are US$ Price Returns and are sourced from S&P Dow Jones Indices and Bloomberg.

PROPRIETARY. PERMISSION TO REPRINT OR DISTRIBUTE ANY CONTENT FROM THIS PRESENTATION REQUIRES THE WRITTEN APPROVAL OF S&P DOW JONES INDICES.
Strategic Indices
11
• Asset Allocation Series
• Exposure to constituent asset class determined by specific strategies or investment goals.
• Designed to facilitate index replication and enable the creation of index-linked investment products for investors.
─ Target Date
─ Comprises of multi-asset class indices, each corresponding to a particular target retirement date.
─ Each index provides varying levels of exposure to equities and fixed income. Each target date allocation is created and retired according to a pre-determined schedule related to the respective target date.
• S&P Target Date 2015 Index
• S&P Target Date 2020 Index
• S&P Target Date 2040 Index
─ Cluster Series
─ Designed for exposure to the component companies of conglomerates
• S&P Japan Corporate Group Index
• Mitsubushi Cluster Index
• Hyundai Cluster Index
─ Risk Control
─ Provide a way for investors to gain exposure to a particular market, investment theme, or strategy while controlling the level of risk.
• S&P Composite Dynamic Rebalancing Risk Control Index
• S&P500 Dynamic Rebalancing Risk Control Index
The above list of indices are not exhaustive.

PROPRIETARY. PERMISSION TO REPRINT OR DISTRIBUTE ANY CONTENT FROM THIS PRESENTATION REQUIRES THE WRITTEN APPROVAL OF S&P DOW JONES INDICES.
Thematic Indices
12
• Exposure to investment themes that cut across traditional industry definitions and geographic boundaries.
– S&P Global Water Index
– S&P Global Infrastructure Index
– S&P U.S Carbon Efficient Index
– S&P Commodity Producers Agribusiness Index
– S&P Global Clean Energy Index
– S&P Global Nuclear Energy Index
– S&P Emerging Asia Consumer Index
The above list of indices are not exhaustive.
PROPRIETARY. PERMISSION TO REPRINT OR DISTRIBUTE ANY CONTENT FROM THIS PRESENTATION REQUIRES THE WRITTEN APPROVAL OF S&P DOW JONES INDICES.
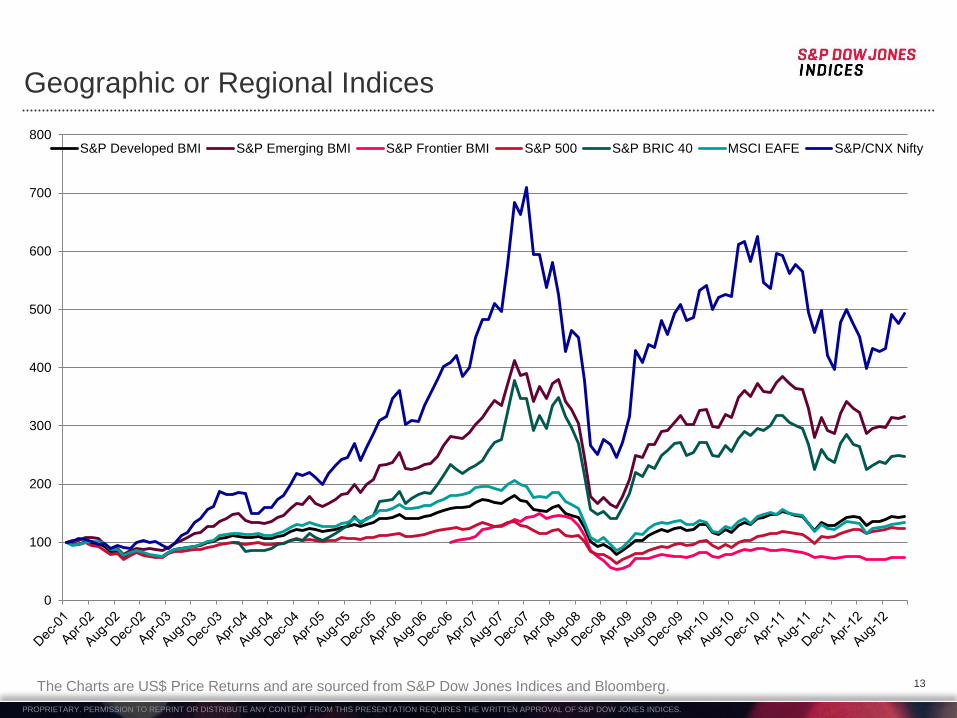
Geographic or Regional Indices
13 The Charts are US$ Price Returns and are sourced from S&P Dow Jones Indices and Bloomberg.
0
100
200
300
400
500
600
700
800S&P Developed BMI S&P Emerging BMI S&P Frontier BMI S&P 500 S&P BRIC 40 MSCI EAFE S&P/CNX Nifty

PROPRIETARY. PERMISSION TO REPRINT OR DISTRIBUTE ANY CONTENT FROM THIS PRESENTATION REQUIRES THE WRITTEN APPROVAL OF S&P DOW JONES INDICES.
Equity Indices Serving Different Purposes
14
Local Market
Leaders
• Headline local market indices that underlie popular financial
products and are widely referenced as market indicators
• S&P 500, DJIA, S&P/TSX 60, S&P/ASX 200
Global
Benchmarks
• Comprehensive, unbiased representations of global markets
• Ideal for benchmarking and performance evaluation
• S&P Global BMI, DJ Titans, DJ Total Stock Market
Tradable Indices
• Representative of specific markets and efficient to replicate
• Designed specifically to be used for financial products
• S&P Global 1200, S&P Latin America 40, S&P BRIC 40
The above list of indices are not exhaustive.

PROPRIETARY. PERMISSION TO REPRINT OR DISTRIBUTE ANY CONTENT FROM THIS PRESENTATION REQUIRES THE WRITTEN APPROVAL OF S&P DOW JONES INDICES.
Top ETP Equity Indices
15

PROPRIETARY. PERMISSION TO REPRINT OR DISTRIBUTE ANY CONTENT FROM THIS PRESENTATION REQUIRES THE WRITTEN APPROVAL OF S&P DOW JONES INDICES.
Appendix
16

PROPRIETARY. PERMISSION TO REPRINT OR DISTRIBUTE ANY CONTENT FROM THIS PRESENTATION REQUIRES THE WRITTEN APPROVAL OF S&P DOW JONES INDICES.
17
Intellectual Property Licensing Custom Indices Education & Research
S&P
DOW JONES
INDICES
• USD 5.5 trillion of global assets
directly benchmarked to S&P 500 *
• Over 1,600 clients across 50 countries
that subscribe to index content
• Client relationships over 90 of the top
100 asset managers, as measured by
assets, and more than 50 of the
largest public pension funds
• 700,000+ indices calculated daily and
launched over 110 new indices in
2011 to meet new client needs
• Provide secure end-of-day data via
FTP to client/vendors and via our own
platform, SPICE
• Calculate over 1,100 real-time indices
• Over 500 licenses have been
granted globally for building/pricing
financial products: index swaps,
equity linked notes, OTC options,
structured products, futures &
options and ETPs
• More than USD 1.3 trillion directly
indexed to the S&P 500 via
investment products*
• 575 S&P Dow Jones-linked ETFs
listed around the globe** including
SPDR -S&P 500 ETF, the largest
ETF in the world, with USD 100+
billion in AUM
• 38 ETPs incorporate VIX indices with
a total of USD 4 billion in AUM
• The most actively traded index
futures contract in the world is based
on the S&P 500 at the CME. ***
• 6,000 headline Custom Indices are
calculated daily for 135 clients in
45 countries*
• White-labeled and made-to-order
customized data sets and index
calculations for benchmarking and
product issuance
• Clients leverage our custom
indexing expertise and global
presence to develop, manage and
distribute their indices
• Over 20 webinars yearly and
numerous face-to-face events
eligible for continuing education
credits
• Award-winning team covers
multiple -asset class research
• Provide monthly, quarterly, and
annual index research to S&P Dow
Jones clients, RIAs and end-user
clients
Benchmarking
* Source: S&P Indices: Annual Survey of S&P Indexed Assets Dec. 31, 2010.
This information pertains to S&P indices only.
** As of May 2012
*** (average daily trading volume of 1.8 million contracts as of Mar. 30, 2012)
S&P DJI: The World‟s Largest Provider of Financial Market Indices

PROPRIETARY. PERMISSION TO REPRINT OR DISTRIBUTE ANY CONTENT FROM THIS PRESENTATION REQUIRES THE WRITTEN APPROVAL OF S&P DOW JONES INDICES.
Global Reach. Local Expertise.
Over 375 client-dedicated professionals with local index understanding
18
An investor-centric approach to index innovation With clients in over 65 countries and
15 offices worldwide
SINGAPORE
SYDNEY
NEW YORK
PARIS
LONDON FRANKFURT
MOSCOW
DUBAI
MUMBAI
BEIJING
TOKYO
TORONTO
HEADQUARTERS
OFFICE
LOCAL EXCHANGE RELATIONSHIP
SEOUL
Hong Kong
SHANGHAI

PROPRIETARY. PERMISSION TO REPRINT OR DISTRIBUTE ANY CONTENT FROM THIS PRESENTATION REQUIRES THE WRITTEN APPROVAL OF S&P DOW JONES INDICES.
Most Innovative Index Provider
of the Year
Asia 2011
Structured Products Magazine Asia
Most Innovative and
Responsive Index Provider of
the Year
Europe 2011
Euromoney Europe
Index Innovation
Americas 2011
William F Sharpe
Most Innovative
ETF Index Provider
Americas 2011
Exchangetradedfunds.com
Best Index Provider in Asia
Asia 2011
Asia Asset Management Best of the Best
Awards
Best Index Provider
Asia 2011
Triple A Investment Asia
Euromoney / Structured Retail
Products Award
Europe 2011
Innovation in Index Creation
ETF Index Provider of the Year
Asia 2011
Asia Asset Management Best of the Best
Awards
Best Islamic Index Provider
2011
Islamic Finance News
Best Shariah-Compliant Index
Provider
2011
Global Finance
Most Innovative
Index Provider
Americas 2010
Structured Products Magazine
Most Innovative
Index Provider
Europe 2010
Structured Products Magazine
Most Innovative
Benchmark
2008
William F. Sharpe Award
Most Innovative
ETF Index
2008
William F. Sharpe Award
Index Provider
of the Year
Asia 2010
Asia Asset Management
Best Local
Index Provider
2010
Asianinvestor
Recognized Around the World for Index Innovation
19
S&P Dow Jones
Indices

PROPRIETARY. PERMISSION TO REPRINT OR DISTRIBUTE ANY CONTENT FROM THIS PRESENTATION REQUIRES THE WRITTEN APPROVAL OF S&P DOW JONES INDICES.
General Disclaimer
Copyright © 2012 by S&P Dow Jones Indices LLC, a subsidiary of The McGraw-Hill Companies, Inc., and/or its affiliates. All rights reserved. Standard & Poor‟s, S&P, S&P 500, S&P MidCap 400 and S&P SmallCap 600 are registered trademarks of Standard & Poor‟s Financial Services LLC (“S&P”), a subsidiary of The McGraw-Hill Companies, Inc. Dow Jones is a registered trademark of Dow Jones Trademark Holdings LLC (“Dow Jones”). Trademarks have been licensed to S&P Dow Jones Indices LLC. Redistribution, reproduction and/or photocopying in whole or in part are prohibited without written permission. This document does not constitute an offer of services in jurisdictions where S&P Dow Jones Indices LLC, Dow Jones, S&P or their respective affiliates (collectively “S&P Dow Jones Indices”) do not have the necessary licenses. All information provided by S&P Dow Jones Indices is impersonal and not tailored to the needs of any person, entity or group of persons. S&P Dow Jones Indices receives compensation in connection with licensing its indices to third parties. Past performance of an index is not a guarantee of future results. It is not possible to invest directly in an index. Exposure to an asset class represented by an index is available through investable instruments based on that index. S&P Dow Jones Indices does not sponsor, endorse, sell, promote or manage any investment fund or other investment vehicle that is offered by third parties and that seeks to provide an investment return based on the performance of any index. S&P Dow Jones Indices makes no assurance that investment products based on the index will accurately track index performance or provide positive investment returns. S&P Dow Jones Indices LLC is not an investment advisor, and S&P Dow Jones Indices makes no representation regarding the advisability of investing in any such investment fund or other investment vehicle. A decision to invest in any such investment fund or other investment vehicle should not be made in reliance on any of the statements set forth in this document. Prospective investors are advised to make an investment in any such fund or other vehicle only after carefully considering the risks associated with investing in such funds, as detailed in an offering memorandum or similar document that is prepared by or on behalf of the issuer of the investment fund or other vehicle. Inclusion of a security within an index is not a recommendation by S&P Dow Jones Indices to buy, sell, or hold such security, nor is it considered to be investment advice. Closing prices for S&P US benchmark indices and Dow Jones US benchmark indices are calculated by S&P Dow Jones Indices based on the closing price of the individual constituents of the index as set by their primary exchange (i.e., NYSE, NASDAQ, NYSE MKT, NYSE Arca). Closing prices are received by S&P Dow Jones Indices from one of its third party vendors and verified by comparing them with prices from an alternative vendor. The vendors receive the closing price from the primary exchanges. Real-time intraday prices are calculated similarly without a second verification.]
These materials have been prepared solely for informational purposes based upon information generally available to the public from sources believed to be reliable. No content contained in these materials (including index data, ratings, credit-related analyses and data, model, software or other application or output therefrom) or any part thereof (Content) may be modified, reverse-engineered, reproduced or distributed in any form by any means, or stored in a database or retrieval system, without the prior written permission of S&P Dow Jones Indices. The Content shall not be used for any unlawful or unauthorized purposes. S&P Dow Jones Indices and its third-party data providers and licensors (collectively “S&P Dow Jones Indices Parties”) do not guarantee the accuracy, completeness, timeliness or availability of the Content. S&P Dow Jones Indices Parties are not responsible for any errors or omissions, regardless of the cause, for the results obtained from the use of the Content. THE CONTENT IS PROVIDED ON AN “AS IS” BASIS. S&P DOW JONES INDICES PARTIES DISCLAIM ANY AND ALL EXPRESS OR IMPLIED WARRANTIES, INCLUDING, BUT NOT LIMITED TO, ANY WARRANTIES OF MERCHANTABILITY OR FITNESS FOR A PARTICULAR PURPOSE OR USE, FREEDOM FROM BUGS, SOFTWARE ERRORS OR DEFECTS, THAT THE CONTENT‟S FUNCTIONING WILL BE UNINTERRUPTED OR THAT THE CONTENT WILL OPERATE WITH ANY SOFTWARE OR HARDWARE CONFIGURATION. In no event shall S&P Dow Jones Indices Parties be liable to any party for any direct, indirect, incidental, exemplary, compensatory, punitive, special or consequential damages, costs, expenses, legal fees, or losses (including, without limitation, lost income or lost profits and opportunity costs) in connection with any use of the Content even if advised of the possibility of such damages. S&P Dow Jones Indices keeps certain activities of its business units separate from each other in order to preserve the independence and objectivity of their respective activities. As a result, certain business units of S&P Dow Jones Indices may have information that is not available to other business units. S&P Dow Jones Indices has established policies and procedures to maintain the confidentiality of certain non-public information received in connection with each analytical process. In addition, S&P Dow Jones Indices provides a wide range of services to, or relating to, many organizations, including issuers of securities, investment advisers, broker-dealers, investment banks, other financial institutions and financial intermediaries, and accordingly may receive fees or other economic benefits from those organizations, including organizations whose securities or services they may recommend, rate, include in model portfolios, evaluate or otherwise address.
20
Thank You
Contact Us
Koel Ghosh
Head, Business Development, South Asia
21

Understanding Equity
ETFs and the
Underlying Indices that
Drive the Engine
GS BeES
Exchange Traded Funds
December 2012

Introduction to Exchange Traded Fund
An exchange-traded fund (ETF) is a mutual fund traded on stock exchanges, much like stocks. An
ETF holds assets such as stocks, commodities, or bonds, and endeavours to trade close to its net asset
value over the course of the trading day. Most ETFs track an index, such as a stock index or bond index.
ETFs may be attractive as investments because of their low costs, tax efficiency, and stock-like features.
•23
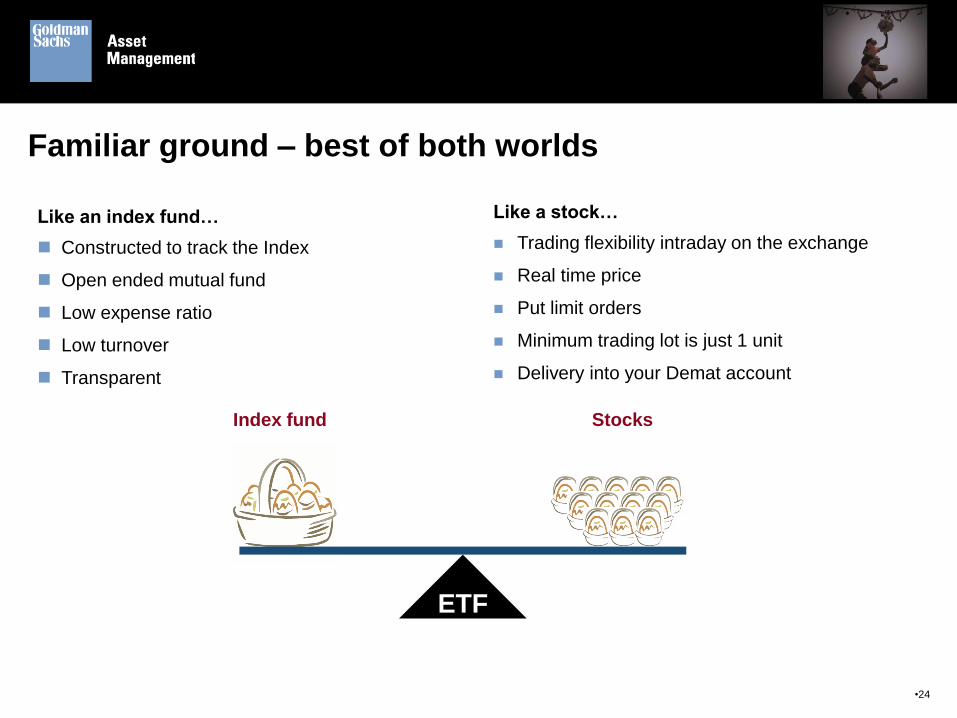
Familiar ground – best of both worlds
•24
Like a stock…
Trading flexibility intraday on the exchange
Real time price
Put limit orders
Minimum trading lot is just 1 unit
Delivery into your Demat account
Like an index fund…
Constructed to track the Index
Open ended mutual fund
Low expense ratio
Low turnover
Transparent
ETF
Index fund Stocks

Index tracking – a long term winner for investments
It has been proved that it is not possible to consistently outperform the overall stock market
Index tracking is a relatively cost effective strategy to implement
Indices are dynamic, transparent and have high investor recall
Eliminates the risk of individual stocks, sectors, individual fund manager etc. i.e. all „unsystemic risks‟ only
the „systemic‟ or market risk remains which is common to all equity investments
•25
This information discusses general market activity, industry or sector trends, or other broad-based economic, market or political conditions and should not be construed as research or
investment advice. Please see additional disclosures.

Index funds in India
At present, there are 41 index funds, of which 191 are based on the S&P CNX Nifty Index
Total recurring expenses2 vary from 0.25% to 1.70% p.a.
Tracking error3 ranges between 0.08% to 1.30%
•26
1 -Source: MFI explorer.
2 – Source: MFI explorer. Service tax may be charged over and above total expense.
3 – Internal calculation done on the basis of NAV data sourced from AMFI
This information discusses general market activity, industry or sector trends, or other broad-based economic, market or political conditions and should not be construed as research or
investment advice. Please see additional disclosures.

Features of GS BeES
Simple – can be bought/ sold on the NSE like a share… in real-time
Buy/ sell the broad Indian market in one ETF unit
Economical – the annual expense ratio for Index funds is low compared to equity or debt fund
No rebalancing issue for the investor due to corporate action or index changes
Full replication strategy
•27

How GS BeES work?
•28
Primary market Secondary market
Seller
Cash GS BeES1
NSE
Cash GS BeES1
Buyer
Authorised
participants/
Financial
institutions
Buy/ Sell
Market making/
arbitrage
Creation
in-kind
Redemption
in-kind
Fund
1- GS BeES = Goldman Sachs Exchange Traded Funds

Index ETFs vs Index futures
•29
Parameters Index ETFs Index futures
Minimum investment amount Can be bought for a small
amount Very large as compared to ETF
Management of mark to
market margins Not required Required on day to day basis
Roll over – for long term
horizon Not required Has to be rolled over
Transaction cost Low Higher due to roll over requirement
Universal eligibility of
investors Yes Not everyone is eligible
Suitable for Investor Speculator
Taxation Lower Higher

Index ETFs vs Portfolio of stocks
•30
Parameters Index ETFs Portfolio of stocks
Minimum investment
amount
Can be bought for a small
amount High when compared to ETFs
Portfolio tracking Easier to track, as it is traded
like a single stock
More difficult to track due to large
number of stocks
Investment decision Easy & quick More difficult, due to large number
of stocks
Transaction cost Very low High when compared to an ETF
Index diversification
Can be achieved, as each ETF
unit represents the entire index
which could be diversified
across stocks
More difficult, as we have to buy
each stock across sectors as
represented in the index

Index ETFs vs Open ended index funds
•31
Parameters Index ETFs Traditional open ended index funds
Traded throughout the
day Yes No
Low expense ratio Usually lower than open-ended index
funds Usually higher than ETFs
Trade at any brokerage
firm Yes No
Tracking Tracks index more closely relative to an
open-ended index fund
Tracking errors are usually higher as
compared to ETFs
NAV Real time pricing as compared to an
open-ended index fund Daily end of day
Can be used for
derivatives margin Yes No
Liquidity Fund and stock market Fund
Structure Insulates long term investor from short
term trading activity
Does not insulate long term investor from
short term trading activity

GS Nifty BeES
Goldman Sachs Nifty Exchange Traded Scheme
•32

Goldman Sachs Nifty Exchange Traded Scheme (GS Nifty
BeES)
Investment objective
The investment objective of GS Nifty BeES is to provide investment returns that, before expenses, closely
correspond to the total returns of the securities as represented by the S&P CNX Nifty Index. However, the
performance of scheme may differ from that of the underlying index due to tracking error.
Investment pattern
The above stated percentages are indicative and not absolute.
Type of scheme
Open ended index scheme, listed on the exchange in the form of an Exchange Traded Fund (ETF)
•33
Instruments Indicative allocation %
Securities covered by S&P CNX Nifty Index Up to 100%
Money market instruments, convertible bonds & other securities
including cash at call but excluding subscription & redemption cash flow
Up to 10%
There is no guarantee that these objectives will be met.

GS Nifty BeES - scheme details
•34
Data as on 28th Sep 2012
1 - Financial year to date expense ratio to average AUM. For maximum chargeable expense ratio, please refer to the SID.
2- Tracking error calculated based on monthly rolling returns for last 12 months.
3 - Impact cost calculated for period of 6 months ending on 15th Sep 2012, Source: NSE Market Tracker, www.nseindia.com
NSE Symbol : NIFTYBEES
BSE Code : 590103
ISIN : INF732E01011
Reuters : NBES.NS
Bloomberg : NBEES.IN
Total Expense Ratio : 0.50% p.a.1
Tracking Error : 0.12% Annualised2
Impact Cost : 0.103
Entry / Exit Load : Nil

GS Nifty BeES - performance
•35
Scheme Name
September 30, 2011 to
September 30, 2012
September 30, 2010 to
September 30, 2011
September 30, 2009 to
September 30, 2010 Since Inception
Absolute PTP Absolute PTP Absolute PTP CAGR PTP
Returns
(%)
Returns
(INR)
Returns
(%)
Returns
(INR)
Returns
(%)
Returns
(INR)
Returns
(%)
Returns
(INR)
GS Nifty BeES 16.66 11666 -17.17 8283 19.41 11941 18.71 63289
S&P CNX Nifty Index (Benchmark)1 15.38 11538 -18.02 8198 18.61 11861 17.20 55168
S&P CNX Nifty Total Returns Index 16.86 11686 -17.07 8293 19.88 11988 19.04 65205
Returns for one year are absolute. Returns for more than one year are compounded annualized. Dividends are assumed to be reinvested at the prevailing
NAV. Distribution taxes are excluded while calculating the returns. Bonus declared has been adjusted. In case, the start/end date of the concerned period
is non business date (NBD), the NAV of the previous date is considered for computation of returns. Point to Point (PTP) returns in INR is based on
standard investment of INR 10,000 made at the beginning of 12 month period as at the end of that period scheme performance. Past performance may or
may not be sustained in future and should not be used as a basis for comparison with other investments. Additional benchmark for equity schemes -
source : National Stock Exchange of India. Inception date is the allotment date which is December 28, 2001.
Fund manager: Vishal Jain
Data as on 28th Sep 2012
1- Also represents additional benchmark

Growth of International ETFs
•36
AUM in USD Billion. Source: Blackrock ETF Landscape Q3 End 2012
This information discusses general market activity, industry or sector trends, or other broad-based economic, market or political conditions and should not be construed as research or
investment advice. Please see additional disclosures.
1993 1994 1995 1996 1997 1998 1999 2000 2001 2002 2003 2004 2005 2006 2007 2008 2009 2010 2011Sep-12
AUM*$ Billion 1 1 2 5 8 18 40 74 105 142 212 310 412 566 797 711 1036 1311 1351 1644
No. of ETFs 1 1 2 19 19 29 30 92 202 280 282 336 461 713 1170 1595 1944 2460 3011 3297
0
400
800
1200
1600
2000
2400
2800
3200
3600
0
200
400
600
800
1000
1200
1400
1600
1800
No
. of E
TF
s A
UM
$ B
illi
on

•37
Growth of ETFs in India
Source : Based on data collated from AMFI website i.e. www.amfiindia.com
* - Average AUM for the Quarter. (For other periods, amount is Average AUM for Month)
This information discusses general market activity, industry or sector trends, or other broad-based economic, market or political conditions and should not be construed as research or
investment advice. Please see additional disclosures.
Dec-02 Dec-03 Dec-04 Dec-05 Dec-06 Dec-07 Dec-08 Dec-09 Dec-10* Dec-11*Sept-12*
Avg. AUM 7 168 568 2920 7811 7142 2671 2410 4981 10852 12186
No of ETFs 1 5 6 6 6 12 16 18 26 33 34
0
5
10
15
20
25
30
35
40
0
2000
4000
6000
8000
10000
12000
14000
No
. of E
TF
s
Avg
. A
UM
(R
s.
in C
rore
s)

Funds managed by Fund Managers
•38
Returns for one year are absolute. Returns for more than one year are compounded annualized. Dividends are assumed to be reinvested at the prevailing NAV. Distribution taxes are
excluded while calculating the returns. Bonus declared has been adjusted. Incase, the start/end date of the concerned period is non business date (NBD), the NAV of the previous date is
considered for computation of returns. Point to Point (PTP) returns in INR is based on standard investment of INR 10,000 made at the beginning of 12 month period as at the end of that
period scheme performance. Additional benchmark for equity schemes - source : National Stock Exchange of India. Past performance may or may not be sustained in future and should not
be used as a basis for comparison with other investments.
Fund manager: Vishal Jain
Scheme Name
September 30, 2011 to
September 30, 2012
September 30, 2010 to
September 30, 2011
September 30, 2009 to
September 30, 2010 Since Inception
Allotment
Date Absolute PTP Absolute PTP Absolute PTP CAGR PTP
Returns (%) Returns (INR) Returns (%) Returns (INR) Returns (%) Returns (INR) Returns (%) Returns (INR)
GS Nifty BeES 16.66 11666 -17.17 8283 19.41 11941 18.71 63289 28-Dec-01
S&P CNX Nifty Index (Benchmark) 15.38 11538 -18.02 8198 18.61 11861 17.20 55168
S&P CNX Nifty Total Returns Index 16.86 11686 -17.07 8293 19.88 11988 19.04 65205
GS Bank BeES 22.61 12261 -22.84 7716 41.14 14114 21.30 50094 27-May-04
CNX Bank Index (Benchmark) 21.00 12100 -23.43 7657 40.33 14033 19.84 45291
CNX Bank Total Returns Index 22.47 12247 -22.67 7733 41.86 14186 21.76 51709
S&P CNX Nifty Index (Addl. Benchmark) 15.38 11538 -18.02 8198 18.61 11861 16.57 35951
GS Gold BeES 19.98 11998 32.85 13285 21.49 12149 23.02 31672 8-Mar-07
Domestic Price of Gold (Benchmark) 21.33 12133 34.73 13473 22.75 12275 24.28 33514
GSEDOF - Growth 7.82 10782 7.47 10747 3.53 10353 6.38 13552 31-Oct-07
Crisil Balance Fund Index 8.65 10865 7.77 10777 4.05 10405 6.95 13911
S&P CNX Nifty Index (Addl. Benchmark) 15.38 11538 -18.02 8198 18.61 11861 -0.69 9666
GS S&P CNX 500 Fund - Growth 13.17 11317 -19.39 8061 17.27 11727 18.98 19119 6-Jan-09
S&P CNX 500 Index (Benchmark) 13.22 11322 -19.22 8078 19.58 11958 17.98 18527
S&P CNX 500 Total Returns Index 14.57 11457 -18.32 8168 20.80 12080 19.39 19366
S&P CNX Nifty Index (Addl. Benchmark) 15.38 11538 -18.02 8198 18.61 11861 17.63 18322
Data as on 28th Sep 2012

Funds managed by Fund Managers
•39
Returns for one year are absolute. Returns for more than one year are compounded annualized. Dividends are assumed to be reinvested at the prevailing NAV. Distribution taxes are
excluded while calculating the returns. Bonus declared has been adjusted. Incase, the start/end date of the concerned period is non business date (NBD), the NAV of the previous date is
considered for computation of returns. Point to Point (PTP) returns in INR is based on standard investment of INR 10,000 made at the beginning of 12 month period as at the end of that
period scheme performance. Additional benchmark for equity schemes - source : National Stock Exchange of India. Past performance may or may not be sustained in future and should not
be used as a basis for comparison with other investments.
Fund manager: Vishal Jain
Scheme Name
September 30, 2011 to
September 30, 2012
September 30, 2010 to
September 30, 2011
September 30, 2009 to
September 30, 2010 Since Inception
Allotment
Date Absolute PTP Absolute PTP Absolute PTP CAGR PTP
Returns (%) Returns (INR) Returns (%) Returns (INR) Returns (%) Returns (INR) Returns (%) Returns (INR)
GS S&P Shariah BeES 10.90 11090 -14.66 8534 9.88 10988 19.91 18996 18-Mar-09
S&P CNX Nifty Shariah Index 10.13 11013 -15.21 8479 9.57 10957 19.17 18587
(Benchmark)
S&P CNX Nifty Shariah 11.93 11193 -14.09 8591 10.88 11088 20.76 19480
Total Returns Index
S&P CNX Nifty Index (Addl. Benchmark) 15.38 11538 -18.02 8198 18.61 11861 22.36 20408
GS Hang Seng BeES 31.48 13148 -12.78 8722 -- -- 8.18 12230 9-Mar-10
Hang Seng Index (Benchmark) 18.46 11846 -21.32 7868 -- -- -0.68 9827
Hang Seng Total Returns Index 33.09 13309 -12.08 8792 -- -- 9.02 12474
S&P CNX Nifty Index (Addl. Benchmark) 15.38 11538 -18.02 8198 -- -- 4.45 11180
GS Infra BeES -2.32 9768 -- -- -- -- -17.67 6778 29-Sep-10
CNX Infrastructure Index (Benchmark) -2.43 9757 -- -- -- -- -17.58 6793
CNX Infrastructure Total Returns Index -1.32 9868 -- -- -- -- -16.73 6933
S&P CNX Nifty Index (Addl. Benchmark) 15.38 11538 -- -- -- -- -2.43 9519
Data as on 28th Sep 2012

Disclaimers
RISK FACTORS
• “S&P®” and “Standard and Poor’s®” are trademarks of the McGraw-hill Companies, Inc. (“S&P”), and have been licensed for use by India Index Services &
Products Limited in connection with the S&P CNX Nifty and S&P CNX Nifty Shariah Index. GS Nifty BeES and GS S&P Shariah BeES are not sponsored,
endorsed, sold or promoted by India Index Services & Products Limited ("IISL") or Standard & Poor's, a division of The McGraw-Hill Companies, Inc. ("S&P").
Neither IISL nor S&P makes any representation or warranty, express or implied, to the owners of GS Nifty BeES and GS S&P Shariah BeES or any member of
the public regarding the advisability of investing in securities generally or in GS Nifty BeES and GS S&P Shariah BeES. Please read the full Disclaimers in
relation to the S&P CNX Nifty Index and S&P CNX Nifty Shariah Index in the Scheme Information Document before investing. • The Products on CNX Nifty
Junior Index, CNX Bank Index, CNX PSU Bank Index and CNX Infrastructure Index are not sponsored, endorsed, sold or promoted by India Index Services &
Products Limited (IISL). IISL does not make and expressly disclaims any representation or warranty, express or implied (including warranties of
merchantability or fitness for particular purpose or use) regarding the advisability of investing in the products linked to CNX Nifty Junior Index, CNX Bank
Index, CNX PSU Bank Index and CNX Infrastructure Index or particularly in the ability of the CNX Nifty Junior Index, CNX Bank Index, CNX PSU Bank Index
and CNX Infrastructure Index to track general stock market performance in India.
The Hang Seng Index (the “Index”) is published and compiled by Hang Seng Indexes Company Limited pursuant to a license from Hang Seng Data Services
Limited. The mark and name Hang Seng Index are proprietary to Hang Seng Data Services Limited. Hang Seng Indexes Company Limited and Hang Seng
Data Services Limited have agreed to the use of, and reference to, the index by Goldman Sachs Asset Management (India) Pvt. Ltd. in connection with
Goldman Sachs Hang Seng Exchange Traded Scheme (GS Hang Seng BeES) (the “Product”), but neither Hang Seng Indexes Company Limited nor Hang
Seng Data Services Limited warrants or represents or guarantees to any broker or holder of the product or any other person (i) the accuracy or completeness
of the index and its computation or any information related thereto; or (ii) the fitness or suitability for any purpose of the index or any component or data
comprised in it; or (iii) the results which may be obtained by any person from the use of the index or any component or data comprised in it for any purpose,
and no warranty or representation or guarantee of any kind whatsoever relating to the index is given or may be implied. The process and basis of
computation and compilation of the index and any of the related formula or formulae, constituent stocks and factors may at any time be changed or altered by
Hang Seng Indexes Company Limited without notice. To the extent permitted by applicable law, no responsibility or liability is accepted by Hang Seng
Indexes Company Limited or Hang Seng Data Services Limited (i) In respect of the use of and/ or reference to the index by Goldman Sachs Asset
Management (India) Pvt. Ltd. in connection with the product; or (ii) for any inaccuracies, omissions, mistakes or errors of Hang Seng Indexes Company
Limited in the computation of the index; or (iii) for any inaccuracies, omissions, mistakes, errors or incompleteness of any information used in connection
with the computation of the index which is supplied by any other person; or (iv) for any economic or other loss which may be directly or indirectly sustained
by any broker or holder of the product or any other person dealing with the product as a result of any of the aforesaid, and no claims, actions or legal
proceedings may be brought against Hang Seng Indexes Company Limited and/ or Hang Seng Data Services Limited in connection with the product in any
manner whatsoever by any broker, holder or other person dealing with the product. Any broker, holder or other person dealing with the product does so
therefore in full knowledge of this disclaimer and can place no reliance whatsoever on Hang Seng Indexes Company Limited and Hang Seng Data Services
Limited.

For the avoidance of doubt, this disclaimer does not create any contractual or quasi-contractual relationship between any broker, holder or other person and
Hang Seng Indexes Company Limited and/ or Hang Seng Data Services Limited and must not be construed to have created such relationship. • Please read
the Scheme Information Documents (SID) and Statement of Additional Information (SAI) carefully before investing. • For schemes specific risk factors, please
refer SID.
Risk factors pertaining to VIP (This is applicable only for Goldman Sachs S&P CNX 500 Fund):
• As the monthly investment amount is variable, it would be difficult for the investors to manage their cash flows. • If the market moves in one direction i.e.
either up or down, VIP may generate less return compared to SIP. • If the NAV of the Goldman Sachs S&P CNX 500 Fund continuously decreases, the absolute
loss to the investor would be more than what the investor would have incurred by investing in SIP.
For more details please refer the SID, SAI, Key Information Memorandum and Application Form which are available at the office of the AMC or can be
downloaded from www.gsam.in
NSE Disclaimer : It is to be distinctly understood that the permission given by NSE should not in any way be deemed or construed that the Scheme
Information Document has been cleared or approved by NSE nor does it certify the correctness or completeness of any of the contents of the Draft Scheme
Information Document . The investors are advised to refer to the Scheme Information Document for the full text of the Disclaimer Clause of NSE
Information gathered & material used in this document is believed to be from reliable sources. However, Goldman Sachs Asset Management (India) Private
Limited does not warrant the accuracy, reasonableness and/or completeness of any information.
Confidentiality
No part of this material may, without GSAM‟s prior written consent, be (i) copied, photocopied or duplicated in any form, by any means, or (ii) distributed to any person
that is not an employee, officer, director, or authorized agent of the recipient.
•41
Disclaimers (contd.)
Mutual Fund Investments are subject to market risks,
read all scheme related documents carefully.

Appendix
THIS MATERIAL DOES NOT CONSTITUTE AN OFFER OR SOLICITATION IN ANY JURISDICTION WHERE OR TO ANY PERSON TO WHOM IT WOULD BE
UNAUTHORIZED OR UNLAWFUL TO DO SO.
Although certain information has been obtained from sources believed to be reliable, we do not guarantee its accuracy, completeness or fairness. We have relied upon
and assumed without independent verification, the accuracy and completeness of all information available from public sources.
Views and opinions expressed are for informational purposes only and do not constitute a recommendation by GSAM to buy, sell, or hold any security. Views and
opinions are current as of the date of this presentation and may be subject to change, they should not be construed as investment advice.
The website links provided are for your convenience only and are not an endorsement or recommendation by GSAM of any of these websites or the products or services
offered. GSAM is not responsible for the accuracy and validity of the content of these websites.
Index Benchmarks
Indices are unmanaged. The figures for the index reflect the reinvestment of all income or dividends, as applicable, but do not reflect the deduction of any fees or
expenses which would reduce returns. Investors cannot invest directly in indices.
The indices referenced herein have been selected because they are well known, easily recognized by investors, and reflect those indices that the Investment Manager
believes, in part based on industry practice, provide a suitable benchmark against which to evaluate the investment or broader market described herein. The exclusion of
“failed” or closed hedge funds may mean that each index overstates the performance of hedge funds generally.
This material is issued in or from India by Goldman Sachs Asset Management (India) Private Limited (GSAM India)
•42

References to indices, benchmarks or other measures of relative market performance over a specified period of time are provided for your information only and do not
imply that the portfolio will achieve similar results. The index composition may not reflect the manner in which a portfolio is constructed. While an adviser seeks to design
a portfolio which reflects appropriate risk and return features, portfolio characteristics may deviate from those of the benchmark.
Past performance does not guarantee future results, which may vary. The value of investments and the income derived from investments will fluctuate and can go down
as well as up. A loss of principal may occur.
This material has been prepared by GSAM and is not a product of Goldman Sachs Global Investment Research. The views and opinions expressed may differ from
those of Goldman Sachs Global Investment Research or other departments or divisions of Goldman Sachs and its affiliates. Investors are urged to consult with their
financial advisors before buying or selling any securities. This information may not be current and GSAM has no obligation to provide any updates or changes.
© 2012 Goldman Sachs. All rights reserved.
87548.OSF.OTU
•43
Appendix

Thank you
Goldman Sachs Asset Management (India) Pvt. Ltd.
951-A, Rational House,
Appasaheb Marathe Marg,
Prabhadevi
Mumbai - 400 025.
Toll free no.: 1800-266-1220
Website: www.gsam.in
Email: [email protected]
•18

Understanding Equity ETFs and the Underlying Indices that Drive
the Engine
Investing Online
Trade Tiger – A Tool

Synopsis
•Online Investing Trend
– Advantages, Key Trends
•Online trading demo (Trade Tiger)
•Online SIPs

Online Investing Trends • Online trading platforms have been available in India since 2002
• Indian capital markets have subsequently recorded 1488% of growth in exchange turnover.
• Key advantages experienced by investors using online trading platforms
• Lower trading costs
• Improved execution speed, and
• Greater ease of access
• Highly Secured execution of trades, and timely availability of execution data
• Simplicity in tracking portfolios
• Emerging Trends
• Usage of online platforms to track research trends
• Mobile Trading

Online Investing Volumes
Source: NSE Factbook

Trade in ETFs

Trade in ETFs

Trade in ETFs

Features Introduced
Bracket Order :-
A 2 legged positional order, where you can place the
Book Profit & Stop Loss order with your initial order.
Bracket order helps you to lock the profits and also define
the stop loss price to bracket your position

New Features Introduced
Bracket Order :-
A 2 legged positional order, where you can place the
Book Profit & Stop Loss order with your initial order.
Bracket order helps you to lock the profits and also define
the stop loss price to bracket your position

New Features Introduced
Bracket Order :-
A 2 legged positional order, where you can place the
Book Profit & Stop Loss order with your initial order.
Bracket order helps you to lock the profits and also define
the stop loss price to bracket your position

Charts in TradeTiger:
• Charts empowered with 15 different studies and 6 tools for in
depth technical analysis
• New Studies in Charts: Parabolic SAR & Pivot Point
• 30 day Intraday charts with different time intervals
• Types of Charts: Line, Bar and Candle stick


ETF SIP
• ETF SIP will help you in buying ETFs systematically.
• This will be executed (as market order) on the specified date/s
subject to availability of funds in your account
• Useful for professionals who are keen to have control on their
investments directly but do not have enough time to do so.

ETF SIP
•Steps for Creating ETF SIP:
Choose the ETF for your SIP
Choose the start date, frequency and period for SIP
Enter the trading password and click on Create SIP
• Two Ways of Creating SIP:
• Choose your own ETF
• Choose ETF from Sharekhan picks (if any)

Own ETFs
•Steps for Creating Stock SIP:
Choose the stock/s for your SIP
Choose the start date, frequency and period for SIP
Enter the trading password and click on Create SIP
• Two Ways of Creating SIP:
• Choose your own stocks
• Choose stocks from Sharekhan Research picks

Research Picks

Thank You!
Q & A

PROPRIETARY. PERMISSION TO REPRINT OR DISTRIBUTE ANY CONTENT FROM THIS PRESENTATION REQUIRES THE WRITTEN APPROVAL OF S&P DOW JONES INDICES.
Thank you for joining us…
62
Contact Us Want More?
Koel Ghosh
S&P Dow Jones Indices
Click on the widget at the bottom of your screen and
visit www.spindices.com
Featured Content:
• S&P Indices India website
Please click on the widget at the bottom of your screen to
complete the survey. Your feedback is important to us.
Sameer Desai
Goldman Sachs Asset Management
Sunny Ahuja
Sharekhan
Visit www.spindices.com for more content and to find out about
upcoming events.