Understanding Disproportionality New York University Metropolitan Center for Research on Equity and...
85
Understanding Disproportionality New York University Metropolitan Center for Research on Equity and the Transformation of Schools Technical Assistance Center on Disproportionality ENTER DISTRICT NAME ENTER DATE
-
Upload
erin-fowler -
Category
Documents
-
view
214 -
download
0
Transcript of Understanding Disproportionality New York University Metropolitan Center for Research on Equity and...
Understanding Disproportionality
New York University
Metropolitan Center for Research on Equity and the Transformation of Schools
Technical Assistance Center on Disproportionality
ENTER DISTRICT NAME
ENTER DATE
ICEBREAKER: Getting to know each other
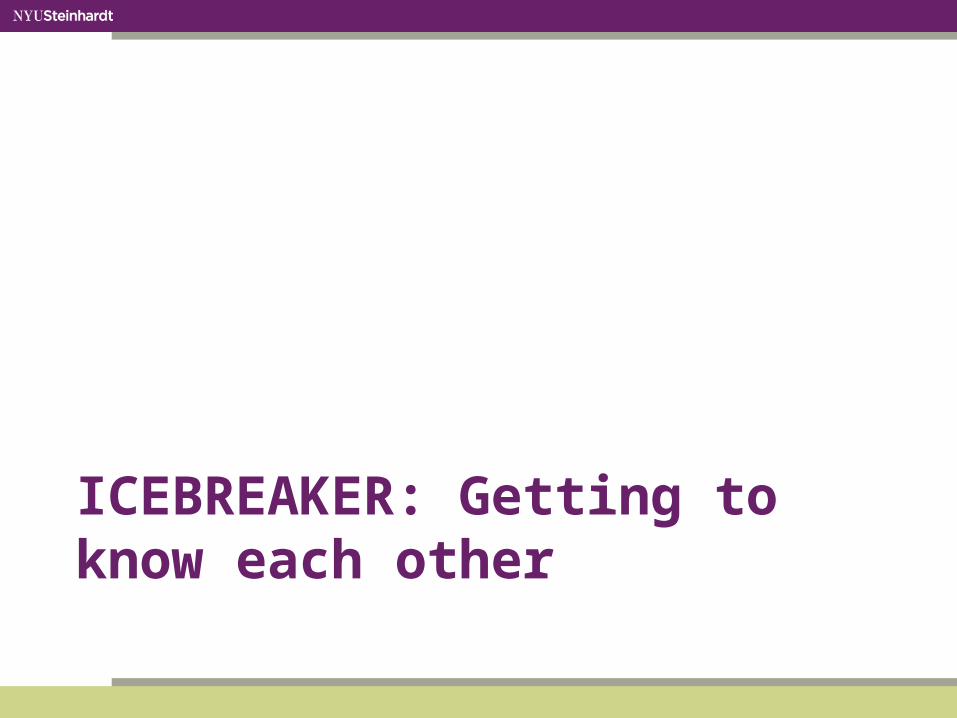
Overview of the Day
• Part 1: Establishing Norms Within the Root Cause Process
• Part 2: Defining Disproportionality• Part 3: Looking at Ourselves• Part 4: Looking at the Data Around Disproportionality• Part 5: Looking at Disproportionality in our District• Part 6: Reflection, wrap-up, and debriefing

Objectives
• Develop a framework for understanding how disproportionality relates to special education and school discipline both at the national and local level
• Identify policies, practices and beliefs that may contribute to disproportionality in your district which will be examined in the root cause process
PART 1: Establishing Norms Within the Root Cause Process

Contract
• Push your growing edge• Consider what’s in it for you
and where you’re going• Listen with respect and stay
engaged• Struggle together and expect
to experience discomfort• Speak your “truth” and
respect the “truth” of others
“As we struggle together, we will have hit the growing edge—push your growing edge!”
-The People’s Institute for Survival and Beyond

Discussing the Elephant in the Room
Our educational systems have disproportionate negative impacts on particular students: • Males• Students of color (particularly
Black and Latino students)• Students of low socio-
economic backgrounds• LGBTQ• Students with Disabilities
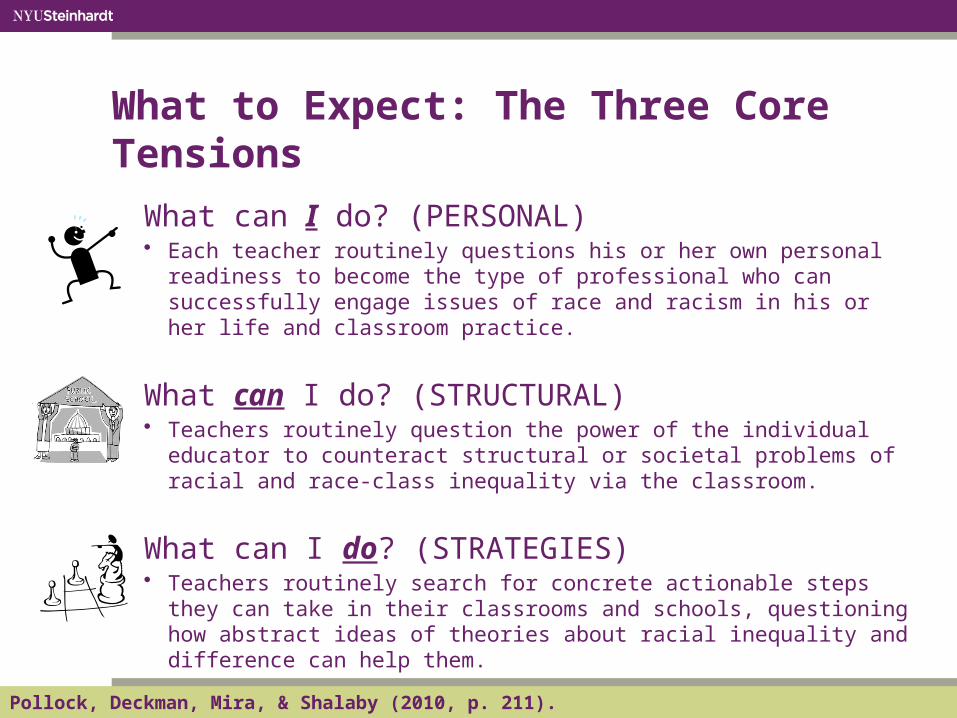
What to Expect: The Three Core Tensions
What can I do? (PERSONAL) • Each teacher routinely questions his or her own personal readiness
to become the type of professional who can successfully engage issues of race and racism in his or her life and classroom practice.
What can I do? (STRUCTURAL) • Teachers routinely question the power of the individual educator to
counteract structural or societal problems of racial and race-class inequality via the classroom.
What can I do? (STRATEGIES)• Teachers routinely search for concrete actionable steps they can
take in their classrooms and schools, questioning how abstract ideas of theories about racial inequality and difference can help them.
From Pollock, Deckman, Mira, & Shalaby (2010, p. 211).
PART 2: Defining Disproportionality
Critical Questions: • What is disproportionality?• Who is affected by
disproportionality?

What is the Purpose of…
Special Education
• Provides intervention services • Provides equal opportunity for all learners to
access educational services• Ensures equal opportunity and access for
every child to be academically successful
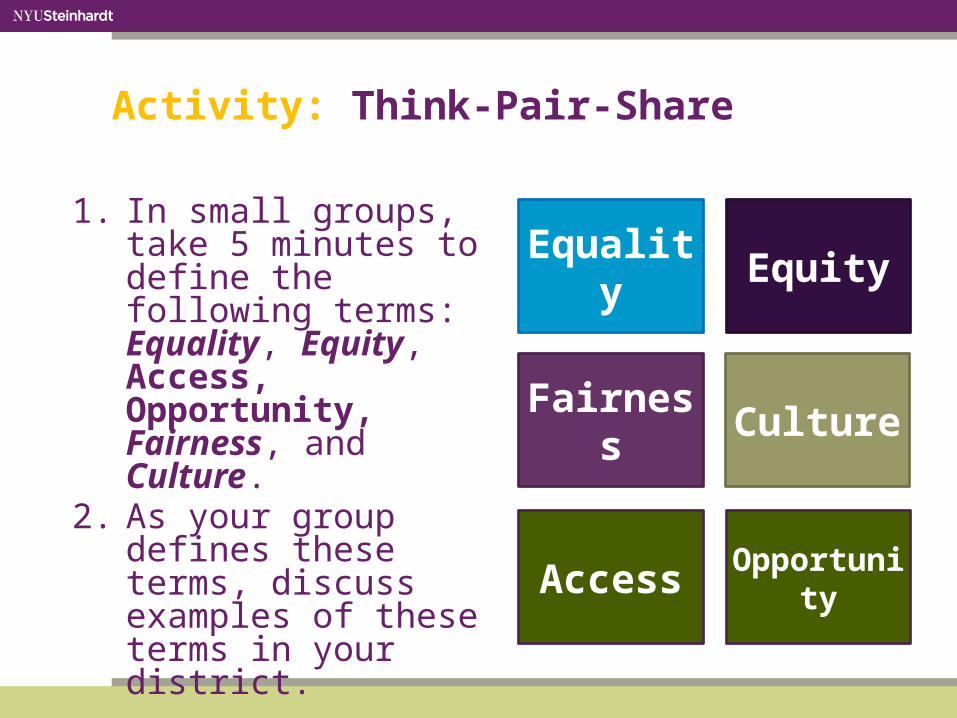
Activity: Think-Pair-Share
1. In small groups, take 5 minutes to define the following terms: Equality, Equity, Access, Opportunity, Fairness, and Culture.
2. As your group defines these terms, discuss examples of these terms in your district.
Equality Equity
Fairness Culture
Access Opportunity

General Equality• The state or quality of
being equal; correspondence in quantity, degree, value, rank, or ability.
Educational Equality• The principal of allocating
educational resources with an emphasis on the equal distribution of inputs without attention given to the corresponding outputs.
Equality

• Equity is when
everyone has access
to the opportunities
necessary to satisfy
their essential needs,
advance their well-
being and reach their
full potential

General Equity• “The principle of
supplementing the law to ensure equality or justice.”
Educational Equity• “The principle of altering
current practices and perspectives to teach for social transformation and to promote equitable learning outcomes for students for all social groups.”
From: Lee, E. (2002)
Equity

• The right or opportunity to use or benefit from resources
• Educational access: means the right to the resources for success.
• Access scenarios:– Affirmative action, quotas,
etc.– GI bill for housing and
college– Fair criteria for gifted and
talented/AP/honors
Access
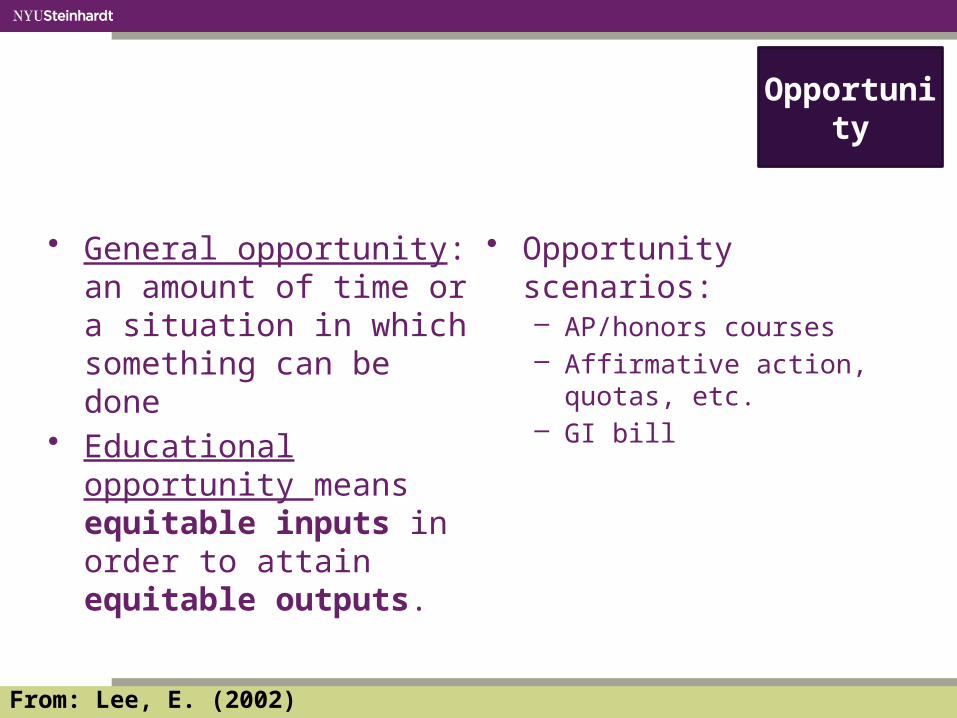
• General opportunity: an amount of time or a situation in which something can be done
• Educational opportunity means equitable inputs in order to attain equitable outputs.
• Opportunity scenarios:– AP/honors courses– Affirmative action, quotas,
etc.– GI bill
From: Lee, E. (2002)
Opportunity

• The chance of getting what we want in life.• How our chance for success compares with others (may
not always look the same).
From: Mithaug, D. E. (1996)
Fairness
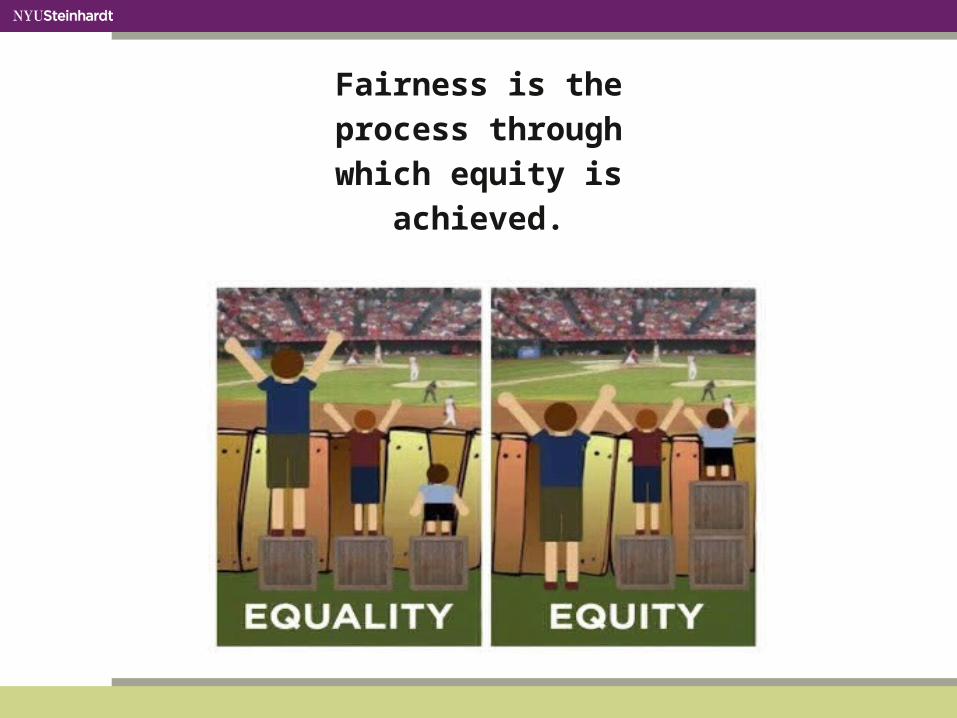
Fairness is the
process through
which equity is
achieved.

Disproportionality is…
• The over-representation of a specific group in special education programs or disciplinary outcomes relative to the presence of this group in the overall student population, and/or
• The under-representation of a specific group in accessing intervention services, resources, programs, rigorous curriculum and instruction relative to the presence of this group in the overall student population
SOURCE:U.S. Department of Education

WHY SHOULD WE PAY ATTENTION TO DISPROPORTIONALITY?
Who is affected by disproportionality?
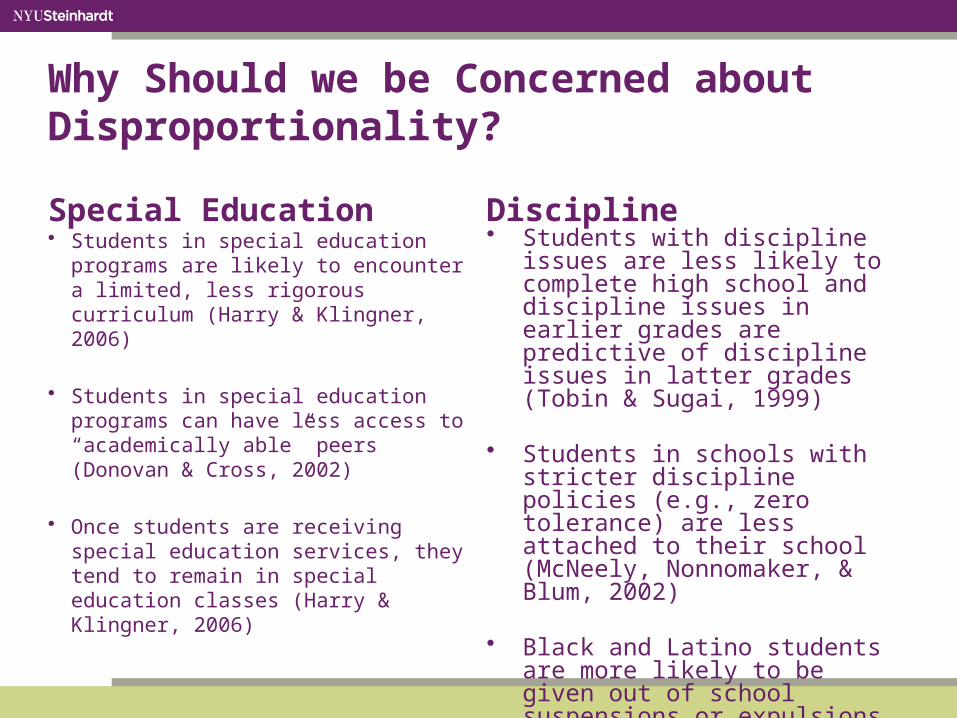
Why Should we be Concerned about Disproportionality?
Special Education• Students in special education
programs are likely to encounter a limited, less rigorous curriculum (Harry & Klingner, 2006)
• Students in special education programs can have less access to “academically able” peers (Donovan & Cross, 2002)
• Once students are receiving special education services, they tend to remain in special education classes (Harry & Klingner, 2006)
Discipline• Students with discipline issues are
less likely to complete high school and discipline issues in earlier grades are predictive of discipline issues in latter grades (Tobin & Sugai, 1999)
• Students in schools with stricter discipline policies (e.g., zero tolerance) are less attached to their school (McNeely, Nonnomaker, & Blum, 2002)
• Black and Latino students are more likely to be given out of school suspensions or expulsions for the same behavior than their White peers (Skiba et al., 2011)

Think-Pair-Share
Video - Melissa Harris-Perry
Based on the clip, how would you answer the question:
Why should we be concerned about disproportionality?
Defining Disproportionality within the Root Cause Process
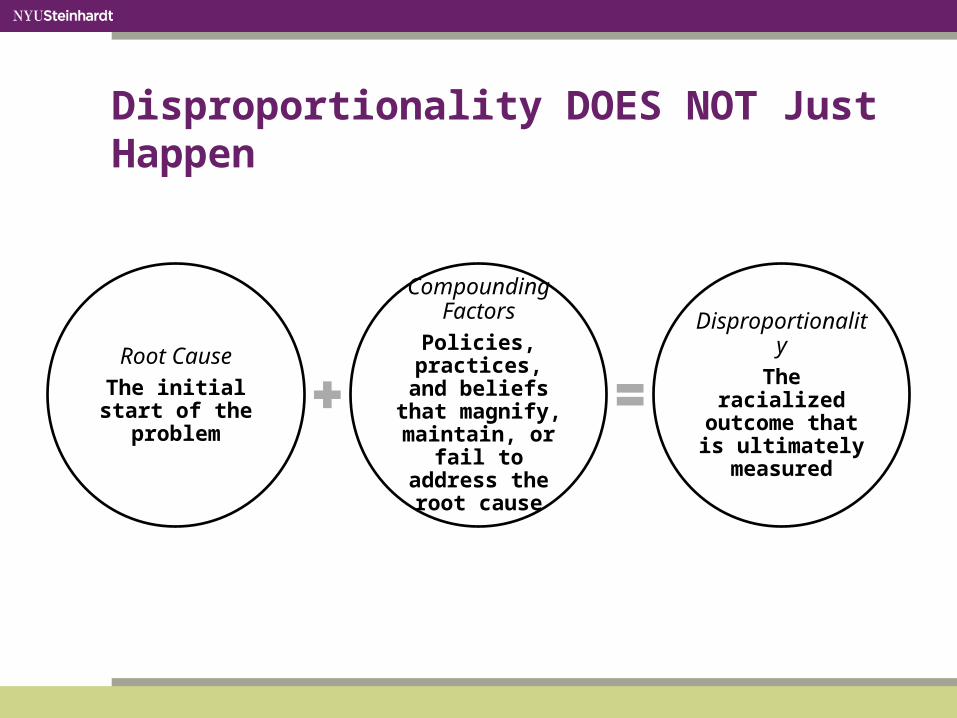
Disproportionality DOES NOT Just Happen
Disproportionality is often times NOT a special education issue
Disproportionality DOES NOT Just Happen
Root CauseThe initial start of the problem
Compounding FactorsPolicies,
practices, and beliefs that
magnify, maintain, or fail to address the
root cause
DisproportionalityThe racialized
outcome that is ultimately measured

Disproportionality is often times NOT a special education issue
While disproportionality citations come from special education laws, the factors that lead to it are oftentimes outside of the realm of special education
District/
School Wide
Interventions and
Supports
Special Education

Throughout the Root Cause process we are going to understand how:
Disproportionality manifests in beliefs, policies and practices (BPP) —and—
How changing beliefs, policies and practices can positively affect student outcomes.

Factors that Influence Disproportionality(Causes and Solutions)• Policies: the written guidelines that frame these
domains within or in relation to school• Practices: the activities in these domains (formal and
informal)• Beliefs: the ideas held by school personnel in
engaging in specific practices or implementing school policies
Catherine Maria Voulgarides
I think we shoudl say the written guidelines that influence teh educational process or something like that; then practice: the activitites, both formal and informal, that result from policies and procedures: then beliefs: teh ideas held by schoolpersonnel...NO EDITS NEEDED ON THIS ONE
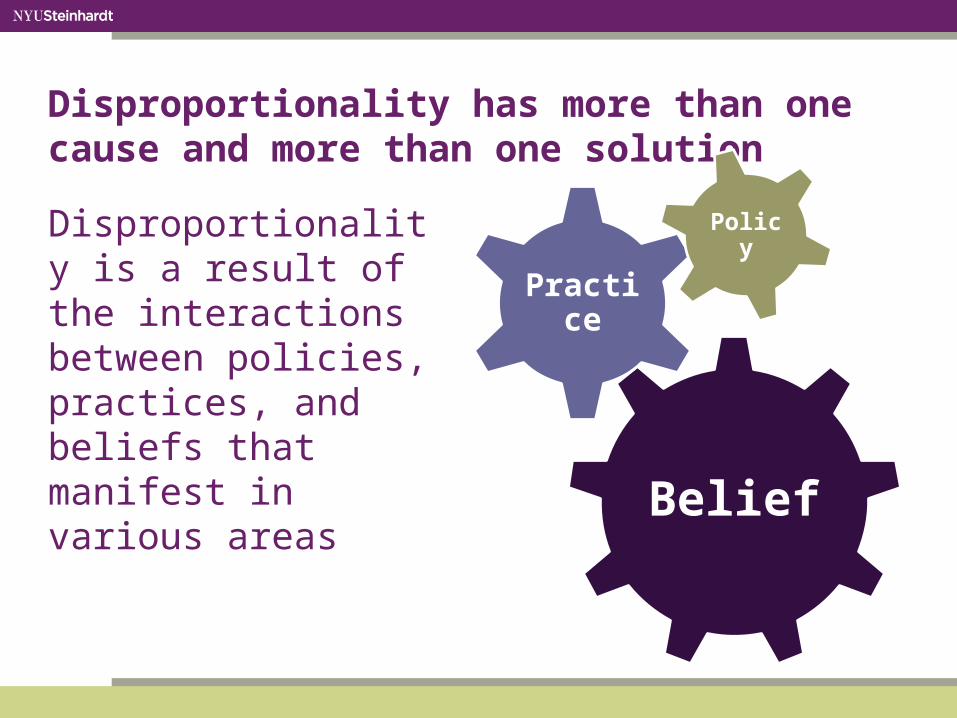
Disproportionality has more than one cause and more than one solution
Disproportionality is a result of the interactions between policies, practices, and beliefs that manifest in various areas
Belief
Practice
Policy

Disproportionality Is Complex
Disproportionality Discipline Policies and Practices
Interventions and Referrals
Instruction and Assessment
Educational Opportunity
Family and Community
Teacher Expectations and Misconceptions
Cultural Dissonance
Sociodemographics

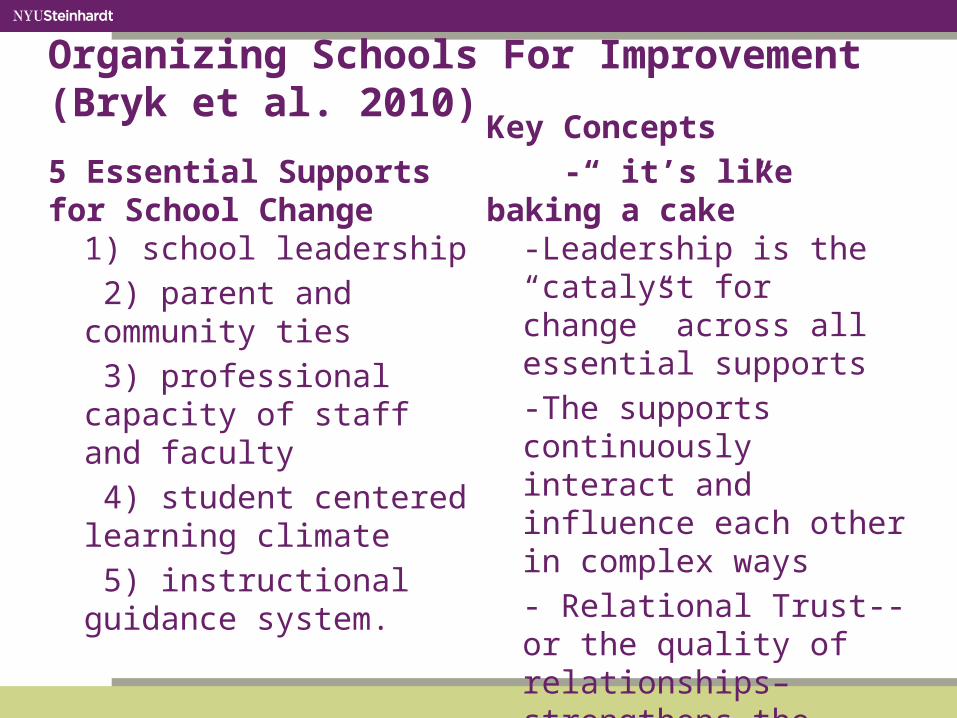
Organizing Schools For Improvement (Bryk et al. 2010)
5 Essential Supports for School Change
1) school leadership
2) parent and community ties
3) professional capacity of staff and faculty
4) student centered learning climate
5) instructional guidance system.
Key Concepts
-“ it’s like baking a cake”-Leadership is the “catalyst for change” across all essential supports
-The supports continuously interact and influence each other in complex ways
- Relational Trust--or the quality of relationships– strengthens the school change process

Moving from Root Causes to SolutionsBeliefs, Polices and Practices influence both the Root Causes and Solutions
Ro
ot
Cau
ses
Leadership
Family and Community Ties
Student Centered Learning Climate
Professional Staff Capacity
Instructional Guidance

Take a moment to jot any new ideas onto your “IDEAS” sheet

PART 3: Looking at Ourselves
Critical Questions: • What interventions do we have in
place in our classrooms and in our schools?

ACTIVITY: The School Early Intervention and Classification Process
Stage 1: Student exhibits problem behavior/need
Stage 2: A school committee considers the student referral
Stage 3: The student is evaluated by a specialist depending on the need that is exhibited
Stage 4: The student receives an individual education plan (IEP)
• Please discuss this student’s journey through the intervention and classification process and record the following:1. key policies and practices that
may affect or determine the student’s outcome at each of the stages
2. critical questions that should be considered at of the stages
3. possible outcomes.
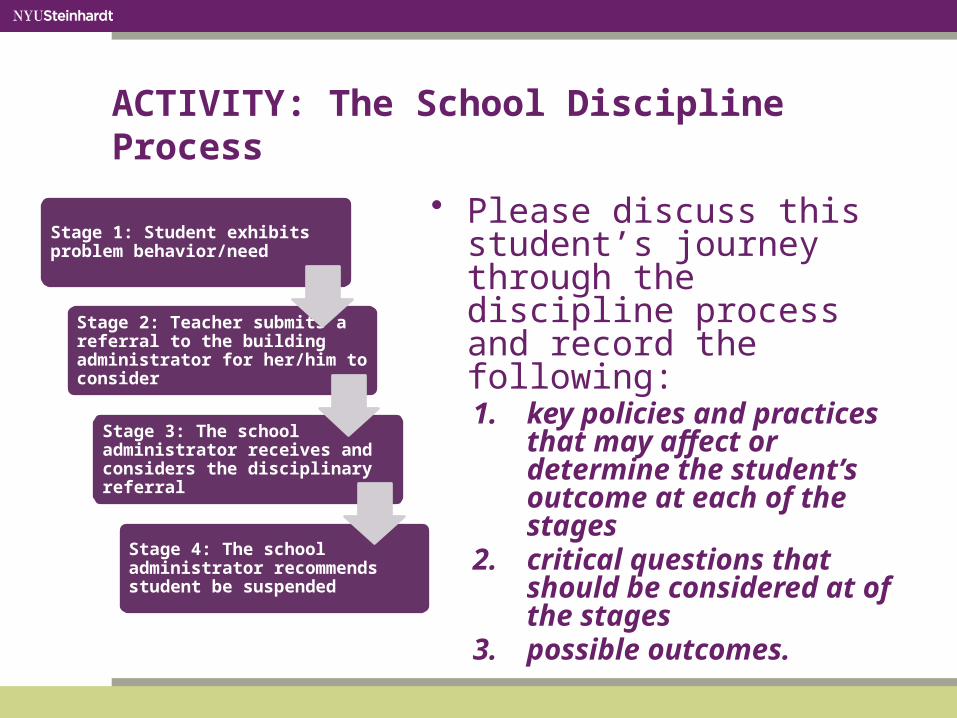
ACTIVITY: The School Discipline Process
Stage 1: Student exhibits problem behavior/need
Stage 2: Teacher submits a referral to the building administrator for her/him to consider
Stage 3: The school administrator receives and considers the disciplinary referral
Stage 4: The school administrator recommends student be suspended
• Please discuss this student’s journey through the discipline process and record the following:1. key policies and practices
that may affect or determine the student’s outcome at each of the stages
2. critical questions that should be considered at of the stages
3. possible outcomes.

Reflection Questions
• Who are the students that are classified as disabled in your school?
• Who are the students that are being suspended or disciplined the most?
• What grades are students referred to special education?
• What are the reasons they are referred to special education? Or for a disciplinary referral?
• What has been provided for them prior to their referral to special education? Or prior to a disciplinary consequence?

Take a moment to jot any new ideas onto your “IDEAS” sheet

PART 4: Looking at the Data Around Disproportionality
Critical Questions: • Are there any patterns that we
can draw from this data?• What questions are posed by this
data?
THE NATIONAL PUBLIC SCHOOL PICTURE

National Public School Achievement4th Grade NAEP (2011)
Math
All Students
-80%
-60%
-40%
-20%
0%
20%
40%
60%
Advanced
Proficient
Basic and Be-low Basic
Reading
All Students
-80%
-60%
-40%
-20%
0%
20%
40%
60%
Advanced
Proficient
Basic or Below Basic
From: U.S. Department of Education, National Center for Educational Statistics (NCES)

National Public School Achievement4th Grade NAEP, by Race/Ethnicity (2011)
Math
White Black Latino Asian0%
10%
20%
30%
40%
50%
60%
70%
80%
Advanced
Proficient
Basic or Below Basic
Reading
White Black Latino Asian0%
10%
20%
30%
40%
50%
60%
70%
80%
Advanced
Proficient
Basic or Below Basic
From: U.S. Department of Education, National Center for Educational Statistics (NCES)

National Public School Achievement8th Grade NAEP (2011)
Math
All Students
-80%
-60%
-40%
-20%
0%
20%
40%
60%
Advanced
Proficient
Basic or Below Basic
Reading
All Students
-10%
0%
10%
20%
30%
40%
50%
60%
Advanced
Proficient
Basic or Below Basic
From: U.S. Department of Education, National Center for Educational Statistics (NCES)

National Public School Achievement8th Grade NAEP, by Race/Ethnicity (2009)
Math
White Black Latino Asian0%
10%
20%
30%
40%
50%
60%
70%
80%
Advanced
Proficient
Basic or Below Basic
Reading
White Black Latino Asian0%
10%
20%
30%
40%
50%
60%
70%
80%
Advanced
Proficient
Basic or Below Basic
From: U.S. Department of Education, National Center for Educational Statistics (NCES)

The National Achievement Gap
Math (2011)• 4th Grade: Black students on
average scored 25 points lower than White students and Latino Students on average scored 20 points lower than White students
• 8th Grade: Black students on average scored 31 points lower than White students and Latino students on average scored 23 points lower than White students
Reading (2011)• 4th Grade: Black students on
average scored 25 points lower than White students and Latino Students on average scored 24 points lower than White students
• 8th Grade: Black students on average scored 25 points lower than White students and Latino students on average scored 22 points lower than White students
BY THE END OF HIGH SCHOOL

Black and Latino 17-Year-Olds Perform as well as White 13-Year-Olds in Math (2008)
200 250 300 3500
10
20
30
40
50
60
70
17-year-old Black students17-year-old Hispanic students13-year-old White students
Performance Level
Perc
ent o
f Stu
dent
s
SOURCE: U.S. Department of Education, National Center for Educational Statistics (NCES)
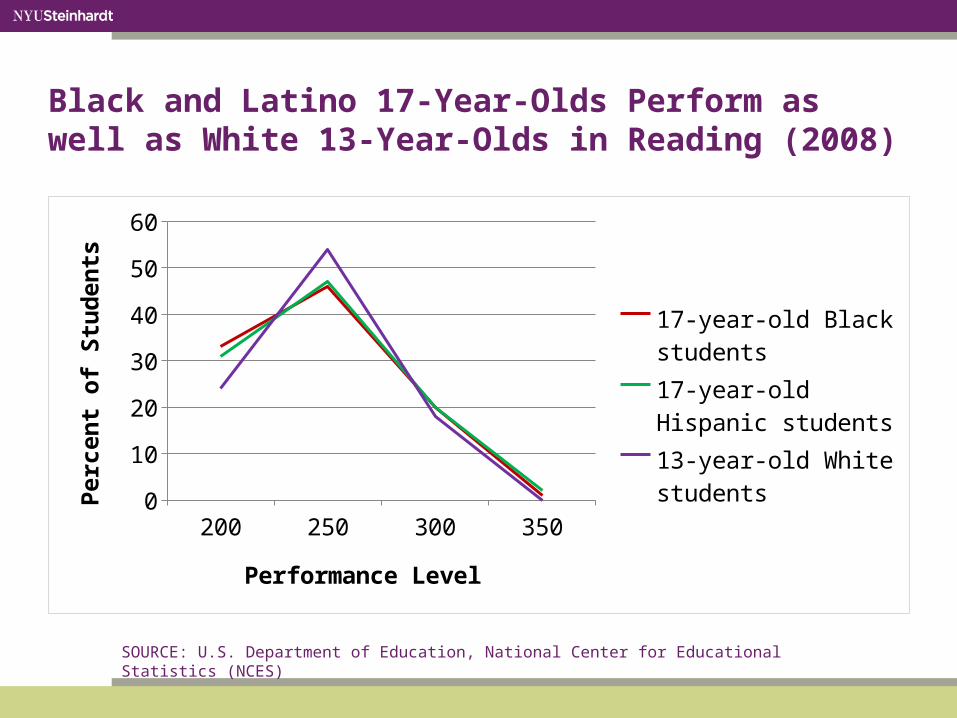
Black and Latino 17-Year-Olds Perform as well as White 13-Year-Olds in Reading (2008)
200 250 300 3500
10
20
30
40
50
60
17-year-old Black students17-year-old Hispanic students13-year-old White students
Performance Level
Perc
ent o
f Stu
dent
s
SOURCE: U.S. Department of Education, National Center for Educational Statistics (NCES)

CONTROLLING FOR POVERTY (NATIONAL)

National Public School 4th Grade NAEP Scores by Race/Ethnicity and Eligibility for Free or Reduced Lunch (2009)
White
Black
Hispanic
Asian/Pacific Island
American Indian
Unclassified
175 185 195 205 215 225 235 245 255
Not eligible Average scale score Eligible Average scale score
Black students who do not qualify for the National Lunch Pro-gram score as well as White students who do qualify for the Na-tional Lunch Pro-gram

THE NEW YORK STATE PUBLIC SCHOOL PICTURE

The New York State Achievement Gap
New York State trends reflect national patterns. There are prevalent disparities by race and ethnicity in both Math and English

CONTROLLING FOR POVERTY(NEW YORK STATE)

New York State 4th Grade NAEP Scores by Race/Ethnicity and Eligibility for Free or Reduced Lunch (2009)
White
Black
Hispanic
Asian/Pacific Island
175 185 195 205 215 225 235 245 255
Not eligible Average scale score Eligible Average scale score
Black students who do not qual-ify for the Na-tional Lunch Pro-gram score as well as White students who do qualify for the National Lunch Program

PART 5: Looking at disproportionality in our district
Critical Questions: • What are some key
disproportionality indicators in your district and what do they mean?

SCHOOL LEVEL DATA: Tools We Can Use to Better Understand
Disproportionality
• School Level Data Book: the resource provides practitioners the opportunity to explore school level data and to understand disciplinary patterns in their schools
• Equity Calendar: the resource provides a framework for practitioners to critically think about school level data, disaggregated by race, to address disparate outcomes

ACTIVITYCitation Data Book and Mapping Root CausesExploring Trends in Your District
ACHIEVEMENT AND ENROLLMENT DATA
What does your data say?
How do the trends in data relate to common root causes of disproportionality?

Enrollment Data Over Time-SAMPLE
Amer
ican
Indi
an
Black
or A
frica
n Am
erica
n
Hispan
ic or
Lat
ino
Asian
Whi
te
Mul
tirac
ial
0%
10%
20%
30%
40%
50%
60%
70%
80%
2008-092009-102010-11
2008-09 2009-10 2010-110
500
1000
1500
2000
2500
American IndianBlack or African AmericanHispanic or LatinoAsianWhiteMultiracial

3rd Grade Math and ELA-SAMPLE
Grade 3 Mathematics
Black Hispanic White
-80%
-60%
-40%
-20%
0%
20%
40%
60%
80%
100%
Level 4Level 3Level 1 or Level 2
Grade 3 ELA
Black Hispanic White
-80%
-60%
-40%
-20%
0%
20%
40%
60%
80%
100%
Level 4Level 3Level 1 or Level 2
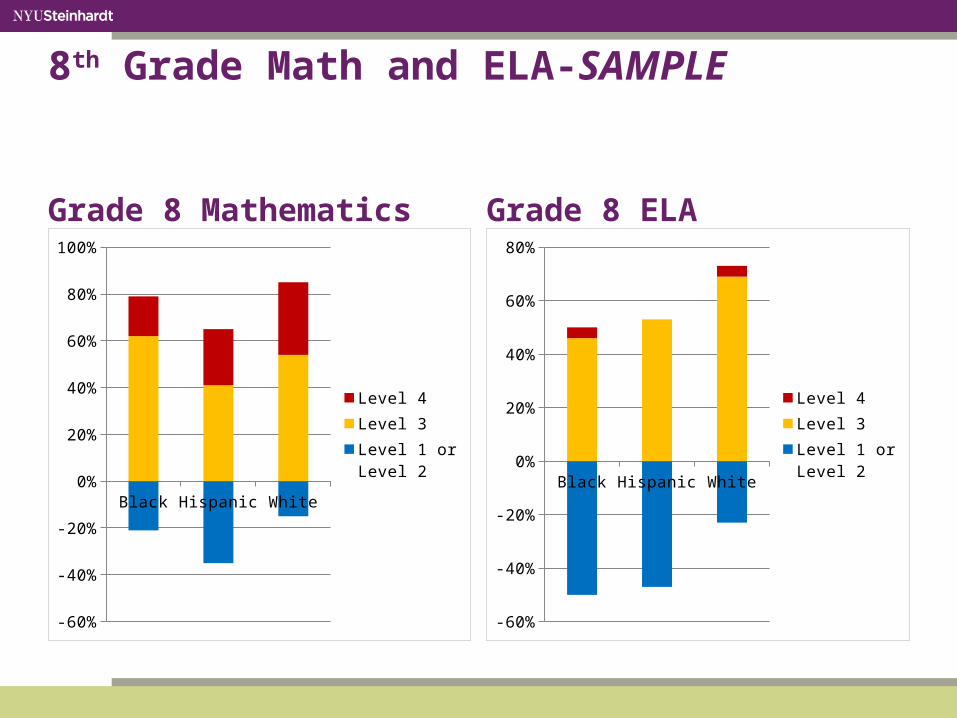
8th Grade Math and ELA-SAMPLE
Grade 8 Mathematics
Black Hispanic White
-60%
-40%
-20%
0%
20%
40%
60%
80%
100%
Level 4Level 3Level 1 or Level 2
Grade 8 ELA
Black Hispanic White
-60%
-40%
-20%
0%
20%
40%
60%
80%
Level 4Level 3Level 1 or Level 2

Reflection Questions
• How does your enrollment data relate to common Root Causes of Disproportionality?
• Are there disparities in achievement? How do these relate to common Root Causes of Disproportionality?

Take a moment to jot any new ideas onto your “IDEAS” sheet

How do we measure disproportionality?
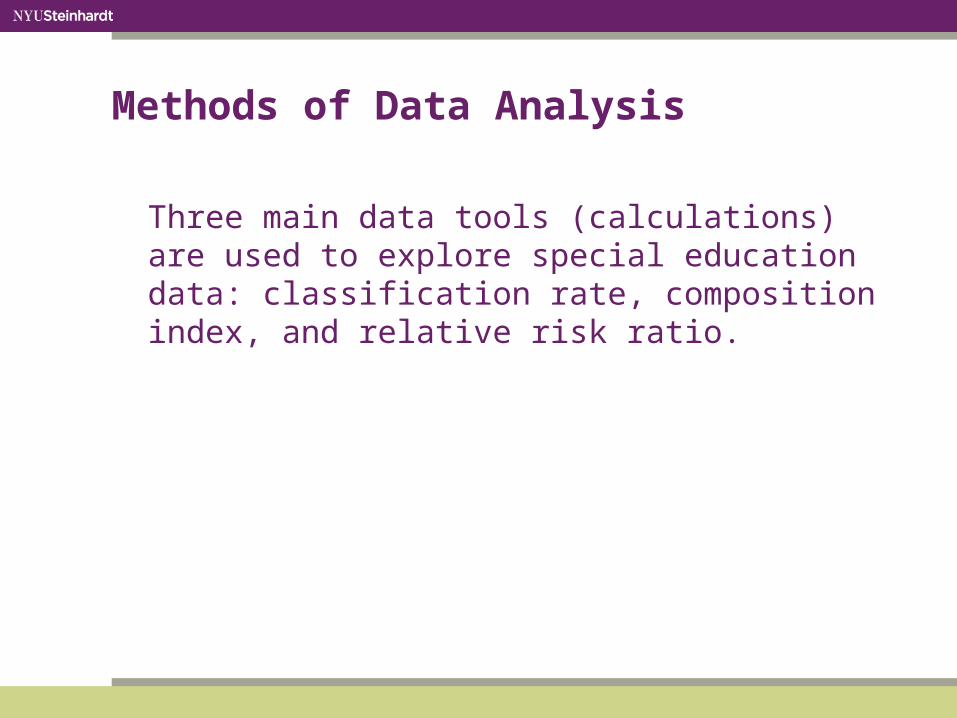
Methods of Data Analysis
Three main data tools (calculations) are used to explore special education data: classification rate, composition index, and relative risk ratio.

Methods for Identifying Disproportionality
Risk Index/Rate Composition Index Relative Risk Ratio
The risk index identifies at what rate, or percentage of risk, students of a particular racial/ethnic group have in a particular outcome.
The composition index gives the proportion of students by race/ethnicity in a particular outcome.
Composition indexes are used to determine if a particular group is over- or underrepresented in a particular outcome.
Relative risk ratios are comparisons of the risks of a particular outcome of one group to the risk of the remaining group(s) experiencing the same outcome.
A risk ratio of 1 indicates that there is equal risk. An increase in risk ratio is indicative of increased risk.
Catherine Maria Voulgarides
Ilike this slide better than the multiple slides because it is more succinct. We dont need to keep it but I put it here for review. The formatting isnt so great either.

Calculating Relative Risk: Classification (SPP Indicator 9)
The Idea
The Risk of Black Students Being Classified SWDCompared to
The Risk of All Other Students Being Classified SWD
The Formula
(Black SWD ÷ Black enrollment)
÷ [(Total SWD – Black
SWD) ÷ (Total enrollment – Black enrollment)]

New York State Citation Information
Indicator 4 Refers to discipline and suspension or expulsion of students with disabilities for greater than 10 days (4a) and by race/ethnicity for greater than 10 days (4b)[20 U.S.C. 1416(a)(3)(A); 1412(a)(22)]
Discrepancy: 4a: 2.7%4b: 2.3%
Disproportionality:
2.0
* review of students records to see if positive behavioral supports have been used* review of Individual Education Plans to see if they reflect the use of behavioral supports and interventions prior to suspension. * review determining whether or not Behavioral Intervention Plans have been developed and utilized *review determining if Manifestation Determination hearings occurred prior to suspension or expulsion *review determining if a proper interim alternative educational setting was provided if a student was suspended.
Indicator 9 Refers to disproportionate identification of racial and ethnic groups for special education and related services as a result of inappropriate identification.[20 U.S.C. 1416(a)(3)(C)]
Disproportionality:2.5
*review of school wide approaches and pre referral interventions*review of the referral process for students to special education* review of the evaluation of practices for students with disabilities *review of evaluation of the districts eligibility determinants for special education
Indicator 10 Refers to disproportionate representation of students with disabilities by classification in specific disability categories (10a) and by placement (10b) by race/ethnicity[20 U.S.C. 1416(a)(3)(C)][20 U.S.C. 1418(d)(1)]
Disproportionality
10a: 4.010b: 2.0
*review of how students are evaluated for special education*review of the content of student Individual Education Plan *review of how special education problem solving teams recommend students for classification
Catherine Maria Voulgarides
I know this is tiny writing but I feel like people always want to know this info. This could be a handout too if needed.

ACTIVITYCitation Data Book and Mapping Root CausesExploring Trends in Your District

SPECIAL EDUCATION DATA
What does your data say?
How do the trends in data relate to common root causes of disproportionality?
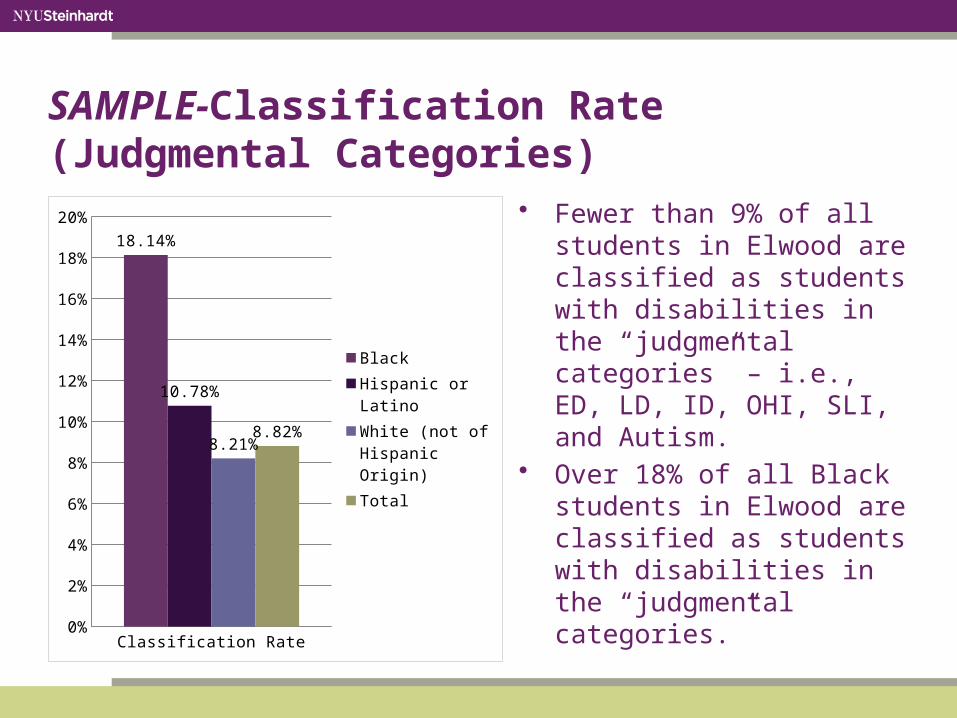
SAMPLE-Classification Rate (Judgmental Categories)
Classification Rate0%
2%
4%
6%
8%
10%
12%
14%
16%
18%
20%
18.14%
10.78%
8.21%8.82%
BlackHispanic or LatinoWhite (not of Hispanic Origin)Total
• Fewer than 9% of all students in Elwood are classified as students with disabilities in the “judgmental categories” – i.e., ED, LD, ID, OHI, SLI, and Autism.
• Over 18% of all Black students in Elwood are classified as students with disabilities in the “judgmental categories.”

SAMPLE-Relative Risk of Being Classified Disabled (Judgmental Categories)
• Black students are more than twice as likely to be classified as students with disabilities (in the judgmental categories) compared to all other students.
Risk Ratio
0.40
0.60
0.80
1.00
1.20
1.40
1.60
1.80
2.00
2.20
2.402.27
1.26
0.79
BlackHispanic or LatinoWhite (not of Hispanic Origin)

SAMPLE-Classification Rate by Disability Category
ED LD ID OHI SLI AUT0%
1%
2%
3%
4%
5%
6%
7%
8%
BlackHispanic or LatinoWhite (not of Hispanic Origin)
• Black students have elevated classification rates in the categories of learning disability and speech/ language impairment.
• White and Hispanic and Latino students have elevated classification rates in the categories of other health impaired.
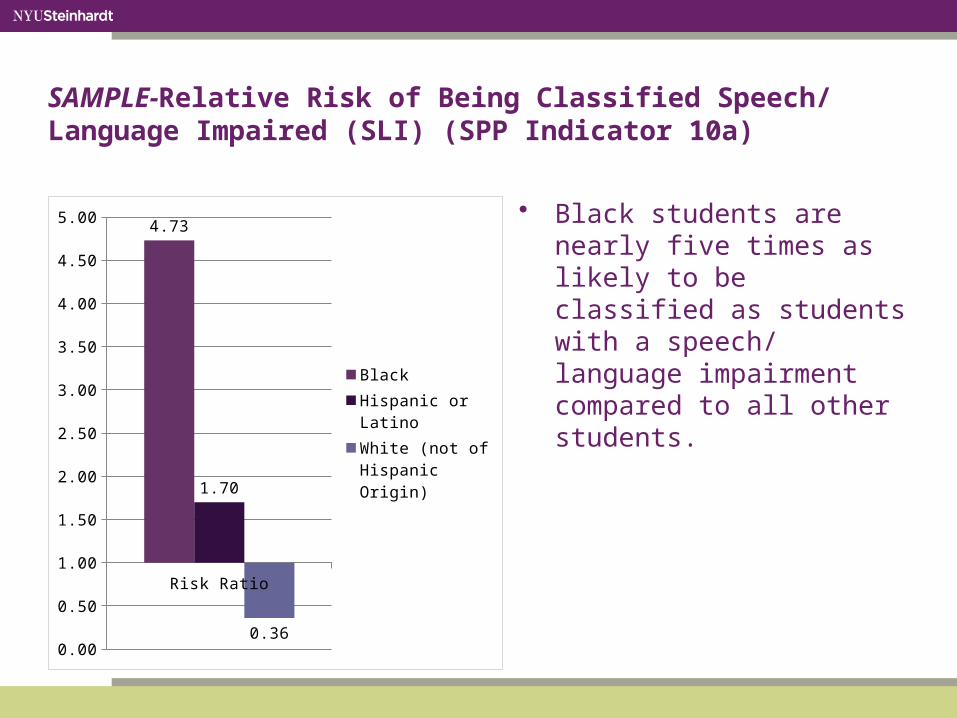
SAMPLE-Relative Risk of Being Classified Speech/ Language Impaired (SLI) (SPP Indicator 10a)
• Black students are nearly five times as likely to be classified as students with a speech/ language impairment compared to all other students.
Risk Ratio
0.00
0.50
1.00
1.50
2.00
2.50
3.00
3.50
4.00
4.50
5.004.73
1.70
0.36
BlackHispanic or LatinoWhite (not of Hispanic Origin)

SAMPLE-Relative Risk of Being Classified Learning Disabled (LD) (SPP Indicator 10a)
• Black students are more than three times as likely to be classified as students with learning disabilities compared to all other students
Risk Ratio
0.00
0.50
1.00
1.50
2.00
2.50
3.00
3.503.32
1.36
0.66
BlackHispanic or LatinoWhite (not of Hispanic Origin)

Reflection Questions
• How does your special education data relate to common Root Causes of Disproportionality?
• Are there disparities in your special education data? How do these disparities relate to common Root Causes of Disproportionality?

Take a moment to jot any new ideas onto your “IDEAS” sheet

PART 6: Reflection, wrap-up, and debriefing

Critical Questions:
• What is disproportionality?• Who is affected by disproportionality?• What interventions do we have in place
in our classrooms and in our schools?• Are there any patterns that we can draw
from this data?• What questions are posed by this data?• What are some key disproportionality
indicators in your district and what do they mean?
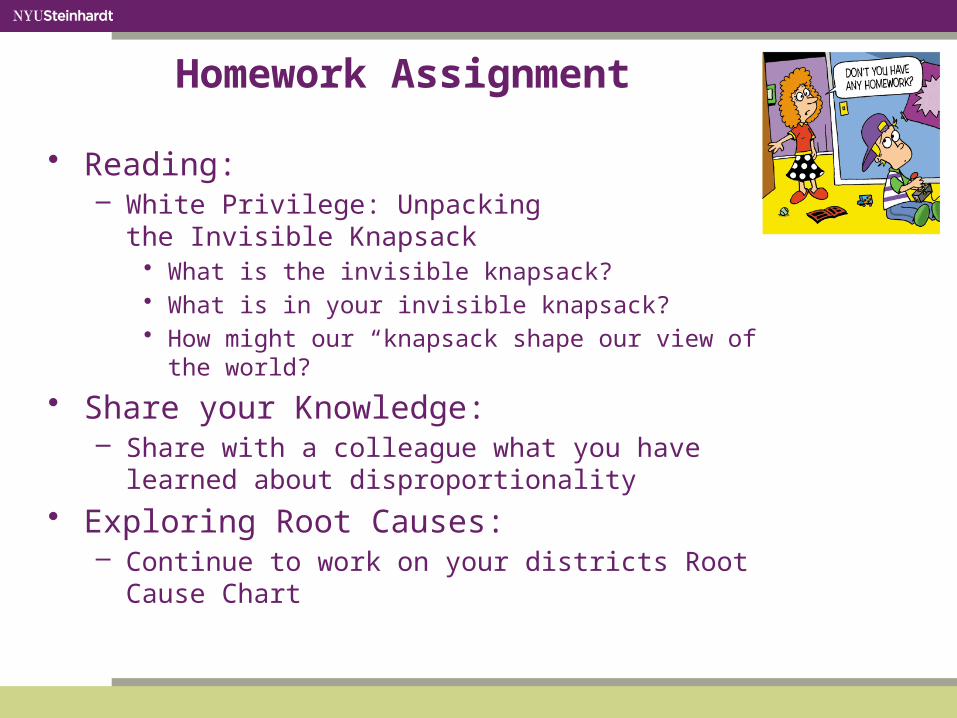
Homework Assignment
• Reading:– White Privilege: Unpacking the Invisible Knapsack
• What is the invisible knapsack? • What is in your invisible knapsack? • How might our “knapsack shape our view of the world?
• Share your Knowledge:– Share with a colleague what you have learned about
disproportionality
• Exploring Root Causes:– Continue to work on your districts Root Cause Chart
Catherine Maria Voulgarides
Do we need to change this HW? Did we talk about that as a whole group?

Wrap-up and Debriefing
• Trainings meeting expectations• Further areas of interest based on today’s training• Potential barriers
• What are some things we learned?• What are some questions we still have?
Evaluate TrainingQuestions, Comments, or Concerns:
ADD NAME AND EMAIL
Ms. Sutton’s Dilemma: a need for special education
Ms. Sutton moves about her fourth grade classroom checking to see which of her students continues to have difficulty with the newly introduced math process of long division. Suddenly, a loud crash draws her attention away from helping students to the commotion in the center of the room. Fallen desks and papers cover the floor. Andy stands in the middle of the havoc.
Ms. Sutton breathes deeply. She thinks, “When will somebody do something for this child? After all, his test scores show he has difficulty with reading and mathematics. Hasn’t this child struggled long enough to be considered for special education? Can’t the special education classes in this school give him more attention than he can possibly get in a general education class of 30 students?”
When Andy engages in class discussions on topics he enjoys, his comments and contributions reflect his regular viewing of educational programs on TV, but his overall performance is low. Ms. Sutton desperately wants to help him, but what are her options? Determined not to let him fail, Ms. Sutton decides to refer him for a special education evaluation. She sees this as her only option to get help for him.
From: Truth in Labeling: Disproportionality in Special Education
Think-Pair-Share: Ms. Sutton and Andy
• What are Ms. Sutton’s options?• Who knows a student similar to Andy?• What are the problems?• What’s going to happen to Andy?

Looking at the situation from multiple perspectives
Student (Andy) Teacher (Ms. Sutton) Administrative
What could Andy have done in order to prevent this incident from occurring?
What could have been done for Andy prior to incident in order to prevent it?
What supports could the administration/school put into place to support Ms. Sutton and Andy prior to this incident in order to prevent it?
What is the function of Andy’s behavior?
Based on this situation, what are some possible problems that Andy could be experiencing? How might you confirm and address them?
Based on this situation, what are some possible problems that Ms Sutton could be experiencing? How might you confirm and address them?
What additional supports are needed?
What additional supports are needed?
What additional supports are needed?
What is going to happen to Andy?