Understanding Conventional and Genomic EPDs
60
-
Upload
rigel-burris -
Category
Documents
-
view
65 -
download
3
description
Understanding Conventional and Genomic EPDs. Dorian Garrick [email protected]. Suppose we generate 100 progeny on 1 bull. Sire. Progeny. Performance of the Progeny. +30 lb. +15 lb. -10 lb. + 5 lb. Sire. +10 lb. Offspring of one sire exhibit more than ¾ diversity of - PowerPoint PPT Presentation
Transcript of Understanding Conventional and Genomic EPDs
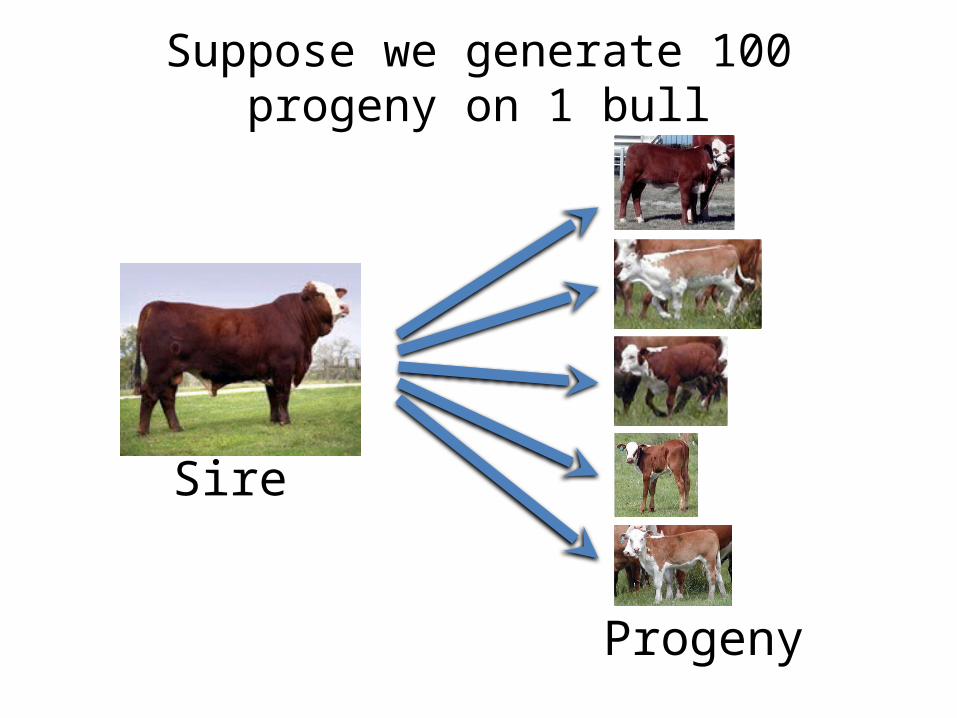
Suppose we generate 100 progeny on 1 bull
Sire
Progeny
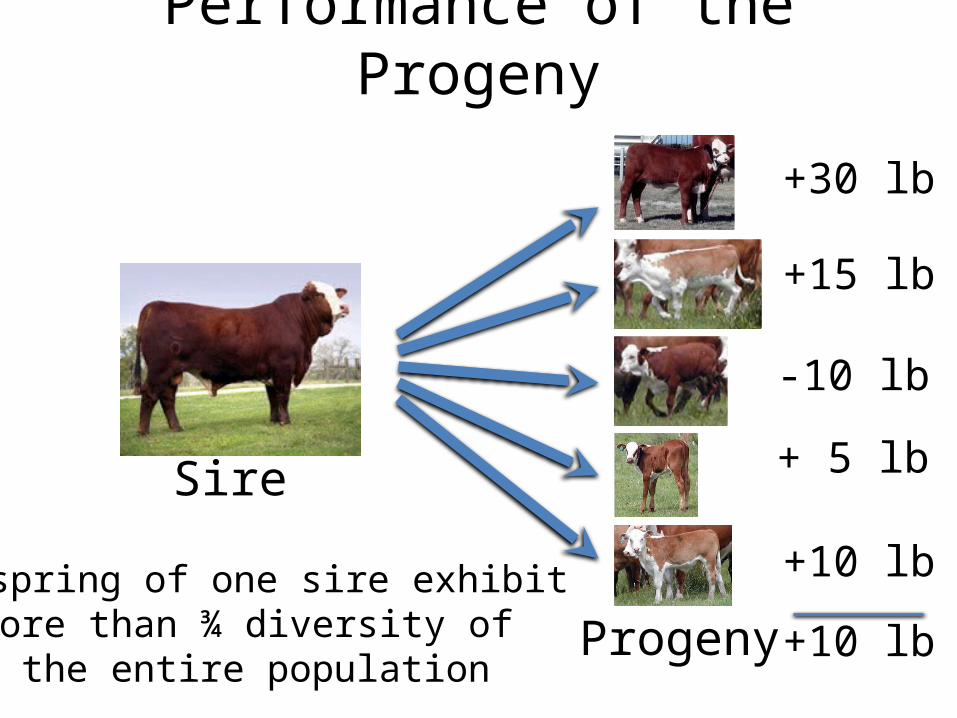
Performance of the Progeny
Sire
Progeny
+30 lb
+15 lb
-10 lb
+ 5 lb
+10 lb
+10 lb
Offspring of one sire exhibit more than ¾ diversity of
the entire population
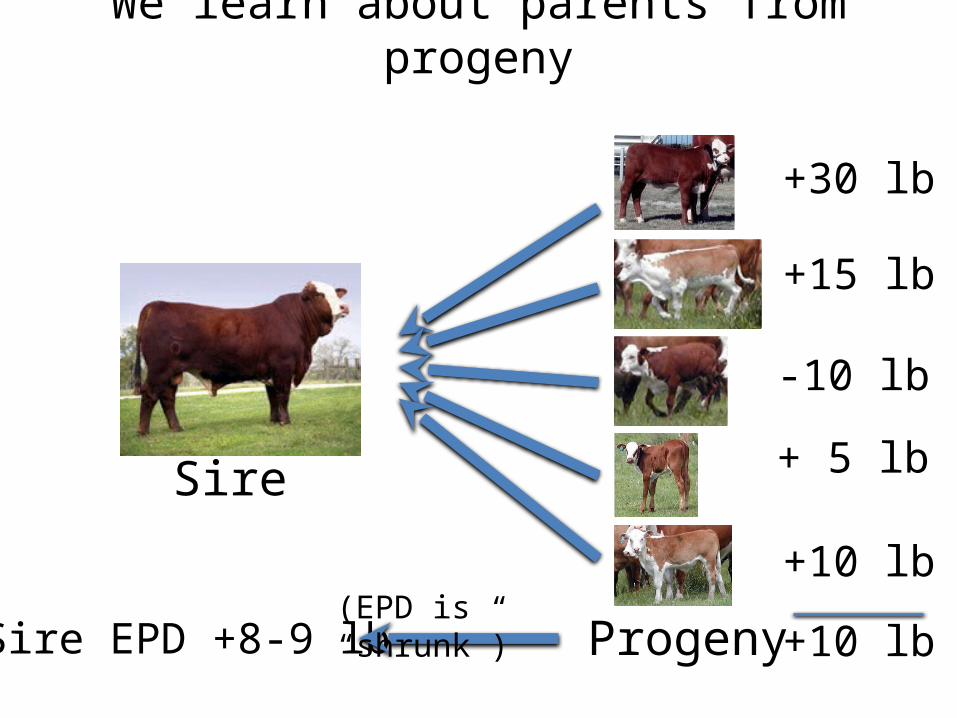
We learn about parents from progeny
Sire
Progeny
+30 lb
+15 lb
-10 lb
+ 5 lb
+10 lb
+10 lbSire EPD +8-9 lb(EPD is “shrunk”)
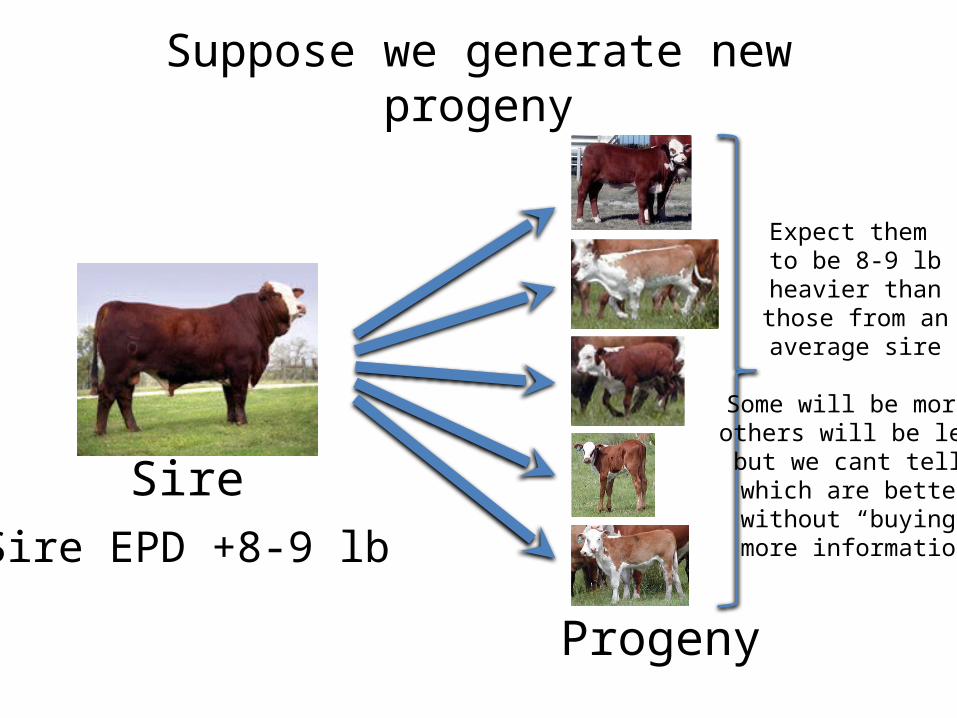
Suppose we generate new progeny
Sire
Progeny
Sire EPD +8-9 lb
Expect them to be 8-9 lb
heavier than those from an average sire
Some will be more others will be less but we cant tell which are better without “buying” more information
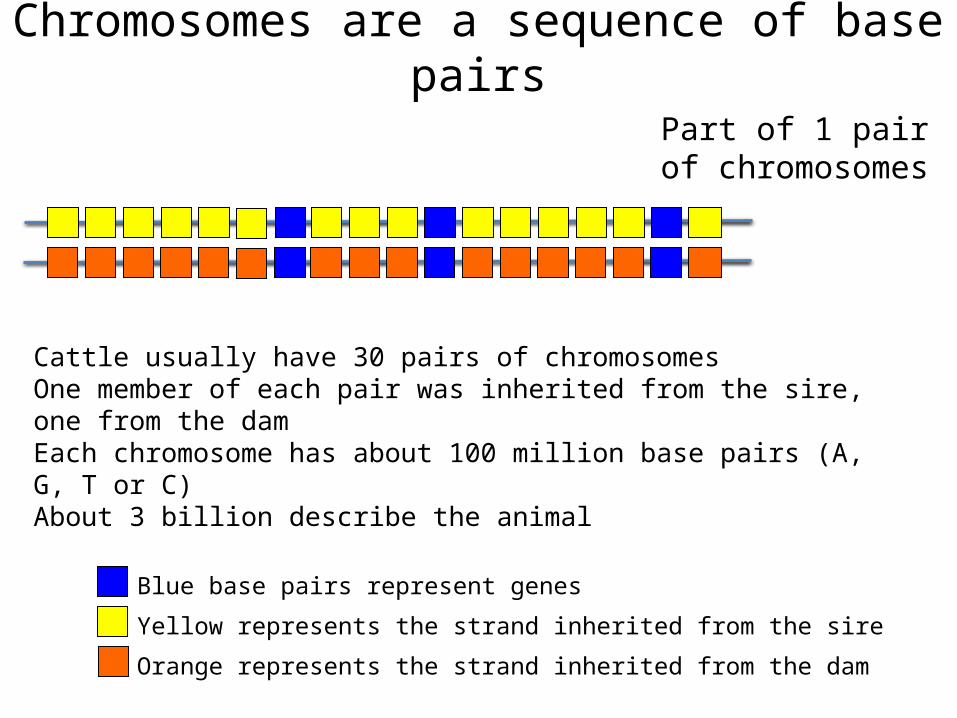
Chromosomes are a sequence of base pairs
Cattle usually have 30 pairs of chromosomesOne member of each pair was inherited from the sire, one from the damEach chromosome has about 100 million base pairs (A, G, T or C)About 3 billion describe the animal
Part of 1 pairof chromosomes
Blue base pairs represent genes
Yellow represents the strand inherited from the sire
Orange represents the strand inherited from the dam
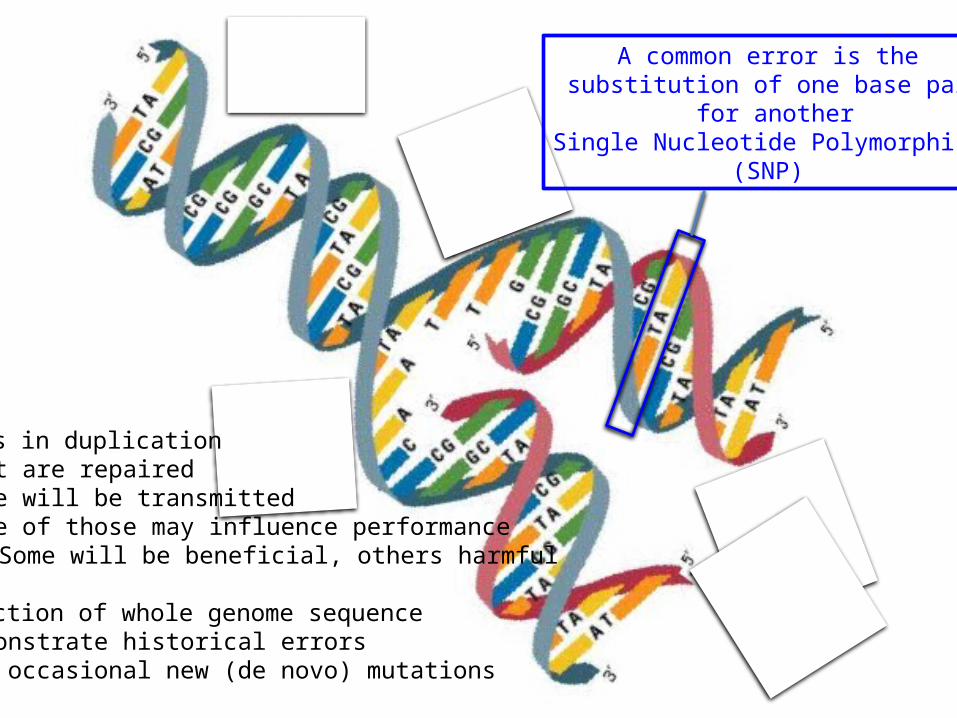
Errors in duplication- Most are repaired- Some will be transmitted- Some of those may influence performance
- Some will be beneficial, others harmful
Inspection of whole genome sequence- Demonstrate historical errors- And occasional new (de novo) mutations
A common error is the substitution of one base pair
for anotherSingle Nucleotide Polymorphism
(SNP)
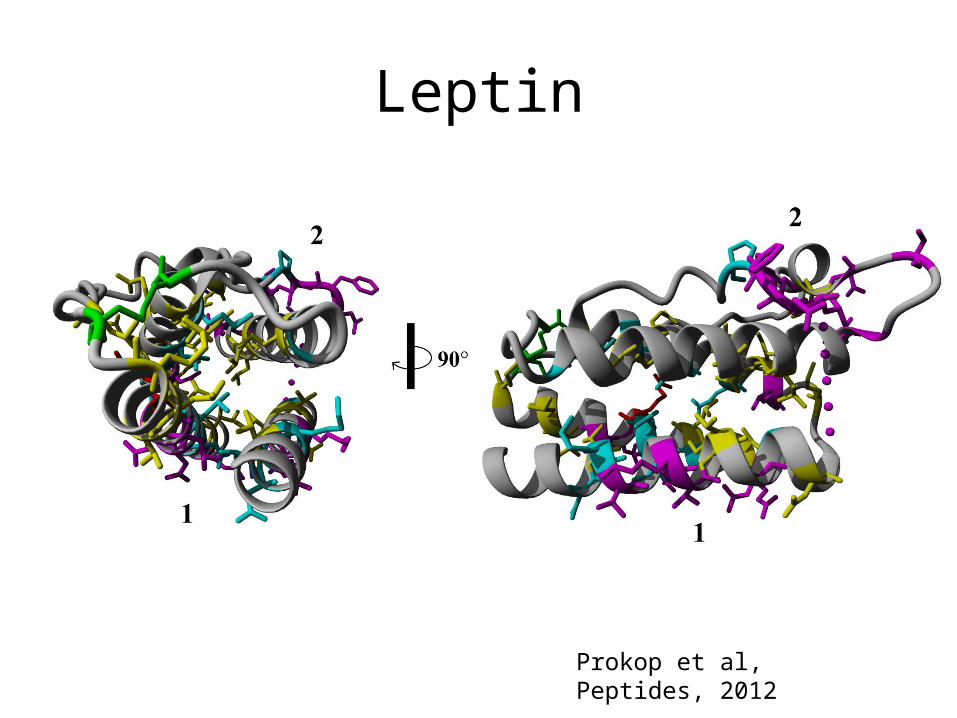
Leptin
Prokop et al, Peptides, 2012
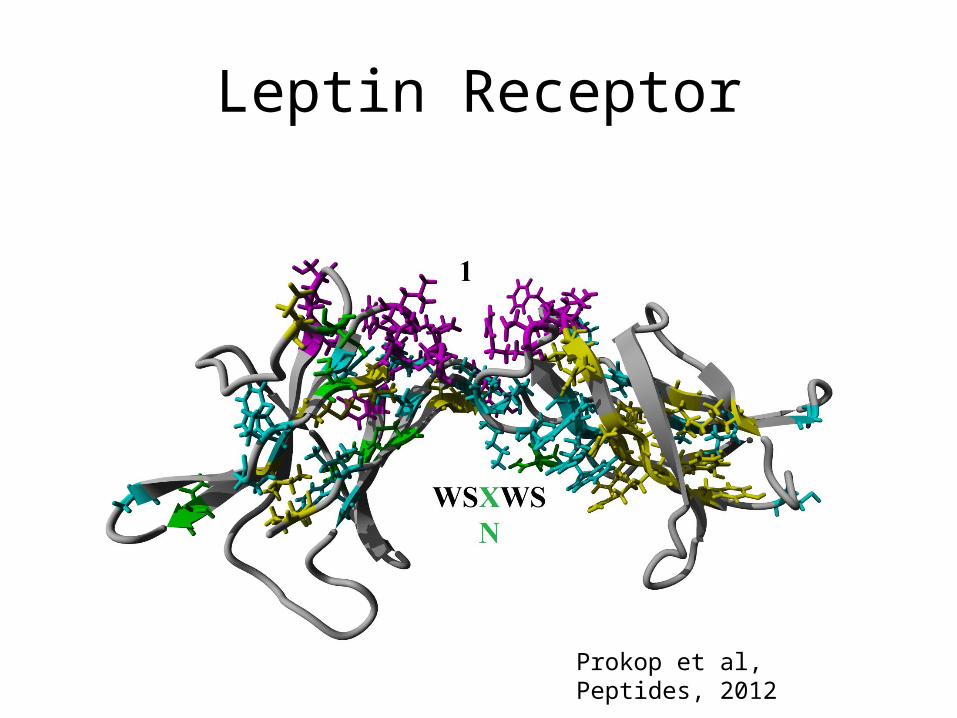
Leptin Receptor
Prokop et al, Peptides, 2012
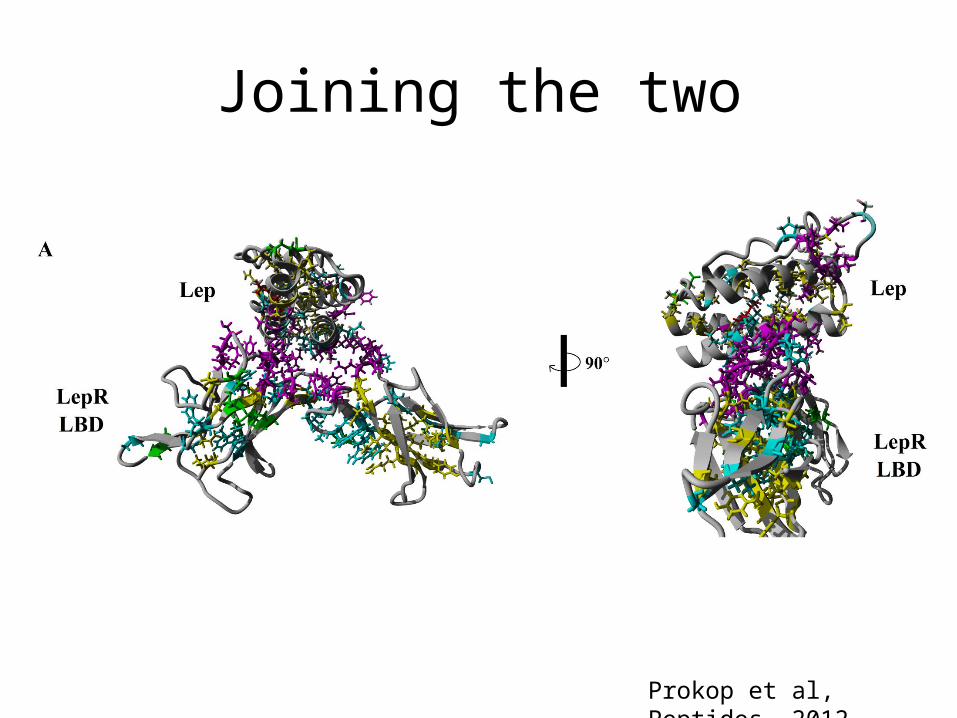
Joining the two
Prokop et al, Peptides, 2012
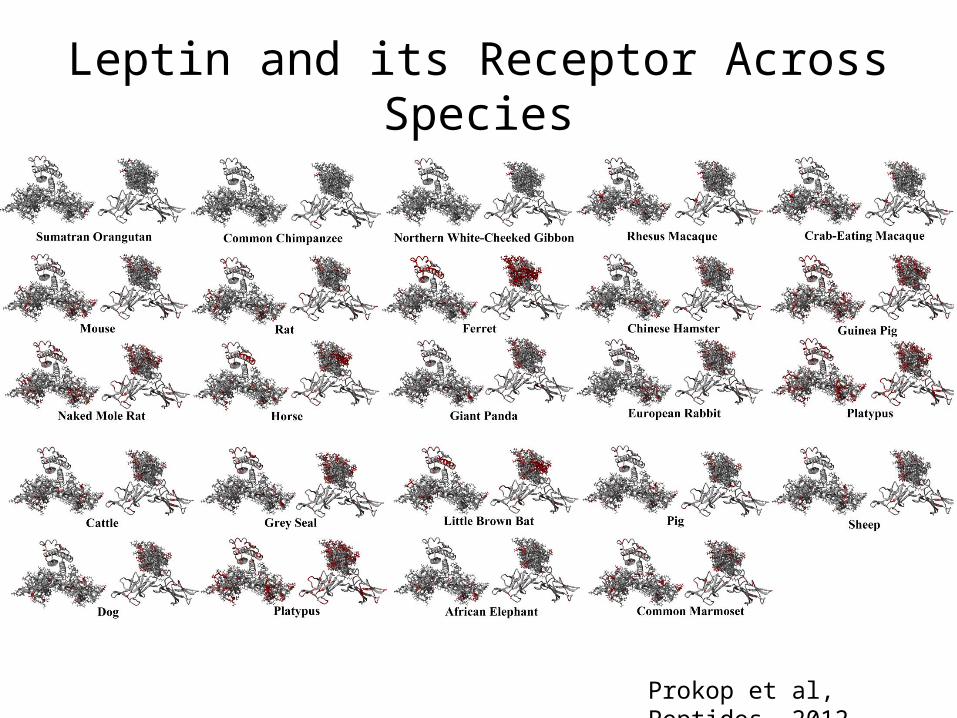
Leptin and its Receptor Across Species
Prokop et al, Peptides, 2012
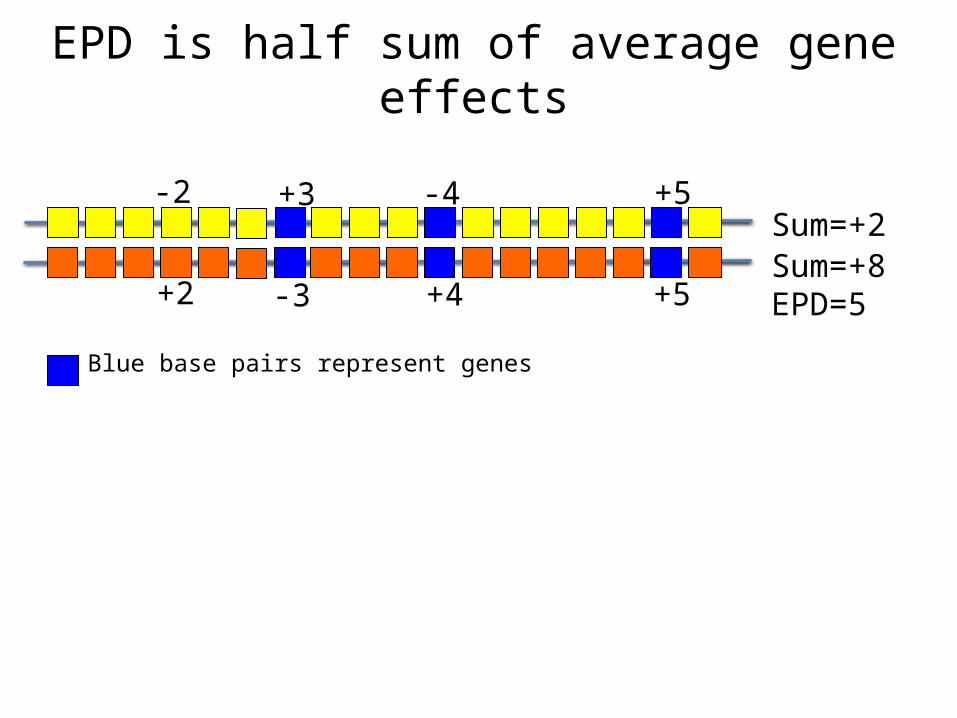
EPD is half sum of average gene effects
Blue base pairs represent genes
+3
-3
-4
+4
+5
+5
Sum=+2Sum=+8EPD=5
-2
+2
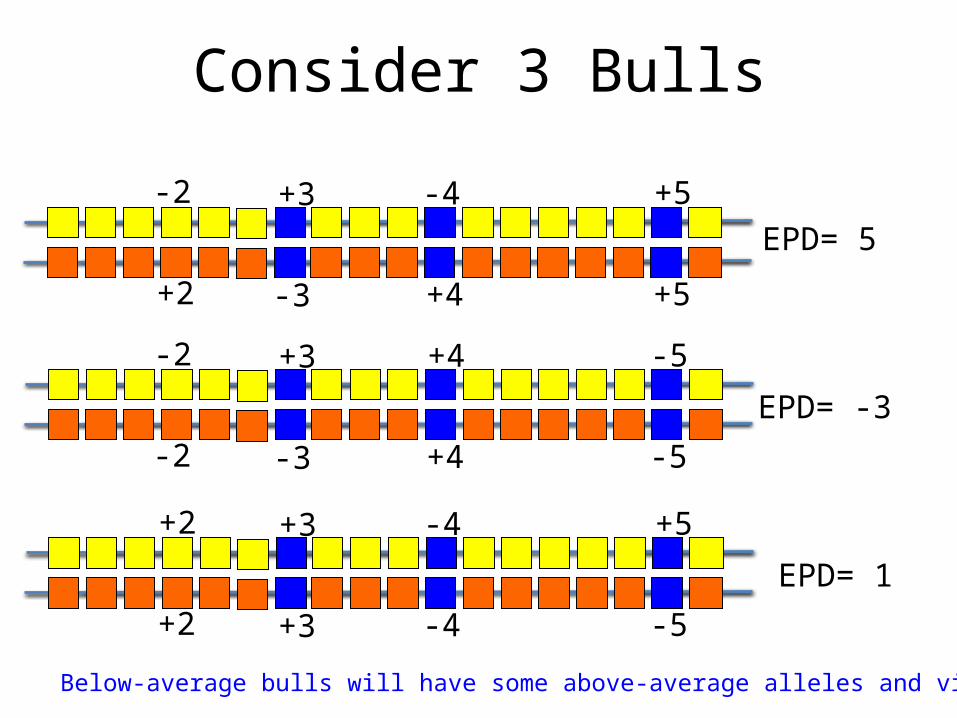
Consider 3 Bulls
+3
-3
-4
+4
+5
+5
-2
+2
+3
-3
+4
+4
-5
-5
-2
-2
+3
+3
-4
-4
+5
-5
+2
+2
EPD= 5
EPD= -3
EPD= 1
Below-average bulls will have some above-average alleles and vice versa!
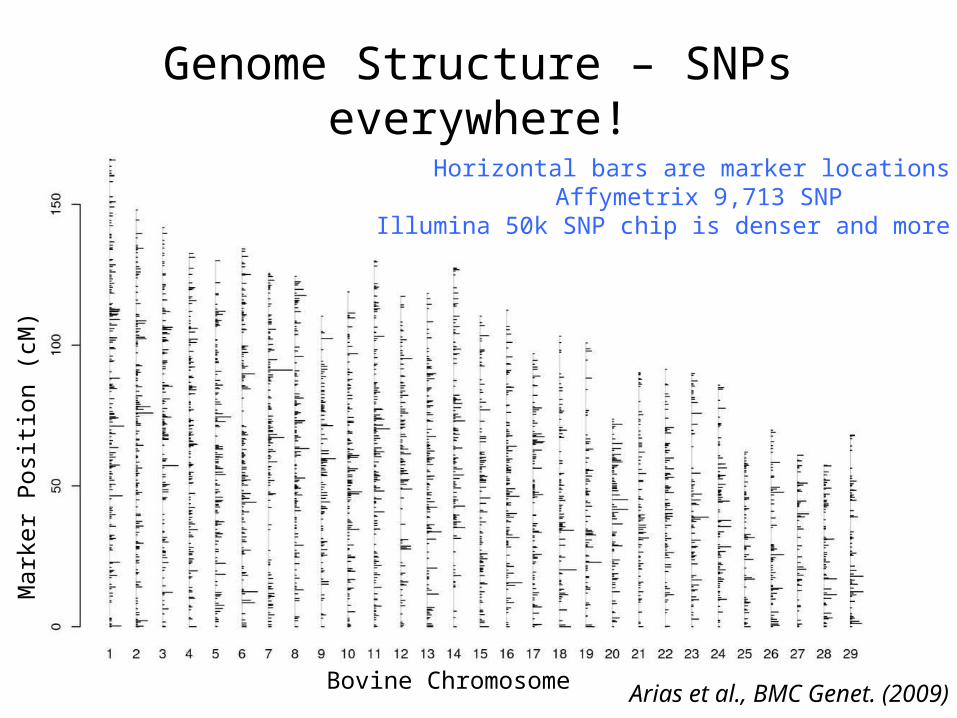
Genome Structure – SNPs everywhere!
Arias et al., BMC Genet. (2009)Bovine Chromosome
Mar
ker P
ositi
on (c
M)
Horizontal bars are marker locations Affymetrix 9,713 SNP
Illumina 50k SNP chip is denser and more even
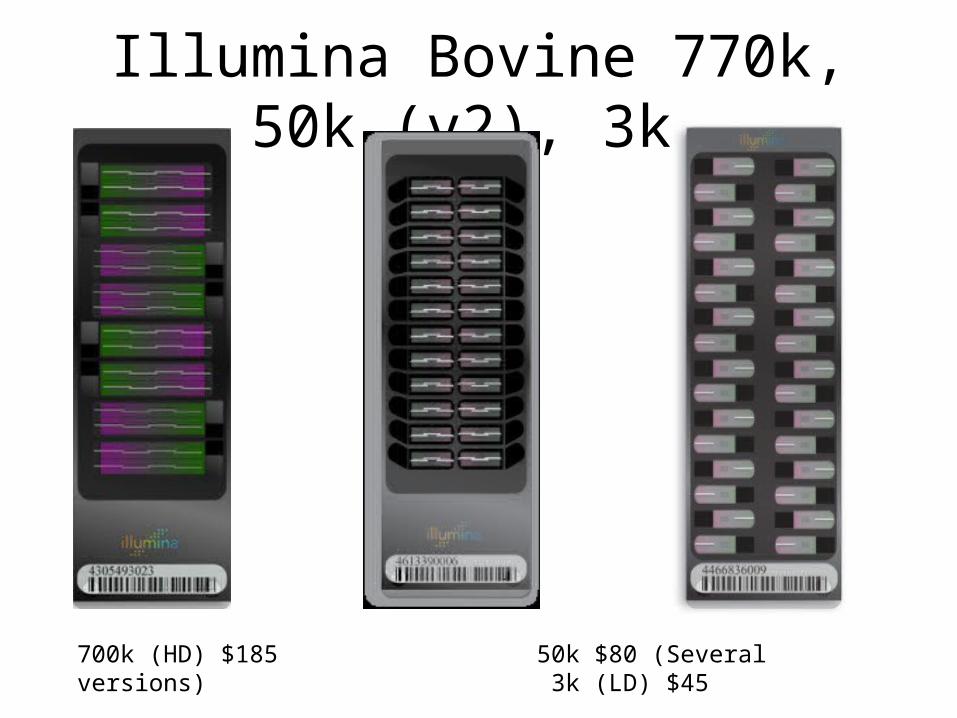
Illumina Bovine 770k, 50k (v2), 3k
700k (HD) $185 50k $80 (Several versions) 3k (LD) $45
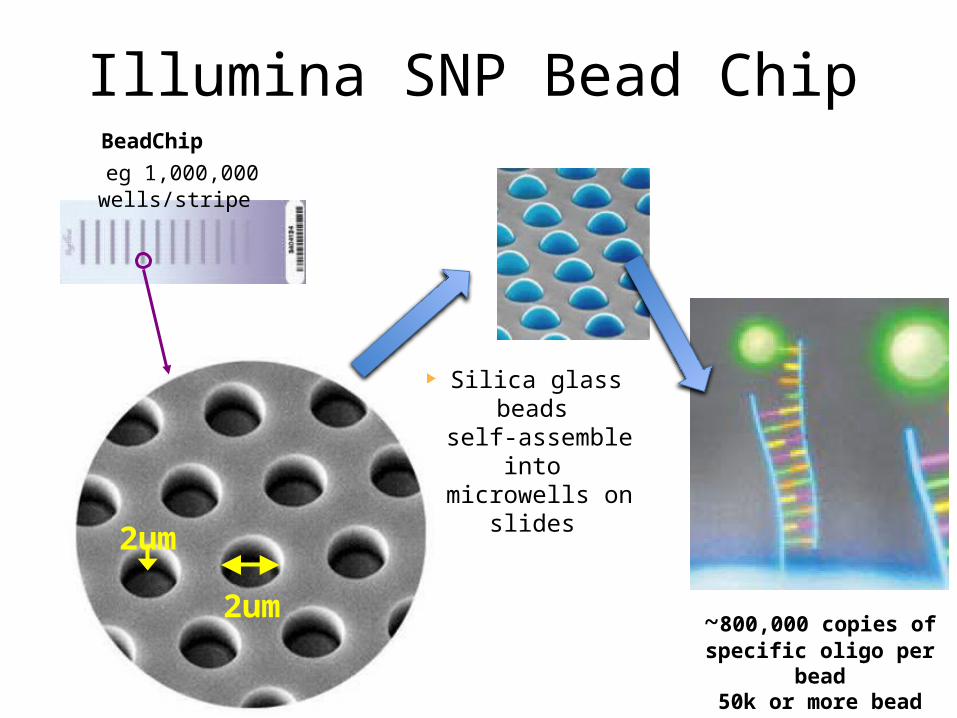
~800,000 copies of specific oligo per bead50k or more bead types
BeadChip eg 1,000,000 wells/stripe
Illumina SNP Bead Chip
2um
2um
Silica glass beads self-assemble into
microwells on slides
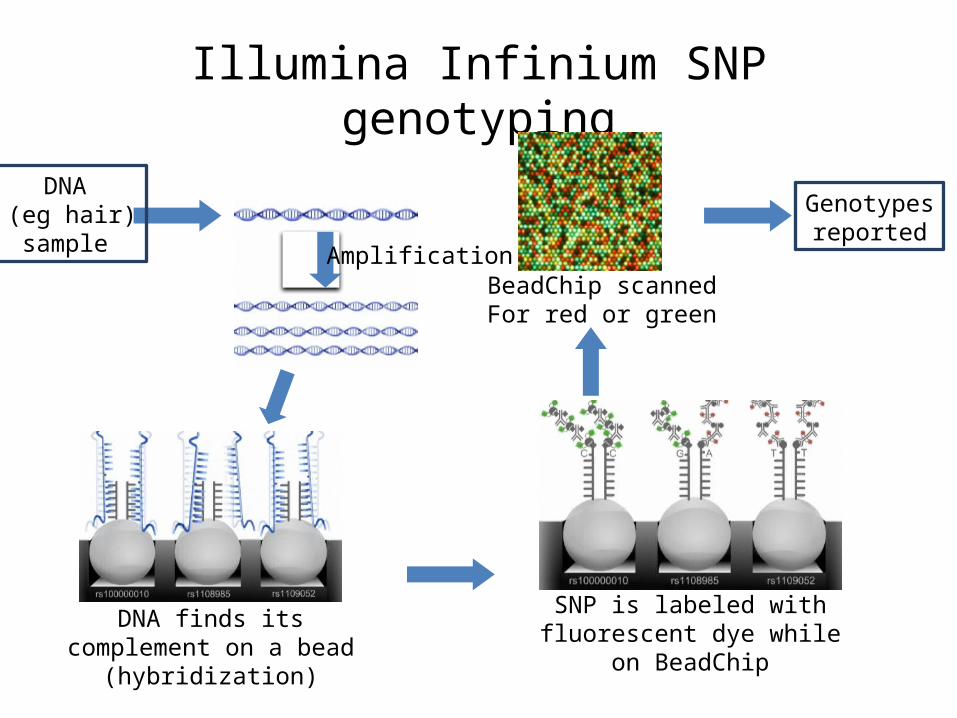
Illumina Infinium SNP genotyping
SNP is labeled with fluorescent dye while on BeadChip
BeadChip scannedFor red or green
DNA finds its complement on a bead (hybridization)
Genotypesreported
Amplification
DNA (eg hair)sample
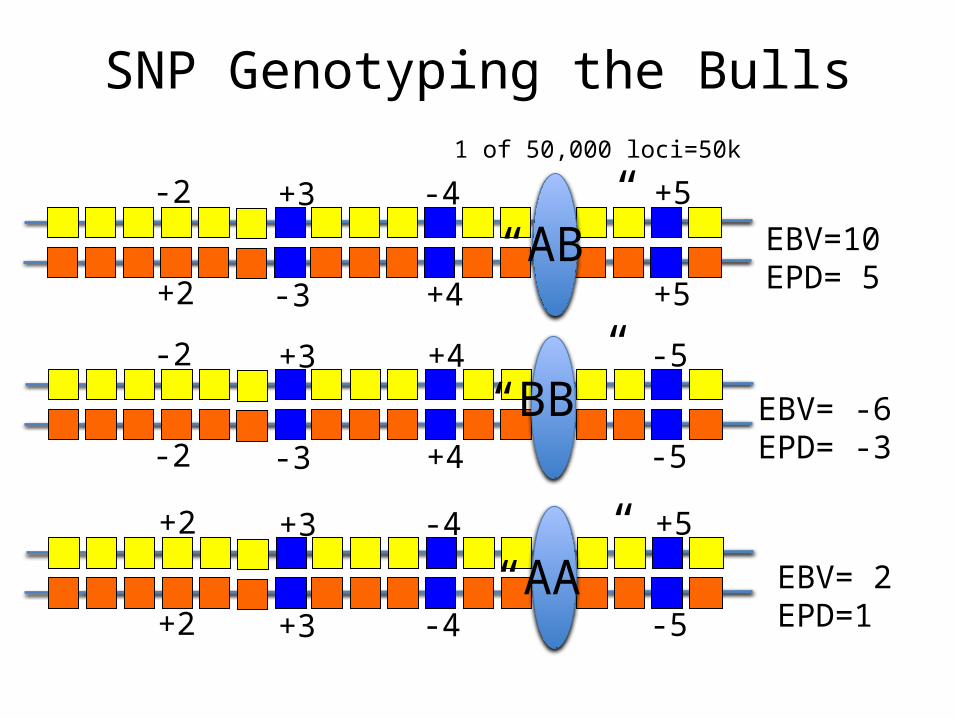
SNP Genotyping the Bulls
+3
-3
-4
+4
+5
+5
-2
+2
+3
-3
+4
+4
-5
-5
-2
-2
+3
+3
-4
-4
+5
-5
+2
+2
EBV=10EPD= 5
EBV= -6EPD= -3
EBV= 2EPD=1
“AB”
“BB”
“AA”
1 of 50,000 loci=50k
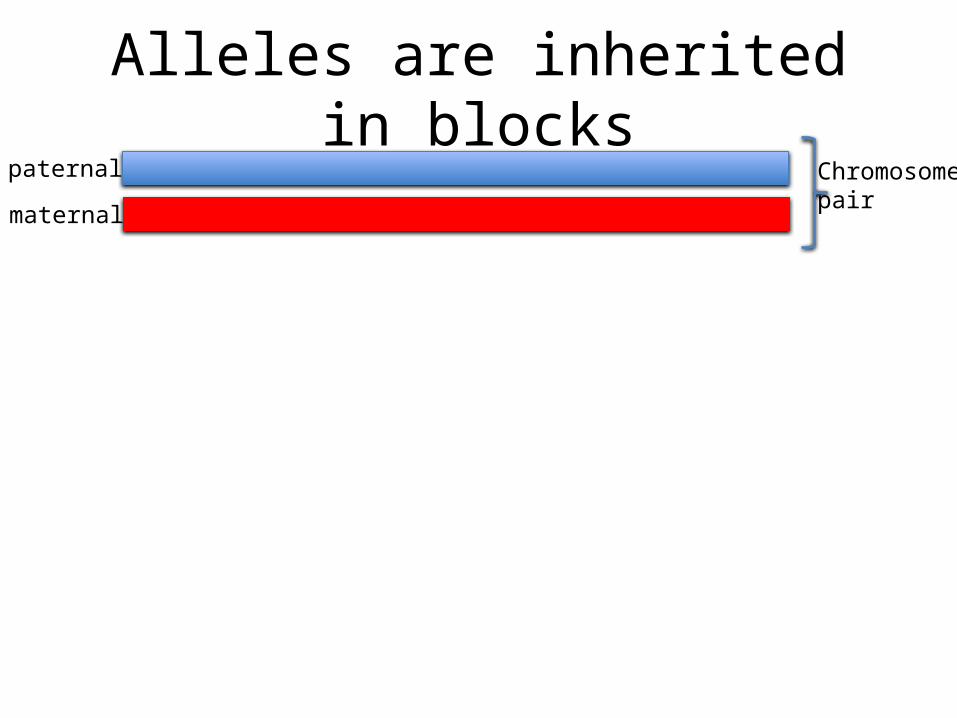
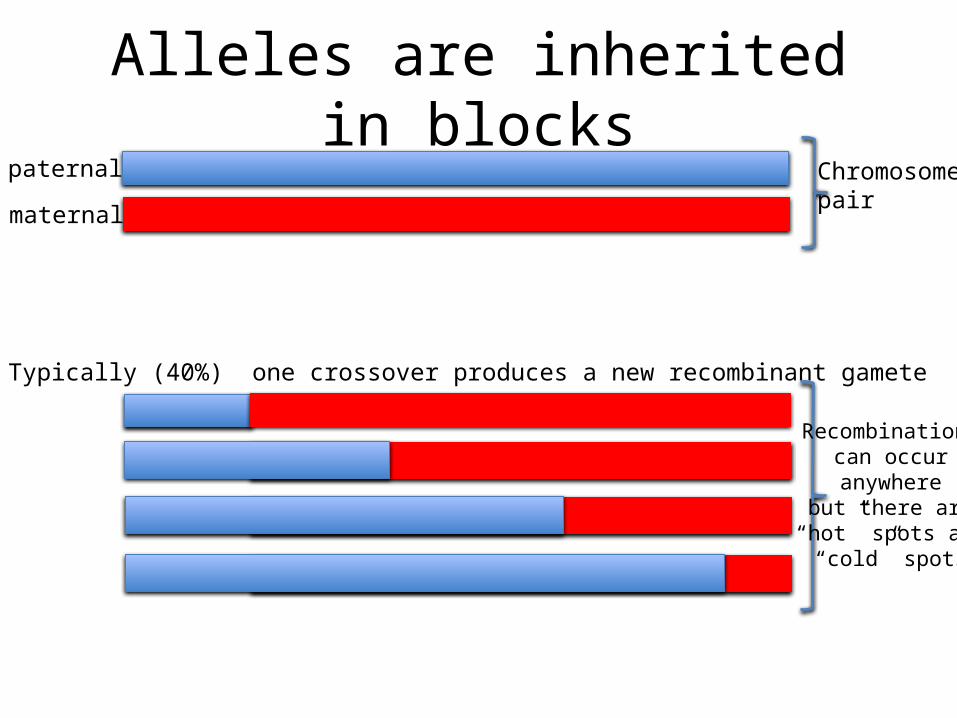
Alleles are inherited in blockspaternal
maternal
Chromosomepair
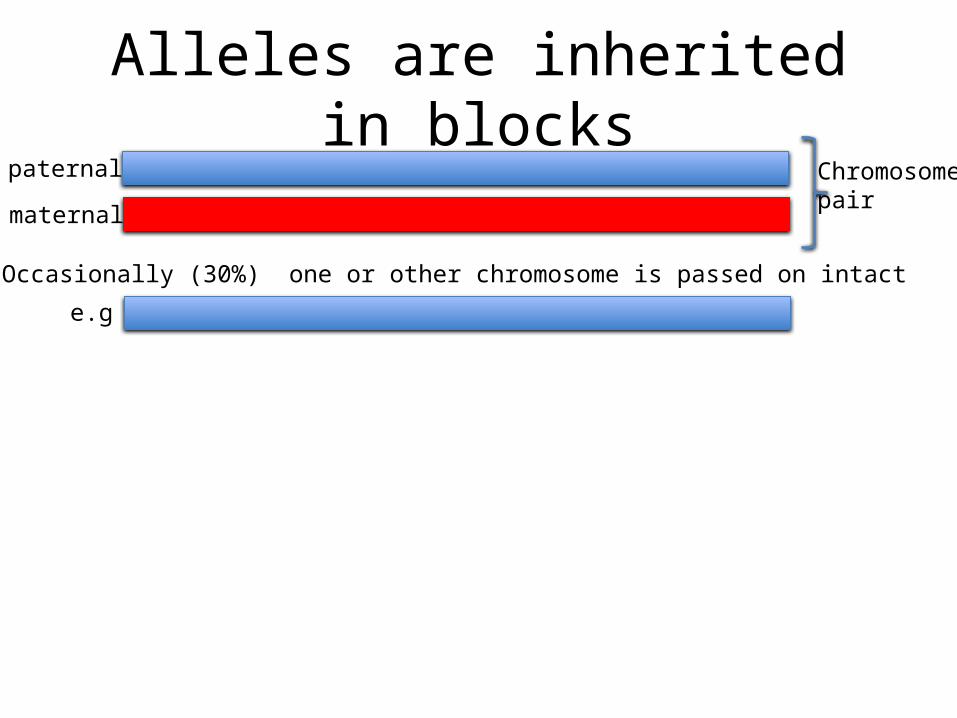
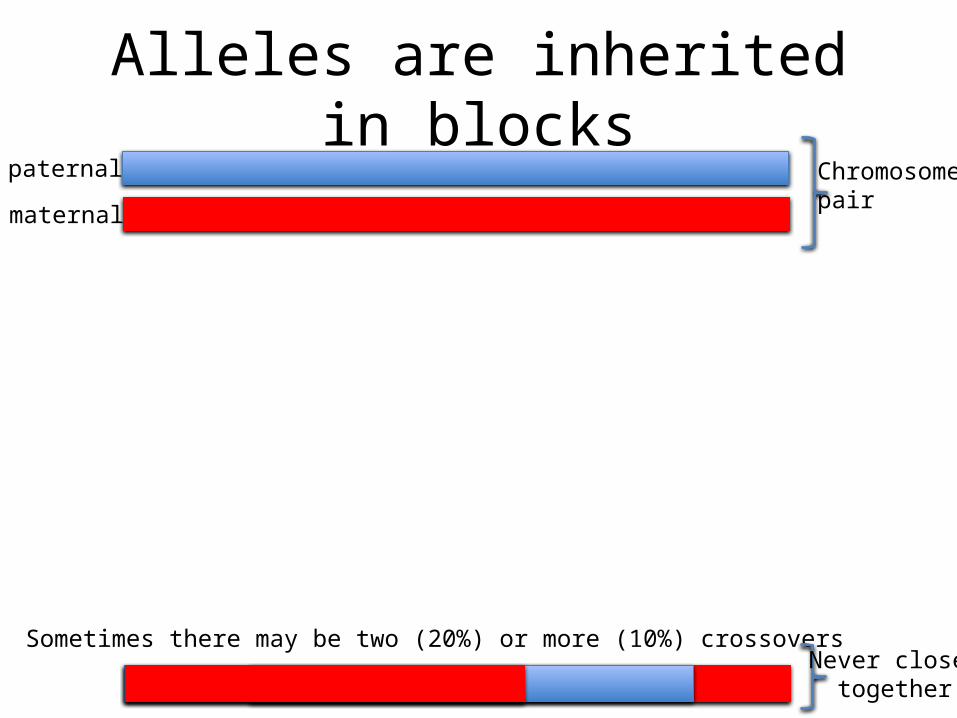
Alleles are inherited in blockspaternal
maternal
Chromosomepair
Occasionally (30%) one or other chromosome is passed on intact
e.g
Alleles are inherited in blockspaternal
maternal
Chromosomepair
Typically (40%) one crossover produces a new recombinant gamete
Recombination can occur anywhere
but there are “hot” spots and
“cold” spots
Alleles are inherited in blockspaternal
maternal
Chromosomepair
Sometimes there may be two (20%) or more (10%) crossoversNever close
together
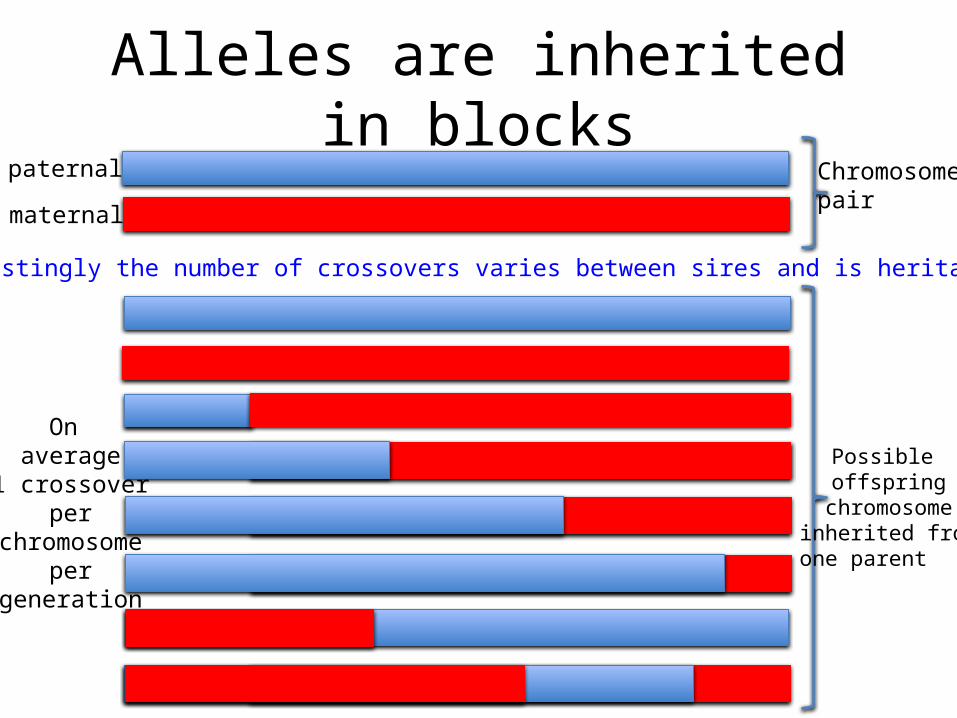
Alleles are inherited in blockspaternal
maternal
Chromosomepair
Possible offspring
chromosome inherited from one parent
Interestingly the number of crossovers varies between sires and is heritable
On average
1 crossover per
chromosome per
generation
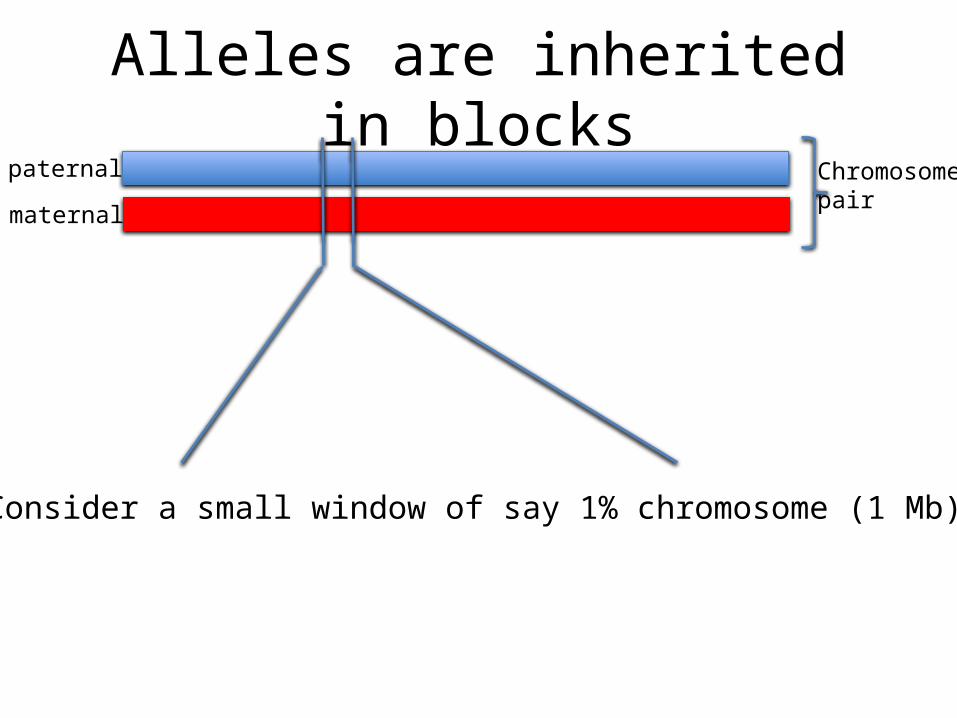
Alleles are inherited in blockspaternal
maternal
Chromosomepair
Consider a small window of say 1% chromosome (1 Mb)

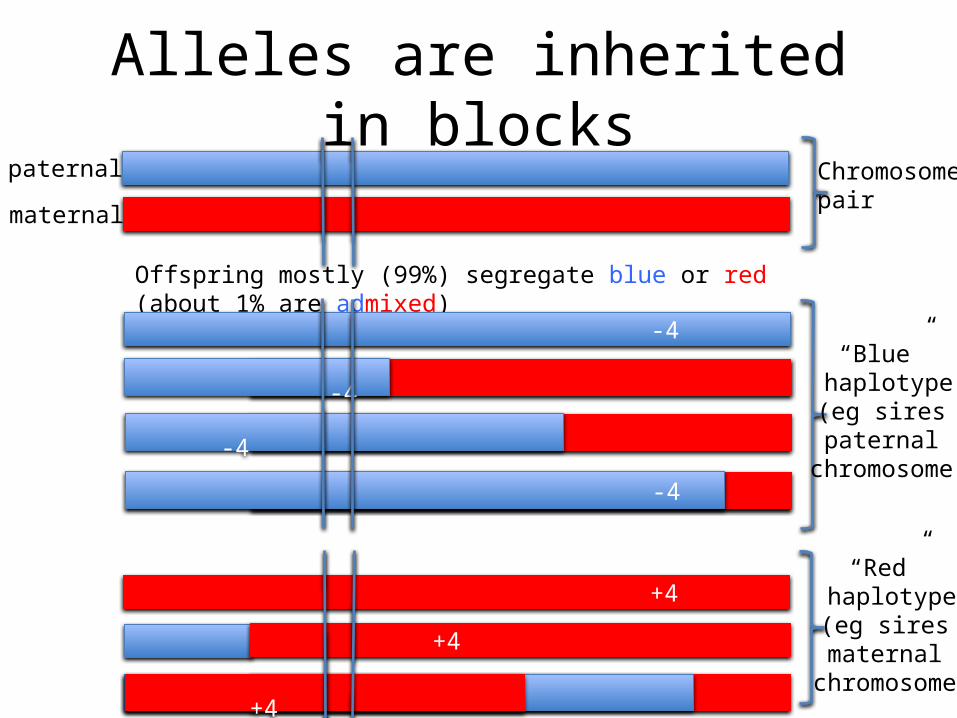
Alleles are inherited in blockspaternal
maternal
Chromosomepair
Offspring mostly (99%) segregate blue or red (about 1% are admixed)
“Blue” haplotype
(eg sires paternal
chromosome)
“Red” haplotype
(eg sires maternal
chromosome)
Alleles are inherited in blockspaternal
maternal
Chromosomepair
Offspring mostly (99%) segregate blue or red (about 1% are admixed)
-4
-4
-4
-4
“Blue” haplotype
(eg sires paternal
chromosome)
“Red” haplotype
(eg sires maternal
chromosome)
+4
+4
+4
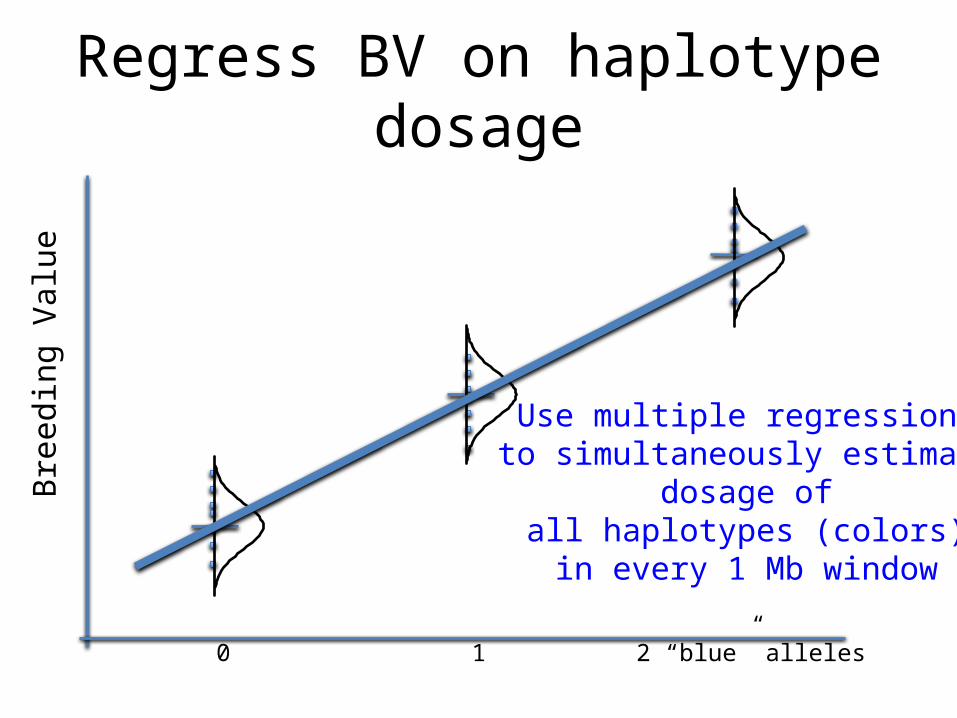
Regress BV on haplotype dosage
0 1 2 “blue” alleles
Bree
ding
Val
ue
Use multiple regression to simultaneously estimate
dosage of all haplotypes (colors) in every 1 Mb window
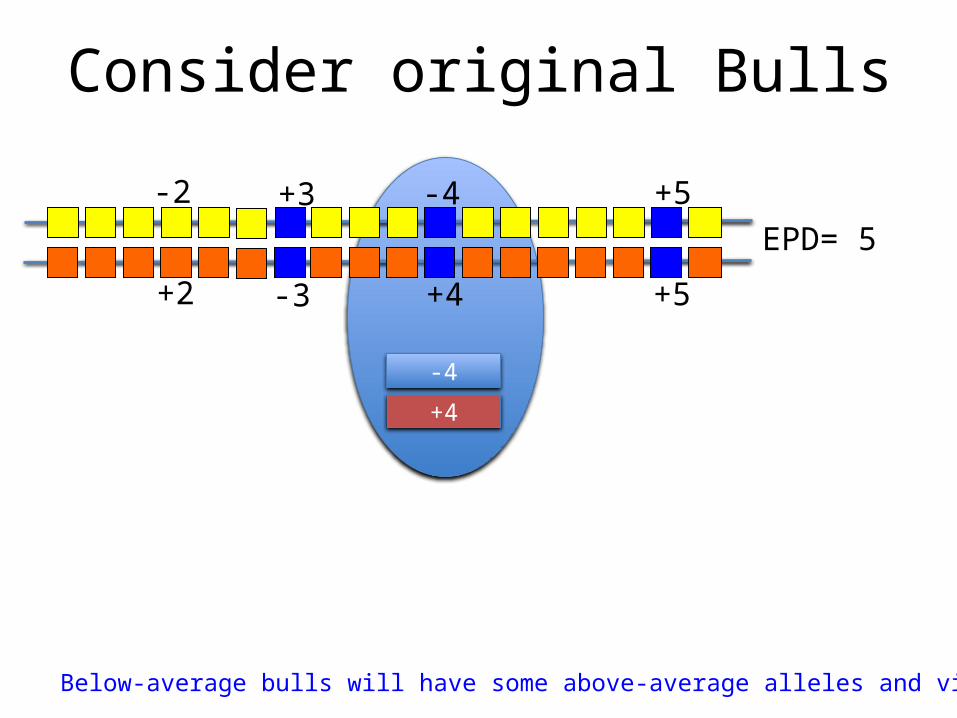
Consider original Bulls
+3
-3
-4
+4
+5
+5
-2
+2
EPD= 5
Below-average bulls will have some above-average alleles and vice versa!
-4
+4
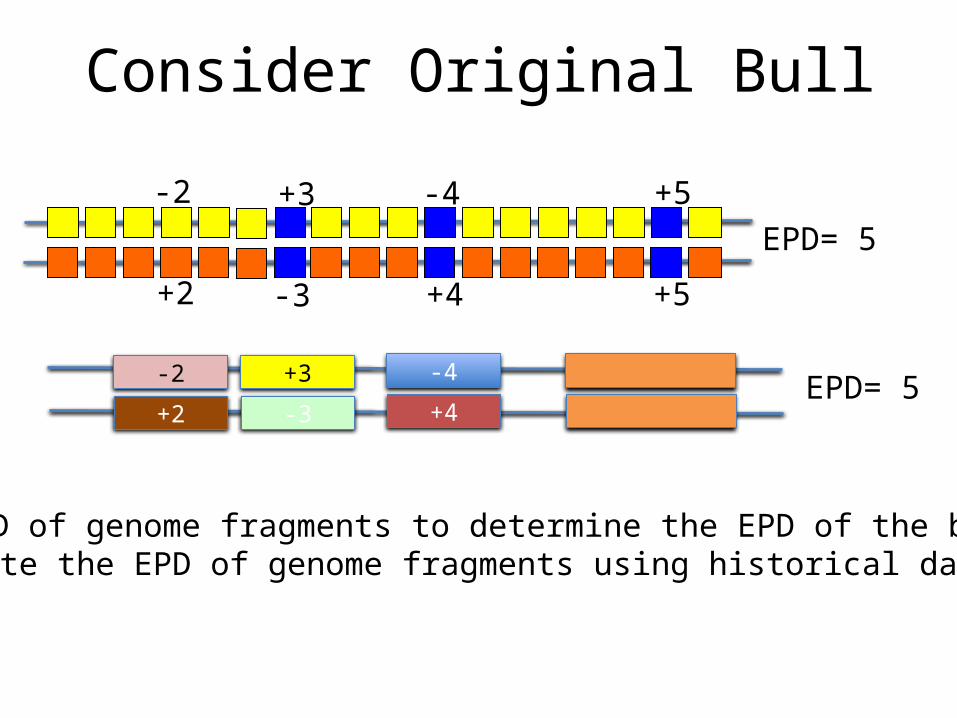
Consider Original Bull
+3
-3
-4
+4
+5
+5
-2
+2
EPD= 5
-4
+4
+5
+5
+3
-3
-2
+2EPD= 5
Use EPD of genome fragments to determine the EPD of the bullEstimate the EPD of genome fragments using historical data
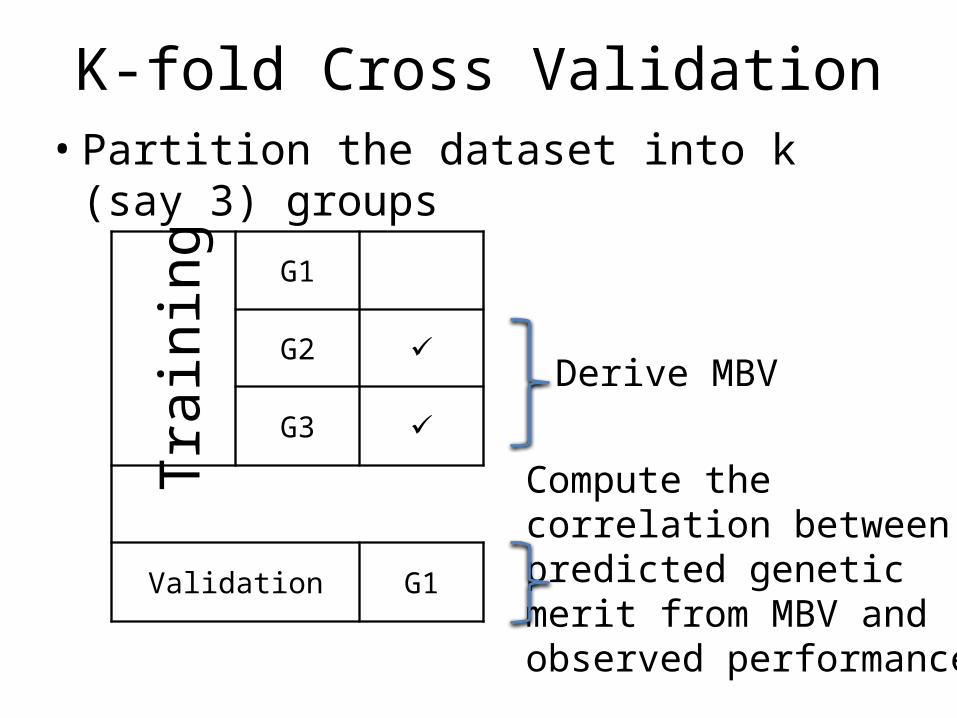
K-fold Cross Validation• Partition the dataset into k (say 3) groups
G1
G2 ✓
G3 ✓
Validation G1
Trai
ning
Compute the correlation between predicted genetic merit from MBV and observed performance
Derive MBV
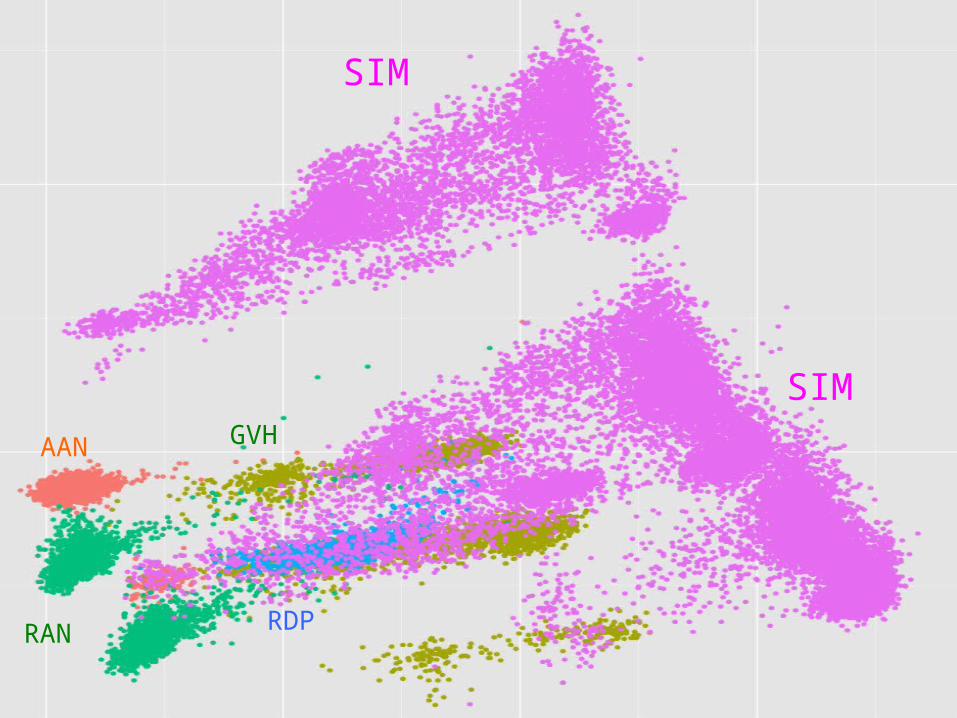
AAN GVH
RAN RDP
SIM
SIM
AAN GVH
RANRDP
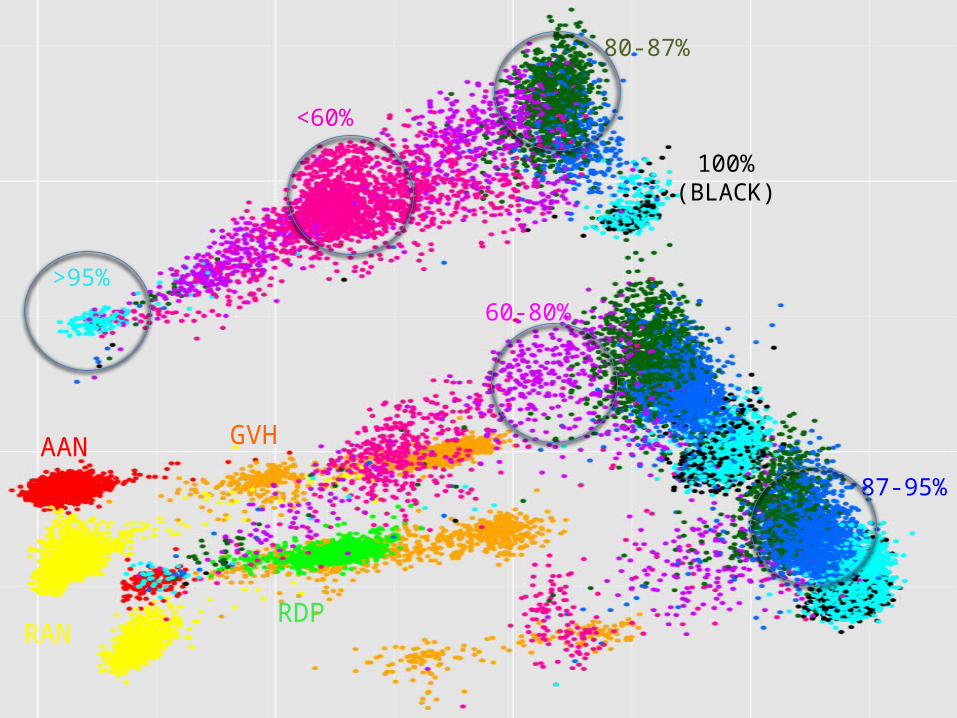
<60%
60-80%
80-87%
87-95%
>95%
100%(BLACK)
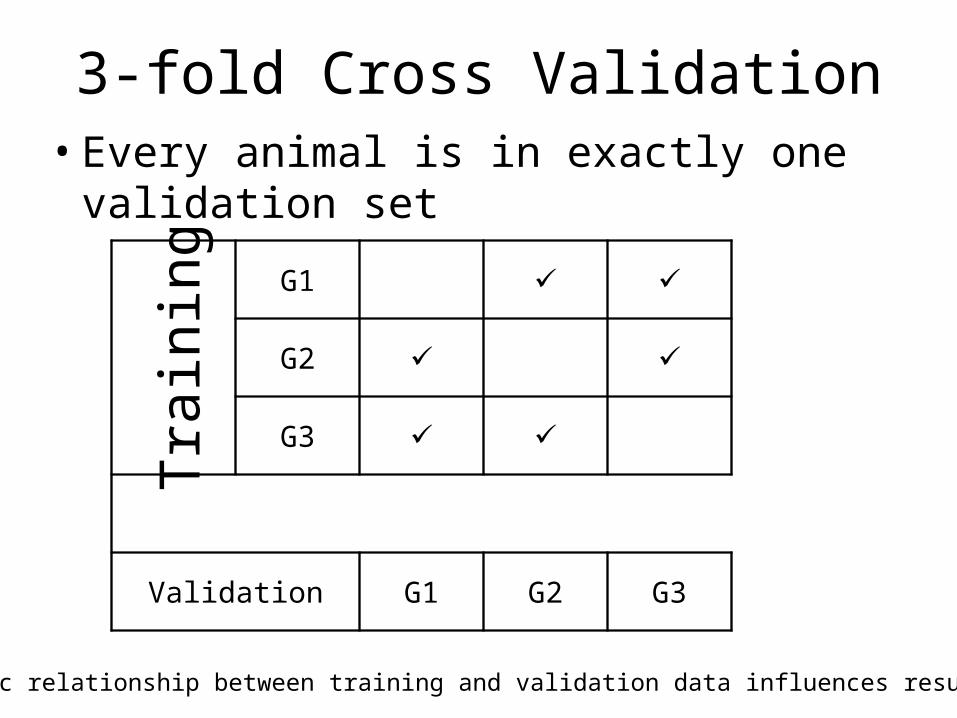
3-fold Cross Validation• Every animal is in exactly one validation set
G1 ✓ ✓
G2 ✓ ✓
G3 ✓ ✓
Validation G1 G2 G3
Trai
ning
Genetic relationship between training and validation data influences results!
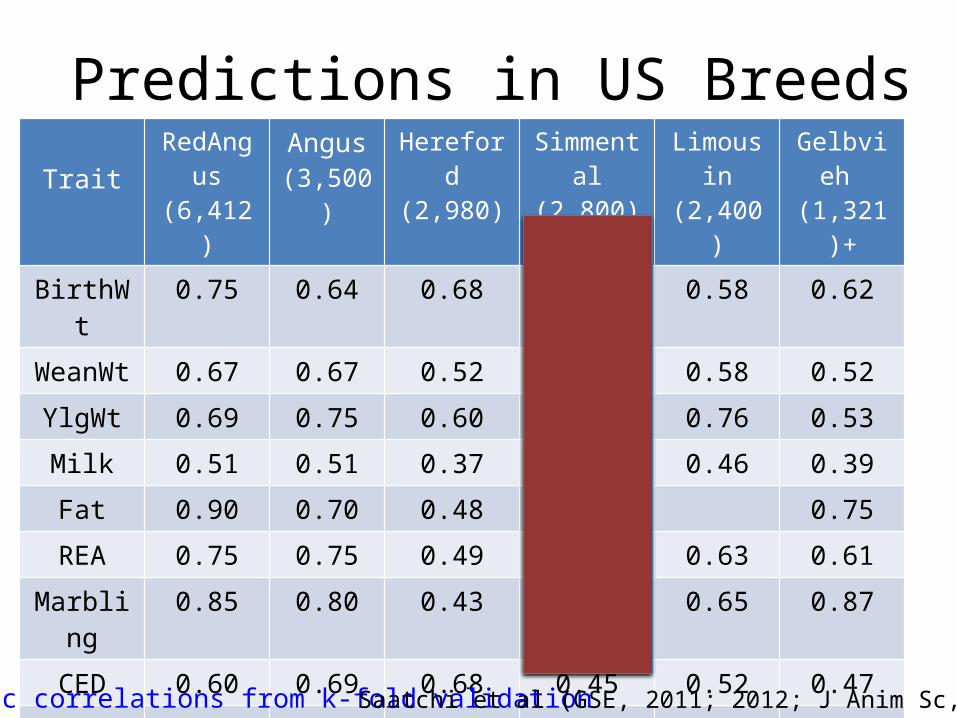
Predictions in US BreedsTrait
RedAngus (6,412)
Angus(3,500)
Hereford(2,980)
Simmental(2,800)
Limousin(2,400)
Gelbvieh (1,321)+
BirthWt 0.75 0.64 0.68 0.65 0.58 0.62
WeanWt 0.67 0.67 0.52 0.52 0.58 0.52
YlgWt 0.69 0.75 0.60 0.45 0.76 0.53
Milk 0.51 0.51 0.37 0.34 0.46 0.39
Fat 0.90 0.70 0.48 0.29 0.75
REA 0.75 0.75 0.49 0.59 0.63 0.61
Marbling 0.85 0.80 0.43 0.63 0.65 0.87
CED 0.60 0.69 0.68 0.45 0.52 0.47
CEM 0.32 0.73 0.51 0.32 0.51 0.62
SC 0.71 0.43 0.45
Average 0.67 0.69 0.52 0.47 0.57 0.56
Genetic correlations from k-fold validation Saatchi et al (GSE, 2011; 2012; J Anim Sc, 2013)
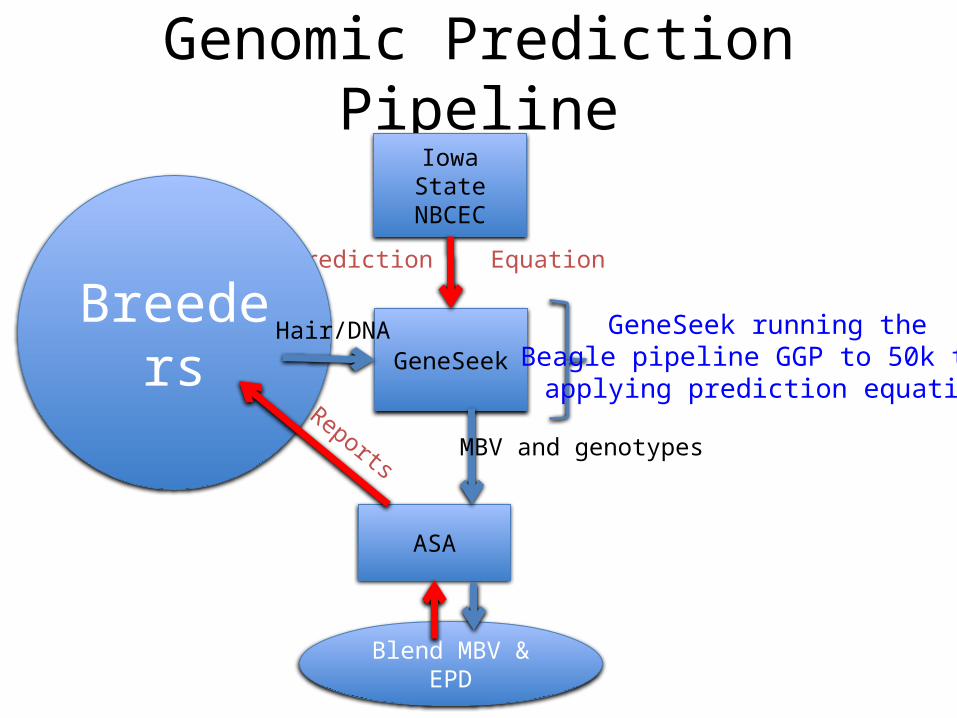
Genomic Prediction Pipeline
GeneSeek
Iowa StateNBCEC
ASA
Prediction Equation
Breeders Hair/DNA
MBV and genotypes
Blend MBV & EPD
Reports
GeneSeek running theBeagle pipeline GGP to 50k then
applying prediction equation
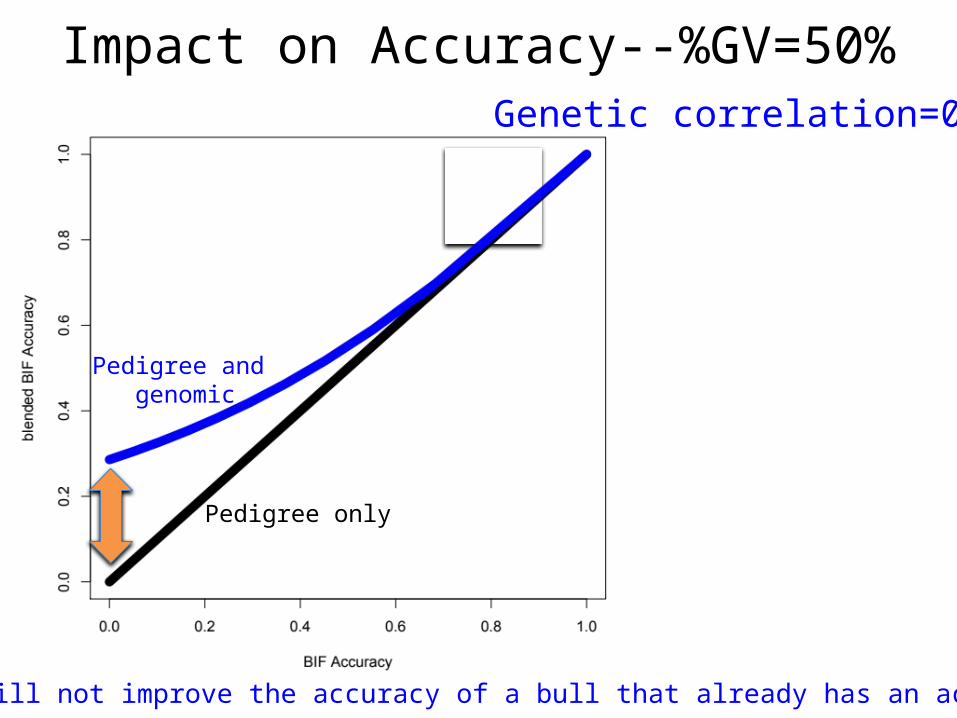
Impact on Accuracy--%GV=50%Genetic correlation=0.7
Genomics will not improve the accuracy of a bull that already has an accurate EPD
Pedigree only
Pedigree and genomic
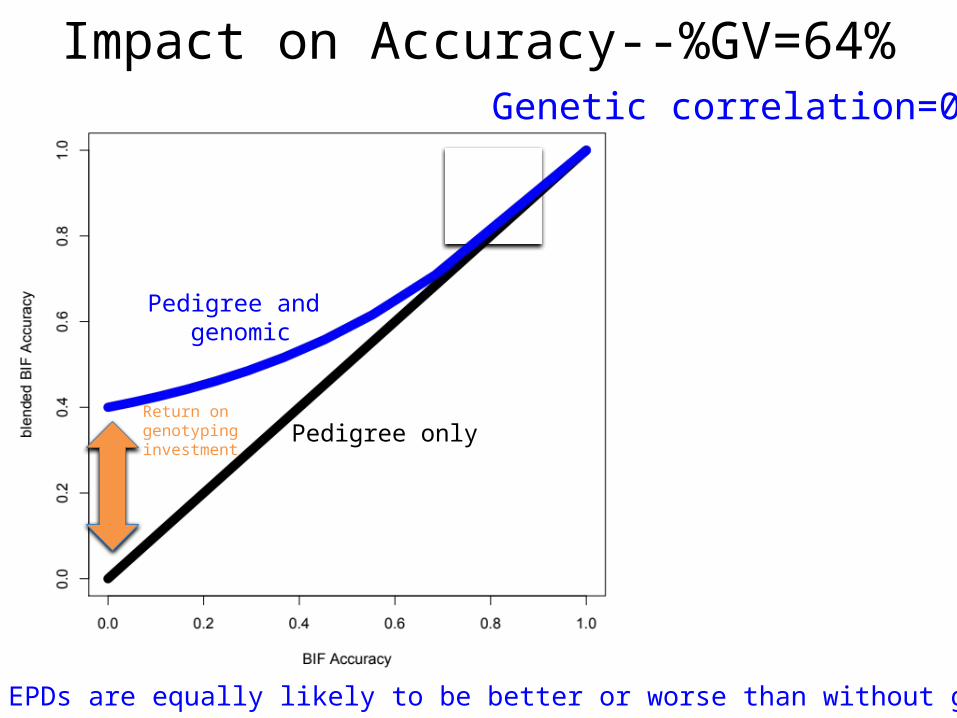
Impact on Accuracy--%GV=64%Genetic correlation=0.8
Genomic EPDs are equally likely to be better or worse than without genomics
Return on genotyping investment
Pedigree only
Pedigree and genomic
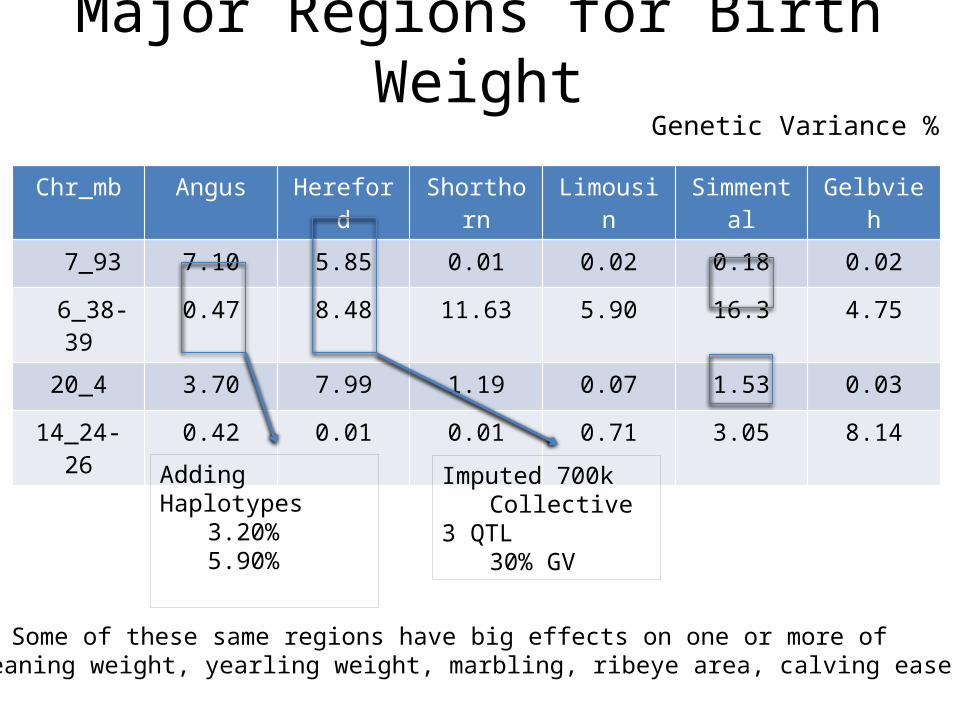
Major Regions for Birth Weight
Chr_mb Angus Hereford Shorthorn Limousin Simmental Gelbvieh
7_93 7.10 5.85 0.01 0.02 0.18 0.02
6_38-39 0.47 8.48 11.63 5.90 16.3 4.75
20_4 3.70 7.99 1.19 0.07 1.53 0.03
14_24-26 0.42 0.01 0.01 0.71 3.05 8.14
Genetic Variance %
Some of these same regions have big effects on one or more of weaning weight, yearling weight, marbling, ribeye area, calving ease
Adding Haplotypes3.20%5.90%
Imputed 700kCollective 3
QTL30% GV
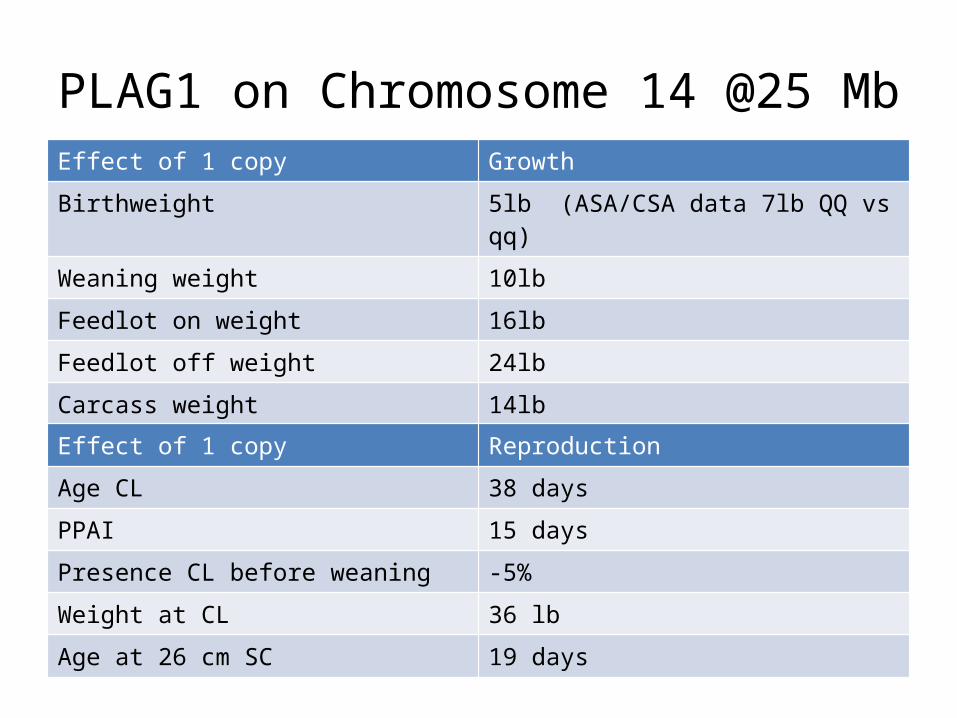
PLAG1 on Chromosome 14 @25 MbEffect of 1 copy Growth
Birthweight 5lb (ASA/CSA data 7lb QQ vs qq)
Weaning weight 10lb
Feedlot on weight 16lb
Feedlot off weight 24lb
Carcass weight 14lb
Effect of 1 copy Reproduction
Age CL 38 days
PPAI 15 days
Presence CL before weaning -5%
Weight at CL 36 lb
Age at 26 cm SC 19 days
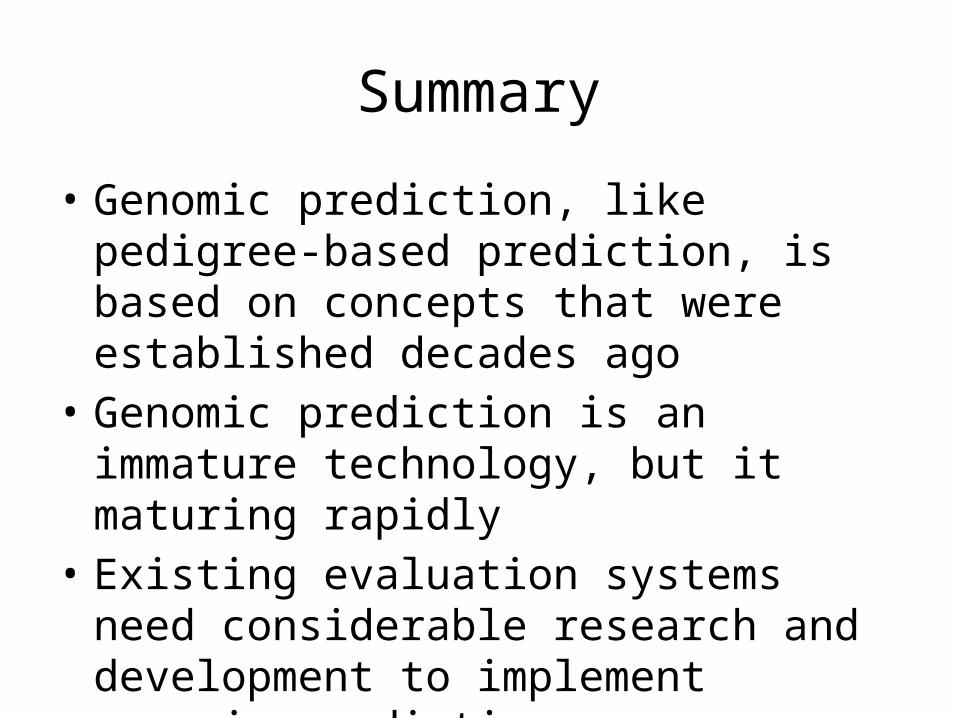
Summary
• Genomic prediction, like pedigree-based prediction, is based on concepts that were established decades ago
• Genomic prediction is an immature technology, but it maturing rapidly
• Existing evaluation systems need considerable research and development to implement genomic prediction
The Future of Genomic Prediction:A Quantum Leap
Including Genomics
• The calculations to obtain EPDs are quire different when genomic information is included along with pedigree information for non genotyped relatives
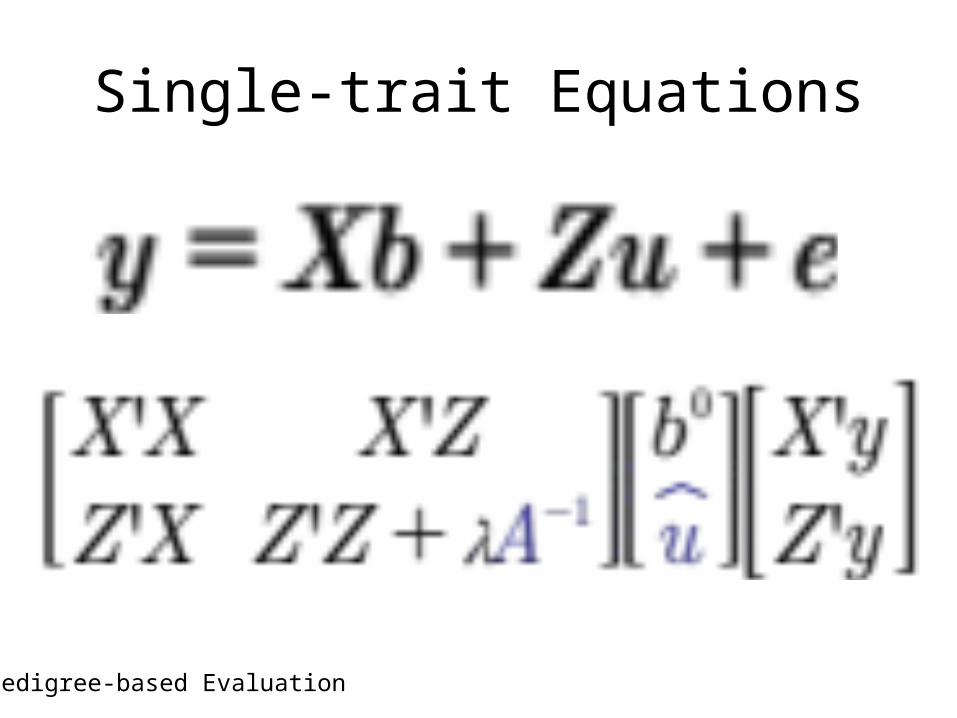
Single-trait Equations
Pedigree-based Evaluation
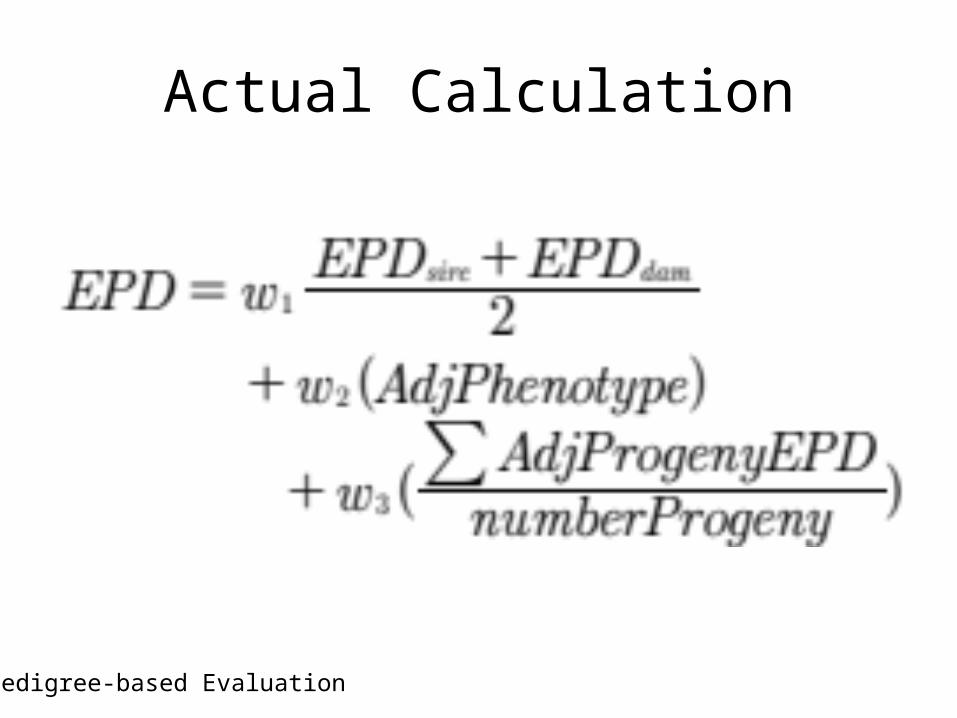
Actual Calculation
Pedigree-based Evaluation
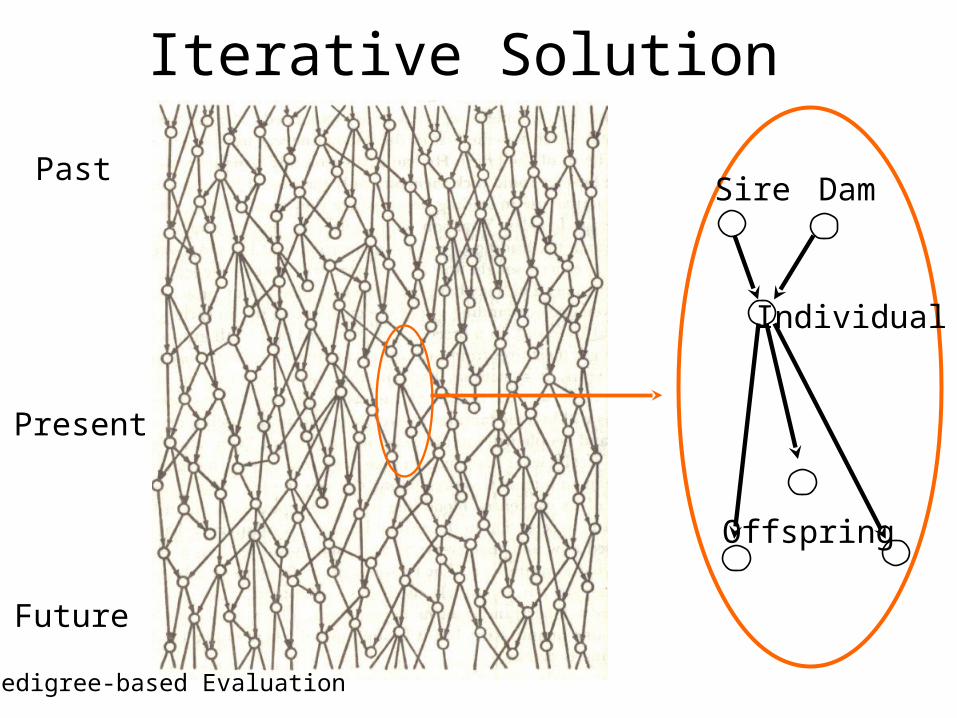
Iterative Solution
Past
Present
Future
Sire Dam
Individual
Offspring
Pedigree-based Evaluation
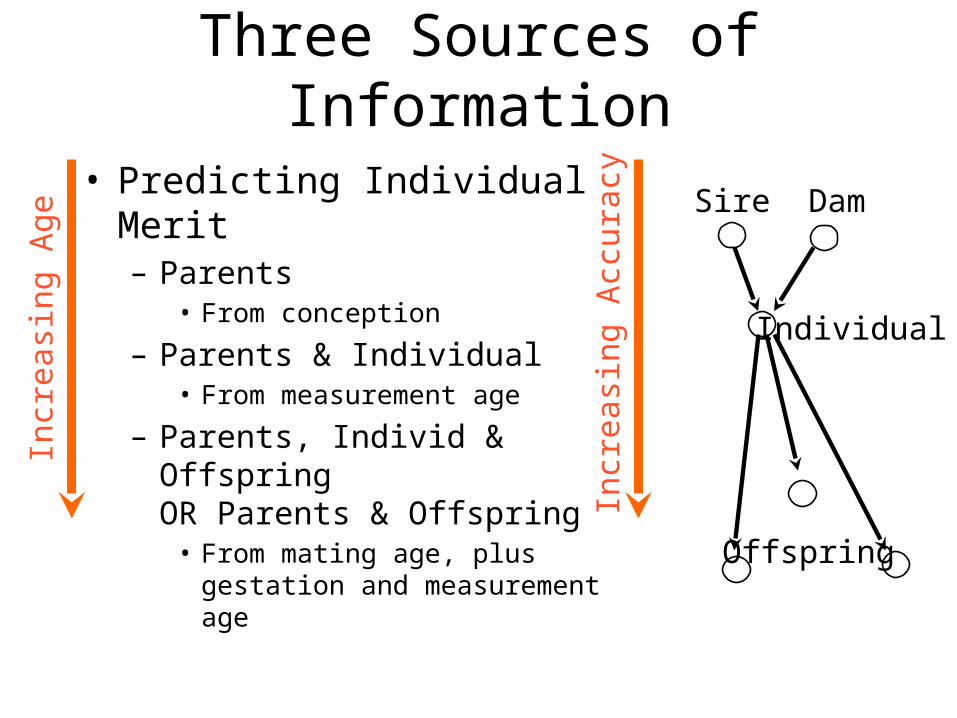
Three Sources of Information
Sire Dam
Individual
Offspring
• Predicting Individual Merit– Parents
• From conception
– Parents & Individual• From measurement age
– Parents, Individ & OffspringOR Parents & Offspring
• From mating age, plus gestation and measurement age
Incr
easi
ng A
ge
Incr
easi
ng A
ccur
acy
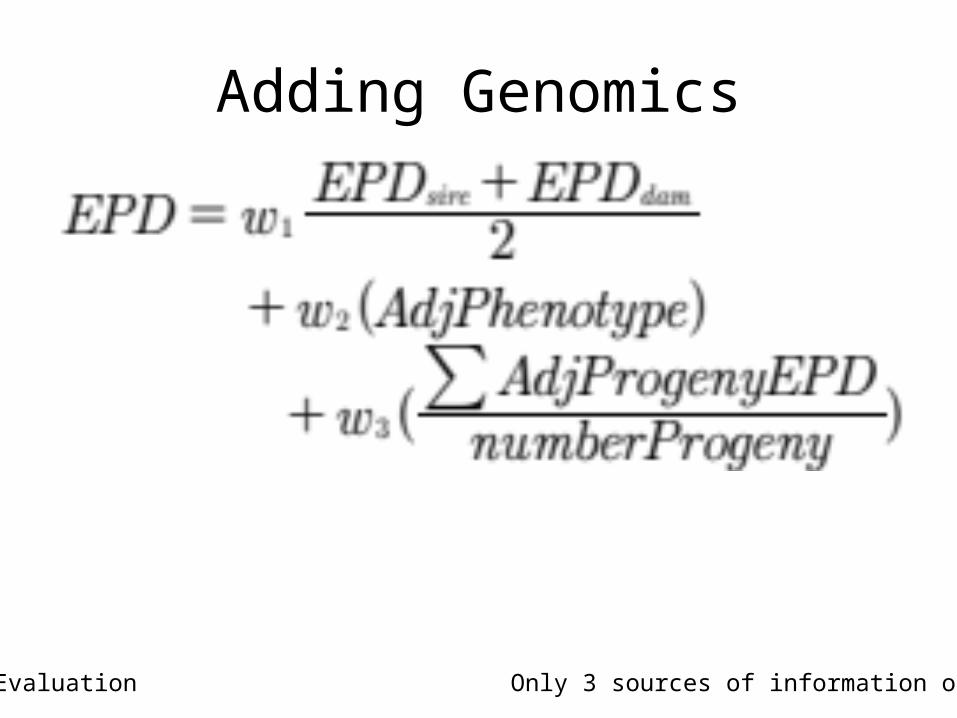
Adding Genomics
Pedigree-based Evaluation Only 3 sources of information on each animal
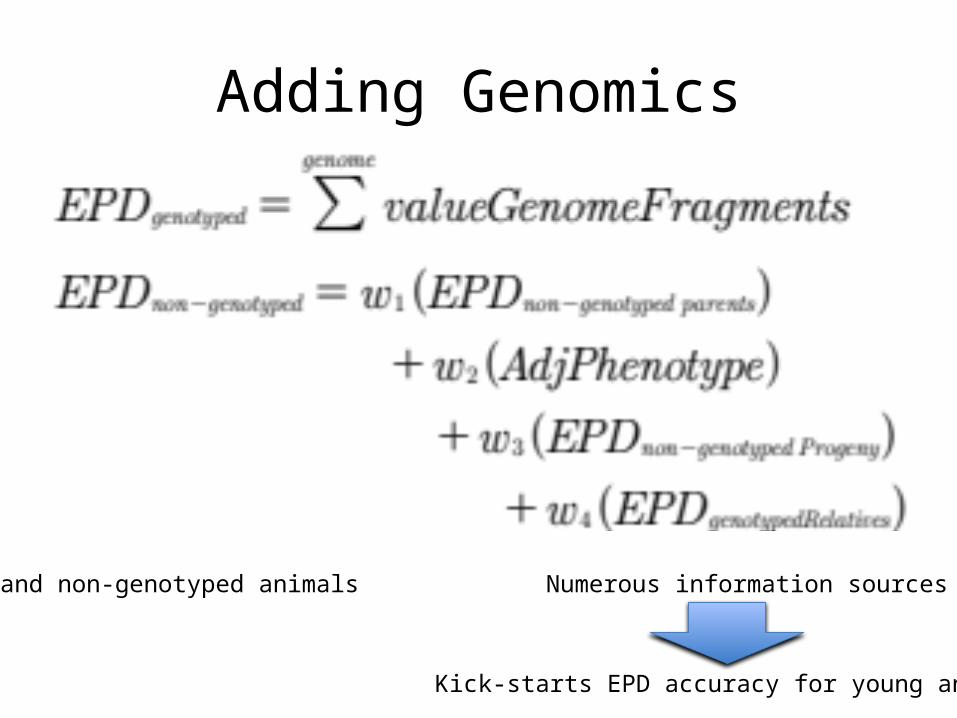
Adding Genomics
Genotyped and non-genotyped animals Numerous information sources per animal
Kick-starts EPD accuracy for young animals
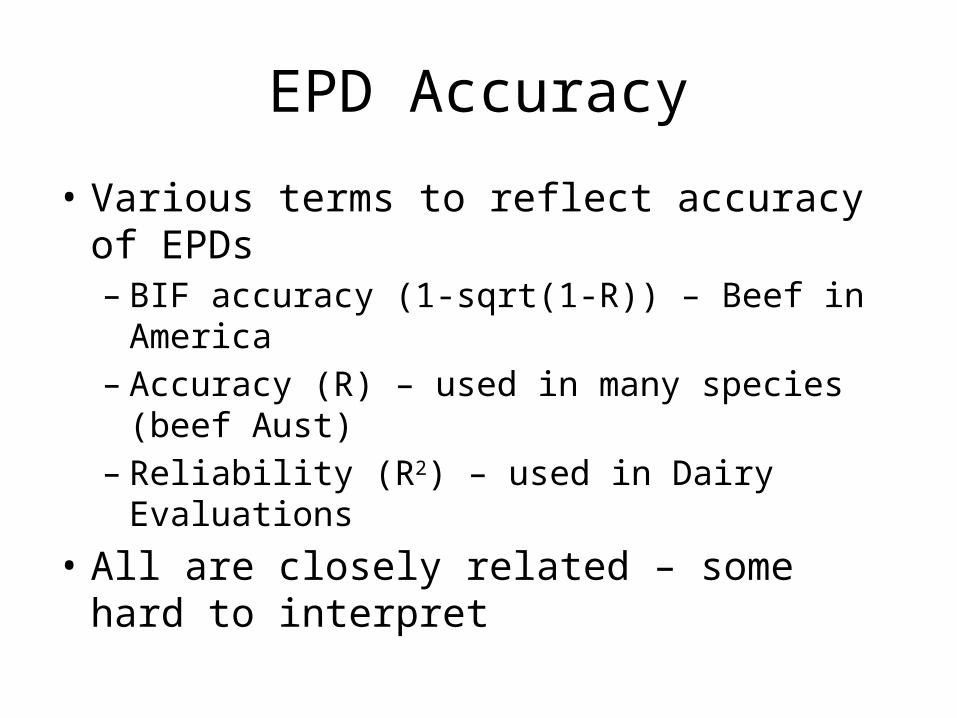
EPD Accuracy
• Various terms to reflect accuracy of EPDs– BIF accuracy (1-sqrt(1-R)) – Beef in America– Accuracy (R) – used in many species (beef Aust)– Reliability (R2) – used in Dairy Evaluations
• All are closely related – some hard to interpret
EPD Accuracy
• Reliability– proportion of variation in true EPD that can be
explained from information used in evaluation• Unreliability = 100-Reliability
– proportion of variation in true EPD that cannot be explained from information used in evaluation
– Reflects the Prediction Error Variance (PEV)
Two Ways to obtain PEV
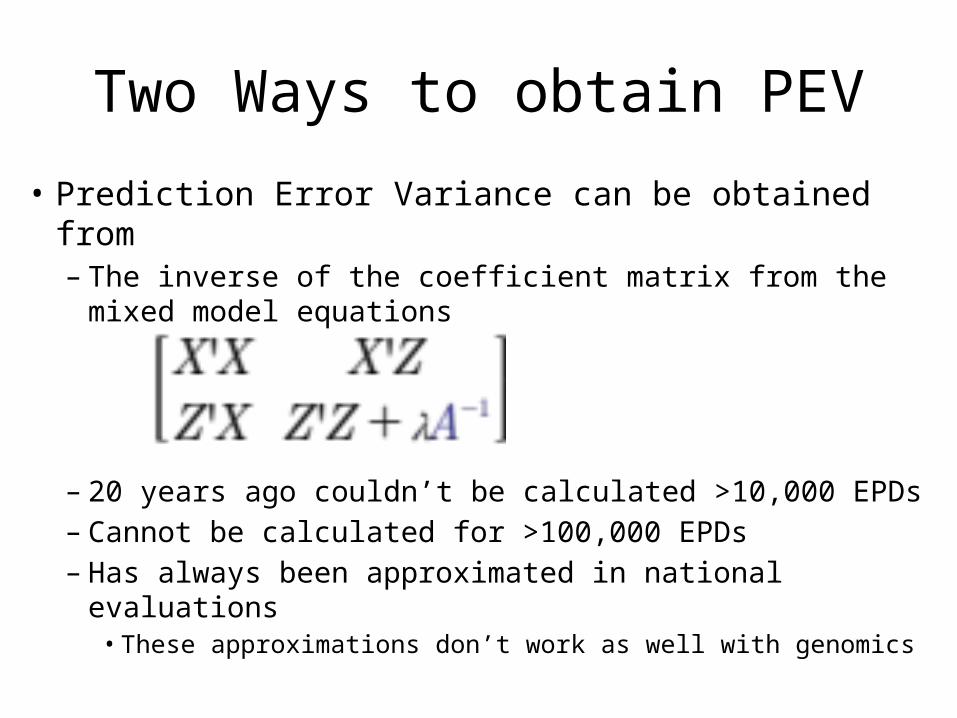
• Prediction Error Variance can be obtained from– The inverse of the coefficient matrix from the mixed
model equations
– 20 years ago couldn’t be calculated >10,000 EPDs– Cannot be calculated for >100,000 EPDs– Has always been approximated in national evaluations
• These approximations don’t work as well with genomics
MCMC Sampling
• Markov chain Monte-Carlo (MCMC) sampling• Uses the mixed model equations – but not just
to get the single solution – it obtains all the plausible solutions for all the animals given all available information – exact PEV
• Most people believe it is too much computer effort to use this method with national evaluation– “Most people” haven’t tried hard enough
MCMC Sampling
• Allows BIF accuracy to be computed for– Differences between 2 bulls
• Two accurate bulls may not be accurately compared
– Groups of bulls• What is the accuracy of teams of bulls?
– Differences between groups of bulls • How do my bulls compare to breed average?• How do my bulls compare to 10 years ago?
Quantum Leap Software Tools
• Allows inclusion of genomic information from the ground up, rather than as an “add-on”
• Allows the use of new computing techniques including parallel computing & graphics cards
• Allows calculation of actual accuracies, for any interesting comparisons
• Allows routine (eg monthly, weekly) updates• Allows easy updating with new methods

Parallel Computing
Worn out software