UNDERSTANDING BY DESIGN UNIT PLAN - · PDF fileUNDERSTANDING BY DESIGN UNIT PLAN Understanding...
25
UNDERSTANDING BY DESIGN UNIT PLAN Understanding by Design 2.0 - Wiggins and McTighe, 2011 Stage 1 – Desired Results (NOTE: # these and include #s in Stage 3) Established Goals AFDA.2 The student will use knowledge of transformations to write an equation, given the graph of a function (linear, quadratic, exponential, and logarithmic). AFDA.3 The student will collect data and generate an equation for the curve (linear, quadratic, exponential, and logarithmic) of best fit to model real-world problems or applications. Students will use the best fit equation to interpolate function values, make decisions, and justify conclusions with algebraic and/or graphical models. CCSS.MATH.CONTENT.HSF.BF.B.3 Identify the effect on the graph of replacing f(x) by f(x) + k, k f(x), f(kx), and f(x + k) for specific values of k (both positive and negative); find the value of k given the graphs. Experiment with cases and illustrate an explanation of the effects on the graph using technology. Name: Brittany French Content Area: Math Unit Topic: Function Transformations Grade Level: Algebra 2 (10 th /11 th ) Meaning UNDERSTANDINGS ESSENTIAL QUESTIONS Students will Understand THAT... U1: Graphs can be used to visualize the effect changes have on the original equation. U2: Where a constant is positioned determines the effect it has on the graph. U3: Linear, quadratic, exponential, and logarithmic graphs can be used to represent real-world data. Students will keep considering... EQ1: How does using graphs help us analyze data? EQ2: How much of an effect does the placement of a constant have on an equation? EQ3: What makes a line or curve the “best-fit” for a set of data? Acquisition KNOWLEDGE SKILLS Students will know... K1: A transformation is a change applied to a function or graph. K2: A parent function is the most basic form of a family of functions. K3: A horizontal shift is represented by f(x+k) and indicates a transformation directly to the left or right. K4: A vertical shift is represented by f(x)+k and indicates a transformation directly up or down. K5: A vertical stretch is represented by kf(x), where k is greater than 1. K6: A vertical compression is represented by kf(x), where k is less than 1. Students will be able to... (include Bloom’s Label) D1: Identify the parent function for linear, quadratic, exponential, and logarithmic functions. (Comprehending) D2: Graph the following transformations for linear, quadratic, exponential, and logarithmic functions: f(x) + k, f(x+k), kf(x), f(kx). (Applying) D3: Construct and graph an equation from given transformations. (Applying) D4: Determine the equation for linear, quadratic,
Transcript of UNDERSTANDING BY DESIGN UNIT PLAN - · PDF fileUNDERSTANDING BY DESIGN UNIT PLAN Understanding...

UNDERSTANDING BY DESIGN UNIT PLAN
Understanding by Design 2.0 - Wiggins and McTighe, 2011
Stage 1 – Desired Results (NOTE: # these and include #s in Stage 3)
Established Goals
AFDA.2 The student will use knowledge of transformations to write an equation, given the graph of a function (linear, quadratic, exponential, and logarithmic).
AFDA.3 The student will collect data and generate an equation for the curve (linear, quadratic, exponential, and logarithmic) of best fit to model real-world problems or applications. Students will use the best fit equation to interpolate function values, make decisions, and justify conclusions with algebraic and/or graphical models.
CCSS.MATH.CONTENT.HSF.BF.B.3 Identify the effect on the graph of replacing f(x) by f(x) + k, k f(x), f(kx), and f(x + k) for specific values of k (both positive and negative); find the value of k given the graphs. Experiment with cases and illustrate an explanation of the effects on the graph using technology.
Name: Brittany French Content Area: Math
Unit Topic: Function Transformations Grade Level: Algebra 2 (10th/11th)
Meaning UNDERSTANDINGS ESSENTIAL QUESTIONS
Students will Understand THAT...
U1: Graphs can be used to visualize the effect changes have on the original equation. U2: Where a constant is positioned determines the effect it has on the graph. U3: Linear, quadratic, exponential, and logarithmic graphs can be used to represent real-world data.
Students will keep considering...
EQ1: How does using graphs help us analyze data? EQ2: How much of an effect does the placement of a constant have on an equation? EQ3: What makes a line or curve the “best-fit” for a set of data?
Acquisition
KNOWLEDGE SKILLS Students will know...
K1: A transformation is a change applied to a function or graph. K2: A parent function is the most basic form of a family of functions. K3: A horizontal shift is represented by f(x+k) and indicates a transformation directly to the left or right. K4: A vertical shift is represented by f(x)+k and indicates a transformation directly up or down. K5: A vertical stretch is represented by kf(x), where k is greater than 1. K6: A vertical compression is represented by kf(x), where k is less than 1.
Students will be able to... (include Bloom’s Label)
D1: Identify the parent function for linear, quadratic, exponential, and logarithmic functions. (Comprehending) D2: Graph the following transformations for linear, quadratic, exponential, and logarithmic functions: f(x) + k, f(x+k), kf(x), f(kx). (Applying) D3: Construct and graph an equation from given transformations. (Applying) D4: Determine the equation for linear, quadratic,

UNDERSTANDING BY DESIGN UNIT PLAN
Understanding by Design 2.0 - Wiggins and McTighe, 2011
K7: A horizontal stretch is represented by f(kx), where k is less than 1. K8: A horizontal compression is represented by f(kx), where k is greater than 1. K9: A reflection over the x-axis occurs when f(x) becomes –f(x). K10: A reflection over the y-axis occurs when f(x) becomes f(-x). K11: The curve of best fit is the function that most closely approximates the values for a set of data. K12: To interpolate means to estimate new function values from known function values. K13: The order to apply multiple transformations in.
exponential, and logarithmic functions from a graph. (Analyzing) D5: Determine the curve of best fit for real-world data. (Analyzing) D6: Predict new values for real world data from known values. (Applying)

UNDERSTANDING BY DESIGN UNIT PLAN
Understanding by Design 2.0 - Wiggins and McTighe, 2011
Performance Assessment: Please Briefly Describe your GRASP and Rubric Categories here. ATTACH YOUR THOROUGH, DETAILED, STUDENT-FRIENDLY VERSION OF YOUR GRASP AND RUBRIC TO YOUR FINAL PROJECT
Stage 2 – EVIDENCE (PERFORMANCE ASSESSMENT)
Rubric Criteria (Categories)
GOAL: Determine when Tolland High School must build an addition in order to support the growing population. Determine how many people this addition needs to fit in order to support another 20 years of growth. ROLE: You are a population analyst who has been asked to determine when Tolland High School will reach maximum capacity and propose how many people this addition should support. AUDIENCE: The Tolland Board of Education SITUATION: Over the past few decades, Tolland’s population has been growing. Tolland High School is nearing its maximum capacity and therefore has decided it needs to start making a plan for adding an addition to the school. They have decided the first step is to determine when the addition will be needed by and second they must decide how big the addition needs to be. They have hired a population analyst to determine how quickly the population is growing, predict in what year the High School will reach capacity, and look at future predictions to determine how big the addition must be in order to support the population for at least 20 years following its construction. The analyst will present this material to the Board of Education so they can begin creating a timeline and budget for construction of the addition. PERFORMANCE/PRODUCT: A presentation that includes past population data, a curve of best fit that represents the past data and can be used to predict future population levels, an explanation of the parent function chosen for the data and the transformations applied to it, an estimation of when the school will reach capacity, and a proposal on how many people the new addition must fit in order to support the population for 20 years after its construction.

TollandHighSchoolIsRunningOutofRoom!
GOAL:DeterminewhenTollandHighSchoolwillreachmaximumcapacityandhowlargeofanadditionwillbeneededtoaccommodatethatgrowth.ROLE:Populationanalyst(Someonewhoanalyzeshowaspecificpopulationwithgrowoveraperiodoftime)AUDIENCE:TollandBoardofEducationSITUATION:Overthepastfewdecades,Tolland’spopulationhasbeengrowing!Thisgrowthisgreatforthetown,buttheHighSchoolisrunningoutofroomandquicklynearingtheirmaximumcapacity.TheyhavedecideditistimetobeginmakingplanstoaddanadditiontotheHighSchooltosupportthegrowingpopulation.
Youhavebeenhiredtoanalyzehowquicklythepopulationisgrowingbasedonpastdataandpredictwhentheywillreachcapacity.ThiswillhelptheBoardofEducationcreateatimelineandbudgetforconstructionofthenewaddition.Inaddition,theywantyoutodeterminehowmanypeoplethenewadditionmustfitinordertosupportthestudentpopulationforatleastanother20yearsafterconstruction.Data:
Year Population(ofstudentsinhighschool)
1997 7561998 7521999 7412000 7602001 7582002 7622003 7712004 7752005 7822006 7892007 7912008 8002009 8142010 8312011 8522012 8642013 8782014 8912015 9322016 967
MaximumCapacityofHighSchool:1,100students

PERFORMANCE/PRODUCT:Apresentationthatincludes:
1. YourCurveofBestFit(D5,K11)accompaniedbya. Yourchosenindependentanddependentvariablesincludingwhatthey
representb. Ascatterplotofthegivendatac. Theparentfunctionyouchoseanditsgraph(K2)
i. Provideanexplanationofthischoiced. Thetransformationsyouapplied(D2)
i. Provideexplanationsofwhattransformationsyouused,inwhatorder,andwhy(U1,U2,U3,K13)
2. YourCapacityPredictiona. Useinterpolationtopredictwhentheschoolwillreachcapacity.(K12,D6)b. Predictionshouldbeintheformofaschoolyear(i.e.“Inthe2022-2023school
year,thehighschoolwillnotfitthestudentpopulation.”)c. Anexplanationforyourpredictionsupportedbyalgebraicandgraphical
evidence(U1,U2,U3)
3. SizeoftheAdditionProposala. Useinterpolationtodetermineaproposalforhowmanypeopleyouthinkthe
additionshouldfittosupportthepopulationfor20yearsaftertheadditioniscompleted(K12,D6)
i. Estimationshouldberoundedtoanappropriateamountofwholepeopleb. Anexplanationforyourpredictionsupportedbyalgebraandgraphicalevidence
(U1,U2,U3)
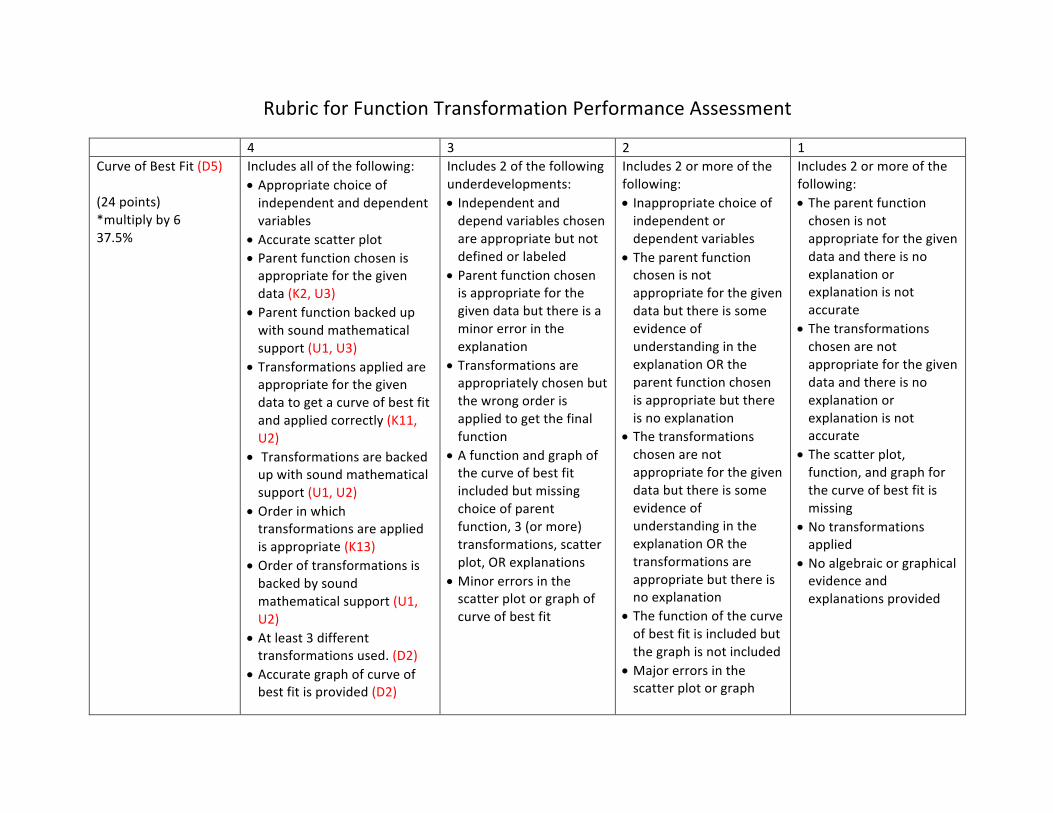
RubricforFunctionTransformationPerformanceAssessment
4 3 2 1CurveofBestFit(D5)(24points)*multiplyby637.5%
Includesallofthefollowing:• Appropriatechoiceofindependentanddependentvariables
• Accuratescatterplot• Parentfunctionchosenisappropriateforthegivendata(K2,U3)
• Parentfunctionbackedupwithsoundmathematicalsupport(U1,U3)
• Transformationsappliedareappropriateforthegivendatatogetacurveofbestfitandappliedcorrectly(K11,U2)
• Transformationsarebackedupwithsoundmathematicalsupport(U1,U2)
• Orderinwhichtransformationsareappliedisappropriate(K13)
• Orderoftransformationsisbackedbysoundmathematicalsupport(U1,U2)
• Atleast3differenttransformationsused.(D2)
• Accurategraphofcurveofbestfitisprovided(D2)
Includes2ofthefollowingunderdevelopments:• Independentanddependvariableschosenareappropriatebutnotdefinedorlabeled
• Parentfunctionchosenisappropriateforthegivendatabutthereisaminorerrorintheexplanation
• Transformationsareappropriatelychosenbutthewrongorderisappliedtogetthefinalfunction
• Afunctionandgraphofthecurveofbestfitincludedbutmissingchoiceofparentfunction,3(ormore)transformations,scatterplot,ORexplanations
• Minorerrorsinthescatterplotorgraphofcurveofbestfit
Includes2ormoreofthefollowing:• Inappropriatechoiceofindependentordependentvariables
• TheparentfunctionchosenisnotappropriateforthegivendatabutthereissomeevidenceofunderstandingintheexplanationORtheparentfunctionchosenisappropriatebutthereisnoexplanation
• ThetransformationschosenarenotappropriateforthegivendatabutthereissomeevidenceofunderstandingintheexplanationORthetransformationsareappropriatebutthereisnoexplanation
• Thefunctionofthecurveofbestfitisincludedbutthegraphisnotincluded
• Majorerrorsinthescatterplotorgraph
Includes2ormoreofthefollowing:• Theparentfunctionchosenisnotappropriateforthegivendataandthereisnoexplanationorexplanationisnotaccurate
• Thetransformationschosenarenotappropriateforthegivendataandthereisnoexplanationorexplanationisnotaccurate
• Thescatterplot,function,andgraphforthecurveofbestfitismissing
• Notransformationsapplied
• Noalgebraicorgraphicalevidenceandexplanationsprovided

CapacityPredication(16points)*multiplyby425%*evaluatedindependentofthecorrectnessofthefunction
Includesallofthefollowing:• Curveofbestfitusedcorrectlytodeterminethepredictionofwhencapacitywillbereached.(K12,D6)
• Predictionsupportedbysoundalgebraicevidenceshowingallworkandgraphicalevidencewithpredictionidentified(U1,U2,U3)
• Appropriatelyestimatedtothenearestyear
Includes1ofthefollowingunderdevelopments:• Thecurveofbestfitisusedcorrectlytopredictwhencapacitywillbereachedbutthereare1-2minorerrorsinthecalculations
• Mathematicallyaccuratepredictionprovided,butmissingalgebraicORgraphicalsupport
• Errorinincorrect
Includes2ofthefollowingunderdevelopments:• Thecurveofbestfitisusedcorrectlytopredictwhencapacitywillbereachedbutthereare1-2minorerrorsinthecalculations
• Mathematicallyaccuratepredictionprovided,butmissingalgebraicORgraphicalsupport
• Errorinincorrect
Includes2ormoreofthefollowing:• Thecurveofbestfitisusedincorrectlytodeterminethepredictionofwhencapacitywillbereached
• Noalgebraicnorgraphicalsupportprovided
• Estimationisincorrect
SizeofAdditionProposal(16points)*multiplyby425%*evaluatedindependentofthecorrectnessofthefunction
Includesallofthefollowing:• Curveofbestfitusedcorrectlytodeterminetheproposedsizeoftheaddition.(K12,D6)
• Proposalsupportedbysoundalgebraicevidenceshowingallworkandgraphicalevidencewithproposalidentified(U1,U2,U3)
• Appropriatelyestimatedtoawholenumberofpeople
Includes1ofthefollowingunderdevelopments:• Thecurveofbestfitisusedcorrectlytodeterminetheproposedsizeoftheadditionbutthereare1-2minorerrorsinthemathorthegraph
• Mathematicallyaccurateproposalprovided,butmissingalgebraicORgraphicalsupport
• Errorinincorrect
Includes2ofthefollowingunderdevelopments:• Thecurveofbestfitisusedcorrectlytodeterminetheproposedsizeoftheadditionbutthereare1-2minorerrorsinthemathorthegraph
• Mathematicallyaccurateproposalprovided,butmissingalgebraicORgraphicalsupport
• Errorinincorrect
Includes2ormoreofthefollowing:• Thecurveofbestfitisusedincorrectlytodeterminetheproposalforthesizeoftheaddition
• Noalgebraicnorgraphicalsupportprovided
• Estimationisincorrect
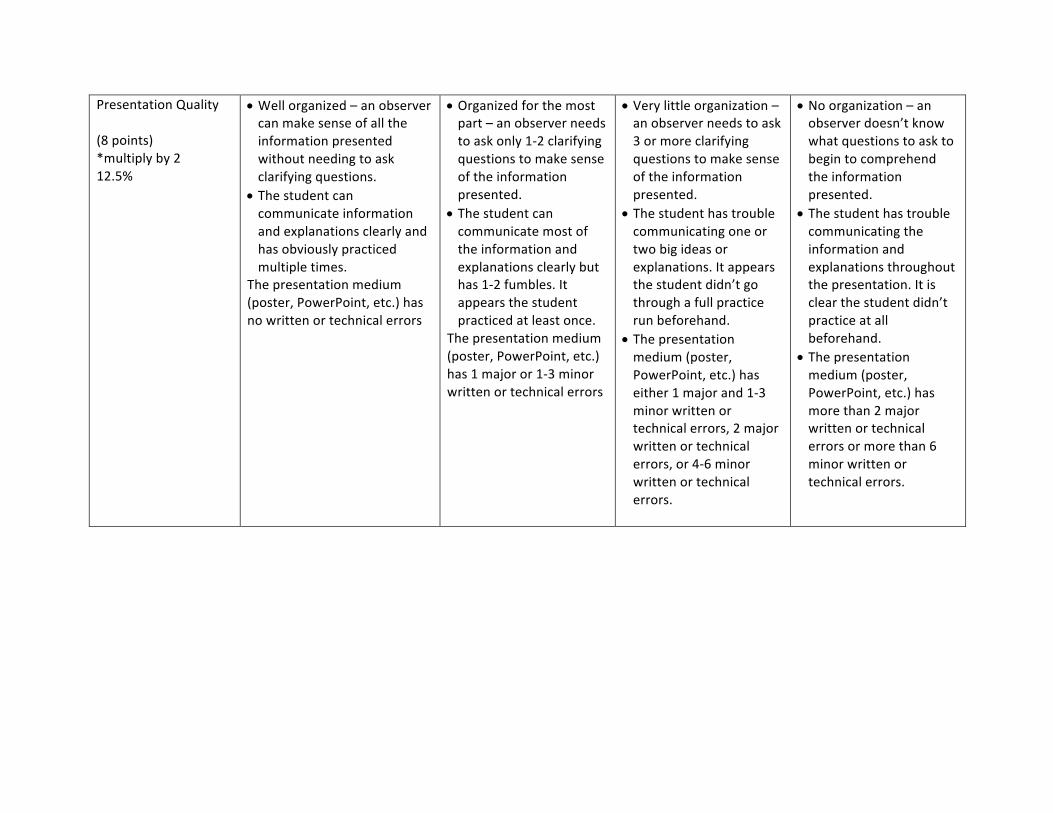
PresentationQuality(8points)*multiplyby212.5%
• Wellorganized–anobservercanmakesenseofalltheinformationpresentedwithoutneedingtoaskclarifyingquestions.
• Thestudentcancommunicateinformationandexplanationsclearlyandhasobviouslypracticedmultipletimes.
Thepresentationmedium(poster,PowerPoint,etc.)hasnowrittenortechnicalerrors
• Organizedforthemostpart–anobserverneedstoaskonly1-2clarifyingquestionstomakesenseoftheinformationpresented.
• Thestudentcancommunicatemostoftheinformationandexplanationsclearlybuthas1-2fumbles.Itappearsthestudentpracticedatleastonce.
Thepresentationmedium(poster,PowerPoint,etc.)has1majoror1-3minorwrittenortechnicalerrors
• Verylittleorganization–anobserverneedstoask3ormoreclarifyingquestionstomakesenseoftheinformationpresented.
• Thestudenthastroublecommunicatingoneortwobigideasorexplanations.Itappearsthestudentdidn’tgothroughafullpracticerunbeforehand.
• Thepresentationmedium(poster,PowerPoint,etc.)haseither1majorand1-3minorwrittenortechnicalerrors,2majorwrittenortechnicalerrors,or4-6minorwrittenortechnicalerrors.
• Noorganization–anobserverdoesn’tknowwhatquestionstoasktobegintocomprehendtheinformationpresented.
• Thestudenthastroublecommunicatingtheinformationandexplanationsthroughoutthepresentation.Itisclearthestudentdidn’tpracticeatallbeforehand.
• Thepresentationmedium(poster,PowerPoint,etc.)hasmorethan2majorwrittenortechnicalerrorsormorethan6minorwrittenortechnicalerrors.

UNDERSTANDING BY DESIGN UNIT PLAN
Understanding by Design 2.0 - Wiggins and McTighe, 2011
STAGE 3: THE LEARNING/FORMATIVE ASSESSMENT PLAN (USE AS MANY ROWS AS NECESSARY)
Lesson # & Topic/Focus
UKDs (You can include #s
from Stage 1) Concrete GROUP Formative Assessments
(Thoroughly Describe and/or Attach) Concrete INDIVIDUAL Formative Assessments
(Thoroughly Describe and/or Attach)
Lesson 1: Parent Functions and Vert ical Shif ts f (x) + k
U2, K1, K2, K4, D1, D2
This lesson wi l l s tar t out w i th an in t roduct ion to what funct ion t ransformat ions are. Th is wi l l invo lve learn ing what parent funct ions are and how to ident i fy them. Once th is mater ia l is in t roduced the s tudents wi l l p lay the game Memory Match w i th parent funct ions. The teacher wi l l randomly sor t s tudents in to groups of 2-3. The deck of memory match cards g iven to each group wi l l have var ious graphs drawn on hal f and the labels l inear , quadrat ic , exponent ia l , and logar i thmic on the other ha l f . Students wi l l lay a l l the cards face down and take turns f l ipp ing two cards over a t a t ime. I f they f l ip over a graph and i ts corresponding parent funct ion ( l inear , quadrat ic , exponent ia l , or logar i thmic) then they have a match and get to go again! I f i t is not a match then the next s tudent takes a turn. Whi le the games are occurr ing the teacher wi l l walk around making note of which matches s tudents are s t ruggl ing wi th the most . When a group completes a game they must ra ise the i r hands so that the teacher can check that a l l the i r matches are accurate. I f there are errors they wi l l be to ld to work as a group to f ind and correct the errors so that a l l matches are accurate. I f there are no errors or they have f ixed them a l l and there is s t i l l t ime, they wi l l be prov ided wi th a new deck. The teacher wi l l have mul t ip le decks of increasing d i f f icu l ty so that groups that are progress ing qu icker w i th the concept and game can develop a deeper understanding.
At the end of the lesson students wi l l complete an ex i t s l ip that is an a l tered form of a Frayer Diagram . Th is wi l l assess the i r understanding of ver t ica l sh i f ts and the i r ab i l i ty to work wi th ver t ica l sh i f ts by ask ing them to produce examples and non-examples. I t w i l l a lso br ing in the top ic o f parent funct ions by hav ing them ident i fy the parent funct ions that go wi th the i r examples. Based on how students do wi th th is w i l l determine how the next lesson wi l l begin. I f there is confus ion on parent funct ions, that w i l l need to be addressed before the teacher can cont inue on wi th teaching more t ransformat ions. I f there are d i f f icu l t ies wi th ver t ica l sh i f ts , then the next lesson wi l l begin wi th whi te board pract ice wi th ver t ica l sh i f ts to he lp s tudents get more comfor tab le wi th the concept and have more pract ice t ime.

UNDERSTANDING BY DESIGN UNIT PLAN
Understanding by Design 2.0 - Wiggins and McTighe, 2011
Lesson 2: Vert ical Stretches/ Compressions kf(x)
U2, K2, K5, K6, D1, D2, D3, D4
After the teacher g ives an in t roduct ion to ver t ica l sh i f ts and compress ions and works through some examples wi th the c lass on the board, the wi l l do a White Board act iv i ty . Th is wi l l begin wi th the teacher wr i t ing a funct ion on the board that inc ludes ver t ica l sh i f ts ( f rom lesson 1) and/or ver t ica l s t re tches and compress ions. Students wi l l sketch the graph on the i r whi te boards (which wi l l have coord inate p lanes on them) and then hold them up for the teacher to see. Whi le they are sketch ing the teacher wi l l walk around and observe how the s tudents are do ing wi th the sketch ing process to he lp determine i f a cer ta in type needs more pract ice ( th is w i l l gu ide what funct ions they t ry to graph next and how quick ly the d i f f icu l ty o f the funct ions wi l l increase) . Af ter the s tudents begin to grasp the ab i l i ty to graph these ver t ica l t ransformat ions, the teacher wi l l g ive them a second marker in a d i f ferent co lor . Th is t ime they wi l l graph two funct ions at the same t ime to see how changing the constant a f fects the graph. For example: graphing f (x) = x2+6 and f (x) = x2-6 or graphing f (x) = 3x2 and f (x) = (1 /3)x2 .
At the end of the lesson s tudents wi l l complete an Exit Sl ip . Th is ex i t s l ip w i l l a l low students to d isp lay the i r understanding of ver t ica l s t re tches and compress ions v ia words and p ic tures as wel l as pract ice wi th graphing a ver t ica l s t re tch. F ina l ly , i t asks s tudents to determine the funct ion f rom a p ic ture of a graph wi th a ver t ica l compress ion. I t is important for s tudents to both be ab le to produce the graphs and deduce the funct ion f rom a graph to ensure a complete understanding of ver t ica l s t re tches and compress ions. The resul ts o f th is ex i t s l ip w i l l be used to determine i f any rev iew or re-teaching needs to occur pr ior to cont inu ing onto the next top ic .
Lesson 3: Horizontal Shif ts f (x+k)
U1, U2, K1, K3, D3, D4
At the end of th is lesson the c lass wi l l do a Graff i t i Wall to he lp t ie together a l l the t ransformat ions covered so far and br ing in the order to apply them. Students wi l l be d iv ided in to 8 groups (probably 2-3 people per group). There wi l l be 4 graphs (one l inear , one quadrat ic , one exponent ia l , and one logar i thmic) on large sheets of paper a long one wal l and the same four a long the opposi te wal l . Each group wi l l be ass igned to a s tar t ing graph and a co lored marker and wi l l then ro tate among the four graphs on the i r s ide of the room. The inst ruct ions (which wi l l be shown v ia a PowerPoint one s tep at a t ime) wi l l be:
At the end of the lesson, s tudents wi l l complete an Exit Sl ip . Th is ex i t s l ip w i l l check in on the i r understanding of t ransformat ions as a whole, have them pract ice expla in ing the concept to someone e lse, and have them deduce a funct ion f rom a graph that inc ludes a hor izonta l sh i f t . Ask ing s tudents to expla in the s teps is very important for th is top ic because many students fa l l t rap to common misconcept ions about hor izonta l sh i f ts . By ask ing them to expla in i t w i l l a l low the teacher to see i f they know why “+k” means go k un i ts to the le f t (not the r ight ! ) . I f they can understand why i t happens then they are much more l ike ly to not make the common mistake than i f they just know that the a lgor i thm

UNDERSTANDING BY DESIGN UNIT PLAN
Understanding by Design 2.0 - Wiggins and McTighe, 2011
1. Wr i te down the equat ion for your graph.
2 . Rotate one graph to your r ight . 3 . Check and make correct ions to any
pr ior work. Then label the types of t ransformat ions in the equat ion (ver t ica l sh i f t , ver t ica l compress ion, e tc…)
4. Rotate one graph to your r ight . 5 . Check and make correct ions to any
pr ior work. Then descr ibe the types of t ransformat ions (ver t ica l sh i f t by a factor o f 2 , ver t ica l compress ion by a factor o f ½, e tc…)
6. Rotate one graph to your r ight . 7 . Check and make correct ions to any
pr ior work. Then number the t ransformat ions in the order you th ink they were appl ied.
Whi le s tudents are work ing on th is , the teacher wi l l walk around to answer quest ions and observe the work s tudents are do ing. I f there are errors in the work, the teacher wi l l s tep in and ask some probing quest ions to get s tudents back on t rack. Once s tudents complete th is they wi l l present the i r graph ( the one they ended at) to the group. S ince there are two of each graph, the groups that have the same ones wi l l present back to back so that compar isons can be made. I f there are s t i l l er rors in the presentat ion s tage, then the c lass wi l l work together to correct them wi th gu idance f rom the teacher when necessary. Th is Graf f i t i Wal l serves to br ing together a l l the in format ion covered so far and see how students are do ing put t ing i t a l l together .
te l ls them to go le f t for pos i t ive numbers. The resul ts o f th is ex i t s l ip w i l l be used to determine i f s tudents need more pract ice wi th hor izonta l sh i f ts , spec i f ica l ly understanding how and why they work, before cont inu ing onto ver t ica l s t re tches and compress ions (especia l ly s ince th is is a lso another top ic which many s tudents mix up) .
Lesson 4: Horizontal Stretches/
U1, U2, K3, K7, K8, D2, D3
After the teacher g ives the in t roduct ion to hor izonta l s t re tches and compress ions, s tudents wi l l pract ice wi th a White Board act iv i ty . Th is wi l l begin s imi lar ly to the whi te
At the end of the lesson, s tudents wi l l complete an Exit Sl ip . Th is ex i t s l ip w i l l check in wi th where s tudents are wi th a l l o f the hor izonta l t ransformat ions covered so far by hav ing them

UNDERSTANDING BY DESIGN UNIT PLAN
Understanding by Design 2.0 - Wiggins and McTighe, 2011
Compressions f (kx)
board act iv i ty f rom lesson 2 wi th the teacher wr i t ing down funct ions on the board that inc lude hor izonta l sh i f ts , s t re tches, and compress ions and the s tudents drawing i t on the i r whi te boards and hold ing them up. Af ter a few pract ice problems as a whole c lass to make sure everyone has the idea, the teacher wi l l d iv ide s tudents up in to groups based on the readiness they have d isp layed in the f i rs t few examples and throughout the un i t so far (spec i f ica l ly w i th graphing the t ransformat ions) . The teacher wi l l have three l is ts o f funct ions prepared – each of which increases in d i f f icu l ty a t a d i f ferent pace. Each of these l is ts inc ludes a l l the hor izonta l t ransformat ions for each of the four types of funct ions ( l inear , quadrat ic , exponent ia l , and logar i thmic) . The more chal lenging l is t w i l l inc lude funct ions that inc lude mul t ip le t ransformat ions and br ing in a l l the ver t ica l t ransformat ions as wel l . The less chal lenging one wi l l begin wi th on ly one t ransformat ion at a t ime and s lowly lead up to incorporat ing mul t ip le . The one in the middle wi l l focus most ly on funct ions wi th two t ransformat ions and towards the end a couple wi th three or four . In these groups s tudents wi l l work together to graph each of the funct ions on the i r l is t . A worksheet w i l l be prov ided as wel l for them to record the i r answers on af ter they have worked them out on the whi te board. The teacher wi l l be randomly co l lect ing one worksheet f rom each group so a l l s tudents must be f i l l ing i t out . The teacher wi l l cyc le around to the groups answer ing quest ions, l is ten ing to d iscuss ions, and ask ing probing quest ions to get them on the r ight t rack.
complete a Venn Diagram compar ing and contrast ing them. I t then has s tudents pract ice speci f ica l ly w i th the hor izonta l s t re tches and compress ions taught that day by hav ing them compose a funct ion f rom g iven t ransformat ions and then graph i t . S ince hor izonta l compress ions and s t re tches are a lso a common p lace where s tudents can fa l l t rap to misconcept ions, they are asked at the end to expla in why what they are g iven is a s t re tch and not a compress ion. Based on these ex i t s l ips, the teacher wi l l dec ide i f more pract ice wi th hor izonta l t ransformat ions is needed before moving on. Speci f ica l ly , the teacher wi l l be look ing for i f s tudents are fa l l ing t rap to the misconcept ion or not . I f they are, then th is would be an important th ing to address through more act iv i t ies and pract ice wi th hor izonta l s t re tches and compress ions before moving on.
Lesson 5:
U1, U2, K1, K3-
This lesson wi l l begin wi th an in t roduct ion to re f lect ions (which are a specia l type of
Th is lesson focused on combin ing a l l the t ransformat ions together . So at the end of the
UNDERSTANDING BY DESIGN UNIT PLAN
Understanding by Design 2.0 - Wiggins and McTighe, 2011
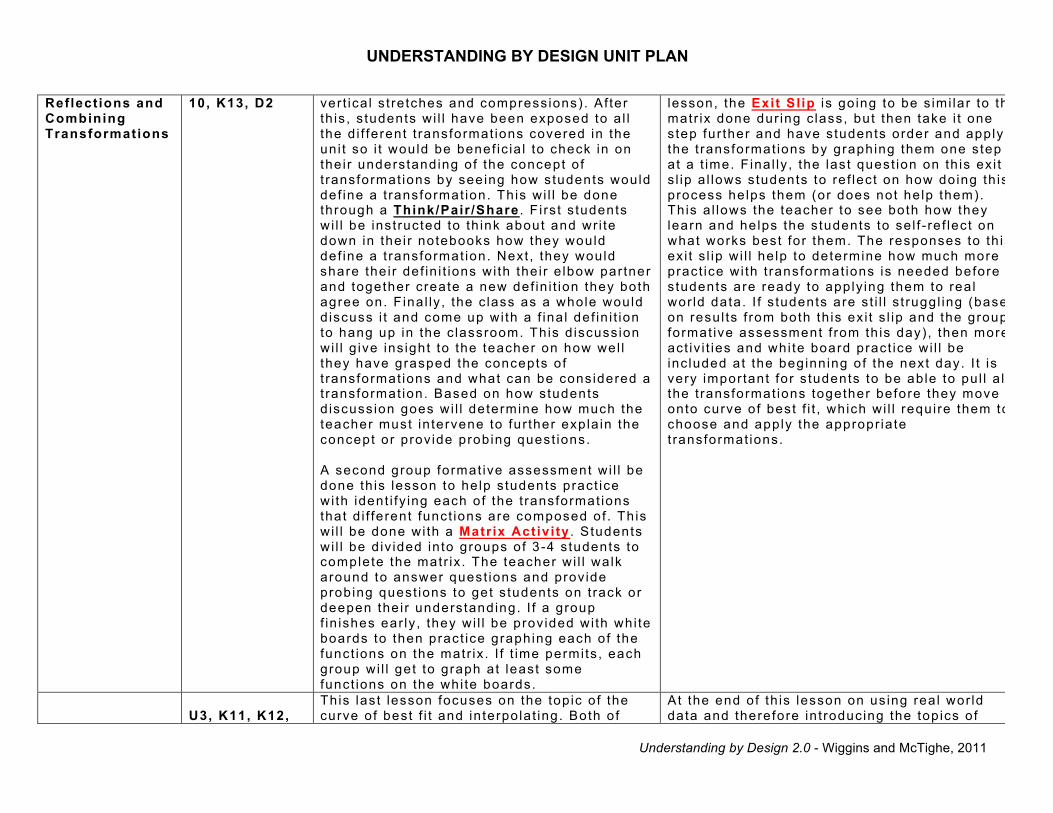
Reflect ions and Combining Transformations
10, K13, D2 ver t ica l s t re tches and compress ions) . Af ter th is , s tudents wi l l have been exposed to a l l the d i f ferent t ransformat ions covered in the un i t so i t would be benef ic ia l to check in on the i r understanding of the concept o f t ransformat ions by seeing how students would def ine a t ransformat ion. Th is w i l l be done through a Think/Pair /Share . F i rs t s tudents wi l l be instructed to th ink about and wr i te down in the i r notebooks how they would def ine a t ransformat ion. Next , they would share the i r def in i t ions wi th the i r e lbow par tner and together create a new def in i t ion they both agree on. F ina l ly , the c lass as a whole would d iscuss i t and come up wi th a f ina l def in i t ion to hang up in the c lassroom. This d iscuss ion wi l l g ive ins ight to the teacher on how wel l they have grasped the concepts o f t ransformat ions and what can be considered a t ransformat ion. Based on how students d iscuss ion goes wi l l determine how much the teacher must in tervene to fur ther exp la in the concept or prov ide probing quest ions. A second group format ive assessment wi l l be done th is lesson to he lp s tudents pract ice wi th ident i fy ing each of the t ransformat ions that d i f ferent funct ions are composed of . Th is wi l l be done wi th a Matrix Activ i ty . S tudents wi l l be d iv ided in to groups of 3 -4 s tudents to complete the matr ix . The teacher wi l l walk around to answer quest ions and prov ide probing quest ions to get s tudents on t rack or deepen the i r understanding. I f a group f in ishes ear ly , they wi l l be prov ided wi th whi te boards to then pract ice graphing each of the funct ions on the matr ix . I f t ime permits , each group wi l l get to graph at least some funct ions on the whi te boards.
lesson, the Exit Sl ip is go ing to be s imi lar to the matr ix done dur ing c lass, but then take i t one s tep fur ther and have s tudents order and apply the t ransformat ions by graphing them one step at a t ime. F ina l ly , the last quest ion on th is ex i t s l ip a l lows s tudents to re f lect on how doing th is process he lps them (or does not he lp them). This a l lows the teacher to see both how they learn and helps the s tudents to se l f - re f lect on what works best for them. The responses to th is ex i t s l ip w i l l he lp to determine how much more pract ice wi th t ransformat ions is needed before s tudents are ready to apply ing them to rea l wor ld data. I f s tudents are s t i l l s t ruggl ing (based on resul ts f rom both th is ex i t s l ip and the group format ive assessment f rom th is day) , then more act iv i t ies and whi te board pract ice wi l l be inc luded at the beginn ing of the next day. I t is very important for s tudents to be ab le to pu l l a l l the t ransformat ions together before they move onto curve of best f i t , which wi l l require them to choose and apply the appropr ia te t ransformat ions.
U3, K11, K12,
This last lesson focuses on the top ic o f the curve of best f i t and in terpo lat ing. Both of
At the end of th is lesson on us ing rea l wor ld data and therefore in t roducing the top ics of

UNDERSTANDING BY DESIGN UNIT PLAN
Understanding by Design 2.0 - Wiggins and McTighe, 2011
Lesson 6; Curve of Best Fit and Interpolat ing
D5, D6 these d i rect ly re la te to work ing wi th rea l wor ld data. To pract ice ident i fy ing the curve of best f i t for rea l wor ld data, s tudents wi l l par take in a Closed Sort . They wi l l be randomly d iv ided in to groups of 2-3 s tudents. Each group wi l l be g iven notecards that have e i ther a tab le of data or a scat ter p lo t represent ing rea l wor ld data. The groups wi l l then sor t the notecards in to the groups: l inear , quadrat ic , exponent ia l , and logar i thmic. Th is means they would be sor t ing the notecards based on which type of funct ion would be used to make the curve of best f i t . Once a group completes the sor t , they wi l l compare wi th another group who is f in ished and d iscuss why they put each notecard in the category they chose. Some notecards wi l l be ab le to go in mul t ip le categor ies so i t ’s important for the s tudents to both be able to back up why they chose one over the other and a lso be ab le to understand that there can be more than one opt ion as long as i t is appropr ia te ly supported. Af ter th is , each group wi l l p ick one of the notecards f rom each of the i r four categor ies and come up wi th a funct ion ( inc lud ing some t ransformat ions) that would be an appropr ia te curve of best f i t . Each notecard wi l l a lso have a number in the upper r ight hand corner . Student w i l l then use the funct ion they produced to in terpo late for the va lue wr i t ten in that top r ight corner . They wi l l wr i te the i r funct ion, show the i r work for in terpo lat ing, and wr i te a sentence in terpret ing what the i r resu l t means for the set o f data on the back of the notecard. These notecards wi l l be co l lected by the teacher a t the end of the lesson. Throughout th is act iv i ty the teacher wi l l be cyc l ing around to check in on how students are do ing and l is ten to the i r d iscuss ions.
curve of best f i t and in terpo lat ing, s tudents wi l l complete an Exit Sl ip . Th is ex i t s l ip w i l l begin by check ing that s tudents do know what a curve of best f i t is and how they would descr ibe i t . Next , they are g iven a scat ter p lo t and some quest ions that he lp them analyze i t and apply the new concepts they learned. I t a lso incorporates a quest ion that checks i f they understand what in terpo lat ing is . F ina l ly , i t checks i f they can apply i t to the rea l wor ld or the i r l i fe by ask ing them to generate an example. Th is ex i t s l ip w i l l he lp the teacher to see how wel l they can use what they have learned about t ransformat ions and use i t w i th rea l wor ld data. I t w i l l a lso he lp the teacher ident i fy which par ts o f work ing wi th rea l wor ld data are the most chal lenging for which s tudents. The next day, d i f ferent ia ted groups can be made (based on the resu l ts o f the ex i t s l ips) that w i l l g ive s tudents more pract ice wi th us ing rea l data by focus ing on the areas that are most chal lenging to them.

Lesson 4 Group Formative Assessment White Board Worksheet After graphing each function on your list on your white board, transfer it to a coordinate plane on this worksheet. One worksheet from each group will be randomly selected to be collected.
1. ___________________________ 2. ___________________________
3. ___________________________ 4. ___________________________

5. ___________________________ 6. ___________________________
7. ___________________________ 8. ___________________________
9. ___________________________ 10. ___________________________

Lesson 5 Group Formative Assessment Matrix In each box, write the description of the transformation. If the transformation isn’t in the function, leave the box blank. For example, if the function was f(x) = x2+7, then in the vertical shift box, you would write “by a factor of 7”.
! " =
−2 " + 3 ) + 4
+ " = 14 (log1 4")
ℎ " =
3 ∗ 251678
9 " = − 2(−") − 3 + 5
; " =13 (12 " − 4)
) − 9
= " =−2 35867> + 3
Vertical Shift
Horizontal Shift
Vertical Stretch
Vertical Compression
Horizontal Stretch
Horizontal Compression
Reflection Over y-axis
Reflection Over x-axis

Lesson 1 Individual Formative Assessment Frayer Diagram Complete the following diagram.
Definition of a vertical shift:
Definition of a parent function:
Examples of functions with a vertical shift (include graph): 1. 2.
Parent Functions of your examples: 1. 2. *if they can’t come up with any examples in the box to the left, I will supply them with functions to see if they can identify the parent functions
Non-Example: 1.
Why is it a non-example? 1.

Lesson 2 Individual Formative Assessment Exit Slip
1. What is the difference between a vertical stretch and a vertical compression?
2. For the graph of f(x) = 3log2(x):
a. What is the parent function?
b. Graph f(x) (be sure to label a couple points on your graph!)
*for those stuck I will suggest making a table
Using Words: Using Picture(s):

3. Write an exponential function that could represent the following graph:

Lesson 3 Individual Formative Assessment Exit Slip
1. a. How would you define a mathematical transformation?
b. What type of transformation is f(x+k)?
2. What steps would you tell a friend to take to apply and graph the transformation f(x+4)
to the function f(x) = 2x? Explain to them why you do each step.
3. Write a quadratic function that could represent the following graph:

Lesson 4 Individual Formative Assessment Exit Slip
1. Fill in the following Venn Diagram in any ways you can think of to compare horizontal shifts, compressions, and stretches. Include a definition in your own words for each of the three.
2. Your parent function is f(x) = x2. Your transformation is a horizontal stretch by 3. a. What is your function?
b. Graph your function:
c. Why is this a stretch and not a compression?
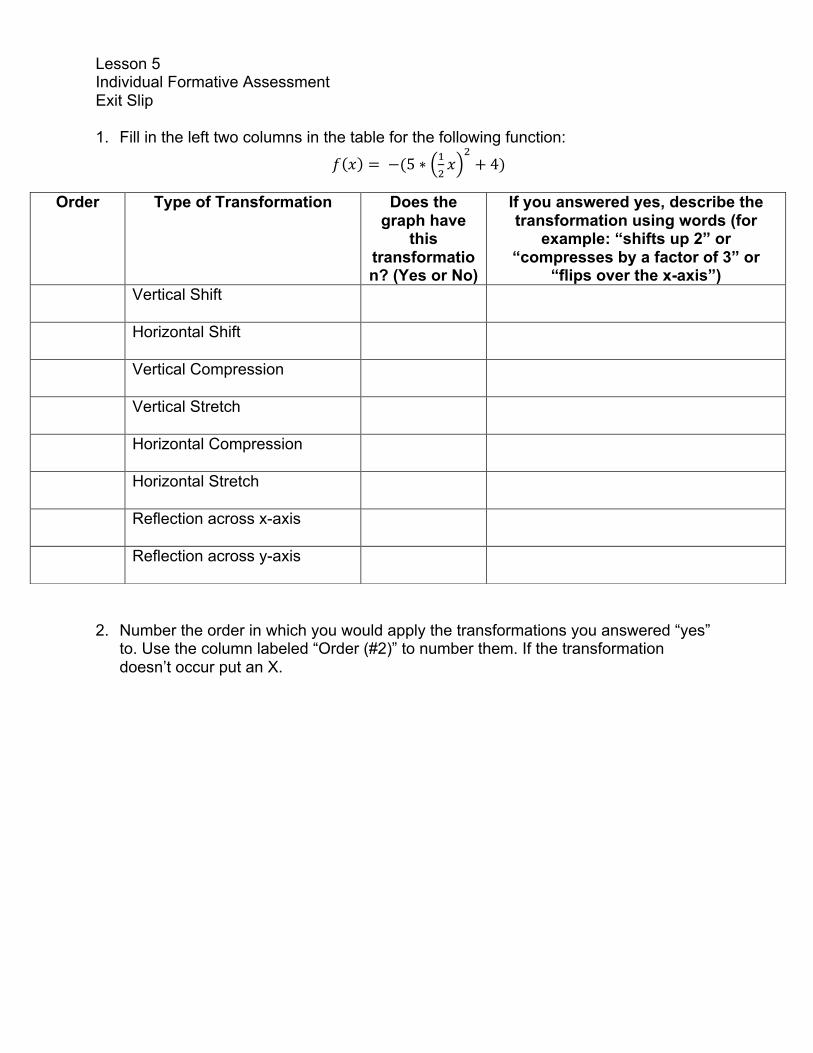
Lesson 5 Individual Formative Assessment Exit Slip 1. Fill in the left two columns in the table for the following function:
! " = −(5 ∗ )* "
*+ 4)
2. Number the order in which you would apply the transformations you answered “yes” to. Use the column labeled “Order (#2)” to number them. If the transformation doesn’t occur put an X.
Order Type of Transformation Does the graph have
this transformation? (Yes or No)
If you answered yes, describe the transformation using words (for
example: “shifts up 2” or “compresses by a factor of 3” or
“flips over the x-axis”) Vertical Shift
Horizontal Shift
Vertical Compression
Vertical Stretch
Horizontal Compression
Horizontal Stretch
Reflection across x-axis
Reflection across y-axis

3. Create a graph to go with each of your steps listed in #2. (Only use as many graphs as transformations you identified – you may end up leaving some blank).
1.
2.
3.
4.
5.
6.
*these pages would not be printed on the front and back of the same side of paper but would be each printed on their own piece so that students can look at the table while they are graphing without having to flip back and forth.

Lesson 6 Individual Formative Assessment Exit Slip
1. In your own words, what is a curve of best fit?
2. Answer the following questions using this scatter plot:
a. What type of function would you use for the curve of best fit? Why?
b. Draw what you think the curve of best fit would look like on the scatter plot.
c. Would your curve of best fit have any transformations? Why or why not?
d. What do you think f(7) would be?
e. Which question above (a, b, c, or d) asked you to interpolate?
3. Give an example of a time in which someone would need to find a curve of best fit and what they would use it for. (This could be for someone’s job or for something you could use it for).