Understanding and Improving Heterogeneous, Modern Recycled ...
189
Understanding and Improving Heterogeneous, Modern Recycled Asphalt Mixes October 2021 Final Report Project number TR201807 MoDOT Research Report number cmr 21-007 PREPARED BY: William G. Buttlar Magdy Abdelrahman Hamed Majidifard Eslam Deef University of Missouri-Columbia and Missouri University of Science and Technology PREPARED FOR: Missouri Department of Transportation Construction and Materials Division, Research Section
Transcript of Understanding and Improving Heterogeneous, Modern Recycled ...

Understanding and Improving Heterogeneous, Modern Recycled Asphalt Mixes
October 2021 Final Report
Project number TR201807 MoDOT Research Report number cmr 21-007
PREPARED BY:
William G. Buttlar
Magdy Abdelrahman
Hamed Majidifard
Eslam Deef
University of Missouri-Columbia and Missouri University of Science and Technology
PREPARED FOR:
Missouri Department of Transportation
Construction and Materials Division, Research Section

TECHNICAL REPORT DOCUMENTATION PAGE
1. Report No. cmr 21-007
2. Government Accession No. 3. Recipient’s Catalog No.
4. Title and SubtitleUnderstanding and Improving Heterogeneous, Modern Recycled Asphalt Mixes
5. Report DateAugust 2021Published: October 20216. Performing Organization Code
7. Author(s)William G. Buttlar, Magdy Abdelrahman, Hamed Majidifard, and Eslam Deef
8. Performing Organization Report No.
9. Performing Organization Name and AddressUniversity of MissouriCivil and Environmental EngineeringE2509 Lafferre HallColumbia, Missouri 65211
10. Work Unit No.
11. Contract or Grant No.MoDOT project # TR201807
12. Sponsoring Agency Name and AddressMissouri Department of Transportation (SPR-B)Construction and Materials DivisionP.O. Box 270, Jefferson City, MO 65102
13. Type of Report and Period CoveredFinal Report (March 2018 – August 2021)14. Sponsoring Agency Code
15. Supplementary NotesConducted in cooperation with the U.S. Department of Transportation, Federal Highway Administration. Project name: Design-Build Evaluation for General Aviation Hangars in Missouri. MoDOT research reports are available in the Innovation Library athttps://www.modot.org/research-publications.16. AbstractA comprehensive research investigation was carried out to investigate the use of recycled materials in Superpave asphalt mixturesin Missouri. The investigation involved sampling of aggregates, binders, plant-produced mixtures, and field cores followed by arigorous lab testing program. Lab testing included an extensive binder extraction and recovery (E & R) experiments, followed by acomprehensive suite of advanced binder tests. An attempt was made to shed light on effective strategies to iterate existing mixdesigns into more ‘balanced mix designs’ for modern, heterogeneous recycled mixtures in the Midwest. Different strategies wereemployed, such as the use of a softer virgin binder, the addition of a rejuvenator, and the employment of 5% to 20% of dry-process, engineered crumb rubber by weight of total binder. These mixes were subjected to a suite of cracking and rutting mixtureperformance tests to establish baseline performance, followed by four additional mix design iterations per mix (for a total of 10investigated mixtures). The DC(T), I-FIT, IDEAL-CT, and Hamburg wheel tracking tests were used in the performance testingsuite. Based on the results of the study, it was found that RAP, and particularly RAS, drive the need for the use of softer virginbinders to be used in modern, recycled asphalt mixtures in Missouri. Recommendations are provided with respect to the selectionof softer virgin binder grades based on recycled material type and amount. Recommendations for balancing mixes with the use ofrejuvenators and ground tire rubber are also provided.
17. Key WordsAsphalt, Modern recycled asphalt mixes, Specification, Performance tests,Pavement
18. Distribution StatementNo restrictions. This document is available through theNational Technical Information Service, Springfield, VA22161.
19. Security Classif. (of this report)Unclassified.
20. Security Classif. (of this page)Unclassified.
21. No. of Pages189
22. Price
Form DOT F 1700.7 (8-72) Reproduction of completed page authorized

UNDERSTANDING AND IMPROVING HETEROGENEOUS, MODERN RECYCLED ASPHALT MIXES
Final Report
William G. Buttlar, University of Missouri-Columbia, Principal Investigator
Magdy Abdelrahman, Missouri S&T, Co-Principal Investigator
and
Graduate Research Assistants, Hamed Majidifard and Eslam Deef
Sponsored by
Missouri Department of Transportation Office of Research
A report from
The University of Missouri-Columbia Missouri Center for Transportation Innovation
Department of Civil and Environmental Engineering

iii
COPYRIGHT PERMISSIONS The authors herein are responsible for the authenticity of their materials and for obtaining written permissions from publishers or individuals who own the copyright to any previously published or copyrighted material used herein. DISCLAIMER The opinions, findings, and conclusions expressed in this document are those of the investigators. They are not necessarily those of the Missouri Department of Transportation, U.S. Department of Transportation, or Federal Highway Administration. This information does not constitute a standard or specification. ACKNOWLEDGMENTS The successful completion of this research project would not have been possible without the help of a number of individuals in key agencies and in the asphalt paving industry. We would like to acknowledge the assistance provided by Dan Oesch of the Missouri Department of Transportation (MoDOT), as well as the assistance of MoDOT engineering staff and field personnel in helping the research team to access field performance data and to safely procure field cores. We also acknowledge the assistance provided by members of the Missouri Asphalt Pavement Association (MAPA) in identifying field sections and in procuring plant materials.

iv
Table of Contents
EXECUTIVE SUMMARY ...............................................................................................xv
1. INTRODUCTION ...............................................................................................................1
1.1. Background ...................................................................................................................1 1.2. Research Motivation .....................................................................................................1 1.3. Research ........................................................................................................................2 1.4. Technology Transfer .....................................................................................................3
2. MATERIAL SAMPLING AND PROCESSING ................................................................4
2.1. Asphalt Mixtures Investigated ......................................................................................4 2.2. Selection of Mixtures for ‘Fix-the-Mix’ Study Task ....................................................9 2.3. Mix Designs used in the Fix-the-Mix Study Task ......................................................10 2.4. Mixing and Compaction .............................................................................................17 2.5. Sample Size .................................................................................................................18 2.6. Materials for Binder Studies .......................................................................................18
3. BINDER RECOVERY AND PERFORMANCE TESTING ............................................27
3.1. Extraction of Asphalt Binders from Asphaltic Mixes.................................................27 3.2. Recovery of Asphalt Binder from Binder-Solvent Solution .......................................27 3.3. Short-Term Aging for Virgin Asphalt Binders ...........................................................28 3.4. Evaluating the Virgin and Extracted & Recovered Asphalt Binders’ Rheological Properties ...........................................................................................................................28
4. MIXTURE PERFORMANCE TESTS ..............................................................................31
4.1. DC(T) Fracture Test ....................................................................................................31 4.2. Semi Circular Bending, I-FIT Test .............................................................................32 4.3. IDEAL-CT Test ..........................................................................................................33 4.4. Hamburg Wheel Track Test (HWTT) .........................................................................34 4.5. Hamburg-DC(T) Performance Space Diagram ..........................................................35
5. BINDER TESTING RESULTS .........................................................................................37
5.1. Relating Asphalt Binders Extracted & Recovered from the Plant Mixes to the Corresponding RTFO-Aged Virgin Asphalt Binders ........................................................37
5.1.1. Extraction of Asphalt Binders from Plant Mixes .........................................37 5.1.2. Analysis of the Asphalt Binders before and after the Extraction and Recovery Processes ................................................................................................39
5.2. Summary of Other Binder Tests Performed ..........................................................48
6. MIXTURE TESTING RESULTS .....................................................................................51
6.1. DC(T) Results for Lab Mixtures in the Fix-the-Mix Study Task ..........................51 6.2. I-FIT Results for Lab Mixtures ..............................................................................53 6.3. IDEAL CT Results for Lab Mixtures ....................................................................54 6.4. Hamburg Results for Lab Mixtures .......................................................................55 6.5. Performance-space Diagram for Lab Mixtures ......................................................57
v
7. COMPARISON OF E & R BINDER AND MIXTURE TESTING RESULTS ...............60
7.1. High-Temperature Results ..........................................................................................60 7.1.1. Mixes Constructed and Sampled in 2016 ....................................................60 7.1.2.Field and Plant Mixes Constructed in 2016 and their E & R Asphalt Binders................................................................................................................................63 7.1.3. Lab Mixes and their E & R Asphalt Binders ...............................................67
7.2. Intermediate-Temperature Results ..............................................................................71
8. DEVELOPMENT OF BEST PRACTICES FOR DESIGNING ASPHALT MIXTURES WITH MODERN RECYCLED MATERIALS .................................................................79
8.1. Evaluation of current practices for binder grade selection in Missouri ......................79 8.2. Best practice recommendations for binder selection, use of rejuvenators and rubber 81 8.3. Other best practice recommendations for designing recycled mixes ..........................83
9. SUMMARY, CONCLUSIONS AND RECOMMENDATIONS......................................86
9.1 Summary ......................................................................................................................86 9.2 Conclusions ..................................................................................................................86 9.3 Recommendations ........................................................................................................89
10. REFERENCES ..................................................................................................................92
APPENDIX ....................................................................................................................................96
A.1. Literature review (binder) ..........................................................................................96 A.2. Binder test and results ..............................................................................................101
A.2.1. Characterizing the Asphalt Binders Extracted and Recovered from the Field Mixes Constructed before 2016 ..................................................................101 A.2.2. Relating Asphalt Binders Extracted and Recovered from Field, Plant, and Lab Mixes to the Corresponding RTFO Aged Virgin Asphalt Binders ..............118 A.2.3. Relating Asphalt Binders Extracted and Recovered from the Field Mixes Constructed in 2016 to the Corresponding RTFO Aged Virgin Asphalt Binders..............................................................................................................................140
REFERENCES (APPENDIX) .....................................................................................................166

vi
List of Figures Figure 2-1. Laboratory Materials Including Virgin Aggregates, RAP, Virgin Binder,
Rejuvenators, Additives and Ground-Tire Rubber ............................................................11 Figure 2-2. Gradation of US63_1 Superpave Mixture...................................................................11 Figure 2-3.Gradation of US54_6 Mixture .....................................................................................15 Figure 2-4. Bucket Lab Mixer (left), Gyratory Compactor (Right) ...............................................17 Figure 2-5. DC(T) Fabrication Process ..........................................................................................18 Figure 2-6. First Batch of Field Mix Cores....................................................................................20 Figure 2-7. Second Batch of Field, Plant, and Lab Mixes .............................................................20 Figure 3-1. Extraction and Recovery Processes; (a) Centrifuge Extractor, (b) Filterless
Centrifuge, (c) Ashing Dishes Containing Mineral Matter, (d) Centrifuge Metal Cup Containing Mineral Matter, and (e) Rotavap .....................................................................28
Figure 4-1. DC(T) Specimen (Top-Left), DC(T) Loading Fixture (Top-Right), and Typical Load-CMOD Curve from DC(T) Testing of Asphalt Mixtures (Bottom) ..................................32
Figure 4-2. SCB I-FIT apparatus in MAPIL lab ............................................................................33 Figure 4-3. Hamburg Wheel Track Machine (Left), Asphalt Specimen Inside Hamburg Machine
after Testing (right) ............................................................................................................35 Figure 4-4. Concept of Hamburg-DC(T) Plot................................................................................36 Figure 5-1. Reference (Actual) vs Extracted AC% using Different MMDMs for Plant Mixes
Containing RAP or RAS ....................................................................................................38 Figure 5-2. Extracted AC vs. Actual AC % for Plant Asphaltic Mixes using Different MMDMs
............................................................................................................................................39 Figure 5-3. Temperature Sweep Test Results for the E & R Asphalt binders from the Plant Mixes
and the Corresponding RTFO Aged Virgin Asphalt Binders ............................................42 Figure 5-4. Rutting Parameter Ratio, Measured at the High PG Temperature of the Virgin
Asphalt Binders, for the E & R Asphalt Binders from the Plant Mixes and the Corresponding RTFO-aged Virgin Asphalt Binders .........................................................43
Figure 5-5. Master Curve for the E & R Asphalt Binders from the Plant Mixes and the Corresponding RTFO Aged Virgin Asphalt Binders Measured at 60°C ...........................44
Figure 5-6. Cole-Cole plots and Black Diagrams Analyzed at 60°C for the E & R Asphalt Binders from the Plant Mixes and the Corresponding RTFO Aged Virgin Asphalt Binders............................................................................................................................................45
Figure 5-7. MSCR Test Results for E & R Asphalt Binders from the Plant Mixes and the Corresponding RTFO Aged Virgin Asphalt Binders Measured at the High PG Temperature of the Virgin Asphalt Binders .......................................................................47
Figure 5-8. The High PG Temperatures for the RTFO Aged Virgin and E & R Asphalt Binders from Different Field Mixes, Constructed in 2016 .............................................................50
Figure 6-1. DC(T) Fracture Energy Test Results for US63_1 Mixtures .......................................52 Figure 6-2. DC(T) Fracture Energy Test Results for US54_6 Mixtures ......................................53 Figure 6-3. Flexibility Index Results for US63_1 and US54_6 Mixtures ....................................54 Figure 6-4. IDEAL CT Index Results for US63_1 and US54_6 Mixtures ...................................55 Figure 6-5. Hamburg Wheel Track Test Results for US63_1 Mixtures .......................................56 Figure 6-6. Hamburg Wheel Track Test Results for US54_6 Mixtures ........................................57 Figure 6-7. Hamburg-DC(T) Performance Space Diagram for US63_1 Mixture ........................58
vii
Figure 6-8. Hamburg-DC(T) Performance Space Diagram for US54_6 Mixture ........................59 Figure 7-1. Hamburg Rut Depths (at 10k & 20k passes) for Sections Constructed in 2016 .........60 Figure 7-2. Temperature Sweep Test Results for E & R Binders from Field Mixes Constructed in
2016....................................................................................................................................61 Figure 7-3. High PG Temperature for E & R Binders from Field Mixes Constructed in 2016 ....62 Figure 7-4. Master Curve Measured at 60°C for E & R Binders from Field Mixes Constructed in
2016....................................................................................................................................62 Figure 7-5. MSCR Test Results Measured at 60°C for E & R Binders from Field Mixes
Constructed in 2016 ...........................................................................................................63 Figure 7-6. Comparing HWTT Rut Depth of Field Cores and Plant Mixes from 2016 Sampling
............................................................................................................................................65 Figure 7-7. Temperature Sweep Test Results for E & R Binders from 2016 Field and Plant Mixes
............................................................................................................................................65 Figure 7-8. High PG Temperature for E & R Binders from Field and Plant Mixes Constructed in
2016....................................................................................................................................66 Figure 7-9. Master Curve Measured at 60°C for E & R Binders from Field and Plant Mixes
Constructed in 2016 ...........................................................................................................66 Figure 7-10. MSCR Test Results Measured at 60°C for E & R Binders from Field and Plant
Mixes Constructed in 2016 ................................................................................................67 Figure 7-11. Hamburg Wheel Track Test Results for (a) US54_6 and (b) US63_1 Mixes .........68 Figure 7-12. Temperature Sweep Test Results for E & R Binders from (a) US54_6 and (b)
US63_1 lab Mixes..............................................................................................................69 Figure 7-13. MSCR Test Results Measured at 60°C for E & R Binders from US54_6 lab Mixes
............................................................................................................................................70 Figure 7-14. MSCR Test Results Measured at 60°C for E & R Binders from US63_1 lab Mixes
............................................................................................................................................71 Figure 7-15. I-FIT SCB FI and Coefficient of Variability for Long-term Aged Field Sections ...72 Figure 7-16.Temperature Sweep Test Results for E & R Binders from Long-term Aged Field
Mixes..................................................................................................................................73 Figure 7-17. Superpave Fatigue Cracking Parameter Measured at 22°C for E & R Binders from
Long-term Aged Field Mixes.............................................................................................74 Figure 7-18. Intermediate PG Temperature for the E & R Binders from Long-term Aged Field
Mixes..................................................................................................................................74 Figure 7-19. Master Curve Measured at 22°C for the E & R Binders from Long-term Aged Field
Mixes..................................................................................................................................75 Figure 7-20. Nf at 2.5 and 5% Strain and 22°C for Binder from Long-term Aged Field Mixes ...75 Figure 7-21. Correlation of Binder Nf at Intermediate Temperature with I-FIT FI .......................76 Figure 7-22. Correlation of the Inverse of Binder |G*|sinδ at Intermediate Temperature with Mix
FI for Field Aged Sections .................................................................................................77 Figure 7-23. Correlation of Nf (5%) Parameter at Intermediate Temperature with FI for Field
Aged Sections ....................................................................................................................77 Figure A-1. Fibers Existing with the Aggregate after the Extraction Process of Asphalt Binders
from Mixes Containing RAS .............................................................................................96 Figure A-2. Temperature Sweep Test Results for the E & R Asphalt Binders from US 63-2 and
MO 151 Field Mixes, Constructed before 2016, Containing RAP and RAS ..................102 Figure A-3. Fatigue Cracking Parameter for the E & R Asphalt Binders from US 63-2 and MO

viii
151 Field Mixes, Constructed before 2016, Containing RAP and RAS Measured at 22°C..........................................................................................................................................103
Figure A-4. Master Curve for the E & R Asphalt Binders from US 63-2 and MO 151 Field Mixes, Constructed before 2016, Containing RAP and RAS Measured at 22°C ............103
Figure A-5. Temperature Sweep Test Results for the E & R Asphalt Binders from Field Mixes, Constructed before 2016, Containing Different Percentages of RAP .............................106
Figure A-6. Fatigue Cracking Parameter for the E & R Asphalt Binders from Field Mixes, Constructed before 2016, Containing Different Percentages of RAP and Measured at 22°C .................................................................................................................................107
Figure A-7. Master Curve for the E & R Asphalt Binders from Field Mixes, Constructed before 2016, Containing Different Percentages of RAP and Measured at 22°C ........................107
Figure A-8. Temperature Sweep Test Results for the E & R Asphalt Binders from MO 52-1 Field Mixes, Constructed before 2016, Containing 34% ABR Percentage by RAS ................108
Figure A-9. Fatigue Cracking Parameter for the E & R Asphalt Binders from Field Mixes, Constructed before 2016, Containing 34% ABR Percentage by RAS and Measured at 22°C .................................................................................................................................109
Figure A-10. Master Curve for the E & R Asphalt Binders from Field Mixes, Constructed before 2016, Containing 34% ABR Percentage by RAS and Measured at 22°C .......................109
Figure A-11. Temperature Sweep Test Results for the E & R Asphalt Binders from US 54-7 and MO 94 Field Mixes, Constructed before 2016, Containing Neither RAP nor RAS ........110
Figure A-12. Fatigue Cracking Parameter for the E & R Asphalt Binders from US 54-7 and MO 94 Field Mixes, Constructed before 2016, Containing neither RAP nor RAS Measured at 22°C .................................................................................................................................110
Figure A-13. Master Curve for the E & R Asphalt Binders from US 54-7 and MO 94 Field Mixes, Constructed before 2016, Containing neither RAP nor RAS and Measured at 22°C .................................................................................................................................111
Figure A-14. (a) Intermediate PG Temperatures in °C and (b) Nf at 2.5 and 5% Strain and 22°C Temperature for Asphalt Binders E & R from Field Mixes, Constructed before 2016, Containing no Recycled Materials ...................................................................................113
Figure A-15. (a) Intermediate PG Temperatures in °C and (b) Nf at 2.5 and 5% Strain and 22°C Temperature for Asphalt Binders E & R from Field Mixes, Constructed before 2016, Containing Different ABR Percentages by RAP .............................................................114
Figure A-16. Fatigue Failure for Asphalt Binder E & R from the US 54-12a-PG 70 (12-0) Mix at 22°C; (a) Sample Failure at the DSR Lower Plate and (b) Sample Failure at the DSR Upper Plate.......................................................................................................................115
Figure A-17. (a) Intermediate PG Temperatures in °C and (b) Nf at 2.5 and 5% Strain and 22°C Temperature for Asphalt Binders E & R from Field Mixes, Constructed before 2016, Containing 34% ABR Percentage by RAS ......................................................................116
Figure A-18. (a) Intermediate PG Temperatures in °C and (b) Nf at 2.5 and 5% Strain and 22°C Temperature for Asphalt Binders E & R from Field Mixes, Constructed before 2016, Containing Different ABR Percentages by RAP-RAS ....................................................117
Figure A-19. The Extracted Rubber Particles; (a) Particles Suspended with the TCE in the Extractor Bowl, (b) Particles with the Mineral Matter in the Metal Cup after the Filterless Centrifuge Process, and (c, d, and e) Particles Remaining with the Aggregate ..............119
Figure A-20. Actual vs Extracted AC% using Different MMDMs for the US 54-6 Field, Plant, and Lab Mixes..................................................................................................................120

ix
Figure A-21. Actual vs Extracted AC% using Different MMDMs for the US 63-1 Field, Plant, and Lab Mixes..................................................................................................................121
Figure A-22. Extracted AC per Actual AC% for US 54-6 Field, Plant, and Lab Asphaltic Mixes using Different MMDMs .................................................................................................122
Figure A-23. Extracted AC per Actual AC% for US 54-6 Lab Asphaltic Mixes using Different MMDMs ..........................................................................................................................123
Figure A-24. Extracted AC per Actual AC% for US 63-1 Field, Plant, and Lab Asphaltic Mixes using Different MMDMs .................................................................................................124
Figure A-25. Extracted AC per Actual AC % for US 63-1 Lab Asphaltic mixes using Different MMDMs ..........................................................................................................................124
Figure A-26. MSCR Test Results Measured at 60°C for RTFO Aged Virgin and E & R Asphalt Binders from (a) US 54-6 and (b) US 63-1 Field, Plant, and Lab Mixes ........................125
Figure A-27. MSCR Test Results Measured at 60°C for RTFO Aged Virgin and E & R Asphalt Binders from (a) US 54-6-PG 58, (b) US 54-6-PG 46, (c) US 63-1-PG 58, and (d) US 63-1-PG 46 Lab Mixes ..........................................................................................................127
Figure A-28. Temperature Sweep Test Results for the E & R Asphalt Binders from the US 54-6 Field, Plant, and Lab Mixes Containing 31% ABR by RAP and the Corresponding RTFO aged Virgin Asphalt Binder .............................................................................................128
Figure A-29. Temperature Sweep Test Results for the E & R Asphalt Binders from the US 54-6 Lab Mixes Containing 31% ABR by RAP and the Corresponding RTFO Aged Virgin Asphalt Binders ................................................................................................................129
Figure A-30. Temperature Sweep Test Results for the E & R Asphalt Binders from the US 63-1 Field, Plant, and Lab Mixes Containing 35% ABR by RAP and the Corresponding RTFO Aged Virgin Asphalt Binders...........................................................................................130
Figure A-31. Temperature Sweep Test Results for the E & R Asphalt Binders from the US 63-1 Lab Mixes Containing 35% ABR by RAP and the Corresponding RTFO Aged Virgin Asphalt Binders ................................................................................................................131
Figure A-32. The Connection between the DSR Upper and Lower Plates for Asphalt Binders E & R from Mixes Containing ECR ...................................................................................131
Figure A-33. Master Curve Measured at 60°C for the RTFO Aged Virgin and E & R Asphalt Binders from the US 54-6 Field, Plant, and Lab Mixes Containing 31% ABR by RAP 132
Figure A-34. Cole-Cole Plot Analyzed at 60°C for the RTFO Aged Virgin and E & R Asphalt Binders from the US 54-6 Field, Plant, and Lab Mixes Containing 31% ABR by RAP 133
Figure A-35. Black Diagram Analyzed at 60°C for the RTFO Aged Virgin and E & R Asphalt Binders from the US 54-6 Field, Plant, and Lab Mixes Containing 31% ABR by RAP 133
Figure A-36. Master Curve Measured at 60°C for the RTFO Aged Virgin and E & R Asphalt Binders from US 54-6 Lab Mixes Containing 31% ABR by RAP..................................134
Figure A-37. Cole-Cole Plot Analyzed at 60°C for the RTFO Aged Virgin and E & R Asphalt Binders from US 54-6 Lab Mixes Containing 31% ABR by RAP..................................135
Figure A-38. Black Diagram Analyzed at 60°C for the RTFO Aged Virgin and E & R Asphalt Binders from US 54-6 Lab Mixes Containing 31% ABR by RAP..................................135
Figure A-39. Master Curve Measured at 60°C for the RTFO Aged Virgin and E & R Asphalt Binders from the US 63-1 Field, Plant, and Lab Mixes Containing 35% ABR by RAP 136
Figure A-40. Cole-Cole Plot Analyzed at 60°C for the RTFO Aged Virgin and E & R Asphalt Binders from the US 63-1 Field, Plant, and Lab Mixes Containing 35% ABR by RAP 137
Figure A-41. Black Diagram Analyzed at 60°C for the RTFO Aged Virgin and E & R Asphalt

x
Binders from the US 63-1 Field, Plant, and Lab Mixes Containing 35% ABR by RAP 137 Figure A-42. Master Curve Measured at 60°C for the RTFO Aged Virgin and E & R Asphalt
Binders from US 63-1 Lab Mixes Containing 35% ABR by RAP..................................138 Figure A-43. Cole-Cole Plot Analyzed at 60°C for the RTFO Aged Virgin and E & R Asphalt
Binders from US 63-1 Lab Mixes Containing 35% ABR by RAP..................................139 Figure A-44. Black Diagram Analyzed at 60°C for the RTFO Aged Virgin and E & R Asphalt
Binders from US 63-1 Lab Mixes Containing 35% ABR by RAP..................................139 Figure A-45. Actual vs Extracted AC% using Different MMDMs for Field Mixes Constructed in
2016..................................................................................................................................141 Figure A-46. Temperature Sweep Test Results for the RTFO Aged Virgin and E & R Asphalt
Binders from MO 13-1 Field Mixes, Constructed in 2016, Containing 17% ABR by RAP and PG 64-22H Virgin Asphalt Binder ............................................................................142
Figure A-47. Master Curve Measured at 60°C for the RTFO Aged Virgin and E & R Asphalt Binders from MO 13-1 field mixes, constructed in 2016, containing 17% ABR by RAP and PG 64-22H virgin asphalt binder ..............................................................................143
Figure A-48. Cole-Cole Plot Analyzed at 60°C for the RTFO Aged Virgin and E & R Asphalt Binders from MO 13-1 Field Mixes, Constructed in 2016, Containing 17% ABR by RAP and PG 64-22H Virgin Asphalt Binder ............................................................................143
Figure A-49. Black Diagram Analyzed at 60°C for the RTFO Aged Virgin and E & R Asphalt Binders from MO 13-1 Field Mixes, Constructed in 2016, Containing 17% ABR by RAP and PG 64-22H Virgin Asphalt Binder ............................................................................144
Figure A-50. Temperature Sweep Test Results for the RTFO Aged Virgin and E & R Asphalt Binders from US 54 Field Mixes, Constructed in 2016, Containing Different Percentages of Recycled Materials and PG 58-28 Virgin Asphalt Binder ..........................................145
Figure A-51. Master Curve Measured at 60°C for the RTFO Aged Virgin and E & R Asphalt Binders from US 54 Field Mixes, Constructed in 2016, Containing Different Percentages of Recycled Materials and PG 58-28 Virgin Asphalt Binder ..........................................146
Figure A-52. Cole-Cole Plot Analyzed at 60°C for the RTFO Aged Virgin and E & R Asphalt Binders from US 54 Field Mixes, Constructed in 2016, Containing Different Percentages of Recycled Materials and PG 58-28 Virgin Asphalt Binder ..........................................146
Figure A-53. Black Diagram Analyzed at 60°C for the RTFO Aged Virgin and E & R Asphalt Binders from US 54 Field Mixes, Constructed in 2016, Containing Different Percentages of Recycled Materials and PG 58-28 Virgin Asphalt Binder ..........................................147
Figure A-54. Temperature Sweep Test Results for the RTFO Aged Virgin and E & R Asphalt Binders from US 54 Field Mixes, Constructed in 2016, Containing PG 64-22H Virgin Asphalt Binder .................................................................................................................148
Figure A-55. Master Curve Measured at 60°C for the RTFO Aged Virgin and E & R Asphalt Binders from US 54 Field Mixes, Constructed in 2016, Containing PG 64-22H Virgin Asphalt Binder .................................................................................................................148
Figure A-56. Cole-Cole Plot Analyzed at 60°C for the RTFO Aged Virgin and E & R Asphalt Binders from US 54 Field Mixes, Constructed in 2016, Containing PG 64-22H Virgin Asphalt Binder .................................................................................................................149
Figure A-57. Black Diagram Analyzed at 60°C for the RTFO Aged Virgin and E & R Asphalt Binders from US 54 Field Mixes, Constructed in 2016, Containing PG 64-22H Virgin Asphalt Binder .................................................................................................................149
Figure A-58. Temperature Sweep Test Results for the RTFO Aged Virgin and E & R Asphalt

xi
Binders from US 63-1 Field Mixes, Constructed in 2016, Containing PG 58-28 Virgin Asphalt Binder and 35% ABR by RAP ...........................................................................150
Figure A-0-59. Master Curve Measured at 60°C for the RTFO Aged Virgin and E & R Asphalt Binders from US 63-1 Field Mixes, Constructed in 2016, Containing PG 58-28 Virgin Asphalt Binder and 35% ABR by RAP ...........................................................................151
Figure A-60. Cole-Cole Plot Analyzed at 60°C for the RTFO Aged Virgin and E & R Asphalt Binders from US 63-1 Field Mixes, Constructed in 2016, Containing PG 58-28 Virgin Asphalt Binder and 35% ABR by RAP ...........................................................................151
Figure A-61. Black Diagram Analyzed at 60°C for the RTFO Aged Virgin and E & R Asphalt Binders from US 63-1 Field Mixes, Constructed in 2016, Containing PG 58-28 Virgin Asphalt Binder and 35% ABR by RAP ...........................................................................151
Figure A-62. The High PG Temperatures for the RTFO Aged Virgin and E & R Asphalt Binders from Different Field Mixes, Constructed in 2016 ...........................................................153
Figure A-63. MSCR Test Results Measured at 60°C for RTFO Aged Virgin and E & R Asphalt Binders from MO 13-1 Field Mixes, Constructed in 2016, Containing 17% ABR by RAP and PG 64-22H Virgin Asphalt Binder ............................................................................154
Figure A-64. MSCR Test Results Measured at 60°C for RTFO Aged Virgin and E & R Asphalt Binders from US 54 Field Mixes, Constructed in 2016, Containing Different Percentages of Recycled Materials and PG 58-28 Virgin Asphalt Binder ..........................................155
Figure A-65. MSCR Test Results, Measured at 60°C, for RTFO Aged Virgin and E & R Asphalt Binders from US 54 Field Mixes, Constructed in 2016, Containing PG 64-22H Virgin Asphalt Binder .................................................................................................................156
Figure A-66. MSCR Test Results Measured at 60°C for RTFO Aged Virgin and E & R Asphalt Binders from US 63-1 Field Mixes, Constructed in 2016, Containing PG 58-28 Virgin Asphalt Binder and 35% ABR by RAP ...........................................................................156
Figure A-67. Percentage Increase or Decrease in the %R Values for the Asphalt Binders E & R from Field Mixes Constructed in 2016 as Compared to the %R Values for the RTFO Aged Virgin Binders; the Measurements were Conducted at 60°C and 0.1 & 3.2 kPa Stress Levels ....................................................................................................................158
Figure A-68. Percentage Decrease in the Jnr Values for the Asphalt Binders E & R from Field Mixes Constructed in 2016 as Compared to the Jnr Values for the RTFO Aged Virgin Binders; the Measurements were Conducted at 60°C and 0.1 & 3.2 kPa Stress Levels .159
Figure A-69. Temperature Sweep Test Results for the RTFO Aged Virgin and E & R Asphalt Binders from MO 13-1 Field and Plant Mixes, Constructed in 2016, Containing PG 64-22H Virgin Asphalt Binder and 17% ABR by RAP ........................................................160
Figure A-70. High PG Temperatures for the E & R Asphalt Binders from MO 13-1 Field and Plant Mixes, Constructed in 2016, Containing PG 64-22H Virgin Asphalt Binder and 17% ABR by RAP ...........................................................................................................160
Figure A-71. Temperature Sweep Test Results for the RTFO Aged Virgin and E & R Asphalt Binders from US 54-6 Field and Plant Mixes, Constructed in 2016, Containing PG 58-28 Virgin Asphalt Binder and 31% ABR by RAP ................................................................161
Figure A-72. High PG Temperatures for the E & R Asphalt Binders from US 54-6 Field and Plant Mixes, Constructed in 2016, Containing PG 58-28 Virgin Asphalt Binder and 31% ABR by RAP....................................................................................................................162
Figure A-73. Temperature Sweep Test Results for the RTFO Aged Virgin and E & R Asphalt Binders from US 54-1 Field and Plant Mixes, Constructed in 2016, Containing PG 58-28

xii
Virgin Asphalt Binder and 33% ABR by RAS ................................................................163 Figure A-74. High PG Temperatures for the E & R Asphalt Binders from US 54-1 Field and
Plant Mixes, Constructed in 2016, Containing PG 58-28 Virgin Asphalt Binder and 33% ABR by RAS....................................................................................................................163
Figure A-75. Temperature Sweep Test Results for the RTFO Aged Virgin and E & R Asphalt Binders from US 63-1 Field and Plant Mixes, Constructed in 2016, Containing PG 58-28 Virgin Asphalt Binder and 35% ABR by RAP ................................................................164
Figure A-76. High PG Temperature for the E & R Asphalt Binders from US 63-1 Field and Plant Mixes, Constructed in 2016, Containing PG 58-28 Virgin Asphalt Binder and 35% ABR by RAP .............................................................................................................................165

xiii
List of Tables Table 2-1. Summary of SPS-10 Sections Investigated (W. G. Buttlar, Meister, et al., 2019) .........5 Table 2-2. Summary of Level 1 Projects Selected (W. G. Buttlar, Meister, et al., 2019) ...............5 Table 2-3. Summary of Level 2 Projects Selected (W. G. Buttlar, Meister, et al., 2019) ...............6 Table 2-4. Summary of Plant Mixtures Collected with Level 2, Regular Sampling Protocol
(Buttlar et al., 2019) .............................................................................................................7 Table 2-5. Summary of Plant Mixtures Collected with Level 1, Heavy Sampling Protocol ...........8 Table 2-6. Summary of Field Cores Collected for BMD Project (Buttlar et al., 2020) ...................9 Table 2-7. Stockpile Gradations (% passing) and Blending Proportions for Mix US63_1 ...........12 Table 2-8. Iterations of Mixture Modifications Applied to US63_1 Mixes ..................................13 Table 2-9. Details for US63_1_C Mix Iterations Compacted to 4.0+0.5% Air Voids ..................14 Table 2-10. Stockpile Gradations (% passing) and Blending Proportions for Mix US54_6 .........15 Table 2-11. Iterations of Modifications Applied to US54_6 Mixes (32% ABR by RAP) ...........16 Table 2-12. Details for US54_6 Mix Iterations Compacted to 4.0+0.5% Air Voids ....................16 Table 2-13. Details for First Round of Field Mix Sampling..........................................................21 Table 2-14. Details for Second Round Field Mix Sampling .........................................................23 Table 2-15. Plant-sampled Mix Details .........................................................................................25 Table 2-16. Simulated Lab Asphalt (‘Fix-the-Mix’) Details .........................................................26 Table 5-1. ANOVA Results for Actual and Extracted AC% for the Plant Mixes .........................38 Table 5-2. High PG Temperature for the E & R Asphalt Binders from the Plant Mixes and the
Corresponding RTFO Aged Virgin Asphalt Binders.........................................................40 Table 8-1 Summary of ABR Levels, Binder Grades, and Comparison to New Recommendations
for Investigated Mixtures Subjected to Binder testing on E&R Samples ..........................80 Table 8-2 Recommended Starting Points for Binder Selection, Use of Rejuvenators and GTR for
Designing Recycled Mixtures in Missouri ........................................................................82 Table A -1. ANOVA Results for the Actual and Extracted AC% for the US 54-6 and US 63-1
Field, Plant, and Lab Mixes .............................................................................................121 Table A-2. ANOVA Results for the Actual and Extracted AC% for the Field Mixes Constructed
in 2016 .............................................................................................................................142 Table A-3. Connecting Letters Report using the Tukey HSD Test .............................................142

xiv
List of Abbreviations AASHTO American Association of State Highway and Transportation Officials ABR Asphalt Binder Replacement AC Asphalt Concrete ANOVA Analysis of Variance ARAN Automatic Road Analyzer ASTM American Society for Testing Materials BBR Bending Beam Rheometer BMD Balanced Mix Design CMOD Crack Mouth Opening Displacement CRM Crumb Rubber Modifier DC(T) Disc-Shaped Compact Tension Test DOT Department of Transportation FI Flexibility Index FTIR Fourier Transform Infrared GTR Ground Tire Rubber HMA Hot Mix Asphalt HWTT Hamburg Wheel Tracking Test LAS Linear Amplitude Sweep LTPP Long-Term Pavement Performance IDEAL-CT Indirect Tensile Asphalt Cracking Test JMF Job Mix Formula MoDOT Missouri Department of Transportation MMDM Mineral Matter Determination Methods MSCR Multiple Stress Creep Recovery NAPA National Asphalt Pavement Association MAPA Missouri Asphalt Pavement Association NCAT National Center for Asphalt Technology NMAS Nominal Maximum Aggregate Size PAV Pressure Aging Vessel PMS Pavement Management System RAP Recycled Asphalt Pavement RAS Recycled Asphalt Shingles RTFO Rolling Thin-Film Oven SCB Semi-Circular Bending Test SGC Superpave Gyratory Compactor VMA Voids in the mineral aggregate WMA Warm Mix Asphalt

xv
EXECUTIVE SUMMARY
A comprehensive research investigation was carried out to investigate the use of recycled
materials in Superpave asphalt mixtures in Missouri (MoDOT project TR201807). The
investigation involved sampling of aggregates, binders, plant-produced mixtures, and field cores
followed by a rigorous lab testing program. Lab testing included an extensive binder extraction
and recovery (E & R) experiments, followed by a comprehensive suite of advanced binder tests.
An attempt was made to shed light on effective strategies to iterate existing mix designs into
more ‘balanced mix designs’ for modern, heterogeneous recycled mixtures in the Midwest.
Different strategies were employed, such as the use of a softer virgin binder, the addition of a
rejuvenator, and the employment of 5% to 20% of dry-process, engineered crumb rubber by weight
of total binder. These mixes were subjected to a suite of cracking and rutting mixture performance
tests to establish baseline performance, followed by four additional mix design iterations per mix
(for a total of 10 investigated mixtures). The DC(T), I-FIT, IDEAL-CT, and Hamburg wheel
tracking tests were used in the performance testing suite.
A summary of the conclusions reached in the study include:
• For plant mixes, the highest resistance to rutting was observed for asphalt binders E
& R from mixes containing RAS.
• The use of a rejuvenator actually increased the stiffness of the E & R asphalt binders.
It is therefore believed that the rejuvenator increased the contribution or blending of
recycled and virgin binders.
• Engineered crumb rubber (ECR) increased the E & R asphalt binder resistance to
rutting by increasing the stiffness and elasticity.
• The use of softer virgin asphalt binders in recycled mixes containing high ABR
facilitated the E & R process. It was noted that softer binders produced more accurate
and less variable extracted AC percentages. The same results were observed for
mixes containing Evoflex rejuvenator. The use of Evoflex in mixes containing
recycled materials appeared to enhance the contribution of the recycled materials in
these mixes, i.e., enhanced the interaction process between the binders from the
recycled materials with the virgin asphalt binder.

xvi
• In the mixture performance balancing portion of the study, otherwise known as the
‘fix-the-mix’ experiments, the following conclusions were drawn:
o The strategy of replacing the base binder with a softer virgin binder grade was
generally effective in both investigated mixtures (US63_1 and US54_1).
o In this study, the addition of a rejuvenator was not as effective as the other
strategies investigated. However, the use of a rejuvenator served the purpose
of helping achieve desirable volumetric properties in the mixtures, likely by
increasing the lubricity/workability of the mixtures.
o Engineered crumb rubber was introduced via a dry process in an attempt to
further improve the cracking and rutting performance of the mixtures. The
results showed that the DC(T) fracture energy test disagrees with the results
obtained from the SCB (I-FIT) and IDEAL CT-index when GTR was
introduced into the study mixtures. The use of rubber up to 20% increased the
fracture energy of mixtures significantly (almost doubled), while the FI and
CT-index scores were significantly reduced. This is somewhat counter-
intuitive as field results suggest that rubber modification provides cracking
resistance benefits to asphalt mixtures in the field, even under extreme
environments and loading conditions. In terms of rutting, the addition of
rubber increased the rutting resistance of the mixtures.
Evaluating BMD optimization as a whole, the use of a softer binder was the most effective
strategy to optimize SCB(I-FIT) and IDEAL CT cracking test scores, while the incorporation of
rubber along with a softer base binder and supplemental binder was the most effective method to
maximize DC(T) fracture energy test results. In all cases, modern recycled mixtures appear to
have a significant factor of safety against rutting, which suggests the increasing importance of
softer virgin binder grades and effective rejuvenators and the importance of accessing these
materials without greatly increasing asphalt mixture costs.
Based on the findings and conclusions of this study, the following recommendations are made:
• For binder E & R, it is recommended to use the centrifuge MMDM if the filterless
centrifuge device is available.

xvii
• The practice of recommending or requiring a softer virgin binder grade when recycled
materials are used should be continued, even as BMD is rolled out. A simple table was
developed to assist mix designers in this regard.
• When designing with very stiff recyclates, such as highly weathered RAP sources,
RAS or waste plastic, it may be necessary to apply a weight factor to the stiffer
recyclates. Current MoDOT specifications recommend that for mixes containing both
RAP and RAS, the ABR should be computed as the ABR by RAP plus 2 times the
ABR by RAS. A similar weight factor may be necessary as waste plastic mixtures are
introduced. Recommendations for rejuvenator and GTR use were also provided.
• The use of GTR can increase mixture sustainability, while helping to meet
performance test results. Depending on the cracking test selected, it may also be
necessary to select a very soft binder and to increase binder content in the mix
containing GTR, through the use of supplemental binder, increasing mixture VMA
and/or regressing air void targets. For the dry-process GTR product studied herein,
0.1% supplemental binder is suggested by the manufacturer for each 5% of rubber
used by weight of virgin binder.
• Attention should be paid to the availability of softer virgin binder supply in Missouri.
As these recommendations are implemented, and as BMD is rolled out, the current
supply of softer virgin binders may fall short of demand. A staged rollout of BMD
may serve to provide a smooth transition.
• When designing at higher ABR levels and/or when using stiff recyclates, additional
strategies may be required beyond virgin binder grade softening and rejuvenator use.
These include:
o Regressing air void targets below the typical 4% target associated with
Superpave, to lower levels such as 3.5%, 3.0%, or perhaps even 2.5%.
o Use of increased VMA targets.
o Transforming older mix designs to meet newer BMD requirements will
generally require building additional crack resistance into the mix. To save
time, it is recommended to iterate mix designs initially by focusing on cracking

xviii
test results conducted with one or two test replicates, then introducing the
Hamburg test and additional cracking test replicates only when a mix design is
reached with a comfortable margin above the design cracking test requirement
threshold.
• Experiment with different combinations and quantities of rejuvenators, anti-strip, and
warm-mix additives.
• Failing to meet Hamburg requirements due to a mix that shows an inflection followed
by a rapid increase in wheel track rut depth might require adjustments to improve
moisture resistance, a better aggregate skeleton and/or a stiffer binder system (perhaps
including more recycled material). A stripping inflection in the Hamburg test can
result from a true stripping failure, plastic deformation in the mix or a combination of
the two.
The movement towards increased sustainability in asphalt mixtures will require continued
balancing of increased recycled material usage, mixture durability, and mixture economics. Major
sacrifices in one or more of these three categories will not truly lead to long-term, sustainable
solutions. Finally, this study highlights the significant challenges confronting the industry with
respect to the need for even softer base binder supplies and a broad slate of effective rejuvenators,
tailored to binders and aggregates with differing chemical characteristics.

1
1. INTRODUCTION
1.1. Background
The use of RAP in hot-mix asphalt (HMA) decreases the construction cost, reduces material
transportation costs, and promotes sustainability. Aged binder in RAP is stiffer, which yields mixes
with poor low temperature (LT) cracking and workability characteristics. To rectify these
deficiencies, researchers and practitioners have tried methods such as the use of softer fresh
bitumen, warm mix asphalt (WMA) additives, rejuvenators, and crumb rubber. On the other hand,
hundreds-of-millions of scrap tires can be found stockpiles in the United States, leading to an
ample supply of potentially recyclable ground tire rubber (GTR). Also, over ten million tons of
tear-off roofing shingles are currently stockpiled, creating the potential for large-scale recycling
of recycled asphalt shingles (RAS). Recycling these materials in asphalt pavements is a potentially
sustainable solution and can often yield performance benefits if used correctly. However, a lack of
scientific test results and effective tests, especially to evaluate new products and manufacturing
processes, and a lack of clear quantification of costs vs. benefits impedes implementation by state
transportation agencies and industry. There is a particular lack of literature and research experience
with regards to newer ground tire rubber (GTR) asphalt products and their use in the Midwest.
Adjustments to mix design procedures, particularly for those containing recycled asphalt shingles
(RAS), also need to be studied. This project involved research collaboration between the
University of Missouri Columbia, University of Missouri S&T, and the Missouri Department of
Transportation (MoDOT), and the Missouri Asphalt Paving Association (MAPA). A laboratory
and field investigation of modern asphalt rubber products, RAP, RAS, and rejuvenators available
in the Midwest was conducted. Investigations included both asphalt binder and mixture
performance characterization, including materials sampled from the field projects.
1.2. Research Motivation
According to the results of a previous, related project (Buttlar et al., 2019), recycled Superpave
mixtures in Missouri were not falling in line with newer, balanced mix design performance test
criteria. Almost across-the-board they were prone to cracking, but highly resistant to rutting. This
was also observed during on-site coring visits and by reviewing data in MoDOT’s pavement

2
management system (as collected by ARAN pavement inspection vehicles). Therefore, an
opportunity existed to investigate the steps needed to evaluate and transform previously designed
Superpave mixtures in Missouri towards more balanced designs, i.e., those that strike a better
balance between cracking and rutting performance. A robust collection of plant-sampled and field-
cored materials also presented an opportunity to conduct an extensive binder extraction and
recovery study, to provide additional clues towards the achievement of more balanced mixes with
recycled materials. Towards these ends, several key research questions needed to be answered,
including:
- How can asphalt mixture cracking performance be improved before resorting to changing
aggregate structure and recycling content? What are the most effective strategies?
- Is there any correlation between the mixture and binder test results, and what deeper
knowledge about mix balancing and optimization can be gained by examining both data sets?
- How do recycled binders interact with virgin binders? What role do rejuvenators play in this
process?
- Can a simple set of best practice recommendations be developed to aid practitioners in
balancing their current and future mix designs as MoDOT BMD specifications evolve and reach
the full implementation stage?
1.3. Research
The work conducted herein was carried out under MoDOT research project number
TR201811, “Understanding and Improving Heterogeneous, Modern Recycled Asphalt Mixes.”
Six main tasks were conducted in this study, including:
• Literature review
• Experimental design
• Mixture testing focused on re-balancing recently placed MoDOT mixes
• Extraction, recover, and testing of binders from recently placed MoDOT mixes
• Data analysis and correlation
• Best practice recommendation development

3
The mixture tests conducted include:
- High temperature: Hamburg wheel tracking testing (submerged)
- Intermediate temperature: I-FIT Flexibility index testing (FI)
- Intermediate temperature: IDEAL cracking test index (CT)
- Low temperature fracture: DC(T) fracture energy (Gf)
Binder tests were performed at University of Missouri S&T on recovered binder from mixture
cracking performance test samples collected from the MAPIL lab at the University of Missouri-
Columbia, along with virgin binder collected from mix producers in a previous research project.
The key steps involved in the binder portion of the study included:
- Extraction of asphalt binder from mix specimens
- Recovery of binder from binder-solvent solution
- Short-term aging of virgin asphalt binders
- Evaluation of rheological properties for virgin and recovered binders
Once mixture and binder testing were complete, correlations between binder and mixture
properties were studied, and finally, best practice recommendations were developed by the
research team.
1.4. Technology Transfer
In addition to the project quarterly and final reports, PowerPoint style presentation materials
were assembled in preparation for presentations at technical meetings and/or webinar events. At
the time of this writing, portions of the study materials have been reviewed at joint meetings held
between the Missouri Department of Transportation and the Missouri Asphalt Pavement
Association. A journal paper has been prepared (Majidifard et al., to be submitted), with others
planned after the publication of this report. Preliminary results have been used in support of the
fine tuning of newly developed BMD asphalt specifications in Missouri.

4
2. MATERIAL SAMPLING AND PROCESSING
2.1. Asphalt Mixtures Investigated Based on the project proposal and further consultation with MoDOT, a total of 18 projects
were selected for sampling and testing in this study. Wherever possible, existing sampled plant
materials and cores from previous projects sponsored by MoDOT were utilized. These include
samples produced during research projects TR201712 (Buttlar et al., 2019) and TR201811
(Buttlar et al., 2020),with the former project focusing on recycled asphalt mixtures and the latter
focusing on balanced mix design and mixture performance testing. Selected materials from these
studies were used to produce new recycled mixture formulations in an effort to transform the
mixes toward higher performance, e.g., achieving cracking and rutting performance test scores
akin to modern BMD specifications. Towards this end, an effort was made to select mixtures
encompassing the following factors:
• New vs. older projects
• Good and poor performers
• Range of recycled materials and additives, i.e., RAP, RAS, GTR, Rejuvenator, Polymer
• Geographic distribution across Missouri, balanced against a concentration of a
majority of projects around the center of the state to reduce sample transportation costs
• Heavy sampling (coring plus plant and paver sampling), to enable future testing and
testing of reconstituted lab mixes, vs. light sampling for economy (coring only)
In previous studies, two levels of sampling were performed: Level 1 (heavy sampling) and
Level 2 (light sampling). A total of 4 Level 1 projects were selected, along with 14 Level 2
projects, for a total of 16 projects (W. G. Buttlar, Meister, et al., 2019). These included a number
of Long Term Pavement Performance (LTPP) Special Pavement Sections (SPS-10), which were
constructed in the fall of 2016. These sections were placed on the southbound driving lanes of
US54 just north of Osage Beach, MO. The asphalt contractor for the job was Magruder Paving,
LLC, who utilized a drum-mix plant located near the intersection of Lakeside Rd. and US54,
near Lakeland, MO, and incorporated aggregates from nearby quarries. While the focus of the

5
SPS-10 project was on warm-mix techniques, the project contained a robust collection of RAP,
RAS, and rejuvenator combinations, as shown in Table 2-1.
After consultation with MoDOT, it was decided to focus all 16 projects on medium
traffic volume facilities, which are dense-graded mixtures designed using Superpave principles.
(Tables 2-2 and 2-3). Two-of-the-four Level 1 projects were part of the SPS-10 project in Osage
Beach, while the other two were located on US63 near Moberly, MO, and US13 near Clinton,
MO. The main recycling variable missing from the projects selected was GTR. It was therefore
decided that the effects of GTR, virgin binder grade, and rejuvenator quantity would be
investigated as means to balance selected Missouri Superpave mixes that were developed and
placed in service prior to the current movement towards full BMD implementation.
Table 2-1. Summary of SPS-10 Sections Investigated (W. G. Buttlar, Meister, et al., 2019)
Test Section APPROX. TONS MIX DESIGN AC MOD1 MOD2 291001 500 SP125 16-83 PG64-22H 291003 500 SP125 16-100 PG64-22H 291002 500 SP125 16-93 PG64-22H EVO M1 291004 460 SP125 16-84 PG64-22H 291008 480 SP125 16-99 PG64-22H FLEX 291005 290 SP125 16-91 PG58-28 291007 680 SP125 16-89 PG58-28 291009 970 SP125 16-98 PG58-28 291010 360 SP125 16-95 PG46-34 291006 400 SP125 16-94 PG58-28 PC2106 IPC70
Table 2-2. Summary of Level 1 Projects Selected (W. G. Buttlar, Meister, et al., 2019) Section
Short Label Job No County Route /Dir Location Total
%ABR %ABR by RAP
%ABR by RAS Misc.
MO13_1 J7P3010 Henry MO 13 NB S. of Clinton 16.6 16.6 0
1.5% Bag House Fines + 0.5% Mlife*
T280
US54_6 J5P3131 mainline Miller US 54
NB N. of Osage Beach 30.7 30.7 0 1% Mlife T280
US54_1 J5P3131 sect 10 Miller US 54
SB N. of Osage Beach 33 0 33
2.5% IPC-70 +3.5% PC
2106 + 1.5%Mlife T280
US63_1 J2P2213 Randolph US 63 SB S. of Moberly 35.2 35.2 0
0.5% IPC-70 +1.75% PC
2106 + 1.5%Mlife T280
*MORLIFE branded rejuvenator product

6
Table 2-3. Summary of Level 2 Projects Selected (W. G. Buttlar, Meister, et al., 2019)
Section Short Label
Job No County Route /Dir Location Total
%ABR
%ABR by
RAP
%ABR by
RAS Misc.
US63_2 J2P0773 SBL Macon US 63
SB N of Macon, near LaPlata 29.9 19.9 10
1.5% Bag House Fines + 0.5% AD-
here HPPLUS
US54_3 J5P3131 sect7 Miller US 54 Osage Beach 33.1 17.9 15.2 1% Mlife*
T280
US54_5 J5P3131 sect4 Miller US 54 Osage Beach 0 0 0 1% Mlife
T280
US54_4 J5P3131 sect5 Miller US 54 Osage Beach 34.7 34.7 0
3% PC 2106, 1%
MORLIFE T280
US54_2 J5P3131 sect8 Miller US 54 Osage Beach 33.2 33.2 0 1% Mlife
T280 US50_1 J5P0961 Moniteau/Morgan US 50 Tipton 24.6 24.6 0 1% Lime
SPS10_1 J5P3131 Sect1 Miller US 54
SB N. of Osage
Beach 23.6 23.6 0 1% Mlife T280
SPS10_2 J5P3131 Sect2 Miller US 54
SB N. of Osage
Beach 24.5 24.5 0 1% Mlife T280
MO52_1 J5P0925 Morgan MO 52 Versailles 33.5 0 33.5
1.5% BHF, 0.8%Adhere
HP+
US54_7 J5P0769 Cole US 54 WB Brazito 0 0 0 0.25% LOF
65-00LS1
US54_8 J5D0600A Cole US 54 S of Jeff City 8.6 8.6 0 0.5% AD-here HP PLUS
SPS10_9 J5P3131 Sect9 Miller US 54
SB N. of Osage
Beach 45.6 15.7 29.9 2% Mlife T280
*MORLIFE
Additional details regarding project location and core locations can be found in Buttlar et
al. (2019). Five existing pavement sections constructed prior to 2016 were selected for coring and
field performance history investigation., as indicated by the shaded cells in Table 2-4, shown
alongside selected plant sampled mixtures introduced earlier. Table 2-6 presents five additional
mixtures sampled during the recently completed balanced mix design study (Buttlar et al., 2020),
which were included for evaluation in the current study based upon their diversity in recycled
material type and contents, including one virgin mix.

7
Table 2-4. Summary of Plant Mixtures Collected with Level 2, Regular Sampling Protocol (Buttlar et al., 2019)
Cons. Year Section
ABR9 % Total Pb10
% Virgin Binder Modifier(s) NMAS (mm) %RAP %RAS
1 2016 MO13_1 (17-17-0) 24 0 5.7 PG64-22 H11 Type 11:0.5% 9.5
2 2016 US63_1 (35-35-0) 35 0 5.1 PG58-28 Type 22:0.5% + Type
33:1.75% 12.5 3 2016 US54_6 (31-31-0) 31 0 5.1 PG58-28 Type 1:1% 12.5
4 2016 US54_1 (33-0-33) 0 33 5.2 PG58-28 Type 44:2.5% + Type 55:3.5%
+ Type 1:1.5% 12.5
5 2011 US50_1 (25-25-0) 25 0 4.5 PG64-22 Type 66:1.5% + Type 77:1% 12.5 6 2010 MO52_1 (34-0-34) 0 34 4.8 PG64-22 Type 6: 1.5%, Type 7:0.8% 12.5 7 2008 US63_2 (30-20-10) 20 10 5.6 PG64-22 Type 6: 1.5% + Type 7: 0.5% 12.5 8 2016 US54_2 (33-33-0) 33 0 5.3 PG58-28 Type 1: 1% 12.5 9 2016 US54_3 (33-18-15) 18 15 5.2 PG58-28 Type 1: 1% 12.5
10 2016 US54_4 (35-35-0) 35 0 4.8 PG64-22 H Type 5:3% + Type 1:1% 12.5 11 2016 US54_5 (0-0-0) 0 0 5.4 PG64-22 H Type 1: 1% 12.5
12 2003 US54_7 (0-0-0) 0 0 6.2 PG64-22 Type 88: 0.25% 12.5 13 2006 US 54_8 (9-9-0) 9 0 5.6 PG70-22 Type 7: 0.5% 12.5 14 2016 SPS10-1 (24-24-0) 24 0 5.2 PG64-22 H Type 1:1% 12.5 15 2016 SPS10-2 (25-25-0) 25 0 5 PG64-22 H Type 1:1% 12.5 16 2016 SPS10-3 (25-25-0) 25 0 5 PG64-22H Type 1:1% + Type 2: 0.5% 9.5 17 2016 SPS10-6 (17-0-17) 0 17 5.4 PG58-28 Type 1: 1% 9.5 18 2016 SPS10-9 (46-16-30) 16 30 5.3 PG46-34 Type 1: 2% 12.5
1. Type 1. Anti-stripping agent ('Morelife T280') 7. Type 7. Anti-stripping agent (‘AD-here HP Plus’)2. Type 2. Warm-mix additive (‘Evotherm’) 8. Type 8. Anti-stripping agent (‘LOF 65-00LS1’)3. Type 3. Rejuvenator additive (‘EvoFlex CA’) 9. ABR = Asphalt binder replacement 4. Type 4. Anti-stripping agent (‘IPC-70’) 10. By total mass of binder, including neat and recycled 5. Type 5. Warm-mix additive (‘PC 2106’) 11. Heavy traffic designation (from MSCR test) 6. Type 6. Bag house fines

8
Table 2-5. Summary of Plant Mixtures Collected with Level 1, Heavy Sampling Protocol
No. Cons. Year Section
ABR9 % Total Pb
10 % Virgin Binder Modifier(s) NMAS
(mm) %RAP %RAS
1 2016 MO13_1 (17-17-0) 17 0 5.7 PG64-22 H11 Type 11:0.5% 9.5
2 2016 US63_1 (35-35-0) 35 0 5.1 PG58-28 Type 22:0.5% + Type 33:1.75% 12.5
3 2016 US54_6 (31-31-0) 31 0 5.1 PG58-28 Type 1:1% 12.5
4 2016 US54_1 (33-0-33) 0 33 5.2 PG58-28 Type 44:2.5% + Type 55:3.5% + Type 1:1.5% 12.5
1. Type 1. Anti-stripping agent ('Morelife T280') 7. Type 7. Anti-stripping agent (‘AD-here HP Plus’)
2. Type 2. Warm-mix additive (‘Evotherm’) 8. Type 8. Anti-stripping agent (‘LOF 65-00LS1’)
3. Type 3. Rejuvenator additive (‘EvoFlex CA’) 9. ABR = Asphalt binder replacement
4. Type 4. Anti-stripping agent (‘IPC-70’) 10. By total mass of binder, including neat and recycled
5. Type 5. Warm-mix additive (‘PC 2106’) 11. Heavy traffic designation (from MSCR test)

9
Table 2-6. Summary of Field Cores Collected for BMD Project (Buttlar et al., 2020)
Route Cons. Year Section
Virgin Binder grade
Total Asphalt Content
(%)
ABR (%)
ABR (%) by RAP
ABR (%) by RAS
NMAS (mm)
0 2014 MO 151 PG64-22 4.7 30.6 15.9 14.7 12.5
1 2011 US 36 E PG64-22 5.1 24.7 24.7 0 12.5
2 2010 US 54 E PG70-22 5.7 11.8 11.8 0 12.5
3 2005 MO 94 PG64-22 5.6 0 0 0 12.5
4 2015 MO 6 W PG58-28 5.9 29.6 29.6 0 4.75
5 2013 US 61 N PG64-22H 5.3 29.6 29.6 0 9.5
2.2. Selection of Mixtures for ‘Fix-the-Mix’ Study Task
For the detailed BMD mixture adjustment study conducted herein (‘fix-the-mix’ study), two
baseline mixture designs from sampled field sections were chosen. The first section sampled was
placed on the southbound lanes of US Route 63 in Randolph County near Moberly, MO, and is
hereby referred to as US63_1. The second section was a mainline mix placed adjacent to recently
installed Long-Term Pavement Performance (LTPP) test sections on US route 54 in Camden and
Miller Counties near Eldon, MO. This test section is hereby referred to as US54_6.
The guiding principles used in the fix-the-mix research task included:
• A baseline asphalt mixture design was adopted, which followed the Superpave volumetric
design principles used in Missouri
• Keeping the aggregate gradation/system intact, various modifications were applied to the
mixture designs to achieve a superior and/or more balanced mix in terms of rutting and
cracking behavior
• Multiple cracking tests were employed (DC(T), I-FIT, and IDEAL), while only a single
rutting test (Hamburg was used)
• The modifications included replacing the base binder with a softer grade binder, adding a
rejuvenator to the base mix, and/or adding various percentages of recycled ground tire
rubber (GTR) to the mix via the dry-process method. The use of GTR was motivated by a
recent study, which provided new insights regarding the toughening mechanisms resulting
in properly designed GTR mixes, such as macro-scale crack pinning.
10
• The goal of the study was not to pursue an exhaustive, full-factorial exploration of additive
dosage rates, various combinations, etc., rather; a systematic approach towards achieving
a more balanced mix design in the fewest possible iterations was employed, akin to the
exercise a contractor might pursue when implementing BMD for the first time
• When dry-process GTR was used, supplemental binder was also automatically used
following the manufacturer’s recommendation, i.e., for each 5% of GTR by weight of
binder used, an additional 0.1% of supplemental virgin binder was added to the mix
• Performance test thresholds were based on recommendations provided in (Buttlar et al.,
2020)
• Mixes were adjusted in an attempt to strike a better balance between recommended DC(T)
and HWTT cracking thresholds and then the same mixture iterations were tested in the
IFIT and IDEAL cracking tests so that differences in strategies for maximizing scores in
the various cracking tests could be studied
• Although out of the scope of the current study, mixes could be re-optimized using the IFIT
and/or IDEAL tests to set cracking test thresholds based on the findings of this study
The following sections introduce the performance tests adopted in this project and then detail the
mix designs used in this study.
2.3. Mix Designs Used in the ‘Fix-the-Mix’ Study Task
The first MoDOT mix investigated (US 63_1) was a 12.5mm NMAS dense-graded mixture,
using four aggregate sources: two coarse aggregate sources collected from Burlington and Cedar
Valley, MO, respectively, a manufactured sand collected from Cedar Valley, MO, and finally a
RAP source with 4.5% asphalt content, creating an asphalt binder replacement (ABR) level of
33.3%. The mix used a base binder graded as Superpave PG58-28 as supplied from the Philips 66
refinery in Kansas City, MO. The base mix design contained Evotherm J12 (0.5% by weight of
binder) and Evoflex CA (1.75% by weight of binder). The mixtures in this study were prepared
using a standard bucket mixer, where aggregates and binder were heated in a forced-draft oven
before being mixed. Evoflex and Evotherm additives were stirred into the binder before mixing
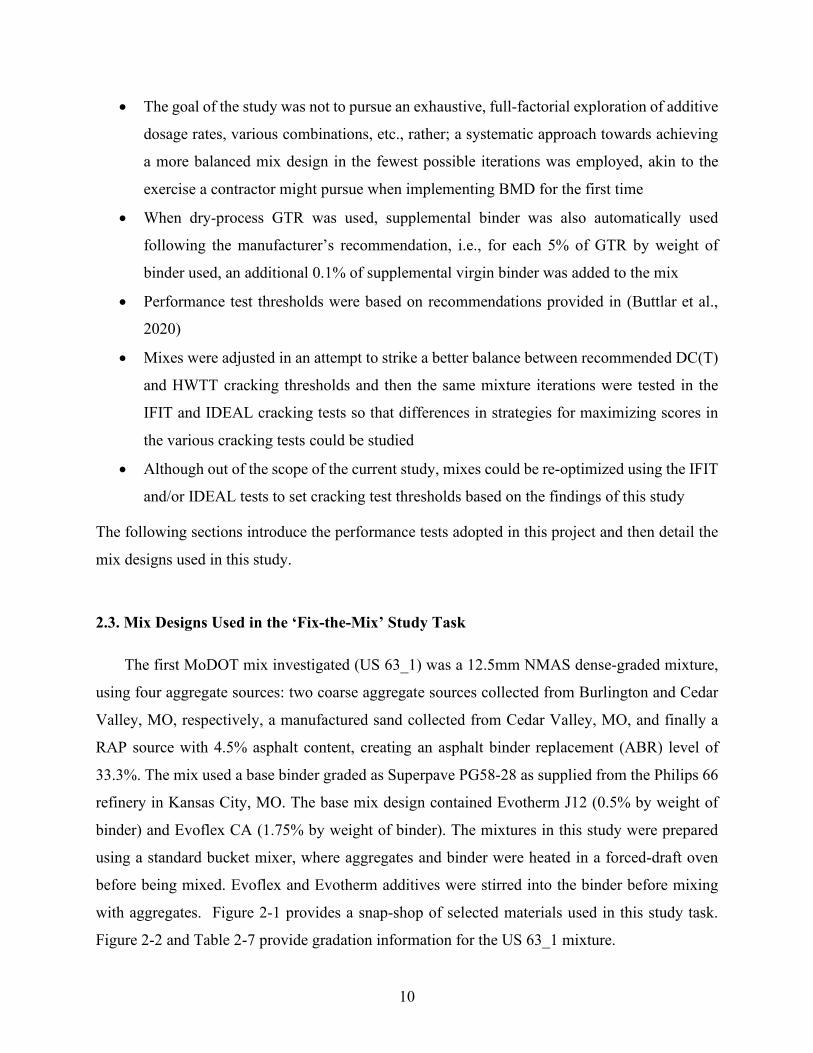
with aggregates. Figure 2-1 provides a snap-shop of selected materials used in this study task.
Figure 2-2 and Table 2-7 provide gradation information for the US 63_1 mixture.

11
Figure 2-1. Laboratory Materials Including Virgin Aggregates, RAP, Virgin Binder, Rejuvenators, Additives and Ground-Tire Rubber
Figure 2-2. Gradation of US63_1 Superpave Mixture
12
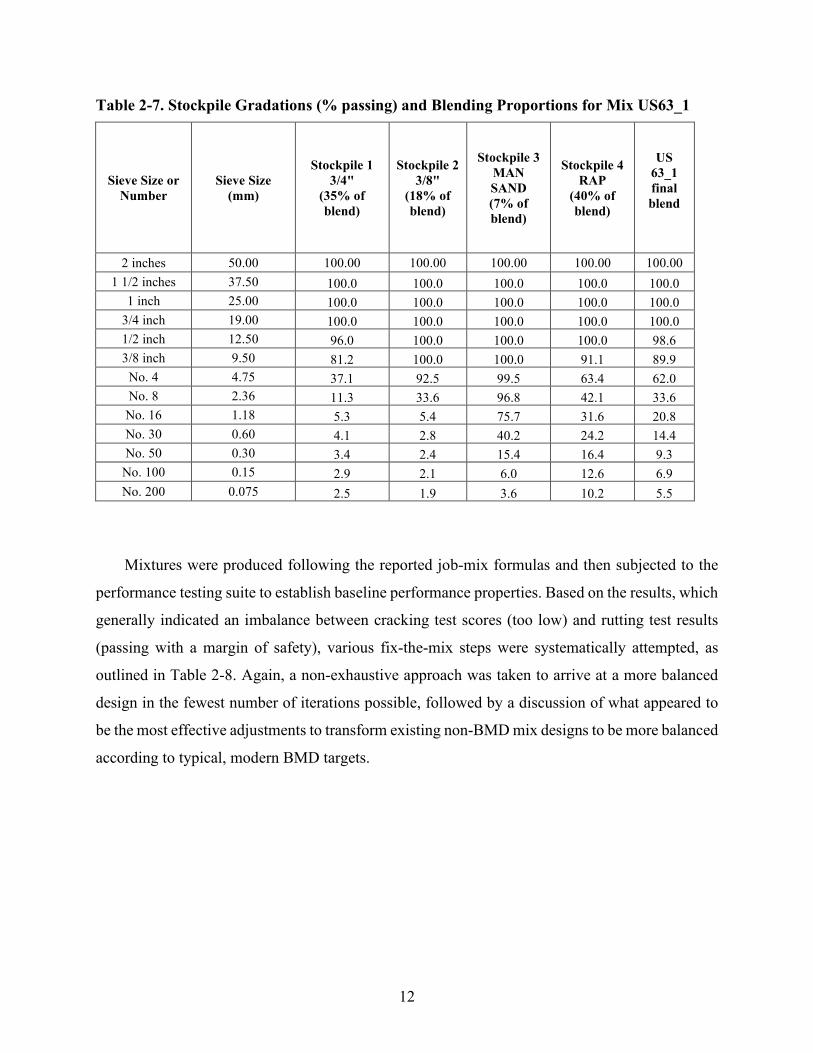
Table 2-7. Stockpile Gradations (% passing) and Blending Proportions for Mix US63_1
Sieve Size or Number
Sieve Size (mm)
Stockpile 1 3/4"
(35% of blend)
Stockpile 2 3/8"
(18% of blend)
Stockpile 3 MAN SAND (7% of blend)
Stockpile 4 RAP
(40% of blend)
US 63_1 final blend
2 inches 50.00 100.00 100.00 100.00 100.00 100.00 1 1/2 inches 37.50 100.0 100.0 100.0 100.0 100.0
1 inch 25.00 100.0 100.0 100.0 100.0 100.0 3/4 inch 19.00 100.0 100.0 100.0 100.0 100.0 1/2 inch 12.50 96.0 100.0 100.0 100.0 98.6 3/8 inch 9.50 81.2 100.0 100.0 91.1 89.9
No. 4 4.75 37.1 92.5 99.5 63.4 62.0 No. 8 2.36 11.3 33.6 96.8 42.1 33.6
No. 16 1.18 5.3 5.4 75.7 31.6 20.8 No. 30 0.60 4.1 2.8 40.2 24.2 14.4 No. 50 0.30 3.4 2.4 15.4 16.4 9.3
No. 100 0.15 2.9 2.1 6.0 12.6 6.9 No. 200 0.075 2.5 1.9 3.6 10.2 5.5
Mixtures were produced following the reported job-mix formulas and then subjected to the
performance testing suite to establish baseline performance properties. Based on the results, which
generally indicated an imbalance between cracking test scores (too low) and rutting test results
(passing with a margin of safety), various fix-the-mix steps were systematically attempted, as
outlined in Table 2-8. Again, a non-exhaustive approach was taken to arrive at a more balanced
design in the fewest number of iterations possible, followed by a discussion of what appeared to
be the most effective adjustments to transform existing non-BMD mix designs to be more balanced
according to typical, modern BMD targets.

13
Table 2-8. Iterations of Mixture Modifications Applied to US63_1 Mixes
Type Softer binder Rubber Rejuvenator
US 63_1_C (Control) PG 58-28 (no change) 0 1.75% Evoflex
0.5% Evotherm
US 63_1_46_R PG 46-34 0 1.75% Evoflex 0.5% Evotherm
US 63_1_46 PG 46-34 0% No
US 63_1_46_E10 PG 46-34 10% No
US 63_1_46_E20 PG 46-34 20% No
Volumetrics for all mix iterations based on this blend are shown in Table 2-9. All mixtures
were compacted to 80 gyrations in the Superpave Gyratory Compactor (SGC). As part of driving
towards more balanced mixes, the traditional Superpave method of designing at 4% air voids
design was relaxed, as modern BMD principles do not typically require strict adherence to a 4%
air void target. Also, for comparison purposes, only one factor was altered between experimental
trials. For instance, when a softer binder was used, other factors such as binder content were kept
constant. In terms of ingredient compatibility, none of the mixtures appeared to have a problem
except in the trial labeled as US63_1_46, wherein a softer binder was used without the use of warm
mix additives. The final air void level after 80 gyrations for mix US63_1_46 was 5.6%, which was
significantly higher than the reference MoDOT mix originally designed at 4% air voids. The
reference mix was in fact found to possess an average of 4.4% voids for the plant materials sampled
and produced in this study. This finding clearly indicated the positive effect of warm mix additives
in terms of the compactability of modern, recycled asphalt mixtures. It is hypothesized that a
combination of factors, including recycled binder softening/reincorporation as a fully liquid phase,
lubricity characteristics imparted by the WMA additive, and/or a net reduction in mastic stiffness
at mixing and compaction temperatures were likely driving the observed improvements in recycled
mix compaction.

14
Table 2-9. Details for US63_1_C Mix Iterations Compacted to 4.0+0.5% Air Voids
Mix Name US 63_1_C US63_1_46
US63_1_46_R
US63_1_46_E10
US63_1_46_E10
Binder Used PG 58-28 PG 46-34 PG 46-34 PG 46-34 PG 46-34 Total Binder % 5.1 5.1 5.1 5.3 5.5
Virgin Binder % 3.4 3.4 3.4 3.6 3.8 ABR % 33.3 33.3 33.3 32.1 30.9 Gmm 2.455 2.460 2.458 2.438 2.425 Va % 4.4 5.6 4.4 4.5 3.9
Va % for performance tests 7 6.9 6.9 6.8 6.7
VMA 14.1 16.5 15.4 16.2 16.2 VFA 72 65.8 71.6 72.2 75.3
The other mix design (US54_6) was also a 12.5 NMAS dense-graded mixture, placed as an
LTPP research section on US 54 in Camden County, near Eldon, MO. The mix used four stockpiles
consisting of: coarse aggregates having NMAS levels of ¾” and ½” (with 8 and 7% chert
respectively), collected from Gasconade, Missouri; manufactured sand collected from the vicinity
of Osage River and finally; a RAP source with 5.1% asphalt leading to an asphalt binder
replacement (ABR) level of about 30%. Mix gradation details are provided in Figure 2-3 and Table
2-10. The mix incorporated the same base binder as the first mix (PG58-28 collected from the
Philips 66 refinery in Kansas City, MO).
Table 2-11 shows the modifications applied to the baseline mix to eventually achieve the
required BMD test thresholds. Three variables were selected to be altered during this phase of the
study- the use of a softer binder grade (PG46-34), the addition of rejuvenator (3% Evoflex CA),
and the addition of dry-process rubber (levels of 5% and 20% GTR by weight of virgin binder
were used). For the mixes with GTR, supplemental binder was added according to the
manufacturer’s recommendation (0.1% supplemental virgin binder was added for the 5% GTR
mix, while 0.4% supplemental binder was used for the 20% GTR mix). An engineered crumb
rubber (ECR) product was used in the current study, which has been used as a modifier in several
hundreds-of-thousands of tons of SMA and dense-graded mixtures placed since 2016 on the
Illinois Tollway, as described in (W. G. Buttlar, Jahangiri, et al., 2020). The variables were
strategically chosen after examining the baseline performance of the control (unmodified) US 54_6
mix.
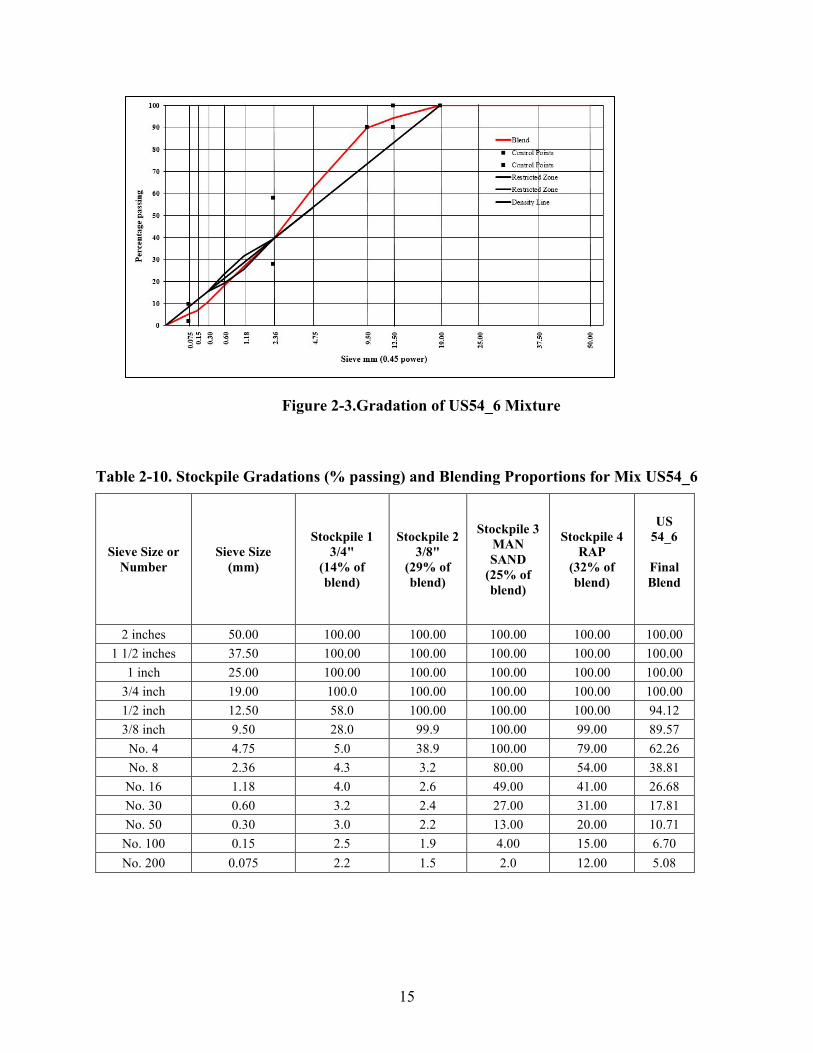
15
Figure 2-3.Gradation of US54_6 Mixture
Table 2-10. Stockpile Gradations (% passing) and Blending Proportions for Mix US54_6
Sieve Size or Number
Sieve Size (mm)
Stockpile 1 3/4"
(14% of blend)
Stockpile 2 3/8"
(29% of blend)
Stockpile 3 MAN SAND
(25% of blend)
Stockpile 4 RAP
(32% of blend)
US 54_6
Final Blend
2 inches 50.00 100.00 100.00 100.00 100.00 100.00 1 1/2 inches 37.50 100.00 100.00 100.00 100.00 100.00
1 inch 25.00 100.00 100.00 100.00 100.00 100.00 3/4 inch 19.00 100.0 100.00 100.00 100.00 100.00 1/2 inch 12.50 58.0 100.00 100.00 100.00 94.12 3/8 inch 9.50 28.0 99.9 100.00 99.00 89.57
No. 4 4.75 5.0 38.9 100.00 79.00 62.26 No. 8 2.36 4.3 3.2 80.00 54.00 38.81
No. 16 1.18 4.0 2.6 49.00 41.00 26.68 No. 30 0.60 3.2 2.4 27.00 31.00 17.81 No. 50 0.30 3.0 2.2 13.00 20.00 10.71
No. 100 0.15 2.5 1.9 4.00 15.00 6.70 No. 200 0.075 2.2 1.5 2.0 12.00 5.08
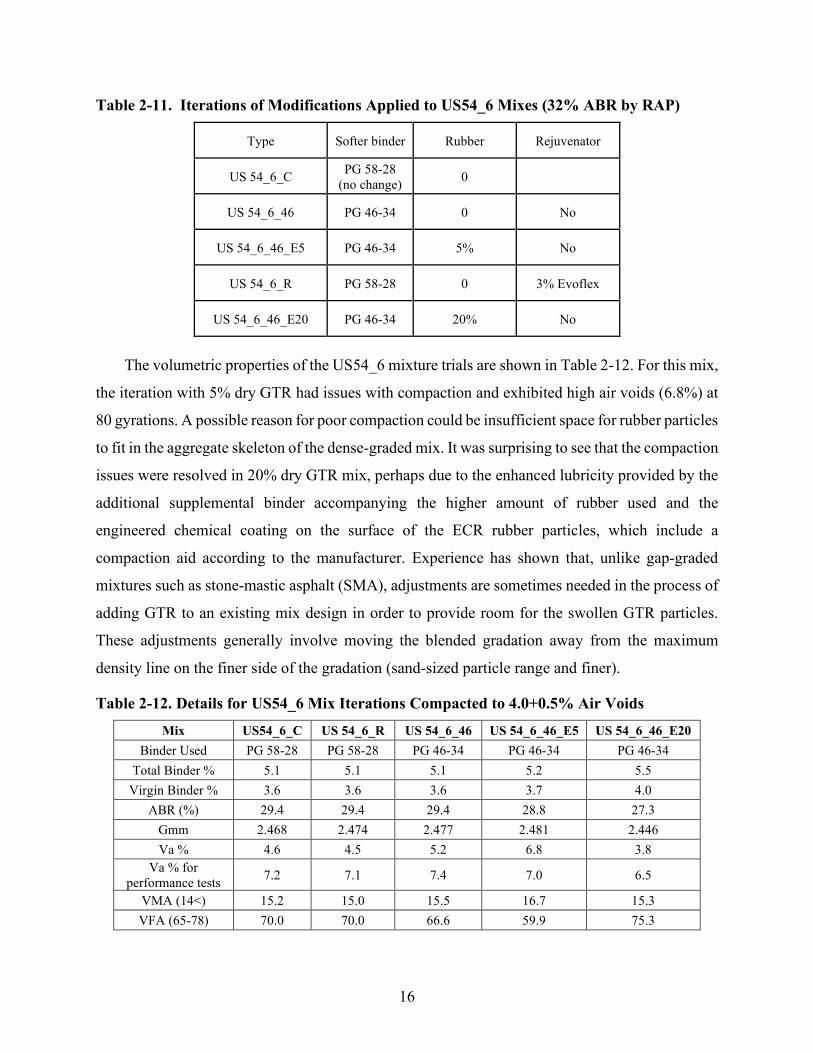
16
Table 2-11. Iterations of Modifications Applied to US54_6 Mixes (32% ABR by RAP)
Type Softer binder Rubber Rejuvenator
US 54_6_C PG 58-28 (no change) 0
US 54_6_46 PG 46-34 0 No
US 54_6_46_E5 PG 46-34 5% No
US 54_6_R PG 58-28 0 3% Evoflex
US 54_6_46_E20 PG 46-34 20% No
The volumetric properties of the US54_6 mixture trials are shown in Table 2-12. For this mix,
the iteration with 5% dry GTR had issues with compaction and exhibited high air voids (6.8%) at
80 gyrations. A possible reason for poor compaction could be insufficient space for rubber particles
to fit in the aggregate skeleton of the dense-graded mix. It was surprising to see that the compaction
issues were resolved in 20% dry GTR mix, perhaps due to the enhanced lubricity provided by the
additional supplemental binder accompanying the higher amount of rubber used and the
engineered chemical coating on the surface of the ECR rubber particles, which include a
compaction aid according to the manufacturer. Experience has shown that, unlike gap-graded
mixtures such as stone-mastic asphalt (SMA), adjustments are sometimes needed in the process of
adding GTR to an existing mix design in order to provide room for the swollen GTR particles.
These adjustments generally involve moving the blended gradation away from the maximum
density line on the finer side of the gradation (sand-sized particle range and finer).
Table 2-12. Details for US54_6 Mix Iterations Compacted to 4.0+0.5% Air Voids
Mix US54_6_C US 54_6_R US 54_6_46 US 54_6_46_E5 US 54_6_46_E20 Binder Used PG 58-28 PG 58-28 PG 46-34 PG 46-34 PG 46-34
Total Binder % 5.1 5.1 5.1 5.2 5.5 Virgin Binder % 3.6 3.6 3.6 3.7 4.0
ABR (%) 29.4 29.4 29.4 28.8 27.3 Gmm 2.468 2.474 2.477 2.481 2.446 Va % 4.6 4.5 5.2 6.8 3.8
Va % for performance tests 7.2 7.1 7.4 7.0 6.5
VMA (14<) 15.2 15.0 15.5 16.7 15.3 VFA (65-78) 70.0 70.0 66.6 59.9 75.3

17
2.4. Mixing and Compaction
All samples were fabricated and tested at the MAPIL Lab at UMC. Plant mixtures were
sampled and stored in the lab in sealed, 5-gallon steel pails and reheated until the mix was
workable. Next, the material was reduced to a gyratory sample following the quartering method
described in AASHTO R47 (AASHTO, 2008). Compaction temperatures were set according to
the Job Mix Formula (JMF) supplied by the contractor.
Lab mixes were produced from the collected aggregates and binders following the
contractor supplied JMF. Prior to mixing, aggregates were dried overnight and then batched. The
mixing process was carried out in a bucket-style lab mixer (Figure 2-4), and mixtures were then
short-term aged in the oven for 2 hours before compaction, at the compaction temperature. For
rubber-modified mixtures, GTR was incorporated into the binder before mixing with aggregates.
Following manufacture recommendations, binder and GTR were heated to 170⁰C then blended in
a high-shear mixer at 3500 rpm for 30 minutes. The GTR-modified binder was then added to
aggregates heated to 190⁰C, and bucket-mixed. The plant and lab mixture specimens were
compacted in a Superpave Gyratory Compactor (SGC) and then fabricated into mixture
performance test specimens.
Figure 2-4. Bucket Lab Mixer (left), Gyratory Compactor (Right)

18
2.5. Sample Size
In this research, DC(T) and HWTT specimens were fabricated from both plant- and lab-
produced mixtures. To perform the HWTT test, a 62 mm height cylindrical sample with 150mm
diameter was produced in a gyratory compactor according AASHTO T 324. For the DC(T), a
gyratory specimen of 150 mm diameter and 140 mm height was produced and, according to ASTM
D7313, subsequently cut into two 50 mm thick slices. Two loading holes of 25 mm diameter and
a notch of approximately 62 mm in length were fabricated into DC(T) specimens. Figure 2-5
illustrates the sample fabrication process used for DC(T) specimens. A minimum of three
replicates were used in DC(T) testing, while a minimum of four replicates were used for HWTT
testing.
Figure 2-5. DC(T) Fabrication Process
2.6. Materials for Binder Studies
Sixty field sample “cores” were collected from different routes in two batches: the first batch had
38 samples (Figure 2-6) and the second batch had 22 samples (Figure 2-7). More details about the
first and second batch samples are presented in Table 2-13 and Table 2-14, respectively. For field

19
samples taken from routes constructed in 2016, the cores were sampled within two weeks after the
pavement construction process in 2016. Therefore, the E & R asphalt binders from those mixes
were considered as short-term aged binders. The asphalt binders E & R from the other field
samples were treated as long-term aged binders. The long-term aged field samples in the first batch
were collected in 2016. The field samples in the second batch were gathered in 2019. These mixes
contained different asphalt binder replacement (ABR) percentages by recycled materials (RAP
and/or RAS) and different additives. Some mixes contained neither RAP nor RAS (e.g. US 54-5,
US 54-7, and MO 94). After testing the compacted samples at the University of Missouri-
Columbia (Mizzou), the samples were collected and brought to the asphalt lab at Missouri
University of Science and Technology (Missouri S&T).
Twelve plant mixes were designed following Superpave and mixed in a drum-mix plant.
The plant is located near the intersection of Lakeside Rd. and US 54, near Lakeland in Missouri.
The asphalt contractor was Magruder Paving, LLC. The plant mixes were sampled from behind
the paver. These mixes were reheated and compacted using Pine GB1 Superpave gyratory in
Mizzou. After testing the compacted samples in Mizzou, the samples were collected and brought
to the asphalt lab at Missouri S&T, Figure 2 8. These mixes contained either RAP or RAS. More
details about these mixes are illustrated in Table 2 14. The E & R asphalt binders from the plant
mixes were treated as short-term aged binders.
Different lab mixes were designed following Superpave using the same original asphalt
binders used in the US 54-6 and US 63-1 plant mixes (PG 58-28) or using a softer one (PG 46-
34). Moreover, different additives and engineered crumb rubber (ECR) percentages were used in
the lab mixes. More details about these mixes are shown in Table 2 15. The E & R asphalt binders
from the lab mixes were analyzed as short-term aged binders.
The field, plant, and lab mix codes represent the route name (e.g. MO 13), section number
(e.g. 1), core/coding system (e.g. HP13), virgin asphalt binder high PG temperature (e.g. PG 64
H), and ABR percentages achieved by RAP-RAS combinations (e.g., 17-0 represents 17% RAP
and 0% RAS).

20
Figure 2-6. First Batch of Field Mix Cores
Figure 2-7. Second Batch of Field, Plant, and Lab Mixes

21
Table 2-13. Details for First Round of Field Mix Sampling
# Code Job No. County Route/Dir
Locat-ion
Air Voids (%)
Virgin asphalt
PG
Plan PG
Virgin ACa (%)
Total AC (%)
ABR by
RAP (%)
ABR by
RAS (%)
NMASb (mm)
Year Built c Additives
1 MO 13-1-5-PG 64H (17-0)
J7P3010 Henry MO 13 NB
S. of Clinton
6.8
64-22H 70-22 4.4 5.7 17 0 9.5 2016
Morelife T280 0.5%
2 MO 13-1-7-PG 64H (17-0) 6.6
3 MO 13-1-11-PG 64H (17-0)
4 US 54-6-9-PG 58 (31-0)
J5P3131 mainline Miller
US 54 NB
N. of Osage Beach
5.6 58-28 70-22 3.6 5.1 31 0 12.5 2016 Morelife T280 1% 5 US 54-6-7-PG
58 (31-0)
6 US 54-6-2-PG 58 (31-0)
7 US 54-1-2a-PG 58 (0-33)
J5P3131 sect 10 Miller US
54 SB
N. of Osage Beach
3.0 58-28 3.6 5.2 0 33 12.5 2016
IPC70 2.5%,
PC2106 3.5%,
Morelife T280 1.5%
8 US 54-1-3a-PG 58 (0-33)
9 US 54-1-4-PG 58 (0-33)
10 US 63-1-9-PG 58 (35-0)
J2P2213 Randolph US 63 SB
S. of Moberly 7.0 58-28 70-22 3.4 5.1 35 0 12.5 2016
Evotherm 0.5%,
Evoflex CA
1.75%
11 US 63-1-5-PG 58 (35-0)
12 US 63-1-2-PG 58 (35-0)
13 US 63-2-5-PG 64 (20-10)
J2P0773 SBL Macon US
63 SB
N of Macon,
near LaPlata
9.8
64-22 4.1 5.6 20 10 12.5 2008
Baghouse fines 1.5%,
AD-here HP plus
0.5%
14 US 63-2-2-PG 64 (20-10) 7
15 US 63-2-11-PG 64 (20-10)
16 US 54-3-8a- J5P3131 Miller US Osage 6.4 58-28 3.6 5.2 18 15 12.5 2016 Morelife

22
PG 58 (18-15) sect7 54 Beach T280 1%
17 US 54-3-6a-PG 58 (18-15) 6.2
18 US 54-3-2-PG 58 (18-15)
19 US 54-5-5a-PG 64H (0-0) J5P3131
sect4 Miller US 54
Osage Beach
4.6 64-22H 64-22 5.4 5.4 0 0 12.5 2016 Morelife
T280 1% 20 US 54-5-9a-PG 64H (0-0) 4.4
21 US 54-4-1a-PG 64H (35-0)
J5P3131 sect5 Miller US
54 Osage Beach
4.7
64-22H
3.2 4.8 35 0 12.5 2016
PC2106 3%,
Morelife T280 1%
22 US 54-4-4a-PG 64H (35-0) 4.8
23 US 54-4-7-PG 64H (35-0)
24 US 54-2-7a-PG 58 (33-0)
J5P3131 sect8 Miller US
54 Osage Beach
4
58-28 3.6 5.3 33 0 12.5 2016 Morelife T280 1% 25 US 54-2-6-PG
58 (33-0) 3.9 26 US 54-2-3-PG
58 (33-0)
27 US 50-1-9-PG 64 (25-0)
J5P0961 Moniteau/Morgan
US 50 Tipton 10 64-22 3.8 5 25 0 12.5 2011
BHF 1.5%,
AD-here HP plus
1%
28 US 50-1-4-PG 64 (25-0)
29 US 50-1-2-PG 64 (25-0)
30 MO 52-1-6-PG 64 (0-34)
J5P0925 Morgan MO 52
Ver-sailles 7.9 64-22 3.7 4.8 0 34 12.5 2010
BHF 1.5%,
AD-here HP plus
0.8%
31 MO 52-1-3-PG 64 (0-34)
32 MO 52-1-9-PG 64 (0-34)
33 US 54-7-7-PG 64 (0-0) J5P0769 Cole
US 54
WB Brazito
3.7 64-22 6.2 6.2 0 0 12.5 2003
LOF 65-00LS1 0.25% 34 US 54-7-2-PG
64 (0-0) 5

23
35 US 54-7-4-PG 64 (0-0)
36 US 54-8-6-PG 70 (9-0)
J5D0600A Cole US
54
S. of Jeff City
4.4
70-22 5.1 5.6 9 0 12.5 2006 AD-here HP plus
0.5% 37 US 54-8-4-PG
70 (9-0) 2.3 38 US 54-8-3-PG
70 (9-0) a AC: Asphalt Content, b NMAS: Nominal Maximum Aggregate Size, and c Const.: Construction. Morelife T280, AD-here HP Plus, LOF 65-00LS1, and IPC-70: anti-stripping agents. Evotherm and PC 2106: warm-mix additives. Evoflex CA: rejuvenator additive.
Table 2-14. Details for Second Round Field Mix Sampling
No. Code Route/Dir Virgin asphalt PG Contract PG Total
AC (%)
ABR by
RAP (%)
ABR by
RAS (%)
NMAS (mm)
Date of most recently overlay
1 MO 151-7-PG 64 (16-15)
MO 151 64-22 64-22 4.7 16 15 12.5
2010
2 MO 151-5a-PG 64 (16-15) 3 MO 151-10a-PG 64 (16-15) 4 MO 151-2a-PG 64 (16-15) 5 MO 151-11-PG 64 (16-15) 6 US 61 N-9a-PG 64H (30-0)
US 61 N 64-22H 64-22H 5.3 30 0 9.5
2013
7 US 61 N-3a-PG 64H (30-0) 8 US 61 N-6a-PG 64H (30-0) 9 US 54-12a-PG 70 (12-0)
US 54 E 70-22 70-22 5.7 12 0 12.5 2010 10 US 54-6a-PG 70 (12-0) 11 US 54-2a-PG 70 (12-0) 12 MO 6-4a-PG 58 (30-0)
MO 6 W 58-28 64-22 5.9 30 0 4.75 2015 13 MO 6-5a-PG 58 (30-0) 14 MO 6-10a-PG 58 (30-0)

24
15 MO 6-11a-PG 58 (30-0) 16 MO 6-8a-PG 58 (30-0) 17 MO 94-9a-PG 64 (0-0)
MO 94 64-22 64-22 5.6 0 0 12.5 2005 18 MO 94-12a-PG 64 (0-0) 19 MO 94-6a-PG 64 (0-0) 20 US 36-10a-PG 64 (25-0)
US 36 E 64-22 64-22 5.1 25 0 12.5 2011 21 US 36-13a-PG 64 (25-0) 22 US 36-12a-PG 64 (25-0)

25
Table 2-15. Plant-sampled Mix Details
No. Code Job No. County Route/Dir Location
Virgin asphalt
PG
Plan PG
Virgin AC (%)
Total AC (%)
ABR by
RAP (%)
ABR by
RAS (%)
NMAS (mm)
Const. Year Additives
1 MO 13-1-
HP13-PG 64 H (17-0)
J7P3010 Henry MO 13 NB
S. of Clinton 64-22H 70-22 4.4 5.7 17 0 9.5 2016
Morelife T280 0.5%
2 MO 13-1-
HP16- PG 64 H (17-0)
3 MO 13-1-
HP14- PG 64 H (17-0)
4 US 54-6-HP3-PG 58 (31-0)
J5P3131 mainline Miller US 54
NB
N. of Osage Beach
58-28 70-22 3.6 5.1 31 0 12.5 2016 Morelife T280 1% 5 US 54-6-DP4A-
PG 58 (31-0)
6 US54-6-DP4B-PG 58 (31-0)
7 US 54-1-
1DCTP1B-PG 58 (0-33)
J5P3131 sect 10 Miller US 54
SB
N. of Osage Beach
58-28 3.6 5.2 0 33 12.5 2016
IPC70 2.5%,
PC2106 3.5%,
Morelife T280 1.5%
8 US 54-1-
1DCTP2B-PG 58 (0-33)
9 US 54-1-
1DCTP1A-PG 58 (0-33)
10 US 63-1-HP8- PG 58 (35-0)
J2P2213 Randolph US 63 SB
S. of Moberly 58-28 70-22 3.4 5.1 35 0 12.5 2016
Evotherm 0.5%,
Evoflex CA 1.75%
11 US 63-1-HP9- PG 58 (35-0)
12 US 63-1-DP3A- PG 58 (35-0)

26
Table 2-16. Simulated Lab Asphalt (‘Fix-the-Mix’) Details
No. Code Code Abbreviated Virgin
AC (%)
Total AC (%)
Virgin Asphalt PG
ABR by
RAP (%)
ABR by
RAS (%)
ECRa (%) Additives
US 54-6 Lab Mixes 1 US 54-6-H9-H10-PG 58 (31-0)
US 54-6
3.6 5.1 58-28
31 0
0
2 US 54-6-H1-PG 58 (31-0) 3 US 54-6-D2a-PG 58 (31-0) 4 US 54-6-D1a-PG 58-R (31-0) US 54-6-R 3% Evoflex 5 US 54-6-H5-H6-PG 58-R (31-0) 6 US 54-6-D1a-PG 46 (31-0) US 54-6-PG 46
46-34
7 US 54-6-H3-H10-PG 46 (31-0) 8 US 54-6-H3-PG 46-E5 (31-0)
US 54-6-PG 46-E5 3.7 5.2 5 9 US 54-6-D2b-PG 46-E5 (31-0) 10 US 54-6-H7-H8-PG 46-E5 (31-0) 11 US 54-6-H4-PG 46-E20 (31-0) US 54-6-PG 46-E20 4 5.5 20 12 US 54-6-H1-PG 46-E20 (31-0)
US 63-1 Lab Mixes 13 US 63-1-H4-PG 58-R (35-0)
US 63-1-R
3.4 5.1
58-28
35 0
3.75% Evoflex, 0.5% Evotherm 14 US 63-1-D1b-PG 58-R (35-0)
15 US 63-1-H2-PG 58-R (35-0) 16 US 63-1-D2a-PG 46 (35-0)
US 63-1-PG 46
46-34
17 US 63-1-H6-PG 46 (35-0) 18 US 63-1-D1b-PG 46 (35-0) 19 US 63-1-D2b-PG 46-R (35-0)
US 63-1-PG 46-R 3.75% Evoflex, 0.5% Evotherm 20 US 63-1-H3-PG 46-R (35-0)
21 US 63-1-D2a-PG 46-R (35-0) 22 US 63-1-H2-PG 46-E10 (35-0) US 63-1-PG 46-E10 3.6 5.3 10 23 US 63-1-H5-PG 46-E10 (35-0) 24 US 63-1-D2b-PG 46-E20 (35-0) US 63-1-PG 46-E20 3.8 5.5 20 25 US 63-1-Gmb3-PG 46-E20 (35-0)
a ECR: Engineered Crumb Rubber
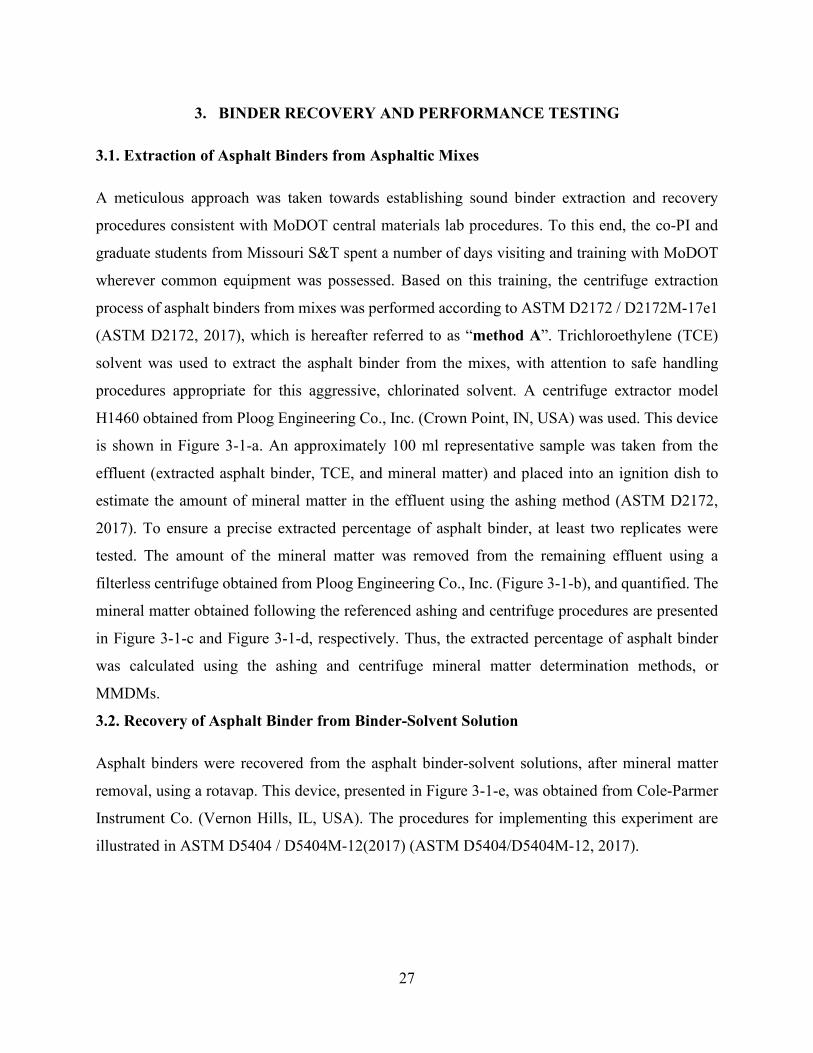
27
3. BINDER RECOVERY AND PERFORMANCE TESTING
3.1. Extraction of Asphalt Binders from Asphaltic Mixes
A meticulous approach was taken towards establishing sound binder extraction and recovery
procedures consistent with MoDOT central materials lab procedures. To this end, the co-PI and
graduate students from Missouri S&T spent a number of days visiting and training with MoDOT
wherever common equipment was possessed. Based on this training, the centrifuge extraction
process of asphalt binders from mixes was performed according to ASTM D2172 / D2172M-17e1
(ASTM D2172, 2017), which is hereafter referred to as “method A”. Trichloroethylene (TCE)
solvent was used to extract the asphalt binder from the mixes, with attention to safe handling
procedures appropriate for this aggressive, chlorinated solvent. A centrifuge extractor model
H1460 obtained from Ploog Engineering Co., Inc. (Crown Point, IN, USA) was used. This device
is shown in Figure 3-1-a. An approximately 100 ml representative sample was taken from the
effluent (extracted asphalt binder, TCE, and mineral matter) and placed into an ignition dish to
estimate the amount of mineral matter in the effluent using the ashing method (ASTM D2172,
2017). To ensure a precise extracted percentage of asphalt binder, at least two replicates were
tested. The amount of the mineral matter was removed from the remaining effluent using a
filterless centrifuge obtained from Ploog Engineering Co., Inc. (Figure 3-1-b), and quantified. The
mineral matter obtained following the referenced ashing and centrifuge procedures are presented
in Figure 3-1-c and Figure 3-1-d, respectively. Thus, the extracted percentage of asphalt binder
was calculated using the ashing and centrifuge mineral matter determination methods, or
MMDMs.
3.2. Recovery of Asphalt Binder from Binder-Solvent Solution
Asphalt binders were recovered from the asphalt binder-solvent solutions, after mineral matter
removal, using a rotavap. This device, presented in Figure 3-1-e, was obtained from Cole-Parmer
Instrument Co. (Vernon Hills, IL, USA). The procedures for implementing this experiment are
illustrated in ASTM D5404 / D5404M-12(2017) (ASTM D5404/D5404M-12, 2017).

28
Figure 3-1. Extraction and Recovery Processes; (a) Centrifuge Extractor, (b) Filterless Centrifuge, (c) Ashing Dishes Containing Mineral Matter, (d) Centrifuge Metal Cup
Containing Mineral Matter, and (e) Rotavap
(a) (b) (c) (d)
(e)
3.3. Short-Term Aging for Virgin Asphalt Binders
Short-term aging was carried out according to ASTM D2872-19 (ASTM D2872, 2012) for
the virgin asphalt binders. Testing was implemented using the RTFO device obtained from James
Cox & Sons Inc. (Colfax, CA, USA).
3.4. Evaluating the Virgin and Extracted & Recovered Asphalt Binders’ Rheological Properties
A Dynamic Shear Rheometer (DSR), Anton Paar MCR 302, was used following ASTM
D7175-15 (AASHTO-T-315, 2019) to characterize the rheological properties for virgin, short-term
aged virgin, and E & R asphalt binders. For short-term aged virgin and E & R asphalt binders,
treated as short-term aged binders, samples with a thickness of 1 mm and 25 mm in diameter were

29
analyzed. For the E & R asphalt binders treated as long-term aged binders, samples with 2-mm
thickness and an 8-mm diameter were analyzed. For the AASHTO binder’s grading system,
AASHTO M332 (AASHTO-M-332, 2020) specification was used. This specification recommends
using the multiple stress creep recovery (MSCR) test for evaluating the high PG temperature.
The aged virgin and E & R asphalt binders were analyzed by the DSR using temperature
sweep and frequency sweep testing. For the plant, lab, and field mixes constructed & collected in
2016, the E & R asphalt binders were treated as RTFO aged asphalt binders. For the other field
mixes, constructed before 2016, the E & R asphalt binders were analyzed assuming roughly a
similar long-term aging state as would be obtained when testing pressure aging vessel (PAV) aged
asphalt binders.
The temperature sweep test was implemented twice for each asphalt binder using two different
samples and the average results were analyzed. Different temperatures were selected in the
temperature sweep testing based on asphalt binder aging state (RTFO or PAV). For RTFO
samples, different PG high temperature grade (rutting) test temperatures were selected beginning
with the high PG temperature of the virgin asphalt binder or contract PG and ending with 94°C
and tested at 6°C increments. For asphalt binders failing before 94°C, testing was terminated. Some
E & R asphalt binders would have surpassed the 94°C high temperature grade requirements;
however, due to typical DSR limitations, further elevation of testing temperature was not possible.
For PAV samples, the intermediate fatigue cracking test temperatures were selected beginning
with 10°C and ending with 34°C, across 3°C intervals.
For the frequency sweep testing, three temperatures were used based on the asphalt binder
type (RTFO or PAV) through different frequencies (100 to 0.1 rad/sec). For the RTFO samples,
different temperatures were selected inside a range of 52, 58, 64, and 70°C temperatures. For PAV
samples, a range of 16, 19, 22, and 25°C temperatures were selected. The master curves, Cole-
Cole plots, and black diagrams for the aged virgin and E & R asphalt binders were derived from
the frequency sweep testing and analyzed at 60°C and 22°C for RTFO and PAV samples,
respectively. Due to time and material limitations, low temperature binder testing was not
performed as part of this study.
The MSCR test was implemented following ASTM D7405-20 to evaluate the resistance of
the RTFO-aged virgin and E & R binders, treated as RTFO-aged binders, to rutting. This was

30
achieved by calculating the percentage of recovery (%R) and non-recoverable creep compliance
(Jnr) at the high PG temperatures of the virgin binders or a reference temperature (60°C) by
applying ten creep cycles at two different levels of stresses (0.1 and 3.2 kPa). For each creep cycle,
the loading time was 1 sec and the unloading time (recovery) was 9 sec.
The linear amplitude sweep (LAS) test was used to further characterize fatigue cracking
resistance following AASHTO TP 101-14 (AASHTO TP 101, 2014). This test was applied for
asphalt binders E & R from field mixes constructed before 2016, treated as PAV samples. The
selected reference temperature was 22°C. The test was conducted by applying two stages on 8-
mm diameter and 2-mm thickness samples. The first stage was a frequency sweep test, which was
applied to evaluate the damage analysis by applying a 0.1% strain load over a frequency range
between 0.2 and 30 Hz. The second stage included the amplitude sweep test that was conducted at
a constant frequency of 10 Hz in a strain-control mode. A linearly increased strain load was applied
from zero to 30% over 3100 loading cycles (10 cycles per second). The number of load repetitions
to failure (Nf) for binders was calculated based on the measurements of the LAS test. The Nf
parameter represents fatigue damage resistance (literally, the # of cycles to fatigue failure in the
test), where higher Nf values reflect higher resistance to fatigue cracking damage. The Nf was
calculated according to the strain levels suggested for strong (thicker, newer, stiffer) and weak
(thinner, older, more flexible) flexible pavement structures, i.e., 2.5 and 5% strain, respectively.

31
4. MIXTURE PERFORMANCE TESTS
4.1. DC(T) Fracture Test
The DC(T) test was developed to characterize the fracture behavior of asphalt concrete
mixtures at low temperatures (W. G. Buttlar, Rath, et al., 2019). The testing temperature is 10oC
warmer than the PG low temperature grade of the mixture, per (ASTM D7313-13). Thermal
cracking in asphalt pavements can be considered as occurring in pure tensile opening or fracture
Mode I, as the cracks propagate perpendicular to the direction of the thermal-induced stresses in
the pavement, i.e., transverse to the direction of traffic. The fracture energy is computed as follows:
𝐺𝐺𝑓𝑓 = 𝐴𝐴𝐴𝐴𝐴𝐴𝐴𝐴𝐵𝐵 ∙ 𝐿𝐿
[1]
where, Gf denotes fracture energy in J/m2, AREA is the area under Load-CMODFIT curve, until
the terminal load of 0.1 kN is reached. B is specimen thickness in m, generally, 0.050 m (2 inch)
(except for field cores) and L is ligament length, usually around 0.083 m. The DC(T) test procedure
used in this study includes conditioning of the fabricated specimen at the selected test temperature
in a temperature-controlled chamber for a minimum of two hours. After the conditioning, the
specimens are suspended on loading pins in the DC(T) machine.
A portable Test Quip DC(T) device was used, which is housed at MAPIL. The test is
performed at a constant crack mouth opening displacement (CMOD) rate, which is controlled by
a CMOD clip-on gage mounted at the crack mouth. The CMOD rate specified in ASTM D7313-
13 is 0.017 mm/s (1 mm/min). To begin the testing sequence, a seating load no greater than 0.2
kN (typically about 0.1 kN) is applied to ‘seat’ the specimen. The test is completed when a crack
has propagated, and the post-peak load level is reduced to 0.1 kN. The fracture energy can be
obtained by measuring the area under the load-CMOD curve and dividing it by the fractured area
(ligament length times thickness). Marasteanu et al. (2007, 2012) recommended thresholds for
DC(T) fracture energy based on traffic level as 400, 460, and 690 J/m2 for low, medium, high
traffic levels respectively (M. O. Marasteanu et al., 2012; Mihai O. Marasteanu et al., 2007). For
this project, a threshold of 460 J/m2 was adopted as the threshold for the medium-level traffic
specified in the problem statement. Additional DC(T) threshold recommendations across a range
of mix types as used in Missouri and for SMA and dense-graded mixtures in Illinois can be found
in (W. G. Buttlar, Urra-Contreras, et al., 2020) and (W. Buttlar et al., n.d.), respectfully.

32
Figure 4-1. DC(T) Specimen (Top-Left), DC(T) Loading Fixture (Top-Right), and Typical
Load-CMOD Curve from DC(T) Testing of Asphalt Mixtures (Bottom)
4.2. Semi Circular Bending, I-FIT Test
The flexibility index (FI) from the I-FIT test is an empirical index parameter that is computed
as the total fracture energy divided by the absolute value of the slope of the post-peak softening
curve multiplied by a scaling factor (Eq. 4).
𝐹𝐹𝐹𝐹 = 𝐺𝐺𝑓𝑓
|𝑚𝑚| (0.01) (4)
where Gf is computed in a similar manner as to the DC(T) test, and m represents the slope of the
post-peak softening curve. The FI was originally proposed as a means to identify brittle mixtures
prone to premature cracking and was specifically developed to be sensitive to recycled material
content (AASHTO TP124-16). There are countless ways to estimate the slope of a curve resulting
from a material test, and this became a challenge for test standardization early in the development
of the I-FIT. At present, to address this source of variability, the slope parameter can be determined

33
using a software program available from the Illinois Center for Transportation or can be
programmed into a spreadsheet or MATLAB. A MATLAB code was developed by researchers in
the MAPIL lab.
To fabricate samples, a notch is cut along the axis of symmetry of a semi-circular bend
specimen to a depth of 15±1 mm (0.6 inch). Test specimens are then conditioned in the
environmental chamber at 25oC for 2 hr ± 10 min. After a contact load of 0.1 kN is reached, the
test is carried out at a rate of 50 mm/min. The test is considered to be complete when the load
drops below 0.1 kN.
Figure 4-2. SCB I-FIT apparatus in MAPIL lab
4.3. IDEAL-CT Test
The IDEAL-CT test was developed to characterize the cracking potential of asphalt concrete
mixes at an intermediate (room) temperature. The test set-up is similar to the traditional indirect
tensile strength test and performed at 25°C under a constant loading rate of 50 mm/min until failure
occurs (ASTM D8225, 2019). The test is gaining popularity in practice due to its basic sample
preparation and testing requirements, as specimens do not require gluing, notching, drilling or
additional cutting. A sample thickness of 62 mm (2.5 inches) is recommended for mixes with
nominal maximum aggregate size (NMAS) blend gradations of less than 25 mm (ASTM D8225),
or 1 inch, and for specimens compacted to a 7±0.5% air void level. The test procedure requires
conditioning the mixture specimens in a temperature-controlled chamber for a minimum of 2 hours

34
at 25 ℃. The Test Quip I-FIT test apparatus at MAPIL is equipped with a second loading fixture
and ram, which was used for the IDEAL CT testing conducted herein. A seating load of 0.1 kN
was applied in order to make appropriate contact between the loading heads and the sample. The
sample was then loaded in ram displacement control mode (e.g., constant load-line deflection, or
LLD), while the loading level was measured via an electronic load cell.
The cracking parameter for the IDEAL-CT is derived from the load vs. displacement curve.
The larger the CT-index, the better cracking resistance of the mixture. A minimum of CT-index=65
is proposed by (Zhou, 2018) while the recommended CT for Superpave mixes is 105. The CT
index equation is as follows.
where,
𝐺𝐺𝑓𝑓 = Fracture energy (area under the curve normalized by the area fractured)
|𝑚𝑚75| = Slope parameter (absolute value of the slope after reduction to 75% of peak load)
𝑙𝑙75 = Vertical displacement after reduction to 75% of peak load (mm)
𝐷𝐷 = Specimen diameter (mm)
𝑡𝑡 = Specimen thickness (mm)
4.4. Hamburg Wheel Track Test (HWTT)
In order to evaluate the rutting performance of the mixtures, the HWTT was conducted in
accordance to the AASHTO-T324 standard (AASHTO-T324, 2017). In this test, a loaded steel
wheel weighing approximately 71.7 kg tracks over the samples submerged in a water bath held
constant at 50oC. The vertical deformation imparted to the specimen is recorded at 220 points
along the length of wheel loading. The test is stopped when either the specimen rut depth reaches
20 mm (0.79 inch) or the number of wheel passes reaches 20,000. A Cooper Hamburg device was
used in this study, shown in Figure 4-3. For this study, a rut depth threshold of 12.5 mm (0.5 inch)
at 20,000 passes was adopted (Larrain, 2015; Buttlar et al., 2020).

35
Figure 4-3. Hamburg Wheel Track Machine (Left), Asphalt Specimen Inside Hamburg
Machine after Testing (right)
4.5. Hamburg-DC(T) Performance Space Diagram
Figure 4-4 presents a convenient x-y plotting form known as the ‘performance-space
diagram,’ or more specifically in this case, the Hamburg-DC(T) plot. This plot allows the
simultaneous evaluation of rutting and cracking behavior (W. G. Buttlar et al., 2016). Some useful
trends that can often be observed when viewing data in this form are:
• The best overall performing mixtures will appear in the upper-right corner of the diagram
(low rutting depth, high fracture energy). These can be considered as high ‘total energy’
mixtures, i.e., rut and crack (or damage) resistant. These are high toughness mixtures, and
the best candidates for surfacing materials especially in demanding climates and for high
traffic volumes.
• Mix variables that increase net total energy in the mix and thus ‘move’ mixtures in the
direction of the upper-right corner of the plot include:
o Higher quality binder (low temperature susceptibility, higher Useful Temperature
Range, or UTI), degree of polymer modification;
o Higher quality aggregate (stronger, more angular, better bond with asphalt);
o The presence of crack interceptors or rut mitigators, such as fibers, rubber particles,
and even RAS (but only if properly used).
Other salient features of the plot include:

36
• Binders with different grades but similar UTI tend to move a mixture along a ‘binder
tradeoff axis, or roughly speaking, diagonal lines moving in the upwards-left or
downwards-right directions, for stiffening and softening, respectively;
• Pure stiffening components, such as RAP, tend to move points upwards and to the left;
• Pure softening components, such as rejuvenators, tend to move points downwards and to
the right;
• Binders with higher UTI, where the grade bump is on the high temperature grade, tend to
move points mainly upwards, but also slightly to the right due to the benefits of polymer
in stretching and maintaining load transfer across forming cracks;
• Binders with higher UTI, where the grade bump is on the low temperature grade, tend to
move points mainly to the right, but also slightly upwards, again, due to the benefits of
polymer in stretching across crack faces as they form, and;
• Data points that appear in the undesirable middle-to-lower-left portion of the plot are
sometimes those that contain RAP and insufficient binder bumping, and possibly poor
bond, where the RAP tended to cause lower DC(T) values, and the nature of the RAP-
virgin material combination led to a moisture-susceptible mix with high Hamburg rut depth
value.
Figure 4-4. Concept of Hamburg-DC(T) Plot

37
5. BINDER TESTING RESULTS
5.1. Relating Asphalt Binders Extracted & Recovered from the Plant Mixes to the Corresponding RTFO-Aged Virgin Asphalt Binders
In this section, the E & R asphalt binders obtained from the twelve plant mixes received by
the Missouri S&T research team from the MU team Table 2-14 are compared to the corresponding
RTFO-aged virgin asphalt binders. The asphalt binders E & R from the plant mixes were treated
as RTFO-aged virgin asphalt binders. First, a comparison of binder content yielded from the E &
R procedure as compared to the expected value (from the mix design) are presented, followed by
an analysis of results obtained from the standard binder testing suite used in this investigation. A
full presentation of test results and analysis for all of the mixture investigated are provided in
Appendix A.2.
5.1.1. Extraction of Asphalt Binders from Plant Mixes The extracted asphalt content (AC) percentages using the ashing, centrifuge, and average
ashing and centrifuge MMDMs are illustrated in Figure 5-1. Only two samples had the same
reference (or ‘actual’) and extracted AC% (experimentally measured) using ashing MMDM as
illustrated in Figure 5-1-a. Moreover, around 60% of the samples had extracted AC% values lower
than the reference percentages. This illustrates that the ashing MMDM underestimated the
extracted AC%. By contrast, by using the centrifuge MMDM, Figure 5-1-b, one-third of the
samples had an extracted AC% with the same values of the actual AC%. To increase the accuracy
of the extracted AC% calculation, the total mineral matter quantity inside the effluent was
estimated using the average ashing & centrifuge MMDMs as presented in Figure 5-1-c.
A one-way analysis of variance (ANOVA) was calculated using JMP Pro software to compare
the means of the different extracted AC% using different MMDMs and the mean of the reported
AC%. Table 5-1 illustrates the ANOVA results. There is no significant difference between the
means of the actual or extracted AC% using the ashing, centrifuge, or the average of ashing &
centrifuge MMDMs. This was illustrated by the Prob > F “p-value” because it was greater than
the significance level α (0.05).

38
4.4
4.6
4.8
5.0
5.2
5.4
5.6
5.8
4.4 4.6 4.8 5 5.2 5.4 5.6 5.8
Extra
cted
AC
(%)
Actual AC (%)
(a) Ashing MMDM
4.4
4.6
4.8
5.0
5.2
5.4
5.6
5.8
4.4 4.6 4.8 5 5.2 5.4 5.6 5.8
Extra
cted
AC
(%)
Actual AC (%)
(b) Centrifuge MMDM
4.4
4.6
4.8
5.0
5.2
5.4
5.6
5.8
4.4 4.6 4.8 5 5.2 5.4 5.6 5.8
Extra
cted
AC
(%)
Actual AC (%)
(c) Average ashing & centrifuge MMDMs MO 13-1-HP13-PG 64 H (17-0)MO 13-1-HP16-PG 64 H (17-0)MO 13-1-HP14-PG 64 H (17-0)US 54-6-HP3-PG 58 (31-0)US 54-6-DP4A-PG 58 (31-0)US54-6-DP4B-PG 58 (31-0)US 54-1-1DCTP1B-PG 58 (0-33)US 54-1-1DCTP2B-PG 58 (0-33)US 54-1-1DCTP1A-PG 58 (0-33)US 63-1-HP8-PG 58 (35-0)US 63-1-HP9-PG 58 (35-0)US 63-I-DP3A-PG 58 (35-0)
Figure 5-1. Reference (Actual) vs Extracted AC% using Different MMDMs for Plant Mixes
Containing RAP or RAS
Table 5-1. ANOVA Results for Actual and Extracted AC% for the Plant Mixes
Source DF* Sum of Squares Mean Square F Ratio Prob > F Method 3 0.089 0.030 0.406 0.749 Error 44 3.211 0.073
C. Total 47 3.300 *degrees of freedom
Figure 5-2 shows the extracted AC per actual AC percentages for plant asphaltic mixes using
different MMDMs. For around 75% of the plant mixes, the extracted AC% using the centrifuge
MMDM was slightly higher than the extracted AC% using the ashing MMDM. By using average
ashing and centrifuge MMDMs, the extracted AC per actual AC percentages were found between
91 and 109% for mixes containing RAP, and between 98 and 105% for mixes containing RAS.
Consequently, the extracted AC percentages from mixes containing RAS were found to be more
accurate than the extracted AC percentages from mixes containing RAP.

39
Figure 5-2. Extracted AC vs. Actual AC % for Plant Asphaltic Mixes using Different
MMDMs
5.1.2. Analysis of the Asphalt Binders Before and After the Extraction and Recovery Processes
Table 5-2 illustrates the high PG temperature for the E & R asphalt binders and the
corresponding RTFO-aged virgin asphalt binders. As explained in Chapter 3, 94°C was the
maximum DSR temperature setting available. Using 17% ABR by RAP changed the asphalt binder
high PG temperature from 64 heavy traffic (H) to 64 extremely heavy traffic (E). Moreover, using
31% or 35% ABR by RAP increased the asphalt binder high PG temperature from 58 to 76°C. For
asphalt binder E & R from plant samples containing 33% ABR by RAS, the resulting high PG
temperature exceeded 94°C. This occurred due to the high stiffness of the polymer-modified, air-
blown asphalt binder present in the shingles, which was undoubtedly further stiffened during the
service life of the roofing shingle.
To compare the effect of RAP or RAS on the E & R asphalt binder properties, asphalt binders
E & R from mixes US 54-6 and US 54-1 were compared. These mixes had the same virgin asphalt
binder and similar percentages of recycled materials: 31% ABR by RAP for US 54-6 and 33%
ABR by RAS for US 54-1. However, the high PG temperature for the E & R asphalt binders from
US 54-6 mixes increased three grades from 58 to 76°C and the high PG temperature for the E &
70
80
90
100
110
120
Extra
cted
AC
per
Act
ual A
C (%
)
Sample Code
Ashing MMDMCentrifuge MMDMAverage ashing & centrifuge MMDMs

40
R asphalt binders from US 54-1 mixes increased more than six grades from 58 to more than 94°C.
This illustrates the E & R asphalt binders from mixes containing RAS was significantly stiffer than
the E & R asphalt binders from mixes containing RAP.
Table 5-2. High PG Temperature for the E & R Asphalt Binders from the Plant Mixes and the Corresponding RTFO Aged Virgin Asphalt Binders
Plant Sample Code
RTFO Aged Virgin Asphalt Binders E & R Asphalt Binders High PG /
Continuous Grade
Temperature
|G*|/sinδ (kPa)a
Jnr3.2 (kPa−1) & Jnr diff
(%)a
High PG / Continuous Grade
Temperature
|G*|/sinδ (kPa)a
Jnr3.2 (kPa−1) & Jnrdiff (%)a
MO 13-1-HP13-PG 64 H (17-0)
64H / 72.61 6.09
Jnr3.2 = 1.36 & Jnr diff = 33.58
64E / 88.92 39.94 Jnr3.2 = 0.08 & Jnr diff = 14.32
MO 13-1-HP16- PG 64 H (17-0) 64E / 91.36 50.54 Jnr3.2 = 0.05 &
Jnr diff = 13.17 MO 13-1-HP14- PG
64 H (17-0) 64E / 87.88 36.44 Jnr3.2 = 0.09 & Jnr diff = 14.32
US 54-6-HP3-PG 58 (31-0)
58 / 62.46 3.96
Jnr3.2 = 2.85 & Jnr diff = 13.36
76 / 76.57 2.39 Jnr3.2 = 4.60 & Jnr diff = 16.83
US 54-6-DP4A-PG 58 (31-0) 76 / 77.58 2.68 Jnr3.2 = 3.81 &
Jnr diff = 16.55 US54-6-DP4B-PG 58
(31-0) 76 / 77.94 2.71 Jnr3.2 = 3.95 & Jnr diff = 14.72
US 54-1-1DCTP1B-PG 58 (0-33)
94b
14.33 Jnr3.2 = 0.64 & Jnr diff = 27.63c
US 54-1-1DCTP2B-PG 58 (0-33) 10.98 Jnr3.2 = 0.77 &
Jnr diff = 31.36c US 54-1-1DCTP1A-
PG 58 (0-33) 8.55 Jnr3.2 = 1.08 & Jnr diff = 33.35c
US 63-1-HP8-PG 58 (35-0)
58 / 58.52 2.43
Jnr3.2 = 4.39 &
Jnr diff = 16.33
76 / 78.08 2.74 Jnr3.2 = 3.68 & Jnr diff = 26.96
US 63-1-HP9- PG 58 (35-0) 76 / 79.06 3.17 Jnr3.2 = 3.13 &
Jnr diff = 26.80 US 63-1-DP3A- PG
58 (35-0) 76 / 77.92 2.76 Jnr3.2 =3.67 & Jnr diff = 28.49
a measured at the high PG temperature. b the succeeded high PG temperature exceeded 94°C; however, the binder evaluation was ended at this temperature. c measured at 94°C.
Figure 5-3 illustrates the rutting parameter (|G*|/sinδ) measured at different temperatures
using the temperature sweep test for E & R asphalt binders from the plant mixes and the
corresponding RTFO-aged virgin asphalt binders. Replicated measurements were implemented to
ensure the repeatability of the result. The coefficient of variation (COV) in the rutting parameter
values for the asphalt binders E & R from samples containing RAS is between 16 and 22%, which
was higher than the values for samples containing RAP (5 to 15% COV). As the temperature
increased, the difference between the rutting parameter for the E & R asphalt binders decreased. It

41
is worthwhile to note that adding RAP or RAS to the mixes increased the stiffness of the E & R
asphalt binders as compared to the corresponding RTFO-aged virgin asphalt binders. This was
easily detected by the increase in the Superpave binder rutting parameter.
From Figure 5-3-b and Figure 5-3-c, US 54 and US 63-1 samples contained virgin asphalt
binders with a PG 58-28. However, the US 63-1 PG 58 virgin binder was found to be softer than
the US 54 PG 58 virgin binder, at least in terms of its lower rutting parameter score at the same
temperature. In addition, increasing the ABR by RAP from 31% for US 54-6 PG 58 samples to
35% for US 63-1 PG 58 samples increased the stiffness of the E & R asphalt binders. Comparing
the E & R asphalt binders in Figure 5-3-b & Figure 5-3-c with Figure 5-3-a, by decreasing the
ABR percentage by RAP, from 31% or 35% to 17%, and increasing the high PG temperature for
the virgin asphalt binder, from PG 58 to PG 64 H, the stiffness of the E & R asphalt binders
increased significantly. Therefore, the use of virgin binders with increasingly high PG temperature
grades in Missouri asphalt mixes plays a crucial role in increasing the stiffness of the E & R asphalt
binders when used with the investigated recycled materials. Using RAS in mixes significantly
altered the asphalt binder properties after the recovery process, both in terms of high overall binder
stiffening and also in terms of the stiffness versus temperature profile. By comparing the asphalt
binders E & R from samples containing 33% ABR by RAS, presented in Figure 5-3-d, and samples
having 31% ABR by RAP, presented in Figure 5-3-b, asphalt binders E & R from mixes including
RAS showed a much stiffer behavior – roughly 70 times stiffer at 52oC.

42
0
30
60
90
120
46 52 58 64 70 76 82 88 94 100
|G*|
/sinδ
(kPa
)
Temperature (°C)
(a) MO 13-1 MO 13-1 PG 64 H RTFO Aged VirginMO 13-1-HP13-PG 64 H (17-0)MO 13-1-HP16- PG 64 H (17-0)MO 13-1-HP14- PG 64 H (17-0)
0
30
60
90
120
46 52 58 64 70 76 82 88 94 100
|G*|
/sinδ
(kPa
)
Temperature (°C)
(b) US 54-6
US 54 PG 58 RTFO Aged VirginUS 54-6-HP3-PG 58 (31-0)US 54-6-DP4A-PG 58 (31-0)US54-6-DP4B-PG 58 (31-0)
0
30
60
90
120
46 52 58 64 70 76 82 88 94 100
|G*|
/sinδ
(kPa
)
Temperature (°C)
(c) US 63-1
US 63 PG 58 RTFO Aged VirginUS 63-1-HP8-PG 58 (35-0)US 63-1-HP9- PG 58 (35-0)US 63-1-DP3A- PG 58 (35-0)
0
500
1000
1500
2000
46 52 58 64 70 76 82 88 94 100|G
*|/s
inδ
(kPa
)
Temperature (°C)
(d) US 54-1US 54 PG 58 RTFO Aged VirginUS 54-1-1DCTP1B-PG 58 (0-33)US 54-1-1DCTP2B-PG 58 (0-33)US 54-1-1DCTP1A-PG 58 (0-33)
Figure 5-3. Temperature Sweep Test Results for the E & R Asphalt binders from the Plant
Mixes and the Corresponding RTFO Aged Virgin Asphalt Binders
Figure 5-4 presents the rutting parameter ratio, which was calculated at the high PG
temperature of the virgin asphalt binders. It was calculated by dividing the |G*|/sinδ for the E & R
asphalt binders from the plant mixes per the same parameter for the corresponding RTFO aged
virgin asphalt binders. Columns with the same pattern fill indicate samples with the same virgin
asphalt binder. For samples containing RAS, the rutting parameter ratio reached the highest values
(between 103 and 151). For asphalt binders E & R from samples containing RAP, the rutting
parameter ratio was between 6 and 15. Although the US 63-1 PG 58 virgin asphalt binder was
softer than the US 54 PG 58 virgin asphalt binder, US 63-1 E & R asphalt binders had a higher
rutting parameter ratio because it contained a higher ABR by RAP (35%). The asphalt binders E
& R from the MO 13-1 samples containing 17% ABR percentage by RAP and a stiff asphalt binder
(PG 64-22H) had approximately the same rutting parameter ratio of the asphalt binders E & R
from US 54-6 samples containing 31% ABR percentage by RAP and a soft asphalt binder (PG 58-
28). This reflects that the grade of the virgin asphalt binder in combination with the percentage of
the recycled materials controlled the grade of the E & R asphalt binders. The US 54-1 mixes
containing 33% ABR by RAS and US 54-6 mixes containing 31% ABR by RAP had the same
virgin asphalt binder (PG 58-28); however, asphalt binders E & R from US 54-1 samples were

43
stiffer than the E & R from US 54-6 samples. This illustrates the effect of the air-blown asphalt
component existing in the RAS on significantly increasing the stiffness of the E & R asphalt
binders.
0
20
40
60
80
100
120
140
160
[(|G
*|/s
inδ)
E &
R a
spha
lt bi
nder
/ (
|G*|
/sin
δ) R
TFO
age
d vi
rgin
asp
halt
bind
er]
E & R asphalt binders' codes
Figure 5-4. Rutting Parameter Ratio, Measured at the High PG Temperature of the Virgin Asphalt Binders, for the E & R Asphalt Binders from the Plant Mixes and the
Corresponding RTFO-aged Virgin Asphalt Binders
The rutting parameter derived from master curves for the E & R asphalt binders from the plant
mixes and the corresponding RTFO-aged virgin asphalt binders at 60°C is presented in Figure 5-5.
For the RTFO-aged virgin asphalt binders, the MO 13-1 PG 64 H showed the highest stiffness as
compared to other RTFO-aged virgin asphalt binders through different frequencies. This
difference had predominantly appeared at the lower frequencies more than the higher frequencies.
For the samples containing RAP, all the E & R asphalt binders showed a higher stiffness as
compared to the corresponding RTFO-aged virgin asphalt binders. The highest rutting parameter
values were obtained for asphalt binders E & R from samples containing 33% ABR percentage by
RAS (US 54-1). The difference in binder stiffnesses for these materials as evidenced by the spread
between curves is quite drastic, considering that a log-log plot was used to display the data. One
log cycle decade represents a 10x change in binder stiffness.

44
0.001
0.01
0.1
1
10
100
1000
10000
0.0001 0.001 0.01 0.1 1 10 100
Log
|G*|
/sin
δat
60°
C (k
Pa)
Log reduced frequency (Hz)
MO 13-1 PG 64 H RTFO Aged VirginMO 13-1-HP13-PG 64 H (17-0)MO 13-1-HP16- PG 64 H (17-0)MO 13-1-HP14- PG 64 H (17-0)US 54 PG 58 RTFO Aged VirginUS 54-6-HP3-PG 58 (31-0)US 54-6-DP4A-PG 58 (31-0)US54-6-DP4B-PG 58 (31-0)US 54-1-1DCTP1B-PG 58 (0-33)US 54-1-1DCTP2B-PG 58 (0-33)US 54-1-1DCTP1A-PG 58 (0-33)US 63-1 PG 58 RTFO Aged VirginUS 63-1-HP8-PG 58 (35-0)US 63-1-HP9- PG 58 (35-0)US 63-1-DP3A- PG 58 (35-0)
RTFO aged virgin asphalt binders
E & R asphaltbinders frommixes containingRAP
E & R asphaltbinders from mixescontaining RAS
Figure 5-5. Master Curve for the E & R Asphalt Binders from the Plant Mixes and the
Corresponding RTFO Aged Virgin Asphalt Binders Measured at 60°C
The Cole-Cole plots analyzed at 60°C for the RTFO-aged virgin and the E & R asphalt binders
from MO 13-1, US 54, and US 63-1 plant mixes are presented in Figure 5-6-a, Figure 5-6-b, and
Figure 5-6-c, respectively. These plots are used to illustrate the relation between loss (Gʺ) and
storage (Gʹ) moduli (Airey, 1997; Ashish et al., 2017). ‘Loss’ represents the purely viscous portion
of the response, while ‘Storage’ refers to the elastic portion. For the E & R asphalt binders, a
downward shift towards the Gʹ axis and to the right-hand side of the curve can be observed. This
indicated an increase in the elastic behavior (Deef-Allah et al., 2019) of the E & R asphalt binders.
Figure 5-6-d, Figure 5-6-e, and Figure 5-6-f show the black diagrams measured at 60°C for
the RTFO aged virgin and the E & R asphalt binders from MO 13-1, US 54, and US 63-1 plant
mixes, respectively. These diagrams show the relationship between the |G*| and δ. A shift towards
higher |G*| values and increasing elasticity (lower δ values) was observed for RAP, and especially,
RAS mixtures. The maximum shift was observed for asphalt binders E & R from US 54-1
(containing 33% ABR percentage by RAS) and US 63-1 (containing 35% ABR percentage by
RAP). These enhancements in stiffness and elasticity are useful in terms of their effect on rutting
resistance, but may provide significant trade-offs in terms of decreased cracking resistance.

45
0.001
0.1
10
1000
100000
0.00001 0.001 0.1 10 1000 100000
Log
G'' a
t 60°
C (k
Pa)
Log G' at 60°C (kPa)
(a) Cole-Cole plot for MO 13-1
MO 13-1 PG 64 H RTFO Aged VirginMO 13-1-HP13-PG 64 H (17-0)MO 13-1-HP16- PG 64 H (17-0)MO 13-1-HP14- PG 64 H (17-0) 0.001
0.1
10
1000
100000
0.00001 0.001 0.1 10 1000 100000
Log
G'' a
t 60°
C (k
Pa)
Log G' at 60°C (kPa)
(b) Cole-Cole plot for US 54
US 54 PG 58 RTFO Aged VirginUS 54-6-HP3-PG 58 (31-0)US 54-6-DP4A-PG 58 (31-0)US54-6-DP4B-PG 58 (31-0)US 54-1-1DCTP1B-PG 58 (0-33)US 54-1-1DCTP2B-PG 58 (0-33)US 54-1-1DCTP1A-PG 58 (0-33)
0.001
0.1
10
1000
100000
0.00001 0.001 0.1 10 1000 100000
Log
G'' a
t 60°
C (k
Pa)
Log G' at 60°C (kPa)
(c) Cole-Cole plot for US 63-1
US 63-1 PG 58 RTFO Aged VirginUS 63-1-HP8-PG 58 (35-0)US 63-1-HP9- PG 58 (35-0)US 63-1-DP3A- PG 58 (35-0) 30
40
50
60
70
80
90
100
0.001 0.1 10 1000 100000
δ at
60°
C (d
egre
es)
Log |G*| at 60°C (kPa)
(d) Black diagram for MO 13-1
MO 13-1 PG 64 H RTFO Aged VirginMO 13-1-HP13-PG 64 H (17-0)MO 13-1-HP16- PG 64 H (17-0)MO 13-1-HP14- PG 64 H (17-0)
30
40
50
60
70
80
90
100
0.001 0.1 10 1000 100000
δ at
60°
C (d
egre
es)
Log |G*| at 60°C (kPa)
(e) Black diagram for US 54
US 54 PG 58 RTFO Aged VirginUS 54-6-HP3-PG 58 (31-0)US 54-6-DP4A-PG 58 (31-0)US54-6-DP4B-PG 58 (31-0)US 54-1-1DCTP1B-PG 58 (0-33)US 54-1-1DCTP2B-PG 58 (0-33)US 54-1-1DCTP1A-PG 58 (0-33) 30
40
50
60
70
80
90
100
0.001 0.1 10 1000 100000
δ at
60°
C (d
egre
es)
Log |G*| at 60°C (kPa)
(f) Black diagram for US 63-1
US 63-1 PG 58 RTFO Aged VirginUS 63-1-HP8-PG 58 (35-0)US 63-1-HP9- PG 58 (35-0)US 63-1-DP3A- PG 58 (35-0)
Figure 5-6. Cole-Cole plots and Black Diagrams Analyzed at 60°C for the E & R Asphalt
Binders from the Plant Mixes and the Corresponding RTFO Aged Virgin Asphalt Binders
Figure 5-7 presents the MSCR test results for the E & R asphalt binders from the plant mixes
and the corresponding RTFO-aged virgin asphalt binders measured at 0.1 and 3.2 kPa stress levels
and the high PG temperatures of the virgin asphalt binders. Replicated measurements were

46
implemented to ensure the repeatability of this test. Figure 5-7-a shows the Jnr at 0.1 and 3.2 kPa
stress levels (Jnr0.1 and Jnr3.2). COV values with less than 6.43, 2.81, and 11.11% were found for
the RTFO-aged virgin binders, E & R binders from mixes containing RAP, and E & R binders
from mixes containing RAS, respectively. The MO 13-1 PG 64H RTFO aged virgin asphalt binder
had the lowest Jnr value as compared to the other two RTFO aged virgin asphalt binders due to its
very high stiffness. As expected, the Jnr values decreased for all E & R asphalt binders as compared
to the corresponding RTFO-aged virgin binders. This was related to the increase in the stiffness of
these E & R asphalt binders resulting from the aged asphalt binders present in the RAP and the
stiff, aged air-blown asphalt present in the mixes containing RAS. The increase in the stiffness was
demonstrated through increases in |G*|, |G*|/sinδ, the rutting parameter, and the PG high
temperature grade. The lowest Jnr values were obtained for the asphalt binders E & R from mixes
containing RAS (US 54-1), indicating the presence of a stiff, elastic binder. Figure 5-7-b shows
the %R at 0.1 and 3.2 kPa stress levels (R0.1 and R3.2). COV values with less than 10.99, 3.53,
and 2.28% were obtained for the RTFO aged virgin binders, E & R binders from mixes containing
RAP, and E & R binders from mixes containing RAS, respectively. For the RTFO-aged virgin
asphalt binders, the highest %R values were obtained for MO 13-1 PG 64 H. Moreover, both US
54 PG 58 and US 63-1 PG 58 RTFO aged virgin asphalt binders had a zero R3.2. However, the E
& R asphalt binders showed an enhancement in the %R values. The highest %R values were
obtained for the asphalt binders E & R from mixes containing RAS (US 54-1). The increase in the
%R values for the E & R asphalt binders was related to the enhancement in the elasticity values
(lower δ and higher Gʹ values).
To compare the RTFO-aged virgin asphalt binders to those associated with the E & R samples,
the percentage increase in %R and the percentage decrease in Jnr are illustrated in Figure 5-7-c, for
binders tested at the 0.1 kPa stress level. The R3.2 values for the RTFO-aged virgin asphalt binders
were both equal to zero. For most samples, the percentage decrease in the Jnr0.1 value was nearly
100%. The highest percentage of decrease in the Jnr0.1 was obtained for asphalt binder E & R from
samples containing RAS. Furthermore, the percentage of increase in the R0.1 reached the highest
values for asphalt binders E & R from US 54-1 mixes containing 33% ABR by RAS. This was
related to the stiffness and elastic behavior of the air-blown asphalt component in the RAS. Also
as expected, increasing the ABR by RAP boosted the percent increase in R0.1.

47
0
1
2
3
4
5
J nr(k
Pa−1
)
(a) Jnr measured at 0.1 and 3.2 kPa stress levels Jnr0.1 Jnr3.2
0
20
40
60
80
100
%R
(b) %R measured at 0.1 and 3.2 kPa stress levelsR0.1 R3.2
-200200600
10001400180022002600
Perc
enta
ge o
f inc
reas
e in
R0.
1 an
d de
crea
se in
J nr0
.1 (%
)
(c) Percentages of increase in %R & decrease in Jnr at 0.1 kPa stress level
Jnr0.1 R0.1
Figure 5-7. MSCR Test Results for E & R Asphalt Binders from the Plant Mixes and the
Corresponding RTFO Aged Virgin Asphalt Binders Measured at the High PG Temperature of the Virgin Asphalt Binders

48
5.2. Summary of Other Binder Tests Performed
Following the general flow of testing presented in Section 5.1, binder testing on E&R binders
from other plant-produced and field-cored sections were also performed. For brevity, a full
summary of these results can be found in Appendix A.2. The key findings of these results can be
summarized as:
• RAS, while adding significant overall stiffness to the binder system, does not always
yield the highest stiffness values at a particular testing temperature (for instance, at
the PG intermediate binder testing temperature, which is used for fatigue cracking
assessment). Thus, it is important to conduct a full binder characterization, and to
conduct tests on the mixture.
• A fraction of rubber particles can be captured in at least two different places in the
E&R apparatus. Thus, binder test results on E&R binders from mixtures containing
GTR are not expected to be fully representative of the stiffening and strengthening
effect of rubber in asphalt. This also reinforces the importance of mixture testing.
• The use of rejuvenators (Evoflex, for instance) tended to increase the stiffness of the
E & R asphalt binders, perhaps counterintuitively. This was likely due to the increased
blending or incorporation of the recycled materials with the virgin binder. This
increased ‘interaction process’ between the binder from recycled material
(RAP/RAS) and the virgin asphalt binder might therefore be expected to cause a
decrease or mixed results in mixture cracking test scores, especially those that are
heavily weighted towards stiffness rather than strength or total fracture energy. Such
is the case with the I-FIT and IDEAL tests. Thus, contractors may not be incentivized
to use rejuvenators when these tests are specified.
• The virgin binders used in the investigated mixtures graded out as either PG 58-XX
or PG 70-XX (the latter was in fact PG 64-22H, MSCR graded binder).
o Recycled mixtures produced with the PG 58-XX did much better in terms of
binder cracking test scores, while those produced with the stiffer PG70-XX
binder had better rutting scores.

49
o The resulting PG high temperature grade of the E&R binders, which contain
virgin binder plus stiffening contributions from RAP, RAS and/or GTR
depending on the section investigated varied over a wide range (Figure 5-8).
This range included: PG 70-XX, PG 76-XX, PG 82-XX, PG 88-XX, and even
PG 94-XX). In comparison, the Missouri climate is PG 64-XX, and factoring
in traffic intensity for state roads utilizing Superpave mixes, the plan or target
PG grade should be in the range of PG 70-XX to PG 76-XX.
o Of the E&R samples investigated (there are 23 samples plotted in Figure 5-8
that are not virgin binder reference samples), 10 graded out at PG 70-XX and
5 graded out at PG 76-XX, for a total of 15-out-of-23 samples (about two-
thirds) grading out in the desired target range. The other 8 samples graded
between one and three grades higher than PG 76-XX.
o It is suspected (and moreover, desired) that the trend of about one-third of
Missouri mixes having over-stiffened binder systems may lessen in the near
future as the full roll-out of BMD proceeds across the state. If working as
intended, the new mixture cracking test requirements should help correct the
imbalance in these mixtures, i.e., stiff/brittle mixtures displaying field
cracking and very low Hamburg rut depths.
o Improved binder and mixture cracking test scores in the future will result from
the use of: (1) softer base (virgin) binders; (2) increased virgin binder content
(possibly resulting from lower design voids and/or higher mixture VMA); (3)
the use of certain rejuvenators (at certain concentration levels), considering
that the use of rejuvenators can either soften or stiffen the resulting binder
system depending on a number of variables; (4) the proper use of additives
such as GTR or waste plastic, but only when combined with other stiffness-
reducing strategies (such as with the use of a softer base binder); and/or the
use of lower recycled material quantities and less stiff recyclates (such as less
aged RAP sources).

50
46
52
58
64
70
76
82
88
94H
igh
PG te
mpe
ratu
re (°
C)
Sample code
Figure 5-8. The High PG Temperatures for the RTFO Aged Virgin and E & R Asphalt Binders from Different Field Mixes, Constructed in 2016

51
6. MIXTURE TESTING RESULTS
6.1. DC(T) Results for Lab Mixtures in the Fix-the-Mix Study Task
Figure 6-1 shows the DC(T) fracture energy for the five iterations undertaken for the US63_1
mix. This study adopted a fixed test temperature of -12°C, based on the mid-Missouri climatic
conditions which usually call for a PGXX-22 plan binder grade (where XX varies depending on
design traffic and geographic location in Missouri). Results show that the control mix (no
additional modifications) had very low fracture energy compared to the lowest recommended
threshold for mainline mixes in Missouri: 400 J/m2 for lower traffic volume roads (W. G. Buttlar,
Urra-Contreras, et al., 2020), and 500 J/m2 for moderate traffic volume routes. The roads
investigated herein are borderline between the low/moderate traffic volume level categories (W.
G. Buttlar, Urra-Contreras, et al., 2020). The lower fracture energy could be attributed to the
absence of bumping (softening) of the virgin binder grade considering the high ABR level of the
mixture. Thus, a softer binder grade was used as a first step to improve/balance performance. The
softer binder grade mix, with and without rejuvenator, performed better in fracture energy but was
still below the lowest desired threshold of 400 J/m2.
For the next iteration, 10% dry-process ground tire rubber was added to the mix along with
the softer binder. The modification proved to be beneficial with a fracture energy increase of about
80 J/m2. For the final iteration, 20% rubber with softer binder grade led to a fracture energy
increase of close to 150 J/m2 as compared to the control mixture, pushing it just beyond the 400
J/m2 threshold for low traffic routes in Missouri.

52
260304
285
339403
200
300
400
500
600
700
Frac
ture
Ene
rgy
at -1
2 ℃
(J/m
2 )
Figure 6-1. DC(T) Fracture Energy Test Results for US63_1 Mixtures
Figure 6-2 shows the fracture energy results obtained from DC(T) testing at -12 ℃ for the
US54_6 mix iterations. The control mix, which had 29.4% ABR, resulted in average fracture
energy of 378 J/m2, failing to reach the threshold of 400 J/m2. Adding 3% Evoflex CA to the mix
(US54_6_58_R) did not appreciably alter the fracture energy in this mix. Similar tendencies were
reported in binder testing (Chapter 5). This somewhat unexpected result might be due to the
specific chemical interactions and blending between the binder, RAP, and rejuvenator in this mix
– resulting in slightly lower fracture energy as compared to the control mix. Next, a softer binder
system (PG46-34) was incorporated into the mixture, which led to an improvement in fracture
energy. Compared to the control mix, the DC(T) fracture energy increased by 53 J/m2. This placed
the second trials between the low and moderate traffic level fracture energy thresholds of 400 and
500 J/m2, respectively. Thus, additional trials were carried out to strive towards further
improvements. While retaining the softer virgin binder grade, dry-process GTR was added to the
mixture, at levels of 5% and 20% by weight of the base binder, respectively, in iterations 4 and 5.
The incorporation of 5% rubber by weight of binder (US54_6_46_E5) increased mixture fracture
energy to 483 J/m2. In the final iteration, using 20% GTR, a significant boost in fracture energy
to a level 567 J/m2 was observed, which finally surpassed the fracture energy threshold of 500 J/m2
recommended for medium traffic level road facilities in Missouri. The combination of mix

53
adjustments significantly boosted thermal cracking resistance to a level of about 50% higher than
the original control mix.
378 372431
483
567
200
300
400
500
600
700
Frac
ture
Ene
rgy
at -1
2 ℃
(J/m
2)
Figure 6-2. DC(T) Fracture Energy Test Results for US54_6 Mixtures
6.2. I-FIT Results for Lab Mixtures
The results of SCB (I-FIT) tests performed on the five mixture iterations for the two study
mix types are shown in Figure 6-3. Using a softer binder improved the FI value significantly in the
US54_6 mixture, while it did not significantly affect the US63_1 mixture. In both mixtures, the
rejuvenator did not help to improve the cracking performance as gauged by the FI. When crumb
rubber was added to the mixture with a softer binder, the FI score decreased significantly. This
was in contrast to DC(T) fracture results, where the addition of dry-process GTR and
supplementary binder increased the fracture energy quite significantly in some cases.

54
1.31.0
1.5
0.4 0.4
0.0
1.0
2.0
3.0
4.0
5.0
6.0
7.0
8.0
9.0
Flex
ibili
ty In
dex
2.2
6.5
1.1
2.1
0.8
0.0
1.0
2.0
3.0
4.0
5.0
6.0
7.0
8.0
9.0
Flex
ibili
tyIn
dex
Figure 6-3. Flexibility Index Results for US63_1 and US54_6 Mixtures
6.3. IDEAL CT Results for Lab Mixtures
Figure 6-4 represents IDEAL CT results for the tested mixtures. The use of a softer binder
and rejuvenator in the US63 mixture did not improve the IDEAL CT index. The consistency of
this result between all 3 cracking tests appears to suggest the presence of a relatively weak
aggregate structure in this mixture. However, the softer binder plus rejuvenator had a positive
effect on the CT index for the US54 mixture. However, the use of crumb rubber along with
supplemental binder significantly reduced the IDEAL CT values measured for both mixtures,
consistent with the trend observed in the SCB (I-FIT) results. The disagreement of IDEAL CT and
FI with DC(T) FE test for the rubber modified mixtures is stark and certainly deserves more
investigation in future studies. The intermediate cracking test results are somewhat counter-
intuitive as field results suggest that rubber modification provides cracking resistance benefits to
asphalt mixtures in the field, even under extreme environments and loading conditions (Davison
et al., 2000; Nazzal et al., 2016). For now, it can be reasonably concluded that the different test
modes, test temperatures and loading rates used in the three cracking tests underlie the differences
observed in cracking index trends observed with the mix alterations investigated herein.

55
2628
23
9 9
0
10
20
30
40
50
60
70
CT in
dex
26
4035
914
0
10
20
30
40
50
60
70
CT in
dex
Figure 6-4. IDEAL CT Index Results for US63_1 and US54_6 Mixtures
6.4. Hamburg Results for Lab Mixtures
The rutting resistance of the baseline control mixtures was excellent, providing a large factor
of safety and motivation for the mixture iterations described in the preceding sections (aimed at
‘softening’ the mix and other strategies to increase crack resistance). The results of the mixture
iterations are shown in Figure 6-5. Replacing the base binder with the softer binder grade increased
the max rut depths measured, as expected, but well within recommended tolerances (W. G. Buttlar,
Urra-Contreras, et al., 2020). Notably, the addition of rubber not only increased the fracture energy
but also helped in increasing the rut resistance (GTR mixes possessed the lowest HWTT rut
depths).
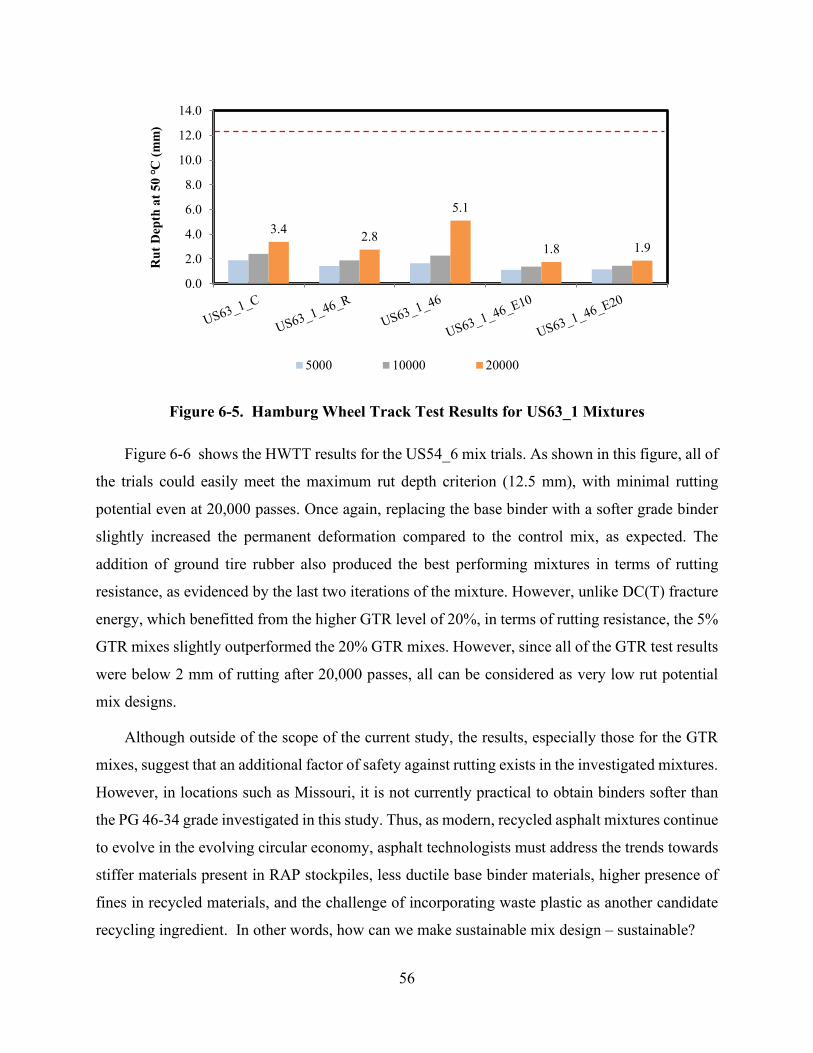
56
3.4 2.8
5.1
1.8 1.9
0.0
2.0
4.0
6.0
8.0
10.0
12.0
14.0
Rut
Dep
th a
t 50
℃ (m
m)
5000 10000 20000
Figure 6-5. Hamburg Wheel Track Test Results for US63_1 Mixtures
Figure 6-6 shows the HWTT results for the US54_6 mix trials. As shown in this figure, all of
the trials could easily meet the maximum rut depth criterion (12.5 mm), with minimal rutting
potential even at 20,000 passes. Once again, replacing the base binder with a softer grade binder
slightly increased the permanent deformation compared to the control mix, as expected. The
addition of ground tire rubber also produced the best performing mixtures in terms of rutting
resistance, as evidenced by the last two iterations of the mixture. However, unlike DC(T) fracture
energy, which benefitted from the higher GTR level of 20%, in terms of rutting resistance, the 5%
GTR mixes slightly outperformed the 20% GTR mixes. However, since all of the GTR test results
were below 2 mm of rutting after 20,000 passes, all can be considered as very low rut potential
mix designs.
Although outside of the scope of the current study, the results, especially those for the GTR
mixes, suggest that an additional factor of safety against rutting exists in the investigated mixtures.
However, in locations such as Missouri, it is not currently practical to obtain binders softer than
the PG 46-34 grade investigated in this study. Thus, as modern, recycled asphalt mixtures continue
to evolve in the evolving circular economy, asphalt technologists must address the trends towards
stiffer materials present in RAP stockpiles, less ductile base binder materials, higher presence of
fines in recycled materials, and the challenge of incorporating waste plastic as another candidate
recycling ingredient. In other words, how can we make sustainable mix design – sustainable?
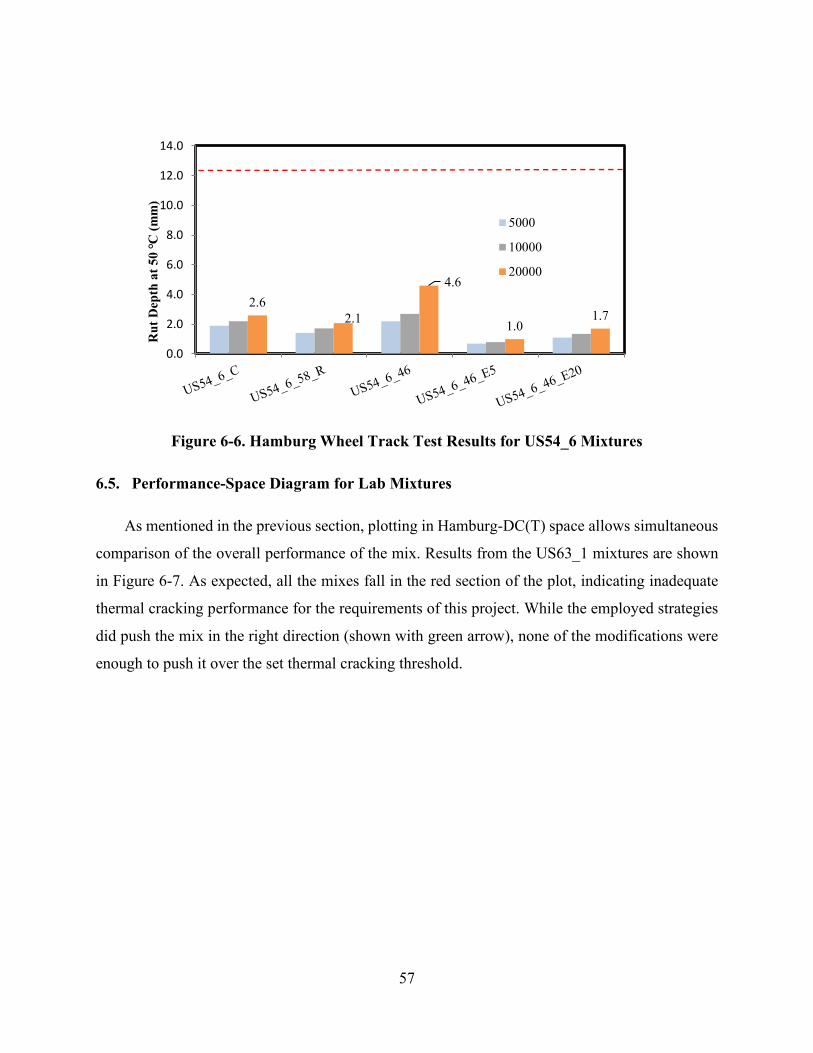
57
2.62.1
4.6
1.01.7
0.0
2.0
4.0
6.0
8.0
10.0
12.0
14.0R
ut D
epth
at 5
0 ℃
(mm
)
5000
10000
20000
Figure 6-6. Hamburg Wheel Track Test Results for US54_6 Mixtures
6.5. Performance-Space Diagram for Lab Mixtures
As mentioned in the previous section, plotting in Hamburg-DC(T) space allows simultaneous
comparison of the overall performance of the mix. Results from the US63_1 mixtures are shown
in Figure 6-7. As expected, all the mixes fall in the red section of the plot, indicating inadequate
thermal cracking performance for the requirements of this project. While the employed strategies
did push the mix in the right direction (shown with green arrow), none of the modifications were
enough to push it over the set thermal cracking threshold.

58
0.0
5.0
10.0
15.0
20.0
25.00 100 200 300 400 500 600 700 800 900 1000
Ham
burg
Rut
Dep
th a
t 200
00 p
asse
s [m
m]
DC(T) Fracture Energy [J/m2]
US63_1_CUS63_1_46_RUS63_1_46US63_1_46_E10US63_1_46_E20
Figure 6-7. Hamburg-DC(T) Performance Space Diagram for US63_1 Mixture
Although the addition of rubber helped to improve the mix in terms of thermal cracking and
rutting, the mixture was still very prone to thermal cracking with the fracture energy barely
crossing the lowest threshold of 400 J/m2. This could be due to the poor quality of aggregates used
in this mix. Thus, another local mix design was adopted to be modified following BMD principles.
This failed mix iteration, however, showed the immense potential of ground tire rubber in resisting
thermal cracking and improving rut resistance of the asphalt mixture.
Figure 6-8 shows the DC(T) and Hamburg results for US54_6 mixture iterations. As seen
from the plot, the addition of rejuvenator and then replacing the base binder with softer binder
pushed the mixture towards better fracture energy but sacrificed rut resistance (shown with blue
arrow). However, the addition of rubber in conjunction with softer grade binder replenished the
rut resistance of the mix and added thermal cracking resistance, allowing the mix to cross the set
threshold (shown with green arrow).

59
0.0
5.0
10.0
15.0
20.0
25.00 100 200 300 400 500 600 700 800 900 1000
Ham
burg
Rut
Dep
th a
t 200
00 p
asse
s [m
m]
DC(T) Fracture Energy [J/m2]
US54_6_CUS54_6_58_RUS54_6_46US54_6_46_E5US54_6_46_E20
Figure 6-8. Hamburg-DC(T) Performance Space Diagram for US54_6 Mixture
In summary, as shown in the previous sections, the 1st mix iteration, US63_1, could not pass
the thermal cracking threshold adopted for this study. Thus, a 2nd mix iteration, US54_6, was tried,
and various modification strategies were tried in line with the concepts of BMD. Finally, by using
softer grade binder and rubber in conjunction, the thermal and rutting thresholds were achieved.

60
7. COMPARISON OF E & R BINDER AND MIXTURE TESTING RESULTS
7.1. High-Temperature Results
7.1.1. Mixes Constructed and Sampled in 2016 Figure 7-1 presents Hamburg wheel tracking results for mixtures constructed in 2016 first
reported by Buttlar et al. (2019), plotted along with the PGHT grade of the virgin binders used.
Hamburg results for the US54_4 and US54_2 mixes indicated the lowest rut depth. The recycled
material percentage used in these mixes was relatively high, and for comparison, note that the
MO13_1 mix had a lower RAP level and exhibited a higher rut depth. The US63_1 section was
among the highest in rut depth. Although it had a similar RAP content as US54_4 and US54_2, it
utilized a softer virgin binder. From a BMD perspective, viewing rut depths alone is not sufficient
to determine if a mix is well-balanced. Very low Hamburg rut depths (for instance, below 3 mm)
often come at the expense of lower cracking test scores for dense-graded mixtures (and therefore
unbalanced mixes).
Figure 7-1. Hamburg Rut Depths (at 10k & 20k passes) for Sections Constructed in 2016
The temperature sweep test results for the E & R asphalt binders from field mixes constructed
in 2016 are presented in Figure 7-2. The US54_4 and US54_2 binders had the highest Superpave
7.3
4.4
2.7 2.3 2.12.8
1.7 1.8
3.3
1.7 2.03.0
1.9
10.4
3.4 3.62.6 1.8
7.7
14.2
3.8 3.3 2.8 3.2
2.1 2.1
4.6
2.02.6
9.5
2.1
10.9
4.4 4.63.5 2.1
46
52
58
64
70
76
0
5
10
15
MO
13_1
(17-
17-0
)
US6
3_1
(35-
35-0
)
US5
4_6
(31-
31-0
)
US5
4_1
(33-
0-33
)
US5
0_1
(25-
25-0
)
MO
52_1
(34-
0-34
)
US6
3_2
(30-
20-1
0)
US5
4_2
(33-
33-0
)
US5
4_3
(33-
18-1
5)
US5
4_4
(35-
35-0
)
US5
4_5
(0-0
-0)
US5
4_7
(0-0
-0)
US5
4_8
(9-9
-0)
SPS1
0-1
(24-
24-0
)
SPS1
0-2
(25-
25-0
)
SPS1
0-3
(25-
25-0
)
SPS1
0-6
(17-
0-17
)
SPS1
0-9
(46-
16-3
0)
Vir
gin
Bin
der
PGH
T [C
]
Rut
Dep
th [
mm
]
Hamburg Rut Depth at 10k passesHamburg Rut Depth at 20k passesVirgin Binder PGHT

61
rutting parameter scores, which agreed with Hamburg mix test results. Some difference in high
temperature scoring occurred when comparing predominantly RAS vs. predominantly RAP mixes.
As mentioned earlier in the report, the binders found in RAS used in Missouri are stiffer than the
binders found in Missouri RAP. However, for E & R binders obtained from mixes containing RAS,
the resistance to rutting was measured to be lower than binders E & R from mixes containing RAP.
This is assumed to have occurred due to the lack of full interaction between the binders included
in the RAS and the virgin asphalt binders. The binder data presented in Figure 7-3 and Figure 7-4
reinforced this observation.
Figure 7-5 shows the MSCR test results for the binders E & R from field mixes constructed
in 2016. The binders E & R from the US54_5, US54_4, and US54_2 showed the highest percent
recovery (elastic behavior). Additionally, the US54_4 and US54_2 binders presented the lowest
Jnr values (permanent deformation). Again, this ranking is in agreement with the mix testing
results.
Figure 7-2. Temperature Sweep Test Results for E & R Binders from Field Mixes
Constructed in 2016
0
50
100
150
200
250
52 58 64 70 76 82 88 94 100
|G*|
/sinδ
(kPa
)
Temperature (°C)MO13_1 (17-17-0) US54_6 (31-31-0) US54_2 (33-33-0)US54_1 (33-0-33) US54_3 (33-18-15) US54_4 (35-35-0)US54_5 (0-0-0) US63_1 (35-35-0)
0
20
40
60
52 64 76 88 100
|G*|
/sinδ
(kPa
)
Temperature (°C)

62
Figure 7-3. High PG Temperature for E & R Binders from Field Mixes Constructed in
2016
Figure 7-4. Master Curve Measured at 60°C for E & R Binders from Field Mixes
Constructed in 2016
46
52
58
64
70
76
82
88
94
Hig
h PG
tem
pera
ture
(°C
)
Sample code
0.01
0.1
1
10
100
1000
0.0001 0.001 0.01 0.1 1 10 100
Log
|G*|
/sin
δat
60°
C (k
Pa)
Log reduced frequency (Hz)MO13_1 (17-17-0) US54_6 (31-31-0) US54_2 (33-33-0)US54_1 (33-0-33) US54_3 (33-18-15) US54_4 (35-35-0)US54_5 (0-0-0) US63_1 (35-35-0)

63
Figure 7-5. MSCR Test Results Measured at 60°C for E & R Binders from Field Mixes
Constructed in 2016
0
20
40
60
80
Perc
enta
ge o
f rec
over
y (%
R)
Sample code
(a) %R
R0.1 R3.2
0
0.2
0.4
0.6
0.8
1
J nr(k
Pa−1
)
Sample code
(b) Jnr
Jnr0.1 Jnr3.2
7.1.2. Field and Plant Mixes Constructed in 2016 and their E & R Asphalt Binders For the plant mixes presented in Figure 7-6, the lowest resistance to rutting was observed for
the MO13_1 mix. As reported by Buttlar et al. (2019), this likely occurred due to the nature of the
aggregates and their interaction with the binder system. By contrast, the worst resistance to rutting
illustrated in Figure 7-7 to 10 was noted for binders E & R from the US54_6 mix. While on one
hand the MO13_1 mix contained a lower percentage of recycled materials than US56_6; on the
other hand, it contained a stiffer virgin asphalt binder. Thus, the MO13_1 E & R binders showed
higher resistance to rutting than the US 54_6 E & R binders. The asphalt binder included in the
US63_1 mix was softer than the binder included in the US54_6 mix. However, the US 63_1 mix
contained a higher percentage of recycled materials than the US 54_6 mix. Therefore, the binder
E & R from the US54_6 showed the lowest rutting resistance.

64
The US54_6 and US63_1 plant mixes showed similar resistance to rutting (Figure 7-6). In
contrast, the asphalt binders E & R from these two mixes exhibited different binder rutting scores
(Figure 7-7, Figure 7-8, Figure 7-9, Figure 7-10). The binders E & R from the US63_1 was stiffer
than the binders E & R from the US54_6 mixes. The virgin asphalt binder included in the US63_1
mix was softer than the virgin binder used in the US54_6 mixes. However, the US63_1 contained
a higher ABR percentage by RAP than the US54_6 by 4%.
The US54_1 plant mix (containing RAS) showed the highest resistance to rutting as illustrated
in Figure 7-6. The same observations were noted for the E & R asphalt binder from the temperature
sweep test results in Figure 7-7. The high PG temperature for the binder E & R from this mix
exceeded 94°C (Figure 7-8). This E & R binder showed the highest rutting parameter at different
frequencies and the highest %R in Figure 7-9 and 10-a, respectively. The Jnr values for this binder
at 0.1 and 3.2 stress levels reached approximately zero, as illustrated in Figure 7-10b, indicating
very high stiffness and elasticity.
For the field mixes and the corresponding E & R asphalt binders, a lower rutting resistance
was noted as compared to those of the plant mixes. It is hypothesized that more interaction
processes occurred between the virgin and recycled binders in the plant mixes. After sampling the
plant mixes from behind the paver, the reheating process before the compaction process in the lab
appeared to have caused more interaction to occur. The interaction process for the US54_1 field
mix did not appear to be sufficient to achieve full interaction between the virgin and RAS binders.
Thus, binders E & R from the mixes containing RAP showed higher stiffness. For the US54_1
plant mix, a fuller interaction process appeared to have been achieved, as evidenced by the higher
stiffness measured for those E & R binders as compared to the binders E & R from the mixes
containing RAP.

65
Figure 7-6. Comparing HWTT Rut Depth of Field Cores and Plant Mixes from 2016
Sampling
0
100
200
300
400
500
600
52 58 64 70 76 82 88 94 100
|G*|
/sinδ
(kPa
)
Temperature (°C)MO13_1_F (17-17-0) MO13_1_P (17-17-0) US54_6_F (31-31-0) US54_6_P (31-31-0)
US54_1_F (33-0-33) US54_1_P (33-0-33) US63_1_F (35-35-0) US63_1_P (35-35-0)
0
30
60
90
120
52 64 76 88 100
|G*|
/sinδ
(kPa
)
Temperature (°C)
Figure 7-7. Temperature Sweep Test Results for E & R Binders from 2016 Field and Plant
Mixes

66
Figure 7-8. High PG Temperature for E & R Binders from Field and Plant Mixes
Constructed in 2016
Figure 7-9. Master Curve Measured at 60°C for E & R Binders from Field and Plant Mixes
Constructed in 2016
46
52
58
64
70
76
82
88
94
Hig
h PG
tem
pera
ture
(°C
)
Sample code
Field Plant
0.01
0.1
1
10
100
1000
10000
0.0001 0.001 0.01 0.1 1 10 100
Log
|G*|
/sin
δat
60°
C (k
Pa)
Log reduced frequency (Hz)MO13_1_F (17-17-0) MO13_1_P (17-17-0) US54_6_F (31-31-0)
US54_6_P (31-31-0) US54_1_F (33-0-33) US 54_1_P (33-0-33)
US63_1_F (35-35-0) US 63_1_P (35-35-0)

67
0
20
40
60
80
100
Perc
enta
ge o
f rec
over
y (%
R)
Sample code
(a) %R
R0.1 R3.2
0
0.2
0.4
0.6
0.8
1
J nr(k
Pa−1
)
Sample code
(b) Jnr
Jnr0.1 Jnr3.2
Figure 7-10. MSCR Test Results Measured at 60°C for E & R Binders from Field and
Plant Mixes Constructed in 2016
7.1.3. Lab Mixes and Their E & R Asphalt Binders The Hamburg wheel track test results for the US54_6 and US63_1 lab mixes are presented in
Figure 7-11. The mixes containing engineered crumb rubber (ECR) showed the highest resistance
to rutting. The binders E & R from these mixes had the highest Superpave rutting parameter
presented in Figure 7-12. Furthermore, these binders presented the highest %R and the lowest Jnr
values (Figure 7-13 and Figure 7-14), indicating high stiffness and elasticity in the rubber-modified
binder system. The use of a softer virgin asphalt binder base grade decreased the resistance to
rutting for both the mixes and the corresponding E & R asphalt binders, as expected. Adding
Evoflex to the US54_6_C and US63_2_46 mixes actually increased the rutting resistance in the
mix, where similar results were noted for the corresponding E & R asphalt binders. This result

68
suggests that the Evoflex rejuvenator increased the recycled materials’ contribution inside the
mixes, or stated otherwise, increased the interaction process between the virgin and recycled
binders and, in turn, increased the rutting resistance.
2.62.1
4.6
1.0 1.7
0.0
2.0
4.0
6.0
8.0
10.0
12.0
14.0
Rut
Dep
th a
t 50
℃ (m
m) (a)
50001000020000
3.4 2.8
5.1
1.8 1.9
0.02.04.06.08.0
10.012.014.0
Rut
Dep
th a
t 50
℃ (m
m) (b)
5000 10000 20000
Figure 7-11. Hamburg Wheel Track Test Results for (a) US54_6 and (b) US63_1 Mixes

69
0
100
200
300
46 52 58 64 70 76 82 88 94
|G*|
/sinδ
(kPa
)
Temperature (°C)
(a)
US54_6_C US54_6_58_R US54_6_46US54_6_46_E5 US54_6_46_E20
0
50
100
150
200
250
46 52 58 64 70 76 82 88 94 100
|G*|
/sinδ
(kPa
)
Temperature (°C)
(b)
US63_1_C US63_1_46 US63_1_46_R
US63_1_46_E10 US63_1_46_E20
Figure 7-12. Temperature Sweep Test Results for E & R Binders from (a) US54_6 and (b)
US63_1 lab Mixes

70
Figure 7-13. MSCR Test Results Measured at 60°C for E & R Binders from US54_6 lab
Mixes
0
20
40
60
80
100Pe
rcen
tage
of r
ecov
ery
(%R
)
Sample code
(a) %R
R0.1 R3.2
0
0.2
0.4
0.6
0.8
1
1.2
J nr(k
Pa−1
)
Sample code
(b) Jnr
Jnr0.1 Jnr3.2

71
Figure 7-14. MSCR Test Results Measured at 60°C for E & R Binders from US63_1 lab
Mixes
0
20
40
60
80
100Pe
rcen
tage
of r
ecov
ery
(%R
)
Sample code
(a) %R
R0.1 R3.2
0
0.05
0.1
0.15
0.2
0.25
0.3
J nr(k
Pa−1
)
Sample code
(b) JnrJnr0.1 Jnr3.2
7.2. Intermediate-Temperature Results
In this section, the fatigue resistance results for the long-term aged field mixes and their
corresponding E & R asphalt binders were discussed. The mixes termed as Phase I were cored in
2016, while Phase II coring occurred in 2019. Figure 7-15 illustrates the I-FIT mix cracking test
results obtained for these materials, where the MO 6 W mixes (field-aged about 5 years at the time
of sampling) showed the highest FI scored. In contrast, the lowest FI scores were recorded for the
US54_8, US 36 E, and MO 151 mixes. The MO 151 mix contained 16 and 15% ABR percentages

72
by RAP and RAS, respectively, and was 9 years old at the time of coring. The US 36 E section
contained 25% ABR by RAP and was 8 years old. The US 54_8 mix contained 9% ABR by RAP;
however, it was 10 years old and contained a stiff virgin asphalt binder (PG 70-22). Some mixes
were older than the MO 151 section, namely, MO 94 and US 54_7. However, these older sections
scored in the I-FIT as having higher resistance to fatigue cracking, likely due to the absence of
recycled materials.
Figure 7-15. I-FIT SCB FI and Coefficient of Variability for Long-term Aged Field
Sections
The temperature sweep test results for the E & R asphalt binders from the long-term aged
binders are presented in Figure 7-16. The highest resistance to fatigue cracking was noted for the
binders E & R from the MO 6 mix. This agrees with the mix testing results. However, the lowest
resistance to fatigue cracking was recorded for binders E & R from the MO 151 and US 54 E
mixes. The MO 151 mix contained both RAP and RAS with a total ABR percentage of 31% and
it was 9 years old during the sampling process. The US 54 E was 9 years old and it contained one
of the lowest ABR percentages by RAP (12%), but a stiff virgin asphalt binder (PG 70-22) was
used. Therefore, both the mix and binder testing results agree that the MO 151 samples had low
resistance to fatigue cracking. This suggests that PG 64-22 binder contains polymer and therefore
possesses a low temperature susceptivity, it may not be the best choice for use in mixes containing
MO52_1 US54_8 US50_1 US63_2 US54_7 MO 151 US 36 E US 54 E MO 94 MO 6 W US 61 NDC(T) FE 0.6 0.1 1.4 0.4 1.8 0.3 0.2 0.6 0.8 5.4 0.4COV [%] 45.5 99.6 45.0 27.7 33.5 76.8 21.1 33.8 91.9 61.5 29.2
0.60.1
1.40.4
1.8
0.3 0.2 0.6 0.8
5.4
0.40123456789
10
SCB
-FI
Phase I Phase II

73
recycled materials. As a virgin binder blending component, it is too stiff for use with recycled
mixes in Missouri.
Figure 7-16.Temperature Sweep Test Results for E & R Binders from Long-term Aged Field Mixes
The Superpave fatigue cracking parameter measured at 22°C for the E & R binders is
presented in Figure 7-17. The highest parameter values were recorded for the MO 151 and US 54
E binders indicating the worst fatigue cracking resistance. By contrast, the lowest parameter value
was noted for the MO 6 binders representing the highest resistance to fatigue cracking. The same
observations can be noted from Figure 7-18 that shows the intermediate PG temperature for the E
& R asphalt binders. The MO 151 and US 54 E binders had the highest intermediate PG
temperatures that reflected the worst fatigue cracking resistance. The intermediate temperature for
some binders E & R from both MO 151 and US 54 E mixes exceeded 34°C. Contrarily, the MO 6
binders showed the lowest intermediate PG temperature, which indicated the highest fatigue
cracking resistance. The same results were observed from the master curve in Figure 7-19.
0
5000
10000
15000
20000
25000
30000
7 13 19 25 31 37
|G*|
.sinδ
(kPa
)
Temperature (°C)
MO52_1
US54_8
US50_1
US63_2
US54_7
MO 151
US 36 E
US 54 E
MO 94
MO 6 W
US 61 N
Phase I
Phase II

74
Figure 7-17. Superpave Fatigue Cracking Parameter Measured at 22°C for E & R Binders from Long-term Aged Field Mixes
Figure 7-18. Intermediate PG Temperature for the E & R Binders from Long-term Aged Field Mixes
20000Phase II
)a 16000
kP ( Phase I
C°2 12000
t 2aδn 8000
is|.*|G 4000
0
Sample code
52
46
C) Phase II
°e
(r 40 Phase I
uat 34 32
er 34
p 3130 29 30 29
emt 27
28 26 25
G 24
e P
22
atied
m 16
ertnI 10
Sample code

75
Figure 7-19. Master Curve Measured at 22°C for the E & R Binders from Long-term Aged
Field Mixes
Figure 7-20 illustrates the Nf values measured at 2.5 & 5% strain levels and 22°C reference
temperature for the E & R asphalt binders from the long-term aged field mixes. The highest Nf
values were noted for the binders E & R from the MO 6 mix. The lowest Nf values were recorded
for the US 54 E E & R binders. Some E & R binders from the MO 151 and US 54 E mixes showed
zero Nf values, which represent very poor fatigue cracking resistance. The mix and binder testing
results agreed that the MO 6 section had the highest fatigue cracking resistance. The MO 151
showed the lowest fatigue cracking resistance at 5% strain and had a low I-FIT score of 0.3.
Figure 7-20. Nf at 2.5 and 5% Strain and 22°C for Binder from Long-term Aged Field
Mixes
100
1000
10000
100000
0.0001 0.001 0.01 0.1 1 10 100
Log
|G*|
.sinδ
at 2
2 °C
(kPa
)
Log reduced frequency (Hz)
MO 52-1US 54-8US 50-1US 63-2US 54-7MO 151US 36US 54MO 94MO 6US 61 N
Phase I
Phase II
0
4,000
8,000
12,000
16,000
Nf
Sample code
2.5% strain 5% strain
100
1000
10000
100000
0.0001 0.001 0.01 0.1 1 10 100
Log
|G*|
.sinδ
at 2
2 °C
(kPa
)
Log reduced frequency (Hz)
MO 52-1US 54-8US 50-1US 63-2US 54-7MO 151US 36US 54MO 94MO 6US 61 N
Phase I
Phase II

76
A series of figures were developed to investigate the correlation between binder and
mixture fatigue cracking tests at intermediate temperatures. Figure 7-21 shows that the best
correlation was obtained for the higher strain level binder fatigue test as compared to the FI scores
from the I-FIT mix cracking test. Because the I-FIT is a cracking test driven to failure (a crack is
driven across the notched, semi-circular bend specimen), it can be viewed as a high strain test.
Thus, its higher correlation to the binder fatigue test performed at higher strain (5%) is an intuitive
result.
R² = 0.25
02000400060008000
10000120001400016000
0 2 4 6
|G*|
.sinδ
FI
FI -|G*|.sinδ
R² = 0.44270
2000
4000
6000
8000
10000
12000
0 5000 10000 15000 20000
Nf (
2.5%
)
|G*|.sinδ
|G*|.sinδ-Nf(2.5%)
R² = 0.4508
0
2000
4000
6000
8000
10000
12000
0 2 4 6
Nf (
2.5%
)
FI
FI-Nf(2.5%)
R² = 0.5982
0
100
200
300
400
500
600
0 2 4 6
Nf (
5%)
FI
FI-Nf (5%)
Figure 7-21. Correlation of Binder Nf at Intermediate Temperature with I-FIT FI

77
Figure 7-22 and Figure 7-23 illustrate a mix-by-mix comparison of binder and mixture
cracking test results. In Figure 7-22, a good but not perfectly correlated relationship between
mixture FI (blue bars) and binder stiffness (red dots) can be observed. Figure 7-23, which
compares binder fatigue test results to mixture FI, yielded a similar result.
Figure 7-22. Correlation of the Inverse of Binder |G*|sinδ at Intermediate Temperature
with Mix FI for Field Aged Sections
0.02.04.06.08.010.012.014.016.018.020.0
0
1
2
3
4
5
6
1/(|
G*|.
sinδ)
E5
SCB
(FI)
Mixture
0
100
200
300
400
500
600
0
1
2
3
4
5
6
Nf (
5%)
SCB
(FI)
Mixture
Figure 7-23. Correlation of Nf (5%) Parameter at Intermediate Temperature with FI for Field Aged Sections

78
It is concluded from these plots, and moreover from the collective data presented
throughout this chapter that:
• Binder testing and mixture testing each have their place in asphalt mixture design,
control, and forensic research
o Binder testing showed utility in evaluating the degree of binder interaction in
various sample types (lab, field/plant, field/core)
o Mixture testing showed the benefits of considering aggregate effects, such as
its effect on rut resistance and moisture resistance
• RAS possesses a high melting point and a different binder system as compared to
virgin and RAP binders. This leads to some differences in ranking of binder test
scores on E&R binder material as compared to mix scores.
• Reasonable correlation exists between certain binder intermediate test results and
mixture FI, particularly binder fatigue Nf (at 5% strain) and mixture FI scores (r2 ≈
0.6). This suggests that prior to starting mix design trials, binder testing of proposed
virgin and recycled binder components could be used as a screening tool prior to
conducting more time-consuming mix design trials.

79
8. DEVELOPMENT OF BEST PRACTICES FOR DESIGNING ASPHALT MIXTURES WITH MODERN RECYCLED MATERIALS
8.1. Evaluation of Current Practices for Binder Grade Selection in Missouri
Table 8-1 provides a summary of the target or plan grade of binder for various mixtures
investigated, along with the virgin binder grade selected by the contractor and resulting in-situ
binder grade determined from E&R binders. For newer projects cored shortly after construction,
the E&R binder grade is considered to be in a short-term aging condition, and termed RTFO in
Table 8-1. Results from older, cored projects were considered to be in a long-term aged condition
and labeled as PAV.

80
Table 8-1 Summary of ABR Levels, Binder Grades, and Comparison to New Recommendations for Investigated Mixtures Subjected to Binder testing on E&R Samples
Code Virgin asphalt PG
Contract PG
ABR by RAP (%)
ABR by RAS (%)
Extracted Binder Type*
Extracted Binder
High PG temp.
Comments
US 54_8-6-PG 70 (9-0) 70-22 70-22 9 0 PAV n.a. Appropriate virgin
binder selected US 54_8-4-PG 70 (9-0) US 54_8-3-PG 70 (9-0) US 54-12a-PG 70 (12-0)
70-22 70-22 12 0 PAV n.a. Appropriate virgin binder selected US 54-6a-PG 70 (12-0)
US 54-2a-PG 70 (12-0) MO 13-1-5-PG 64H (17-0)
64-22H 70-22 17 0 RTFO
82 Softer virgin binder suggested MO 13-1-7-PG 64H (17-0) 76 MO 13-1-11-PG 64H (17-0)
US 50-1-9-PG 64 (25-0) 64-22 64-22 25 0 PAV n.a. Softer virgin binder
suggested US 50-1-4-PG 64 (25-0) US 50-1-2-PG 64 (25-0) US 36-10a-PG 64 (25-0)
64-22 64-22 25 0 PAV n.a. Softer virgin binder
suggested
US 36-13a-PG 64 (25-0) US 36-12a-PG 64 (25-0) US 61 N-9a-PG 64H (30-0)
64-22H 64-22H 30 0 PAV n.a. US 61 N-3a-PG 64H (30-0) US 61 N-6a-PG 64H (30-0) MO 6-4a-PG 58 (30-0)
58-28 64-22 30 0 PAV n.a. Appropriate virgin
binder selected
MO 6-5a-PG 58 (30-0) MO 6-10a-PG 58 (30-0) MO 6-11a-PG 58 (30-0) MO 6-8a-PG 58 (30-0) US 54_6-9-PG 58 (31-0)
58-28 70-22 31 0 RTFO 70 US 54_6-7-PG 58 (31-0) US 54_6-2-PG 58 (31-0) US 54_2-7a-PG 58 (33-0)
58-28 70-22** 33 0 RTFO 88
Appropriate virgin binder selected
(However, stiff E&R binder resulted)
US 54_2-6-PG 58 (33-0)
US 54_2-3-PG 58 (33-0)
US 63_1-9-PG 58 (35-0)
58-28 70-22 35 0 RTFO 70 Appropriate virgin binder selected US 63_1-5-PG 58 (35-0)
US 63_1-2-PG 58 (35-0)
US 54_4-1a-PG 64H (35-0) 64-22H 70-22** 35 0 RTFO 70 Softer virgin binder
suggested US 54_4-4a-PG 64H (35-0) US 54_4-7-PG 64H (35-0) US 54_1-2a-PG 58 (0-33)
58-28 70-22** 0 33 RTFO 70 Softer virgin binder
suggested (due to high % RAS)
US 54_1-3a-PG 58 (0-33) US 54_1-4-PG 58 (0-33) MO 52-1-6-PG 64 (0-34)
64-22 64-22** 0 34 PAV n.a. Softer virgin binder
suggested (due to high % RAS)
MO 52-1-3-PG 64 (0-34) MO 52-1-9-PG 64 (0-34) US 63_2-5-PG 64 (20-10)
64-22 70-22** 20 10 PAV n.a.
Softer virgin binder suggested (due to high
total ABR which includes RAS)
US 63_2-2-PG 64 (20-10)
US 63_2-11-PG 64 (20-10)
US 54_3-8a-PG 58 (18-15)
58-28 70-22** 18 15 RTFO 76 Softer virgin binder
suggested (due to high total ABR which includes RAS)
US 54_3-6a-PG 58 (18-15)
US 54_3-2-PG 58 (18-15) 70

81
MO 151-7-PG 64 (16-15)
64-22 64-22 16 15 PAV n.a.
Softer virgin binder suggested (due to high
total ABR which includes RAS), two
grades softer
MO 151-5a-PG 64 (16-15)
MO 151-10a-PG 64 (16-15)
MO 151-2a-PG 64 (16-15)
MO 151-11-PG 64 (16-15)
MO 13-1-HP13-PG 64 H (17-0) 64-22H 70-22 17 0 RTFO 88 Softer virgin binder
suggested MO 13-1-HP16- PG 64 H (17-0) MO 13-1-HP14- PG 64 H (17-0) 82
US 54-6-HP3-PG 58 (31-0)
58-28 70-22 31 0 RTFO 76
Appropriate virgin binder selected
(However, stiff E&R binder resulted)
US 54-6-DP4A-PG 58 (31-0)
US54-6-DP4B-PG 58 (31-0)
US 63_1-HP8-PG 58 (35-0)
58-28 70-22 35 0 RTFO 76
Appropriate virgin binder selected
(However, stiff E&R binder resulted)
US 63_1-HP9- PG 58 (35-0)
US 63_1-DP3A- PG 58 (35-0)
US 54_1-1DCTP1B-PG 58 (0-33)
58-28 64-22** 0 33 RTFO > 94
Softer virgin binder suggested (due to high
total ABR, all by RAS), at least two grades
softer
US 54_1-1DCTP2B-PG 58 (0-33)
US 54_1-1DCTP1A-PG 58 (0-33) * Based upon the construction and sampling years. ** Assumed contract grade 8.2. Best Practice Recommendations for Binder Selection, Use of Rejuvenators and Rubber
The following recommendations for binder selection, use of rejuvenators and ground tire
rubber were prepared based on the mixture and binder performance test results in this project and
other recently completed, related studies. Additional recommendations to aid the mix designer are
provided in Section 8.3. Recommendations are based on total asphalt binder replacement (ABR)
in the mix, which is generally achieved with RAP or RAS in current practice. However, other
recyclates, such as waste plastic, may provide additional sources of binder replacement in the near
future. When designing with a softer binder, best results will be obtained when selecting a binder
that is one grade softer on both the low and high temperature grade. This will create a full grade
bump down across all temperature ranges, i.e., moving from a PG 64-22 to PG 58-28, or in the
MSCR grading system, moving from a PG 64H-22 to PG 58H-28. The next best choice would be
to use a binder that has been bumped downward in terms of the low temperature grade, for instance,

82
from PG 64-22 to PG 64-28. However, this will only drop the intermediate temperature
performance by one-half grade (3 oC), which may limit the improvement observed in the mixture
cracking test, which is run at an intermediate temperature. It may also require a more expensive
binder, such as a polymer modified binder.
Based on the research conducted herein, a rejuvenator is recommended whenever
designing with recycled materials, especially for ABR levels above 15%. This will increase binder
interactivity between the virgin and recycled binder sources. Based on manufacturer’s
recommendations, higher ABR levels will naturally require higher dosages of rejuvenator.
Table 8-2 Recommended Starting Points for Binder Selection, Use of Rejuvenators and GTR for Designing Recycled Mixtures in Missouri
Recycling Content in terms of Asphalt
Binder Replacement Recommendations
0 to 14.9%
No grade bump
Rejuvenator recommended
5-10 % GTR optionally
15.0 to 29.9%
One grade bump softer
Rejuvenator required
10-20% GTR optionally
30% or greater
Two grade bumps softer
Rejuvenator required
10-20% GTR optionally
In addition, when designing with very stiff recycles, such as highly weathered RAP
sources, RAS or waste plastic, it may be necessary to apply a weight factor to the stiffer recyclates.
The MSSHC suggests that for mixes containing both RAP and RAS, the ABR should be computed
as the ABR by RAP plus 2 times the ABR by RAS. A similar weight factor may be necessary for
waste plastic. Finally, as shown in this report, the use of GTR can increase mixture sustainability,
while helping to meet performance test results. Depending on the cracking test selected, it may
also be necessary to select a very soft binder and to increase binder content in the mix containing
GTR, through the use of supplemental binder, increasing mixture VMA and/or regressing air void
83
targets. For the dry-process GTR product studied herein, 0.1% supplemental binder is suggested
by the manufacturer for each 5% of rubber used by weight of virgin binder.
8.3. Other Best Practice Recommendations for Designing Recycled Mixes
Additional recommendations for designing asphalt mixtures containing recycled materials
were prepared based on the binder and mixture test results obtained in this project and other
recently completed studies.
8.3.1 Other Binder-Related Considerations for Designing with Recycled Materials It is recommended to conduct extraction and recovery experiments for each mix containing
recycled materials to check the contract grade in the job mix formula (JMF). This is being
recommended because the high-performance grade (PG) temperature for the majority of the
extracted and recovered (E & R) binders was greater than the high PG temperature of the contract
grade by at least one grade (6°C per grade). The interaction process is the key point for achieving
the compatibility between the virgin and recycled binders. Characterizing the E & R asphalt
binders not only depended upon choosing the appropriate virgin asphalt binder grades, selecting
the percentage of the recycled materials, and following the Missouri standard specifications for
highway construction (MSSHC) but also on achieving the interaction process between the recycled
materials and virgin asphalt binders. For the same mix, changing the interaction process changed
the high PG temperature of the E & R binders (e.g. field and plant samples in Table 8-1). The E &
R binders from the plant mixes showed higher PG temperatures than the high PG temperatures of
the binders E & R from the field mixes.
It is recommended to use a rejuvenator in all mixes containing recycled materials. One of
the challenges in using recycled materials in asphalt mixes is the compatibility process between
the virgin binder and the binders included in the recycled materials. This appeared with changing
the interaction process: the plant samples were collected and reheated in the lab causing more
interaction processes to occur between the virgin and recycled binders. It was found that using
Evoflex rejuvenator enhanced the interaction process between the virgin and recycled binders.
This additive was viewed as increasing the RAP/RAS contribution (blending) in the mixes. Thus,
the interaction process between the virgin and recycled binders increased by increasing the
solubility of the recycled materials.

84
More clarifications are needed in the MSSHC regarding using both RAP and RAS in the
asphalt mixes. In the MSSHC, it was mentioned that for mixes containing both RAP and RAS, the
percent effective virgin binder replacement or asphalt binder replacement (ABR) by RAP plus 2
times the ABR by RAS should be less than or equal to 40%. However, in another portion of the
MSSHC, it was recommended that the ABR by RAP and RAS (not doubled) should be less than
or equal to 40%, which is not identical. Also, according to the MSSHC, PG 64-22 asphalt binder
may be used in mixes containing recycled materials under specific considerations. Consequently,
it is not recommended to use asphalt binders with a PG higher than (64-22). Using asphalt binders
with high PG temperature of 70 was found in this study to reduce the fatigue resistance in mixture
and binder tests. Recommendations for mixes containing waste plastic will also need to be
developed in future research studies.
8.3.2 Other Mixture-Related Considerations for Designing with Recycled Materials In the emerging era of BMD, additional best practices are expected to evolve with respect
to designing mixes with recycled materials to meet BMD requirements while minimizing design
iterations, minimizing cost, and maximizing mixture sustainability. Based on this study, the
following best practice recommendations are suggested:
• When designing at higher ABR levels and/or when using stiff recyclates, additional
strategies may be required beyond virgin binder grade softening and rejuvenator use.
These include:
o Regressing air void targets below the typical 4% target associated with
Superpave, to lower levels such as 3.5%, 3.0%, or perhaps even 2.5%. Care must
be exercised in using very low design void targets, as rutting or flushing potential
may be increased. Rutting potential should be controlled, however, by meeting
Hamburg requirements.
o Use of increased VMA targets.
• When conducting mix design iterations in practice, avoid using a full factorial
experimental design approach, i.e., a strategy where a number of factors are considered
simultaneously and where the complete slate of mixture tests are conducted. Rather:
o Pre-screen binder selection using the techniques suggested in the previous section.
o Transforming older mix designs to meet newer BMD requirements will generally
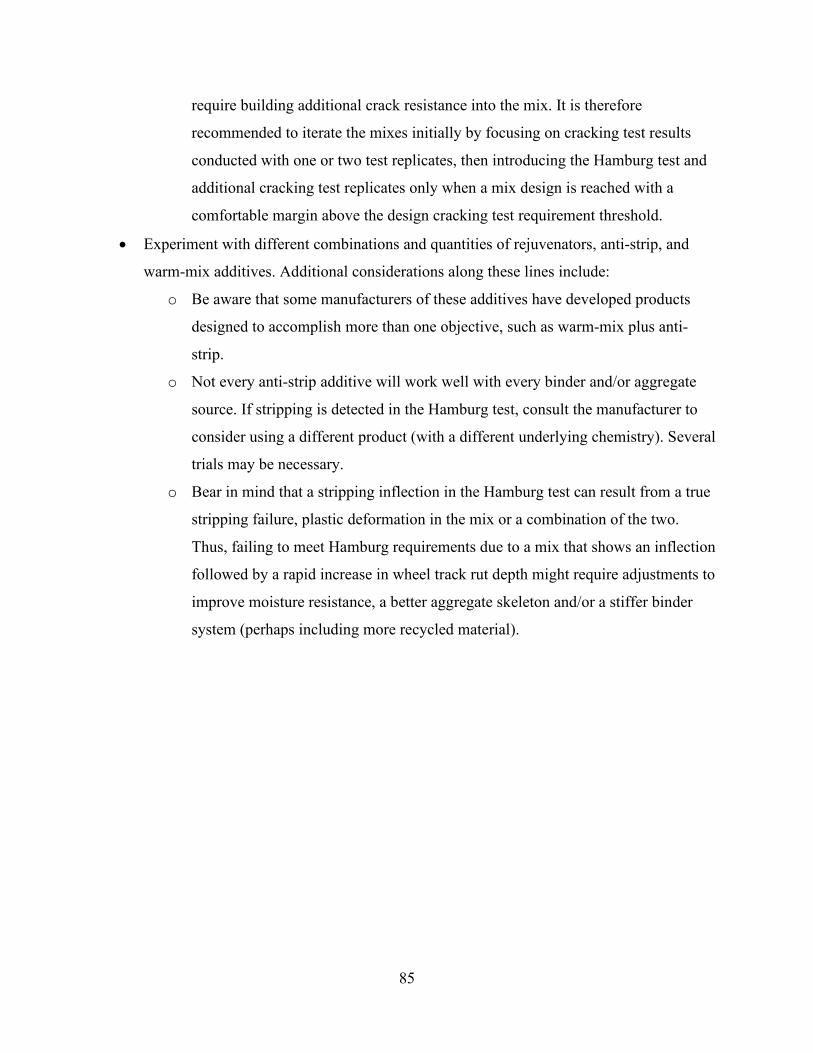
85
require building additional crack resistance into the mix. It is therefore
recommended to iterate the mixes initially by focusing on cracking test results
conducted with one or two test replicates, then introducing the Hamburg test and
additional cracking test replicates only when a mix design is reached with a
comfortable margin above the design cracking test requirement threshold.
• Experiment with different combinations and quantities of rejuvenators, anti-strip, and
warm-mix additives. Additional considerations along these lines include:
o Be aware that some manufacturers of these additives have developed products
designed to accomplish more than one objective, such as warm-mix plus anti-
strip.
o Not every anti-strip additive will work well with every binder and/or aggregate
source. If stripping is detected in the Hamburg test, consult the manufacturer to
consider using a different product (with a different underlying chemistry). Several
trials may be necessary.
o Bear in mind that a stripping inflection in the Hamburg test can result from a true
stripping failure, plastic deformation in the mix or a combination of the two.
Thus, failing to meet Hamburg requirements due to a mix that shows an inflection
followed by a rapid increase in wheel track rut depth might require adjustments to
improve moisture resistance, a better aggregate skeleton and/or a stiffer binder
system (perhaps including more recycled material).

86
9. SUMMARY, CONCLUSIONS AND RECOMMENDATIONS
9.1 Summary
A comprehensive research investigation was carried out to investigate the use of recycled
materials in Superpave asphalt mixtures in Missouri, leading to best practice recommendations
geared towards the achievement of passing mixes as modern, balanced mix design requirements
are rolled out in Missouri. The investigation involved sampling of aggregates, binders, plant-
produced mixtures, and field cores followed by a rigorous lab testing program. Lab testing
included extensive binder extraction and recovery experiments, followed by a comprehensive suite
of advanced binder tests.
An attempt was made to shed light on effective strategies to iterate existing mix designs into
more ‘balanced mix designs’ for modern, heterogeneous recycled mixtures in the Midwest.
Different strategies were employed, such as the use of a softer virgin binder, the addition of a
rejuvenator, and the employment of 5% to 20% of dry-process, engineered crumb rubber by weight
of total binder. Two dense-graded asphalt mixtures designed and placed on Missouri roadways
prior to the use of BMD were adopted as the baseline mix designs. These mixes were subjected to
a suite of cracking and rutting mixture performance tests to establish baseline performance,
followed by four mix design iterations per mix (for a total of 10 investigated mixtures). The DC(T),
I-FIT, IDEAL-CT, and Hamburg wheel tracking tests were used in the performance testing suite.
9.2 Conclusions
Based on the results and analysis reported herein, the following conclusions were drawn:
• For plant mixes, the highest resistance to rutting was observed for asphalt binders E
& R from mixes containing RAS. For mixes containing the same PG virgin binder,
the E & R asphalt binders from mixes containing RAS were stiffer than the E & R
asphalt binders from mixes containing RAP. This demonstrated the effect of the air-
blown asphalt component in the RAS on increasing the stiffness and elasticity of the
E & R asphalt binders.
• The use of a rejuvenator actually increased the stiffness of the E & R asphalt binders.
It is therefore believed that the rejuvenator increased the contribution or blending of
recycled and virgin binders.

87
• The asphalt binders E & R from mixes containing a virgin asphalt binder with a high
PG temperature of 70°C and 12% ABR by RAP showed reduced fatigue cracking
resistance.
• From the standpoint of binder testing, the use of RAS enhanced the resistance of the
E & R asphalt binders to fatigue cracking as compared to binders E & R from mixes
containing RAP. The asphalt binders E & R from mixes containing 34% ABR by
RAS showed higher fatigue cracking resistance than asphalt binders E & R from
mixes containing 25% ABR by RAP.
• For plant mixes, the asphalt binders E & R from mixes containing 33% ABR by RAS
were measured to possess a high PG temperature grade of more than 94°C, while the
binders E & R from mixes containing 31% ABR by RAP had a high PG temperature
grade of 76°C. This was related to the effect of the aged air-blown asphalt binders
included in the RAS.
• However, for field mixes, the E & R asphalt binders from mixes containing either
31% ABR by RAP or 33% ABR by RAS had the same high PG temperature (70°C).
Consequently, the asphalt binders E & R from the plant mixes showed higher PG
temperatures than the binders E & R from the field mixes. This increase was
approximately one to two grades (6°C per grade) for mixes containing RAP and more
than four grades for mixes containing RAS. Thus, the re-heating step implemented for
the plant mixes caused more contribution of the binders included in the recycled
materials especially for the binders existing in the RAS. This contribution increased
the interaction process between the virgin and recycled material binders.
• Engineered crumb rubber (ECR) increased the E & R asphalt binder resistance to
rutting by increasing the stiffness and elasticity. However, during the E & R process,
some rubber was present in the recovered aggregate, and in the fines captured during
the centrifuge stage. Thus, the binder testing results are not expected to be fully
representative of the ECR binder system.
• The ashing MMDM was very sensitive and required a highly skilled operator. It
underestimated the extracted AC percentages if the 100-ml representative sample
contained a high amount of mineral matter. However, the centrifuge MMDM

88
accurately determined the total mineral matter in the extracted effluent.
• The use of softer virgin asphalt binders in recycled mixes containing high ABR
facilitated the E & R process. It was noted that softer binders produced more accurate
and less variable extracted AC percentages. The same results were observed for
mixes containing Evoflex rejuvenator. The use of Evoflex in mixes containing
recycled materials appeared to enhance the contribution of the recycled materials in
these mixes, i.e., enhanced the interaction process between the binders from the
recycled materials with the virgin asphalt binder.
• In the ‘fix-the-mix’ portion of the study, the following conclusions were drawn:
o The strategy of replacing the base binder with a softer virgin binder grade was
generally effective in both investigated mixtures (US63_1 and US54_1).
According to performance test results, it was concluded that the US63
aggregate structure was relatively weak. Therefore, the use of a softer binder
was not as effective as compared to the US54_1 section, where all three
cracking tests showed a positive effect when a softer based binder was used.
The softer base binder led to higher HWTT rut depths, but still far from the
maximum threshold of 12.5 mm even for the highest traffic designs entailing
20,000 wheel track passes.
o In this study, the addition of a rejuvenator was not as effective as the other
strategies investigated. However, the use of a rejuvenator served the purpose
of helping achieve desirable volumetric properties in the mixtures, likely by
increasing the lubricity/workability of the mixtures. According to the results,
when the rejuvenator was eliminated from the mixture, it did not meet the
volumetric properties (4% voids at Ndesign). This suggests the value of using
a rejuvenator when designing high-RAP mixtures.
o Engineered crumb rubber was introduced via a dry-process in an attempt to
further improve the cracking and rutting performance of the mixtures. The
results showed that the DC(T) fracture energy test disagrees with the results
obtained from the SCB (I-FIT) and IDEAL CT-index when GTR was
introduced into the study mixtures. The use of rubber up to 20% increased the
fracture energy of mixtures significantly (almost doubled), while the FI and

89
CT-index scores were significantly reduced. This is somewhat counter-
intuitive as field results suggest that rubber modification provides cracking
resistance benefits to asphalt mixtures in the field, even under extreme
environments and loading conditions. In terms of rutting, the addition of
rubber increased the rutting resistance of the mixtures.
Evaluating BMD optimization as a whole, the use of a softer binder was the most effective
strategy to optimize SCB(I-FIT) and IDEAL CT cracking test scores, while the incorporation of
rubber along with a softer base binder and supplemental binder was the most effective method to
maximize DC(T) fracture energy test results. In all cases, modern recycled mixtures appear to
have a significant factor of safety against rutting, which suggests the increasing importance of
softer virgin binder grades and effective rejuvenators and the importance of accessing these
materials without greatly increasing asphalt mixture costs.
9.3 Recommendations
Based on the findings and conclusions of this study, the following recommendations are made:
• For binder E & R, it is recommended to use the centrifuge MMDM if the filterless
centrifuge device is available.
• The practice of recommending or requiring a softer virgin binder grade when recycled
materials are used should be continued, even as BMD is rolled out. Table 8-1 was
developed, which sets recommended thresholds for virgin binder grade softening
based on research observations.
• When designing with very stiff recyclates, such as highly weathered RAP sources,
RAS or waste plastic, it may be necessary to apply a weight factor to the stiffer
recyclates. The MSSHC suggests that for mixes containing both RAP and RAS, the
ABR should be computed as the ABR by RAP plus 2 times the ABR by RAS. A similar
weight factor may be necessary for waste plastic. Recommendations for rejuvenator
and GTR use were also provided in Table 8-1.
• The use of GTR can increase mixture sustainability, while helping to meet
performance test results. Depending on the cracking test selected, it may also be
necessary to select a very soft binder and to increase binder content in the mix

90
containing GTR, through the use of supplemental binder, increasing mixture VMA
and/or regressing air void targets. For the dry-process GTR product studied herein,
0.1% supplemental binder is suggested by the manufacturer for each 5% of rubber
used by weight of virgin binder.
• Attention should be paid to the availability of softer virgin binder supply in Missouri.
As these recommendations are implemented, and as BMD is rolled out, the current
supply of softer virgin binders may fall short of demand. A staged rollout of BMD
may serve to provide a smooth transition.
• When designing at higher ABR levels and/or when using stiff recyclates, additional
strategies may be required beyond virgin binder grade softening and rejuvenator use.
These include:
o Regressing air void targets below the typical 4% target associated with
Superpave, to lower levels such as 3.5%, 3.0%, or perhaps even 2.5%. Care
must be exercised in using very low design void targets, as rutting or flushing
potential may be increased. Rutting potential should be controlled, however,
by meeting Hamburg requirements.
o Use of increased VMA targets.
o When conducting mix design iterations in practice, avoid using a full factorial
experimental design approach, i.e., a strategy where a number of factors are
considered simultaneously and where the complete slate of mixture tests are
conducted. Transforming older mix designs to meet newer BMD requirements
will generally require building additional crack resistance into the mix. It is
therefore recommended to iterate the mixes initially by focusing on cracking
test results conducted with one or two test replicates, then introducing the
Hamburg test and additional cracking test replicates only when a mix design is
reached with a comfortable margin above the design cracking test requirement
threshold.
• Experiment with different combinations and quantities of rejuvenators, anti-strip, and
warm-mix additives. Additional considerations along these lines include:

91
o Be aware that some manufacturers of these additives have developed products
designed to accomplish more than one objective, such as warm-mix plus anti-
strip.
o Not every anti-strip additive will work well with every binder and/or aggregate
source. If stripping is detected in the Hamburg test, consult the manufacturer
to consider using a different product (with a different underlying chemistry).
Several trials may be necessary.
• Failing to meet Hamburg requirements due to a mix that shows an inflection followed
by a rapid increase in wheel track rut depth might require adjustments to improve
moisture resistance, a better aggregate skeleton and/or a stiffer binder system (perhaps
including more recycled material). A stripping inflection in the Hamburg test can
result from a true stripping failure, plastic deformation in the mix or a combination of
the two.
The movement towards increased sustainability in asphalt mixtures will require
continued balancing of increased recycled material usage, mixture durability, and
mixture economics. Major sacrifices in one or more of these three categories will not
truly lead to long-term, sustainable solutions. Finally, this study highlights the
significant challenges confronting the industry with respect to the need for even softer
base binder supplies and a broad slate of effective rejuvenators, tailored to binders and
aggregates with differing chemical characteristics.

92
10. REFERENCES
ASTM 2172, A. D. (2017). Standard test methods for quantitative extraction of asphalt binder from asphalt mixtures.
AASHTO-M-332. (2020). Standard specification for performance-graded asphalt binder using multiple stress creep recovery (MSCR) test.
AASHTO-T-315. (2019). Standard method of test for determining the rheological properties of asphalt binder using a dynamic shear rheometer (DSR).
AASHTO-T324. (2017). Standard method of test for hamburg wheel-track testing of compacted asphalt mixtures.
AASHTO, R. (2008). Reducing samples of asphalt mixtures to testing size. AASHTO, T. (2014). Standard method of test for estimating damage tolerance of asphalt
binders using the linear amplitude sweep. AbuHassan, Y., Alin, M., Iqbal, T., Nazzal, M., & Abbas, A. R. (2019). Effect of extraction
solvents on rheological properties of recovered asphalt binders. Journal of Transportation Engineering, Part B: Pavements, 145(1), 4018064.
Airey, G. D. (1997). Rheological characteristics of polymer modified and aged binder. PhD Dissertation). University of Nottingham, Nottingham.
Alavi, M. Z., Jones, D., He, Y., Chavez, P., & Liang, Y. (2017). Investigation of the Effect of Reclaimed Asphalt Pavement and Reclaimed Asphalt Shingles on the Performance Properties of Asphalt Binders: Phase 1 Laboratory Testing.
Alavi, Z., He, Y., Harvey, J., & Jones, D. W. (2015). Evaluation of the combined effects of reclaimed asphalt pavement (RAP), reclaimed asphalt shingles (RAS), and different virgin binder sources on the performance of blended binders for mixes with higher percentages of RAP and RAS: a research report from t. University of California (System). Pavement Research Center.
Alvergue, A. J. (2014). Laboratory Evaluation of Asphalt Mixtures and Binders with Reclaimed Asphalt Shingle Prepared Using the Wet Process.
Ashish, P. K., Singh, D., & Bohm, S. (2017). Investigation on influence of nanoclay addition on rheological performance of asphalt binder. Road Materials and Pavement Design, 18(5), 1007–1026.
ASTM-D8225. (2019). Standard test method for determination of cracking tolerance index of asphalt mixture using the indirect tensile cracking test. April, 1–6. https://doi.org/10.1520/D8225-19.Copyright
ASTM. (2013). ASTM D7313-13: standard test method for determining fracture energy of asphalt-aggregate mixtures using the disk-shaped compact tension geometry. In ASTM International, April.
ASTM. (2017). ASTM-D5404:Standard practice for recovery of asphalt from solution using the rotary evaporator. ASTM International West Conshohocken, PA.
ASTM, D. (2012). Standard test method for effect of heat and air on a moving film of asphalt (rolling thin-film oven test). American Society for Testing and Materials, West Conshohocken, PA.
Austerman, A. J., Mogawer, W. S., & Stuart, K. D. (2020). Variability of Reclaimed Asphalt Pavement (RAP) Properties within a State and Its Effects on RAP Specifications. Transportation Research Record, 2674(6), 73–84.
Buttlar, W. G., Hill, B. C., Wang, H., & Mogawer, W. (2016). Performance space diagram for

93
the evaluation of high- and low-temperature asphalt mixture performance. Road Materials and Pavement Design, 1–23. https://doi.org/10.1080/14680629.2016.1267446
Buttlar, W. G., Jahangiri, B., Rath, P., Majidifard, H., Urra, L., Meister, J., & Brown, H. (2020). Development of a performance-related asphalt mix design specification for the illinois tollway. Tollway Report.
Buttlar, W. G., Meister, J., Jahangiri, B., Majidifard, H., & Rath, P. (2019). Performance characteristics of modern recycled asphalt mixes in Missouri, including ground tire rubber, recycled roofing shingles, and rejuvenators.
Buttlar, W. G., Rath, P., Majidifard, H., Dave, E. V., & Wang, H. (2019). Relating DC(t) fracture energy to field cracking observations and recommended specification thresholds for performance-engineered mix design. Transportation Research Circular, E-C251(September), 51–69.
Buttlar, W. G., Urra-Contreras, L., Jahangiri, B., Rath, P., & Majidifard, H. (2020). Support for balanced asphalt mixture design specification development in Missouri.
Buttlar, W., Jahangiri, B., Rath, P., Majidifard, H., Urra, L., Meister, J., & Brwon, H. (n.d.). Develoment of a Performance-Related Asphalt Mix Design Specification for the Illinois Tollway. In Illinois State Toll Highway Authority: Chicago, IL, USA.
Collins-Garcia, H., Tia, M., Roque, R., & Choubane, B. (2000). Alternative solvent for reducing health and environmental hazards in extracting asphalt: An evaluation. Transportation Research Record, 1712(1), 79–85.
Copeland, A. (2011). Reclaimed asphalt pavement in asphalt mixtures: State of the practice. United States. Federal Highway Administration. Office of Research ….
Daniel, J. S., Pochily, J. L., & Boisvert, D. M. (2010). Can more reclaimed asphalt pavement be added? Study of extracted binder properties from plant-produced mixtures with up to 25% reclaimed asphalt pavement. Transportation Research Record, 2180(1), 19–29.
Davis, J. (n.d.). Roofing the Road – Using Asphalt Shingles as Binder. Asphalt: The Magazine of the Asphalt Institute. http://asphaltmagazine.com/roofing-the-road-using-asphalt-shingles-as-binder/
Davison, R. R., Bullin, J. A., Estakhri, C. K., Williamson, S. A., Chipps, J. F., Chun, J. S., Juristyarini, P., Leicht, S. E., Wattanachai, P., & Glover, C. J. (2000). A comprehensive laboratory and field study of high-cure crumb-rubber modified asphalt materials. Texas Transportation Institute.
Deef-Allah, E., Abdelrahman, M., Fitch, M., Ragab, M., Bose, M., & He, X. (2019). Balancing the performance and environmental concerns of used motor oil as rejuvenator in asphalt mixes. Recycling, 4(1), 11.
Health, N. I. for O. S. and. (2001). Asphalt Fume Exposures During the Manufacture of Asphalt Roofing Products: Current Practices for Reducing Exposures. US Department of Health and Human Services Cincinnati, Ohio.
Kleinschmidt, L. R., & Snoke, H. R. (1958). Changes in the properties of an asphalt during the blowing operation. Journal of Research of the National Bureau of Standards, 60(3), 169–172.
Larrain, M. M. M. (2015). Analytical modeling of rutting potential of asphalt mixes using hamburg wheel tracking device (master thesis). (Master Thesis).
Li, H., Wu, Y., & Guo, Y. (2014). Validation of reclaimed shingles asphalt binder extraction and recovery methods. In Advanced Characterization of Asphalt and Concrete Materials (pp. 17–23).
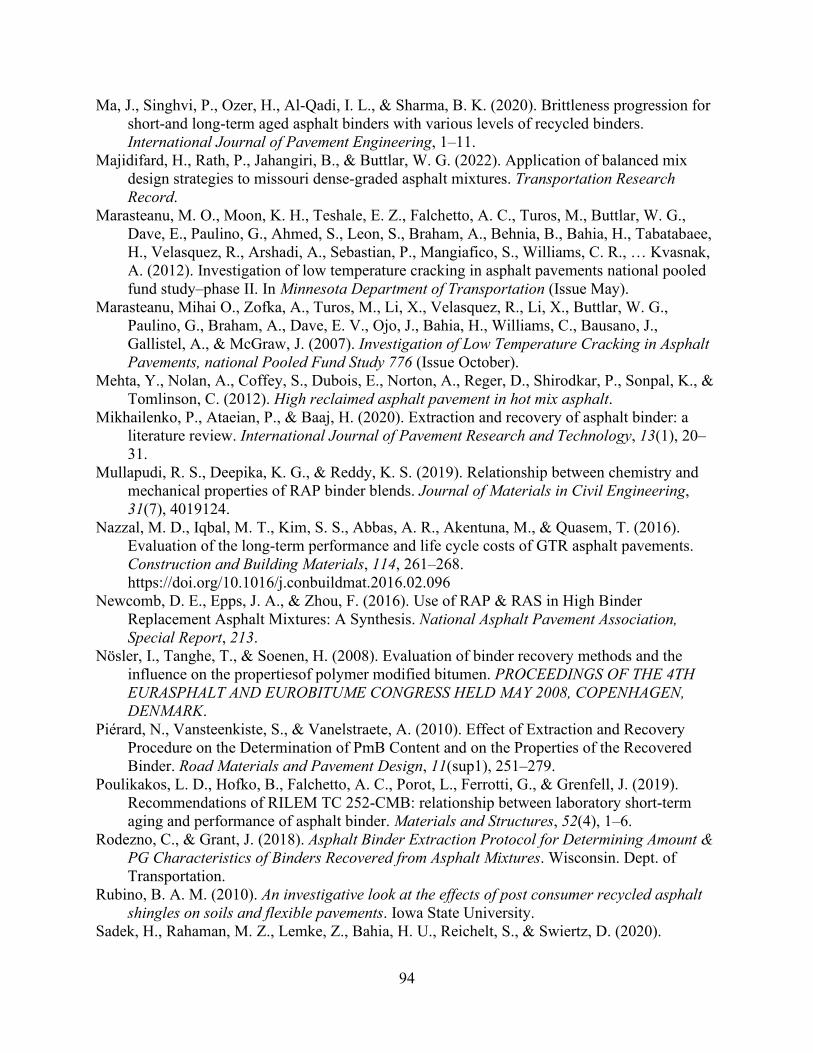
94
Ma, J., Singhvi, P., Ozer, H., Al-Qadi, I. L., & Sharma, B. K. (2020). Brittleness progression for short-and long-term aged asphalt binders with various levels of recycled binders. International Journal of Pavement Engineering, 1–11.
Majidifard, H., Rath, P., Jahangiri, B., & Buttlar, W. G. (2022). Application of balanced mix design strategies to missouri dense-graded asphalt mixtures. Transportation Research Record.
Marasteanu, M. O., Moon, K. H., Teshale, E. Z., Falchetto, A. C., Turos, M., Buttlar, W. G., Dave, E., Paulino, G., Ahmed, S., Leon, S., Braham, A., Behnia, B., Bahia, H., Tabatabaee, H., Velasquez, R., Arshadi, A., Sebastian, P., Mangiafico, S., Williams, C. R., … Kvasnak, A. (2012). Investigation of low temperature cracking in asphalt pavements national pooled fund study–phase II. In Minnesota Department of Transportation (Issue May).
Marasteanu, Mihai O., Zofka, A., Turos, M., Li, X., Velasquez, R., Li, X., Buttlar, W. G., Paulino, G., Braham, A., Dave, E. V., Ojo, J., Bahia, H., Williams, C., Bausano, J., Gallistel, A., & McGraw, J. (2007). Investigation of Low Temperature Cracking in Asphalt Pavements, national Pooled Fund Study 776 (Issue October).
Mehta, Y., Nolan, A., Coffey, S., Dubois, E., Norton, A., Reger, D., Shirodkar, P., Sonpal, K., & Tomlinson, C. (2012). High reclaimed asphalt pavement in hot mix asphalt.
Mikhailenko, P., Ataeian, P., & Baaj, H. (2020). Extraction and recovery of asphalt binder: a literature review. International Journal of Pavement Research and Technology, 13(1), 20–31.
Mullapudi, R. S., Deepika, K. G., & Reddy, K. S. (2019). Relationship between chemistry and mechanical properties of RAP binder blends. Journal of Materials in Civil Engineering, 31(7), 4019124.
Nazzal, M. D., Iqbal, M. T., Kim, S. S., Abbas, A. R., Akentuna, M., & Quasem, T. (2016). Evaluation of the long-term performance and life cycle costs of GTR asphalt pavements. Construction and Building Materials, 114, 261–268. https://doi.org/10.1016/j.conbuildmat.2016.02.096
Newcomb, D. E., Epps, J. A., & Zhou, F. (2016). Use of RAP & RAS in High Binder Replacement Asphalt Mixtures: A Synthesis. National Asphalt Pavement Association, Special Report, 213.
Nösler, I., Tanghe, T., & Soenen, H. (2008). Evaluation of binder recovery methods and the influence on the propertiesof polymer modified bitumen. PROCEEDINGS OF THE 4TH EURASPHALT AND EUROBITUME CONGRESS HELD MAY 2008, COPENHAGEN, DENMARK.
Piérard, N., Vansteenkiste, S., & Vanelstraete, A. (2010). Effect of Extraction and Recovery Procedure on the Determination of PmB Content and on the Properties of the Recovered Binder. Road Materials and Pavement Design, 11(sup1), 251–279.
Poulikakos, L. D., Hofko, B., Falchetto, A. C., Porot, L., Ferrotti, G., & Grenfell, J. (2019). Recommendations of RILEM TC 252-CMB: relationship between laboratory short-term aging and performance of asphalt binder. Materials and Structures, 52(4), 1–6.
Rodezno, C., & Grant, J. (2018). Asphalt Binder Extraction Protocol for Determining Amount & PG Characteristics of Binders Recovered from Asphalt Mixtures. Wisconsin. Dept. of Transportation.
Rubino, B. A. M. (2010). An investigative look at the effects of post consumer recycled asphalt shingles on soils and flexible pavements. Iowa State University.
Sadek, H., Rahaman, M. Z., Lemke, Z., Bahia, H. U., Reichelt, S., & Swiertz, D. (2020).

95
Performance Comparison of Laboratory-Produced Short-Term Aged Mixtures with Plant-Produced Mixtures. Journal of Materials in Civil Engineering, 32(1), 4019313.
Salari, S. (2012). Effects of recycled asphalt shingle on the rheological and molecular composition properties of asphalt cement.
Sirin, O., & Tia, M. (2003). Investigation of problems in binder extraction from conventional and rubber modified asphalt mixtures. Sixth International RILEM Symposium on Performance Testing and Evaluation of Bituminous Materials, 212–219.
Stroup-Gardiner, M., & Nelson, J. W. (2000). Use of normal propyl bromide solvents for extraction and recovery of asphalt cements. National Center for Asphalt Technologies, Report# NCAT, 6, 2000.
West, R. C., Tran, N. H., Kvasnak, A., Powell, B., & Turner, P. (2009). Construction and Field Performance of Hot Mix asphalt with Moderate and High RAP Contents. Bearing Capacity of Roads, Railways and Airfields. 8th International Conference (BCR2A’09) University of Illinois, Urbana-Champaign.
West, R. C., & Willis, J. R. (2014). Case studies on successful utilization of reclaimed asphalt pavement and recycled asphalt shingles in asphalt pavements.
Willis, J. R., & Turner, P. (2016). Characterization of asphalt binder extracted from reclaimed asphalt shingles. National Center for Asphalt Technology (NCAT) Rep., Auburn, AL.
Zhou, F. (2018). IDEAL Cracking Test for QC / QA and Associated Criteria. Zhou, F., Button, J. W., & Epps, J. A. (2012). Best practice for using RAS in HMA. Texas
Transportation Institute. Zhou, F., Li, H., Hu, S., Button, J. W., & Epps, J. A. (2012). Characterization and best use of
recycled asphalt shingles in hot-mix asphalt. Texas. Dept. of Transportation. Research and Technology Implementation Office.
Zhou, F., Li, H., Lee, R., Scullion, T., & Claros, G. (2013). Recycled asphalt shingle binder characterization and blending with virgin binders. Transportation Research Record, 2370(1), 33–43.

96
APPENDIX
A.1. Literature review (binder)
Recycling of asphalt pavements has started during the 1970s with the oil embargo and the
dramatic rise in the prices of crude oil, which lead to a drop in the asphalt supply levels. During
that time, agencies and contractors examined asphalt mixes containing 80% reclaimed asphalt
pavement (RAP) (Copeland, 2011; Newcomb et al., 2016; West & Willis, 2014). Between the
1980s and 1990s, recycled asphalt shingles (RAS) were used in the asphaltic mixes (Newcomb et
al., 2016; West & Willis, 2014). The use of RAP or RAS in the asphalt mixes reduces the demand
for natural resources, reduces the emissions during the production process, and decreases the
quantities of materials dumped in landfills (M. Z. Alavi et al., 2017; West et al., 2009).
Using RAS in the pavement industry is increasing in the U.S. due to the valuable constituents
that make them more appropriate to be used with asphaltic mixtures. RAS contains oxidized air-
blown asphalt binder percentage ranging from 19 to 36% by weight, granules “ceramic-coated or
sand-sized natural aggregate” from 20 to 38% by weight, mineral filler/stabilizer (limestone,
dolomite, silica) from 8 to 40%, and fibers “fiberglass or cellulose backing” 2 to 20% by weight
(Rubino, 2010; Willis & Turner, 2016). The fibers were observed during making sieve analysis
for the aggregate after the extraction process for mixes containing RAS as indicated in Figure A-1.
Figure A-1. Fibers Existing with the Aggregate after the Extraction Process of Asphalt
Binders from Mixes Containing RAS

97
These fiber backings constitute the basic structure of shingles. They are saturated with air-
blown asphalt. Both sides of the backings are covered with this kind of asphalt cement. Usually
RAS asphalt binder content is five times more than what is obtained from RAP (Alvergue, 2014);
however, the properties of both binders are different (Z. Alavi et al., 2015). The top side of the
shingles is covered with granules (crushed rocks coated with ceramic metal oxides) to protect
shingles from the sun rays. The bottom side is covered with fine sand to prevent the agglomeration
of shingles during the transportation process. RAS contains valuable materials that are very
essential to the asphaltic mixtures. Shingles are preferred to be grounded to 100% passing the 3/8-
inch sieve according to the Missouri Department of Transportation (MoDOT) specifications.
Shingles shall be used in mixtures containing asphalt binder PG 64-22. However, when the ratio
of virgin effective binder to total binder is between 60 and 70% in the mixture, the grade of the
virgin binder may be PG 58-28 or PG 52-28 instead of PG 64-22 (Zhou, Button, et al., 2012).
In 2002, the MoDOT received its first request regarding using the post-consumer RAS in the
asphaltic mixture in Saint Louis. Missouri allows using of RAS in asphalt pavements within a
percentage of less than or equal to 7% (West & Willis, 2014). MoDOT implemented a
demonstration project in December 2004 to assess using RAS in the pavement; this project was
constructed in 2005 on Route 61/67 in Saint Louis County, Missouri. MoDOT allowed using of
RAS in the asphalt mixtures through a provisional specification in 2006 followed by a formal
specification in 2008 (West & Willis, 2014). In 2009, the MoDOT used 53,000 tons of RAS and
50,000 tons of RAP in the pavement industry. This saves $20 million in resurfacing projects during
that year. Adding RAS to asphalt mixtures as an asphalt alternative source increased by 80% from
2009 to 2012 (Willis & Turner, 2016). The percentage of RAS in the asphalt mixture is typically
five percent by the weight of the mix. Using RAS with a percentage of five percent in the hot mix
asphalt (HMA) would lead to a cost savings between $1.00 and $2.80 per ton according to the
National Asphalt Pavement Association estimations (Davis, n.d.). Based on a technical report
implemented in 2013, assuming a cost of $600 per ton for virgin asphalt binder, using 5% RAS in
the asphaltic mixture could save $4 to $7 per ton of HMA (Zhou, Li, et al., 2012). MoDOT uses
RAS percentage from two to five percent in the mix or no more than 20% effective virgin binder
replacement (Davis, n.d.). Generally, in Missouri, up to 7% RAS (tear-off) is accepted to be used
with PG 64-22 asphalt binder (Salari, 2012; Zhou, Button, et al., 2012).

98
Exploring the effect of the recycled materials (e.g. RAP, RAS, or both) on the performance of
the extracted & recovered (E & R) asphalt binders’ performance is the main idea followed in this
report. Different methods can be used to extract asphalt binders from the asphaltic mixes.
However, the centrifuge extraction method is the most common method used to extract asphalt
binders from mixes using solvents (Rodezno & Grant, 2018) because of its simplicity and use at
room temperature (Mehta et al., 2012; Mikhailenko et al., 2020). This method can be used if the
characterizing of the E & R asphalt binder is necessary. However, one of the main drawbacks of
this method is leaving around 4% of the total binder with the aggregate (Mehta et al., 2012;
Rodezno & Grant, 2018; Stroup-Gardiner & Nelson, 2000). The solvent used dissolves the asphalt
binder; however, during the extraction process, some mineral matter (dust) is captured within the
dissolved asphalt binder. The mineral matter can be removed using a filterless centrifuge. After
removing the mineral matter from the extracted solvent, the asphalt binders are recovered using a
distillation process that could be achieved by a rotary evaporator “rotavap”. This recovery process
was used since the 1970s (Collins-Garcia et al., 2000); however, the overheating process in the
rotavap would result in increasing the stiffness of the recovered asphalt binders. Furthermore, any
remaining solvent in the recovered asphalt binders could result in decreasing the asphalt binders’
stiffness. It was observed that even 0.5% of the solvent remaining in the recovered asphalt binders
could result in a 50% decrease in the viscosity value (AbuHassan et al., 2019).
Rodezno and Julian (Rodezno & Grant, 2018) investigated the effect of different extraction
methods (centrifuge, ignition, asphalt analyzer “automated”, and reflux) on the behavior of the E
& R asphalt binders. Eight mixes were analyzed; those mixes either contained a virgin asphalt
binder or contained recycled materials (RAP, RAS, or both). The testing program was achieved
with the collaboration of different laboratories in Wisconsin to evaluate the within-lab and
between-lab variability. For the centrifuge extraction method, an average difference between the
actual and extracted asphalt binder was found to be 0.21% for mixes containing a virgin binder
and may reach to 0.38% for mixes containing a high percentage of recycled materials (recycled
binder percentage of 30-35%). The within-lab and between-lab variability were not affected using
recycled materials in asphaltic mixes. Ignition and asphalt analyzer extraction methods had the
highest accuracy since the average differences between the actual and extracted asphalt binder’s
percentages were 0.05 and 0.17%, respectively. However, the ignition method cannot be used
when the characterization of the extracted asphalt binder is necessary. Unfortunately, the asphalt

99
analyzer apparatus is not available in our lab. Regardless of the extraction method and type of
solvent [toluene, trichloroethylene (TCE), and n-propyl bromide], there was no significant
difference in the performance grade (PG) characterization of the E & R asphalt binders (Rodezno
& Grant, 2018). However, another research showed that there was a difference in the properties’
characterization of the E & R asphalt binders using the three aforementioned types of solvents
(AbuHassan et al., 2019)
The main issue of using RAS in asphaltic mixes is the high stiffness of its asphalt component.
This asphalt is an oxidized air-blown type, which is stiffer than the ordinary asphalt binder
(Alvergue, 2014). The percentage of asphaltene increases while the percentages of oil and resin
constituents decrease linearly with time during the air-blowing process of an asphalt flux
(Kleinschmidt & Snoke, 1958). The asphalt flux is “the residuum of atmospheric and vacuum
distillation processes used by petroleum refineries” (Health, 2001). The air blowing process causes
an increase in the stiffness of the asphalt by increasing the softening point and decreasing the
ductility and penetration (Health, 2001; Kleinschmidt & Snoke, 1958). The resulting air-blown
asphalt would be more viscous and less temperature-susceptible (Health, 2001). Moreover, the
oxidation effect in the tear-off shingles caused a stiffer property for the E & R asphalt as compared
to the asphalt E & R from manufactured waste shingles (Alvergue, 2014; Zhou et al., 2013). It was
found that the average high PG temperature for asphalt E & R from manufactured waste and tear-
off shingles is 130 and 178°C, respectively (Willis & Turner, 2016; Zhou et al., 2013).
The properties of RAP binders cannot be categorized regionally since they varied for different
stockpiles in Massachusetts and varied from one season to another (Austerman et al., 2020).
Generally, researchers have reported the high PG temperature for the asphalt binders E & R from
RAP to be between 76 and 94°C (M. Z. Alavi et al., 2017; Austerman et al., 2020; Daniel et al.,
2010; Ma et al., 2020). Alavi et al. (M. Z. Alavi et al., 2017)collected three RAP sources from
three plants in California and evaluated the properties of the E & R asphalt binders. The high PG
temperatures for the E & R RAP binders were between 82 and 88°C, while the low PG temperature
was around −4°C. This illustrates that the asphalt binders E & R from RAP are aged. It was found
that the E & R asphalt binders from mixes containing no or low percentages of recycled materials
(recycled binder percentage of 5-20%) had a PG 64-28 (Rodezno & Grant, 2018). However, the
virgin asphalt binder used in these mixes had a PG 58-28, which illustrates an increase in the high
PG temperature of the E & R asphalt binders by one grade (6°C). Adding a higher percentage of

100
recycled materials would lead to stiffer E & R asphalt binders. For mixes having high percentages
of RAP (recycled binder percentage of 30-35%), the E & R asphalt binders had a PG 70-22. For
mixes having the same high percentages (recycled binder percentage of 30-35%) by using RAP
and RAS, the E & R asphalt binders showed more increase in the high PG temperature that reached
a value of 76°C. This illustrates that using both RAP and RAS can significantly alter the properties
of the E & R asphalt binders (Rodezno & Grant, 2018). Sadek et al. (Sadek et al., 2020) compared
the rheological properties of the asphalt binders E & R from the plant- and lab-produced mixes
containing RAP at high, intermediate, and low temperatures using multiple stress creep recovery
(MSCR), linear amplitude sweep (LAS), and bending beam rheometer testing, respectively. It was
reported that the properties were different at the high and intermediate temperatures. Mullapudi et
al. (Mullapudi et al., 2019) have mixed different proportions of extracted and recovered RAP
binders with virgin asphalt binders. The authors (Mullapudi et al., 2019) found that the oxygenated
functional groups’ indices, IS=O and IC=O, increased with increasing RAP binders’ percentages.
Increasing the RAP binder’s percentage in the mix had increased the asphalt binders’ rutting
resistance by increasing the complex shear modulus (|G*|), high PG temperature, recovery
percentages (%R), and decreased the phase angle (δ) and the non-recoverable creep compliance
(Jnr).
The oxidative functional groups [e.g. sulfoxide (S=O) and carbonyl (C=O)] in asphalt binders’
Fourier Transform Infrared (FTIR) spectra can reflect the aging condition. Poulikakos et al.
(Poulikakos et al., 2019) proved that increasing the aging process of asphalt binders led to a higher
intensity of these functional groups. The rolling thin film oven (RTFO) aging process in the lab at
163°C underrates the chemical aging as compared to binders E & R from the HMA. The authors
(Poulikakos et al., 2019) recommended using the sulfoxide index to represent short-term aging. A
good correlation was observed between the mechanical and the chemical properties, IS=O & IC=O
(Mullapudi et al., 2019).
Piérard et al. (Piérard et al., 2010) investigated the effect of the extraction process on the
asphalt binder content. Styrene-butadiene-styrene or ethyl vinyl acetate modified asphalt binders
were extracted from fresh, short-term aged, and compacted mixtures prepared in the laboratory.
Two asphalt binder and aggregate types were used. Different solvents like toluene,
dichloromethane, and TCE were used to extract binders. The average extracted content of asphalt
binder, regardless of the solvent, was 6.3 ± 0.2% that is considered a relative decrease of around

101
5% compared to the initial binder content (6.6%). The FTIR results showed that the asphalt binder
content decrease was not related to the decreases in the polymer content since the intensity of the
released polymer’s peaks were similar for the modified binder used in the preparation of mixtures
and the recovered one. Toluene and TCE are preferable to dichloromethane. No appreciable effect
of the aggregate type and/or the compaction process was noted on the percentage of the extracted
binder. Moreover, the percentage of the extracted binder from short-term aged mixtures depended
mainly on the type of the asphalt binder and the selected solvent. The recovery process of asphalt
binder from asphalt binder and solvent combinations is very sensitive. The recovery process should
be terminated when no traces of solvents (e.g. TCE) are observed. These residues even with small
amounts could affect the recovered asphalt binder’s rheological properties. Nösler et al. (Nösler et
al., 2008) had found a decrease in the ring and ball softening point by 6°C because of the presence
of TCE in the recovered binder by a percentage of 0.9% by weight. On the other hand, the over-
cooking recovery process is also not preferred since this will produce an asphalt binder that is
excessively aged (Li et al., 2014; Zhou, Li, et al., 2012).
Sirin and Tia (Sirin & Tia, 2003) evaluated the effect of the extraction process using reflux on
the extracted percentage of asphalt binder from field and lab asphalt mixtures containing crumb
rubber modifier (CRM). Mixtures modified with CRM had an actual asphalt binder content of
6.34% and a CRM percentage of 0.76%, which was a total of asphalt and CRM content of 7.1%
by the weight of the mix. Conventional mixtures with only an asphalt binder percentage of 6.34%
were evaluated. The authors have concluded that the extracted asphalt binder percentage was lower
than the actual one either for the mixtures modified with CRM or the conventional ones (without
CRM modification). For the mixes modified with CRM, an average asphalt binder and CRM
percentage (not extracted) was found to be 0.86%. For conventional mixes, an average asphalt
binder not extracted percentage of 0.25% was obtained. Thus, the average percentage of CRM that
remained in the reflux was 0.61% (0.86-0.25%) out from a CRM percentage of 0.76% by the
weight of the mixture. This illustrates that existence of recycled materials like CRM in the asphalt
mixes would make the extraction process of the asphalt binders from these mixes more difficult.
A.2. Binder test and results
A.2.1. Characterizing the Asphalt Binders Extracted and Recovered from the Field Mixes

102
Constructed before 2016 In this section, the asphalt binders E & R from the US 63-2, US 50-1, US 54-8, MO 52-1, and
US 54-7 field mixes, presented in, and the field mixes presented in Table 2- are compared. These
binders were treated as PAV aged binders. Unfortunately, the virgin binders used in these mixes
were not available to be compared with the E & R asphalt binders.
A.2.1.2. Properties of Asphalt Binders E & R from Field Mixes Constructed before 2016 The temperature sweep test results for the E & R binders from field mixes containing RAP
and RAS are illustrated in Figure A-2. Both US 63-2 and MO 151 mixes contained asphalt binders
with the same PG (64-22). Moreover, US 63-2 and MO 151 mixes were 8 and 9 years old,
respectively. Thus, the asphalt binders E & R from the MO151 mixes showed lower resistance to
fatigue cracking than the US 63-2 E & R binders. This was reflected from the trendlines in Figure
A-2-b because the MO 151 binders had slopes lower than the slope of the trendlines in Figure A-2-
a for the US 63-2 binders. The same results were noted in Figure A-3 by comparing the fatigue
cracking parameters (|G*|.sinδ) for the E & R asphalt binders at 22°C. Another reason was the
higher percentage of recycled materials included in the MO 151 mixes.
0
5000
10000
15000
20000
25000
30000
7 13 19 25 31 37
|G*|
.sinδ
(kPa
)
Temperature (°C)
(a) US 63-2
US 63-2-5-PG 64 (20-10) US 63-2-2-PG 64 (20-10)
US 63-2-11-PG 64 (20-10)
0
5000
10000
15000
20000
25000
30000
7 13 19 25 31 37
|G*|
.sinδ
(kPa
)
Temperature (°C)
(b) MO 151
MO 151-7-PG 64 (16-15) MO 151-5a-PG 64 (16-15)MO 151-10a-PG 64 (16-15) MO 151-2a-PG 64 (16-15)MO 151-11-PG 64 (16-15)
Figure A-2. Temperature Sweep Test Results for the E & R Asphalt Binders from US 63-2
and MO 151 Field Mixes, Constructed before 2016, Containing RAP and RAS

103
0
3000
6000
9000
12000
15000
18000|G
*|.si
nδat
22°
C(k
Pa)
Sample code
Figure A-3. Fatigue Cracking Parameter for the E & R Asphalt Binders from US 63-2 and MO 151 Field Mixes, Constructed before 2016, Containing RAP and RAS Measured at
22°C
Figure A-4 shows the master curve, fatigue cracking parameter measured at different
frequencies (100 to 0.1 rad/sec) and reference temperature (22°C), for the E & R asphalt binders
from US 63 and MO 151 field mixes. The extracted asphalt binders from MO 151 showed higher
stiffness as compared to binders E & R from US 63-2 mixes at low frequencies. At high
frequencies, no significant difference was observed.
100
1000
10000
100000
0.0001 0.001 0.01 0.1 1 10 100
Log
|G*|
.sinδ
at 2
2°C
(kPa
)
Log reduced frequency (Hz)
US 63-2-5-PG 64 (20-10)
US 63-2-2-PG 64 (20-10)
US 63-2-11-PG 64 (20-10)
MO 151-7-PG 64 (16-15)
MO 151-5a-PG 64 (16-15)
MO 151-10a-PG 64 (16-15)
MO 151-2a-PG 64 (16-15)
MO 151-11-PG 64 (16-15)
Figure A-4. Master Curve for the E & R Asphalt Binders from US 63-2 and MO 151 Field
Mixes, Constructed before 2016, Containing RAP and RAS Measured at 22°C

104
The temperature sweep results for asphalt binders E & R from field mixes containing RAP
only are presented in Figure A-5. The mixes contained different asphalt binders and different RAP
percentages. By analyzing the fatigue cracking parameter at a reference temperature (22°C),
presented in Figure A-6, it can be concluded that asphalt binders E & R from MO 6 mixes had the
highest resistance to fatigue cracking. These binders showed the lowest |G*|.sinδ values in Figure
A-5 and Figure A-6. The MO 6 mixes contained the highest ABR percentage by RAP (30%), but
they had a soft asphalt binder (PG 58-28) and were 4 years old during the sampling process.
Although both MO 6 and US 61N mixes have the same ABR (30% RAP), the asphalt binders E &
R from the US 61N mixes showed lower resistance to fatigue cracking as compared to binders E
& R from MO 6 mixes. This occurred because the US 61N mixes were older than the MO 6 mixes
by 2 years and contained a stiffer virgin asphalt binder (PG 64-22H). The same results can be
observed from the master curve in Figure A-7: asphalt binders E & R from US 61N mixes showed
higher |G*|.sinδ values as compared to binders E & R from MO 6 mixes.
The worst resistance to fatigue cracking at 22°C was recorded to the asphalt binders E& R
from US 54-12a and US 54-6a mixes. Both mixes were 9 years old during the sampling process
and they included a stiff asphalt binder (PG 70-22); however, the mixes included 12% ABR
percentage by RAP. This illustrates that using asphalt binders having a high PG temperature of 70
or higher is not recommended in the case of using recycled materials. The master curve, Figure
A-7, shows the same results because the asphalt binders E & R from US 54 mixes showed the
highest fatigue cracking parameter values.
The US 50-1 and US 36 mixes contained virgin asphalt binders with the same PG (64-22) and
had the same ABR percentage by RAP. The US 36 mixes were older than the US 50-1 mixes by 3
years. Thus, the trendlines for these binders, presented in Figure A-5-c and Figure A-5-d, were
different especially at the lowest temperature (10°C). However, the asphalt binders E & R from
these mixes had approximately the same |G*|.sinδ values measure at 22°C, Figure A-6. The same
results were observed in the master curve, Figure A-7.
Asphalt binders E & R from US 54-8 mixes showed better resistance to fatigue cracking than
the asphalt binders E & R from the US 36 mixes. However, the US 54-8 mixes were older than the
US 36 mixes by 2 years. Moreover, US 54-8 mixes contained a stiffer virgin asphalt binder as
compared to the asphalt binders included in the US 36 mixes. This was related to the higher

105
percentage of RAP included in the US 36 mixes. The US 36 mixes contained ABR percentage by
RAP two and a half times greater than the ABR percentage by RAP included in the US 54-8 mixes.
The same observations were deduced from the master curve in Figure A-7.

106
0
5000
10000
15000
20000
25000
30000
7 13 19 25 31 37
|G*|
.sinδ
(kPa
)
Temperature (°C)
(a) US 54-8
US 54-8-6-PG 70 (9-0) US 54-8-4-PG 70 (9-0)US 54-8-3-PG 70 (9-0)
0
5000
10000
15000
20000
25000
30000
7 13 19 25 31 37
|G*|
.sinδ
(kPa
)
Temperature (°C)
(b) US 54
US 54-12a-PG 70 (12-0) US 54-6a-PG 70 (12-0)US 54-2a-PG 70 (12-0)
0
5000
10000
15000
20000
25000
30000
7 13 19 25 31 37
|G*|
.sinδ
(kPa
)
Temperature (°C)
(c) US 50-1
US 50-1-9-PG 64 (25-0) US 50-1-4-PG 64 (25-0)US 50-1-2-PG 64 (25-0)
0
5000
10000
15000
20000
25000
30000
7 13 19 25 31 37
|G*|
.sinδ
(kPa
)
Temperature (°C)
(d) US 36
US 36-10a-PG 64 (25-0) US 36-13a-PG 64 (25-0)US 36-12a-PG 64 (25-0)
0
5000
10000
15000
20000
25000
30000
7 13 19 25 31 37
|G*|
.sinδ
(kPa
)
Temperature (°C)
(e) MO 6
MO 6-4a-PG 58 (30-0) MO 6-5a-PG 58 (30-0)MO 6-10a-PG 58 (30-0) MO 6-11a-PG 58 (30-0)MO 6-8a-PG 58 (30-0)
0
5000
10000
15000
20000
25000
30000
7 13 19 25 31 37
|G*|
.sinδ
(kPa
)
Temperature (°C)
(f) US 61N
US 61 N-9a-PG 64H (30-0) US 61 N-3a-PG 64H (30-0)US 61 N-6a-PG 64H (30-0)
Figure A-5. Temperature Sweep Test Results for the E & R Asphalt Binders from Field Mixes, Constructed before 2016, Containing Different Percentages of RAP

107
0
3000
6000
9000
12000
15000
18000|G
*|.si
nδat
22°
C(k
Pa)
Sample code Figure A-6. Fatigue Cracking Parameter for the E & R Asphalt Binders from Field Mixes, Constructed before 2016, Containing Different Percentages of RAP and Measured at 22°C
100
1000
10000
100000
0.0001 0.001 0.01 0.1 1 10 100
Log
|G*|
.sinδ
at 2
2°C
(kPa
)
Log reduced frequency (Hz)
US 54-8-6-PG 70 (9-0)US 54-8-4-PG 70 (9-0)US 54-8-3-PG 70 (9-0)US 54-12a-PG 70 (12-0)US 54-6a-PG 70 (12-0)US 54-2a-PG 70 (12-0)US 50-1-9-PG 64 (25-0)US 50-1-4-PG 64 (25-0)US 50-1-2-PG 64 (25-0)US 36-10a-PG 64 (25-0)US 36-13a-PG 64 (25-0)US 36-12a-PG 64 (25-0)MO 6-4a-PG 58 (30-0)MO 6-5a-PG 58 (30-0)MO 6-10a-PG 58 (30-0)MO 6-11a-PG 58 (30-0)MO 6-8a-PG 58 (30-0)US 61 N-9a-PG 64H (30-0)US 61 N-3a-PG 64H (30-0)US 61 N-6a-PG 64H (30-0)
Figure A-7. Master Curve for the E & R Asphalt Binders from Field Mixes, Constructed before 2016, Containing Different Percentages of RAP and Measured at 22°C
Figure A-8 shows the temperature sweep results for the E & R asphalt binders from mixes
containing 34% ABR percentage by RAS and virgin asphalt binder PG 64-22. These mixes were
6 years old during the sampling process. The fatigue cracking parameter for these binders
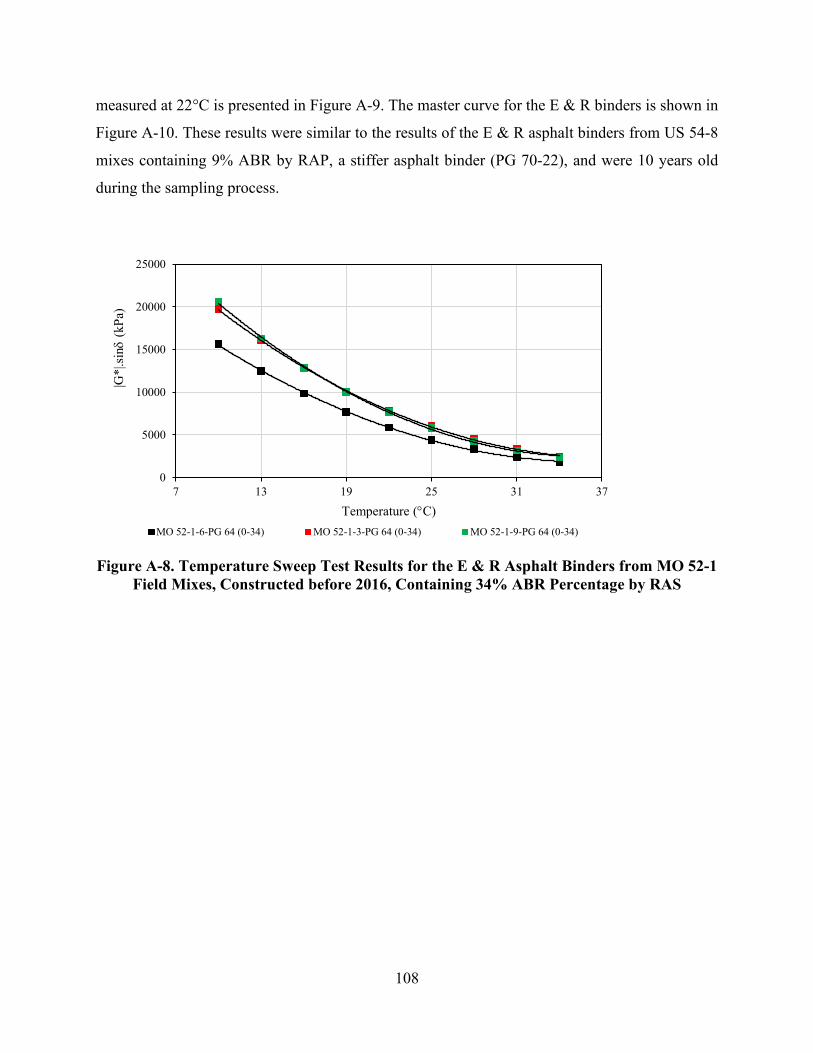
108
measured at 22°C is presented in Figure A-9. The master curve for the E & R binders is shown in
Figure A-10. These results were similar to the results of the E & R asphalt binders from US 54-8
mixes containing 9% ABR by RAP, a stiffer asphalt binder (PG 70-22), and were 10 years old
during the sampling process.
0
5000
10000
15000
20000
25000
7 13 19 25 31 37
|G*|
.sinδ
(kPa
)
Temperature (°C)MO 52-1-6-PG 64 (0-34) MO 52-1-3-PG 64 (0-34) MO 52-1-9-PG 64 (0-34)
Figure A-8. Temperature Sweep Test Results for the E & R Asphalt Binders from MO 52-1
Field Mixes, Constructed before 2016, Containing 34% ABR Percentage by RAS
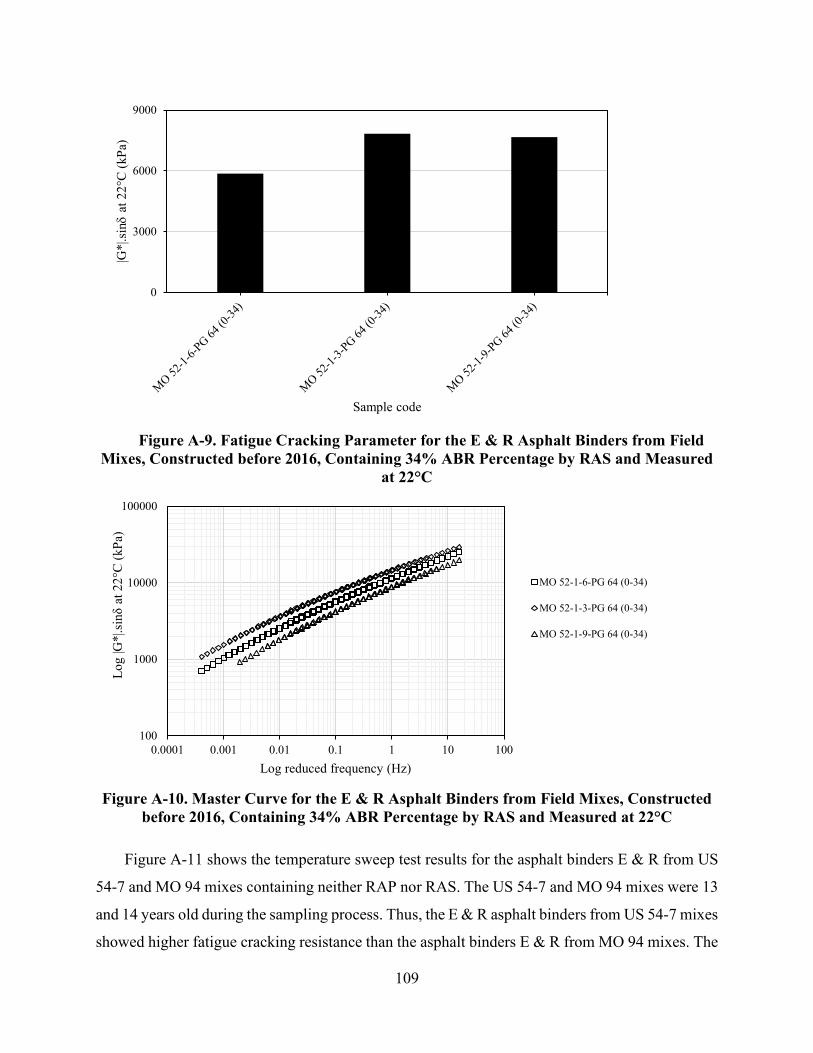
109
0
3000
6000
9000|G
*|.si
nδat
22°
C(k
Pa)
Sample code
Figure A-9. Fatigue Cracking Parameter for the E & R Asphalt Binders from Field Mixes, Constructed before 2016, Containing 34% ABR Percentage by RAS and Measured
at 22°C
100
1000
10000
100000
0.0001 0.001 0.01 0.1 1 10 100
Log
|G*|
.sinδ
at 2
2°C
(kPa
)
Log reduced frequency (Hz)
MO 52-1-6-PG 64 (0-34)
MO 52-1-3-PG 64 (0-34)
MO 52-1-9-PG 64 (0-34)
Figure A-10. Master Curve for the E & R Asphalt Binders from Field Mixes, Constructed
before 2016, Containing 34% ABR Percentage by RAS and Measured at 22°C
Figure A-11 shows the temperature sweep test results for the asphalt binders E & R from US
54-7 and MO 94 mixes containing neither RAP nor RAS. The US 54-7 and MO 94 mixes were 13
and 14 years old during the sampling process. Thus, the E & R asphalt binders from US 54-7 mixes
showed higher fatigue cracking resistance than the asphalt binders E & R from MO 94 mixes. The

110
same results were noted in Figure A-12 and Figure A-13 by comparing the fatigue cracking
parameter for the E & R binders from these mixes at 22°C. A similar rank in cracking performance
was also noted in mixture testing. In addition, the US 54-7 mix, in general, displayed the best
cracking performance of all field cores evaluated in a previous study (Buttlar et al., 2019).
0
5000
10000
15000
20000
25000
30000
7 13 19 25 31 37
|G*|
.sinδ
(kPa
)
Temperature (°C)US 54-7-7-PG 64 (0-0) US 54-7-2-PG 64 (0-0) US 54-7-4-PG 64 (0-0)
MO 94-9a-PG 64 (0-0) MO 94-12a-PG 64 (0-0) MO 94-6a-PG 64 (0-0)
Figure A-11. Temperature Sweep Test Results for the E & R Asphalt Binders from US 54-7 and MO 94 Field Mixes, Constructed before 2016, Containing Neither RAP nor RAS
0
3000
6000
9000
12000
15000
|G*|
.sinδ
at 2
2°C
(kPa
)
Sample code Figure A-12. Fatigue Cracking Parameter for the E & R Asphalt Binders from US 54-7 and

111
MO 94 Field Mixes, Constructed before 2016, Containing neither RAP nor RAS Measured at 22°C
100
1000
10000
100000
0.0001 0.001 0.01 0.1 1 10 100
Log
|G*|
.sinδ
at 2
2°C
(kPa
)
Log reduced frequency (Hz)
US 54-7-7-PG 64 (0-0)
US 54-7-2-PG 64 (0-0)
US 54-7-4-PG 64 (0-0)
MO 94-9a-PG 64 (0-0)
MO 94-12a-PG 64 (0-0)
MO 94-6a-PG 64 (0-0)
Figure A-13. Master Curve for the E & R Asphalt Binders from US 54-7 and MO 94 Field Mixes, Constructed before 2016, Containing neither RAP nor RAS and Measured at 22°C
To compare the E & R binders from field mixes constructed before 2016, Figure A-14-a
illustrates the intermediate PG temperatures for the E & R binders from mixes containing no
recycled materials and PG 64-22 virgin asphalt binders. The US 54-7 and MO 94 mixes were 13
and 14 years old during the sampling process. Therefore, the asphalt binders E & R from the US
54-7 mixes presented higher resistance to fatigue cracking than the binders E & R from the MO
94 mixes. This was affirmed by lower intermediate (Figure A-14-a) PG temperatures and a higher
number of load repetitions to failure (Nf) at 2.5 and 5% strain levels and 22°C temperature, Figure
A-14-b.
Figure A-15 presents the intermediate PG temperatures and the Nf values (measured at 2.5 and
5% strain levels and 22°C temperature) for the asphalt binders E & R from mixes containing
different ABR percentages by RAP and different virgin asphalt binders. By comparing Figure
A-15-a and Figure A-15-b, it was concluded that E & R asphalt binders from different mixes can
have the same intermediate PG temperature; however, the Nf values could be significantly different
(e.g. binders E & R from the US 54-8 and MO 6 mixes). The lowest resistance for fatigue cracking
(the highest intermediate PG temperature and the lowest Nf values) was recorded for asphalt
112
binders E & R from the US 54 mixes. These mixes were 9 years old during the sampling process,
contained 12% ABR percentage by RAP, and included PG 70-22 asphalt binder. The asphalt
binder E & R from US 54-12a-PG 70 (12-0) shows a zero Nf value, which represents a failure for
this sample to resist fatigue cracking at 22°C. This failure is shown in Figure A-16. The asphalt
binders E & R from US 54-8 mixes showed higher resistance to fatigue cracking than the binders
E & R from the US 54 mixes. This occurred because the US 54-8 mixes contained lower ABR
percentage by RAP than the US 54 mixes; however, the US 54-8 mixes were older than US 54
mixes by 1 year. The highest resistance to fatigue cracking was recorded for asphalt binders E &
R from the MO 6 mixes. These mixes were 4 years old during the sampling process and contained
PG 58-28 virgin asphalt binder; however, they had a high percentage of recycled materials (30%
ABR percentage by RAP). The US 61N and MO 6 mixes had the same ABR percentage by RAP
(30%). However, the values for the Nf, at 2.5% strain level, for the asphalt binders E & R from the
US 61N mixes decreased by 75% as compared to the values for the binders E & R from the MO 6
mixes. This returned to the high stiffness of the virgin asphalt binder included in the US 61 N
mixes (PG 64-22H); however, the MO 6 mixes contained a softer asphalt binder (PG 58-28).
Moreover, the MO 6 mixes were newer than US 61 N mixes by 2 years during the sampling
process. The US 36 mixes were older than the US 61 N mixes by 2 years; however, the binders E
& R from the US 36 mixes showed a higher resistance to fatigue cracking than binders E & R from
the US 61 N mixes. This was related to the low ABR percentage by RAP included in the US 36
mixes, which was 25%. Moreover, they contained a softer asphalt binder (PG 64-22).
The asphalt binders E & R from mixes containing no recycled materials, Figure A-14, showed
non-zero Nf values. However, these mixes were greater than or equal to 13 years old during the
sampling process. Thus, these mixes were nearing the end of a typical asphalt overlay life.
However, incorporating stiffer asphalt binders and/or using RAP, Figure A-15, deteriorated the
resistance to fatigue cracking significantly. This was noted for asphalt binder E & R from US 54-
12a-PG 70 (12-0) mix, which had zero Nf values at 2.5 and 5% strain levels.

113
10
13
16
19
22
25
28
31
34
Inte
rmed
iate
PG
tem
pera
ture
(°C
)
Sample code
(a)
0
2000
4000
6000
8000
10000
12000
14000
Nf
Sample code
(b) 2.5% strain 5% strain
Figure A-14. (a) Intermediate PG Temperatures in °C and (b) Nf at 2.5 and 5% Strain and 22°C Temperature for Asphalt Binders E & R from Field Mixes, Constructed before 2016,
Containing no Recycled Materials

114
10
13
16
19
22
25
28
31
34
Inte
rmed
iate
PG
tem
pera
ture
(°C
)
Sample code
(a)
0
2000
4000
6000
8000
10000
12000
14000
Nf
Sample code
(b) 2.5% strain 5% strain
Figure A-15. (a) Intermediate PG Temperatures in °C and (b) Nf at 2.5 and 5% Strain and 22°C Temperature for Asphalt Binders E & R from Field Mixes, Constructed before 2016,
Containing Different ABR Percentages by RAP
Note: The asphalt binders E & R from the US 54-12a-PG 70 (12-0) and US 54-6a-PG 70 (12-0) mixes had intermediate PG temperature greater than 34°C.

115
(a) (b)
Figure A-16. Fatigue Failure for Asphalt Binder E & R from the US 54-12a-PG 70 (12-0) Mix at 22°C; (a) Sample Failure at the DSR Lower Plate and (b) Sample Failure at the
DSR Upper Plate
Figure A-17 illustrates the intermediate PG temperatures and Nf values, measured at 2.5
and 5% strain levels and 22°C temperature, for the asphalt binders E & R from mixes containing
34% ABR percentage by RAS. The MO 52-1and US 50-1 mixes had asphalt binders with the same
PG (64-22). The MO 52-1 mixes were older than US 50-1 mixes by 1 year. Moreover, the MO 52-
1 mixes had a higher percentage of recycled materials, 34% ABR by RAS, than the percentage
included in the US 50-1 mixes (25% ABR by RAP). However, the asphalt binders E & R from
mixes containing RAS showed higher resistance to fatigue cracking than binders E & R from mixes
containing RAP. This reflects that using RAS in the asphaltic mixes enhanced the resistance of the
E & R asphalt binders to fatigue cracking as compared to binders E & R from mixes containing
RAP. This is a somewhat counter-intuitive result, as RAS was shown before to greatly increase
binder stiffness. On the other hand, RAS binders may be very different than typical paving-grade
binders in that they are generally air-blown, may contain polymers, and some amount of fibers
may be present even after E&R is performed.

116
Figure A-18 shows the intermediate PG temperatures and Nf values, measured at 2.5 and 5%
strain levels and 22°C temperature, for the asphalt binders E & R from mixes containing different
ABR percentages by RAP-RAS. The mixes were greater than or equal to 8 years old during the
sampling process. Thus, the Nf values for binders E & R from some MO 151 mixes were zero.
101316192225283134
Inte
rmed
iate
PG
tem
pera
ture
(°C
)
Sample code
(a)
0
2000
4000
6000
8000
10000
12000
14000
Nf
Sample code
(b) 2.5% strain 5% strain
Figure A-17. (a) Intermediate PG Temperatures in °C and (b) Nf at 2.5 and 5% Strain and 22°C Temperature for Asphalt Binders E & R from Field Mixes, Constructed before 2016,
Containing 34% ABR Percentage by RAS

117
10
13
16
19
22
25
28
31
34
Inte
rmed
iate
PG
tem
pera
ture
(°C
)
Sample code
(a)
0
2000
4000
6000
8000
10000
12000
14000
Nf
Sample code
(b) 2.5% strain 5% strain
Figure A-18. (a) Intermediate PG Temperatures in °C and (b) Nf at 2.5 and 5% Strain and 22°C Temperature for Asphalt Binders E & R from Field Mixes, Constructed before 2016,
Containing Different ABR Percentages by RAP-RAS
Note: The intermediate PG temperature exceeded 34°C for asphalt binders E & R from the MO 151-7-PG 64 (16-15), MO 151-5a-PG 64 (16-15), MO 151-10a-PG 64 (16-15), and MO 151-2a-PG 64 (16-15) mixes.

118
A.2.2. Relating Asphalt Binders Extracted and Recovered from Field, Plant, and Lab Mixes to the Corresponding RTFO Aged Virgin Asphalt Binders
In this section, the asphalt binders E & R from the US 54-6 and US 63-1 field, plant, and lab
mixes were compared to the RTFO aged virgin asphalt binders. The field and plant mixes
contained 31 and 35% ABR percentages by RAP. The asphalt binders E & R from the field mixes
were treated as RTFO aged asphalt binders because the samples were collected within two weeks
after the construction process in 2016. Moreover, the asphalt binders E & R from the lab and plant
mixes were analyzed as RTFO aged asphalt binders. For lab mixes containing Engineered Crumb
Rubber (ECR), a type of dry-process ground tire rubber (GTR), it was observed that part of the
rubber particles remained with the aggregate, the second part of the particles dissolved in the
asphalt binder, and the third part was extracted with the effluent. Figure A-19 illustrates the ECR
particles that remained with the aggregate and extracted with the effluent. A fraction of the
recovered ECR rubber particles were first observed in the recovered aggregates. A second fraction
of the rubber particles were present in the E&R asphalt binder, which enhances binder stiffness,
elasticity, and strength. A third fraction was observed in the metal cup along with the mineral
matter collected in the filterless centrifuge process. Thus, it is difficult to properly assess GTR
effects on binders in a forensic manner, as not all of the binder ends up in the E&R binder sample.
This reinforces the importance of mixture testing, particularly testing that can be readily done on
field-produced samples.

119
(a) (b) (c)
(d) (e)
Figure A-19. The Extracted Rubber Particles; (a) Particles Suspended with the TCE in the Extractor Bowl, (b) Particles with the Mineral Matter in the Metal Cup after the Filterless
Centrifuge Process, and (c, d, and e) Particles Remaining with the Aggregate
A.2.2.1. Extraction of the Asphalt Binders from Field, Plant, and Lab Mixes
The actual and extracted AC% are presented in Figure A-20 for the US 54-6 field, plant, and
lab mixes using different MMDMs. The actual AC for field, plant, and lab mixes was 5.1%;
however, some lab mixes had actual AC% of 5.2 and 5.5%. The extracted AC percentages using
ashing MMDM, presented in Figure A-20-a, were between 4.4 and 6%. The centrifuge MMDM,
Figure A-20-b, presents more accurate extracted AC percentages that were between 4.8 and 5.6%.
Figure A-20-c shows the extracted AC percentages by calculating the mineral matter using both
ashing and centrifuge MMDMs. The ashing MMDM underestimated the extracted AC% for US
54-6 mixes. Thus, most of the extracted AC percentages in Figure A-20-a and Figure A-20-c were
lower than the actual AC percentages.
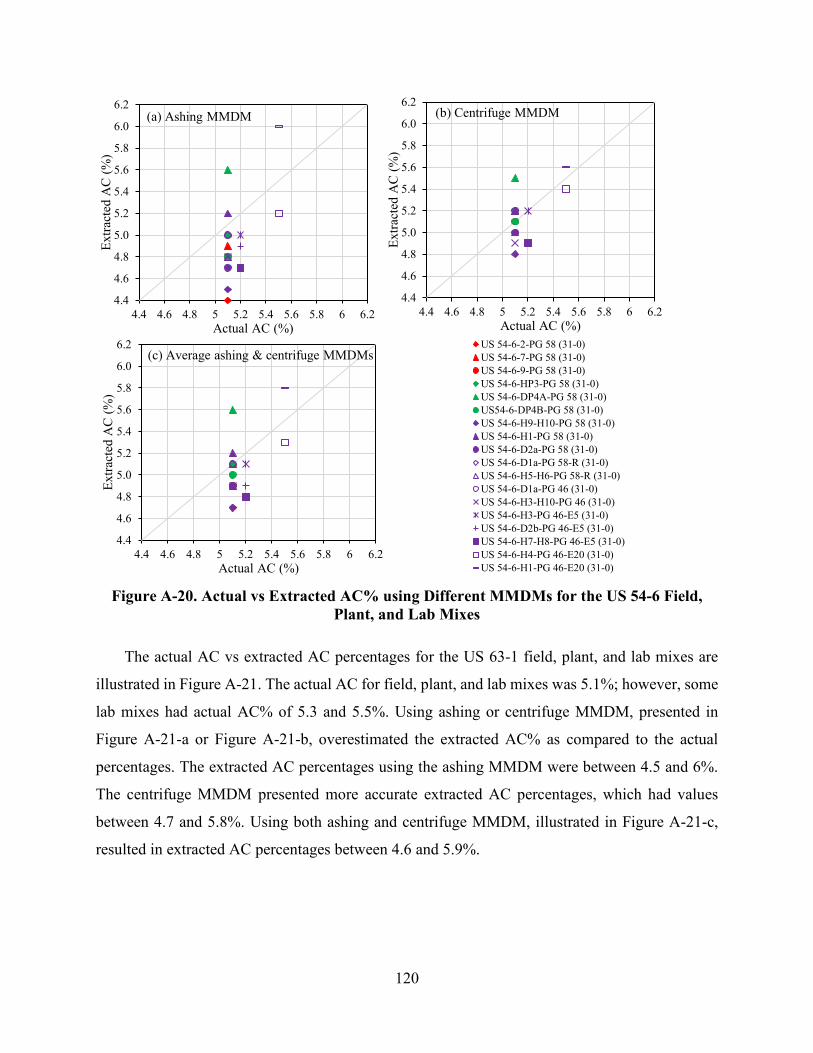
120
4.4
4.6
4.8
5.0
5.2
5.4
5.6
5.8
6.0
6.2
4.4 4.6 4.8 5 5.2 5.4 5.6 5.8 6 6.2
Extra
cted
AC
(%)
Actual AC (%)
(a) Ashing MMDM
4.4
4.6
4.8
5.0
5.2
5.4
5.6
5.8
6.0
6.2
4.4 4.6 4.8 5 5.2 5.4 5.6 5.8 6 6.2
Extra
cted
AC
(%)
Actual AC (%)
(b) Centrifuge MMDM
4.4
4.6
4.8
5.0
5.2
5.4
5.6
5.8
6.0
6.2
4.4 4.6 4.8 5 5.2 5.4 5.6 5.8 6 6.2
Extra
cted
AC
(%)
Actual AC (%)
(c) Average ashing & centrifuge MMDMsUS 54-6-2-PG 58 (31-0)US 54-6-7-PG 58 (31-0)US 54-6-9-PG 58 (31-0)US 54-6-HP3-PG 58 (31-0)US 54-6-DP4A-PG 58 (31-0)US54-6-DP4B-PG 58 (31-0)US 54-6-H9-H10-PG 58 (31-0)US 54-6-H1-PG 58 (31-0)US 54-6-D2a-PG 58 (31-0)US 54-6-D1a-PG 58-R (31-0)US 54-6-H5-H6-PG 58-R (31-0)US 54-6-D1a-PG 46 (31-0)US 54-6-H3-H10-PG 46 (31-0)US 54-6-H3-PG 46-E5 (31-0)US 54-6-D2b-PG 46-E5 (31-0)US 54-6-H7-H8-PG 46-E5 (31-0)US 54-6-H4-PG 46-E20 (31-0)US 54-6-H1-PG 46-E20 (31-0)
Figure A-20. Actual vs Extracted AC% using Different MMDMs for the US 54-6 Field, Plant, and Lab Mixes
The actual AC vs extracted AC percentages for the US 63-1 field, plant, and lab mixes are
illustrated in Figure A-21. The actual AC for field, plant, and lab mixes was 5.1%; however, some
lab mixes had actual AC% of 5.3 and 5.5%. Using ashing or centrifuge MMDM, presented in
Figure A-21-a or Figure A-21-b, overestimated the extracted AC% as compared to the actual
percentages. The extracted AC percentages using the ashing MMDM were between 4.5 and 6%.
The centrifuge MMDM presented more accurate extracted AC percentages, which had values
between 4.7 and 5.8%. Using both ashing and centrifuge MMDM, illustrated in Figure A-21-c,
resulted in extracted AC percentages between 4.6 and 5.9%.

121
4.4
4.6
4.8
5.0
5.2
5.4
5.6
5.8
6.0
6.2
4.4 4.6 4.8 5 5.2 5.4 5.6 5.8 6 6.2
Extra
cted
AC
(%)
Actual AC (%)
(a) Ashing MMDM
4.4
4.6
4.8
5.0
5.2
5.4
5.6
5.8
6.0
6.2
4.4 4.6 4.8 5 5.2 5.4 5.6 5.8 6 6.2
Extra
cted
AC
(%)
Actual AC (%)
(b) Centrifuge MMDM
4.4
4.6
4.8
5.0
5.2
5.4
5.6
5.8
6.0
6.2
4.4 4.6 4.8 5 5.2 5.4 5.6 5.8 6 6.2
Extra
cted
AC
(%)
Actual AC (%)
(c) Average ashing & centrifuge MMDMsUS 63-1-2-PG 58 (35-0)US 63-1-5-PG 58 (35-0)US 63-1-9-PG 58 (35-0)US 63-1-HP8-PG 58 (35-0)US 63-1-HP9-PG 58 (35-0)US 63-I-DP3A-PG 58 (35-0)US 63-1-H4-PG 58-R (35-0)US 63-1-D1b-PG 58-R (35-0)US 63-1-H2-PG 58-R (35-0)US 63-1-D2a-PG 46 (35-0)US 63-1-H6-PG 46 (35-0)US 63-1-D1b-PG 46 (35-0)US 63-1-D2b-PG 46-R (35-0)US 63-1-H3-PG 46-R (35-0)US 63-1-D2a-PG 46-R (35-0)US 63-1-H2-PG 46-E10 (35-0)US 63-1-H5-PG 46-E10 (35-0)US 63-1-D2b-PG 46-E20 (35-0)US 63-1-Gmb3-PG 46-E20 (35-0)
Figure A-21. Actual vs Extracted AC% using Different MMDMs for the US 63-1 Field, Plant, and Lab Mixes
To better understand the effect of the MMDMs on the extracted AC percentages, the means
of the extracted AC% using different MMDMs were compared with the mean of the actual AC%.
The ANOVA results are shown in Table A -. The p-value (Prob > F) is 0.3833, which was greater
than the 0.05 significance level. Thus, no significant difference was found between the means of
the extracted AC% using different MMDMs as compared to the mean of the actual AC%.
Table A -1. ANOVA Results for the Actual and Extracted AC% for the US 54-6 and US 63-1 Field, Plant, and Lab Mixes
Source DF Sum of Squares Mean Square F Ratio Prob > F Method 3 0.294 0.098 1.025 0.383 Error 144 13.774 0.096
C. Total 147 14.068
Figure A-22 presents the extracted AC per actual AC percentages for the US 54-6 field,
plant, and lab mixes using different MMDMs. The extracted AC per actual AC percentages were
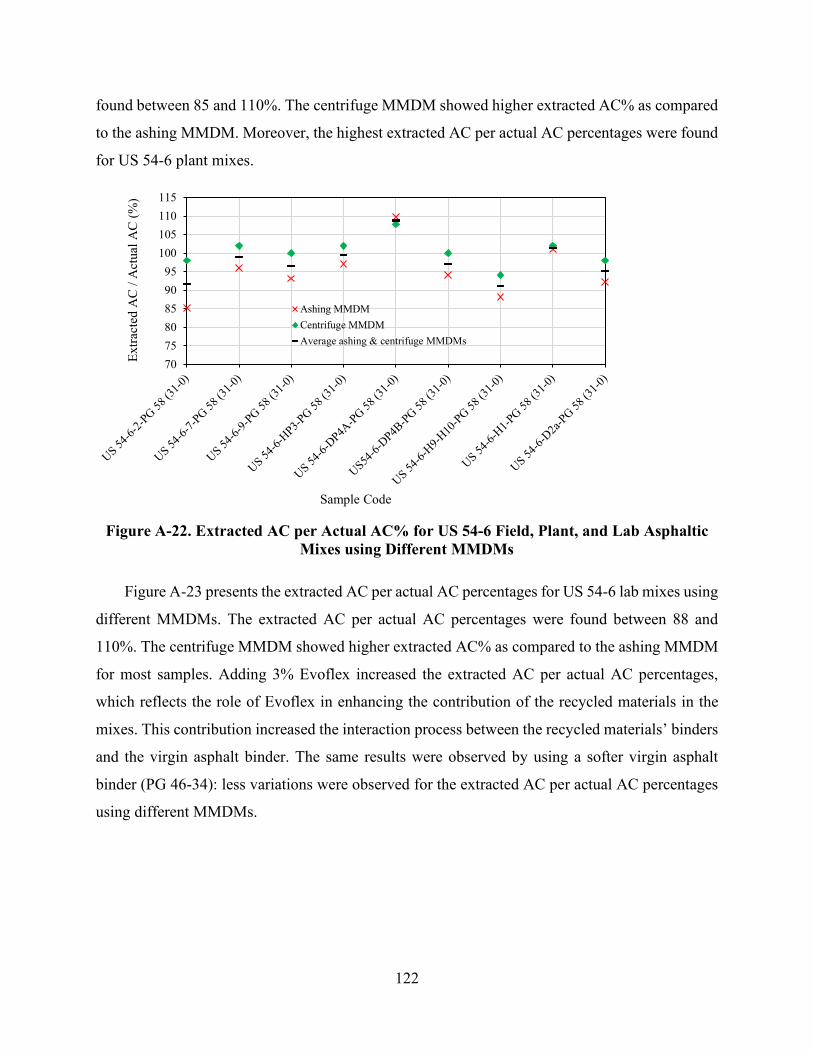
122
found between 85 and 110%. The centrifuge MMDM showed higher extracted AC% as compared
to the ashing MMDM. Moreover, the highest extracted AC per actual AC percentages were found
for US 54-6 plant mixes.
707580859095
100105110115
Extra
cted
AC
/ A
ctua
l AC
(%)
Sample Code
Ashing MMDMCentrifuge MMDMAverage ashing & centrifuge MMDMs
Figure A-22. Extracted AC per Actual AC% for US 54-6 Field, Plant, and Lab Asphaltic
Mixes using Different MMDMs
Figure A-23 presents the extracted AC per actual AC percentages for US 54-6 lab mixes using
different MMDMs. The extracted AC per actual AC percentages were found between 88 and
110%. The centrifuge MMDM showed higher extracted AC% as compared to the ashing MMDM
for most samples. Adding 3% Evoflex increased the extracted AC per actual AC percentages,
which reflects the role of Evoflex in enhancing the contribution of the recycled materials in the
mixes. This contribution increased the interaction process between the recycled materials’ binders
and the virgin asphalt binder. The same results were observed by using a softer virgin asphalt
binder (PG 46-34): less variations were observed for the extracted AC per actual AC percentages
using different MMDMs.

123
707580859095
100105110115
Extra
cted
AC
/ A
ctua
l AC
(%)
Sample Code
Ashing MMDMCentrifuge MMDMAverage ashing & centrifuge MMDMs
Figure A-23. Extracted AC per Actual AC% for US 54-6 Lab Asphaltic Mixes using
Different MMDMs
Figure A-24 shows the extracted AC per actual AC percentages for the US 63-1 field, plant,
and lab mixes using different MMDMs. The extracted AC per actual AC percentages were found
between 88 and 112%. The centrifuge MMDM showed higher extracted AC% as compared to the
ashing MMDM for most samples. Moreover, the highest extracted AC per actual AC percentages
were found for plant and lab mixes.
707580859095
100105110115
Extra
cted
AC
/ A
ctua
l AC
(%)
Sample Code
Ashing MMDMCentrifuge MMDMAverage ashing & centrifuge MMDMs

124
Figure A-24. Extracted AC per Actual AC% for US 63-1 Field, Plant, and Lab Asphaltic Mixes using Different MMDMs
Figure A-25 presents the extracted AC per actual AC percentages for US 63-1 lab mixes
using different MMDMs. The extracted AC per actual AC percentages were found between 95 and
112%. The centrifuge MMDM showed higher extracted AC% as compared to the ashing MMDM
for most samples.
707580859095
100105110115
Extra
cted
AC
/ A
ctua
l AC
(%)
Sample Code
Ashing MMDM
Centrifuge MMDM
Average ashing & centrifuge MMDMs
Figure A-25. Extracted AC per Actual AC % for US 63-1 Lab Asphaltic mixes using
Different MMDMs
A.2.2.2. Properties of the RTFO Aged Virgin and Extracted and Recovered Asphalt Binders from the Field, Plant, and Lab Mixes
The MSCR test results, measured at 0.1 and 3.2 kPa stress levels and 60°C temperature, are
illustrated in Figure A-26 for RTFO aged virgin and E & R asphalt binders from US 54-6 and US
63-1 field, plant, and lab mixes. Both US 54 and US 63-1 asphalt binders had the same PG (PG
58-28); however, the US 54 was stiffer than the US 63 asphalt binder. The US 54 binder showed
lower Jnr and higher %R values than the US 63 binder. The E & R asphalt binders had higher %R
and lower Jnr values than values for the corresponding RTFO aged virgin binders due to the
stiffness effect of the asphalt binder component existed in the RAP. Furthermore, asphalt binders
E & R from US 63-1 mixes revealed lower Jnr and higher %R values as compared to asphalt binders

125
E & R from US 54-6 mixes. This occurred because the US 63-1 mixes contained 4% ABR
percentage by RAP higher than the US 54-6 mixes.
Figure A-26-a shows the Jnr and %R values for the RTFO aged virgin and E & R asphalt
binders from the US 54-6 field, plant, and lab mixes. The E & R asphalt binders from plant mixes
showed lower Jnr and higher %R values as compared to the E & R asphalt binders from field mixes.
This was related to the extra heating that occurred to the plant samples before the compaction
process in the lab, which increased the recycled materials contribution in the mix. This contribution
increased the interaction process between the recycled materials’ binders and the virgin asphalt
binder. Moreover, asphalt binders E & R from lab mixes showed higher %R and lower Jnr values
as compared to binders E & R from plant mixes. The same results were noticed in Figure A-26-b
for E & R binders from the US 63-1 field, plant, and lab mixes.
0
1
2
3
4
5
6
7
0 10 20 30 40
J nr(k
Pa−1
)
Recovery (%)
(a)US 54-PG 58 RTFO Aged Virgin
US 54-6-2-PG 58 (31-0)
US 54-6-7-PG 58 (31-0)
US 54-6-9-PG 58 (31-0)
US 54-6-DP4A-PG 58 (31-0)
US 54-6-DP4B-PG 58 (31-0)
US54-6-HP3-PG 58 (31-0)
US 54-6-H9-H10-PG 58 (31-0)
US 54-6-H1-PG 58 (31-0)
US 54-6-D2a-PG 58 (31-0)
0.1 kPa stress level
3.2 kPa stress level
00.20.40.60.8
1
0 10 20 30 40
J nr(k
Pa−1
)
Recovery (%)
0
1
2
3
4
5
6
7
0 10 20 30 40
J nr(k
Pa−1
)
Recovery (%)
(b)US 63-PG 58 RTFO Aged Virgin
US 63-1-2-PG 58 (35-0)
US 63-1-5-PG 58 (35-0)
US 63-1-9-PG 58 (35-0)
US 63-1-DP3A-PG 58 (35-0)
US 63-1-HP8-PG 58 (35-0)
US 63-1-HP9-PG 58 (35-0)
US 63-1-H4-PG 58-R (35-0)
US 63-1-D1b-PG 58-R (35-0)
US 63-1-H2-PG 58-R (35-0)
0.1 kPa stress level
3.2 kPa stress level
0.1
0.2
0.3
0.4
10 20 30 40
J nr(k
Pa−1
)
Recovery (%)
Figure A-26. MSCR Test Results Measured at 60°C for RTFO Aged Virgin and E & R
Asphalt Binders from (a) US 54-6 and (b) US 63-1 Field, Plant, and Lab Mixes

126
Figure A-27 shows the MSCR results, measured at 0.1 and 3.2 kPa stress levels and 60°C
temperature, for the RTFO aged virgin and E & R asphalt binders from the US 54-6 and US 63-1
lab mixes. It is worthy to note that RTFO aged PG 46-34 asphalt binder is softer than RTFO aged
US 63-1-PG 58-28 or US 54-PG 58-28 asphalt binders because it had the highest Jnr and the lowest
%R values. For all lab mixes, E & R asphalt binders showed a higher stiffness as compared to the
corresponding RTFO aged virgin asphalt binders. This reflects the effect of the stiff asphalt binder
component in the RAP on increasing the E & R asphalt binder stiffness values.
Evoflex worked as a rejuvenator and enhanced the contribution of the recycled asphalt binders
in the asphaltic mixes. This contribution increased the interaction process between the recycled
materials’ binders and the virgin asphalt binder. From Figure A-27-a, adding 3% Evoflex to the
US 54-6-H5-H6 lab sample slightly increased the %R and decreased the Jnr for the E & R asphalt
binder as compared to E & R asphalt binders from mixes with 0% Evoflex. However, adding the
same percentage of Evoflex to the US 54-6-D1a did not alter the E & R asphalt binder significantly
as compared to E & R asphalt binders from the same mixes without Evoflex. Figure A-27-b shows
that E & R asphalt binders from US 54-6 lab samples containing PG 46-34 asphalt binder had a
lower stiffness by showing higher Jnr and lower %R values as compared to E & R asphalt binders
from the same mixes containing PG 58-28 asphalt binder. Adding 5% or 20% ECR to US 54-6-
PG 46 mixes increased the stiffness (lower Jnr values) and elasticity (higher %R values) of the E
& R asphalt binders as compared to US 54-6 mixes containing PG 46-34 or PG 58-28 asphalt
binders.
Regardless of the used PG virgin asphalt binders, increasing the ABR by RAP from 31 to 35%
caused an increase in the stiffness of the E & R asphalt binders, Figure A-27-c. This reflects that
the effect of the percentage of the recycled materials on the E & R asphalt binders was effective
besides the effect of the PG of the used virgin asphalt binders. Figure A-27-d shows that using a
softer asphalt binder (PG 46-34) decreased the stiffness of the E & R asphalt binders. Moreover,
using Evoflex increased the stiffness of the E & R asphalt binders by increasing the contribution
of the recycled materials in the mixes. This contribution increased the interaction process between
the recycled materials’ binders and the virgin asphalt binder. Using 10 or 20% ECR increased the
stiffness and elasticity of the E & R asphalt binders.

127
Figure A-27. MSCR Test Results Measured at 60°C for RTFO Aged Virgin and E & R
Asphalt Binders from (a) US 54-6-PG 58, (b) US 54-6-PG 46, (c) US 63-1-PG 58, and (d) US 63-1-PG 46 Lab Mixes
The temperature sweep test results for the E & R asphalt binders from the US 54-6 field, plant,
and lab mixes containing 31% ABR by RAP and the corresponding RTFO aged virgin asphalt
binder are presented in Figure A-28. All E & R asphalt binders showed higher stiffness than the
corresponding RTFO aged virgin asphalt binder because of the aged asphalt binder included in the
RAP. It can be noted that asphalt binders E & R from the plant and lab mixes had the highest
stiffness and the highest rutting parameter. Furthermore, the asphalt binders E & R from the plant
mixes were stiffer than asphalt binders E & R from the field mixes. This occurred because the

128
collected samples from behind the paver were reheated and compacted in the Mizzou lab, which
increased the contribution of the recycled materials in the mix. This contribution increased the
interaction process between the recycled materials’ binders and the virgin asphalt binder.
0
15
30
45
60
75
90
105
120
46 52 58 64 70 76 82 88 94 100
|G*|
/sinδ
(kPa
)
Temperature (°C)
US 54 PG 58 RTFO Aged Virgin US 54-6-2-PG 58 (31-0) US 54-6-7-PG 58 (31-0)US 54-6-9-PG 58 (31-0) US 54-6-HP3-PG 58 (31-0) US 54-6-DP4A-PG 58 (31-0)US54-6-DP4B-PG 58 (31-0) US 54-6-H9-H10-PG 58 (31-0) US 54-6-H1-PG 58 (31-0)US 54-6-D2a-PG 58 (31-0)
Figure A-28. Temperature Sweep Test Results for the E & R Asphalt Binders from the US 54-6 Field, Plant, and Lab Mixes Containing 31% ABR by RAP and the Corresponding
RTFO aged Virgin Asphalt Binder
The temperature sweep test results for the E & R asphalt binders from the US 54-6 lab mixes
containing 31% ABR by RAP and the corresponding RTFO aged virgin asphalt binders are
illustrated in Figure A-29. Different mixes were mixed in the lab containing rejuvenator, soft
asphalt binder, or ECR, using two percentages 5 and 20% by the weight of the binder, with a soft
asphalt binder. The rejuvenator was Evoflex, the used percentage was 3% by the weight of the
binder and the soft asphalt binder had a PG of 46-34. Asphalt binders E & R from the lab mixes
containing ECR had the highest stiffness and the highest rutting parameter. This happened because
of the effect of the rubber on increasing the asphalt binder’s stiffness and elasticity, which
enhanced the resistance to rutting. Asphalt binders E & R from mixes contained PG 46-34 asphalt
binder had the lowest resistance to rutting; however, they had a higher rutting parameter than the
corresponding RTFO aged virgin asphalt binder.

129
0
100
200
300
400
500
600
700
40 46 52 58 64 70 76 82 88 94 100
|G*|
/sinδ
(kPa
)
Temperature (°C)US 54 PG 58 RTFO Aged Virgin PG 46 RTFO Aged Virgin US 54-6-H9-H10-PG 58 (31-0)US 54-6-H1-PG 58 (31-0) US 54-6-D2a-PG 58 (31-0) US 54-6-D1a-PG 58-R (31-0)US 54-6-H5-H6-PG 58-R (31-0) US 54-6-D1a-PG 46 (31-0) US 54-6-H3-H10-PG 46 (31-0)US 54-6-H3-PG 46-E5 (31-0) US 54-6-D2b-PG 46-E5 (31-0) US 54-6-H7-H8-PG 46-E5 (31-0)US 54-6-H4-PG 46-E20 (31-0) US 54-6-H1-PG 46-E20 (31-0)
0
30
60
90
120
150
46 52 58 64 70 76 82 88 94
|G*|
/sinδ
(kPa
)
Temperature (°C)
Figure A-29. Temperature Sweep Test Results for the E & R Asphalt Binders from the US 54-6 Lab Mixes Containing 31% ABR by RAP and the Corresponding RTFO Aged Virgin
Asphalt Binders
The temperature sweep test results for the E & R asphalt binders from the US 63-1 field, plant,
and lab mixes containing 35% ABR by RAP and the corresponding RTFO aged virgin asphalt
binder are shown in Figure A-30. All E & R asphalt binders showed higher stiffness than the
corresponding RTFO aged virgin asphalt binder because of the aged asphalt binder included in the
RAP. The virgin asphalt binder US 63-1 PG 58 was softer than the virgin asphalt binder US 54 PG
58. However, the asphalt binders E & R from the US 63-1 mixes were stiffer than the asphalt
binders E & R from the US 54-6 mixes. This occurred due to the higher ABR percentage by RAP
included in the US 63-1 mixes. The asphalt binders E & R from the US 63-1 lab mixes had the
highest stiffness and the highest rutting parameter. Additionally, the asphalt binders E & R from
the plant mixes were stiffer than asphalt binders E & R from the field mixes.

130
0
15
30
45
60
75
90
105
120
46 52 58 64 70 76 82 88 94 100
|G*|
/sinδ
(kPa
)
Temperature (°C)US 63 PG 58 RTFO Aged Virgin US 63-1-2-PG 58 (35-0) US 63-1-5-PG 58 (35-0)
US 63-1-9-PG 58 (35-0) US 63-1-HP8-PG 58 (35-0) US 63-1-HP9-PG 58 (35-0)
US 63-1-DP3A-PG 58 (35-0) US 63-1-H4-PG 58-R (35-0) US 63-1-D1b-PG 58-R (35-0)
US 63-1-H2-PG 58-R (35-0) Figure A-30. Temperature Sweep Test Results for the E & R Asphalt Binders from the US
63-1 Field, Plant, and Lab Mixes Containing 35% ABR by RAP and the Corresponding RTFO Aged Virgin Asphalt Binders
The temperature sweep test results for the E & R asphalt binders from the US 63-1 lab mixes
containing 35% ABR by RAP and the corresponding RTFO aged virgin asphalt binder are
presented in Figure A-31. Different mixes were mixed in the lab containing rejuvenator, soft
asphalt binder, or ECR, using two percentages 10 and 20%, with a soft asphalt binder. Using a soft
binder (PG 46-34) decreased the resistance to rutting by showing the lowest rutting parameter
values for the E & R asphalt binders as compared to the E & R asphalt binders from the other US
63-1 lab mixes. Adding 3.75% Evoflex and 0.5% Evotherm to the soft asphalt binder increased
the rutting parameter values, which was related to the effect of the Evoflex on enhancing the
recycled materials’ contribution in the mix. This contribution increased the interaction process
between the recycled materials’ binders and the virgin asphalt binder. Adding 10 or 20% ECR to
the soft asphalt binder showed significant enhancement in the resistance to rutting due to the role
of the rubber in increasing the asphalt binders’ stiffness and elasticity. The enhanced stiffness and
elasticity are shown in Figure A-32. These photos were taken for the asphalt binder samples E &
R from mixes containing ECR after finishing the measurements on the DSR. The asphalt binder
connection between the lower and upper plates showed the elastic behavior of the asphalt binders.
Moreover, it was very difficult to clean the plates after finishing the measurement on the DSR

131
although the temperature was raised to 94°C, which illustrated increasing the stiffness of the
asphalt binders.
0
50
100
150
200
250
300
350
400
40 46 52 58 64 70 76 82 88 94 100
|G*|
/sinδ
(kPa
)
Temperature (°C)US 63 PG 58 RTFO Aged Virgin PG 46 RTFO Aged Virgin US 63-1-H4-PG 58-R (35-0)US 63-1-D1b-PG 58-R (35-0) US 63-1-H2-PG 58-R (35-0) US 63-1-D2a-PG 46 (35-0)US 63-1-H6-PG 46 (35-0) US 63-1-D1b-PG 46 (35-0) US 63-1-D2b-PG 46-R (35-0)US 63-1-H3-PG 46-R (35-0) US 63-1-D2a-PG 46-R (35-0) US 63-1-H2-PG 46-E10 (35-0)US 63-1-H5-PG 46-E10 (35-0) US 63-1-D2b-PG 46-E20 (35-0) US 63-1-Gmb3-PG 46-E20 (35-0)
Figure A-31. Temperature Sweep Test Results for the E & R Asphalt Binders from the US 63-1 Lab Mixes Containing 35% ABR by RAP and the Corresponding RTFO Aged Virgin
Asphalt Binders
Figure A-32. The Connection between the DSR Upper and Lower Plates for Asphalt
Binders E & R from Mixes Containing ECR

132
The master curve, measured at 60°C for the RTFO aged virgin and E & R asphalt binders
from the US 54-6 field, plant, and lab mixes is presented in Figure A-33. The asphalt binders E &
R from the field mixes showed higher rutting resistance as compared to the corresponding RTFO
aged virgin asphalt binders. The asphalt binders E & R from the lab or plant mixes showed higher
resistance to rutting than asphalt binders E & R from the field mixes. This was related to the
increased contribution of the asphalt binders included in the recycled materials to the total E & R
binders. This contribution increased the interaction process between the recycled materials’
binders and the virgin asphalt binder in the lab and plant mixes.
0.01
0.1
1
10
100
1000
0.001 0.01 0.1 1 10 100
Log
|G*|
/sin
δat
60°
C (k
Pa)
Log reduced frequency (Hz)
US 54 PG 58 RTFO Aged Virgin
US 54-6-2-PG 58 (31-0)
US 54-6-7-PG 58 (31-0)
US 54-6-9-PG 58 (31-0)
US 54-6-HP3-PG 58 (31-0)
US 54-6-DP4A-PG 58 (31-0)
US54-6-DP4B-PG 58 (31-0)
US 54-6-H9-H10-PG 58 (31-0)
US 54-6-H1-PG 58 (31-0)
US 54-6-D2a-PG 58 (31-0)
Figure A-33. Master Curve Measured at 60°C for the RTFO Aged Virgin and E & R
Asphalt Binders from the US 54-6 Field, Plant, and Lab Mixes Containing 31% ABR by RAP
The Cole-Cole plot measured at 60°C for the same binders is shown in Figure A. Comparing
the RTFO aged virgin and the E & R asphalt binders, a shift towards the elastic modulus axis and
the right-hand side of the curve occurred to the E & R asphalt binders. This shift referred to
enhancement in the elasticity. The maximum shift was observed for binders E & R from the lab
mixes. The same results were observed from analyzing the black diagram in Figure A because the
maximum shift towards the |G*| axis and the right-hand side of the curve was also observed for
the binders E & R from the lab mixes. This shift indicated an increase in the stiffness and elasticity.

133
0.001
0.1
10
1000
0.00001 0.001 0.1 10 1000
Log
G'' a
t 60°
C (k
Pa)
Log G' at 60°C (kPa)
US 54 PG 58 RTFO Aged Virgin
US 54-6-2-PG 58 (31-0)
US 54-6-7-PG 58 (31-0)
US 54-6-9-PG 58 (31-0)
US 54-6-HP3-PG 58 (31-0)
US 54-6-DP4A-PG 58 (31-0)
US54-6-DP4B-PG 58 (31-0)
US 54-6-H9-H10-PG 58 (31-0)
US 54-6-H1-PG 58 (31-0)
US 54-6-D2a-PG 58 (31-0)
Figure A-34. Cole-Cole Plot Analyzed at 60°C for the RTFO Aged Virgin and E & R
Asphalt Binders from the US 54-6 Field, Plant, and Lab Mixes Containing 31% ABR by RAP
60
70
80
90
0.01 0.1 1 10 100 1000
δ at
60°
C (d
egre
es)
Log |G*| at 60°C (kPa)
US 54 PG 58 RTFO Aged Virgin
US 54-6-2-PG 58 (31-0)
US 54-6-7-PG 58 (31-0)
US 54-6-9-PG 58 (31-0)
US 54-6-HP3-PG 58 (31-0)
US 54-6-DP4A-PG 58 (31-0)
US54-6-DP4B-PG 58 (31-0)
US 54-6-H9-H10-PG 58 (31-0)
US 54-6-H1-PG 58 (31-0)
US 54-6-D2a-PG 58 (31-0)
Figure A-35. Black Diagram Analyzed at 60°C for the RTFO Aged Virgin and E & R
Asphalt Binders from the US 54-6 Field, Plant, and Lab Mixes Containing 31% ABR by RAP
The master curve measured at 60°C for the RTFO aged virgin and E & R asphalt binders from
the US 54-6 lab mixes is shown in Figure A-36. Asphalt binders E & R from US 54-6-H9-H10-
PG 58, US 54-6-H1-PG 58, and US 54-6-D2a-PG 58 mixes showed higher resistance to rutting as
compared to the RTFO aged virgin asphalt binder because of the aged asphalt binder included in

134
the RAP. Adding 3% Evoflex to PG 58-28 asphalt binder slightly increased the rutting resistance
of the E & R asphalt binders. Using soft asphalt binder (PG 46-34) significantly reduced the rutting
resistance of the E & R binders; however, they had a higher rutting resistance than the
corresponding RTFO aged virgin asphalt binder’s resistance. Adding 5% or 20% ECR to the soft
asphalt binder significantly increased the rutting parameter for the E & R asphalt binders. This
occurred because of the effect of the rubber particles on increasing the stiffness and elasticity of
the E & R asphalt binders.
0.001
0.01
0.1
1
10
100
1000
0.00001 0.0001 0.001 0.01 0.1 1 10 100
Log
|G*|
/sin
δat
60°
C (k
Pa)
Log reduced frequency (Hz)
US 54 PG 58 RTFO Aged Virgin
PG 46 RTFO Aged Virgin
US 54-6-H9-H10-PG 58 (31-0)
US 54-6-H1-PG 58 (31-0)
US 54-6-D2a-PG 58 (31-0)
US 54-6-D1a-PG 58-R (31-0)
US 54-6-H5-H6-PG 58-R (31-0)
US 54-6-D1a-PG 46 (31-0)
US 54-6-H3-H10-PG 46 (31-0)
US 54-6-H3-PG 46-E5 (31-0)
US 54-6-D2b-PG 46-E5 (31-0)
US 54-6-H7-H8-PG 46-E5 (31-0)
US 54-6-H4-PG 46-E20 (31-0)
US 54-6-H1-PG 46-E20 (31-0)
Figure A-36. Master Curve Measured at 60°C for the RTFO Aged Virgin and E & R
Asphalt Binders from US 54-6 Lab Mixes Containing 31% ABR by RAP
The Cole-Cole plot analyzed at 60°C for the same binders is shown in Figure A-37.
Comparing the RTFO aged virgin and the E & R asphalt binders, a shift towards the elastic
modulus axis and the right-hand side of the curve occurred to the E & R asphalt binders. The
maximum shift was observed for binders E & R from the mixes containing ECR. The same results
were observed from analyzing the black diagram in Figure A-38 because the maximum shift
towards the |G*| axis and the right-hand side of the curve was also observed for the binders E & R
from the mixes containing ECR.

135
0.001
0.1
10
1000
0.000001 0.0001 0.01 1 100
Log
G'' a
t 60°
C (k
Pa)
Log G' at 60°C (kPa)
US 54 PG 58 RTFO Aged Virgin
PG 46 RTFO Aged Virgin
US 54-6-H9-H10-PG 58 (31-0)
US 54-6-H1-PG 58 (31-0)
US 54-6-D2a-PG 58 (31-0)
US 54-6-D1a-PG 58-R (31-0)
US 54-6-H5-H6-PG 58-R (31-0)
US 54-6-D1a-PG 46 (31-0)
US 54-6-H3-H10-PG 46 (31-0)
US 54-6-H3-PG 46-E5 (31-0)
US 54-6-D2b-PG 46-E5 (31-0)
US 54-6-H7-H8-PG 46-E5 (31-0)
US 54-6-H4-PG 46-E20 (31-0)
US 54-6-H1-PG 46-E20 (31-0)
Figure A-37. Cole-Cole Plot Analyzed at 60°C for the RTFO Aged Virgin and E & R
Asphalt Binders from US 54-6 Lab Mixes Containing 31% ABR by RAP
30
40
50
60
70
80
90
100
0.001 0.01 0.1 1 10 100 1000
δ at
60°
C (d
egre
es)
Log |G*| at 60°C (kPa)
US 54 PG 58 RTFO Aged Virgin
PG 46 RTFO Aged Virgin
US 54-6-H9-H10-PG 58 (31-0)
US 54-6-H1-PG 58 (31-0)
US 54-6-D2a-PG 58 (31-0)
US 54-6-D1a-PG 58-R (31-0)
US 54-6-H5-H6-PG 58-R (31-0)
US 54-6-D1a-PG 46 (31-0)
US 54-6-H3-H10-PG 46 (31-0)
US 54-6-H3-PG 46-E5 (31-0)
US 54-6-D2b-PG 46-E5 (31-0)
US 54-6-H7-H8-PG 46-E5 (31-0)
US 54-6-H4-PG 46-E20 (31-0)
US 54-6-H1-PG 46-E20 (31-0)
Figure A-38. Black Diagram Analyzed at 60°C for the RTFO Aged Virgin and E & R
Asphalt Binders from US 54-6 Lab Mixes Containing 31% ABR by RAP
Figure A-39 shows the master curve measured at 60°C for the RTFO aged virgin and E & R
asphalt binders from the US 63-1 field, plant, and lab mixes. The asphalt binders E & R from the
field mixes showed higher rutting resistance as compared to the corresponding RTFO aged virgin
asphalt binder. This difference in the rutting resistance was greater than what was obtained
between the US 54-6 RTFO aged virgin and E & R asphalt binders because of the higher

136
percentage of ABR by RAP included in the US 63-1 mixes; however, US 63-1 PG 58 asphalt
binder was softer than US 54 PG 58 asphalt binder. The asphalt binders E & R from the lab or
plant mixes showed higher resistance to rutting than asphalt binders E & R from the field mixes.
This was related to increased interactions that occurred between the recycled materials and the
virgin asphalt binders in the plant and lab mix.
0.01
0.1
1
10
100
1000
0.0001 0.001 0.01 0.1 1 10 100
Log
|G*|
/sin
δat
60°
C (k
Pa)
Log reduced frequency (Hz)
US 63-1 PG 58 RTFO Aged Virgin
US 63-1-2-PG 58 (35-0)
US 63-1-5-PG 58 (35-0)
US 63-1-9-PG 58 (35-0)
US 63-1-HP8-PG 58 (35-0)
US 63-1-HP9-PG 58 (35-0)
US 63-1-DP3A-PG 58 (35-0)
US 63-1-H4-PG 58-R (35-0)
US 63-1-D1b-PG 58-R (35-0)
US 63-1-H2-PG 58-R (35-0)
Figure A-39. Master Curve Measured at 60°C for the RTFO Aged Virgin and E & R
Asphalt Binders from the US 63-1 Field, Plant, and Lab Mixes Containing 35% ABR by RAP
The Cole-Cole plot measured at 60°C for the same binders is shown in Figure A-40.
Comparing the RTFO aged virgin and the E & R asphalt binders, a shift towards the elastic
modulus axis and the right-hand side of the curve occurred to the E & R asphalt binders. The
maximum shift was observed for the binders E & R from the plant and lab mixes. The same results
were observed from analyzing the black diagram in Figure A-41 because the maximum shift
towards the |G*| axis and the right-hand side of the curve was also observed for the binders E & R
from the lab mixes.

137
0.001
0.1
10
1000
0.00001 0.001 0.1 10 1000
Log
G'' a
t 60°
C (k
Pa)
Log G' at 60°C (kPa)
US 63-1 PG 58 RTFO Aged Virgin
US 63-1-2-PG 58 (35-0)
US 63-1-5-PG 58 (35-0)
US 63-1-9-PG 58 (35-0)
US 63-1-HP8-PG 58 (35-0)
US 63-1-HP9-PG 58 (35-0)
US 63-1-DP3A-PG 58 (35-0)
US 63-1-H4-PG 58-R (35-0)
US 63-1-D1b-PG 58-R (35-0)
US 63-1-H2-PG 58-R (35-0)
Figure A-40. Cole-Cole Plot Analyzed at 60°C for the RTFO Aged Virgin and E & R
Asphalt Binders from the US 63-1 Field, Plant, and Lab Mixes Containing 35% ABR by RAP
60
70
80
90
0.01 0.1 1 10 100 1000
δ at
60°
C (d
egre
es)
Log |G*| at 60°C (kPa)
US 63-1 PG 58 RTFO Aged Virgin
US 63-1-2-PG 58 (35-0)
US 63-1-5-PG 58 (35-0)
US 63-1-9-PG 58 (35-0)
US 63-1-HP8-PG 58 (35-0)
US 63-1-HP9-PG 58 (35-0)
US 63-1-DP3A-PG 58 (35-0)
US 63-1-H4-PG 58-R (35-0)
US 63-1-D1b-PG 58-R (35-0)
US 63-1-H2-PG 58-R (35-0)
Figure A-41. Black Diagram Analyzed at 60°C for the RTFO Aged Virgin and E & R
Asphalt Binders from the US 63-1 Field, Plant, and Lab Mixes Containing 35% ABR by RAP
Figure A-42 presents the master curve measured at 60°C for the RTFO aged virgin and E &
R asphalt binders from the US 63-1 lab mixes. Asphalt binders E & R from US 63-1-H4-PG 58-
R, US 63-1-D1b-PG 58-R, and US 63-1-H2-PG 58-R lab mixes showed higher resistance to rutting
than the RTFO aged virgin asphalt binder because of the aged asphalt binder included in the RAP.

138
Using soft asphalt binder (PG 46-34) reduced the rutting resistance of the E & R binders as
compared to E & R asphalt binders from mixes contained PG 58-28. Adding 3.75% Evoflex and
0.5% Evotherm to PG 46-34 asphalt binder slightly increased the rutting resistance of the E & R
asphalt binders as compared to E & R binders from the same mixes but with the same binder and
no additives. This was related to the effect of Evoflex on enhancing the blending of the recycled
materials with the virgin binder. Adding 10% or 20% ECR to the soft asphalt binder significantly
increased the rutting resistance in the E & R asphalt binders, even though we observed that not all
of the rubber made it into the recovered binder (some was present in recovered aggregates and
fines).
0.001
0.01
0.1
1
10
100
1000
0.0001 0.001 0.01 0.1 1 10 100
Log
|G*|
/sin
δat
60°
C (k
Pa)
Log reduced frequency (Hz)
US 63-1 PG 58 RTFO Aged VirginPG 46 RTFO Aged VirginUS 63-1-H4-PG 58-R (35-0)US 63-1-D1b-PG 58-R (35-0)US 63-1-H2-PG 58-R (35-0)US 63-1-D2a-PG 46 (35-0)US 63-1-H6-PG 46 (35-0)US 63-1-D1b-PG 46 (35-0)US 63-1-D2b-PG 46-R (35-0)US 63-1-H3-PG 46-R (35-0)US 63-1-D2a-PG 46-R (35-0)US 63-1-H2-PG 46-E10 (35-0)US 63-1-H5-PG 46-E10 (35-0)US 63-1-D2b-PG 46-E20 (35-0)US 63-1-Gmb3-PG 46-E20 (35-0)
Figure A-42. Master Curve Measured at 60°C for the RTFO Aged Virgin and E & R
Asphalt Binders from US 63-1 Lab Mixes Containing 35% ABR by RAP
The Cole-Cole plot analyzed at 60°C for the same binders is shown in Figure A-43.
Comparing the RTFO aged virgin and the E & R asphalt binders, a shift towards the elastic
modulus axis and the right-hand side of the curve occurred to the E & R asphalt binders. The
maximum shift was observed for binders E & R from the mixes containing ECR. The same results
were observed from analyzing the black diagram Figure A-44 because the maximum shift towards
the |G*| axis and the right-hand side of the curve was also observed for the binders E & R from
mixes containing ECR.

139
0.001
0.1
10
1000
0.000001 0.0001 0.01 1 100 10000
Log
G'' a
t 60°
C (k
Pa)
Log G' at 60°C (kPa)
US 63-1 PG 58 RTFO Aged VirginPG 46 RTFO Aged VirginUS 63-1-H4-PG 58-R (35-0)US 63-1-D1b-PG 58-R (35-0)US 63-1-H2-PG 58-R (35-0)US 63-1-D2a-PG 46 (35-0)US 63-1-H6-PG 46 (35-0)US 63-1-D1b-PG 46 (35-0)US 63-1-D2b-PG 46-R (35-0)US 63-1-H3-PG 46-R (35-0)US 63-1-D2a-PG 46-R (35-0)US 63-1-H2-PG 46-E10 (35-0)US 63-1-H5-PG 46-E10 (35-0)US 63-1-D2b-PG 46-E20 (35-0)US 63-1-Gmb3-PG 46-E20 (35-0)
Figure A-43. Cole-Cole Plot Analyzed at 60°C for the RTFO Aged Virgin and E & R
Asphalt Binders from US 63-1 Lab Mixes Containing 35% ABR by RAP
30
40
50
60
70
80
90
100
0.01 0.1 1 10 100 1000
δ at
60°
C (d
egre
es)
Log |G*| at 60°C (kPa)
US 63-1 PG 58 RTFO Aged VirginPG 46 RTFO Aged VirginUS 63-1-H4-PG 58-R (35-0)US 63-1-D1b-PG 58-R (35-0)US 63-1-H2-PG 58-R (35-0)US 63-1-D2a-PG 46 (35-0)US 63-1-H6-PG 46 (35-0)US 63-1-D1b-PG 46 (35-0)US 63-1-D2b-PG 46-R (35-0)US 63-1-H3-PG 46-R (35-0)US 63-1-D2a-PG 46-R (35-0)US 63-1-H2-PG 46-E10 (35-0)US 63-1-H5-PG 46-E10 (35-0)US 63-1-D2b-PG 46-E20 (35-0)US 63-1-Gmb3-PG 46-E20 (35-0)
Figure A-44. Black Diagram Analyzed at 60°C for the RTFO Aged Virgin and E & R
Asphalt Binders from US 63-1 Lab Mixes Containing 35% ABR by RAP

140
A.2.3. Relating Asphalt Binders Extracted and Recovered from the Field Mixes Constructed in 2016 to the Corresponding RTFO Aged Virgin Asphalt Binders
In this section, the asphalt binders E & R from the first batch field mixes constructed and
collected in 2016 presented in Table 2- are related to the corresponding RTFO aged virgin asphalt
binders. The asphalt binders were recovered from 23 samples for 8 different mixes. These mixes
either contained RAP, RAS, or both. Moreover, there was a mix that contained neither RAP nor
RAS (e.g. US 54-5).
A.2.3.1. Extraction of the Asphalt Binders from Field Mixes Constructed in 2016
The actual and extracted AC percentages for the field mixes constructed in 2016 using
different MMDMs are illustrated in Figure A-45. Any point located on the inclined line with an
angle of 45° represented samples that had the same percentages of the actual and extracted AC%.
The actual AC percentages for the field mixes were ranging between 4.8 and 5.7%. The extracted
AC percentages using the ashing MMDM presented in Figure A-45-a were found to be between
4.4 and 5.3%. Most of the samples having extracted AC percentages less than the actual AC
percentages. Therefore, the ashing MMDM underestimated the extracted AC percentages. Using
the centrifuge MMDM presented in Figure A-45-b increased the accuracy of the extracted AC
percentages. The extracted AC percentages using this MMDM were ranging between 4.7 and
5.6%. These extracted AC percentages were near the actual ones. Therefore, the centrifuge
MMDM presented more accurate extracted AC percentages. The extracted AC percentages were
also calculated using the average ashing and centrifuge MMDMs in Figure A-45-c. The extracted
AC percentages using this average ashing and centrifuge MMDMs were located between 4.6 and
5.5%.
To show the effect of the different MMDMs on the extracted AC percentages, the ANOVA
results are presented in Table A-2. The p-value (Prob > F) is 0.0028, which was lower than the
0.05 significance level. Thus, there was a significant difference between the means of the extracted
AC% using different MMDMs as compared to the mean of the actual AC%. To understand which
MMDM has a significant difference, the Tukey honestly significant difference (HSD) test was
implemented. The connecting letters report using the Tukey HSD test is illustrated in

141
Table A-3. Levels that were not connected by the same letter were considered significantly
different. This reflected that the mean of the extracted AC percentages using the ashing MMDM
was significantly different as compared to the means of the actual or extracted AC percentages
using the centrifuge MMDM.
The ashing MMDM was so sensitive and required a skilled operator. In other words, the
mineral matter in the total extracted effluent (asphalt binder dissolved in TCE plus mineral matter)
was calculated using the 100-ml representative sample taken into the ignition dish. Consequently,
if this 100-ml sample was not representative, contained more mineral matter, this underestimated
the extracted AC percentage. However, the centrifuge MMDM was more accurate because it did
not depend on the skills and accuracy of the operator. The whole mineral matter in the extracted
effluent was calculated easily using the centrifuge MMDM if the filterless centrifuge device was
available. These explanations illustrated why the ashing MMDM underestimated the extracted AC
percentages as compared to the centrifuge MMDM.
4.2
4.4
4.6
4.8
5.0
5.2
5.4
5.6
5.8
4.2 4.4 4.6 4.8 5 5.2 5.4 5.6 5.8
Extra
cted
AC
(%)
Actual AC (%)
(a) Ashing MMDM
4.2
4.4
4.6
4.8
5.0
5.2
5.4
5.6
5.8
4.2 4.4 4.6 4.8 5 5.2 5.4 5.6 5.8
Extra
cted
AC
(%)
Actual AC (%)
(b) Centrifuge MMDM
4.2
4.4
4.6
4.8
5.0
5.2
5.4
5.6
5.8
4.2 4.4 4.6 4.8 5 5.2 5.4 5.6 5.8
Extra
cted
AC
(%)
Actual AC (%)
(c) Average ashing & centrifuge MMDMsMO 13-1-5-PG 64H (17-0)MO 13-1-7-PG 64H (17-0)MO 13-1-11-PG 64H (17-0)US 54-6-9-PG 58 (31-0)US 54-6-7-PG 58 (31-0)US 54-6-2-PG 58 (31-0)US 54-2-7a-PG 58 (33-0)US 54-2-6-PG 58 (33-0)US 54-2-3-PG 58 (33-0)US 63-1-9-PG 58 (35-0)US 63-1-5-PG 58 (35-0)US 63-1-2-PG 58 (35-0)US 54-4-1a-PG 64H (35-0)US 54-4-4a-PG 64H (35-0)US 54-4-7-PG 64H (35-0)US 54-1-2a-PG 58 (0-33)US 54-1-3a-PG 58 (0-33)US 54-1-4-PG 58 (0-33)US 54-3-8a-PG 58 (18-15)US 54-3-6a-PG 58 (18-15)
Figure A-45. Actual vs Extracted AC% using Different MMDMs for Field Mixes Constructed in 2016.

142
Table A-2. ANOVA Results for the Actual and Extracted AC% for the Field Mixes Constructed in 2016
Source DF Sum of Squares Mean Square F Ratio Prob > F Method 3 0.978 0.326 5.067 0.0028 Error 88 5.661 0.064
C. Total 91 6.639 Table A-3. Connecting Letters Report using the Tukey HSD Test
Level Mean Actual AC% A 5.22
Extracted AC% using the centrifuge MMDM A 5.20 Extracted AC% using average ashing & centrifuge
MMDMs A B 5.08
Extracted AC% using the ashing MMDM B 4.96 Levels not connected by the same letter are significantly different.
The temperature sweep test results for the RTFO aged virgin and E & R asphalt binders from
the MO 13-1 field mixes containing 17% ABR by RAP and PG 64 -22H virgin asphalt binder are
presented in Figure A-46. It was observed that using 17% ABR by RAP increased the rutting
parameter for the E & R asphalt binders because of the stiffness of the RAP aged binders.
0
10
20
30
40
50
60
70
52 58 64 70 76 82 88 94
|G*|
/sinδ
(kPa
)
Temperature (°C)
MO 13-1 PG 64 H RTFO Aged Virgin MO 13-1-5-PG 64H (17-0)
MO 13-1-7-PG 64H (17-0) MO 13-1-11-PG 64H (17-0)
Figure A-46. Temperature Sweep Test Results for the RTFO Aged Virgin and E & R Asphalt Binders from MO 13-1 Field Mixes, Constructed in 2016, Containing 17% ABR by
RAP and PG 64-22H Virgin Asphalt Binder

143
Figure A-47 shows the master curve measured at 60°C for the RTFO aged virgin and E & R
asphalt binders from the MO 13-1 field mixes containing 17% ABR by RAP and PG 64-22H virgin
asphalt binder. The E & R asphalt binders showed a higher rutting parameter at different
frequencies as compared to the RTFO aged virgin asphalt binder. This was attributed to the higher
elasticity presented in Figure A-48 and the higher stiffness at high frequencies as illustrated in
Figure A-49.
0.01
0.1
1
10
100
1000
0.001 0.01 0.1 1 10 100
Log
|G*|
/sin
δat
60°
C (k
Pa)
Log reduced frequency (Hz)
MO 13-1 PG 64 H RTFO Aged Virgin
MO 13-1-5-PG 64H (17-0)
MO 13-1-7-PG 64H (17-0)
MO 13-1-11-PG 64H (17-0)
Figure A-47. Master Curve Measured at 60°C for the RTFO Aged Virgin and E & R
Asphalt Binders from MO 13-1 field mixes, constructed in 2016, containing 17% ABR by RAP and PG 64-22H virgin asphalt binder
0.001
0.1
10
1000
0.001 0.01 0.1 1 10 100 1000
Log
G'' a
t 60°
C (k
Pa)
Log G' at 60°C (kPa)
MO 13-1 PG 64 H RTFO Aged Virgin
MO 13-1-5-PG 64H (17-0)
MO 13-1-7-PG 64H (17-0)
MO 13-1-11-PG 64H (17-0)
Figure A-48. Cole-Cole Plot Analyzed at 60°C for the RTFO Aged Virgin and E & R

144
Asphalt Binders from MO 13-1 Field Mixes, Constructed in 2016, Containing 17% ABR by RAP and PG 64-22H Virgin Asphalt Binder
60
65
70
75
80
85
90
0.01 0.1 1 10 100 1000
δ at
60°
C (d
egre
es)
Log |G*| at 60°C (kPa)
MO 13-1 PG 64 H RTFO Aged Virgin
MO 13-1-5-PG 64H (17-0)
MO 13-1-7-PG 64H (17-0)
MO 13-1-11-PG 64H (17-0)
Figure A-49. Black Diagram Analyzed at 60°C for the RTFO Aged Virgin and E & R
Asphalt Binders from MO 13-1 Field Mixes, Constructed in 2016, Containing 17% ABR by RAP and PG 64-22H Virgin Asphalt Binder
Figure A-50 shows the temperature sweep test results for the RTFO aged virgin and E & R
asphalt binders from the US 54 field mixes containing different percentages of recycled materials
(RAP, RAS, or both) and PG 58-28 virgin asphalt binder. The E & R asphalt binders from mixes
containing 31% ABR by RAP showed higher resistance to rutting as compared to corresponding
RTFO aged virgin asphalt binder. Increasing the ABR by RAP to 33% increased the rutting
parameter significantly. Asphalt binders E & R from mixes containing 33% ABR by RAS showed
higher resistance values than asphalt binders E & R from mixes containing 31% by RAP and lower
rutting parameter values than asphalt binders E & R from mixes containing 33% ABR by RAP.
The air-blown asphalt binders included in the RAS were stiffer than the aged binders in the RAP.
Consequently, it was concluded that there was no full interaction process between the binder
included in the RAS and the virgin binder. Consequently, for the same percentage of recycled
materials (33% ABR by RAS or RAP) the E & R asphalt binders from mixes containing RAP were
stiffer than the binders E & R from mixes containing RAS. Using 18% ABR by RAP and 15%
ABR by RAS with a total ABR of 33% increased the rutting parameter of the E & R asphalt binders
as compared to the E & R asphalt binders from mixes containing 33% ABR by RAS. It was

145
important to mention here that not only the virgin asphalt binder and the percentage of the recycled
materials affected the performance of the E & R asphalt binder but also the interaction process
between the recycled materials components and the virgin asphalt binder altered the properties of
the E & R binders.
These results were related to the results obtained in Figure A-51, Figure A-52, and Figure
A-53 for the master curve, Cole-Cole plot, and black diagram, respectively. All E & R asphalt
binders showed higher rutting resistance at different frequencies as compared to the corresponding
RTFO aged virgin asphalt binder. The highest rutting parameter was achieved for asphalt binders
E & R from mixes containing 33% ABR percentage by RAP; the highest stiffness and elasticity
values were observed for these binders.
0
20
40
60
80
100
120
140
160
180
46 52 58 64 70 76 82 88 94 100
|G*|
/sinδ
(kPa
)
Temperature (°C)US 54 PG 58 RTFO Aged Virgin US 54-6-9-PG 58 (31-0) US 54-6-7-PG 58 (31-0)US 54-6-2-PG 58 (31-0) US 54-2-7a-PG 58 (33-0) US 54-2-6-PG 58 (33-0)US 54-2-3-PG 58 (33-0) US 54-1-2a-PG 58 (0-33) US 54-1-3a-PG 58 (0-33)US 54-1-4-PG 58 (0-33) US 54-3-8a-PG 58 (18-15) US 54-3-6a-PG 58 (18-15)US 54-3-2-PG 58 (18-15)
0
5
10
15
20
25
30
46 52 58 64 70 76 82 88 94 100
|G*|
/sinδ
(kPa
)
Temperature (°C)
Figure A-50. Temperature Sweep Test Results for the RTFO Aged Virgin and E & R Asphalt Binders from US 54 Field Mixes, Constructed in 2016, Containing Different
Percentages of Recycled Materials and PG 58-28 Virgin Asphalt Binder

146
0.01
0.1
1
10
100
1000
0.0001 0.001 0.01 0.1 1 10 100
Log
|G*|
/sin
δat
60°
C (k
Pa)
Log reduced frequency (Hz)
US 54 PG 58 RTFO Aged Virgin
US 54-6-9-PG 58 (31-0)
US 54-6-7-PG 58 (31-0)
US 54-6-2-PG 58 (31-0)
US 54-2-7a-PG 58 (33-0)
US 54-2-6-PG 58 (33-0)
US 54-2-3-PG 58 (33-0)
US 54-1-2a-PG 58 (0-33)
US 54-1-3a-PG 58 (0-33)
US 54-1-4-PG 58 (0-33)
US 54-3-8a-PG 58 (18-15)
US 54-3-6a-PG 58 (18-15)
US 54-3-2-PG 58 (18-15)
Figure A-51. Master Curve Measured at 60°C for the RTFO Aged Virgin and E & R Asphalt Binders from US 54 Field Mixes, Constructed in 2016, Containing Different
Percentages of Recycled Materials and PG 58-28 Virgin Asphalt Binder
0.001
0.1
10
1000
0.00001 0.001 0.1 10 1000
Log
G'' a
t 60°
C (k
Pa)
Log G' at 60°C (kPa)
US 54 PG 58 RTFO Aged Virgin
US 54-6-9-PG 58 (31-0)
US 54-6-7-PG 58 (31-0)
US 54-6-2-PG 58 (31-0)
US 54-2-7a-PG 58 (33-0)
US 54-2-6-PG 58 (33-0)
US 54-2-3-PG 58 (33-0)
US 54-1-2a-PG 58 (0-33)
US 54-1-3a-PG 58 (0-33)
US 54-1-4-PG 58 (0-33)
US 54-3-8a-PG 58 (18-15)
US 54-3-6a-PG 58 (18-15)
US 54-3-2-PG 58 (18-15)
Figure A-52. Cole-Cole Plot Analyzed at 60°C for the RTFO Aged Virgin and E & R Asphalt Binders from US 54 Field Mixes, Constructed in 2016, Containing Different
Percentages of Recycled Materials and PG 58-28 Virgin Asphalt Binder

147
50
60
70
80
90
0.01 0.1 1 10 100 1000
δ at
60°
C (d
egre
es)
Log |G*| at 60°C (kPa)
US 54 PG 58 RTFO Aged Virgin
US 54-6-9-PG 58 (31-0)
US 54-6-7-PG 58 (31-0)
US 54-6-2-PG 58 (31-0)
US 54-2-7a-PG 58 (33-0)
US 54-2-6-PG 58 (33-0)
US 54-2-3-PG 58 (33-0)
US 54-1-2a-PG 58 (0-33)
US 54-1-3a-PG 58 (0-33)
US 54-1-4-PG 58 (0-33)
US 54-3-8a-PG 58 (18-15)
US 54-3-6a-PG 58 (18-15)
US 54-3-2-PG 58 (18-15) Figure A-53. Black Diagram Analyzed at 60°C for the RTFO Aged Virgin and E & R Asphalt Binders from US 54 Field Mixes, Constructed in 2016, Containing Different
Percentages of Recycled Materials and PG 58-28 Virgin Asphalt Binder
Figure A-54 shows the temperature sweep test results for the RTFO aged virgin and E & R
asphalt binders from the US 54 field mixes containing PG 64-22H virgin asphalt binder. The
asphalt binders E & R from mixes containing no recycled materials showed an increase in the
stiffness by presenting higher rutting parameter values than the RTFO binders. Using 35% ABR
by RAP increased the E & R asphalt binders’ rutting parameter values significantly as compared
to the E & R asphalt binders from mixes containing no recycled materials.
Figure A-55 shows the master curve for these binders measured at 60°C and different
frequencies. The E & R asphalt binders showed higher rutting resistance as compared to the
corresponding RTFO aged virgin binder. The Cole-Cole plot and black diagram measured at 60°C
for these binders are presented in Figure A-56 and Figure A-57, respectively. The Cole-Cole plots
showed no significant difference between the RTFO aged virgin and E & R asphalt binders from
mixes containing no recycled materials. However, the E & R asphalt binders from mixes
containing 35% ABR percentage by RAP showed right-hand side shifting for the curves, which
indicated more elasticity. The black diagram presented in Figure A-57 illustrates that the asphalt
binders E & R from mixes containing 35% ABR by RAP showed different trends as compared to
the other binders.

148
0
50
100
150
200
250
300
52 58 64 70 76 82 88 94 100
|G*|
/sinδ
(kPa
)
Temperature (°C)
US 54 PG 64H RTFO Aged Virgin US 54-4-1a-PG 64H (35-0) US 54-4-4a-PG 64H (35-0)
US 54-4-7-PG 64H (35-0) US 54-5-5a-PG 64H (0-0) US 54-5-9a-PG 64H (0-0)
0
10
20
30
40
52 58 64 70 76 82 88 94
|G*|
/sinδ
(kPa
)
Temperature (°C)
Figure A-54. Temperature Sweep Test Results for the RTFO Aged Virgin and E & R Asphalt Binders from US 54 Field Mixes, Constructed in 2016, Containing PG 64-22H
Virgin Asphalt Binder
0.01
0.1
1
10
100
1000
10000
0.0001 0.001 0.01 0.1 1 10 100
Log
|G*|
/sin
δat
60°
C (k
Pa)
Log reduced frequency (Hz)
US 54 PG 64H RTFO Aged Virgin
US 54-4-1a-PG 64H (35-0)
US 54-4-4a-PG 64H (35-0)
US 54-4-7-PG 64H (35-0)
US 54-5-5a-PG 64H (0-0)
US 54-5-9a-PG 64H (0-0)
Figure A-55. Master Curve Measured at 60°C for the RTFO Aged Virgin and E & R
Asphalt Binders from US 54 Field Mixes, Constructed in 2016, Containing PG 64-22H Virgin Asphalt Binder

149
0.001
0.1
10
1000
0.001 0.01 0.1 1 10 100 1000
Log
G'' a
t 60°
C (k
Pa)
Log G' at 60°C (kPa)
US 54 PG 64H RTFO Aged Virgin
US 54-4-1a-PG 64H (35-0)
US 54-4-4a-PG 64H (35-0)
US 54-4-7-PG 64H (35-0)
US 54-5-5a-PG 64H (0-0)
US 54-5-9a-PG 64H (0-0)
Figure A-56. Cole-Cole Plot Analyzed at 60°C for the RTFO Aged Virgin and E & R
Asphalt Binders from US 54 Field Mixes, Constructed in 2016, Containing PG 64-22H Virgin Asphalt Binder
50
60
70
80
90
0.01 0.1 1 10 100 1000
δ at
60°
C (d
egre
es)
Log |G*| at 60°C (kPa)
US 54 PG 64H RTFO Aged Virgin
US 54-4-1a-PG 64H (35-0)
US 54-4-4a-PG 64H (35-0)
US 54-4-7-PG 64H (35-0)
US 54-5-5a-PG 64H (0-0)
US 54-5-9a-PG 64H (0-0)
Figure A-57. Black Diagram Analyzed at 60°C for the RTFO Aged Virgin and E & R Asphalt Binders from US 54 Field Mixes, Constructed in 2016, Containing PG 64-22H
Virgin Asphalt Binder
Figure A-58 shows the temperature sweep test results for the RTFO aged virgin and E & R
asphalt binders from the US 63-1 field mixes containing PG 58-28 virgin asphalt binder. The
asphalt binders E & R from mixes containing 35% ABR by RAP showed an increase in the
stiffness by presenting higher rutting parameter values than the RTFO binders.

150
The master curve, Cole-Cole plot, and black diagram measured for these binders at 60°C and
different frequencies are presented in Figure A-59, Figure A-60, and Figure A-61, respectively.
The asphalt binders E & R from mixes containing 35% ABR percentage by RAP showed higher
rutting resistance than the values of the corresponding RTFO aged virgin asphalt binders. This was
related to the higher stiffness and elasticity.
0
10
20
30
40
50
60
46 52 58 64 70 76 82 88
|G*|
/sinδ
(kPa
)
Temperature (°C)
US 63 PG 58 RTFO Aged Virgin US 63-1-9-PG 58 (35-0)
US 63-1-5-PG 58 (35-0) US 63-1-2-PG 58 (35-0)
Figure A-58. Temperature Sweep Test Results for the RTFO Aged Virgin and E & R Asphalt Binders from US 63-1 Field Mixes, Constructed in 2016, Containing PG 58-28
Virgin Asphalt Binder and 35% ABR by RAP
0.01
0.1
1
10
100
1000
0.001 0.01 0.1 1 10 100
Log
|G*|
/sin
δat
60°
C (k
Pa)
Log reduced frequency (Hz)
US 63 PG 58 RTFO Aged Virgin
US 63-1-9-PG 58 (35-0)
US 63-1-5-PG 58 (35-0)
US 63-1-2-PG 58 (35-0)

151
Figure A-0-59. Master Curve Measured at 60°C for the RTFO Aged Virgin and E & R Asphalt Binders from US 63-1 Field Mixes, Constructed in 2016, Containing PG 58-28
Virgin Asphalt Binder and 35% ABR by RAP
0.001
0.1
10
1000
0.00001 0.001 0.1 10 1000
Log
G'' a
t 60°
C (k
Pa)
Log G' at 60°C (kPa)
US 63 PG 58 RTFO Aged Virgin
US 63-1-9-PG 58 (35-0)
US 63-1-5-PG 58 (35-0)
US 63-1-2-PG 58 (35-0)
Figure A-60. Cole-Cole Plot Analyzed at 60°C for the RTFO Aged Virgin and E & R
Asphalt Binders from US 63-1 Field Mixes, Constructed in 2016, Containing PG 58-28 Virgin Asphalt Binder and 35% ABR by RAP
60
70
80
90
0.01 0.1 1 10 100 1000
δ at
60°
C (d
egre
es)
Log |G*| at 60°C (kPa)
US 63 PG 58 RTFO Aged Virgin
US 63-1-9-PG 58 (35-0)
US 63-1-5-PG 58 (35-0)
US 63-1-2-PG 58 (35-0)
Figure A-61. Black Diagram Analyzed at 60°C for the RTFO Aged Virgin and E & R Asphalt Binders from US 63-1 Field Mixes, Constructed in 2016, Containing PG 58-28
Virgin Asphalt Binder and 35% ABR by RAP

152
To compare the different E & R binders and the corresponding RTFO aged virgin binders, the
high PG temperature for each asphalt binder is presented in Figure A-62. The columns’ color
indicated the state of the asphalt binder. In other words, the black columns represent the RTFO
aged virgin binders, the red ones indicate the binders E & R from mixes containing RAP, the green
ones indicate the binders E & R from mixes containing RAS, the purple ones indicate the binders
E & R from mixes containing both RAP and RAS, and the blue ones refer to the E & R binders
from mixes containing no recycled materials. The high PG temperature increased one to two
grades, 6°C per grade, for asphalt binders E & R from mixes containing 17% ABR by RAP, MO
13-1. Using 31% ABR by RAP or 33% ABR by RAS in US 54-6 and US 54-1 mixes respectively
increased the high PG temperatures of the E & R asphalt binders by two grades. Increasing the
ABR percentage by RAP from 31% to 33% in US 54-2 mixes increased the high PG temperature
by another three grades. In other words, the E & R asphalt binders containing 33% ABR by RAP
showed a boost in the high PG temperature by five grades as compared to the corresponding RTFO
aged virgin asphalt binder. This was related to the high variability of the aged binders E & R from
the RAP as discussed in the literature: the asphalt binders E & R from the RAP can be varied from
one season and/or stockpile to another.
Using both RAP and RAS with a total ABR of 33% in the US 54-3 mixes showed an increase
in the high PG temperature by one grade as compared to the high PG temperature of the E & R
asphalt binders from mixes containing the same 33% ABR percentage by RAS only, US 54-1
mixes. This indicated that combining both RAP and RAS in the mixes altered the performance of
the E & R asphalt binders. This occurred because the asphalt binders included in the RAP
interacted with the virgin asphalt binders easier than the interaction process between the air-blown
asphalt included in the RAS and the same virgin asphalt binders. The interaction process was
different in the case of the RAS binders due to the stiff nature of the air-blown asphalt. These
binders required high heat to ensure good interaction process with the virgin asphalt binder. The
extra heating during the preheating and compaction processes for the plant mixes containing RAS
collected from behind the paver caused more interaction process between the air-blown binder in
the RAS and the virgin asphalt binder. However, for the same field mixes, the interaction process
was not fully achieved. Therefore, the asphalt binders E & R from mixes containing 33% ABR by
RAP presented higher stiffness than the binders E & R from mixes containing the same virgin
asphalt binder and 33% ABR by RAS.

153
Asphalt binders E & R from mixes containing no recycled materials in the US 54-5 mixes
showed an increase in the high PG temperature from one to two grades. Adding RAP by a
percentage of 35% ABR to US 54-4 mixes increased the high PG temperature from three to four
grades as compared to the RTFO aged virgin binders. Comparing the high PG temperatures of the
E & R asphalt binders from US 54-4 and US 63-1 mixes, both mixes contained the same ABR
percentage by RAP (35%). However, the US 63-1 mixes contained a softer asphalt binder. This
caused an increase in the high PG temperature of the E & R asphalt binders from US 63-1 mixes
only two grades, which was lower than the increase for the asphalt binders E & R from US 54-4
mixes (three to four grades). Another reason was the variability of RAP properties.
46
52
58
64
70
76
82
88
94
Hig
h PG
tem
pera
ture
(°C
)
Sample code
Figure A-62. The High PG Temperatures for the RTFO Aged Virgin and E & R Asphalt Binders from Different Field Mixes, Constructed in 2016
Figure A-63 illustrates the MSCR test results measured at 60°C reference temperature and 0.1
& 3.2 kPa stress levels for the RTFO aged virgin and E & R asphalt binders from MO 13-1 field
mixes containing 17% ABR by RAP and PG 64-22H virgin asphalt binder. The asphalt binders E
& R from these mixes showed more resistance to rutting by presenting higher %R and lower Jnr

154
values at different stress levels than the values recorded for the RTFO aged virgin asphalt binder.
This was related to the stiffness of the asphalt binders included in the RAP.
0
0.1
0.2
0.3
0.4
0.5
0.6
0.7
20 30 40 50
J nr(k
Pa−1
)
Recovery (%)
MO 13-1-PG 64H RTFO Aged Virgin
MO 13-1-5-PG 64H (17-0)
MO 13-1-7-PG 64H (17-0)
MO 13-1-11-PG 64H (17-0)
0.1 kPa stress level
3.2 kPa stress level
Figure A-63. MSCR Test Results Measured at 60°C for RTFO Aged Virgin and E & R
Asphalt Binders from MO 13-1 Field Mixes, Constructed in 2016, Containing 17% ABR by RAP and PG 64-22H Virgin Asphalt Binder
Figure A-64 shows the relation between the %R and Jnr measured at 60°C and two different
stress levels for the RTFO aged virgin and E & R asphalt binders from US 54 field mixes
containing different percentages of recycled materials by RAP, RAS, or both, and a PG 58-28
virgin asphalt binder. All asphalt binders E & R from these mixes presented higher %R and lower
Jnr values than the RTFO aged virgin asphalt binder’s values. The highest %R and the lowest Jnr
values were recorded for binders E & R from mixes containing 33% ABR by RAP. The lowest
%R and the highest Jnr values for the E & R asphalt binders were recorded for binders E & R from
mixes having 31% ABR percentage by RAP. This reflected that increasing the percentage of the
recycled materials altered the performance of the E & R asphalt binders. Another reason was the
high variability of the binders’ properties included in the RAP. For asphalt binders E & R from
mixes containing either 33% ABR by RAS or 18-15% ABR by RAP-RAS, the binders had a higher
rutting resistance (higher %R and lower Jnr) than binders E & R from mixes containing 31% ABR
by RAP and lower rutting resistance than binders E & R from mixes containing 33% ABR by
RAP.

155
0
0.5
1
1.5
2
2.5
3
3.5
4
4.5
0 20 40 60 80
J nr(k
Pa-1
)
Recovery (%)
US 54-PG 58 RTFO Aged Virgin
US 54-6-9-PG 58 (31-0)
US 54-6-2-PG 58 (31-0)
US 54-6-7-PG 58 (31-0)
US 54-3-6a-PG 58 (18-15)
US 54-3-2-PG 58 (18-15)
US 54-3-8a-PG 58 (18-15)
US 54-1-3a-PG 58 (0-33)
US 54-1-4-PG 58 (0-33)
US 54-1-2a-PG 58 (0-33)
US 54-2-7a-PG 58 (33-0)
US 54-2-6-PG 58 (33-0)
US 54-2-3-PG 58 (33-0)
0.1 kPa stress level
3.2 kPa stress level
0
0.2
0.4
0.6
0.8
1
0 20 40 60 80
J nr(k
Pa-1
)
Recovery (%)
Figure A-64. MSCR Test Results Measured at 60°C for RTFO Aged Virgin and E & R
Asphalt Binders from US 54 Field Mixes, Constructed in 2016, Containing Different Percentages of Recycled Materials and PG 58-28 Virgin Asphalt Binder
The MSCR test results at 60°C for RTFO aged virgin and E & R asphalt binders from US 54
field mixes containing PG 64-22H virgin asphalt binder are presented in Figure A-65. The %R
values did not show any significant enhancement for the US 54-5-9a E & R asphalt binder as
compared to the RTFO aged virgin binder. Moreover, the %R values decreased for US 54-5-5a
and all US 54-4 E & R asphalt binders as compared to the RTFO aged virgin binder. However, for
the Jnr, the E & R asphalt binders introduced lower values than the RTFO aged virgin binders’
values. The lowest Jnr values were recorded for asphalt binders E & R from mixes containing 35%
ABR percentage by RAP.

156
0
0.05
0.1
0.15
0.2
0.25
0.3
40 50 60 70 80
J nr(k
Pa−1
)
Recovery (%)
US 54-PG 64H RTFO Aged Virgin
US 54-4-1a-PG 64H (35-0)
US 54-4-4a-PG 64H (35-0)
US 54-4-7-PG 64H (35-0)
US 54-5-5a-PG 64H (0-0)
US 54-5-9a-PG 64H (0-0)
0.1 kPa stress level
3.2 kPa stress level
Figure A-65. MSCR Test Results, Measured at 60°C, for RTFO Aged Virgin and E & R Asphalt Binders from US 54 Field Mixes, Constructed in 2016, Containing PG 64-22H
Virgin Asphalt Binder
Figure A-66 illustrates the MSCR test results measured at 60°C for the RTFO aged virgin and
E & R asphalt binders from US 63-1 field mixes containing 35% ABR percentage by RAP and PG
58-28 virgin asphalt binder. The asphalt binders E & R from these mixes showed higher %R and
lower Jnr values than the values obtained for the RTFO aged virgin asphalt binder. This occurred
due to the stiffness of the binders contained in the RAP.
0
1
2
3
4
5
6
7
0 5 10 15 20 25
J nr(k
Pa−1
)
Recovery (%)
US 63-PG 58 RTFO Aged Virgin
US 63-1-9-PG 58 (35-0)
US 63-1-5-PG 58 (35-0)
US 63-1-2-PG 58 (35-0)
0.1 kPa stress level
3.2 kPa stress level
Figure A-66. MSCR Test Results Measured at 60°C for RTFO Aged Virgin and E & R Asphalt Binders from US 63-1 Field Mixes, Constructed in 2016, Containing PG 58-28
Virgin Asphalt Binder and 35% ABR by RAP

157
Figure A-67 shows the percentage increase or decrease in the %R values for the E & R asphalt
binders from field mixes constructed in 2016 as compared to the %R of the RTFO aged virgin
binders. The MSCR test’s measurements were conducted at 60°C and 0.1 & 3.2 kPa stress levels.
Most of the E & R asphalt binders presented higher %R values than the values of the corresponding
RTFO aged virgin binders. However, some E & R asphalt binders showed a percentage decrease
in the %R values (e.g. E & R binders from US 54-4 and US 54-5-5a mixes). These mixes contained
a PG 64-22H virgin asphalt binder. The lowest percentage increase in the %R values was observed
for asphalt binders E & R from MO 13-1 mixes. These mixes had a PG 64-22H virgin asphalt
binder. Therefore, the asphalt binders E & R from mixes containing a PG 64-22H virgin asphalt
binder did not present a significant increase in the %R values as compared to the RTFO aged virgin
binders’ values.
Contrarily, by using a PG 58-28 virgin asphalt binder, the %R for the E & R asphalt binders
enhanced significantly as compared to the corresponding RTFO aged virgin binders. The
percentages increase in the %R values at 3.2 kPa stress level (R3.2) for asphalt binders E & R from
US 54-PG 58 and US 63-1 mixes were not presented in the figure because the R3.2 values for the
corresponding RTFO aged virgin binders were zero. The percentage increase in the R0.1 value for
asphalt binders E & R from US 54-6-PG 58 (31-0) reached above 400%. Increasing the ABR
percentage by RAP to 33% for US 54-2-PG 58 (33-0) mixes caused a significant increase in the
percentage increase in the R0.1 value for the E & R asphalt binders. The percentage increase in
the R0.1 value for these binders reached approximately 2400%. The asphalt binders E & R from
either US 54-1-PG 58 (0-33) or US 54-3-PG 58 (18-15) mixes had the same percentage increase
in the R0.1 value (800%), which was greater than what was obtained for mixes contained 31%
ABR by RAP and lower than the values obtained for mixes containing 33% ABR by RAP. By
comparing asphalt binders E & R from US 54-4 and US 63-1 mixes, these mixes had the same
ABR percentage by RAP (35%), the binders E & R from mixes containing a soft binder, PG 58-
28, (US 63-1) showed a higher increase in the percentage increase in the R0.1 value. The value
reached more than 1600%. However, the other binders E & R from the other mixes, US 54-4,
showed a percentage decrease in the %R values due to the stiffness of the used virgin asphalt
binder (PG 64-22H).

158
-400
0
400
800
1200
1600
2000
2400
2800Pe
rcen
tage
incr
ease
or d
ecre
ase
in %
R (%
)
Sample code
R0.1 R3.2
Figure A-67. Percentage Increase or Decrease in the %R Values for the Asphalt Binders E & R from Field Mixes Constructed in 2016 as Compared to the %R Values for the RTFO Aged Virgin Binders; the Measurements were Conducted at 60°C and 0.1 & 3.2 kPa Stress
Levels
Figure A-68 shows the percentage decrease in the Jnr values for the E & R asphalt binders
from field mixes constructed in 2016 as compared to the Jnr of the RTFO aged virgin binders. The
MSCR test’s measurements were conducted at 60°C and 0.1 & 3.2 kPa stress levels. All binders
E & R from these mixes presented lower percentages of Jnr values than the values corresponding
to the RTFO aged virgin asphalt binders. The highest percentage decrease in the Jnr values was
recorded for asphalt binders E & R from mixes containing 33% ABR percentage by RAP and a
virgin asphalt binder having a PG of 58-28. The asphalt binders E & R from mixes containing 30%
or more ABR percentage by recycled materials showed a percentage decrease in the Jnr values
greater than 80%. The lowest percentage decrease in the Jnr values was noted for asphalt binders
E & R from mixes containing no recycled materials and a stiff asphalt binder as illustrated in US
54-5-5a.

159
-100
-90
-80
-70
-60
-50
-40
-30
-20
-10
0
Perc
enta
ge d
ecre
ase
in J n
r(%
)
Sample code
Jnr0.1 Jnr3.2
Figure A-68. Percentage Decrease in the Jnr Values for the Asphalt Binders E & R from
Field Mixes Constructed in 2016 as Compared to the Jnr Values for the RTFO Aged Virgin Binders; the Measurements were Conducted at 60°C and 0.1 & 3.2 kPa Stress Levels
In this section, a comparison between the RTFO aged virgin and the E & R asphalt binders
from the MO 13-1, US 54-6, US 54-1, and US 63-1 field and plant mixes constructed in 2016 was
discussed. The temperature sweep test results for the RTFO aged virgin and E & R asphalt binders
from MO 13-1 field and plant mixes containing 17% ABR by RAP are presented in Figure A-69.
As discussed in the previous sections, the E & R asphalt from mixes even containing no recycled
materials showed a higher rutting parameter as compared to the corresponding RTFO aged asphalt
binders. However, the asphalt binders E & R from the plant mixes presented a higher stiffness by
showing higher rutting parameter values than the binders E & R from the field mixes. This
happened because of the reheating and compaction processes that had occurred to the plant mixes
in the lab after collecting from behind the paver. These processes increased the interaction process
of the asphalt binders included in the recycled materials and the virgin asphalt binder. The same
observations were concluded from Figure A-70: the E & R asphalt binders from plant mixes
presented higher PG temperatures by one or two grades as compared to the E & R binders from
the field mixes.

160
0
20
40
60
80
100
120
52 58 64 70 76 82 88 94 100
|G*|
/sinδ
(kPa
)
Temperature (°C)MO 13-1 PG 64 H RTFO Aged Virgin MO 13-1-5-PG 64H (17-0)MO 13-1-7-PG 64H (17-0) MO 13-1-11-PG 64H (17-0)MO 13-1-HP13-PG 64 H (17-0) MO 13-1-HP16- PG 64 H (17-0)MO 13-1-HP14- PG 64 H (17-0)
0
20
40
60
80
52 58 64 70 76 82 88 94
|G*|
/sinδ
(kPa
)
Temperature (°C)
Figure A-69. Temperature Sweep Test Results for the RTFO Aged Virgin and E & R
Asphalt Binders from MO 13-1 Field and Plant Mixes, Constructed in 2016, Containing PG 64-22H Virgin Asphalt Binder and 17% ABR by RAP
46
52
58
64
70
76
82
88
94
Hig
h PG
tem
pera
ture
(°C
)
Sample code
Field Plant
Figure A-70. High PG Temperatures for the E & R Asphalt Binders from MO 13-1 Field and Plant Mixes, Constructed in 2016, Containing PG 64-22H Virgin Asphalt Binder and
17% ABR by RAP

161
Temperature sweep test results for the RTFO aged virgin and E & R asphalt binders from US
54-6 field and plant mixes constructed in 2016, contained 31% ABR by RAP and PG 58-28 virgin
asphalt binder are illustrated in Figure A-71. The same finding presented in Figure A-69 was
concluded from Figure A-71. The E & R asphalt binders from the plant mixes presented higher
rutting parameter values than the values of the E & R asphalt binders from the field mixes. Figure
A-72 presents the high PG temperatures for the asphalt binders E & R from the US 54-6 field and
plant mixes containing 31% ABR by RAP and a PG 58-28 virgin asphalt binder. The high PG
temperature of the E & R binders from the plant mixes was one grade higher than the high PG
temperature of the binders E & R from the field mixes.
0
15
30
45
60
75
90
46 52 58 64 70 76 82 88 94 100
|G*|
/sinδ
(kPa
)
Temperature (°C)US 54 PG 58 RTFO Aged Virgin US 54-6-2-PG 58 (31-0) US 54-6-7-PG 58 (31-0)
US 54-6-9-PG 58 (31-0) US 54-6-HP3-PG 58 (31-0) US 54-6-DP4A-PG 58 (31-0)
US54-6-DP4B-PG 58 (31-0)
0
3
6
9
12
15
18
46 52 58 64 70 76 82 88 94 100
|G*|
/sinδ
(kPa
)
Temperature (°C)
Figure A-71. Temperature Sweep Test Results for the RTFO Aged Virgin and E & R
Asphalt Binders from US 54-6 Field and Plant Mixes, Constructed in 2016, Containing PG 58-28 Virgin Asphalt Binder and 31% ABR by RAP

162
46
52
58
64
70
76
82H
igh
PG te
mpe
ratu
re (°
C)
Sample code
Field Plant
Figure A-72. High PG Temperatures for the E & R Asphalt Binders from US 54-6 Field and Plant Mixes, Constructed in 2016, Containing PG 58-28 Virgin Asphalt Binder and
31% ABR by RAP
Figure A-73 presents the temperature sweep test results for the RTFO aged virgin and the E
& R asphalt binders from US 54-1 field and plant mixes containing PG 58-28 virgin asphalt binder
and 33% ABR by RAS. For the asphalt binders E & R from the plant samples, the rutting parameter
increased significantly as compared to the values for the E & R asphalt binders from the field
samples. Even at 94°C, the rutting parameter for the E & R asphalt binders from the US 54-1 plant
mixes was at least four times greater than the 2.2 kPa value (specification limit for the RTFO aged
binders). Figure A-74 shows the high PG temperatures for the asphalt binders E & R from the US
54-1 field and plant mixes containing PG 58-28 virgin asphalt binder and 33% ABR by RAS. The
reheating and compaction processes implemented in the lab for the collected plant mixes have
caused a significant increase in the high PG temperature of the E & R asphalt binders. Thus, the
high PG temperature for the E & R asphalt binders from US 54-1 field mixes was 70°C. However,
the high PG temperature for the E & R asphalt binders from the US 54-1 plant mixes exceeded
94°C. The asphalt binders included in the RAS were very stiff “air-blown asphalt”. So, increasing
the heating process caused more contribution of recycled materials in the mix. This altered the
performance of the total E & R binder by increasing its stiffness.

163
0
200
400
600
800
1000
1200
1400
1600
46 52 58 64 70 76 82 88 94 100
|G*|
/sinδ
(kPa
)
Temperature (°C)US 54 PG 58 RTFO Aged Virgin US 54-1-2a-PG 58 (0-33) US 54-1-3a-PG 58 (0-33)
US 54-1-4-PG 58 (0-33) US 54-1-1DCTP1B-PG 58 (0-33) US 54-1-1DCTP2B-PG 58 (0-33)
US 54-1-1DCTP1A-PG 58 (0-33) Figure A-73. Temperature Sweep Test Results for the RTFO Aged Virgin and E & R
Asphalt Binders from US 54-1 Field and Plant Mixes, Constructed in 2016, Containing PG 58-28 Virgin Asphalt Binder and 33% ABR by RAS
0
4
8
12
16
20
24
28
46 52 58 64 70 76 82 88 94 100
|G*|
/sinδ
(kPa
)
Temperature (°C)
46
52
58
64
70
76
82
88
94
Hig
h PG
tem
pera
ture
(°C
)
Sample code
Field Plant
Figure A-74. High PG Temperatures for the E & R Asphalt Binders from US 54-1 Field and Plant Mixes, Constructed in 2016, Containing PG 58-28 Virgin Asphalt Binder and
33% ABR by RAS
Note: The high PG temperatures for the E & R asphalt binders from US 54-1 plant mixes exceeded 94°C.

164
Temperature sweep test results for the RTFO aged virgin and E & R asphalt binders from US
63-1 field and plant mixes containing PG 58-28 virgin asphalt binder and 35% ABR by RAP are
illustrated in Figure A-75. The E & R asphalt binders from the plant mixes presented higher rutting
parameter values than the values of the E & R asphalt binders from the field mixes. The US 63 PG
58 asphalt binder was softer than the US 54 PG 58 asphalt binder. However, the asphalt binders E
& R from the US 63-1 mixes were stiffer than the binders E & R from the US 54-6 due to the
higher percentage of RAP included in the US 63-1 mixes. Figure A-76 shows the high PG
temperatures for the asphalt binders E & R from the US 63-1 field and plant mixes containing PG
58-28 virgin asphalt binder and 35% ABR by RAP. The high PG temperature of the E & R binders
from the plant mixes was one grade higher than the high PG temperature of the binders E & R
from the field mixes due to the occurrence of more interaction process.
0
15
30
45
60
75
90
46 52 58 64 70 76 82 88
|G*|
/sinδ
(kPa
)
Temperature (°C)US 63 PG 58 RTFO Aged Virgin US 63-1-2-PG 58 (35-0) US 63-1-5-PG 58 (35-0)US 63-1-9-PG 58 (35-0) US 63-1-HP8-PG 58 (35-0) US 63-1-HP9- PG 58 (35-0)US 63-1-DP3A- PG 58 (35-0)
Figure A-75. Temperature Sweep Test Results for the RTFO Aged Virgin and E & R Asphalt Binders from US 63-1 Field and Plant Mixes, Constructed in 2016, Containing PG
58-28 Virgin Asphalt Binder and 35% ABR by RAP

165
46
52
58
64
70
76
82H
igh
PG te
mpe
ratu
re (°
C)
Sample code
Field Plant
Figure A-76. High PG Temperature for the E & R Asphalt Binders from US 63-1 Field and
Plant Mixes, Constructed in 2016, Containing PG 58-28 Virgin Asphalt Binder and 35% ABR by RAP

166
REFERENCES (APPENDIX)
ASTM 2172, A. D. (2017). Standard test methv ods for quantitative extraction of asphalt binder from asphalt mixtures.
AASHTO-M-332. (2020). Standard specification for performance-graded asphalt binder using multiple stress creep recovery (MSCR) test.
AASHTO-T-315. (2019). Standard method of test for determining the rheological properties of asphalt binder using a dynamic shear rheometer (DSR).
AASHTO-T324. (2017). Standard method of test for hamburg wheel-track testing of compacted asphalt mixtures.
AASHTO, R. (2008). Reducing samples of asphalt mixtures to testing size.
AASHTO, T. (2014). Standard method of test for estimating damage tolerance of asphalt binders using the linear amplitude sweep.
AbuHassan, Y., Alin, M., Iqbal, T., Nazzal, M., & Abbas, A. R. (2019). Effect of extraction solvents on rheological properties of recovered asphalt binders. Journal of Transportation Engineering, Part B: Pavements, 145(1), 4018064.
Airey, G. D. (1997). Rheological characteristics of polymer modified and aged binder. PhD Dissertation). University of Nottingham, Nottingham.
Alavi, M. Z., Jones, D., He, Y., Chavez, P., & Liang, Y. (2017). Investigation of the Effect of Reclaimed Asphalt Pavement and Reclaimed Asphalt Shingles on the Performance Properties of Asphalt Binders: Phase 1 Laboratory Testing.
Alavi, Z., He, Y., Harvey, J., & Jones, D. W. (2015). Evaluation of the combined effects of reclaimed asphalt pavement (RAP), reclaimed asphalt shingles (RAS), and different virgin binder sources on the performance of blended binders for mixes with higher percentages of RAP and RAS: a research report from t. University of California (System). Pavement Research Center.
Alvergue, A. J. (2014). Laboratory Evaluation of Asphalt Mixtures and Binders with Reclaimed Asphalt Shingle Prepared Using the Wet Process.
Ashish, P. K., Singh, D., & Bohm, S. (2017). Investigation on influence of nanoclay addition on rheological performance of asphalt binder. Road Materials and Pavement Design, 18(5), 1007–1026.
ASTM-D8225. (2019). Standard test method for determination of cracking tolerance index of asphalt mixture using the indirect tensile cracking test. April, 1–6. https://doi.org/10.1520/D8225-19.Copyright
ASTM. (2013). ASTM D7313-13: standard test method for determining fracture energy of asphalt-aggregate mixtures using the disk-shaped compact tension geometry. In ASTM International, April.
ASTM. (2017). ASTM-D5404:Standard practice for recovery of asphalt from solution using the
167
rotary evaporator. ASTM International West Conshohocken, PA.
ASTM, D. (2012). Standard test method for effect of heat and air on a moving film of asphalt (rolling thin-film oven test). American Society for Testing and Materials, West Conshohocken, PA.
Austerman, A. J., Mogawer, W. S., & Stuart, K. D. (2020). Variability of Reclaimed Asphalt Pavement (RAP) Properties within a State and Its Effects on RAP Specifications. Transportation Research Record, 2674(6), 73–84.
Buttlar, W. G., Hill, B. C., Wang, H., & Mogawer, W. (2016). Performance space diagram for the evaluation of high- and low-temperature asphalt mixture performance. Road Materials and Pavement Design, 1–23. https://doi.org/10.1080/14680629.2016.1267446
Buttlar, W. G., Jahangiri, B., Rath, P., Majidifard, H., Urra, L., Meister, J., & Brown, H. (2020). Development of a performance-related asphalt mix design specification for the illinois tollway. Tollway Report.
Buttlar, W. G., Meister, J., Jahangiri, B., Majidifard, H., & Rath, P. (2019). Performance characteristics of modern recycled asphalt mixes in Missouri, including ground tire rubber, recycled roofing shingles, and rejuvenators.
Buttlar, W. G., Rath, P., Majidifard, H., Dave, E. V., & Wang, H. (2019). Relating DC(t) fracture energy to field cracking observations and recommended specification thresholds for performance-engineered mix design. Transportation Research Circular, E-C251(September), 51–69.
Buttlar, W. G., Urra-Contreras, L., Jahangiri, B., Rath, P., & Majidifard, H. (2020). Support for balanced asphalt mixture design specification development in Missouri.
Buttlar, W., Jahangiri, B., Rath, P., Majidifard, H., Urra, L., Meister, J., & Brwon, H. (n.d.). Develoment of a Performance-Related Asphalt Mix Design Specification for the Illinois Tollway. In Illinois State Toll Highway Authority: Chicago, IL, USA.
Collins-Garcia, H., Tia, M., Roque, R., & Choubane, B. (2000). Alternative solvent for reducing health and environmental hazards in extracting asphalt: An evaluation. Transportation Research Record, 1712(1), 79–85.
Copeland, A. (2011). Reclaimed asphalt pavement in asphalt mixtures: State of the practice. United States. Federal Highway Administration. Office of Research ….
Daniel, J. S., Pochily, J. L., & Boisvert, D. M. (2010). Can more reclaimed asphalt pavement be added? Study of extracted binder properties from plant-produced mixtures with up to 25% reclaimed asphalt pavement. Transportation Research Record, 2180(1), 19–29.
Davis, J. (n.d.). Roofing the Road – Using Asphalt Shingles as Binder. Asphalt: The Magazine of the Asphalt Institute. http://asphaltmagazine.com/roofing-the-road-using-asphalt-shingles-as-binder/
Davison, R. R., Bullin, J. A., Estakhri, C. K., Williamson, S. A., Chipps, J. F., Chun, J. S., Juristyarini, P., Leicht, S. E., Wattanachai, P., & Glover, C. J. (2000). A comprehensive laboratory and field study of high-cure crumb-rubber modified asphalt materials. Texas

168
Transportation Institute.
Deef-Allah, E., Abdelrahman, M., Fitch, M., Ragab, M., Bose, M., & He, X. (2019). Balancing the performance and environmental concerns of used motor oil as rejuvenator in asphalt mixes. Recycling, 4(1), 11.
Health, N. I. for O. S. and. (2001). Asphalt Fume Exposures During the Manufacture of Asphalt Roofing Products: Current Practices for Reducing Exposures. US Department of Health and Human Services Cincinnati, Ohio.
Kleinschmidt, L. R., & Snoke, H. R. (1958). Changes in the properties of an asphalt during the blowing operation. Journal of Research of the National Bureau of Standards, 60(3), 169–172.
Larrain, M. M. M. (2015). Analytical modeling of rutting potential of asphalt mixes using hamburg wheel tracking device (master thesis). (Master Thesis).
Li, H., Wu, Y., & Guo, Y. (2014). Validation of reclaimed shingles asphalt binder extraction and recovery methods. In Advanced Characterization of Asphalt and Concrete Materials (pp. 17–23).
Ma, J., Singhvi, P., Ozer, H., Al-Qadi, I. L., & Sharma, B. K. (2020). Brittleness progression for short-and long-term aged asphalt binders with various levels of recycled binders. International Journal of Pavement Engineering, 1–11.
Majidifard, H., Rath, P., Jahangiri, B., & Buttlar, W. G. (2022). Application of balanced mix design strategies to missouri dense-graded asphalt mixtures. Transportation Research Record.
Marasteanu, M. O., Moon, K. H., Teshale, E. Z., Falchetto, A. C., Turos, M., Buttlar, W. G., Dave, E., Paulino, G., Ahmed, S., Leon, S., Braham, A., Behnia, B., Bahia, H., Tabatabaee, H., Velasquez, R., Arshadi, A., Sebastian, P., Mangiafico, S., Williams, C. R., … Kvasnak, A. (2012). Investigation of low temperature cracking in asphalt pavements national pooled fund study–phase II. In Minnesota Department of Transportation (Issue May).
Marasteanu, Mihai O., Zofka, A., Turos, M., Li, X., Velasquez, R., Li, X., Buttlar, W. G., Paulino, G., Braham, A., Dave, E. V., Ojo, J., Bahia, H., Williams, C., Bausano, J., Gallistel, A., & McGraw, J. (2007). Investigation of Low Temperature Cracking in Asphalt Pavements, national Pooled Fund Study 776 (Issue October).
Mehta, Y., Nolan, A., Coffey, S., Dubois, E., Norton, A., Reger, D., Shirodkar, P., Sonpal, K., & Tomlinson, C. (2012). High reclaimed asphalt pavement in hot mix asphalt.
Mikhailenko, P., Ataeian, P., & Baaj, H. (2020). Extraction and recovery of asphalt binder: a literature review. International Journal of Pavement Research and Technology, 13(1), 20–31.
Mullapudi, R. S., Deepika, K. G., & Reddy, K. S. (2019). Relationship between chemistry and mechanical properties of RAP binder blends. Journal of Materials in Civil Engineering, 31(7), 4019124.
Nazzal, M. D., Iqbal, M. T., Kim, S. S., Abbas, A. R., Akentuna, M., & Quasem, T. (2016).

169
Evaluation of the long-term performance and life cycle costs of GTR asphalt pavements. Construction and Building Materials, 114, 261–268. https://doi.org/10.1016/j.conbuildmat.2016.02.096
Newcomb, D. E., Epps, J. A., & Zhou, F. (2016). Use of RAP & RAS in High Binder Replacement Asphalt Mixtures: A Synthesis. National Asphalt Pavement Association, Special Report, 213.
Nösler, I., Tanghe, T., & Soenen, H. (2008). Evaluation of binder recovery methods and the influence on the propertiesof polymer modified bitumen. PROCEEDINGS OF THE 4TH EURASPHALT AND EUROBITUME CONGRESS HELD MAY 2008, COPENHAGEN, DENMARK.
Piérard, N., Vansteenkiste, S., & Vanelstraete, A. (2010). Effect of Extraction and Recovery Procedure on the Determination of PmB Content and on the Properties of the Recovered Binder. Road Materials and Pavement Design, 11(sup1), 251–279.
Poulikakos, L. D., Hofko, B., Falchetto, A. C., Porot, L., Ferrotti, G., & Grenfell, J. (2019). Recommendations of RILEM TC 252-CMB: relationship between laboratory short-term aging and performance of asphalt binder. Materials and Structures, 52(4), 1–6.
Rodezno, C., & Grant, J. (2018). Asphalt Binder Extraction Protocol for Determining Amount & PG Characteristics of Binders Recovered from Asphalt Mixtures. Wisconsin. Dept. of Transportation.
Rubino, B. A. M. (2010). An investigative look at the effects of post consumer recycled asphalt shingles on soils and flexible pavements. Iowa State University.
Sadek, H., Rahaman, M. Z., Lemke, Z., Bahia, H. U., Reichelt, S., & Swiertz, D. (2020). Performance Comparison of Laboratory-Produced Short-Term Aged Mixtures with Plant-Produced Mixtures. Journal of Materials in Civil Engineering, 32(1), 4019313.
Salari, S. (2012). Effects of recycled asphalt shingle on the rheological and molecular composition properties of asphalt cement.
Sirin, O., & Tia, M. (2003). Investigation of problems in binder extraction from conventional and rubber modified asphalt mixtures. Sixth International RILEM Symposium on Performance Testing and Evaluation of Bituminous Materials, 212–219.
Stroup-Gardiner, M., & Nelson, J. W. (2000). Use of normal propyl bromide solvents for extraction and recovery of asphalt cements. National Center for Asphalt Technologies, Report# NCAT, 6, 2000.
West, R. C., Tran, N. H., Kvasnak, A., Powell, B., & Turner, P. (2009). Construction and Field Performance of Hot Mix asphalt with Moderate and High RAP Contents. Bearing Capacity of Roads, Railways and Airfields. 8th International Conference (BCR2A’09) University of Illinois, Urbana-Champaign.
West, R. C., & Willis, J. R. (2014). Case studies on successful utilization of reclaimed asphalt pavement and recycled asphalt shingles in asphalt pavements.
Willis, J. R., & Turner, P. (2016). Characterization of asphalt binder extracted from reclaimed
170
asphalt shingles. National Center for Asphalt Technology (NCAT) Rep., Auburn, AL.
Zhou, F. (2018). IDEAL Cracking Test for QC / QA and Associated Criteria.
Zhou, F., Button, J. W., & Epps, J. A. (2012). Best practice for using RAS in HMA. Texas Transportation Institute.
Zhou, F., Li, H., Hu, S., Button, J. W., & Epps, J. A. (2012). Characterization and best use of recycled asphalt shingles in hot-mix asphalt. Texas. Dept. of Transportation. Research and Technology Implementation Office.
Zhou, F., Li, H., Lee, R., Scullion, T., & Claros, G. (2013). Recycled asphalt shingle binder characterization and blending with virgin binders. Transportation Research Record, 2370(1), 33–43.