Undernutrition among under-five tribal children of Joda...
56
Undernutrition among under-five tribal children of Joda block, Keonjhar district, Orissa, India, 2008 LIBRARY By De basis Jethy (MAE - FETP Scholar 2007-2008) National Institute of Epidemiology {Indian Council of MediCal Research) Tamil Nadu Housing Board, Ayapakkam, Chennai, 600 077, India January 2009 1
-
Upload
hoangkhanh -
Category
Documents
-
view
226 -
download
2
Transcript of Undernutrition among under-five tribal children of Joda...

Undernutrition among under-five tribal children of Joda
block, Keonjhar district,
Orissa, India, 2008
LIBRARY
By
De basis Jethy
(MAE - FETP Scholar 2007-2008)
National Institute of Epidemiology
{Indian Council of MediCal Research)
Tamil Nadu Housing Board, Ayapakkam, Chennai, 600 077, India
January 2009
1

Undernutrition among under-five tribal children of Joda
block, Keonjhar district,
Orissa, India, 2008
by
Debasis Jethy
(MAE - FETP Scholar 2007-2008)
Dissertation project submitted in partial fulfillment of the requirements for the degree of Master of
Applied Epidemiology (M.A.E) of
Sree Chitra Tirunallnstitute for Medical Sciences and Technology,
Thiruvananthapuram, Kerala -695 011.
This work has been done as part of the two years Field Epidemiology
Training Programme (FETP) conducted at
National Institute of Epidemiology,
(Indian Council of Medical Research),
Tamil Nadu Housing Board, Ayapakkam,
Chennai, 600 077, India
January 2009
2
CERTIFICATION
This is to certify that this dissertation entitled "Undernutrition among under-
five tribal children of Joda block, Keonjhar district, Orissa, India, 2008"
submitted by Dr. De basis Jethy in partial fulfillment of the requirements for the
degree of Master of Applied Epidemiology is the original work done by him.
Date:
£§Director,
' National Institute of Epidemiology,
(ICMR), Chennai
3

ACKNOWLEDGEMENT
Several dignitaries and institutions have extended their valuable time, advice and assistance to me
during the preparation of this dissertation. I would like to extend my sincere thanks to all who
helped me in the completion of dissertation work.
Dr. Kumaraswami, officer in charge, National Institute of Epidemiology (NIE), Chennai for his
valuable guidance amidst his busy schedule.
Dr. M.D. Gupte, Ex Director, NIE, Chennai for providing an opportunity to undergo this course and
for guidance, support and facilities for my works.
Dr. Manoj V. Murhekar, Deputy Director, NIE, course co-coordinator (MAE - FETP) guided me and
took care of me all the time.
Dr Yvan F. Hutin, Resident Advisor WHO to NIE, Chennai, who informed me join this course and for
his valuable guidance, comments, suggestions and advice.
-Dr. P. Manickam, Scientist B, NIE, Chennai and my mentor for constant guidance at all level for the
completion of my dissertation.
Dr B. N. Murty, Dr.R.Ramakrishnan, Dr.Vidya Ramachandran, Dr Prabhdeep Kaur, Dr. ~under
Murthy, Dr.Jabbar, Dr.Josheph, Dr Vasna Joshua and several scientists and staff of NIE, Chennai for·
their help in my work.
Mr. Satish, Librarian and Mrs. Uma Manoharan, secretary to FETP facilitated my work.
I am very grateful to all dignitaries of my Orissa state and Cuttack district for their support in my
study. I earnestly thank all of them.
4

The Government of Orissa for allowing me to pursue this course and also to conduct the study in
Cuttack district.
Dr Bikash Pattnaik, Dr M. M. Pradhan, Dr A. Das, Dr K. K. Das, Dr M. Panda, MAE - FETP graduates
of Orissa for their support and advice.
All my field staffs, who worked with me during the data collection in difficult terrain and outreached
areas of Joda block.
My mother Sacha Ia Jethy, father Krushna Chandra Jethy and all the family
members for bearing with me in this endeavor of hard work.
Last but not the least all the respondents who very graciously spared me their valuable time and
information in addition to extending their cooperation, which rendered the entire research,
endeavor a very novel experience.
Dr. Debasis Jethy
5

TABLE OF CONTENTS
SECTtON: I DISSERTATION .....•......•....•....••..••.•...........•...•......•..•••.••••...........••••••...••...•.......•....•...•....•............•..••.. 7
Abstract .••........................•..................................•.........................•..•..•.................................•......................................• 8
Introduction ...................••.....•.........•..........•..............................•...............••....•••...•.....•.....••••...••...••..•......•.........•••..••••. 9
Methods ...........•..........•.....••...•••........•...............•...•........•..•.......•...............•.....••....•...•.............••......•.•........•.....•...•.••.• 11
Results .•......•.....•...........•.....•..........•................•.......•.....••...••..........•.....•••....••.•.............•...........••.....•.....•.....•••...•.....•... 15
Discussion .....................................•.....•.•....•.•...••...•.......•...............•..•.....•......................•...•.......•• ~ .......•.••......•....••....... 19
References ...............................•...•.......•.....••....••.....•........................................................•.....................•..•..•.•........... 22
Tables and Figures ....... , .............................................................................................................................................. 24
Annexures ....................................................................................................................................................... 30
ANNEXURE$ 1-5: Additional tables .............................................................................................................................. 31
Annexure: 6 Data collection instrument. ..••......................••.............•..••....•.....••...........•....•..................•...........•......•.•... 37
Annexure: 7 Consent form ................................................................•.......................•.........................•........................ 43
Annexure 8: certificate of consent •.•................•.........•........................•..............................•...•.......•...........••......•...•...•• 44
SECTION: II UTERATURE REVIEW ············································································•·········································· 45
6

SECTION: I DISSERTATION
7

Undernutrition among under-five tribal children of Joda block, Keonjhar district,
Orissa, India, 2008
Abstract
Background: We conducted a survey to estimate prevalence of under-nutrition and its risk factors in
pre-school children in a tribal area of Kendujhar district, Orissa.
Methods: We used cluster sampling to select households. We collected data on the demographic
and socio-economic environment of the child, health history, maternal and child anthropometry and
child feeding practices. We classified children with under-nutrition as underweight, stunting and
wasting according to weight-for-age, height-for-age and weight-for-height Z-score below -2
standard deviation (SO) using the CDC 2000 reference data. Severe under-nutrition was considered
for those with Z-score below -3 SD. We calculated prevalence estimates and 95% confidence
intervals (CI) of under-nutrition. We calculated adjusted Odds Ratios (AOR) and 95% Cl in the
multivariate analysis for factors associated with under-nourished children.
Results: Of the 600 children surveyed, the prevalence of stunting, underweight and wasting was 71%
(95% Cl: 66%-75%), 68% (95% Cl: 63%-72%) and 40% (95% Cl: 35%-45%), respectively. Ofthese, 46%,
41% and 21% children had severe stunting, underweight and wasting. Factors significantly related to
under-nutrition were: inaccessible location of house (AOR:3.0; 95% Cl:l.S-5.8 for wasting), mother
working in mines (AOR:2.9; 95% Cl:1.3-6.1 for underweight; AOR:2.1; 95% Cl:1.3-3.4 for wasting),
higher birth order >3rd (AOR:2.5; 95% Cl:1.4-4.5 for stunting, AOR:4.9; 95% Cl:2.0-8.3 for
underweight) and exclusively breastfed for more than six months (AOR:1.7; 95%CI:l.0-2.6 for
stunting; AOR:3.5; 95%CI:1. 7-6.9 for wasting).
Conclusions: The nutritional status of the tribal children was unsatisfactory. The identified risk
factors co,nfirm the influence of socio-economic conditions and child feeding practices on the
nutritional status of children. We recommend an integrated approach to improve the nutritional
status of children in this. tribal area.
8

0
Undernutrition among under-five tribal children of Joda block, Keonjhar district,
Orissa, India, 2008
Introduction
Under-five children also referred to as 'preschool children' constitute the most nutritionally
vulnerable segment of the population and their nutritional status is considered to be a
sensitive indicator of community health and nutrition1• Even moderately undernourished
children have 4 to 5 folds higher risk of mortalitl. The survivors of undernutrition have its
pervasive effects that include acute morbidity as well as long-term impairment of cognitive &
social development, physical work capacity, productivity, and economic growth.
Globally undernutrition is responsible for 54% of 10.8 million under five deaths annually.
Out of the world's 182 million stunted under five children in developing countries, 128
million (70%) live in Asia4• In south East Asia (2005), 42% of under-five are stunted and
33% are underweight for age5•
Reducing hunger and undernutrition is the key area of United Nation's Millennium
Development Goals. One of the targets is to reduce by half (1) the prevalence of underweight
children under-five years of age and (2) the proportion of population below minimum level of
dietary energy consumption13•
In India, prevalence of undernourished children less than 5 years is 46% in India6• About 60
million children are underweight in India. Of the overall undernutrition in India, 80% is
contributed by Orissa. It accounts for nearly 20% of undernutrition deaths of the countrl,
and has India's highest infant mortality rate at 69 per 1,000 live births in rural areas.3 Rural . .
9

Orissa comprises predominantly of tribal people (64%) belonging to different tribes.
National level surveys indicate that proportion underweight children in Orissa declined from
50% in 1998to41% in2005.6
Interventions for combating undernutrition include, Supplementation of nutritious food and
other activities by Integrated Child Development Services (ICDS) programme, Vitamin A
prophylaxis, "Panchavyadhi chikitsa" to fight against infectious diseases, Iron and folic acid
supplementation for pregnant women. However, undernutrition. still remains a significant
problem among tribal children due to. a variety of factors including insufficient food intake,
frequent infections, lack of access to health services, illiteracy, unhygienic personal habits
and adverse cultural practices. In fact, the health indices of the tribal population indicate that
over 55% children are underweight and under-five mortality rate is 127 per 1000 live births8•
The 'Joda' is a hilly tribal block ofKendujhar district, Orissa. Its rural population comprises
of more than 64% tribal people. People mostly work as mines labourer for their livelihood
and as such agricultural activities are scarce leading to low amount of locally available food.
People eat rice with salts and occasionally potato. Protein intake is very low. During a
measles outbreak investigated in Joda block, Kendujhar, Orissa, 2007, of the 34 under five
children tpere were 29 cases (attackrate: 85%) and 9 deaths (case fatality: 31%). The case
fatality was two times higher among undernourished. This prompted us to conduct full-scale
study on under-nutrition problem in this ar~a ·with the .objectives to (1) est4nate the
prevalence of undernutrition among under five tribal children (2) Propose recommendations '
to improve their nutritional status. As a secondary objective we wanted to identify the factors
associated with under nutrition in this population.
10

Methods
Study population
Our study population was tribal children of Joda block, Keonjhar, Orissa who had completed
60 months of age by June 2008. We included only the permanent and tribal residents. We
excluded floating population and also children born to mother who did not stay in the area
during the pregnancy period.
Study design
We conducted community based, cross-sectional study.
Sample size
At 95 per cent confidence interval with 5 per cent precision and estimated proportion of 50%
of undernutrition, the estimated sample was 480. However, considering anticipated non
response of 25% we proposed to include 600 children (i.e. 15 children from each of 40
clusters).
Sampling procedure
We chose cluster sampling with probability proportional to size. For this, we selected villages
covered by a single anganwadi centre as a cluster. We selected the first house in a randomly
selected direction every next nearest house till we assessed 15 under-five children.
Data collection
The primary investigator and four teams collected the information. Each team consisted of
two field investigators, one female and a male health worker in each team. We also had two
supervisors, one supervisor to supervise two teams. We used a structured questionnaire
11

(Annexure-2) and collected data on the demographic and socio-economic environment of the
child, health history, maternal and child anthropometry and child feeding practices.
The anthropometric measurements included measuring of height, weight for both mothers
and children, mid-arm circumference for children. We used an observational-check list to
collect data on environmental factors at the household level.
Operational definitions
Under-five: Children who have not completed 60 months of age
Under-nutrition: it is defined according to WHO guidelines5 as z-score below -2 standard
deviation (SD) from the median.
Moderate under-nutrition: it is defined according to WHO guidelines5 as z-score between -
2 to -3 SD from the median.
Severe under-nutrition: it is defined according to WHO guidelines5 as z-score below -3
standard deviation (SD) from the median.
Stunting is defined as children whose height-for-age Z-score is< -2 SD from the median of
the reference population.
Wasting is defined as children whose weight-for-height Z-score is < -2 SD from the median
of the reference population.
Underweight is defined as children whose weight-for-age Z-score is < -2 SD from the
median of the reference population.
Chronic and acute undernutrition: While stunting and wasting reflect chronic and acute
undernutrition respectively, underweight is a composite of the two.
12

Body mass index (BMI) is calculated by dividing body weight by height squared (kg/m2)
Wasting or stunting is considered severe or moderate ifthe Z-score for weight-for-height or
height-for-age is greater than -3 or between -2 & -3, respectively.
Below Poverty Line: Households having monthly income less than 1500 rupees.
Safe drinking water: according to WHO it includes household connection; public standpipe;
borehole; protected dug well; protected spring etc14• In the rural area of Joda, tube well is the
only source of water. Other sources such as kacha well, river, supply water are not safe.
Data analysis
We estimated the prevalence of under-nutrition using different indices and their 95%
confidence intervals. The indices were weight for age, height for age and weight for height
using WHO classification system. We classified children with more than two SD below the
reference median on any of the indices as undernourished and those with more than three SD
below the reference median as severely undernourished. We estimated prevalence odds ratio
(POR) and 95% confidence intervals (95% CI) for the various factors in the univariate
analysis. We conducted dose response analysis. We did stratified analysis to examine
confounders and effect modifiers .. We included all the significant factors in a logistic
regression model to estimate adjusted odds ratios (AOR) and 95% CI for the risk factors. We
calculated population attributable fraction for each factor found statistically significant in
logistic regression model.
Quality assurance
We submitted our research protocol for peer-review. We translated the instrument to the local
language and back-translated to minimize discrepancy in the questionnaire. We conducted
pilot test of the Oriya questionnaire in the nearby village and modified it as per the local
13
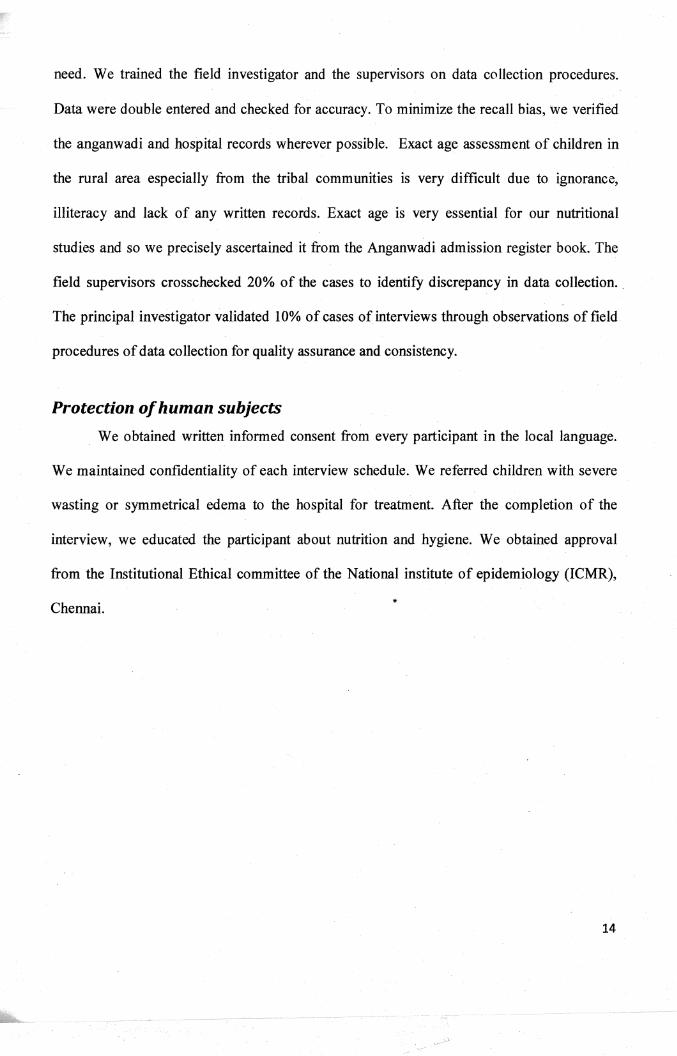
need. We trained the field investigator and the supervisors on data collection procedures.
Data were double entered and checked for accuracy. To minimize the recall bias, we verified
the anganwadi and hospital records wherever possible. Exact age assessment of children in
the rural area especially from the tribal communities is very difficult due to ignorance,
illiteracy and lack of any written records. Exact age is very essential for our nutritional
studies and so we precisely ascertained it from the Anganwadi admission register book. The
field supervisors crosschecked 20% of the cases to identify discrepancy in data collection ..
The principal investigator validated 10% of cases of interviews through observations of field
procedures of data collection for quality assurance and consistency.
Protection of human subjects
We obtained written informed consent from every participant in the local language.
We maintained confidentiality of each interview schedule. We referred children with severe
wasting or symmetrical edema to the hospital for treatment. After the completion of the
interview, we educated the participant about nutrition and hygiene. We obtained approval
from the Institutional Ethical committee of the National institute of epidemiology (ICMR),
Chennai.
14

Results
Characteristics of study population:
The study population included predominantly three different tribes namely 'munda' (n = 600,
56%), bhuyan (27%) and santal (13%) (Tablel). Of the 600 children, 41% lived in hilly
terrains of which 21% were difficult to access areas. Majority of the population was below
the poverty line (86%). The literacy level of the mothers was lower than the fathers (20% vs.
39%). One-third of the mothers worked as mines laborers. More than 60% of the children
were exclusively breastfed for 4 - 6 months. Exclusive breastfeeding was prolonged i.e.
beyond 6 months in case of 38% children. Six children had inadequate or no breast feeding
due to lactation failure or death of the mother. In our study about 75% of children avail
anganwadi service. Only one third (33%) have access to tube-well water supply.
Prevalence of undernutrition:
Of the 600 children, 427 had stunting (71%, 95% CI: 66%-75%), 406 were underweight
(68%, 95% CI: 63%-72%) and 239 had wasting (40%, 95% CI: 35%-45%). Further, 46%
(n=275), 41% (n=244) and 21% (n=124) children had severe stunting, underweight and
wasting respectively (Table 2). Prevalence of undernutrition was more in male children.
Factors associated with undernutrition:
We present the results of the univariate and multivariate analysis for factors associated with
under-nutrition by group them according to factors pertaining to child, parental and
environmental and socioeconomic characteristics.
Univariate analysis:
15

Child characteristics
We identified higher birth order, improper weaning practices (reflected by prolonged
exclusive breast feeding), and frequent diarrheal episodes were associated with undernutrition
(table 3, 4, 5). The birth order of the children in our sample ranges from l to 10. As evident
from a dose response analysis the risk of undernutrition (e.g. stunting) increases with birth
order Ci for linear trend =10.7, p=O.OOl) and prolonged exclusive breast-feeding (X2 for
linear trend =15.7, p=0.00007). On stratified analysis, we identified improper weaning,
maternal factors like low BMI during pregnancy and education as effect modifiers of birth
order in stunted children. Occupation (as mines worker) and education of the mother were
effect modifiers for improper weaning of the child leading to underweight; crude POR = 1.7,
stratified POR = 1.6, 2.6 & 1.5, 2.2 respectively (annexure 3).
The infants (children in the first year of life) have a lower prevalence of
underweight, stunting, wasting as compared to children 2-5 years of age. Subgroup analysis
by age reveals that socioeconomic status was most significant for acute malnutrition during
the 2nd year of life. Initiation of breast feeding was within 1 to 6 hours after birth. All except
five children were not breastfed and out of them three due to primary lactational failure and
two due to death of the mother. Of the 59 children ::::; 6 months, 24 (29%) had their mother
working in mines as laborers.
Maternal characteristics:
The maternal factors statistically significant for undernutrition were mother working in mines
, mother's BMI during pregnancy less than 18.5 kg/m2 and illiteracy. We observed dose
response relationship between mother's educational status and prevalence of stunting ci for
linear trend = 17.1, p=0.00003 ). We stratified the association between mother illiteracy and
16

underweight by father's educational status. We identified that father's educational status was
an effect modifier (crude POR = 1.9, Father illiterate POR = 1, and literate father POR = 2.3).
However, the role of father's occupation and literacy per se in undernutrition is insignificant.
Environmental characteristics:
Location in hilly, difficult to access area and unsafe water were associated with
undernutrition. Stratified analysis showed that with hilly area as an exposure factor for
stunting the unsafe water is effect modifier; crude POR = 1.5, stratified POR = 1.5, 4.8
(annexure 2). Likewise; for unsafe drinking water as an exposure variable for underweight
children mother's illiteracy is an effect modifier; crude POR = 1.5, stratified POR = 1.3, 2.4
(annexure 3). We have higher birth order ofthe child, illiteracy ofthe mother etc. are effect
modifiers for inaccessibility leading-to wasting; crude POR = 2.3, stratified POR = 4.6, 1.7 &
2.2, 0.9 respectively (annexure 4).
Socioeconomic characteristics:
We found monthly income of the family less than Rs. 1500 per month is associated with all
three measures of undernutrition. On stratified analysis of soc~oeconomic condition as
exposure of stunted children we found birth order and improper weaning as effect modifiers
and BMI of the mother during pregnancy as confounder.
Multivariate analysis
In the multivariate analysis the following factors were associated with stunting: Child's birth
order > 3, Child exclusively breast fed for> 6 months, Mother illiterate, Mother mines
worker, Underweight mother during pregnancy, Difficult accessibility of the house,
Inaccessible residence and monthly income <Rs. 1500
17

For underweight following factors were significantly associated in the multivariate analysis:
Child's birth order > 3, child exclusively breast fed for > 6 months, underweight mother
during pregnancy
In the multivariate analysis the factors associated with wasting were child exclusively breast
fed for > 6 months, mother illiterate, underweight mother during pregnancy, difficult
accessibility of the house and monthly income <Rs. 1500.
18

Discussion
In a tribal population of Orissa we identified that substantial proportion ofunder-five children
were malnourished. The prevalence was higher among male children. We identified both
biological and socio-economic factors to be associated with under-nutrition. The results
provide information for the health services to plan interventions for addressing under
nutrition among tribal children in Kendujhar district of Orissa.
The prevalence of under-nutrition among tribal under-five children in our study area was
higher than the Orissa state level estimates. Further, the categories of under-nutrition in
terms of stunting, underweight, and wasting were also higher than the State average. So, we
have failed by a substantial margin to address this key area of Millennium Development Goal
i.e. hunger and undernutrition especially in tribal communities. In tribal populations, poverty,
illiteracy, mountainous and inaccessible terrain form the social, economic and ecologic
situations leading to food insecurity and undernutrition. The prevalence of all three indices of
undernutrition increases after the 1st year of life. This is consistent with similar findings in
earlier studies conducted in North-Eastern Province of Sri Lanka where underweight reaches
a peak in the age groups 12-35 months, and then tapers of2• This increase may at least partly
be attributable to improper weaning practices. In our study, higher birth order was associated
with under-nutrition. Earlier study in children under five years of age in Nghean, Vietnam
also shows higher number of children in a family to be an adverse factor for malnutritionu.
Exclusive breast feeding for 4- 6 months is beneficial but when prolonged i.e. beyond six
months implies delayed weaning with supplementary foods and our study reveals it to be a
significant factor associated with undernutrition. A similar study on preschool tribal children
19

in Madhya Pradesh concludes that prolonged breast feeding has adverse impact on nutritional
status of the child10• Association of acute undernutrition with frequent diarrheal episodes is
consistent with the fact that the former predisposes to infection and vice versa in a vicious
cycle. Lack of significant association between undernutrition and anganwadi attendance is in
contrast to data from national surveys, where prevalence of under-nutrition was inversely
related to attendance at anganwadi centers. This is despite reported coverage of more than
70% under ICDS. Either in our study the data are having interviewer's bias, or the effects of
interventions are small.
In our study maternal factors seem to have more impact on chronic health status of the child
as evident from its greater significance in height for age analyses. The mothers working as
mines laborer are perhaps not able to take proper care of the child leading to
undernourishment. Nutritional status of the mother as evident from the low body mass index
(< 18.5) during pregnancy had adverse effect on child's growth also. Mothers' education
especially when it is at or above high school standard plays an important role in nutrition.
In difficult to access areas people live in isolation with little access to information, health and
other facilities leading to undernutrition. Unsafe drinking water contributes thereto being a
vehicle of water-borne diseases. Infections predispose to undernutrition and vice-versa in a
vicious cycle.
Our study has few limitations. During the data collection procedure, there was possibility of
recall bias and interviewer bias. We gave sufficient time to the participants to prevent recall
bias. We also verified the record available at the. sub..,center and Anganwadi center to reduce
recall bias. To minimize the interviewer bias, we did not involve the health workers of the
same area in the investigation team. We could not account for size at birth as in most cases
anganwadi registers did not record it and institutional deliveries were negligible. However_
20
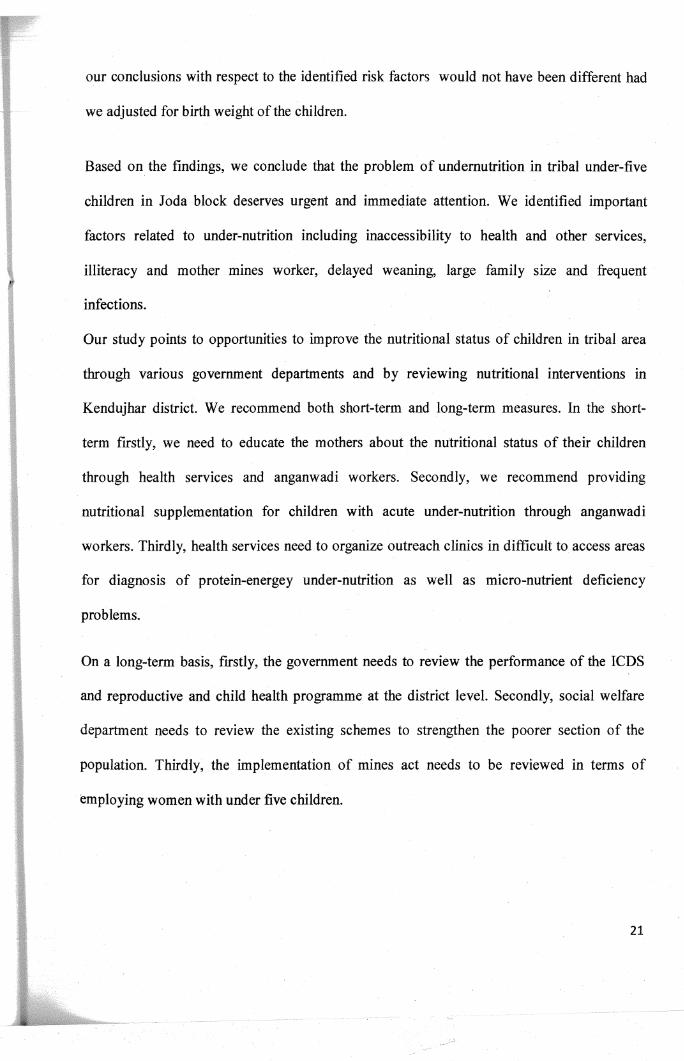
our conclusions with respect to the identified risk factors would not have been different had
we adjusted for birth weight of the children.
Based on the findings, we conclude that the problem of undernutrition in tribal under-five
children in Joda block deserves urgent and immediate attention. We identified important
factors related to under-nutrition including inaccessibility to health and other services,
illiteracy and mother mines worker, delayed weaning, large family size and frequent
infections.
Our study points to opportunities to improve the nutritional status of children in tribal area
through various government departments and by reviewing nutritional interventions in
Kendujhar district. We recommend both short-term and long-term measures. In the short
term firstly, we need to educate the mothers about the nutritional status of their children
through health services and anganwadi workers. Secondly, we recommend providing
nutritional supplementation for children with acute under-nutrition through anganwadi
workers. Thirdly, health services need to organize outreach clinics in difficult to access areas
for diagnosis of protein-energey under-nutrition as well as micro-nutrient deficiency
problems.
On a long-term basis, firstly, the government needs to review the performance of the ICDS
and reproductive and child health programme at the district level. Secondly, social welfare
department needs to review the existing schemes to strengthen the poorer section of the
population. Thirdly, the implementation of mines act needs to be reviewed in terms of
employing women with under five children.
21

References
1) 9th Five Year Plan (Vol-2). Agriculture, Irrigation, Food Security and Nutrition. Available
at http:/ /planningcommission.nic.in/plans/planrel/fiveyr/9th/vol2/v2c4-3 -2.htm Accessed on
20.8.2008
2) Nelson's pediatrics; 171h Edition, page 170 to 171
3) World Health Organization. Severe acute Mal nutrition. Available at
www. who.int/nutrition/topics/undernutrition/en/index.html Accessed on 14.4.08.
4) Bulletin of World health organization. The International Journal ofPublic Health; Volume
87, Number 2, February 2009,81-160. Available at www.who.int/bulletin accessed on
15.2.2009
5) Global database on child growth and undernutrition, Geneva. World Health Organization,
2007. Available at http://www.who.int/nutgrowthdb/database/en
6) National Family Health Survey-III Accessed on 14.6.08
7) Hidden Hunger and Silent Deaths in Orissa, India (page 22) Focus 03/2008.
8) Orissa Vision 2010: A Health Strategy- Orissa State Integrated Health Policy, Strategies
. and Action Points. Health and Family Welfare Department, Govt. of Orissa, 2003.
9) World Health Organization Expert Committee: Physical status: the use and interpretation
of anthropometry. WHO Technical Report Series, 854. Geneva: World Health Organization,
1995.
1 0) Rao VG, Yadav Rajeev, Dolla CK, Kumar Surendra, Bhondeley MK & Ukey Mahendra.
Undernutrition & childhood morbidities among tribal preschool children; Indian J Med Res
122, July 2005, pp 43-47; RMRCfor Tribals (JCMR), Jabalpur, India. Available at
http://icmr.nic.in/ijmr/2005/july/0704.pdf Accessed on 12.10.2008
22

11) Nguyen Ngoc Hien, Sin Kam Department of Preventive Medicine, School of Medicine,
Kyungpook National University, Daegu, Korea Nutritional Status and the Characteristics
Related to Malnutrition in Children Under Five Years of Age in Nghean, Vietnam. Available
at
http://synapse.koreamed.org/search.php?where=aview&id=6658&code=0056JPMPH&vmod
e=AFTR Accessed on 17.10.2008
12) World Bank. DHS 2000. Available at
http ://siteresources. worldbank.org/INTSRILANKA/Resources/MDG-Ch3 .pdf
13) World Health Organization (WHO). Health and the Millennium Development Goals.
Geneva; WHO, 2005
14) WHO. Health through safe drinking water and basic sanitation. Water sanitation and
health. Available at http://www.who.int/water sanitation healthlmdgllen/index.html
23

Tables and Figures
Table 1: Socio-demographic characteristics of under five tribal children (n=600), Joda block, Kendujhar, Orissa, India, 2008
Characteristics # % Monthly income < Rs. 1500 518 86
0-1 170 28 >1-2 170 28
Age of the child (in years) >2-3 118 20 >3 -4 84 14 >4-5 58 10
<20 44 years 7
Age of the mother (in years) 20 to 34 426 71 ~ 35 86 14
8+ 40 7
Mother's educational status (number of years studied) 6-7 24 4 I- 5 52 9
0 479 80 Mines worker 172 29
Occupation of mother Other 424 71 8+ 100 17
Father's education status (number of years studied) 6-7 76 13 1-5 56 9
0 368 61 Mines worker 463 77
Occupation of father Other 136 23 .
Munda 335 56 Bhuyan 164 27
Tribe Santal 75 13 Others 26 4
24

\
Table 2: Prevalence of different categories of under-nutrition among tribal children by gender, Jotla block, Kendujhar, Orissa, India
2008
· ~ ~ ThW \ Characteristics Z score and m~~sure of (n - 307) (n = 293) (n = 600) [ (Anthropometry) undernutrition # (o/o) # (%) # (o/o) I
< -3 SD (severe stunting) 161 52.4 114 38.9 Height for age <-2 to -3SD (moderate stunting) 67 21.8 85 29.0
~ -2 SD 79 25.7 94 32.1 < -3 SD (severe underweight) 118 38.4 126 43.0
Weight for age <-2 to -3SD (moderate underweight) 96 31.3 66 22.5 ~ -2 SD 93 30.3 101 34.5
,- < -3 SD (severe wasting) 61 19.9 63 ----2f.5-- \Weight for height <-2 to -3SD (moderate wasting) 62 20.0 54 18.4 I ~ -2 SD 184 60.1 176 60.1
275 152 173 244 162 194 124 115 360
45.8 25.3 28.8 40.7 27.0 32.3 20.7 19.2 60.1
25

Table 3: Prevalence of stunting according to selected characteristics, among tribal under-five children of Joda block, Kendujhar, Orissa, India, 2008
Child
Frequency of exposure Among stunted Among not stunted
# % # %
Prevalence odds ratio
95% confidence interval
Female gender 199 67.9 94 32.1 0.7 0.5 - 1.0 Birth order> 3rd 117 83.6 23 16.4 2.4 1.5 - 4.0 Birth interval< 24 months 205 74.3 71 25.7 1.2 0.7- 1.9 Exclusively breast fed for> 6 months 1 146 78.5 40 21.5 1.9 1.2 - 2.9
characteristics Breast fed for 24 months 244 71.6 97 28.4 0.6 0.2- 1.3 >one diarrheal episode in last 3 months 150 67.9 71 32.1 0.7 0.5-1.1 >one URTI episode in last 3 months 222 71.8 87 28.2 1.0 0.7- 1.5 Child not attendinganganwadi centre 111 73.5 40 26.5 1.1 0.7- 1,(7 Underweight mother during pregnancy2 166 76.5 51 23.5 1.7 Ll.-lk5 Mother mines worker 134 77.9 38 22.1 1.6 1.0- <;4
h t . t' Mother illiterate 335 74.1 124 25.9 1.9 1.2- jii9 c arac ens 1cs . · Father ~~nes worker 335 72.4 128 27.6 1.2 0.8~ t~9
Parental
Fathenlhterate 270 73.4 98 26.6 1.3 0.~--; (:8
E . t 1 Unsafe drinking water 300 74.9 104 25.7 1.5 1.0-.=-.~.2 nvironmen a R 'd . h'll 188 75 8 60 -·- 2 h t . t. es1 ence m 1 s . 24.2 1.4 1.0 -, .1
c arac ens 1cs . . Inaccesstblerestdence 135 82.8 28 17.2 2.3 1.5-3.7
Economic status
Monthly income <Rs. 1500 382 73·7 136 26·9 2.3 1.4 _ ~.7
1 Reference group: exclusively breastfed for 5-6 months 2 BMI < 18.5 kg/m2
26

\ J
Table 4: Prevalence of undenveight according to selected characteristics, among tribal under-five children of Joda block, Kendujhar, Orissa, India, 2008
Female gender Birth order> 3rd Birth interval< 24 months
Child Exclusively breast fed for> 6 months3
characteristics Breast fed (total) for 24 months > one diarrheal episode in last 3 months >one URTI episode in last 3 months Child not attending anganwadi centre Underweight mother during pregnancy4
Parental Mother mines worker
characteristics Mother illiterate Father mines worker Father illiterate
Environmental Unsafe drinking water
characteristics Residence in hills Inaccessible residence
Economic status Monthly income <Rs. 1500
3 Reference group: exclusively breastfed for 5-6 months 4 BMI < 18.5 kg/m2
'
Freguenc~ of ex12osure Among underweight Among not
underweight # % #
192 65.5 101 111 19.3 29 202 73.2 74 144 77.4 42 246 72.1 95 160 72.4 61 211 68.3 98 104 68.9 47 154 71 63 133 77.3 39 339 70.8 140 313 67.6 150 263 71.5 105 285 70.5 119 182 73.4 66 129 79.1 34 367 70.8 151
95% Prevalence confidence odds ratio interval
% 34.5 0.8 0. 5-1.1 20.7 2.1 1.3-3.3 26.8 1.4 0.9 - 2.2 22.6 1.7 1.1 -2.6 27.9 1.6 0.8- 3.1 27.6 1.4 1.0-2.0 31.7 1.0 0.7-1.5 31.1 1.0 0.7-1.6
29 1.3 0.9-1.9 22.7 1.9 1.2-2.9 29.2 1.9 1.2-2.9 32.4 0.9 0.6-1.4 28.5 1.5 1.1-2.2 29.5 1.4 1.0-2.1 26.6 1.5 1.1-2.2 20;9 2.1 1.4-3.3 29.2 2.6 1.6-4.3
27

Table 5: Prevalence of wasting according to selected characteristics, among tribal under-five children of Joda block, Kendujhar, Orissa, India, 2008
Female gender Birth order> 3rd Birth interval < 24 months
Child characteristics Exclusively breast fed for> 6 months5
Breast fed for 24 months > one diarrheal episode in last 3 months >one URTI episode in last 3 months Child not attending anganwadi centre Underweight mother during pregnancl Mother mines worker
Parental characteristics Mother illiterate Father mines worker Father illiterate Unsafe drinking water
Environmental characteristics Residence in hills Inaccessible residence
Economic status Monthly income <Rs. 1500
5 Reference group: exclusively breastfed for 5-6 months 6 BMI < 18.5 kg/m2
Freguency of ex_Qosure Among Among not wasted wasted
# % # % 117 39.9 176 60.1 60 42.9 80 57.1
107 38.8 169 61.2 89 47.8 97 52.2
136 39.9 205 60.1 109 49.3 112 50.7 135 43.7 174 56.3 67 44.4 84 55.6 90 41.5 127 58.5 88 51.2 84 48.8
200 41.8 279 58.2 175 37.8 288. 62.2 156 42.4 212 57.6 174 43.1 230 56.9 113 45.6 135 54.4
87 53.4 76 46.6 223 43.1 295 56.9
Prevalence odds 95% confidenct ratio interval
0.9 0.7-1.1 0.7-1.0 0.6 -1.5 1.0-1.2 0.6 -1.8 1.3-1.3 0.9 -1.2 0.8-1.1 0.7-1.9 1.3-1.4 0.9 -0.6 0.4-1.2 0.9-1.4 1.0-1.4 1.0-2.1 1.4-2.8 1.6-
28

Table 6: Logistic regression analysis of selected characteristics for under-nutrition, among tribal under-five children of Joda block, Kendujhar, Orissa, India, 2008
Exposure characteristics
Child's birth order > 3 Child exclusively breast fed for > 6 months
Crude Odds ratio
2.4 1.9
Stunting Underweight Wasting Adjusted odds Adjusted odds Adjusted odds
ratio ratio ratio (95% Crude .odds (95% Crude .odds (95%
ratio ratio confidence confidence confidence
interval) interval) interval) 2.5 (1.4-4.5) 2.1 4.9 (2.0-8.3) 1.5 1.4 (0.9-2.1) 1.7 (1.0-2.6) 1.7 3.5 (1.7-6.9) 1.8 1.9 (1.3-2.9)
Mother illiterate 1.9 1.3 (0.7-2.2) 1.4 0.6 (0.3-1.1) 1.9 2.1 (1.3-3.4) Mother mines worker 1.6 1.4 (0.8-2.4) 1.9 1.0 (0.4-2.6) 1.4 0.8 (0.4-1.5) Underweight mother during pregnancy 1.7 1.7 (1.1-2.6) 1.9 2.9 (1.3-6.1) 2.1 3.0 (1.5-5.8) Residence in hills 1.4 0.9 (0.5-1.7) 1.3 1.1 (0.6-2.0) 1.4 1.8 (1.1-2.7) Difficult accessibility of the house 2.3 2.2 (1.0-4.5) 1.5 0.5 (0.1-1.8) 2.8 2.8 (1.4-5.5) Inaccessible residence 1.5 1.4 (0.9-2.2) 1.5 0.9 (0.4-2.2) 1.5 1.4 (0.9-2.1) Monthly income <Rs. 1500 2.3 1.5 (0.8-2.7) 2.1 2.4 (0.9-6.5) 1.8 1.9 (1.3-2.9)
29

"' LU a:: ::J >< LU z z <(
0 rt)

Annexures 1-5: Additional tables
Annexurel: Dose response analysis of selected va.riables associated with under-nutrition among under-five among tribal under-five children of Joda block, Kendujhar, Orissa, India, 2008
Stunted children Underweight children Wasted children
l for P value x2 for P value X2 for Characteristics level
x2 0R linear x2 0R linear loR linear
trend trend trend
~3 1 1 1
4 1.89 1.30 1.27 Birth order 10.7 0.001 18.1 0.00002 8.3 0.001
5 2.93 2.57 1.15
6+ 3.05 10.35 1.26
4-6 1 1 1
Exclusive 7 1.20 1.29 1.28 15.7 0.00007 10.2 0.001 9.4 0.002
breast feeding 8 2.24 1.61 1.37
9+ 6.66 4.65 2.97
8+ 1 1 1
Education of 6 to 7 1.44 3.46 2.40 17.1 0.00003 20.7 0.00001 6.1 0.01
the mother lto5 3.32 4.67 2. 71
Illiterate 3.50 5.03 2.87
31

Annexure2: Stratified analysis of selected characteristics leading to stunting in tribal under-five children of Joda block, Kendujhar district Orissa 2008
Exposure variable Variable of stratification Strata OR and 95% Cl Interpretation Mantel Haenszel
adjusted OR Crude 2.5 (1.4- 4.5)
BMI of the mother < 18.5 1.4 (0.6- 3.2)
Effect modification Not relevant ;:: 18.5 4.0 {2.0- 8.0}
Higher birth order (>3) Exclusive breast feeding in months >6 2.0 (0.7. 5.1)
Effect modification Not relevant of the child 4-6 3.3 {1.6. 6.6}
Education of the mother Illiterate 2.1 (1.2. 3.7)
Effect modification Not relevant Literate 3.4 (0.9. 12.7}
Accessibility of the house Difficult 1.3 (0.5. 3.2)
Effect modification Not relevant Eas;r: 2.9 (1.6. 5.3} Crude 1.9 (1.3- 3.0}
Literacy of the father Illiterate 1.7 (0.8- 3.6)
Confounding 1.86 Literate 1.9(1.1-3.4}
BMI of the mother in kg/m2 < 18.5 2.2 (1.1- 4.4) No confounding and no effect modification Not relevant
Illiteracy of the mother ;:: 18.5 1.7 (1.0- 3.0) Exclusive breast feeding in months >6 1.9 (0.8- 4.3)
Confounding 1.97 4-6 2.0 (1.1- 3.5)
Occupation of the mother Mines worker 2.7 (0.8- 9.2)
Effect modification Not relevant Others 1.7 (1.1- 2.7} Crude 1.5(1.0-2.1}
Accessibility of the house Difficult 0.0 (0.0- 8.4)
Effect modifier Not relevant Easy 0.8 (0.5- 1.4)
Location of the house Drinking water source Unsafe 1.5 (0.8- 2.8)
Effect modifier Not relevant in hilly area Sate 4.8(2.1-11.0}
Education of the mother Illiterate 1.3 (0.9- 2.0)
No confounding and no effect modification 1.38 (0.95- 2.02) Literate 1.6 (0.7- 3.9~
Occupation of the mother Mines worker 1.5 (0.7- 3.0) Effect modification Not relevant Others 1.4 (0.9- 2.2} Crude 2.1 (1.2-3.6)
Exclusive breast feeding in months >6 1.3 (0.5- 3.7) Effect modifier Not relevant
4-6 2.5 (1.3- 4.9} i
Birth order >3 3.9 (1.0 -15.1)
Effect modifier Not relevant 1Below poverty line S3 1.9 (1.2- 3.3)
BMI of the mother in kg/m 2 < 18.5 2.1 (0.9- 4.7) Confounder 2.36 (1.44- 3.85)
;:: 18.5 2.4 (1.2- 4.6}
Occupation of the mother Mines worker 2.1 (0.7-6.1)
No confounding and no effect modification Not relevant Others 2.2~1.3-3.7~
32

BM I of the mother "' ............. 1.8 {0.9- 3.6)
No confounding and no effect modification Not relevant ~ 18.5 1.6 {0.9- 2.8)
Prolong exclusive breast Occupation of the mother Mines worker 2.6 {0.8- 8.6)
Effect modification Not relevant Others 1.6 {1.0- 2.6) eeding Illiterate 1.5 {0.9- 2.5)
Education of the mother Literate 2.2 (0.9- 5.1)
Effect modification Not relevant
Accessibility of the house Difficult 2.0 (0.6- 6.6)
No confounding and no effect modification Not relevant Easy 1.7{1.1-2.8) Crude 1.9 {1.2- 2.9)
BM I of the mother < 18.5 1.5 {0.7- 3.3)
Effect modification Not relevant ~ 18.5 2.2 {1.3- 4.0)
Birth order >3 1.3 {0.5- 3.4)
Effect modification Not relevant ccupation of the mother :!>3 2.2 {1.4- 3.4)
Education of the mother Illiterate 1.8 {1.1- 2.7)
Confounder 1.9 {1.3- 2.9) Literate 1.7 {0.5 -6.0)
Accessibility of the house Difficult 1.4 {0.6 -3.0)
Effect modification Not relevant Easy 2.0 {1.2- 3.2) Crude 1.5{0.8-2.8)
BM I of the mother < 18.5 0.9 {0.5 -1.8)
Effect modification Not relevant ~ 18.5 2.0 {1.3- 3.2)
'Unsafe drinking water Education of the mother Illiterate 1.3 {0.9- 2.0)
Effect modification Not relevant Literate 2.4 {1.0 -5.2)
Accessibility of the house Difficult 0.8 {0.3- 1. 7}
Effect modification Not relevant Easy 1.8 {1.2- 2.7) Crude 2.7 (1.6- 4.3)
BM I of the mother in kg/m2 < 18.5 2.7 {1.3- 5.8) No confounding and no effect modification Not relevant
~ 18.5 2.7 {1.4- 5.3) Low socio economy
Birth order >3 2.8 {0.7 -10.7)
No confounding and no effect modification Not relevant (monthly income< Rs. S3 2.4 {1.5- 4.1) ,;1500)
Education of the mother Illiterate 2.5 (1.3- 4.9)
Confounder 2.2 {1.3- 3.6) Literate 1.9 (0.9- 4.0)
Accessibility of the house Difficult 5.4 (1.8 -16.0)
Effect modification Not relevant Easy 2.1 {1.3- 3.6)
Annexure4: Stratified analysis of selected characteristics leading to wasting in tribal under-five children of Joda block, Kendujhar district Orissa 2008
33

variable --··--·- ..... ;tratification Strata Stratified OR and 95% Ci OR across the strata Interpretation
Crude 1.9(1.3-2.7) BMI of the mother in < 18.5 2.5 (1.4 -4.3)
Different Effect modification Not relevant kg/m2 ~ 18.5 1.6 (1.0- 2.5) Occupation of the Mines worker 2.8 (1.4- 5.5)
Different Effect modification Not relevant mother Others 1.6 (1.0- 2.4) Education of the Illiterate 1.9 (1.3 2.8) Identical and crude No confounding and no
Not relevant mother Literate 1.9(0.9-4.1) value within strata effect modification Accessibility of the Difficult 1.5 (0.8- 3.0)
Different Effect modification Not relevant house Easy 2.2 (1.5- 3.3)
Crude 2.2 (1.4- 3.2 BMI of the mother in < 18.5 2.8(1.5 5.5)
Different Effect modification Not relevant kg/m2 ~ 18.5 1.8 (1.1- 3.0) ccupation of
Birth order >3 3.6 (1. 7 -7.8)
Different Effect modification Not relevant mother as S3 1.6 (1.0- 2.4) Education of the Illiterate 1.8(1.3 2.7)
Different Effect modification Not relevant mother Literate 1.5 {0.5- 5.2) Accessibility of the Difficult 1.0{0.5 1.9)
Different Effect modification Not relevant i.2 ·-- - -· house Easy Crude 2.3
BMI of the mother in < 18.5 1.8,~.~ 'Oioo.#J
Different Effect modification Not relevant kg/m2 ~ 18.5 2.6(1.6-4.2) >3 4.6(2.2 9.9)
Different Effect modification Not relevant of Birth order S3 1, 7 (1.1- 2.6)
Education of the Illiterate 2.2 (2.5 3.2) Different Effect modification Not relevant
\ mother Literate 0.9 {0.3-3.1)
\(; Crude 2.8 (1.5- 5.0) BMI of the mother in <.18.5 2.1 (0.9 4.7)
Different Effect modification Not relevant kg/m2 ~ 18.5 3.6(1.6-8.5) >3 0.7(0.2-2.7)
Different Effect modification Not relevant Birth order S3 3.9 (2.0-7.4)
Education of the Illiterate 4.0 (1. 7 9.9) Different Effect modification Not relevant
mother Literate 1.8 (0.8 -4.1) Accessibility of the Difficult 5.3 (1.4-19.3)
Different Effect modification Not relevant house Easv 2.3(1.2 4.2}
34

AnnexureS: Population Attributable Fraction (PAF) of selected characteristics leading to undernutrition in tribal under-five children of Joda block, Kendujhar district Orissa 2008
Measure of # children with # undernutrition proportion of cases
Exposure factor children exposed to POR PAF undernutrition undernutrition factor exposed
breast feeding 146 0.34 1.7 0.14
stunting bir order
427 117 0.27 2.5 0.16
outreach 188 0.44 2.2 0.24 lowBMim 166 0.39 1.7 0.16 breast feeding 144 0.35 3.5 0.25
under-weight bir order 406 111 0.27 4.9 0.21 mother-mines 133 0.33 2.9 0.21 outreach 87 0.36 3 0.24 BPL 227 0.95 2.8 0.60
wasting unsafe water 240 174 0.73 1.8 0.32 diar 109 0.45 1.9 0.21 mother-mines 88 0.37 2.1 0.19
35

Annexure: 6 Data collection instrument
Undernutrition among under-five tribal children of Joda block,
Kendujhar, Orissa, India, 2008
Information about the child (to be asked to the mother)
IDNo: - Team No: ! Date: !
Age: Sex:
Date ofbirth:
Now I will ask some questions about your child.
Ql. What was the weight of baby at the time of birth (in gm)? (To be verified from Anganwadi's register.)
I. Within 30 2. 31 min. to lhr
minutes Q2. When was the child started on breast feeding?
3.1 hourto2 4. more than 2 hours hours
Q3. for how many months was the child taking mother's milk only (i.e. exclusively): write in months
Q4. How many times in a day do you breast feed your child (Write in number)?
Q5. Do you feed your child on demand I. yes 2.no
Q6. Up to what years do you breast feed your baby? (Write in number)
t.watei 2. Cow's milk
Q7. What extra food was given to the baby along with mother's milk? (this is to ascertain weaning practices) 3. handia 4. prepared food other
(country liquor) than handia
1. Rice and 2. Vegetables Q8. After the child has totally stopped breast feeding, what are the pulses
food items you give to your baby? (there may be more than one answer; quantify each in terms of how many times a day/ week I 3. Fish, meat,
4. Handia month) crabs,
Q7. Where does your child stay? 1. Living with both 2. Living with mother (not parents father)
37

3. Living with father 4. Living with neither parent
(not mother)
Yes regularly Yes, but irregularly
Q8. Does your child go to anganwadi center No
I. Yes 2.No
Q9. Has your child received vaccines? completely
(To be verified from the records of anganwadi) 3. partially
Q9. How many times your child suffers from diarrhea in the last 3 months? (write the number)
c<t:
Q 10. How many times your child suffers from respiratory tract infection in last 3 months? (write in number)
I. consult govt. 2. consult village doctor practitioner
Q 11. What do you do when your child is sick? 3. give 4. Do "puja" traditional (superstitious animal medications sacrifice etc.)
38
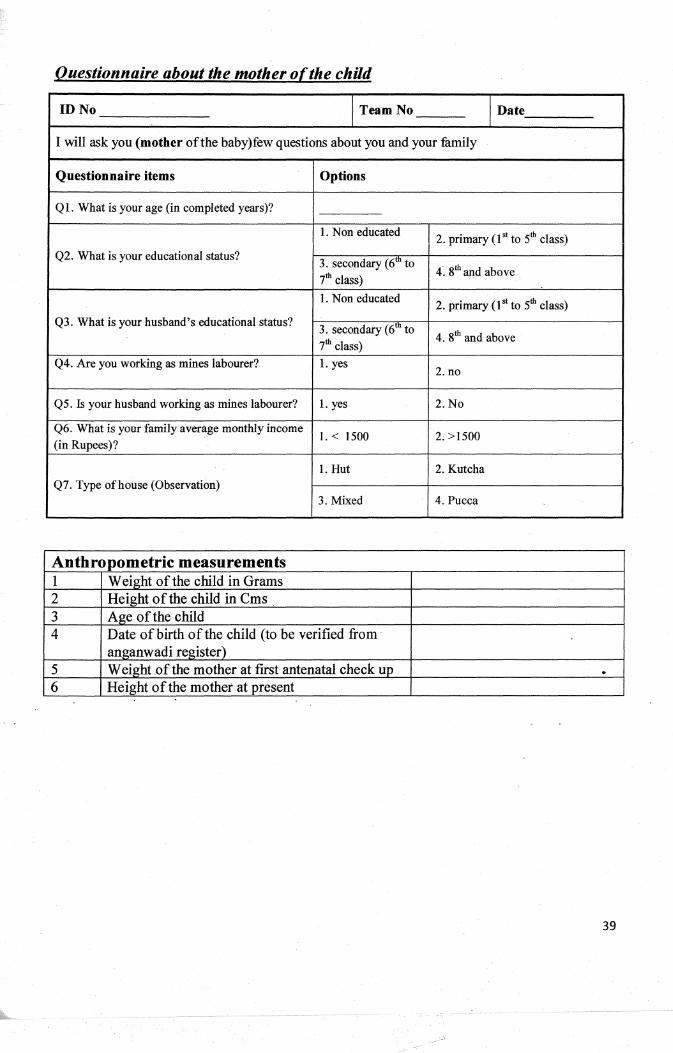
Questionnaire about the mother of the child
ID No I Team No I Date
I will ask you (mother of the baby)few questions about you and your family
Questionnaire items Options
Ql. What is your age (in completed years)?
I. Non educated 2. primary (1st to 5th class)
Q2. What is your educational status? 3. secondary (6m to 7th class)
4~ gth and above
I. Non educated 2. primary (1st to 5th class)
Q3. What is your husband's educational status? 3. secondary (6m to 7th class)
4. 8th and above
Q4. Are you working as mines labourer? 1. yes 2.no
Q5. Is your husband working as mines labourer? I. yes 2.No
Q6. What is your family average monthly income I.< 1500 2;>1500
(in Rupees)?
1. Hut 2. Kutcha Q7. Type ofhouse (Observation)
3. Mixed 4. Pucca
Anthropometric measurements 1 Weight of the child in Grams 2 Height of the child in Cms 3 Age ofthe child 4 Date ofbirth of the child (to be verified from·
anganwadi register) 5 Weight of the mother at first antenatal check up . 6 Height of the mother at present
39
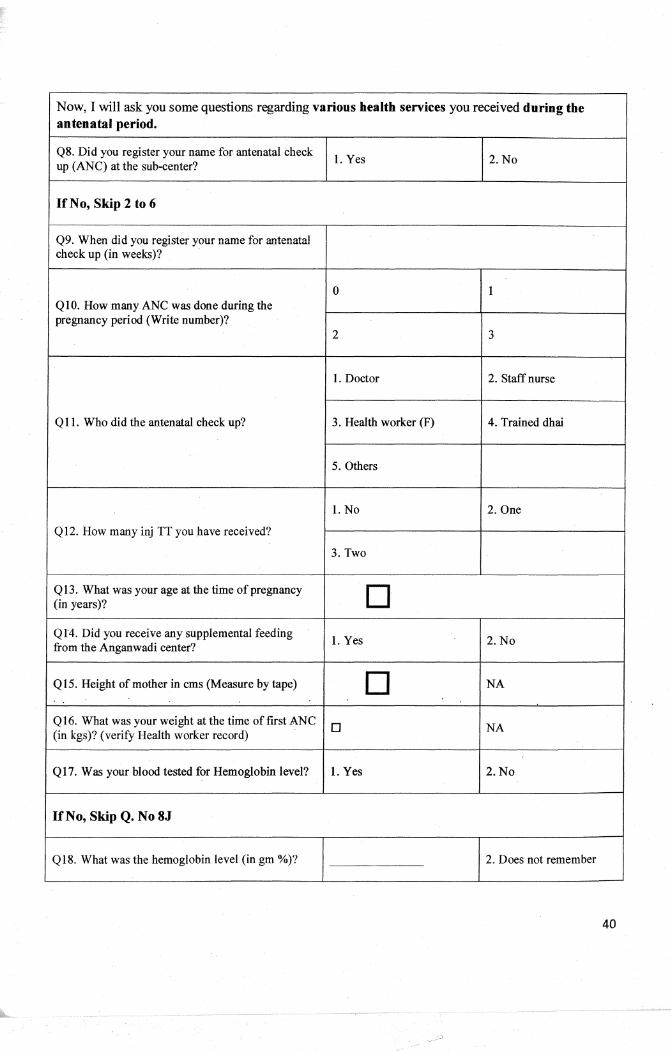
Now, I will ask you some questions regarding various health services you received during the antenatal period.
Q8. Did you register your name for antenatal check I. Yes 2.No up (AN C) at the sub-center?
HNo, Skip 2 to 6
Q9. When did you register your name for antenatal check up (in weeks)?
0 I Q I 0. How many ANC was done during the pregnancy period (Write number)?
2 3
I. Doctor 2. Staff nurse
Q II. Who did the antenatal check up? 3. Health worker (F) 4. Trained dhai
5. Others
1. No 2. One
QI2. How many inj TT you have received?
3.Two
Q I3. What was your age at the time of pregnancy D (in years)?
Ql4. Did you receive any supplemental feeding 1. Yes 2.No from the Anganwadi center?
QI5. Height of mother in ems (Measure by tape) D NA
Ql6. What was your weight at the time of first ANC D NA (in kgs)? (verify Health worker record)
Q I7. Was your blood tested for Hemoglobin level? I. Yes 2.No
If No, Skip Q. No 8J
Ql8. What was the hemoglobin level (in gm %)? 2. Does not remember
40

IDNo
Ql9. did you get food supplementation from I. Yes 2.No anganwadi centre
Q20. did anganwadi taught you about what food I. Yes 2. No
should be taken during pregnancy
I. no 2. yes, complete Q21. Had you taken full course IFA tablet (100 tablets) after 3 months of pregnancy?
3. incomplete
1st 2-3
Q22. What was the birth order of this child? 4-5
6 &more
<24 24to 47
Q23. What was the duration of gap from the previous pregnancy (in months)?
48+ NA (as it is the 1st birth)
Now, I will ask you some questions regarding various health services you received during the natal & perinatal period.
1. Govt. hospital 2. Private hospital
Q24. In which place did you deliver the baby? 3. Sub- center 4.Home
5. Outside Home
1. Doctor 2. Staff nurse
3. Health worker 4. Trained Dhai Q25 • .Who did the qelivery?
5. Untrained 6. self personnel
Food frequency questionnaire (FFQ) -Now I will ask about the food and water you ta)(e
Q26. Do you take rice Yes No
Q27. (IfQ26 ans. is yes), how often? (In terms of how many times a day or week or month)
41

Q28. (IfQ26 ans. is yes) What is the quantity every time? (In gram)
Q29. Do you take pulses Yes No
Q30. (IfQ29 ans. is yes) How often? (In terms of how many times a day or week or month)
Q31. (If Q29 ans. is yes) What is the quantity every time? (In gram)
Q32. Do you take milk I curd Yes No
Q33. (IfQ32 ans. is yes) How often? (In terms of how many times a day or week or month)
Q34. (IfQ32 ans. is yes) What is the quantity every time? (In gram)
Q35. DoByou take vegetables Yes No
Q36. (If Q26 ans. is yes) How often? (In terms of how many times a day or week or month)
Q37. (IfQ26 ans. is yes) What is the quantity every time? (In gram)
Q38.Do you take meat/ fish/egg/ants/crabs Yes No
Q39. How often? (In terms of how many times a day or week or month)
Q40. What is the quantity every time? (In gram)
" No As a, part of diet . Q41. Do you take countr~ liquor (handia)
As a beverage As the only dietary item
Q42. Where from you get water for drinking pond I river shallow well Fountain tube well
thank the family for participation
Thank You
42

Annexure: 7 Consent form
Consent form for Undernutrition among tribal under-five of Joda
block, Keonjhar, Orissa, India, 2008
Dear participants
Namaskar,
We are ------------------------------------------ and -----------------------------------------------working with Dr. Debasis Jethy (MAE, FETP scholar, Chennai) for a research on "undernutrition
among tribal under-five of Joda block, Kendujhar, Orissa". We are looking into the factors associated with tribal under-five. By knowing these factors, the health department will take care of these factors
to reduce undernutrition.
To find out why there is undernutrition, we need to ask questions to parents of under-five children. We would like to confidentially ask these few questions to you once. Answering these questions will take about 30 minutes of your time.
Taking part in this survey is voluntary. No compensation will be paid to you for taking part in this study. You can choose not to take part. You can choose not to answer a specific question. You can also stop answering these questions at any time without having to provide a reason. This will not affect your rights to health care in the government hospitals, or any other rights. There is no specific benefit for you if you take part in the survey. However, taking part in the survey may be ofbenefit to the community, as it may help us to understand the problem, its causes and potential solutions. After the results are analyzed, a report will be shared with all the participants by focus group discussion at the village and the local health officials, so that the right measures can be taken to prevent and control undernutrition among the tribal under-five population.
The information we will collect in this survey will remain between you and the investigation team. We will not write your name on this form. We will only use a code instead. Only the principal investigator will know the key to this code. It will be kept under lock and key. It will be destroyed after the project is over.
If you wish to .:finq out more about this survey before taking part, you can ask us all the questions you want. You can also contact Dr. Debasis Jethy, MAE-FETP Scholar, NIE, Chennai (principal investigator ofthis survey) who will be happy to give you more details. If you are okay to take part, we will go ahead now.
Signature I Thumb impression of the participant Name of the interviewer
Date:
Signature of witness
Date:
43
Annexure 8: certificate of consent
I have read the foregoing iriformation, or it has been read to me. I have had the opportunity to ask questions about it and any questions I have asked have been answered to my satisfaction. I
consent voluntarily to participate as a participant in this study and understand that I have the right to withdraw from the study at any time without in any way it affecting my further medical care.
Name of the study participant
Name of the witness
Name ofthe interviewer
Signature/thumb impression of the study participant
Signature of the witness
Signature of the interviewer
(One copy to be given to the participant after signature of participant, witness and investigator)
Nutritional status and characteristics related to malnutrition under five years of age Nghean, Vietnam The nutritional status of children has an impact on their heal
44

SECTION: II LITERATURE REVIEW
45

Introduction
Malnutrition is associated with about half of all child deaths worldwide. Malnourished children have
lowered resistance to infection; they are more likely to die from common childhood ailments like
diarrhoeal diseases and respiratory infections; and for those who survive, frequent illness saps their
nutritional status, locking them into a vicious cycle of recurring sickness, faltering growth and
diminished learning ability. 2
Malnutrition has been responsible, directly or indirectly, for 60% of the 10.9 million deaths annually
among children under five. Well over two-thirds of these deaths, which are often associated with
inappropriate feeding practices, occur during the first year of life. 3
Underweight prevalence declined from 32 per cent to 28 per cent in developing countries over the past
decade. The most remarkable progress has been in East Asia and the Pacific.2 The profile of
malnutrition in India is one where the distribution of children's age-standardized weight is
dramatically to the left of the global reference standard, suggesting a major undernutrition problem. 4
Preventing under-nutrition has emerged as one of the most critical challenges to India's development
planners in recent times. Despite substantial improvement in health and well-being since the country's
independence in 1947, under-nutrition remains a silent emergency in India, where almost half of all
children under the age of three are underweight, 30 percent of newborns born with low birth weight,
anq 52 percent of women and 74 perceirt of children are anaemic. Other major nutritional deficienCies
of public health importance in the country are Vitamin A deficiency and iodine deficiency. 5
Under-nutrition is the underlying cause for about 50% of the 2.1 million Under-5 deaths in India each
year. The prevalence of under nutrition is the highest in Madhya Pradesh (55%), Bihar (54%), Orissa
(54%), Uttar Pradesh (52%) and Rajasthan (51%), while Kerala (37%) and Tamil Nadu (27%) have
lower rates.5
46

Interventions for combating undernutrition include, Supplementation of nutritious food and
other activities by Integrated Child Development Services (ICDS) programme, Vitamin A
prophylaxis, "Panchavyadhi chikitsa" to fight against infectious diseases, Iron and folic acid
supplementation for pregnant women. However, undernutrition still remains a significant
problem among tribal children due to a variety of factors including insufficient food intake,
frequent infections, lack of access to health services, illiteracy, unhygienic personal habits
and adverse cultural practices. In fact, the health indices of the tribal population indicate that
over 55% children are underweight and under-five mortality rate is 127 per 1000 live births16•
Under-five children: Under-fives (also referred to as preschool children by NNMB)
constitute the. most nutritionally vulnerable segment of the population and their nutritional
status is considered to be a sensitive indicator of community health and nutrition. 6
Nutrition
Nutrition is an input to and foundation for health and development. Interaction of infection
and malnutrition is well-docume~ted. Better nutrition means stronger immune systems, less
illness and better health. Healthy children learn better. Healthy people are stronger, are more
productive and more able to create opportunities to gradually break the cycles Qfboth poverty
and hunger in a sustainable way. Better nutrition is a prime entry point to ending poverty and
a milestone to achieving better quality of life.
47

Freedom from hunger and malnutrition is a basic human right and their alleviation is a
fundamental prerequisite for human and national development.
WHO has traditionally focused on the vast magnitude of the many forms of nutritional
deficiency, along with their associated mortality and morbidity in infants, young children and
mothers. However, the world is also seeing a dramatic increase in other forms of malnutrition
characterized by obesity and the long-term implications of unbalanced dietary and lifestyle
practices that result in chronic diseases such as cardiovascular disease, cancer and diabetes.
All forms of malnutrition's broad spectrum are associated with significant morbidity;
mortality, and economic costs, particularly in countries where both under- and overnutrition
co-exist as is the case in developing countries undergoing rapid transition in nutrition and
life-style. 8
Nutrition of mother and child: The health and nutritional status of mothers and children are
intimately linked. Improved infant and young child feeding begins with ensuring the health
and nutritional status of women, in their own right, throughout all stages of life and continues
with women as providers for their children and families. Mothers and infants form a
biological and social unit; they also share problems of malnutrition and ill-health. Whatever•
is done to solve these problems concerns both mothers and children together. 3
Measurement of undernutrition by anthropometry
A) For children: stunting, underweight and wasting
Population-based anthropometric measures of child malnutrition include stunting, wasting
and underweight children. Stunting is defined by the child's length given his or her age, and
48

l wasting by weight for a given length. Underweight is measured by weight for a given age. To
measure children's nutritional status, we use anthropometric standards to calculate children's
Z-scores for length-for-age and weight-for-age; The Z-scores are calculated using the
reference growth curves developed by the US National Center for Health Statistics and
recommended by the World Health Organization for international use (World Health
Organization Working Group 1986o; Dibley et al. 1987). Z-scores are calculated as the
difference between the anthropometric score (length-for-age and weight-for-age) and the
standard score, divided by the standard deviation. . . . Moderately stunted or underweight
children are between two and three standard deviations below these standards; severely
stunted or underweight children are those who fall more than three standard deviations below.
9
B) For adults: Body Mass Index
Body Mass Index (BMI) is a simple index of weight-for-height that is commonly used to classify
underweight, overweight and obesity in adults. It is defined as the weight in kilograms divided by the
square of the height in metres (kglm2). 10
Table: The International Classification of adult underweight, overweight and obesity according to BMI Classification BMI(kg/m2)
"
Principal cut-off points Additional cut-off points Underweight <18.50 <i8.50
Severe thinness <16.00 <16.00
Moderate thinness 16.00- 16.99 " 16.00 - 16.99 Mild thinness 17.00-18.49 17.00- 18.49
Normal range 18.50 - 24.99 18.50 - 22.99 23.00 - 24.99
Overweight ~5.00 ~25.00
Pre-obese 25.00 - 29.99 25.00 - 27.49 27.50-29.99
49

l Obese ~30.00 ~30.00
Obese class I 30.00 - 34-99 30.00 - 32.49 32.50 - 34.99
Obese class II 35.00- 39.99 35.00-37.49 37.50 - 39.99
Obese class III ~40.00 ~40.00
Source: Adapted from WHO, 1995, WHO, 2000 and WHO 2004.
Factors associated with undernutrition
Child undernutrition is a consequence of the complex: interactions of multiple determinants.
One way to conceptualize these interactions is with the use of a framework that traces the
causal pathways of undernutrition through different levels - the most immediate, the
underlying, and the basic causes. The first level is composed of the most immediate causes of
malnutrition and highlights the importance of both food intake and the absence of infection
(or improving child nutritional status. Inadequate dietary intake and infections create a
vicious cycle that is responsible for much of the high morbidity and mortality among children
in developing countries. On the one hand, when children do not consume enough, immune
response· is lowered~ rendering the~ moresusceptible to infectious diseases. On the other
hand, ill children deplete their nutritional stores and are in poor health because of reduced
intake, poor absorption of nutrients and the increased demands of combating disease. 11
Various causes of undernutrition are Low birth weight, Introduction of Supplementary Food too
late/too early, Infections12
50
Complications
Undernutrition, both protein-energy malnutrition and micronutrient deficiencies, directly affects many
aspects of children's development. In particular, it retards their physical and cognitive growth and
increases susceptibility to infection, further increasing the probability of malnutrition. Child
malnutrition is responsible for 22 percent of India's burden of disease. Undernutrition also
undermines educational attainment, and productivity, with adverse implications for income and
. wth.4 econormc gro
As a result, malnutrition has been estimated to be associated with about half of all child
deaths and more than half of child deaths from major diseases, such as malaria (57 percent),
diarrhea (61 percent) and pneumonia (52 percent), as well as 45 percent of deaths from
measles ( 45 percent). In India, child malnutrition is responsible for 22 percent of the
country's burden of disease. Undernutrition also affects cognitive and motor development
and undermines educational attainment; and, ultimately impacts on productivity at work and
at home, with adverse implications for income and economic growth. 13
Proposed interventions with proper food
A) Antenatal Care: an opportunity to counsel and educate the pregnant mother to take about . .
nutritious food, iron tablets, folic acid suppliments.
B) Breast feeding: Breastfeeding is the ideal way of providing young infants with the nutrients they
need for healthy growth and development. Virtually all mothers can breastfeed, provided they have
accurate information, and the support of their family and the health care system. 14 Colostrum, the
yellowish, sticky breast milk produced at the end of pregnancy, is recommended by WHO as the
perfect food for the newborn, and feeding should be initiated within the first hour after birth.
51

Exclusive breastfeeding is recommended up to 6 months of age. IS Lack of exclusive breastfeeding
during the first half-year of life- are important risk factors for infant and childhood morbidity and
mortality that are only compounded by inappropriate complementary feeding. The life-long impact
includes poor school performance, reduced productivity, and impaired intellectual and social
development. 3
No more than 35% of infants worldwide are exclusively breastfed during the first four months oflife;
complementary feeding frequently begins too early or too late, and foods are often nutritionally
inadequate and unsafe. 3
Faulty feeding practices begin with giving any other nourishment but breast milk before
complementary feeding is nutritionally required- or with substituting entirely for breast milk, which
places babies at risk of illness, even death. When complementary feeding begins, uninformed
decisions can also interfere with g~od nutrition in terms of which foods are given, how much ~dhow
often and whether breastfeeding. continues, as it should Nutritionally inadequate or contaminated
food, and starting complementary feeding too early or too late are major causes of malnutrition in
infants and young children. I 7
Breastfeeding is an unequalled way of providing ideal food for the healthy growth and
developJ?ent of infants; it is also an integral part of the r~productive process with impo~t
implications for the health of mothers. A recent review of evidence has shown that, on a
pop~lation b~sis, exclusive brea~tfe~~ing for 6 tp.onths ~s ~h~ optimal way o( feed,in~ infants.
Thereafter infants should receive complementary foods with continued breastfeeding up to 2
years of age or beyond.
To enable mothers to establish and sustain exclusive breastfeeding for 6 months, WHO and
UNICEF recommend:
• Initiation ofbreastfeeding within the first hour of life
52

• Exclusive breastfeeding - that is the infant only receives breastmilk without any
additional food or drink, not even water
• Breastfeeding on demand- that is as often as the child wants, day and night
• No use of bottles, teats or pacifiers ·
Breastmilk is the natural first food for babies, it provides all the energy and nutrients that the
infant needs for the first months of life, and it continues to provide up to half or more of a
child's nutritional needs during the second half of the first year, and up to one-third during
the second year of life. 111
Breastmilk promotes sensory and cognitive development, and protects the infant against
infectious and chronic diseases. Exclusive breastfeeding reduces infant mortality due to
common childhood illnesses such as diarrhoea or pneumonia, and helps for a quicker
recovery during illness. These effects can be measured in resource-poor and affluent
societies7
Breastfeeding contributes to the health and well-being of mothers, it helps to space children, reduces
the risk of ovarian cancer and breast cancer, increases family and national resources, is a secure way
of feeding and is safe for the environment. 18
C) Timely introduction of Supple01entary Food: Adequate nutrition during infimcy is essential for
lifelong health 8.nd wellbeing. infants should be exclusively breastfed for the first six months ~flife to
achieve optimal growth, development and health. Thereafter, to meet their evolvi~g nutritional
requirements, infants should receive nutritionally. adequate and safe complementary foods, while
continuing to breastfeed for up to two years or more. 19
When breastmilk is no longer enough to meet the nutritional needs of the infant,
complementary foods should be added to the diet ofthe child. The transition from exclusive
53

breastfeeding to family foods, referred to as complementary feeding, typically covers the
period from 6 to 18-24 months of age, and is a very vulnerable period. It is the time when
malnutrition starts in many infants, contributing significantly to the high prevalence of
malnutrition in children under five years of age world-wide. WHO estimates that 2 out of 5
children are stunted in low-income countries.
Complementary feeding should be timely, meaning that all infants should start receiving
foods in addition to breastmilk from 6 months onwards. It should be adequate, meaning that
the nutritional value of complementary foods should parallel at least that ofbreastmilk. Foods
should be prepared and given in a safe manner, meaning that measures are taken to minimize
the risk of contamination with pathogens. And they should be given in a way that is
appropriate, meaning that foods are of appropriate texture and given in sufficient quantity.
The adequacy of complementary feeding (adequacy in short for timely, adequate, safe and
appropriate) not only depends on the availability of a variety of foods in the household, but
also on the feeding practices of caregivers. Feeding young infants requires active care and
stimulation, where the caregiver is responsive to the child clues for hunger and also
encourages the child to eat. Th!s is also referred to as active or responsive fee~ing.
WHO recommends that infants start receiving complementary foods at 6 months of age in
. addition t~"br~astmilk, initially 2~3· tiines a day betwee~ 6-8 months, i~creasi~gto 3-4 tim"~s
daily between 9-11 months and 12-24 months with additional nutritious snacks offered 1-2
times per day, as desired.
Inappropriate feeding practices are often a greater determinant of inadequate intakes than the
availability of foods in the households. WHO has developed a protocol for adapting feeding
recommendations ·that enables programme managers to identify local feeding practices,
54

common problems associated with feeding, and adequate complementary foods. The protocol
builds upon available information and proposes household trials to test improved feeding
recommendations. WHO recommends that the protocol be used to design interventions for
improved complementary feeding, and is included as part of adaptation process of the
Integrated Management of Childhood Illness strategy.
Research has shown that caregivers require skilled support to adequately feed their infants.
Guidelines for appropriate feeding are included as part of the Integrated Management of
Childhood Illness guidelines and training course for first-level health workers. Extending
these guidelines, WHO has developed the guide Complementary feeding: Family Foods for
breastfed children that gives more detailed guidance for health workers on how to support
complementary feeding. The guide is the basis of a 3-day training course for health
professionals, which is currently under development.20
Non-nutritional measures to combat undernutrition and its
complications:
Prevention, early detection and treatment ofinfections
A) Growth monitoring
B) Malnourished children who survive are more frequently sick and suffer the life-long consequences
of impaired development. 3
55

Integrated Child Development Scheme:
It was designC!d to address the multidimensional causes of undernutrition. As the program expands to
reach more and more villages, it has tremendous potential to impact positively on the nutritional and
health status and well-being of the millions of women and children who are eligible for participation.
Thekey.21
REFERENCES
2. Child Malnutrition; Available at http://www.unicet:orglspecialsessionlabout/sgreportpdf702 ChildMalnutrition D734llnsert Eng1ish.pdf
3. WHO- UNICEF. Global Strategy for Infant and Young Children Feeding.2003 Available at http://whqlibdoc. who.int/publications/2003/9241562218.pdf
4. World Bank. Dimensions of undernutrition problem in India. Available at http://siteresources. worldbank. org/SOUTIIASIAEXT/Resources/223 546-114 7272668285/undernourished chapter l.pdf accessed on 12.11.2008
5. UNICEF. Undernutrition- a challenge for India. Nutrition. Available at http://www~ unicef.org/indialnutrition 1556.htm
6. http://planningcommission.nic.inlplans/planrellfiveyr/9th/vol2/v2c4-3.;.2.htm
7. Kramer Metal Promotion ofBreastfeeding Intervention Trial (PROBIT): A randomized trial in ·the Republic of Belarus. Journal of the Ameiicim Medical Association, 2001, 285 ( 4 ): 413-420
8. WHO. Nutrition. Available at http://www. who.int/nutritionlnhd/en/index.html accessed on 25.12.08·
9. Hugh R Waters, Mary E Penny, Hilary M Creed'"Kanashiro, Rebecca C Robert, Rocio Narro, Jeff Willis, Laura E Caulfield and Robert E Black. The cost-effectiveness of a child nutrition education programme in Peru. ·
10. WHO. BMI classification. Global Data Base oil Body Mass Index. Available at httP://www.who.int/bmi/index.jsp?introPage=intro 3.html
11. World Bank. Chapter 2 The Integrated Child Development Services Program (Icds)- Are Results Meeting Expectations. Available at http ://siteresources. worldbank.org/SOUTHASIAEXT /Resources/223 546-1147272668285/undemourished chapter 2.pdf
56

12. Ninth five year plan (Vol- 2). Agriculture, Irrigation, Food Security and Nutrition. 4.3 available at http://planningcommission.nic.in/plans/planrel/fiveyr/9th/vol2/v2c4-3-2.htm accessed on 10.12.08
13. Michele Gragnolati, Meera Shekar, Monica Das Gupta, Caryn Bredenkamp and Yi Kyoung Lee. India's Undernourished Children: A Call For Reform And Action. HNP discussion paper. A vai1able at http:/ /siteresources. worldbank.org/SOUTHASIAEXT /Resources/223546-114 7272668285/IndiaUndemourishedChildrenFinal.pdf
14. IYCF
15. WHQ. Breast feeding. Health topics. Available at http://www.who.int/topicslbreastfeeding/en/
16. Orissa Vision 2010: A Health Strategy- Orissa State Integrated Health Policy, Strategies
and Action Points. Health and Family Welfare Department, Govt. of Orissa, 2003.
17. WHO. Promoting proper feeding for infants and young children. Health topics. Available at http://www.who.int/nutrition/topics/infantfeeding/en/index.html
18. WHO. Exclusive Breast Feeding. Nutrition. Available at http://www. who. inti nutrition/topics/ exclusive breastfeeding/ en/index.html
19. WHO. Infant nutrition. Health topics. Available at http://www.who.int/topics/infant nutrition/en/
20. WHO. Complementary food. Nutrition. Available at http://www. who.int/nutrition/topics/complementary feeding/en/index.html
21. World Bank. How to enhance the impact ofiCDS. Chapter 3. Available at http ://siteresources. worldbank. org/SOUTHASIAEXT /Resources/223546-1147272668285/undemourished chapter 3.pdf
57