Undermining Markets: When Government Intervention Hurts 04 …€¦ · Undermining Markets: When...
33
{k.k'k% d.k'k'pSo fo|ke~ vFkZa p lk/;sr~A {k.ks u"Vs dqrks fo|k d.ks u"Vs dqrks /ue~AA Every moment one should learn, from every bit one should earn. If you waste a second you can’t get knowledge and if you waste a bit u can’t get money. Government intervention, sometimes though well intended, often ends up undermining the ability of the markets to support wealth creation and leads to outcomes opposite to those intended. This chapter analyses four examples of anachronistic government interventions, though many more abound. First, frequent and unpredictable imposition of blanket stock limits on commodities under Essential Commodities Act (ECA) neither brings down prices nor reduces price volatility. However, such intervention does enable opportunities for rent-seeking and harassment. For instance, imposition of stock limits on dal in 2006-Q3, sugar in 2009- Q1 and onions in September 2019 spiked up the volatility of the wholesale and retail prices instead of smoothening them – in contrast to its objective of easing pressure on prices. Around 76000 raids under ECA were conducted during 2019. Assuming a minimum of 5 persons involved in a raid, considerable administrative effort goes into enforcement of ECA. As the conviction rate, however, is abysmally low and raids have no impact on prices, the ECA only seems to enable rent-seeking and harassment. The Act is anachronistic as it was passed in 1955 in an India worried about famines and shortages; it is irrelevant in today's India and must be jettisoned. Second, the regulation of prices of drugs through the DPCO 2013, has led to increase in the price of a regulated pharmaceutical drug vis-à-vis that of a similar drug whose price is not regulated. Our analysis shows that the increase in prices was witnessed for more expensive formulations than for cheaper ones and those sold in hospitals rather than retail shops, reinforcing that the outcome is opposite to what DPCO aims to do - making drugs affordable. The evidence across different commodities (pulses, sugar, onions and drugs) - not just onions or sugar where cartelisation is often suspected - and episodes spanning different time periods (2006-19) suggests that the ineffectiveness of ECA stems from unnecessary government intervention that undermines markets. Third, government policies in the foodgrain markets has led to the emergence of Government as the largest procurer and hoarder of foodgrains – adversely affecting competition in these markets. This has led to overflowing of buffer stocks with FCI, burgeoning food subsidy burden, divergence between demand and supply of cereals and acted as a disincentive towards crop diversification. Fourth, analysis of debt waivers given by States/Centre shows that full waiver beneficiaries consume less, save less, invest less and are less productive after the waiver when compared to the partial beneficiaries. The share of formal credit decreases for full beneficiaries when compared to partial beneficiaries, thereby defeating the very purpose of the debt waiver provided to farmers. Undermining Markets: When Government Intervention Hurts More Than It Helps 04 CHAPTER
Transcript of Undermining Markets: When Government Intervention Hurts 04 …€¦ · Undermining Markets: When...
{k.k'k% d.k'k'pSo fo|ke~ vFkZa p lk/;sr~A{k.ks u"Vs dqrks fo|k d.ks u"Vs dqrks /ue~AA
Every moment one should learn, from every bit one should earn. If you waste a second you can’t get knowledge and if you waste a bit u can’t get money.
Government intervention, sometimes though well intended, often ends up undermining the ability of the markets to support wealth creation and leads to outcomes opposite to those intended. This chapter analyses four examples of anachronistic government interventions, though many more abound.First, frequent and unpredictable imposition of blanket stock limits on commodities under Essential Commodities Act (ECA) neither brings down prices nor reduces price volatility. However, such intervention does enable opportunities for rent-seeking and harassment. For instance, imposition of stock limits on dal in 2006-Q3, sugar in 2009-Q1 and onions in September 2019 spiked up the volatility of the wholesale and retail prices instead of smoothening them – in contrast to its objective of easing pressure on prices. Around 76000 raids under ECA were conducted during 2019. Assuming a minimum of 5 persons involved in a raid, considerable administrative effort goes into enforcement of ECA. As the conviction rate, however, is abysmally low and raids have no impact on prices, the ECA only seems to enable rent-seeking and harassment. The Act is anachronistic as it was passed in 1955 in an India worried about famines and shortages; it is irrelevant in today's India and must be jettisoned.Second, the regulation of prices of drugs through the DPCO 2013, has led to increase in the price of a regulated pharmaceutical drug vis-à-vis that of a similar drug whose price is not regulated. Our analysis shows that the increase in prices was witnessed for more expensive formulations than for cheaper ones and those sold in hospitals rather than retail shops, reinforcing that the outcome is opposite to what DPCO aims to do - making drugs affordable. The evidence across different commodities (pulses, sugar, onions and drugs) - not just onions or sugar where cartelisation is often suspected - and episodes spanning different time periods (2006-19) suggests that the ineffectiveness of ECA stems from unnecessary government intervention that undermines markets.Third, government policies in the foodgrain markets has led to the emergence of Government as the largest procurer and hoarder of foodgrains – adversely affecting competition in these markets. This has led to overflowing of buffer stocks with FCI, burgeoning food subsidy burden, divergence between demand and supply of cereals and acted as a disincentive towards crop diversification.Fourth, analysis of debt waivers given by States/Centre shows that full waiver beneficiaries consume less, save less, invest less and are less productive after the waiver when compared to the partial beneficiaries. The share of formal credit decreases for full beneficiaries when compared to partial beneficiaries, thereby defeating the very purpose of the debt waiver provided to farmers.
Undermining Markets: When Government Intervention Hurts More Than It Helps
04CHAPTER
68 Economic Survey 2019-20 Volume 1
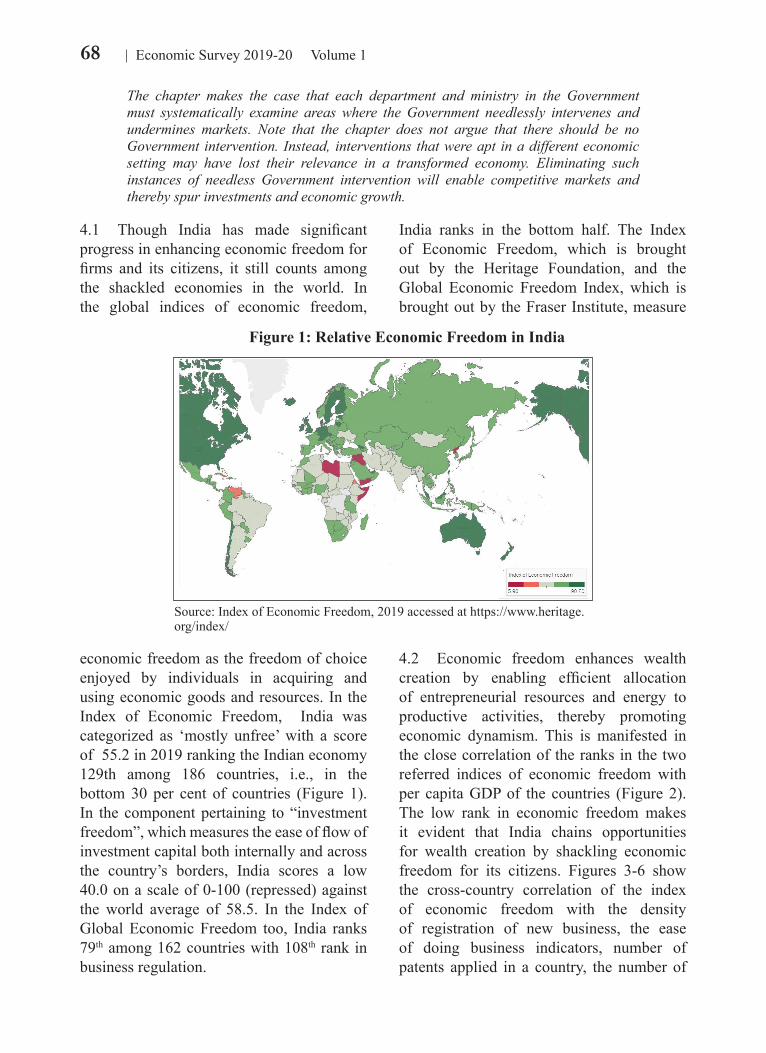
economic freedom as the freedom of choice enjoyed by individuals in acquiring and using economic goods and resources. In the Index of Economic Freedom, India was categorized as ‘mostly unfree’ with a score of 55.2 in 2019 ranking the Indian economy 129th among 186 countries, i.e., in the bottom 30 per cent of countries (Figure 1). In the component pertaining to “investment freedom”, which measures the ease of flow of investment capital both internally and across the country’s borders, India scores a low 40.0 on a scale of 0-100 (repressed) against the world average of 58.5. In the Index of Global Economic Freedom too, India ranks 79th among 162 countries with 108th rank in business regulation.
Figure 1: Relative Economic Freedom in India
Source: Index of Economic Freedom, 2019 accessed at https://www.heritage.org/index/
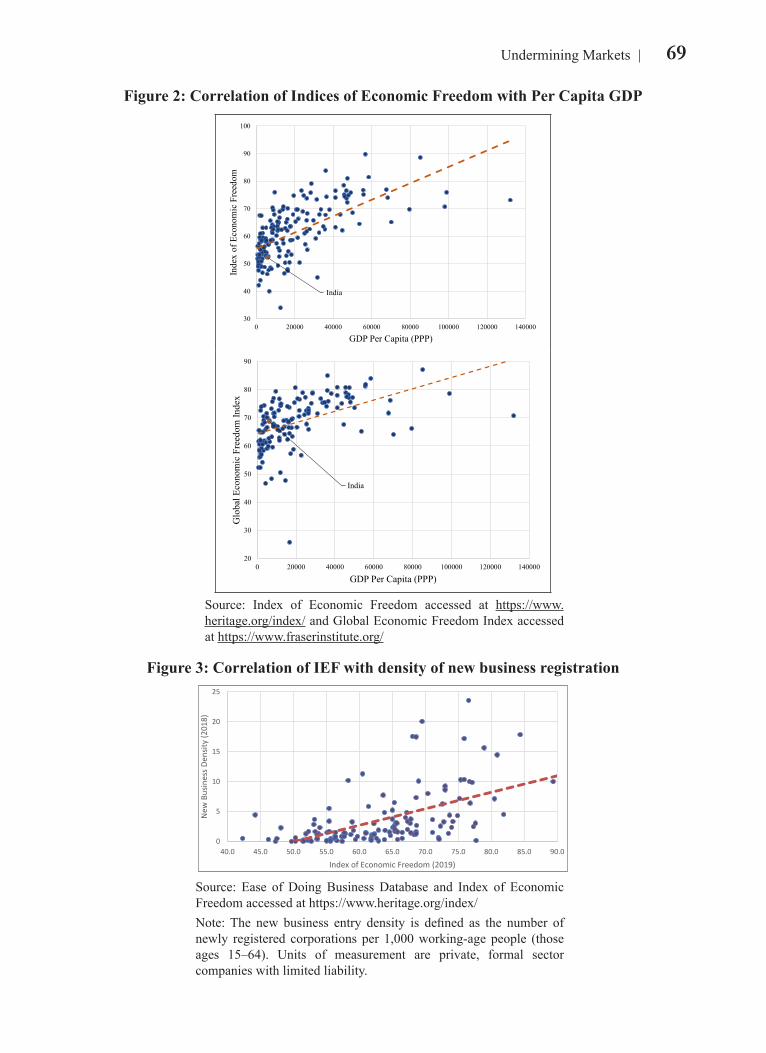
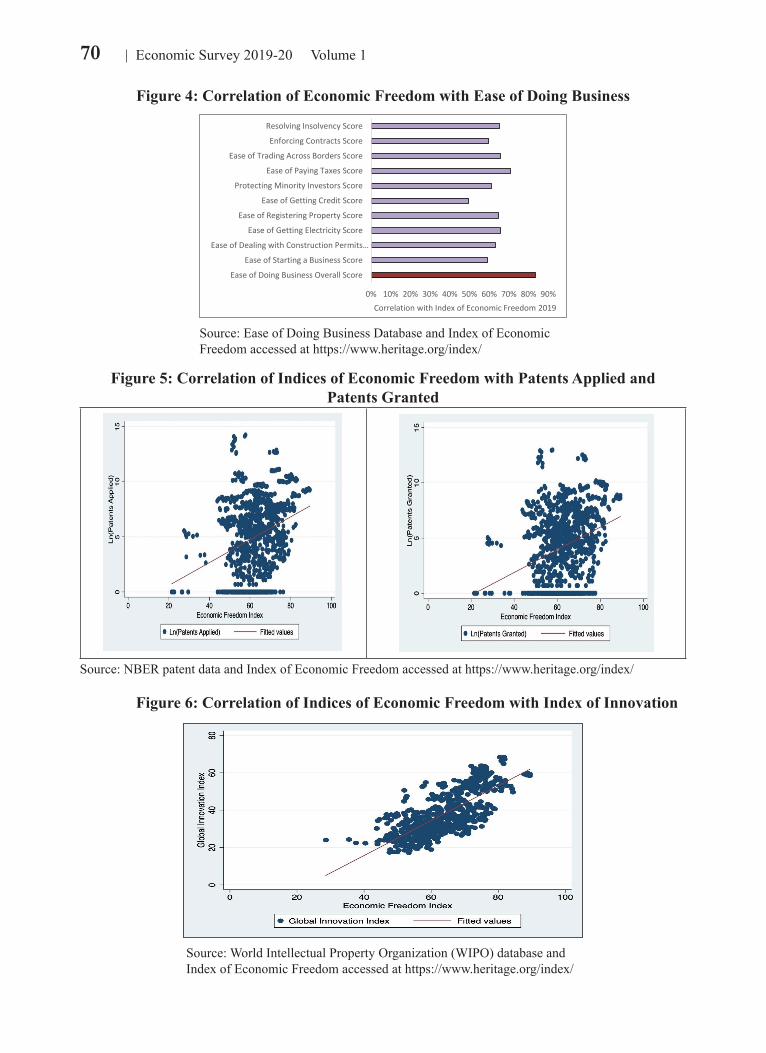
4.2 Economic freedom enhances wealth creation by enabling efficient allocation of entrepreneurial resources and energy to productive activities, thereby promoting economic dynamism. This is manifested in the close correlation of the ranks in the two referred indices of economic freedom with per capita GDP of the countries (Figure 2). The low rank in economic freedom makes it evident that India chains opportunities for wealth creation by shackling economic freedom for its citizens. Figures 3-6 show the cross-country correlation of the index of economic freedom with the density of registration of new business, the ease of doing business indicators, number of patents applied in a country, the number of
4.1 Though India has made significant progress in enhancing economic freedom for firms and its citizens, it still counts among the shackled economies in the world. In the global indices of economic freedom,
India ranks in the bottom half. The Index of Economic Freedom, which is brought out by the Heritage Foundation, and the Global Economic Freedom Index, which is brought out by the Fraser Institute, measure
The chapter makes the case that each department and ministry in the Government must systematically examine areas where the Government needlessly intervenes and undermines markets. Note that the chapter does not argue that there should be no Government intervention. Instead, interventions that were apt in a different economic setting may have lost their relevance in a transformed economy. Eliminating such instances of needless Government intervention will enable competitive markets and thereby spur investments and economic growth.
69Undermining Markets
Figure 3: Correlation of IEF with density of new business registration
0
5
10
15
20
25
40.0 45.0 50.0 55.0 60.0 65.0 70.0 75.0 80.0 85.0 90.0
New
Bus
ines
s Den
sity
(201
8)
Index of Economic Freedom (2019)
Source: Ease of Doing Business Database and Index of Economic Freedom accessed at https://www.heritage.org/index/Note: The new business entry density is defined as the number of newly registered corporations per 1,000 working-age people (those ages 15–64). Units of measurement are private, formal sector companies with limited liability.
Figure 2: Correlation of Indices of Economic Freedom with Per Capita GDP
India
30
40
50
60
70
80
90
100
0 20000 40000 60000 80000 100000 120000 140000
Inde
x of
Eco
nom
ic F
reed
om
GDP Per Capita (PPP)
India
20
30
40
50
60
70
80
90
0 20000 40000 60000 80000 100000 120000 140000
Glo
bal E
cono
mic
Fre
edom
Inde
x
GDP Per Capita (PPP)
Source: Index of Economic Freedom accessed at https://www.heritage.org/index/ and Global Economic Freedom Index accessed at https://www.fraserinstitute.org/
70 Economic Survey 2019-20 Volume 1
Figure 4: Correlation of Economic Freedom with Ease of Doing Business
0% 10% 20% 30% 40% 50% 60% 70% 80% 90%
Ease of Doing Business Overall ScoreEase of Starting a Business Score
Ease of Dealing with Construction Permits…Ease of Getting Electricity Score
Ease of Registering Property ScoreEase of Getting Credit Score
Protecting Minority Investors ScoreEase of Paying Taxes Score
Ease of Trading Across Borders ScoreEnforcing Contracts Score
Resolving Insolvency Score
Correlation with Index of Economic Freedom 2019
Source: Ease of Doing Business Database and Index of Economic Freedom accessed at https://www.heritage.org/index/
Figure 6: Correlation of Indices of Economic Freedom with Index of Innovation
Source: World Intellectual Property Organization (WIPO) database and Index of Economic Freedom accessed at https://www.heritage.org/index/
Figure 5: Correlation of Indices of Economic Freedom with Patents Applied and Patents Granted
Source: NBER patent data and Index of Economic Freedom accessed at https://www.heritage.org/index/
71Undermining Markets
patents granted in a country and the index of innovation respectively. Thus, it is clear that economic freedom affects several aspects of wealth creation significantly.
4.3 While there is a case for Government intervention when markets do not function properly, excessive intervention, especially when markets can do the job of enhancing citizens’ welfare perfectly well, stifles economic freedom. Government can affect markets either through direct participation (as a market maker or as a buyer or supplier of goods and services), or through indirect participation in private markets (for example, through regulation, taxation, subsidy or other influence). Any Government intervention of the first kind, however, affects the dynamic interaction of supply and demand in markets and thereby determination of ‘equilibrium’ market prices. When the price is too high, there is an excessive amount of the product
for sale compared to what people want. When the price is too low, it causes consumers to want more of the product than producers have available. In both cases, serious welfare loss results because not enough of the good is sold. The wasted chance to create both producer and consumer welfare from such sales leads to ‘deadweight loss’ - income that is lost forever. In addition to creating deadweight loss, an artificially high price transfers profits from consumers to producers and creates opportunities for rent seeking and an artificially low price leads to transfer of profits from producers to consumers and leads to low incentive to invest further and aggravates the scarcity of the product.
4.4 As we illustrate in this chapter, the Indian economy is replete with examples where Government intervenes even if there is no risk of market failure, and in fact, in some instances its intervention has created market
Box 1: Essential Commodities Act, 1955
Essential Commodities Act (ECA), 1955 was enacted to control the production, supply and distribution of, and trade and commerce in, certain goods considered as essential commodities. The Act itself does not lay out Rules and Regulations but allows the States to issue Control Orders related to dealer licensing, regulate stock limits, restrict movement of goods and requirements of compulsory purchases under the system of levy. The Act also provides for action to confiscate the stock seized; to suspend/cancel licences, if any and impose punishments like imprisonment. The Act also gives the power to fix price limits, and selling the particular commodities above the limit will attract penalties. Most of the powers under the Act have been delegated by the Central Government to the State Governments with the direction that they shall exercise these powers. Food and civil supply authorities in States execute the provisions of the Act. The major commodity groups included in the Act are
(i) Petroleum and its products, including petrol, diesel, kerosene, Naphtha, solvents etc(ii) Food stuff, including edible oil and seeds, vanaspati, pulses, sugarcane and its products like,
khandsari and sugar, rice paddy(iii) Raw Jute and jute textiles(iv) Drugs- prices of essential drugs are still controlled by the DPCO(v) Fertilisers- the Fertiliser Control Order prescribes restrictions on transfer and stock of fertilizers
apart from prices(vi) Onion and Potato(vii) Seeds of food crops, fruits and vegetables, cattle fodder, Jute seeds and Cotton seeds
72 Economic Survey 2019-20 Volume 1
Figure 7: Agricultural Market distortions due to ECA
Market distortions from
stock limits under ECA
Increased price volatility - reduced consumer
welfare - Opposite of what ECA is intended for
Reduced producer profit
Reduced incentive to invest in storage
Inhibits development of
vibrant commodity derivative markets
Weakens development of
Agricultural value-chain
failures. This may be partly due to the legacy of post-independence economic policies which the country followed. However, as the role of markets has been recognized globally, it is only natural that markets are allowed to work to enable quick wealth creation and thereby economic growth.
ESSENTIAL COMMODITIES ACT (ECA), 1955
4.5 The Essential Commodities Act (ECA), 1955 controls the production, supply and distribution of, and trade and commerce in, certain goods such as vegetables, pulses, edible oils, sugar etc., which are treated as essential commodities. Under the Act, the powers to implement the provisions of the Act are delegated to the States. When the price of any of these essential commodities rises, the regulator can impose stockholding limits on the commodity, restrict movement of goods, and mandate compulsory purchases under the system of levy. Consequently, all wholesalers, distributors, and retailers dealing in the product must reduce their inventories to comply with the
holding limit. The purported aim of this Act is to ensure affordability of essential commodities for the poor by restricting hoarding. It is an overarching legislation regulating agricultural marketing and production.
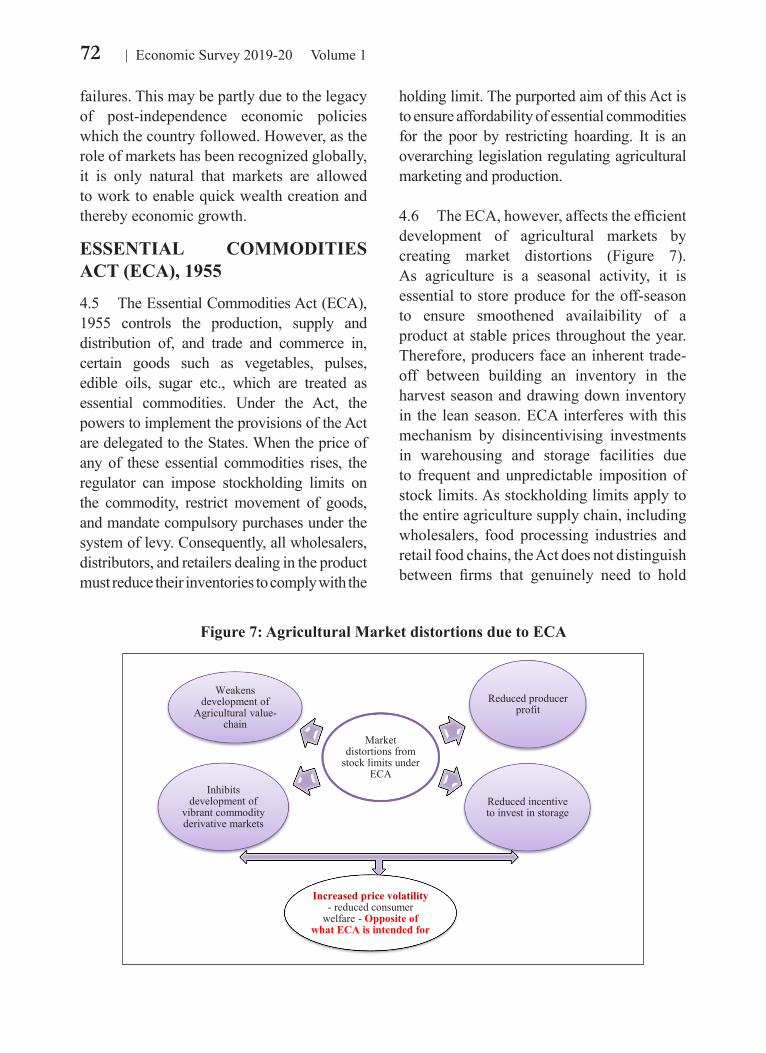
4.6 The ECA, however, affects the efficient development of agricultural markets by creating market distortions (Figure 7). As agriculture is a seasonal activity, it is essential to store produce for the off-season to ensure smoothened availaibility of a product at stable prices throughout the year. Therefore, producers face an inherent trade-off between building an inventory in the harvest season and drawing down inventory in the lean season. ECA interferes with this mechanism by disincentivising investments in warehousing and storage facilities due to frequent and unpredictable imposition of stock limits. As stockholding limits apply to the entire agriculture supply chain, including wholesalers, food processing industries and retail food chains, the Act does not distinguish between firms that genuinely need to hold
73Undermining Markets
stocks owing to the nature of their operations, and firms that might speculatively hoard stocks. Further, this reduces the effectiveness of free trade and flow of commodities from surplus areas to markets with higher demand. ECA also affects the commodity derivative markets as traders may not be able to deliver on the exchange platform the promised quantity, owing to stock limits. The Act distorts markets by increasing uncertainty and discouraging the entry of large private sector players into agricultural-marketing. These market distortions further aggravate the price volatility in agricultural commodities- the
opposite of what it is intended for.
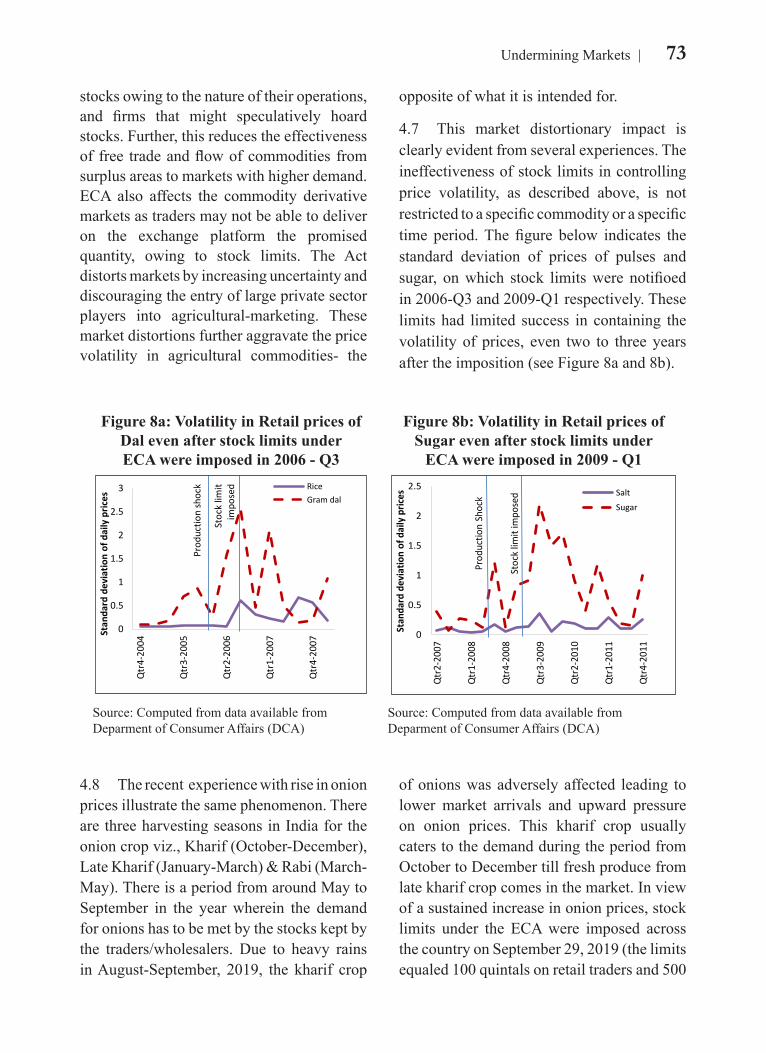
4.7 This market distortionary impact is clearly evident from several experiences. The ineffectiveness of stock limits in controlling price volatility, as described above, is not restricted to a specific commodity or a specific time period. The figure below indicates the standard deviation of prices of pulses and sugar, on which stock limits were notifioed in 2006-Q3 and 2009-Q1 respectively. These limits had limited success in containing the volatility of prices, even two to three years after the imposition (see Figure 8a and 8b).
Figure 8a: Volatility in Retail prices ofDal even after stock limits underECA were imposed in 2006 - Q3
Figure 8b: Volatility in Retail prices of Sugar even after stock limits under
ECA were imposed in 2009 - Q1
0
0.5
1
1.5
2
2.5
3
Qtr4
-200
4
Qtr3
-200
5
Qtr2
-200
6
Qtr1
-200
7
Qtr4
-200
7Stan
dard
dev
iatio
n of
dai
ly p
rices
RiceGram dal
Prod
uctio
n sh
ock
Stoc
k lim
it im
pose
d
0
0.5
1
1.5
2
2.5
Qtr2
-200
7
Qtr1
-200
8
Qtr4
-200
8
Qtr3
-200
9
Qtr2
-201
0
Qtr1
-201
1
Qtr4
-201
1
Stan
dard
dev
iatio
n of
dai
ly p
rices Salt
SugarSt
ock l
imit
impo
sed
Prod
uctio
nSh
ock
Source: Computed from data available from Deparment of Consumer Affairs (DCA)
Source: Computed from data available from Deparment of Consumer Affairs (DCA)
4.8 The recent experience with rise in onion prices illustrate the same phenomenon. There are three harvesting seasons in India for the onion crop viz., Kharif (October-December), Late Kharif (January-March) & Rabi (March-May). There is a period from around May to September in the year wherein the demand for onions has to be met by the stocks kept by the traders/wholesalers. Due to heavy rains in August-September, 2019, the kharif crop
of onions was adversely affected leading to lower market arrivals and upward pressure on onion prices. This kharif crop usually caters to the demand during the period from October to December till fresh produce from late kharif crop comes in the market. In view of a sustained increase in onion prices, stock limits under the ECA were imposed across the country on September 29, 2019 (the limits equaled 100 quintals on retail traders and 500
74 Economic Survey 2019-20 Volume 1
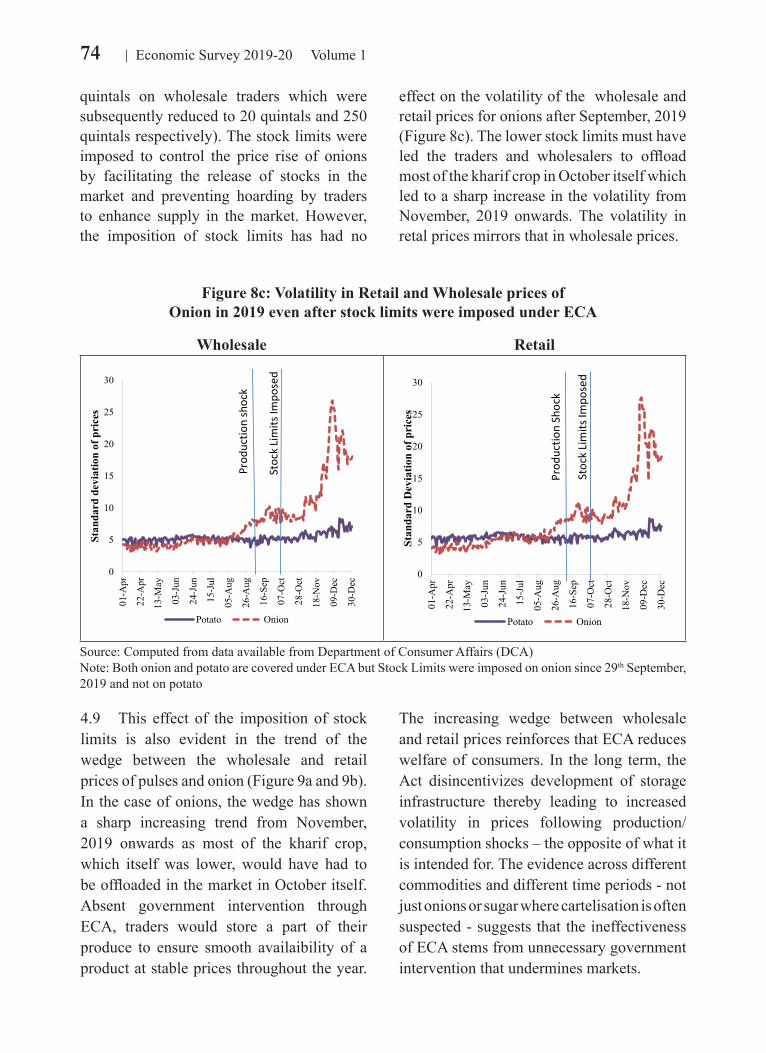
quintals on wholesale traders which were subsequently reduced to 20 quintals and 250 quintals respectively). The stock limits were imposed to control the price rise of onions by facilitating the release of stocks in the market and preventing hoarding by traders to enhance supply in the market. However, the imposition of stock limits has had no
effect on the volatility of the wholesale and retail prices for onions after September, 2019 (Figure 8c). The lower stock limits must have led the traders and wholesalers to offload most of the kharif crop in October itself which led to a sharp increase in the volatility from November, 2019 onwards. The volatility in retal prices mirrors that in wholesale prices.
Figure 8c: Volatility in Retail and Wholesale prices of Onion in 2019 even after stock limits were imposed under ECA
Wholesale Retail
0
5
10
15
20
25
30
01-A
pr
22-A
pr
13-M
ay
03-J
un
24-J
un
15-J
ul
05-A
ug
26-A
ug
16-S
ep
07-O
ct
28-O
ct
18-N
ov
09-D
ec
30-D
ec
Stan
dard
dev
iatio
n of
pri
ces
Potato Onion
Prod
uctio
n sh
ock
Stoc
k Lim
its Im
pose
d
0
5
10
15
20
25
30
01-A
pr
22-A
pr
13-M
ay
03-J
un
24-J
un
15-J
ul
05-A
ug
26-A
ug
16-S
ep
07-O
ct
28-O
ct
18-N
ov
09-D
ec
30-D
ec
Stan
dard
Dev
iatio
n of
pri
ces
Potato Onion
Prod
uctio
n Sh
ock
Stoc
k Lim
its Im
pose
d
Source: Computed from data available from Department of Consumer Affairs (DCA)Note: Both onion and potato are covered under ECA but Stock Limits were imposed on onion since 29th September, 2019 and not on potato
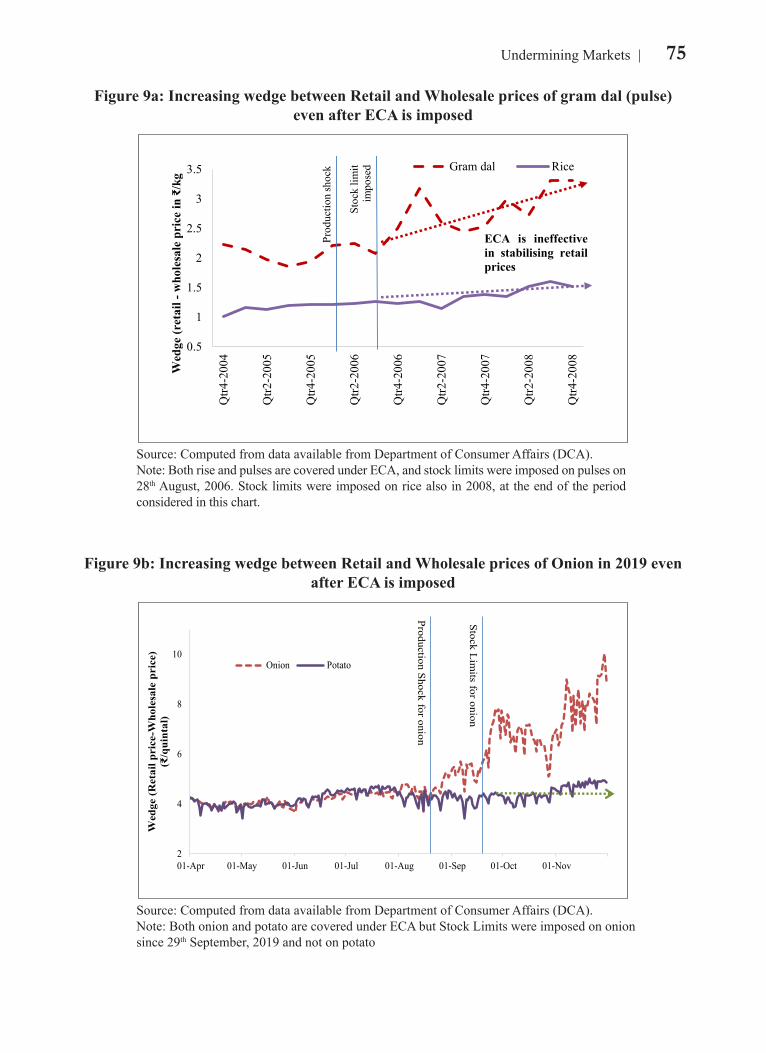
4.9 This effect of the imposition of stock limits is also evident in the trend of the wedge between the wholesale and retail prices of pulses and onion (Figure 9a and 9b). In the case of onions, the wedge has shown a sharp increasing trend from November, 2019 onwards as most of the kharif crop, which itself was lower, would have had to be offloaded in the market in October itself. Absent government intervention through ECA, traders would store a part of their produce to ensure smooth availaibility of a product at stable prices throughout the year.
The increasing wedge between wholesale and retail prices reinforces that ECA reduces welfare of consumers. In the long term, the Act disincentivizes development of storage infrastructure thereby leading to increased volatility in prices following production/consumption shocks – the opposite of what it is intended for. The evidence across different commodities and different time periods - not just onions or sugar where cartelisation is often suspected - suggests that the ineffectiveness of ECA stems from unnecessary government intervention that undermines markets.
75Undermining Markets
Figure 9a: Increasing wedge between Retail and Wholesale prices of gram dal (pulse) even after ECA is imposed
0.5
1
1.5
2
2.5
3
3.5
Qtr4
-200
4
Qtr2
-200
5
Qtr4
-200
5
Qtr2
-200
6
Qtr4
-200
6
Qtr2
-200
7
Qtr4
-200
7
Qtr2
-200
8
Qtr4
-200
8
Wed
ge (r
etai
l -w
hole
sale
pri
ce in
₹/k
gGram dal Rice
Prod
uctio
n sh
ock
Stoc
k lim
itim
pose
d
ECA is ineffectivein stabilising retailprices
Source: Computed from data available from Department of Consumer Affairs (DCA).Note: Both rise and pulses are covered under ECA, and stock limits were imposed on pulses on 28th August, 2006. Stock limits were imposed on rice also in 2008, at the end of the period considered in this chart.
Figure 9b: Increasing wedge between Retail and Wholesale prices of Onion in 2019 even after ECA is imposed
2
4
6
8
10
01-Apr 01-May 01-Jun 01-Jul 01-Aug 01-Sep 01-Oct 01-Nov
Wed
ge (R
etai
l pri
ce-W
hole
sale
pri
ce)
(₹/q
uint
al)
Onion Potato
Production Shock for onion
Stock Limits for onion
Source: Computed from data available from Department of Consumer Affairs (DCA).Note: Both onion and potato are covered under ECA but Stock Limits were imposed on onion since 29th September, 2019 and not on potato
76 Economic Survey 2019-20 Volume 1
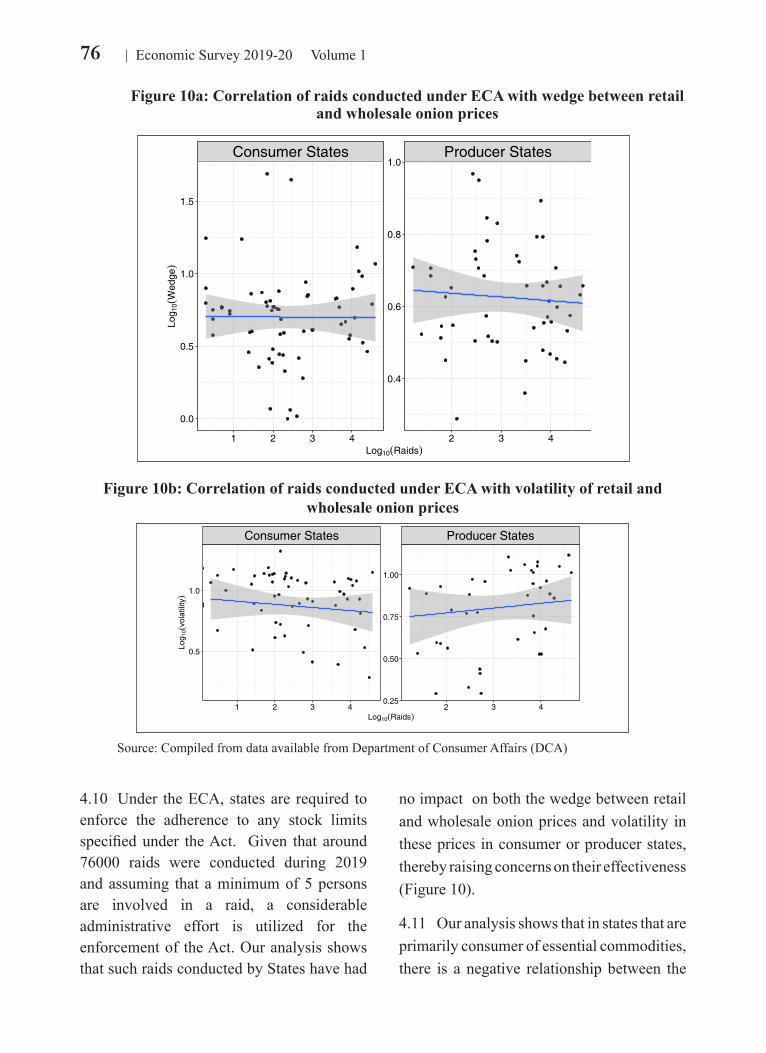
4.10 Under the ECA, states are required to enforce the adherence to any stock limits specified under the Act. Given that around 76000 raids were conducted during 2019 and assuming that a minimum of 5 persons are involved in a raid, a considerable administrative effort is utilized for the enforcement of the Act. Our analysis shows that such raids conducted by States have had
no impact on both the wedge between retail and wholesale onion prices and volatility in these prices in consumer or producer states, thereby raising concerns on their effectiveness (Figure 10).
4.11 Our analysis shows that in states that are primarily consumer of essential commodities, there is a negative relationship between the
Figure 10a: Correlation of raids conducted under ECA with wedge between retail and wholesale onion prices
Consumer States Producer States
1 2 3 4 2 3 4
0.4
0.6
0.8
1.0
0.0
0.5
1.0
1.5
Log10(Raids)
Log 1
0(Wed
ge)
Figure 10b: Correlation of raids conducted under ECA with volatility of retail and wholesale onion prices
Consumer States Producer States
1 2 3 4 2 3 40.25
0.50
0.75
1.00
0.5
1.0
Log10(Raids)
Log 1
0(vol
atili
ty)
Source: Compiled from data available from Department of Consumer Affairs (DCA)
77Undermining Markets
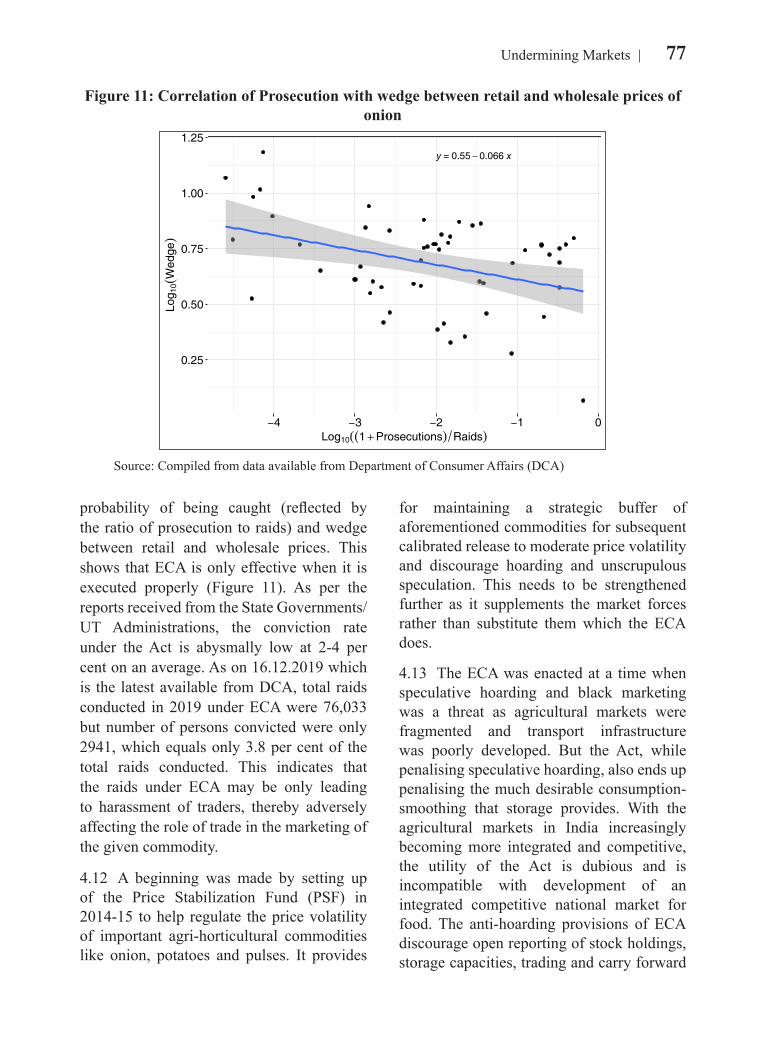
probability of being caught (reflected by the ratio of prosecution to raids) and wedge between retail and wholesale prices. This shows that ECA is only effective when it is executed properly (Figure 11). As per the reports received from the State Governments/UT Administrations, the conviction rate under the Act is abysmally low at 2-4 per cent on an average. As on 16.12.2019 which is the latest available from DCA, total raids conducted in 2019 under ECA were 76,033 but number of persons convicted were only 2941, which equals only 3.8 per cent of the total raids conducted. This indicates that the raids under ECA may be only leading to harassment of traders, thereby adversely affecting the role of trade in the marketing of the given commodity.
4.12 A beginning was made by setting up of the Price Stabilization Fund (PSF) in 2014-15 to help regulate the price volatility of important agri-horticultural commodities like onion, potatoes and pulses. It provides
for maintaining a strategic buffer of aforementioned commodities for subsequent calibrated release to moderate price volatility and discourage hoarding and unscrupulous speculation. This needs to be strengthened further as it supplements the market forces rather than substitute them which the ECA does.
4.13 The ECA was enacted at a time when speculative hoarding and black marketing was a threat as agricultural markets were fragmented and transport infrastructure was poorly developed. But the Act, while penalising speculative hoarding, also ends up penalising the much desirable consumption-smoothing that storage provides. With the agricultural markets in India increasingly becoming more integrated and competitive, the utility of the Act is dubious and is incompatible with development of an integrated competitive national market for food. The anti-hoarding provisions of ECA discourage open reporting of stock holdings, storage capacities, trading and carry forward
Figure 11: Correlation of Prosecution with wedge between retail and wholesale prices of onion
y = 0.55 0.066 x
0.25
0.50
0.75
1.00
1.25
−4 −3 −2 −1 0Log10 1 Prosecutions Raids
Log 1
0W
edge
Source: Compiled from data available from Department of Consumer Affairs (DCA)
78 Economic Survey 2019-20 Volume 1
positions. There is no aggregated data of the total private storage capacity available in the country, which would enable policymakers to assess the impact of any production shocks on the prices. Besides discouraging investment in modern methods of storage and in market intelligence, the lack of information on trades makes it harder for market participants to make accurate forecasts for the future. Supporting development of commodity futures markets would help efficient discovery of market expected future prices, which can provide a better basis for private storage decisions and avoid ‘peaks’ and ‘troughs’ in prices. Development of effective forecasting mechanisms, stable trade policies, and increasing integration of agricultural markets can serve the purpose of stabilising prices of agricultural markets more efficiently than government fiat imposed through ECA.
DRUG PRICE CONTROLS UNDER ECA4.14 Given the important task of ensuring access to essential lifesaving drugs and to avoid poor households from falling into poverty, Governments often resort to price controls for drugs. In India, the Government has historically relied on price controls to regulate the prices of pharmaceutical drugs through the National Pharmaceutical Pricing Authority (NPPA) and Drug (Prices Control) Order (DPCO). The National List of Essential Medicines (NLEM), prepared by Ministry of Health and Family Welfare, is a list of medicines considered essential and high priority for India’s health needs. It is based on aspects like prevalence of disease in the population, safety and efficacy of the medicine, and current affordability. DPCOs are issued by the Government, in exercise of the powers conferred under section 3 of the ECA to ensure that the medicines listed under NELM are available at a reasonable price to the general public.
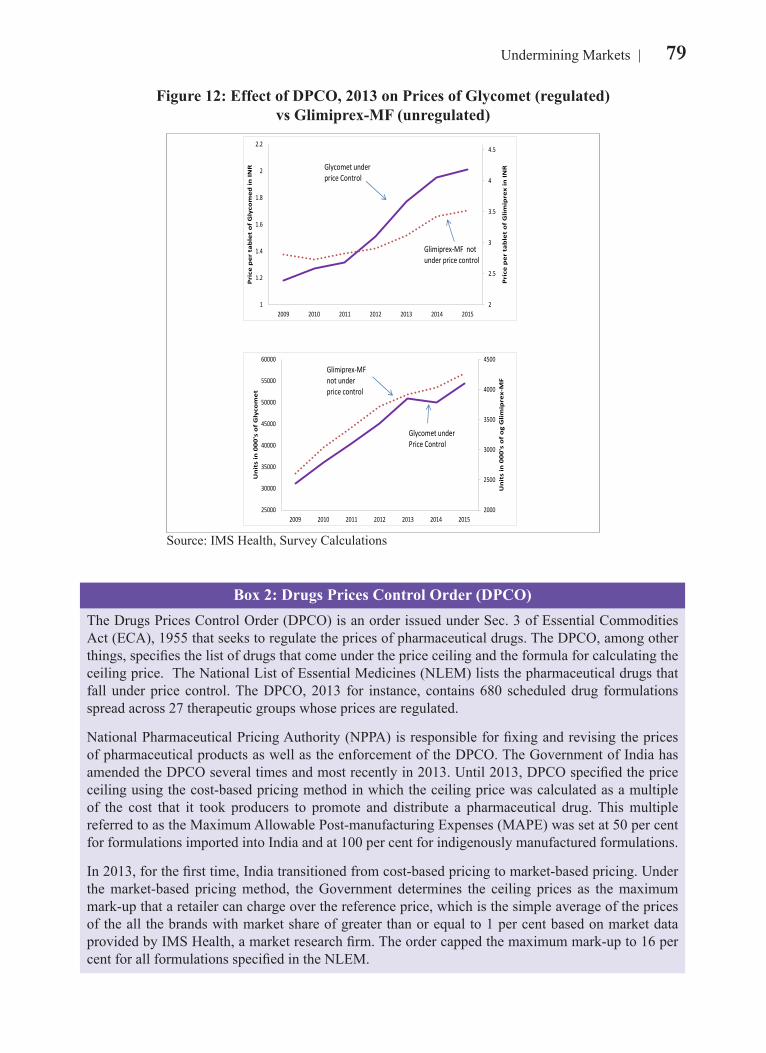
4.15 To examine carefully the impact of the DPCO order on the price and quantity of essential drugs, we undertake the following comparison. Consider Glycomet (Metformin) and Glimiprex-MF (Glimepiride+Metformin) both of which are used for controlling high blood sugar. Glycomet came under price control in DPCO, 2013 while Glimiprex-MF did not. Therefore, a comparison of the before-after change in price and quantity consumed for Glycomet vis-à-vis that for Glimiprex-MF controls for the effect of all other confounding factors such as demand and supply of drugs in this category. This comparison, therefore, estimates the pure effect of the DPCO order. Figure 12 shows that the price of Glycomet actually increased more than that for Glimiprex-MF after DPCO, 2013. It, however, had no effect on the quantity consumed, which is consistent with pharmaceutical drugs being an essential commodity for which the demand is inelastic, or insensitive, to the changes in price.
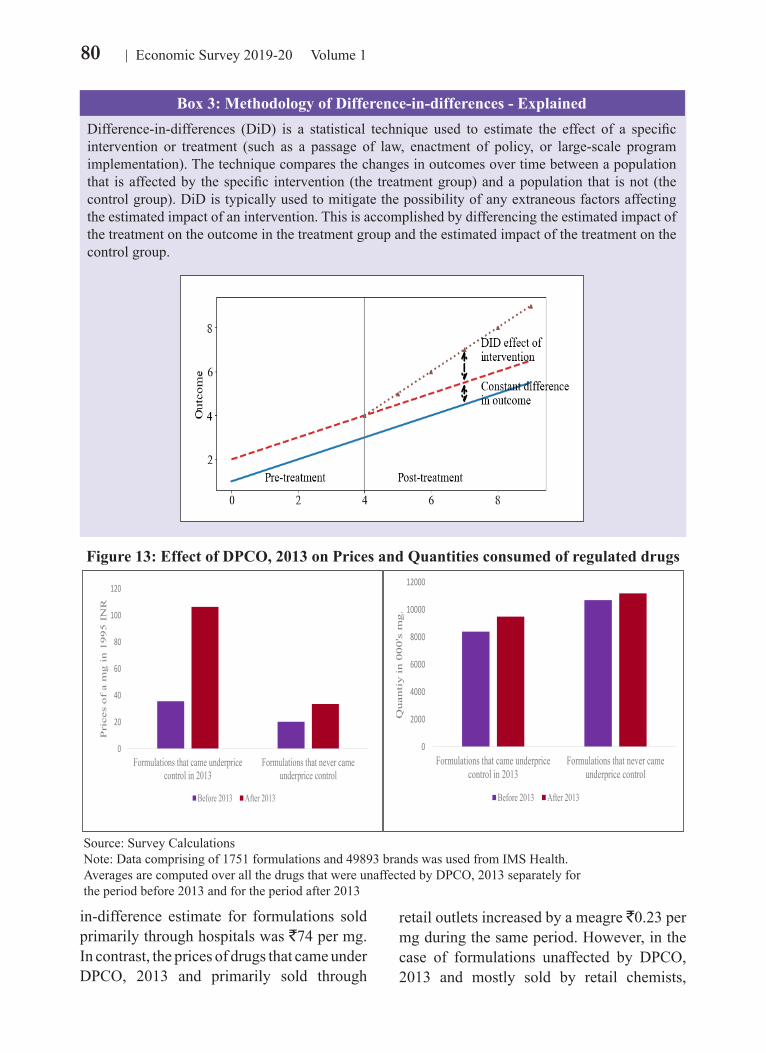
4.16 Our estimates also show that the prices of drugs that came under DPCO, 2013 increased on average by ` 71 per mg of the active ingredient. For drugs that were unaffected by DPCO, 2013, the prices increased by ` 13 per mg of the active ingredient. The difference-in-difference estimate in prices was 58 per mg of the active ingredient, which was statistically significant at 5 per cent (Figure 13). The difference-in-difference in quantities was statistically indistinguishable from zero.
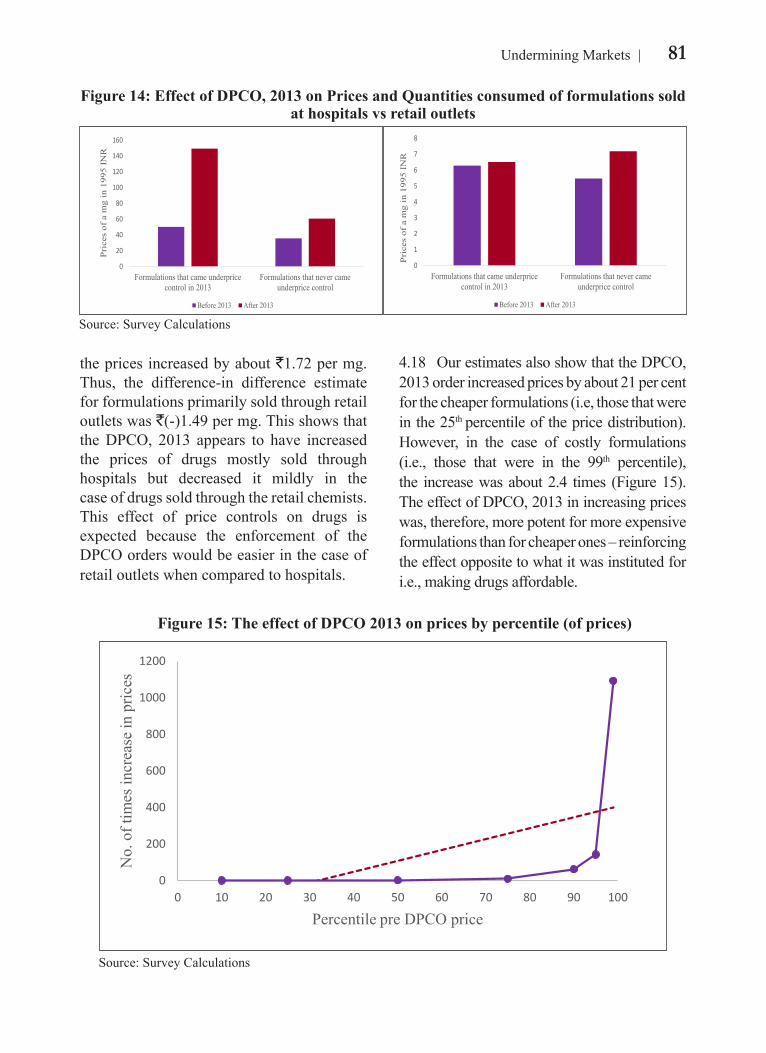
4.17 To parse out the effect of the DPCO order, we separate formulations by those that are sold primarily through retail outlets and those that are primarily sold through hospitals. The prices of formulations that came under DPCO, 2013 and that were mostly sold at hospitals increased by `99 per mg. In the case of formulations mostly sold in hospitals that were unaffected by DPCO, 2013, the prices increased by only 25 per mg (Figure 14). Thus, the difference-
79Undermining Markets
Box 2: Drugs Prices Control Order (DPCO)The Drugs Prices Control Order (DPCO) is an order issued under Sec. 3 of Essential Commodities Act (ECA), 1955 that seeks to regulate the prices of pharmaceutical drugs. The DPCO, among other things, specifies the list of drugs that come under the price ceiling and the formula for calculating the ceiling price. The National List of Essential Medicines (NLEM) lists the pharmaceutical drugs that fall under price control. The DPCO, 2013 for instance, contains 680 scheduled drug formulations spread across 27 therapeutic groups whose prices are regulated.
National Pharmaceutical Pricing Authority (NPPA) is responsible for fixing and revising the prices of pharmaceutical products as well as the enforcement of the DPCO. The Government of India has amended the DPCO several times and most recently in 2013. Until 2013, DPCO specified the price ceiling using the cost-based pricing method in which the ceiling price was calculated as a multiple of the cost that it took producers to promote and distribute a pharmaceutical drug. This multiple referred to as the Maximum Allowable Post-manufacturing Expenses (MAPE) was set at 50 per cent for formulations imported into India and at 100 per cent for indigenously manufactured formulations.
In 2013, for the first time, India transitioned from cost-based pricing to market-based pricing. Under the market-based pricing method, the Government determines the ceiling prices as the maximum mark-up that a retailer can charge over the reference price, which is the simple average of the prices of the all the brands with market share of greater than or equal to 1 per cent based on market data provided by IMS Health, a market research firm. The order capped the maximum mark-up to 16 per cent for all formulations specified in the NLEM.
Figure 12: Effect of DPCO, 2013 on Prices of Glycomet (regulated)vs Glimiprex-MF (unregulated)
2
2.5
3
3.5
4
4.5
1
1.2
1.4
1.6
1.8
2
2.2
2009 2010 2011 2012 2013 2014 2015
Pri
ce p
er t
able
t o
f G
limip
rex
in IN
R
Pri
ce p
er t
able
t o
f G
lyco
med
in IN
R Glycomet under
price Control
Glimiprex-MF not under price control
2000
2500
3000
3500
4000
4500
25000
30000
35000
40000
45000
50000
55000
60000
2009 2010 2011 2012 2013 2014 2015
Un
its
in 0
00's
of
og
Glim
ipre
x-M
F
Un
its
in 0
00's
of
Gly
com
et
Glycomet under Price Control
Glimiprex-MF not under price control
Source: IMS Health, Survey Calculations
80 Economic Survey 2019-20 Volume 1
Figure 13: Effect of DPCO, 2013 on Prices and Quantities consumed of regulated drugs
Source: Survey CalculationsNote: Data comprising of 1751 formulations and 49893 brands was used from IMS Health. Averages are computed over all the drugs that were unaffected by DPCO, 2013 separately for the period before 2013 and for the period after 2013
in-difference estimate for formulations sold primarily through hospitals was `74 per mg. In contrast, the prices of drugs that came under DPCO, 2013 and primarily sold through
retail outlets increased by a meagre `0.23 per mg during the same period. However, in the case of formulations unaffected by DPCO, 2013 and mostly sold by retail chemists,
0
20
40
60
80
100
120
Formulations that came underpricecontrol in 2013
Formulations that never cameunderprice control
Pri
ces
of
a m
g i
n 1
995 I
NR
Before 2013 After 2013
0
2000
4000
6000
8000
10000
12000
Formulations that came underpricecontrol in 2013
Formulations that never cameunderprice control
Qu
anti
y i
n 0
00
's m
g.
Before 2013 After 2013
Box 3: Methodology of Difference-in-differences - ExplainedDifference-in-differences (DiD) is a statistical technique used to estimate the effect of a specific intervention or treatment (such as a passage of law, enactment of policy, or large-scale program implementation). The technique compares the changes in outcomes over time between a population that is affected by the specific intervention (the treatment group) and a population that is not (the control group). DiD is typically used to mitigate the possibility of any extraneous factors affecting the estimated impact of an intervention. This is accomplished by differencing the estimated impact of the treatment on the outcome in the treatment group and the estimated impact of the treatment on the control group.
81Undermining Markets
the prices increased by about `1.72 per mg. Thus, the difference-in difference estimate for formulations primarily sold through retail outlets was `(-)1.49 per mg. This shows that the DPCO, 2013 appears to have increased the prices of drugs mostly sold through hospitals but decreased it mildly in the case of drugs sold through the retail chemists. This effect of price controls on drugs is expected because the enforcement of the DPCO orders would be easier in the case of retail outlets when compared to hospitals.
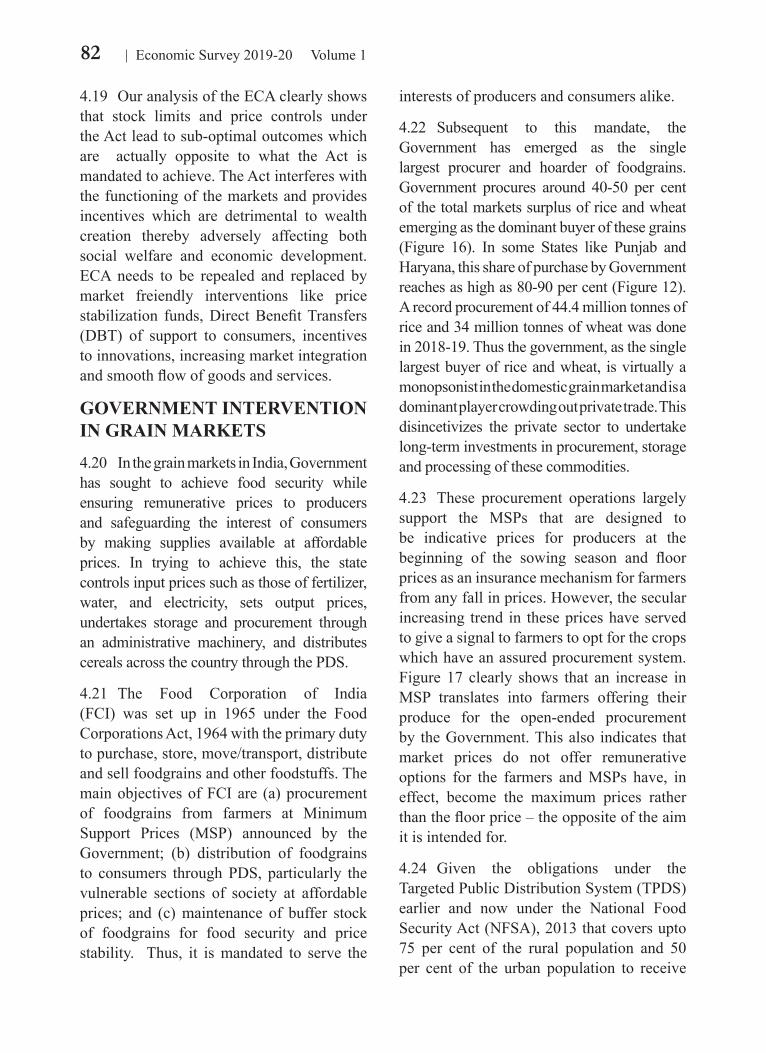
4.18 Our estimates also show that the DPCO, 2013 order increased prices by about 21 per cent for the cheaper formulations (i.e, those that were in the 25th percentile of the price distribution). However, in the case of costly formulations (i.e., those that were in the 99th percentile), the increase was about 2.4 times (Figure 15). The effect of DPCO, 2013 in increasing prices was, therefore, more potent for more expensive formulations than for cheaper ones – reinforcing the effect opposite to what it was instituted for i.e., making drugs affordable.
Figure 14: Effect of DPCO, 2013 on Prices and Quantities consumed of formulations sold at hospitals vs retail outlets
Figure 15: The effect of DPCO 2013 on prices by percentile (of prices)
0
200
400
600
800
1000
1200
0 10 20 30 40 50 60 70 80 90 100
No.
of t
imes
incr
ease
in p
rices
Percentile pre DPCO price
Source: Survey Calculations
0
20
40
60
80
100
120
140
160
Formulations that came underpricecontrol in 2013
Formulations that never cameunderprice control
Pri
ces
of a
mg
in 1
995
INR
Before 2013 After 2013
0
1
2
3
4
5
6
7
8
Formulations that came underpricecontrol in 2013
Formulations that never cameunderprice control
Pri
ces
of a
mg
in 1
995
INR
Before 2013 After 2013
Source: Survey Calculations
82 Economic Survey 2019-20 Volume 1
4.19 Our analysis of the ECA clearly shows that stock limits and price controls under the Act lead to sub-optimal outcomes which are actually opposite to what the Act is mandated to achieve. The Act interferes with the functioning of the markets and provides incentives which are detrimental to wealth creation thereby adversely affecting both social welfare and economic development. ECA needs to be repealed and replaced by market freiendly interventions like price stabilization funds, Direct Benefit Transfers (DBT) of support to consumers, incentives to innovations, increasing market integration and smooth flow of goods and services.
GOVERNMENT INTERVENTION IN GRAIN MARKETS
4.20 In the grain markets in India, Government has sought to achieve food security while ensuring remunerative prices to producers and safeguarding the interest of consumers by making supplies available at affordable prices. In trying to achieve this, the state controls input prices such as those of fertilizer, water, and electricity, sets output prices, undertakes storage and procurement through an administrative machinery, and distributes cereals across the country through the PDS.
4.21 The Food Corporation of India (FCI) was set up in 1965 under the Food Corporations Act, 1964 with the primary duty to purchase, store, move/transport, distribute and sell foodgrains and other foodstuffs. The main objectives of FCI are (a) procurement of foodgrains from farmers at Minimum Support Prices (MSP) announced by the Government; (b) distribution of foodgrains to consumers through PDS, particularly the vulnerable sections of society at affordable prices; and (c) maintenance of buffer stock of foodgrains for food security and price stability. Thus, it is mandated to serve the
interests of producers and consumers alike.
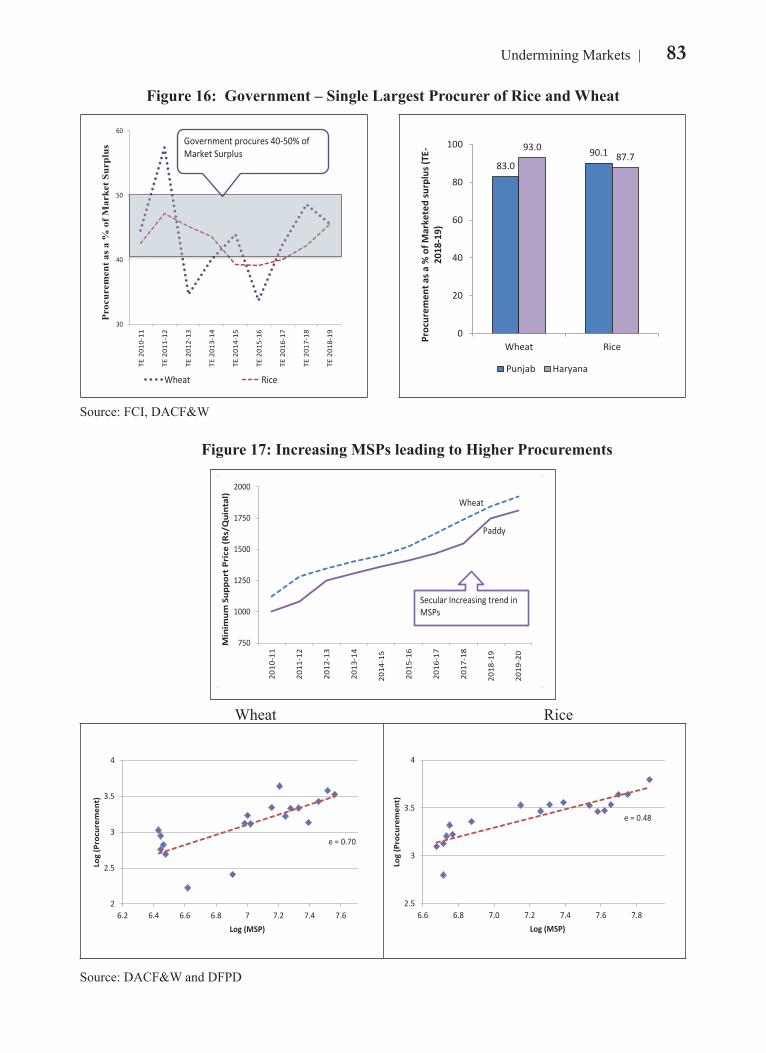
4.22 Subsequent to this mandate, the Government has emerged as the single largest procurer and hoarder of foodgrains. Government procures around 40-50 per cent of the total markets surplus of rice and wheat emerging as the dominant buyer of these grains (Figure 16). In some States like Punjab and Haryana, this share of purchase by Government reaches as high as 80-90 per cent (Figure 12). A record procurement of 44.4 million tonnes of rice and 34 million tonnes of wheat was done in 2018-19. Thus the government, as the single largest buyer of rice and wheat, is virtually a monopsonist in the domestic grain market and is a dominant player crowding out private trade. This disincetivizes the private sector to undertake long-term investments in procurement, storage and processing of these commodities.
4.23 These procurement operations largely support the MSPs that are designed to be indicative prices for producers at the beginning of the sowing season and floor prices as an insurance mechanism for farmers from any fall in prices. However, the secular increasing trend in these prices have served to give a signal to farmers to opt for the crops which have an assured procurement system. Figure 17 clearly shows that an increase in MSP translates into farmers offering their produce for the open-ended procurement by the Government. This also indicates that market prices do not offer remunerative options for the farmers and MSPs have, in effect, become the maximum prices rather than the floor price – the opposite of the aim it is intended for.
4.24 Given the obligations under the Targeted Public Distribution System (TPDS) earlier and now under the National Food Security Act (NFSA), 2013 that covers upto 75 per cent of the rural population and 50 per cent of the urban population to receive
83Undermining Markets
Figure 16: Government – Single Largest Procurer of Rice and Wheat
30
40
50
60TE
201
0-11
TE 2
011-
12
TE 2
012-
13
TE 2
013-
14
TE 2
014-
15
TE 2
015-
16
TE 2
016-
17
TE 2
017-
18
TE 2
018-
19
Pro
cure
men
t as
a %
of M
arke
t Sur
plus
Wheat Rice
Government procures 40-50% of Market Surplus
83.090.193.0
87.7
0
20
40
60
80
100
Wheat Rice
Proc
urem
ent a
s a %
of M
arke
ted
surp
lus (
TE-
2018
-19)
Punjab Haryana
Source: FCI, DACF&W
Figure 17: Increasing MSPs leading to Higher Procurements
750
1000
1250
1500
1750
2000
2010
-11
2011
-12
2012
-13
2013
-14
2014
-15
2015
-16
2016
-17
2017
-18
2018
-19
2019
-20
Min
imum
Sup
port
Pric
e (R
s/Q
uint
al)
Paddy
Wheat
Secular Increasing trend in MSPs
Wheat Rice
e = 0.70
2
2.5
3
3.5
4
6.2 6.4 6.6 6.8 7 7.2 7.4 7.6 7.8
Log
(Pro
cure
men
t)
Log (MSP)
e = 0.48
2.5
3
3.5
4
6.6 6.8 7.0 7.2 7.4 7.6 7.8 8.0
Log
(Pro
cure
men
t)
Log (MSP)
Source: DACF&W and DFPD
84 Economic Survey 2019-20 Volume 1
Figure 18: Trend in Buffer Stocks with FCI
0
10
20
30
40
50
60
70
80
90
2008 2009 2010 2011 2012 2013 2014 2015 2016 2017 2018 2019
Mill
ion
Tonn
es
Wheat
Rice
NORM
74.380.5
Source: FCINote: Stocks and norms are as on 1st July of the year
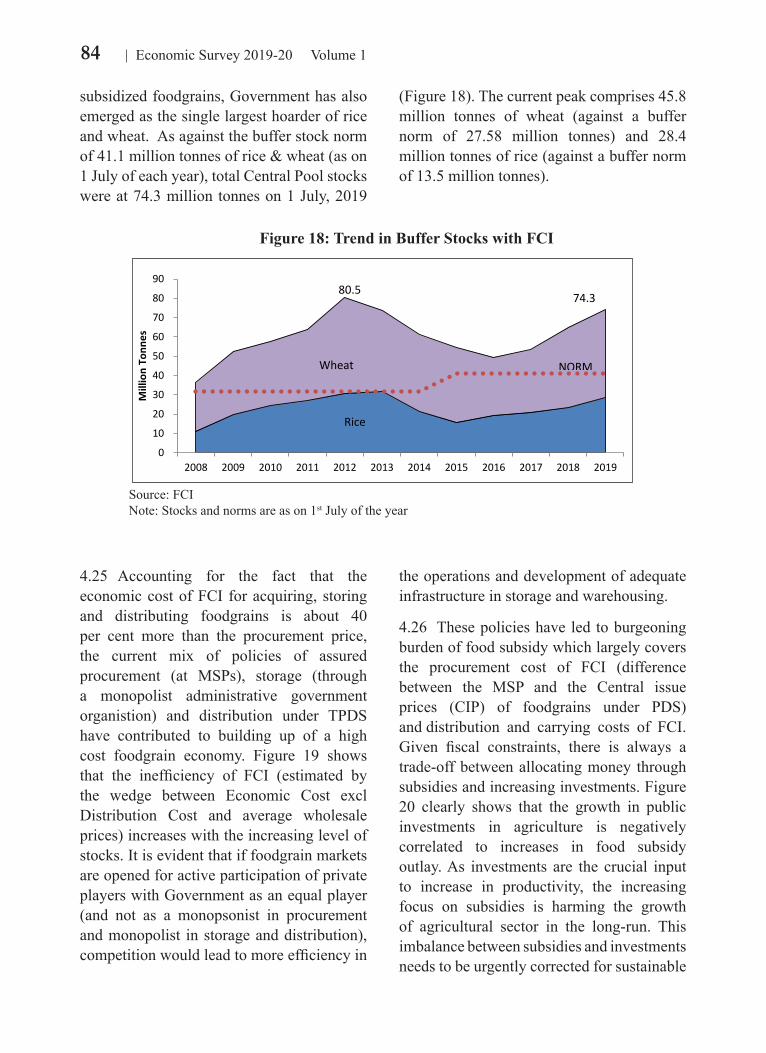
subsidized foodgrains, Government has also emerged as the single largest hoarder of rice and wheat. As against the buffer stock norm of 41.1 million tonnes of rice & wheat (as on 1 July of each year), total Central Pool stocks were at 74.3 million tonnes on 1 July, 2019
(Figure 18). The current peak comprises 45.8 million tonnes of wheat (against a buffer norm of 27.58 million tonnes) and 28.4 million tonnes of rice (against a buffer norm of 13.5 million tonnes).
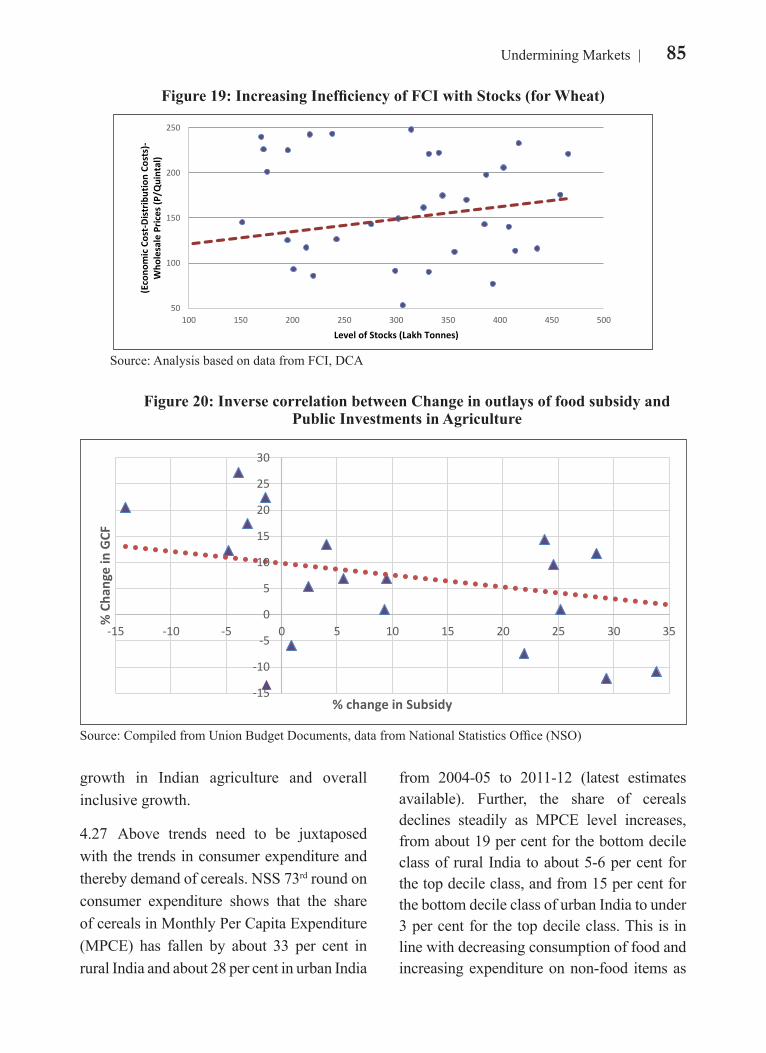
4.25 Accounting for the fact that the economic cost of FCI for acquiring, storing and distributing foodgrains is about 40 per cent more than the procurement price, the current mix of policies of assured procurement (at MSPs), storage (through a monopolist administrative government organistion) and distribution under TPDS have contributed to building up of a high cost foodgrain economy. Figure 19 shows that the inefficiency of FCI (estimated by the wedge between Economic Cost excl Distribution Cost and average wholesale prices) increases with the increasing level of stocks. It is evident that if foodgrain markets are opened for active participation of private players with Government as an equal player (and not as a monopsonist in procurement and monopolist in storage and distribution), competition would lead to more efficiency in
the operations and development of adequate infrastructure in storage and warehousing.
4.26 These policies have led to burgeoning burden of food subsidy which largely covers the procurement cost of FCI (difference between the MSP and the Central issue prices (CIP) of foodgrains under PDS) and distribution and carrying costs of FCI. Given fiscal constraints, there is always a trade-off between allocating money through subsidies and increasing investments. Figure 20 clearly shows that the growth in public investments in agriculture is negatively correlated to increases in food subsidy outlay. As investments are the crucial input to increase in productivity, the increasing focus on subsidies is harming the growth of agricultural sector in the long-run. This imbalance between subsidies and investments needs to be urgently corrected for sustainable
85Undermining Markets
Figure 19: Increasing Inefficiency of FCI with Stocks (for Wheat)
50
100
150
200
250
100 150 200 250 300 350 400 450 500
(Eco
nom
ic Co
st-D
istrib
utio
n Co
sts)
-W
hole
sale
Pric
es (P
/Qui
ntal
)
Level of Stocks (Lakh Tonnes)
Source: Analysis based on data from FCI, DCA
Figure 20: Inverse correlation between Change in outlays of food subsidy and Public Investments in Agriculture
-15
-10
-5
0
5
10
15
20
25
30
-15 -10 -5 0 5 10 15 20 25 30 35
% C
hang
e in
GCF
% change in Subsidy
Source: Compiled from Union Budget Documents, data from National Statistics Office (NSO)
growth in Indian agriculture and overall inclusive growth.
4.27 Above trends need to be juxtaposed with the trends in consumer expenditure and thereby demand of cereals. NSS 73rd round on consumer expenditure shows that the share of cereals in Monthly Per Capita Expenditure (MPCE) has fallen by about 33 per cent in rural India and about 28 per cent in urban India
from 2004-05 to 2011-12 (latest estimates available). Further, the share of cereals declines steadily as MPCE level increases, from about 19 per cent for the bottom decile class of rural India to about 5-6 per cent for the top decile class, and from 15 per cent for the bottom decile class of urban India to under 3 per cent for the top decile class. This is in line with decreasing consumption of food and increasing expenditure on non-food items as
86 Economic Survey 2019-20 Volume 1
Figure 21: Trends in Consumption and Production of Cereals in India
Source: DACF&W and NSS 68th RoundNote: Cereals consist of Rice, Wheat and Coarse cereals wherein Rice and Wheat comprise more than 80 per cent of total production of cereals Data for Consumption is available only till 2011-12
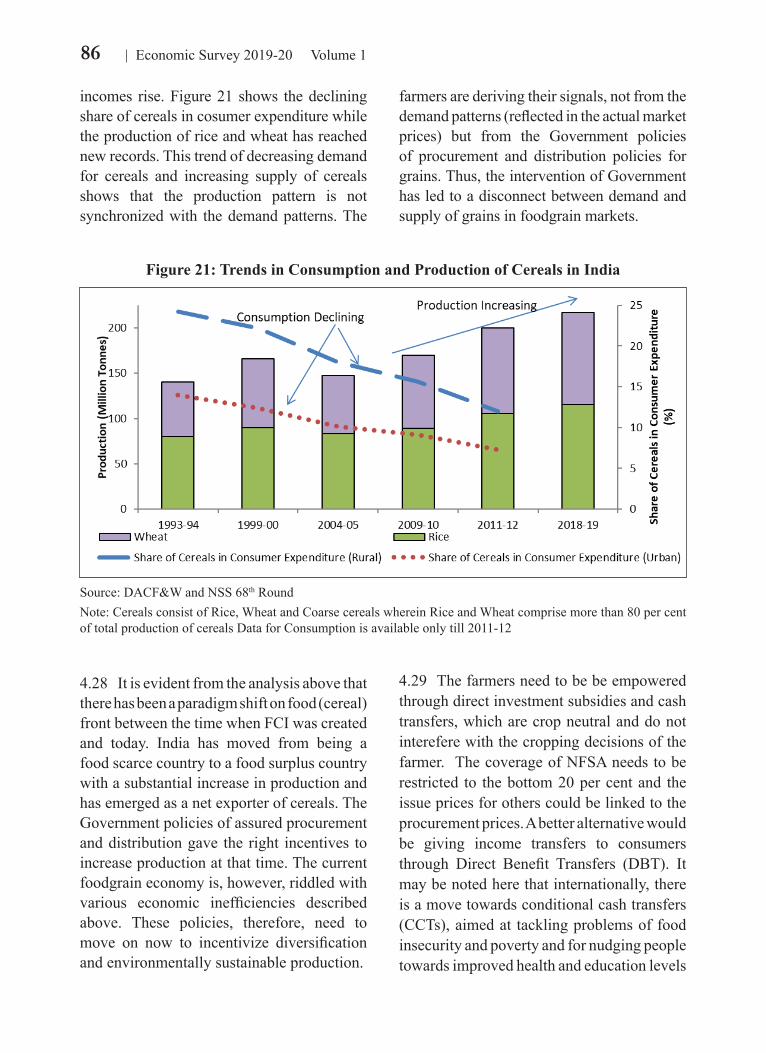
incomes rise. Figure 21 shows the declining share of cereals in cosumer expenditure while the production of rice and wheat has reached new records. This trend of decreasing demand for cereals and increasing supply of cereals shows that the production pattern is not synchronized with the demand patterns. The
farmers are deriving their signals, not from the demand patterns (reflected in the actual market prices) but from the Government policies of procurement and distribution policies for grains. Thus, the intervention of Government has led to a disconnect between demand and supply of grains in foodgrain markets.
4.28 It is evident from the analysis above that there has been a paradigm shift on food (cereal) front between the time when FCI was created and today. India has moved from being a food scarce country to a food surplus country with a substantial increase in production and has emerged as a net exporter of cereals. The Government policies of assured procurement and distribution gave the right incentives to increase production at that time. The current foodgrain economy is, however, riddled with various economic inefficiencies described above. These policies, therefore, need to move on now to incentivize diversification and environmentally sustainable production.
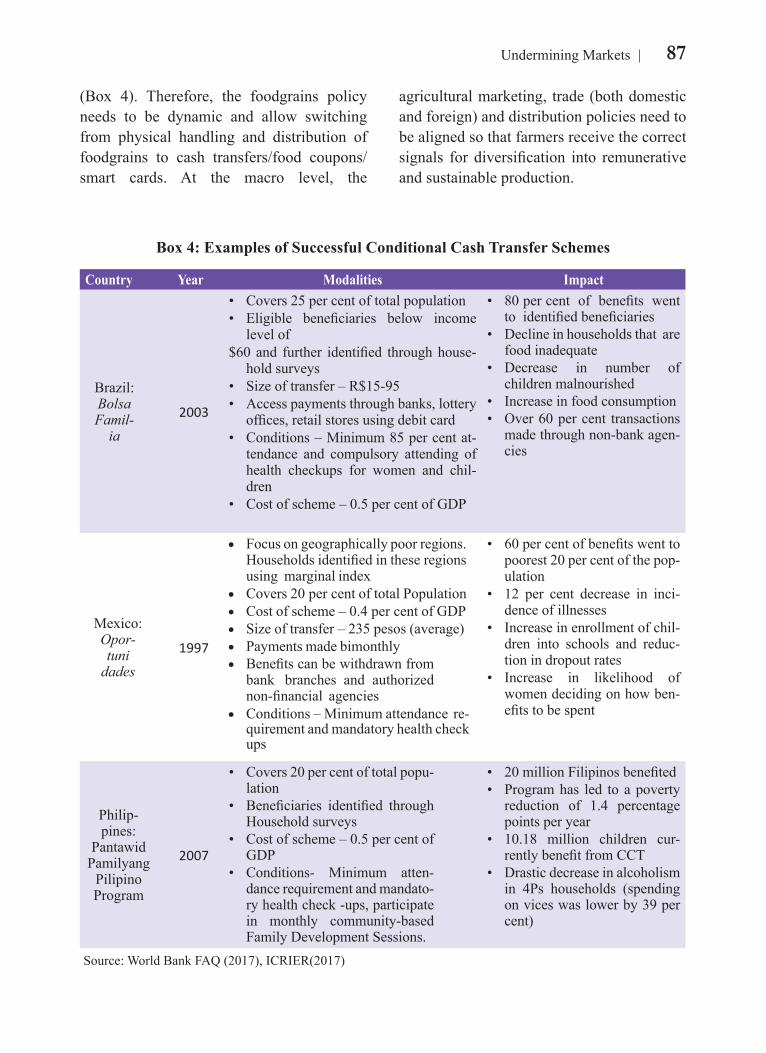
4.29 The farmers need to be be empowered through direct investment subsidies and cash transfers, which are crop neutral and do not interefere with the cropping decisions of the farmer. The coverage of NFSA needs to be restricted to the bottom 20 per cent and the issue prices for others could be linked to the procurement prices. A better alternative would be giving income transfers to consumers through Direct Benefit Transfers (DBT). It may be noted here that internationally, there is a move towards conditional cash transfers (CCTs), aimed at tackling problems of food insecurity and poverty and for nudging people towards improved health and education levels
87Undermining Markets
Box 4: Examples of Successful Conditional Cash Transfer Schemes
Country Year Modalities Impact
Brazil: Bolsa Famil-
ia2003
• Covers 25 per cent of total population• Eligible beneficiaries below income
level of$60 and further identified through house-
hold surveys• Size of transfer – R$15-95• Access payments through banks, lottery
offices, retail stores using debit card• Conditions – Minimum 85 per cent at-
tendance and compulsory attending of health checkups for women and chil-dren
• Cost of scheme – 0.5 per cent of GDP
• 80 per cent of benefits went to identified beneficiaries
• Decline in households that are food inadequate
• Decrease in number of children malnourished
• Increase in food consumption• Over 60 per cent transactions
made through non-bank agen-cies
Mexico: Opor-tuni
dades1997
• Focus on geographically poor regions. Households identified in these regions using marginal index
• Covers 20 per cent of total Population• Cost of scheme – 0.4 per cent of GDP• Size of transfer – 235 pesos (average)• Payments made bimonthly• Benefits can be withdrawn from
bank branches and authorized non-financial agencies
• Conditions – Minimum attendance re-quirement and mandatory health check ups
• 60 per cent of benefits went to poorest 20 per cent of the pop-ulation
• 12 per cent decrease in inci-dence of illnesses
• Increase in enrollment of chil-dren into schools and reduc-tion in dropout rates
• Increase in likelihood of women deciding on how ben-efits to be spent
Philip-pines:
Pantawid Pamilyang
Pilipino Program
2007
• Covers 20 per cent of total popu-lation
• Beneficiaries identified through Household surveys
• Cost of scheme – 0.5 per cent of GDP
• Conditions- Minimum atten-dance requirement and mandato-ry health check -ups, participate in monthly community-based Family Development Sessions.
• 20 million Filipinos benefited • Program has led to a poverty
reduction of 1.4 percentage points per year
• 10.18 million children cur-rently benefit from CCT
• Drastic decrease in alcoholism in 4Ps households (spending on vices was lower by 39 per cent)
Source: World Bank FAQ (2017), ICRIER(2017)
(Box 4). Therefore, the foodgrains policy needs to be dynamic and allow switching from physical handling and distribution of foodgrains to cash transfers/food coupons/smart cards. At the macro level, the
agricultural marketing, trade (both domestic and foreign) and distribution policies need to be aligned so that farmers receive the correct signals for diversification into remunerative and sustainable production.
88 Economic Survey 2019-20 Volume 1
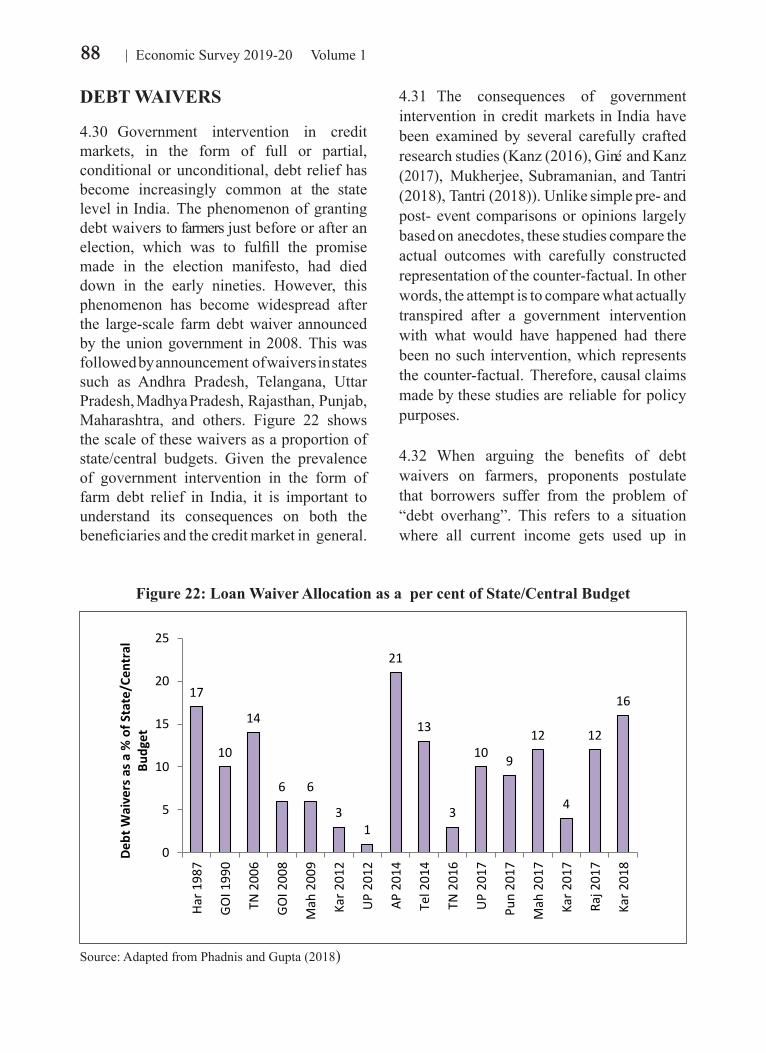
Figure 22: Loan Waiver Allocation as a per cent of State/Central Budget
17
10
14
6 6
31
21
13
3
10 9
12
4
12
16
0
5
10
15
20
25
Har 1
987
GOI 1
990
TN 2
006
GOI 2
008
Mah
200
9
Kar 2
012
UP 2
012
AP 2
014
Tel 2
014
TN 2
016
UP 2
017
Pun
2017
Mah
201
7
Kar 2
017
Raj 2
017
Kar 2
018
Debt
Wai
vers
as a
% o
f Sta
te/C
entr
al
Budg
et
Source: Adapted from Phadnis and Gupta (2018)
DEBT WAIVERS
4.30 Government intervention in credit markets, in the form of full or partial, conditional or unconditional, debt relief has become increasingly common at the state level in India. The phenomenon of granting debt waivers to farmers just before or after an election, which was to fulfill the promise made in the election manifesto, had died down in the early nineties. However, this phenomenon has become widespread after the large-scale farm debt waiver announced by the union government in 2008. This was followed by announcement of waivers in states such as Andhra Pradesh, Telangana, Uttar Pradesh, Madhya Pradesh, Rajasthan, Punjab, Maharashtra, and others. Figure 22 shows the scale of these waivers as a proportion of state/central budgets. Given the prevalence of government intervention in the form of farm debt relief in India, it is important to understand its consequences on both the beneficiaries and the credit market in general.
4.31 The consequences of government intervention in credit markets in India have been examined by several carefully crafted research studies (Kanz (2016), Gine and Kanz (2017), Mukherjee, Subramanian, and Tantri (2018), Tantri (2018)). Unlike simple pre- and post- event comparisons or opinions largely based on anecdotes, these studies compare the actual outcomes with carefully constructed representation of the counter-factual. In other words, the attempt is to compare what actually transpired after a government intervention with what would have happened had there been no such intervention, which represents the counter-factual. Therefore, causal claims made by these studies are reliable for policy purposes.
4.32 When arguing the benefits of debt waivers on farmers, proponents postulate that borrowers suffer from the problem of “debt overhang”. This refers to a situation where all current income gets used up in
89Undermining Markets
repaying the accumulated debt, leaving little incentives to invest either in physical or human capital. The incentives become muted because any incremental benefit of such investment in physical or human capital is likely to go to the lenders in the form of repayment of existing obligations and not the farmer. Such borrowers are unlikely to receive new funding, either equity or debt, as the ability of the borrower to repay additional loans or grow his/her business/farm is in question. Debt overhang, therefore, leads to abandonment of beneficial investment and hence reduces social welfare. Given this situation, proponents of debt relief argue that a debt waiver helps the borrowers to come out of the debt trap as it cleans their balance sheet and reduces the burden of debt servicing. This clean-up of borrowers’ balance sheet is likely to lead to both new investments as well as fresh fund rising as borrowers’ repayment capacity increases even if there is no change in income.
4.33 Kanz (2016) examines the 2008 debt waiver offered by Government of India and tests whether any of these effects actually play out. He uses the fact that farmers having less than 2 hectares of land received full relief while those with less than 2 hectares of land received only partial relief. A farmer having 1.98 hectares of land is not different from another farmer having 2.02 hectares of land. However, the farmer having 1.98 hectares of land receives the full relief while the farmer having 2.02 hectares of land receives only partial relief. If debt relief indeed benefits the farmers, then the former set of farmers should be definitely better off than the latter set. The results, however, are quite the opposite of what proponents of
debt waivers believe. Neither agricultural investment nor productivity increased after the waiver. Consequently, there was little impact on consumption as well. In other words, a stimulus worth close to 2 per cent of the GDP did not have any meaningful real impact on the lives of the farmers.
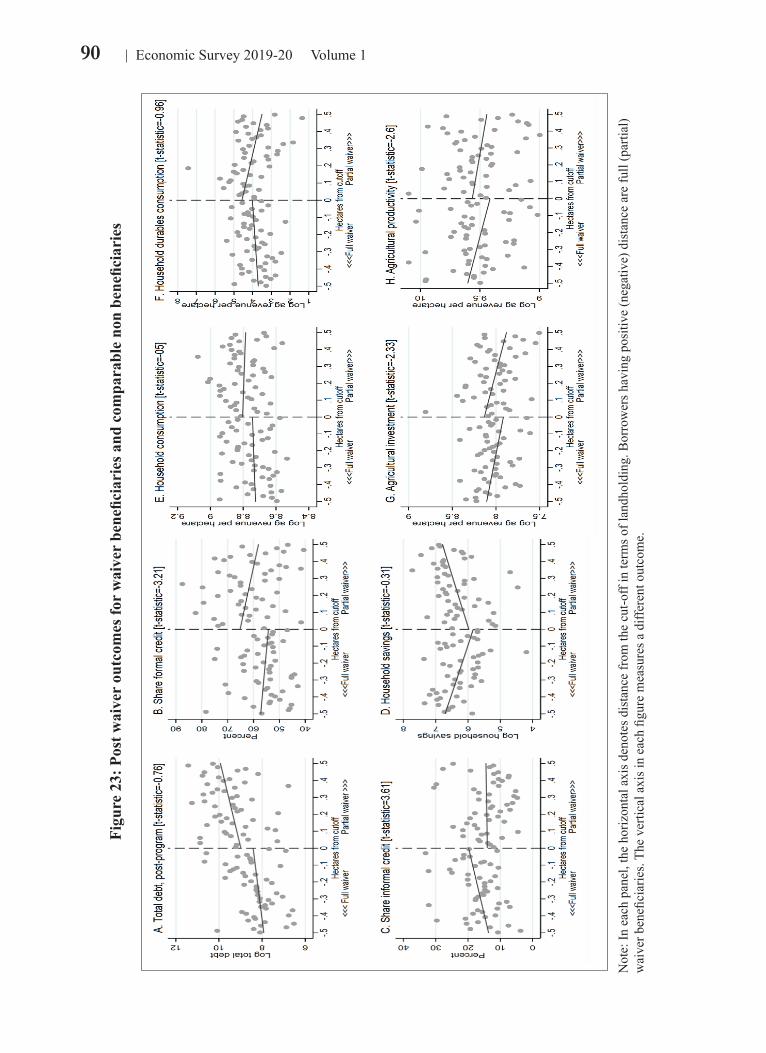
4.34 Figure 23 summarizes these results, where each panel shows the impact of the debt waiver on a key outcome on the y-axis. The horizontal axis denotes distance from the two hectare cut-off in terms of landholding. Borrowers having positive distance received a partial waiver as they have landholding more than two hectares. In contrast, borrowers having negative distance have landholdings less than two hectares and therefore received full waiver. It is clear from the figure that the waiver did not benefit the full beneficiaries more than the partial beneficiaries. In fact, full waiver beneficiaries consume less, save less, invest less and are less productive after the waiver when compared to the partial beneficiaries. The effects for agricultural investment and productivity are statistically significant. As well, the disconcerting evidence is that the share of formal credit decreases while the share of formal credit decreases for full beneficiaries when compared to partial beneficiaries, thereby defeating the very purpose of the debt waiver provided to farmers.
4.35 Debt waivers impact credit markets negatively as well. Bolton and Rosenthal (2002) argue that debt relief can help as long as they are awarded under exceptional circumstances and remain unanticipated. In such situations, a debt relief can prevent
90 Economic Survey 2019-20 Volume 1
Figu
re 2
3: P
ost w
aive
r ou
tcom
es fo
r w
aive
r be
nefic
iari
es a
nd c
ompa
rabl
e no
n be
nefic
iari
es
Not
e: In
eac
h pa
nel,
the
horiz
onta
l axi
s den
otes
dis
tanc
e fr
om th
e cu
t-off
in te
rms o
f lan
dhol
ding
. Bor
row
ers h
avin
g po
sitiv
e (n
egat
ive)
dis
tanc
e ar
e fu
ll (p
artia
l) w
aive
r ben
efici
arie
s. Th
e ve
rtica
l axi
s in
each
figu
re m
easu
res a
diff
eren
t out
com
e.
91Undermining Markets
farmers going out of farming and the consequent reduction of output. However, they also note that an anticipated waiver may lead to moral hazard and destroy the credit culture. Given the nature of the 2008 waiver, the later consequences seem to have prevailed. Gine and Kanz (2017) find that the waiver led to increased loan defaults on future loans and no improvement in wages, productivity, or consumption. They compare districts based on their exposure to the 2008 debt waiver provided by Government of India. A one percentage increase in exposure to the debt waiver increased the amount of non-performing assets by about 7 per cent. Most worryingly, they find that the loan performance deteriorated the most in areas that were headed for election, indicating strategic default in anticipation of waiver. Ironically, flow of bank credit to waiver beneficiaries declined after the waiver. A one standard deviation increase in the exposure of a district to the waiver led to a 4-6 per cent decline in the number of new loans and a 14-16 per cent decline in the amount of post-program lending.
4.36 Tantri (2018) finds that the Andhra Pradesh government’s 2010 intervention in micro-finance loans had a contagious impact on other segments of credit markets such as bank loans. In October, 2010, the government of Andhra Pradesh issued an ordinance virtually banning almost all loan recovery practices of micro-finance lenders. However, the loan delinquency rates in the micro-finance went up significantly following this intervention. The intervention had a contagious impact on bank loans as well. Rate of defaults and the rate of non-performing assets rose on bank loans increased by 12.4 per cent and 24.5 per
cent respectively following this intervention. Finally, as the flow of new credit reduced by half, government intervention that intended to help micro-finance borrowers ended up hurting borrowers by depriving them of credit.
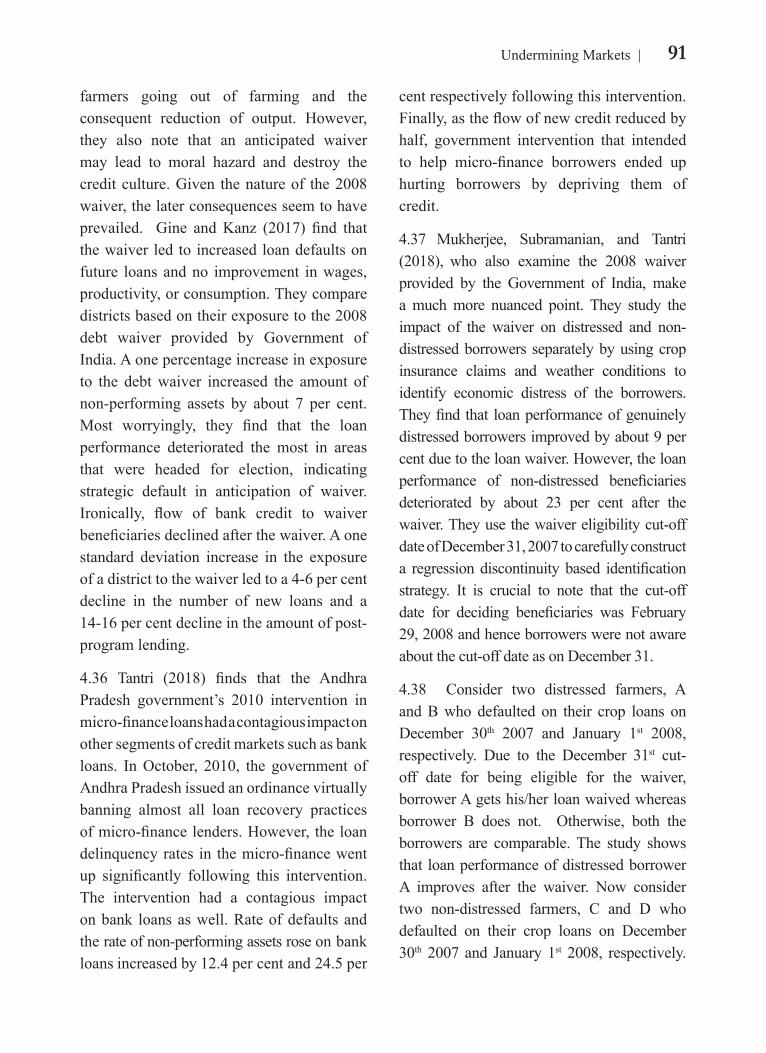
4.37 Mukherjee, Subramanian, and Tantri (2018), who also examine the 2008 waiver provided by the Government of India, make a much more nuanced point. They study the impact of the waiver on distressed and non- distressed borrowers separately by using crop insurance claims and weather conditions to identify economic distress of the borrowers. They find that loan performance of genuinely distressed borrowers improved by about 9 per cent due to the loan waiver. However, the loan performance of non-distressed beneficiaries deteriorated by about 23 per cent after the waiver. They use the waiver eligibility cut-off date of December 31, 2007 to carefully construct a regression discontinuity based identification strategy. It is crucial to note that the cut-off date for deciding beneficiaries was February 29, 2008 and hence borrowers were not aware about the cut-off date as on December 31.
4.38 Consider two distressed farmers, A and B who defaulted on their crop loans on December 30th 2007 and January 1st 2008, respectively. Due to the December 31st cut-off date for being eligible for the waiver, borrower A gets his/her loan waived whereas borrower B does not. Otherwise, both the borrowers are comparable. The study shows that loan performance of distressed borrower A improves after the waiver. Now consider two non-distressed farmers, C and D who defaulted on their crop loans on December 30th 2007 and January 1st 2008, respectively.
92 Economic Survey 2019-20 Volume 1
Figure 24: Impact of Debt Waiver On Distressed And Non- Distressed Borrowers
A: Distressed Borrowers
B: Non-distressed Borrowers
Source: Adapted from Mukherjee, Subramanian, and Tantri (2018)
Borrower C gets his/her loan waived whereas borrower D does not. Otherwise, both the borrowers are comparable. The study shows that loan performance of borrower D worsens after the waiver. In other words, a waiver helps only when the beneficiaries are
genuinely distressed but fuels even greater default when relief is not made conditional on genuine distress.
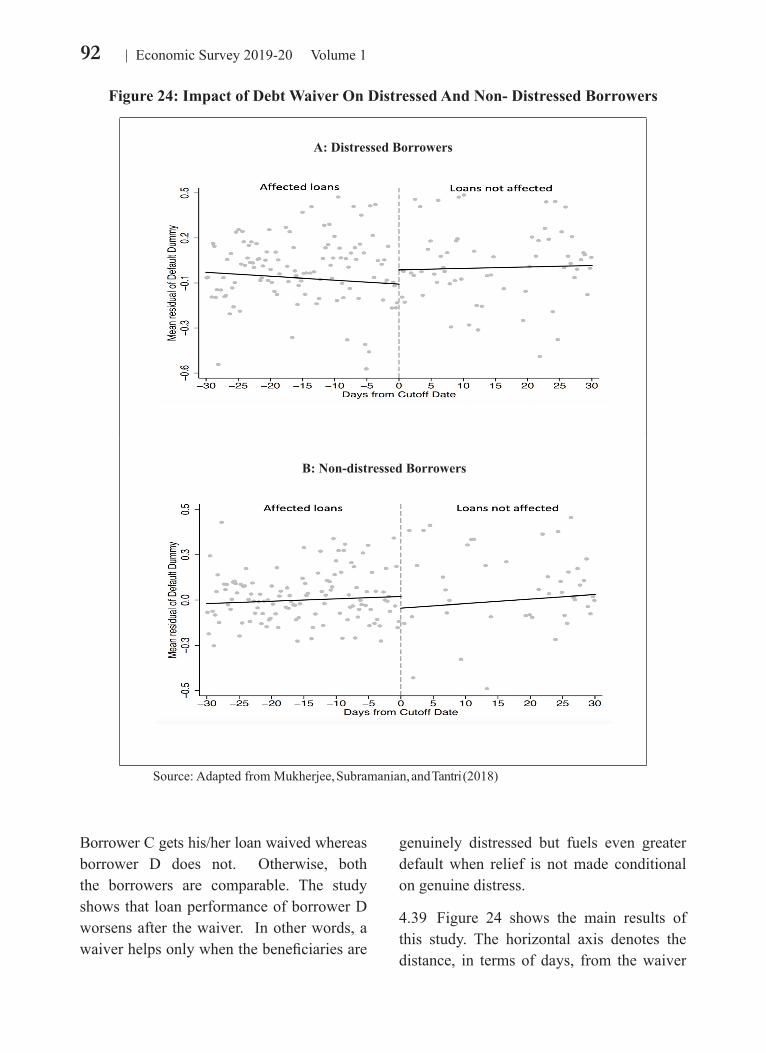
4.39 Figure 24 shows the main results of this study. The horizontal axis denotes the distance, in terms of days, from the waiver
93Undermining Markets
eligibility cut-off. The vertical axis denotes the default rate. Panel A (B) present the results for distressed (non-distressed) borrowers. Those who are on the left (right) of the cut-off are waiver beneficiaries (non-beneficiaries). It is clear from the figure that among the distressed (non-distressed) borrowers the waiver beneficiaries default less (more) when compared to comparable non-beneficiaries after the waiver. The horizontal axis denotes the distance, in terms of days, from the waiver eligibility cut-off. The vertical axis denotes the default rate on agricultural crop loans. Figure A indicates that distressed waiver beneficiaries default 9 per cent less than comparable distressed non-beneficiaries. Figure B shows that non-distressed beneficiaries default 23 per cent more than comparable non-distressed non-beneficiaries.
4.40 It is clear from the above studies that an unconditional and blanket debt waiver is a bad idea. It does not achieve any meaningful real outcomes for the intended beneficiaries while the costs to the exchequer are significant. Most importantly, debt waivers disrupt the credit culture and end up reducing the formal credit flow to the very same farmers it intends to help. As noted by Mukherjee, Subramanian, and Tantri (2018) and Bolton and Rosenthal (2002), there is a case for a limited relief only when distress can be identified credibly. In other words, a waiver can at best be an
emergency medicine to be given in rare cases after a thorough diagnosis and identification of illness and not a staple diet. In most cases, its side effects, the unintended consequences, far outweigh any plausible short term benefits.
LEGISLATIVE CHANGES REQUIRED TO REDUCE GOVERNMENT INTERVENTIONS
4.41 The analysis above highlights clearly that India is still stuck with several forms of Government intervention that are anchronistice with today’s economy. In several spheres of the economy, India has traversed the transition from a command and control economy to a market-driven economy. Table 1 illustrates this across several areas. Specifically industrial deregulation, privatizations of several state-owned enterprises, reduced controls on international trade and investment stand out in this context.
4.42 However, as highlighted in previous sections, several areas of unnecessary and inefficient government intervention still remain. Table 2 summarizes some key Acts, as low-hanging fruits to begin with, which have outlived their use and need to be repealed by one ‘stroke-of-the-pen’ as was done post-1990s or amended to enable functioning of competitive markets.
94 Economic Survey 2019-20 Volume 1
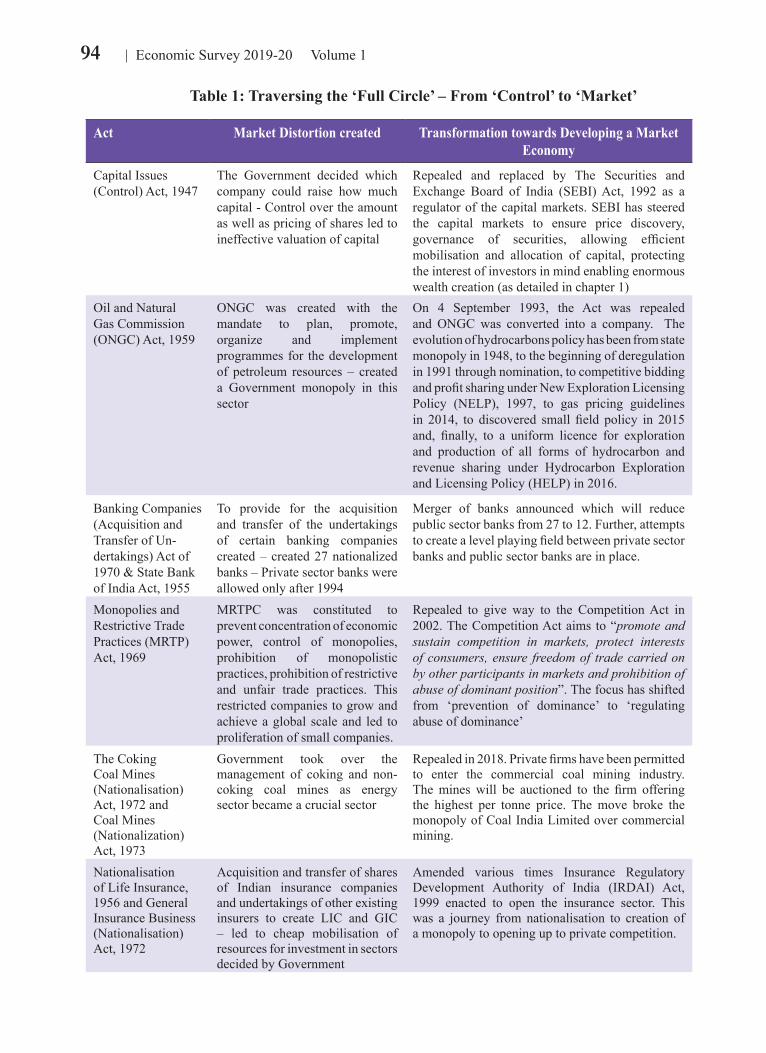
Table 1: Traversing the ‘Full Circle’ – From ‘Control’ to ‘Market’
Act Market Distortion created Transformation towards Developing a Market Economy
Capital Issues (Control) Act, 1947
The Government decided which company could raise how much capital - Control over the amount as well as pricing of shares led to ineffective valuation of capital
Repealed and replaced by The Securities and Exchange Board of India (SEBI) Act, 1992 as a regulator of the capital markets. SEBI has steered the capital markets to ensure price discovery, governance of securities, allowing efficient mobilisation and allocation of capital, protecting the interest of investors in mind enabling enormous wealth creation (as detailed in chapter 1)
Oil and Natural Gas Commission (ONGC) Act, 1959
ONGC was created with the mandate to plan, promote, organize and implement programmes for the development of petroleum resources – created a Government monopoly in this sector
On 4 September 1993, the Act was repealed and ONGC was converted into a company. The evolution of hydrocarbons policy has been from state monopoly in 1948, to the beginning of deregulation in 1991 through nomination, to competitive bidding and profit sharing under New Exploration Licensing Policy (NELP), 1997, to gas pricing guidelines in 2014, to discovered small field policy in 2015 and, finally, to a uniform licence for exploration and production of all forms of hydrocarbon and revenue sharing under Hydrocarbon Exploration and Licensing Policy (HELP) in 2016.
Banking Companies (Acquisition and Transfer of Un-dertakings) Act of 1970 & State Bank of India Act, 1955
To provide for the acquisition and transfer of the undertakings of certain banking companies created – created 27 nationalized banks – Private sector banks were allowed only after 1994
Merger of banks announced which will reduce public sector banks from 27 to 12. Further, attempts to create a level playing field between private sector banks and public sector banks are in place.
Monopolies and Restrictive Trade Practices (MRTP) Act, 1969
MRTPC was constituted to prevent concentration of economic power, control of monopolies, prohibition of monopolistic practices, prohibition of restrictive and unfair trade practices. This restricted companies to grow and achieve a global scale and led to proliferation of small companies.
Repealed to give way to the Competition Act in 2002. The Competition Act aims to “promote and sustain competition in markets, protect interests of consumers, ensure freedom of trade carried on by other participants in markets and prohibition of abuse of dominant position”. The focus has shifted from ‘prevention of dominance’ to ‘regulating abuse of dominance’
The Coking Coal Mines (Nationalisation) Act, 1972 and Coal Mines (Nationalization) Act, 1973
Government took over the management of coking and non-coking coal mines as energy sector became a crucial sector
Repealed in 2018. Private firms have been permitted to enter the commercial coal mining industry. The mines will be auctioned to the firm offering the highest per tonne price. The move broke the monopoly of Coal India Limited over commercial mining.
Nationalisation of Life Insurance, 1956 and General Insurance Business (Nationalisation) Act, 1972
Acquisition and transfer of shares of Indian insurance companies and undertakings of other existing insurers to create LIC and GIC – led to cheap mobilisation of resources for investment in sectors decided by Government
Amended various times Insurance Regulatory Development Authority of India (IRDAI) Act, 1999 enacted to open the insurance sector. This was a journey from nationalisation to creation of a monopoly to opening up to private competition.
95Undermining Markets
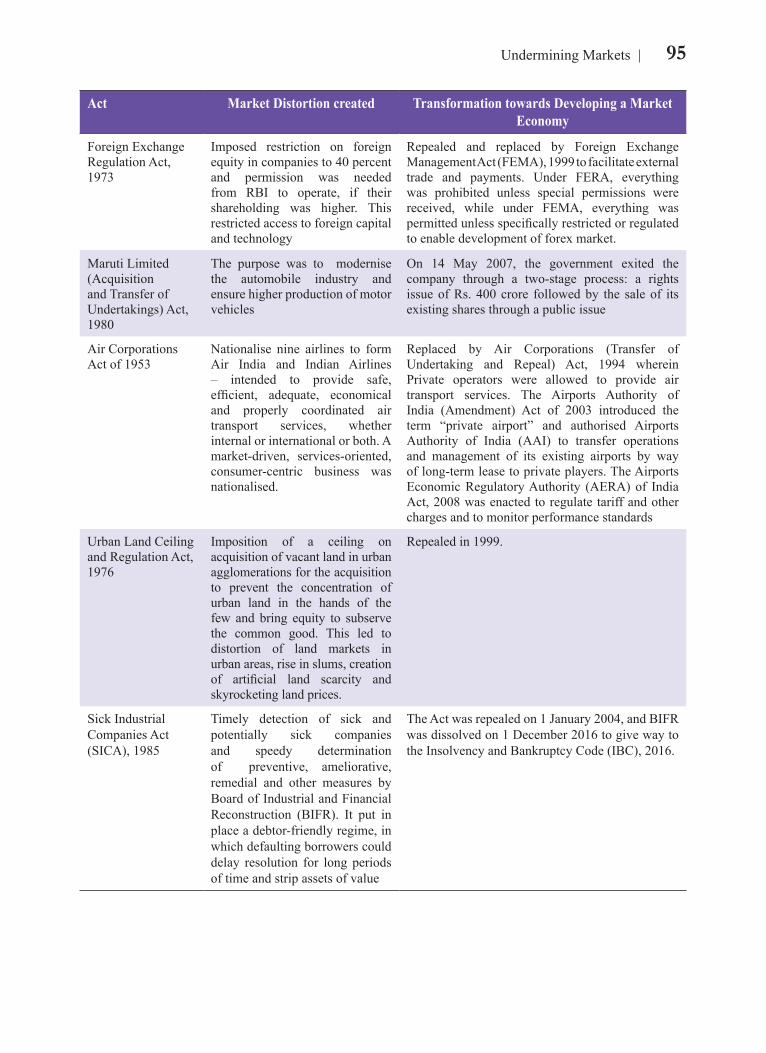
Act Market Distortion created Transformation towards Developing a Market Economy
Foreign Exchange Regulation Act, 1973
Imposed restriction on foreign equity in companies to 40 percent and permission was needed from RBI to operate, if their shareholding was higher. This restricted access to foreign capital and technology
Repealed and replaced by Foreign Exchange Management Act (FEMA), 1999 to facilitate external trade and payments. Under FERA, everything was prohibited unless special permissions were received, while under FEMA, everything was permitted unless specifically restricted or regulated to enable development of forex market.
Maruti Limited (Acquisition and Transfer of Undertakings) Act, 1980
The purpose was to modernise the automobile industry and ensure higher production of motor vehicles
On 14 May 2007, the government exited the company through a two-stage process: a rights issue of Rs. 400 crore followed by the sale of its existing shares through a public issue
Air Corporations Act of 1953
Nationalise nine airlines to form Air India and Indian Airlines – intended to provide safe, efficient, adequate, economical and properly coordinated air transport services, whether internal or international or both. A market-driven, services-oriented, consumer-centric business was nationalised.
Replaced by Air Corporations (Transfer of Undertaking and Repeal) Act, 1994 wherein Private operators were allowed to provide air transport services. The Airports Authority of India (Amendment) Act of 2003 introduced the term “private airport” and authorised Airports Authority of India (AAI) to transfer operations and management of its existing airports by way of long-term lease to private players. The Airports Economic Regulatory Authority (AERA) of India Act, 2008 was enacted to regulate tariff and other charges and to monitor performance standards
Urban Land Ceiling and Regulation Act, 1976
Imposition of a ceiling on acquisition of vacant land in urban agglomerations for the acquisition to prevent the concentration of urban land in the hands of the few and bring equity to subserve the common good. This led to distortion of land markets in urban areas, rise in slums, creation of artificial land scarcity and skyrocketing land prices.
Repealed in 1999.
Sick Industrial Companies Act (SICA), 1985
Timely detection of sick and potentially sick companies and speedy determination of preventive, ameliorative, remedial and other measures by Board of Industrial and Financial Reconstruction (BIFR). It put in place a debtor-friendly regime, in which defaulting borrowers could delay resolution for long periods of time and strip assets of value
The Act was repealed on 1 January 2004, and BIFR was dissolved on 1 December 2016 to give way to the Insolvency and Bankruptcy Code (IBC), 2016.
96 Economic Survey 2019-20 Volume 1
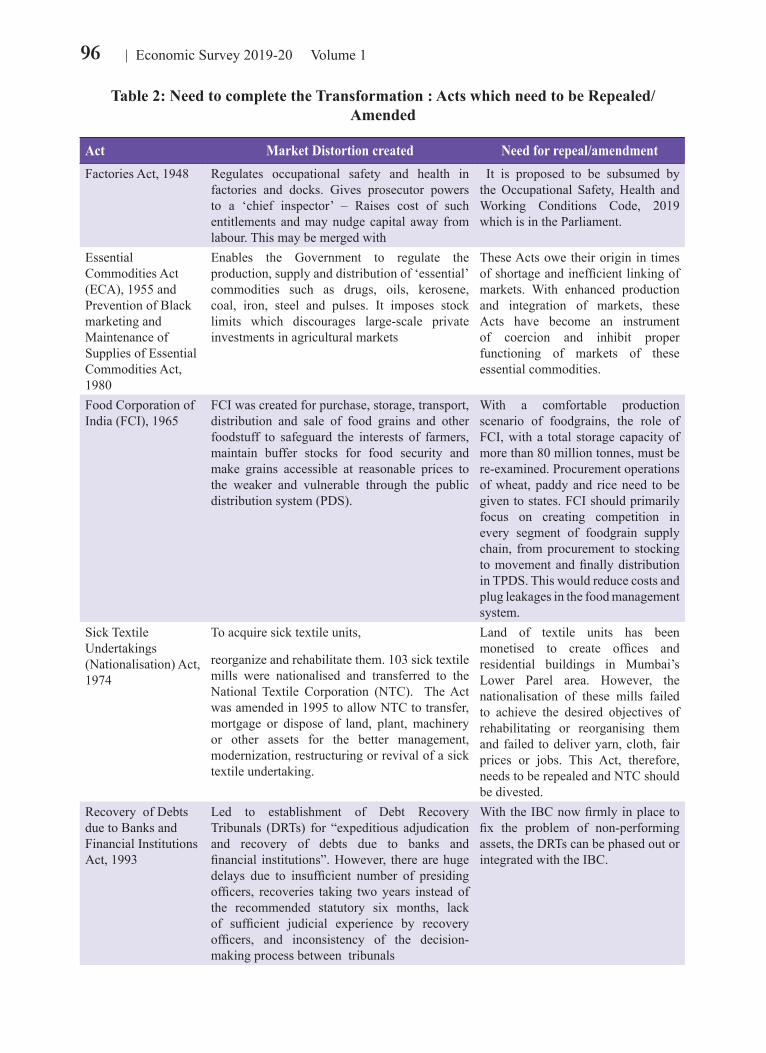
Table 2: Need to complete the Transformation : Acts which need to be Repealed/Amended
Act Market Distortion created Need for repeal/amendmentFactories Act, 1948 Regulates occupational safety and health in
factories and docks. Gives prosecutor powers to a ‘chief inspector’ – Raises cost of such entitlements and may nudge capital away from labour. This may be merged with
It is proposed to be subsumed by the Occupational Safety, Health and Working Conditions Code, 2019 which is in the Parliament.
Essential Commodities Act (ECA), 1955 and Prevention of Black marketing and Maintenance of Supplies of Essential Commodities Act, 1980
Enables the Government to regulate the production, supply and distribution of ‘essential’ commodities such as drugs, oils, kerosene, coal, iron, steel and pulses. It imposes stock limits which discourages large-scale private investments in agricultural markets
These Acts owe their origin in times of shortage and inefficient linking of markets. With enhanced production and integration of markets, these Acts have become an instrument of coercion and inhibit proper functioning of markets of these essential commodities.
Food Corporation of India (FCI), 1965
FCI was created for purchase, storage, transport, distribution and sale of food grains and other foodstuff to safeguard the interests of farmers, maintain buffer stocks for food security and make grains accessible at reasonable prices to the weaker and vulnerable through the public distribution system (PDS).
With a comfortable production scenario of foodgrains, the role of FCI, with a total storage capacity of more than 80 million tonnes, must be re-examined. Procurement operations of wheat, paddy and rice need to be given to states. FCI should primarily focus on creating competition in every segment of foodgrain supply chain, from procurement to stocking to movement and finally distribution in TPDS. This would reduce costs and plug leakages in the food management system.
Sick Textile Undertakings (Nationalisation) Act, 1974
To acquire sick textile units,
reorganize and rehabilitate them. 103 sick textile mills were nationalised and transferred to the National Textile Corporation (NTC). The Act was amended in 1995 to allow NTC to transfer, mortgage or dispose of land, plant, machinery or other assets for the better management, modernization, restructuring or revival of a sick textile undertaking.
Land of textile units has been monetised to create offices and residential buildings in Mumbai’s Lower Parel area. However, the nationalisation of these mills failed to achieve the desired objectives of rehabilitating or reorganising them and failed to deliver yarn, cloth, fair prices or jobs. This Act, therefore, needs to be repealed and NTC should be divested.
Recovery of Debts due to Banks and Financial Institutions Act, 1993
Led to establishment of Debt Recovery Tribunals (DRTs) for “expeditious adjudication and recovery of debts due to banks and financial institutions”. However, there are huge delays due to insufficient number of presiding officers, recoveries taking two years instead of the recommended statutory six months, lack of sufficient judicial experience by recovery officers, and inconsistency of the decision-making process between tribunals
With the IBC now firmly in place to fix the problem of non-performing assets, the DRTs can be phased out or integrated with the IBC.
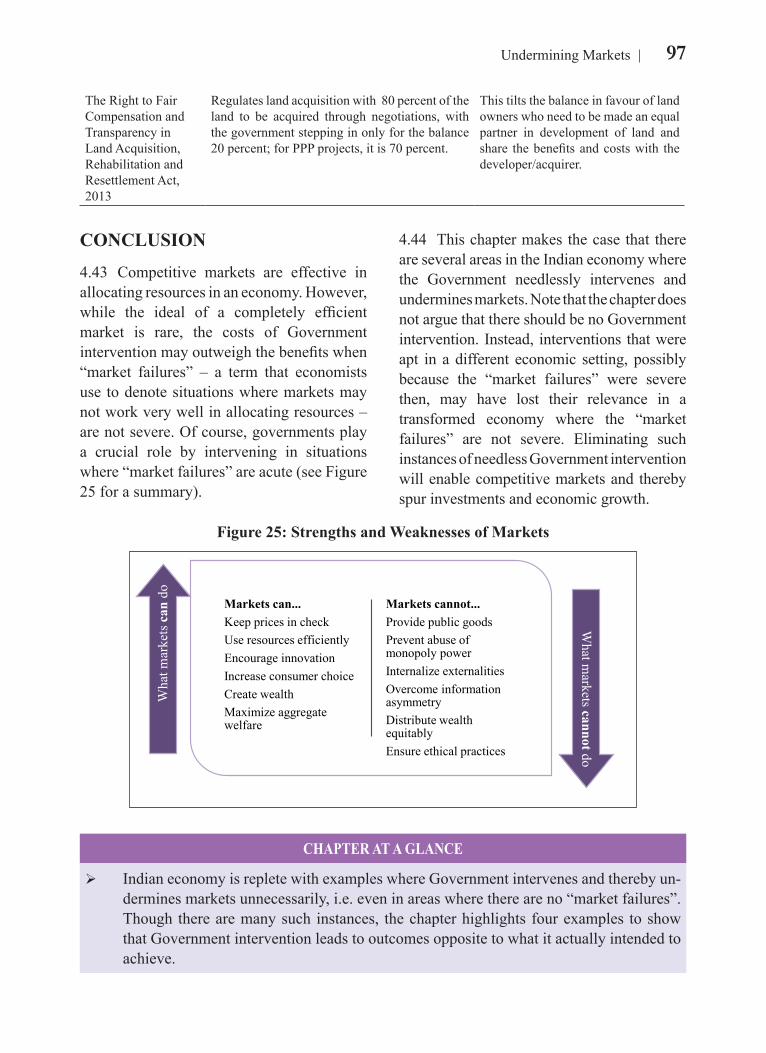
97Undermining Markets
The Right to Fair Compensation and Transparency in Land Acquisition, Rehabilitation and Resettlement Act, 2013
Regulates land acquisition with 80 percent of the land to be acquired through negotiations, with the government stepping in only for the balance 20 percent; for PPP projects, it is 70 percent.
This tilts the balance in favour of land owners who need to be made an equal partner in development of land and share the benefits and costs with the developer/acquirer.
CHAPTER AT A GLANCE
Indian economy is replete with examples where Government intervenes and thereby un-dermines markets unnecessarily, i.e. even in areas where there are no “market failures”. Though there are many such instances, the chapter highlights four examples to show that Government intervention leads to outcomes opposite to what it actually intended to achieve.
CONCLUSION
4.43 Competitive markets are effective in allocating resources in an economy. However, while the ideal of a completely efficient market is rare, the costs of Government intervention may outweigh the benefits when “market failures” – a term that economists use to denote situations where markets may not work very well in allocating resources – are not severe. Of course, governments play a crucial role by intervening in situations where “market failures” are acute (see Figure 25 for a summary).
4.44 This chapter makes the case that there are several areas in the Indian economy where the Government needlessly intervenes and undermines markets. Note that the chapter does not argue that there should be no Government intervention. Instead, interventions that were apt in a different economic setting, possibly because the “market failures” were severe then, may have lost their relevance in a transformed economy where the “market failures” are not severe. Eliminating such instances of needless Government intervention will enable competitive markets and thereby spur investments and economic growth.
Figure 25: Strengths and Weaknesses of Markets
Markets can... Keep prices in check Use resources efficiently Encourage innovation Increase consumer choice Create wealth Maximize aggregate welfare
Markets cannot... Provide public goods Prevent abuse of monopoly power Internalize externalities Overcome information asymmetry Distribute wealth equitably Ensure ethical practices
Wha
t mar
kets
can
do
What m
arkets cannot do
98 Economic Survey 2019-20 Volume 1
Frequent and unpredictable imposition of blanket stock limits on commodities under Essential Commodities Act (ECA) distorts the incentives for the creation of storage in-frastructure by the private sector, movement up the agricultural value chain and devel-opment of national market for agricultural commodities. Imposition of stock limits on dal in 2006-Q3, sugar in 2009-Q1 and onions in September, 2019 had no effect on the volatility of the retail and wholesale prices of onions.
The Ministry of Consumer Affairs and its related arms must examine whether the anach-ronistic ECA, which was passed in 1955 in an India worried about famines and shortag-es, is relevant in today’s India. Around 76000 raids under ECA were conducted during 2019. Assuming a minimum of 5 persons involved in a raid, considerable administrative effort goes into enforcement of ECA. As the conviction rate, however, is abysmally low and raids have no impact on prices, the ECA only seems to enable rent-seeking and harassment. The Survey provides clear evidence that the case for jettisoning this anach-ronistic legislation is strong.
The regulation of prices of drugs, through the DPCO 2013, has led to increase in the price of the regulated pharmaceutical drug vis-à-vis that of a similar drug whose price is not regulated. The increase in prices is greater for more expensive formulations than for cheaper ones and for those sold in hospitals rather than retail shops. These findings rein-force that the outcome is opposite to what DPCO aims to do - making drugs affordable.
As the Government is a huge buyer of drugs through its various arms such as CGHS, Defense, Railways etc., the Government can intervene more effectively to provide af-fordable drugs by combining all its purchases and thereby exercise its bargaining power. The Ministry of Health and Family Welfare as well as its related arms must imbibe the evidence to evolve non-distortionary mechanisms that utilise Government’s bargaining power in a transparent manner.
Government policies in the foodgrain markets has led to the emergence of Government as the largest procurer and hoarder of rice and wheat crowding out. This has led to bur-geoning food subsidy burden and inefficiencies in the markets, which is affecting the long run growth of agricultural sector. The foodgrains policy needs to be dynamic and allow switching from physical handling and distribution of foodgrains to cash transfers/food coupons/smart cards.
Analysis of debt waivers given by States/Centre shows that full waiver beneficiaries consume less, save less, invest less and are less productive after the waiver when com-pared to the partial beneficiaries. Debt waivers disrupt the credit culture and end up reducing the formal credit flow to the very same farmers, thereby defeating the very purpose of the debt waiver provided to farmers.
This chapter makes the case that each department and ministry in the Government must systematically examine areas where the Government needlessly intervenes and under-mines markets. Note that the chapter does not argue that there should be no Government intervention. Instead, interventions that were apt in a different economic setting may have lost their relevance in a transformed economy. Eliminating such instances will en-able competitive markets and thereby spur investments and economic growth.
99Undermining Markets
REFERENCES
Banerjee, A, and L. Iyer. 2005. “History, institutions, and economic performance: The legacy of colonial land tenure systems in India.” American economic review 95 (4): 1190–1213.
Bolton, P, and H. Rosenthal. 2002. “Political intervention in debt contracts.” Journal of Political Economy 110 (5): 1103–1134.
Cunningham, S. 2011. Understanding market failures in an economic development context. Vol. 4. Pretoria: Mesopartner Press.
Gine´, X, and M. Kanz. 2017. “The economic effects of a borrower bailout: evidence from an emerging market.” The Review of Financial Studies 31 (5): 1752–1783.
Gulati, Ashok, Tirtha Chatterjee, and Siraj Hussain. n.d. “Supporting Indian Farmers: Price Support or Direct Income/Investment Support?” ICRIER WP 357.
Hayek, F. A. 1945. “The Use of Knowledge in Society.” The American Economic Review 35 (4): 519-530.
High Level Committee Report on Reorienting the Role and Restructuring of Food Corporation of India (FCI)
Kanz, M. 2016. “What does debt relief do for development? Evidence from India’s bailout for rural households.” American Economic Journal: Applied Economics 8 (4): 66–99.
Keynes, J M. 1936. The General Theory of Employment, Interest and Money. London: McMillan.
Mukherjee , Saptarshi , Krishnamurthy Subramanian, and Prasanna Tantri. 2018. “Borrowers’ Distress and Debt Relief: Evidence from a Natural Experiment.” University of Chicago Press 61 (4): 607-635.
Phadnis, Ajit , and Aishwarya Gupta. 2019. “The Politics of Farm Loan Waivers: A Comparative Study.” Economic and Political Weekly 54 (23).
Sahay, Arvind, and Saravana Jaikumar. 2016. “Does Pharmaceutical Price Regulation Result in Greater Access to Essential Medicines? Study of the impact of drug price control order on sales volume of drugs in India.” IIMA Working Papers WP2016-02-01, Indian Institute of Management Ahmedabad, Research and Publication Department.
Saini, Shweta, Sameedh Sharma, Ashok Gulati, Siraj Hussain, and Joachim von Braun. 2017. “Indian food and welfare schemes: Scope for digitization towards cash transfers.” SSRN Electronic Journal.
Tantri, P L. 2018. “Contagious effects of a political intervention in debt contracts: Evidence using loan-level data.” The Review of Financial Studies 31 (11): 4556–4592.