Underinsurance of property risks - Sigma5
40
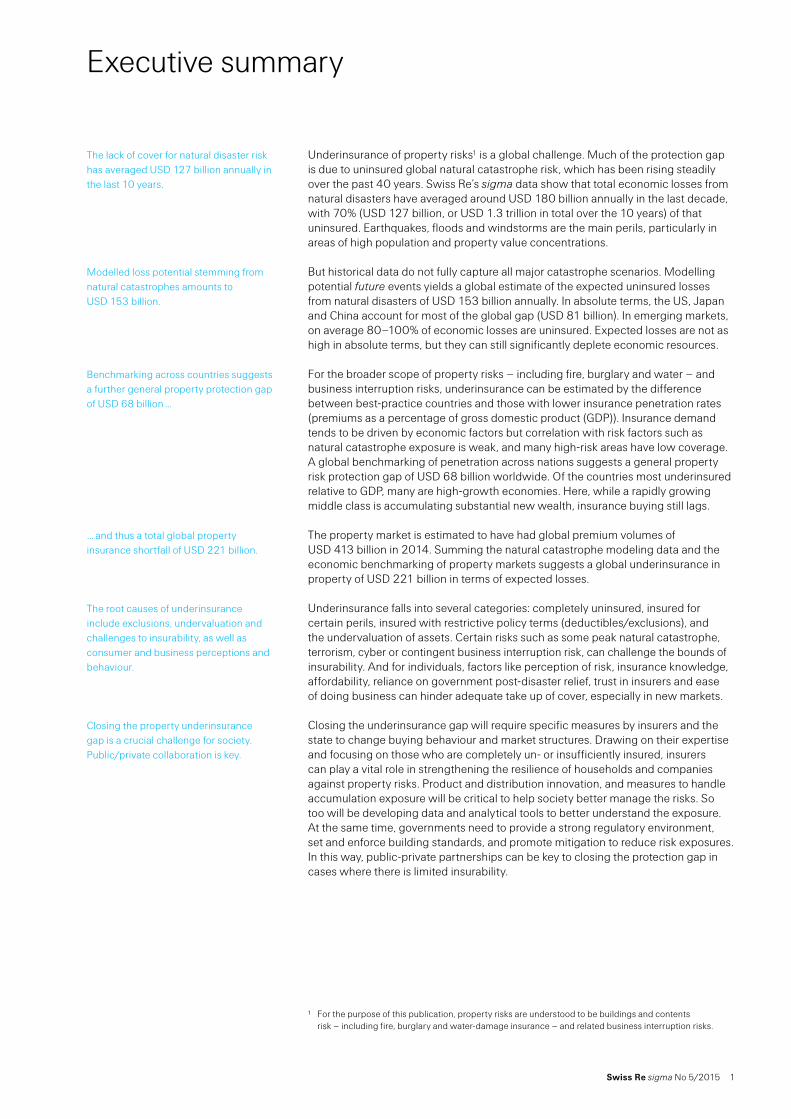
No 5 /2015 Underinsurance of property risks: closing the gap 01 Executive summary 02 Introduction: assessing underinsurance in global property risk 04 How big is the natural catastrophe protection gap? 13 The global shortfall in property insurance 19 Underinsurance explained 25 Dealing with under- insurance 33 Conclusions 34 Appendix
-
Upload
simone-luca-giargia -
Category
Business
-
view
133 -
download
1
Transcript of Underinsurance of property risks - Sigma5
No 5 /2015
Underinsurance of property risks: closing the gap
01 Executive summary
02 Introduction: assessing underinsurance in global property risk
04 How big is the natural catastrophe protection gap?
13 The global shortfall in property insurance
19 Underinsurance explained
25 Dealing with under- insurance
33 Conclusions
34 Appendix

Swiss Re sigma No 5/2015 1
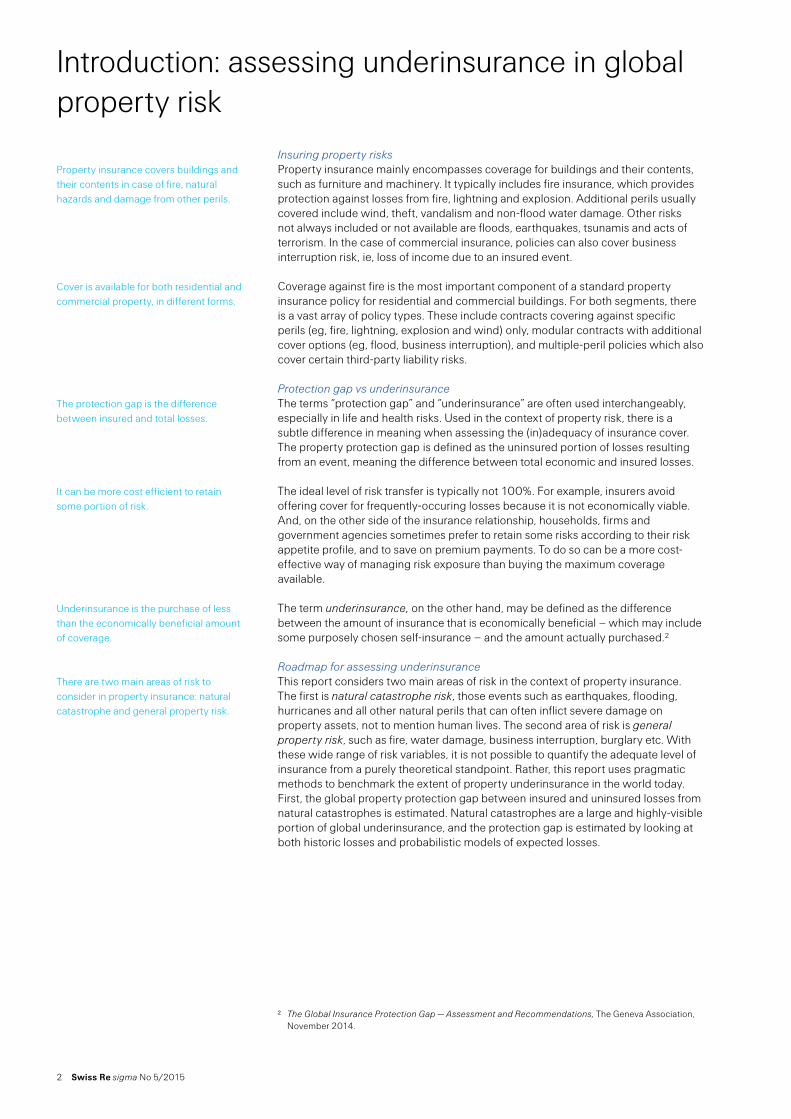
Executive summary
Underinsurance of property risks1 is a global challenge. Much of the protection gap is due to uninsured global natural catastrophe risk, which has been rising steadily over the past 40 years. Swiss Re’s sigma data show that total economic losses from natural disasters have averaged around USD 180 billion annually in the last decade, with 70% (USD 127 billion, or USD 1.3 trillion in total over the 10 years) of that uninsured. Earthquakes, floods and windstorms are the main perils, particularly in areas of high population and property value concentrations.
But historical data do not fully capture all major catastrophe scenarios. Modelling potential future events yields a global estimate of the expected uninsured losses from natural disasters of USD 153 billion annually. In absolute terms, the US, Japan and China account for most of the global gap (USD 81 billion). In emerging markets, on average 80–100% of economic losses are uninsured. Expected losses are not as high in absolute terms, but they can still significantly deplete economic resources.
For the broader scope of property risks – including fire, burglary and water – and business interruption risks, underinsurance can be estimated by the difference between best-practice countries and those with lower insurance penetration rates (premiums as a percentage of gross domestic product (GDP)). Insurance demand tends to be driven by economic factors but correlation with risk factors such as natural catastrophe exposure is weak, and many high-risk areas have low coverage. A global benchmarking of penetration across nations suggests a general property risk protection gap of USD 68 billion worldwide. Of the countries most underinsured relative to GDP, many are high-growth economies. Here, while a rapidly growing middle class is accumulating substantial new wealth, insurance buying still lags.
The property market is estimated to have had global premium volumes of USD 413 billion in 2014. Summing the natural catastrophe modeling data and the economic benchmarking of property markets suggests a global underinsurance in property of USD 221 billion in terms of expected losses.
Underinsurance falls into several categories: completely uninsured, insured for certain perils, insured with restrictive policy terms (deductibles/exclusions), and the undervaluation of assets. Certain risks such as some peak natural catastrophe, terrorism, cyber or contingent business interruption risk, can challenge the bounds of insurability. And for individuals, factors like perception of risk, insurance knowledge, affordability, reliance on government post-disaster relief, trust in insurers and ease of doing business can hinder adequate take up of cover, especially in new markets.
Closing the underinsurance gap will require specific measures by insurers and the state to change buying behaviour and market structures. Drawing on their expertise and focusing on those who are completely un- or insufficiently insured, insurers can play a vital role in strengthening the resilience of households and companies against property risks. Product and distribution innovation, and measures to handle accumulation exposure will be critical to help society better manage the risks. So too will be developing data and analytical tools to better understand the exposure. At the same time, governments need to provide a strong regulatory environment, set and enforce building standards, and promote mitigation to reduce risk exposures. In this way, public-private partnerships can be key to closing the protection gap in cases where there is limited insurability.
1 For the purpose of this publication, property risks are understood to be buildings and contents risk – including fire, burglary and water-damage insurance – and related business interruption risks.
The lack of cover for natural disaster risk has averaged USD 127 billion annually in the last 10 years.
Modelled loss potential stemming from natural catastrophes amounts to USD 153 billion.
Benchmarking across countries suggests a further general property protection gap of USD 68 billion …
… and thus a total global property insurance shortfall of USD 221 billion.
The root causes of underinsurance include exclusions, undervaluation and challenges to insurability, as well as consumer and business perceptions and behaviour.
Closing the property underinsurance gap is a crucial challenge for society. Public/private collaboration is key.
2 Swiss Re sigma No 5/2015
Introduction: assessing underinsurance in global property risk
Insuring property risksProperty insurance mainly encompasses coverage for buildings and their contents, such as furniture and machinery. It typically includes fire insurance, which provides protection against losses from fire, lightning and explosion. Additional perils usually covered include wind, theft, vandalism and non-flood water damage. Other risks not always included or not available are floods, earthquakes, tsunamis and acts of terrorism. In the case of commercial insurance, policies can also cover business interruption risk, ie, loss of income due to an insured event.
Coverage against fire is the most important component of a standard property insurance policy for residential and commercial buildings. For both segments, there is a vast array of policy types. These include contracts covering against specific perils (eg, fire, lightning, explosion and wind) only, modular contracts with additional cover options (eg, flood, business interruption), and multiple-peril policies which also cover certain third-party liability risks.
Protection gap vs underinsuranceThe terms “protection gap” and “underinsurance” are often used interchangeably, especially in life and health risks. Used in the context of property risk, there is a subtle difference in meaning when assessing the (in)adequacy of insurance cover. The property protection gap is defined as the uninsured portion of losses resulting from an event, meaning the difference between total economic and insured losses.
The ideal level of risk transfer is typically not 100%. For example, insurers avoid offering cover for frequently-occuring losses because it is not economically viable. And, on the other side of the insurance relationship, households, firms and government agencies sometimes prefer to retain some risks according to their risk appetite profile, and to save on premium payments. To do so can be a more cost-effective way of managing risk exposure than buying the maximum coverage available.
The term underinsurance, on the other hand, may be defined as the difference between the amount of insurance that is economically beneficial – which may include some purposely chosen self-insurance – and the amount actually purchased.2
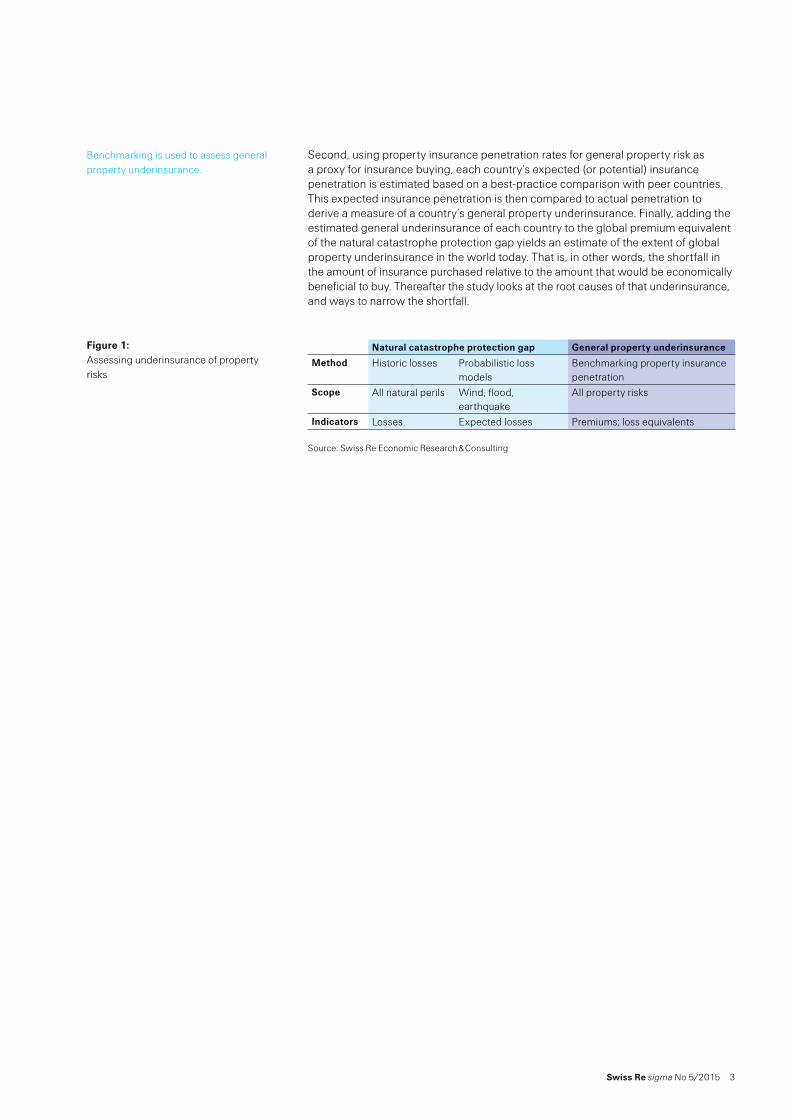
Roadmap for assessing underinsuranceThis report considers two main areas of risk in the context of property insurance. The first is natural catastrophe risk, those events such as earthquakes, flooding, hurricanes and all other natural perils that can often inflict severe damage on property assets, not to mention human lives. The second area of risk is general property risk, such as fire, water damage, business interruption, burglary etc. With these wide range of risk variables, it is not possible to quantify the adequate level of insurance from a purely theoretical standpoint. Rather, this report uses pragmatic methods to benchmark the extent of property underinsurance in the world today. First, the global property protection gap between insured and uninsured losses from natural catastrophes is estimated. Natural catastrophes are a large and highly-visible portion of global underinsurance, and the protection gap is estimated by looking at both historic losses and probabilistic models of expected losses.
2 The Global Insurance Protection Gap — Assessment and Recommendations, The Geneva Association, November 2014.
Property insurance covers buildings and their contents in case of fire, natural hazards and damage from other perils.
Cover is available for both residential and commercial property, in different forms.
The protection gap is the difference between insured and total losses.
It can be more cost efficient to retain some portion of risk.
Underinsurance is the purchase of less than the economically beneficial amount of coverage.
There are two main areas of risk to consider in property insurance: natural catastrophe and general property risk.
Swiss Re sigma No 5/2015 3
Second, using property insurance penetration rates for general property risk as a proxy for insurance buying, each country’s expected (or potential) insurance penetration is estimated based on a best-practice comparison with peer countries. This expected insurance penetration is then compared to actual penetration to derive a measure of a country’s general property underinsurance. Finally, adding the estimated general underinsurance of each country to the global premium equivalent of the natural catastrophe protection gap yields an estimate of the extent of global property underinsurance in the world today. That is, in other words, the shortfall in the amount of insurance purchased relative to the amount that would be economically beneficial to buy. Thereafter the study looks at the root causes of that underinsurance, and ways to narrow the shortfall.
Natural catastrophe protection gap General property underinsurance
Method Historic losses Probabilistic loss models
Benchmarking property insurance penetration
Scope All natural perils Wind, flood, earthquake
All property risks
Indicators Losses Expected losses Premiums; loss equivalents
Source: Swiss Re Economic Research & Consulting
Benchmarking is used to assess general property underinsurance.
Figure 1: Assessing underinsurance of property risks
4 Swiss Re sigma No 5/2015
How big is the natural catastrophe protection gap?
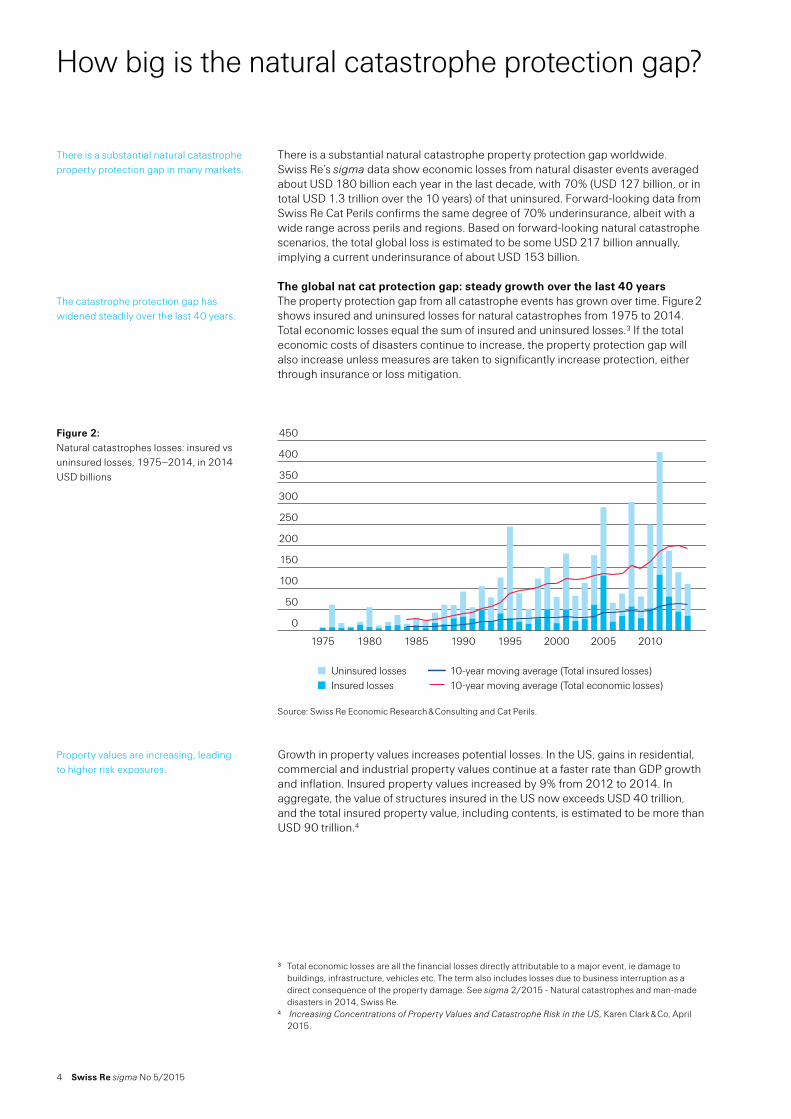
There is a substantial natural catastrophe property protection gap worldwide. Swiss Re’s sigma data show economic losses from natural disaster events averaged about USD 180 billion each year in the last decade, with 70% (USD 127 billion, or in total USD 1.3 trillion over the 10 years) of that uninsured. Forward-looking data from Swiss Re Cat Perils confirms the same degree of 70% underinsurance, albeit with a wide range across perils and regions. Based on forward-looking natural catastrophe scenarios, the total global loss is estimated to be some USD 217 billion annually, implying a current underinsurance of about USD 153 billion.
The global nat cat protection gap: steady growth over the last 40 yearsThe property protection gap from all catastrophe events has grown over time. Figure 2 shows insured and uninsured losses for natural catastrophes from 1975 to 2014. Total economic losses equal the sum of insured and uninsured losses.3 If the total economic costs of disasters continue to increase, the property protection gap will also increase unless measures are taken to significantly increase protection, either through insurance or loss mitigation.
Source: Swiss Re Economic Research & Consulting and Cat Perils.
Growth in property values increases potential losses. In the US, gains in residential, commercial and industrial property values continue at a faster rate than GDP growth and inflation. Insured property values increased by 9% from 2012 to 2014. In aggregate, the value of structures insured in the US now exceeds USD 40 trillion, and the total insured property value, including contents, is estimated to be more than USD 90 trillion.4
3 Total economic losses are all the financial losses directly attributable to a major event, ie damage to buildings, infrastructure, vehicles etc. The term also includes losses due to business interruption as a direct consequence of the property damage. See sigma 2/2015 - Natural catastrophes and man-made disasters in 2014, Swiss Re.
4 Increasing Concentrations of Property Values and Catastrophe Risk in the US, Karen Clark & Co, April 2015.
There is a substantial natural catastrophe property protection gap in many markets.
The catastrophe protection gap has widened steadily over the last 40 years.
Figure 2: Natural catastrophes losses: insured vs uninsured losses, 1975–2014, in 2014 USD billions
10-year moving average (insured losses)
10-year moving average (economic losses)
Uninsured losses
Insured losses
20102005200019951990198519801975
0
50
100
150
200
250
300
350
400
450
10-year moving average (Total insured losses)10-year moving average (Total economic losses)
Uninsured lossesInsured losses
Property values are increasing, leading to higher risk exposures.
Swiss Re sigma No 5/2015 5
With urbanization leading to increased property development in cities worldwide, there are many highly concentrated pockets of exposure across the globe. This risk accumulation is especially high among coastal urban developments exposed to hurricanes. For example, the coastal counties in New York, Florida and Texas account for nearly USD 11 trillion of property risk exposure, or more than 12% of the US total.5 In emerging markets, urbanization trends are increasing property values significantly also.
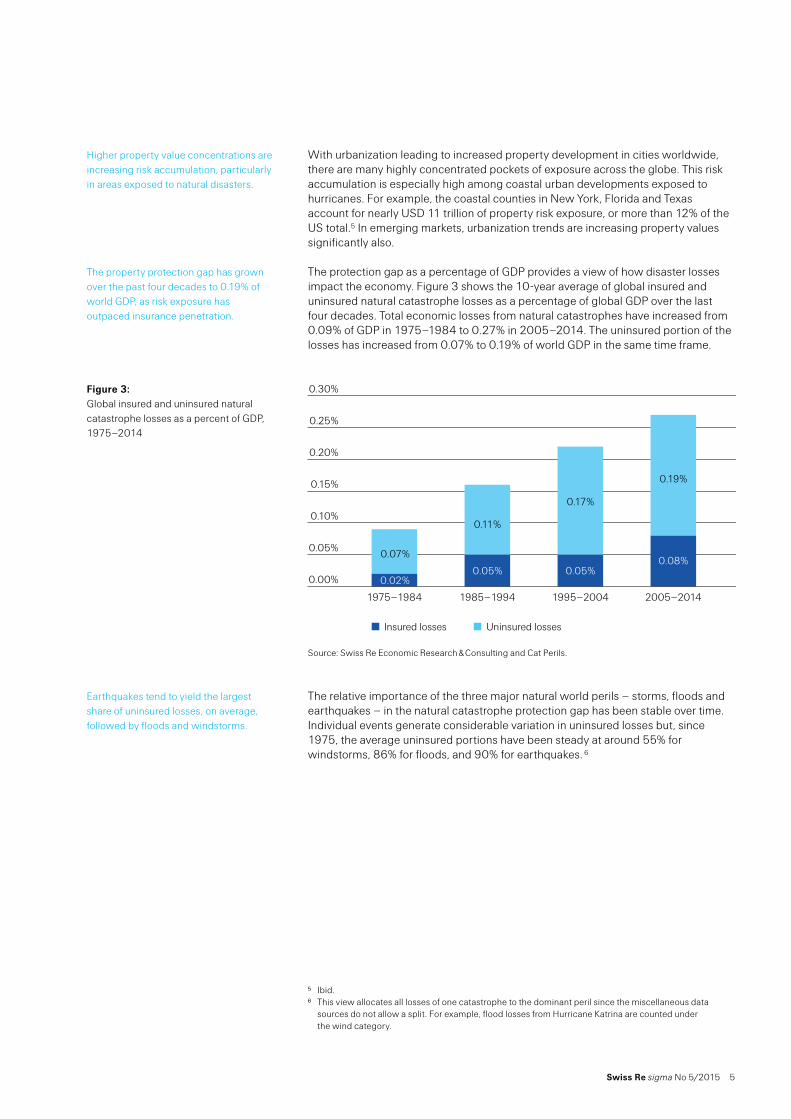
The protection gap as a percentage of GDP provides a view of how disaster losses impact the economy. Figure 3 shows the 10-year average of global insured and uninsured natural catastrophe losses as a percentage of global GDP over the last four decades. Total economic losses from natural catastrophes have increased from 0.09% of GDP in 1975–1984 to 0.27% in 2005–2014. The uninsured portion of the losses has increased from 0.07% to 0.19% of world GDP in the same time frame.
Source: Swiss Re Economic Research & Consulting and Cat Perils.
The relative importance of the three major natural world perils – storms, floods and earthquakes – in the natural catastrophe protection gap has been stable over time. Individual events generate considerable variation in uninsured losses but, since 1975, the average uninsured portions have been steady at around 55% for windstorms, 86% for floods, and 90% for earthquakes. 6
5 Ibid.6 This view allocates all losses of one catastrophe to the dominant peril since the miscellaneous data
sources do not allow a split. For example, flood losses from Hurricane Katrina are counted under the wind category.
Higher property value concentrations are increasing risk accumulation, particularly in areas exposed to natural disasters.
The property protection gap has grown over the past four decades to 0.19% of world GDP, as risk exposure has outpaced insurance penetration.
Figure 3: Global insured and uninsured natural catastrophe losses as a percent of GDP, 1975–2014
0.00%
0.05%
0.10%
0.15%
0.20%
0.25%
0.30%
Uninsured losses
Insured losses
2005–20141995–20041985–19941975–1984
Uninsured lossesInsured losses
0.02% 0.05% 0.05%
0.08% 0.07%
0.11%
0.17%
0.19%
Earthquakes tend to yield the largest share of uninsured losses, on average, followed by floods and windstorms.

6 Swiss Re sigma No 5/2015
How big is the natural catastrophe protection gap?
Note: based on events from which insured and economic losses were known and for which total losses were larger than USD 500 million at 2014 prices.
Source: Swiss Re Economic Research & Consulting and Cat Perils.
The share of uninsured property losses as a result of natural catastrophes varies by region. Typically, the gap is smaller in industrialised than in emerging markets, where 80–100% of economic losses are uninsured. As the value of property in emerging regions has increased alongside rapid economic growth, the emerging market share of the global protection gap has also increased.
The protection gap for storms varies between 51% and 65% of total losses in mature markets. For floods, between 59% and 87% is uninsured. For earthquakes, the spread is even wider, spanning from 21% to 96%. That’s even though devastating earthquakes are rarer and more geographically concentrated than weather-related events, and hence could be more easily anticipated and insured for less per year. Since 1975, there have been 11 earthquakes with economic losses of USD 500 million or more in Western Europe. These were all in Italy or Greece, countries with very low insurance penetration.
Which countries have the largest natural catastrophe protection gaps?A backward-looking view provides useful initial estimates of the property protection gap, but has limitations because it does not capture a picture of the total underlying risk. Low-probability events such as major hurricanes or earthquakes may not occur for several decades and so may not appear in recent historical data. For example, Florida has not experienced a severe hurricane in 10 years, but there is still a very high risk of property damage from hurricanes there.
There are also limitations to the measurement and reporting of economic losses. Post-disaster estimates of total economic losses come from different sources and may be subject to bias. For instance, to receive assistance from the US Federal Emergency Management Agency, a state governor must request a federal disaster declaration for one or more counties, which the US President must approve. This provides incentive to cite large numbers based on broader definitions of losses in order to justify more external assistance.
Figure 4: Natural catastrophe uninsured losses as a % of economic losses, by region, 1975–2014
0%
20%
40%
60%
80%
100%
Earthquakes
Floods
Storms
LatinAmerica
EmergingAsia
OceaniaJapanNorthAmerica
WesternEurope
EarthquakesFloodsStorms
The protection gap varies by region …
… and by peril.
The historical view shows past trends but does not capture underlying risk exposures.
Also, economic loss reporting can be subject to bias.
Swiss Re sigma No 5/2015 7
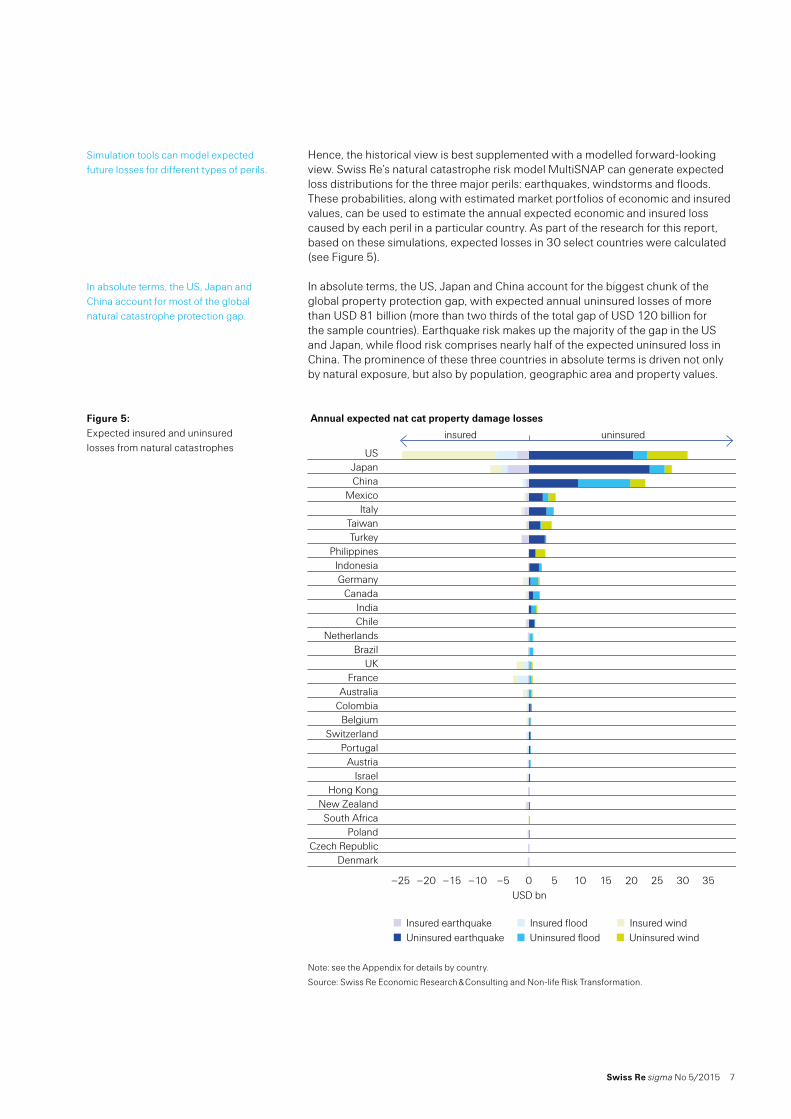
Hence, the historical view is best supplemented with a modelled forward-looking view. Swiss Re’s natural catastrophe risk model MultiSNAP can generate expected loss distributions for the three major perils: earthquakes, windstorms and floods. These probabilities, along with estimated market portfolios of economic and insured values, can be used to estimate the annual expected economic and insured loss caused by each peril in a particular country. As part of the research for this report, based on these simulations, expected losses in 30 select countries were calculated (see Figure 5).
In absolute terms, the US, Japan and China account for the biggest chunk of the global property protection gap, with expected annual uninsured losses of more than USD 81 billion (more than two thirds of the total gap of USD 120 billion for the sample countries). Earthquake risk makes up the majority of the gap in the US and Japan, while flood risk comprises nearly half of the expected uninsured loss in China. The prominence of these three countries in absolute terms is driven not only by natural exposure, but also by population, geographic area and property values.
Note: see the Appendix for details by country.
Source: Swiss Re Economic Research & Consulting and Non-life Risk Transformation.
Simulation tools can model expected future losses for different types of perils.
In absolute terms, the US, Japan and China account for most of the global natural catastrophe protection gap.
Figure 5: Expected insured and uninsured losses from natural catastrophes
0 5 10 15 20 25 30 35
Uninsured wind
Uninsured flood
Uninsured EQ
DenmarkCzech Republic
PolandSouth Africa
New ZealandHong Kong
IsraelAustria
PortugalSwitzerland
BelgiumColombiaAustralia
FranceUK
BrazilNetherlands
ChileIndia
CanadaGermany
IndonesiaPhilippines
TurkeyTaiwan
ItalyMexico
ChinaJapan
US
Annual expected nat cat property damage losses
uninsuredinsured
USD bn–25 –20 –15 –10 –5
Insured wind
Insured flood
Insured EQ
Uninsured windUninsured floodUninsured earthquakeInsured windInsured floodInsured earthquake
8 Swiss Re sigma No 5/2015
How big is the natural catastrophe protection gap?
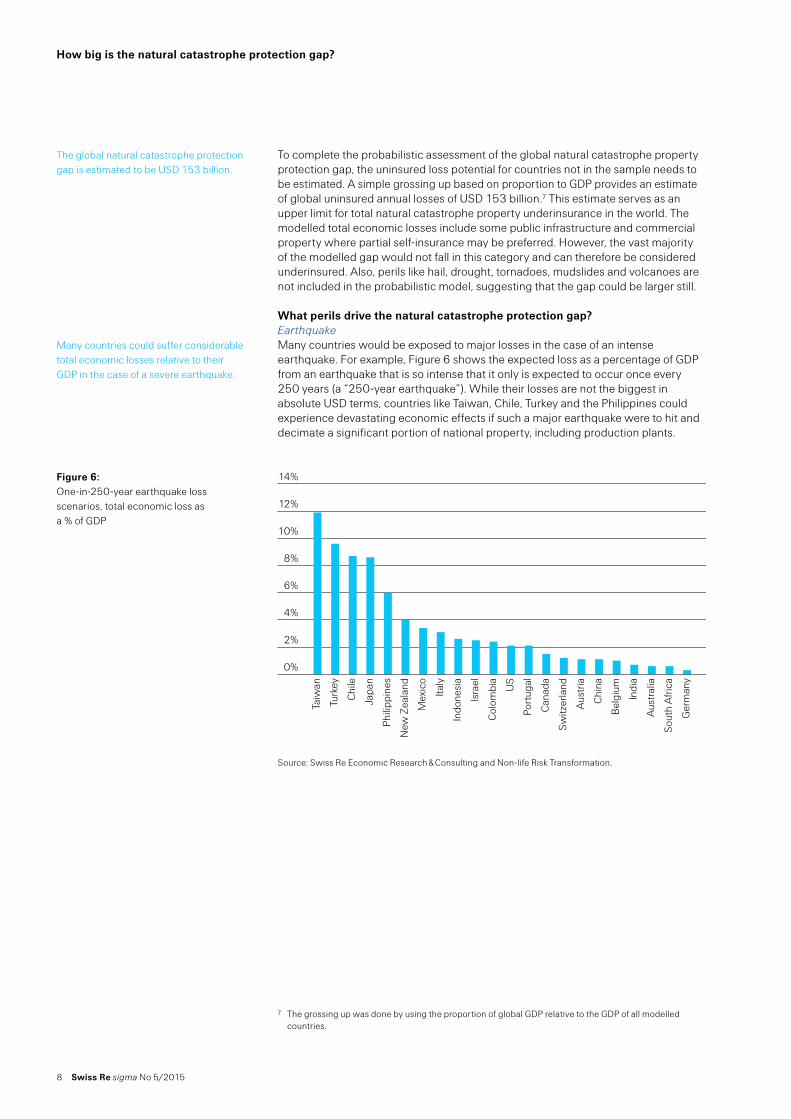
To complete the probabilistic assessment of the global natural catastrophe property protection gap, the uninsured loss potential for countries not in the sample needs to be estimated. A simple grossing up based on proportion to GDP provides an estimate of global uninsured annual losses of USD 153 billion.7 This estimate serves as an upper limit for total natural catastrophe property underinsurance in the world. The modelled total economic losses include some public infrastructure and commercial property where partial self-insurance may be preferred. However, the vast majority of the modelled gap would not fall in this category and can therefore be considered underinsured. Also, perils like hail, drought, tornadoes, mudslides and volcanoes are not included in the probabilistic model, suggesting that the gap could be larger still.
What perils drive the natural catastrophe protection gap?EarthquakeMany countries would be exposed to major losses in the case of an intense earthquake. For example, Figure 6 shows the expected loss as a percentage of GDP from an earthquake that is so intense that it only is expected to occur once every 250 years (a “250-year earthquake”). While their losses are not the biggest in absolute USD terms, countries like Taiwan, Chile, Turkey and the Philippines could experience devastating economic effects if such a major earthquake were to hit and decimate a significant portion of national property, including production plants.
Source: Swiss Re Economic Research & Consulting and Non-life Risk Transformation.
7 The grossing up was done by using the proportion of global GDP relative to the GDP of all modelled countries.
The global natural catastrophe protection gap is estimated to be USD 153 billion.
Many countries could suffer considerable total economic losses relative to their GDP in the case of a severe earthquake.
Figure 6: One-in-250-year earthquake loss scenarios, total economic loss as a % of GDP
0%
2%
4%
6%
8%
10%
12%
14%
Ger
man
y
Sout
h A
fric
a
Aus
tral
ia
Indi
a
Bel
gium
Chi
na
Aus
tria
Switz
erla
nd
Can
ada
Port
ugalUS
Col
ombi
a
Isra
el
Indo
nesi
a
Italy
Mex
ico
New
Zea
land
Phili
ppin
es
Japa
n
Chi
le
Turk
ey
Taiw
an
Swiss Re sigma No 5/2015 9
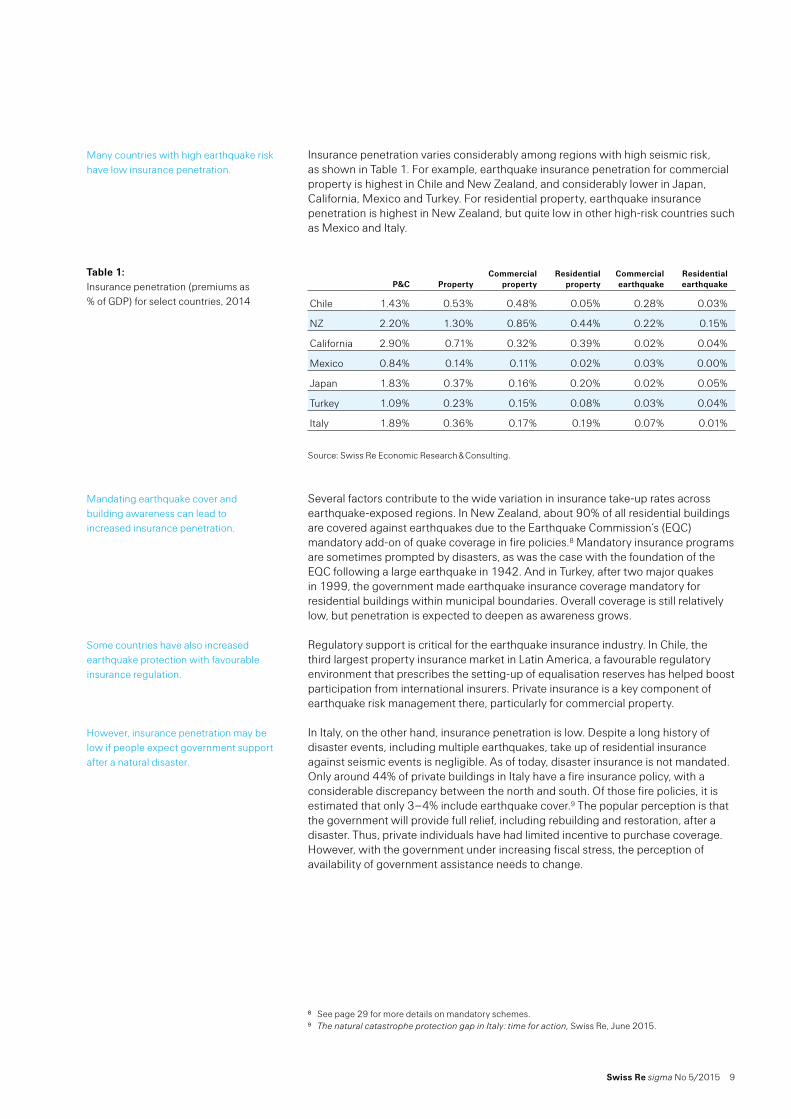
Insurance penetration varies considerably among regions with high seismic risk, as shown in Table 1. For example, earthquake insurance penetration for commercial property is highest in Chile and New Zealand, and considerably lower in Japan, California, Mexico and Turkey. For residential property, earthquake insurance penetration is highest in New Zealand, but quite low in other high-risk countries such as Mexico and Italy.
P&C Property Commercial
propertyResidential
propertyCommercial earthquake
Residential earthquake
Chile 1.43% 0.53% 0.48% 0.05% 0.28% 0.03%
NZ 2.20% 1.30% 0.85% 0.44% 0.22% 0.15%
California 2.90% 0.71% 0.32% 0.39% 0.02% 0.04%
Mexico 0.84% 0.14% 0.11% 0.02% 0.03% 0.00%
Japan 1.83% 0.37% 0.16% 0.20% 0.02% 0.05%
Turkey 1.09% 0.23% 0.15% 0.08% 0.03% 0.04%
Italy 1.89% 0.36% 0.17% 0.19% 0.07% 0.01%
Source: Swiss Re Economic Research & Consulting.
Several factors contribute to the wide variation in insurance take-up rates across earthquake-exposed regions. In New Zealand, about 90% of all residential buildings are covered against earthquakes due to the Earthquake Commission’s (EQC) mandatory add-on of quake coverage in fire policies.8 Mandatory insurance programs are sometimes prompted by disasters, as was the case with the foundation of the EQC following a large earthquake in 1942. And in Turkey, after two major quakes in 1999, the government made earthquake insurance coverage mandatory for residential buildings within municipal boundaries. Overall coverage is still relatively low, but penetration is expected to deepen as awareness grows.
Regulatory support is critical for the earthquake insurance industry. In Chile, the third largest property insurance market in Latin America, a favourable regulatory environment that prescribes the setting-up of equalisation reserves has helped boost participation from international insurers. Private insurance is a key component of earthquake risk management there, particularly for commercial property.
In Italy, on the other hand, insurance penetration is low. Despite a long history of disaster events, including multiple earthquakes, take up of residential insurance against seismic events is negligible. As of today, disaster insurance is not mandated. Only around 44% of private buildings in Italy have a fire insurance policy, with a considerable discrepancy between the north and south. Of those fire policies, it is estimated that only 3–4% include earthquake cover.9 The popular perception is that the government will provide full relief, including rebuilding and restoration, after a disaster. Thus, private individuals have had limited incentive to purchase coverage. However, with the government under increasing fiscal stress, the perception of availability of government assistance needs to change.
8 See page 29 for more details on mandatory schemes.9 The natural catastrophe protection gap in Italy: time for action, Swiss Re, June 2015.
Many countries with high earthquake risk have low insurance penetration.
Table 1: Insurance penetration (premiums as % of GDP) for select countries, 2014
Mandating earthquake cover and building awareness can lead to increased insurance penetration.
Some countries have also increased earthquake protection with favourable insurance regulation.
However, insurance penetration may be low if people expect government support after a natural disaster.
10 Swiss Re sigma No 5/2015
How big is the natural catastrophe protection gap?
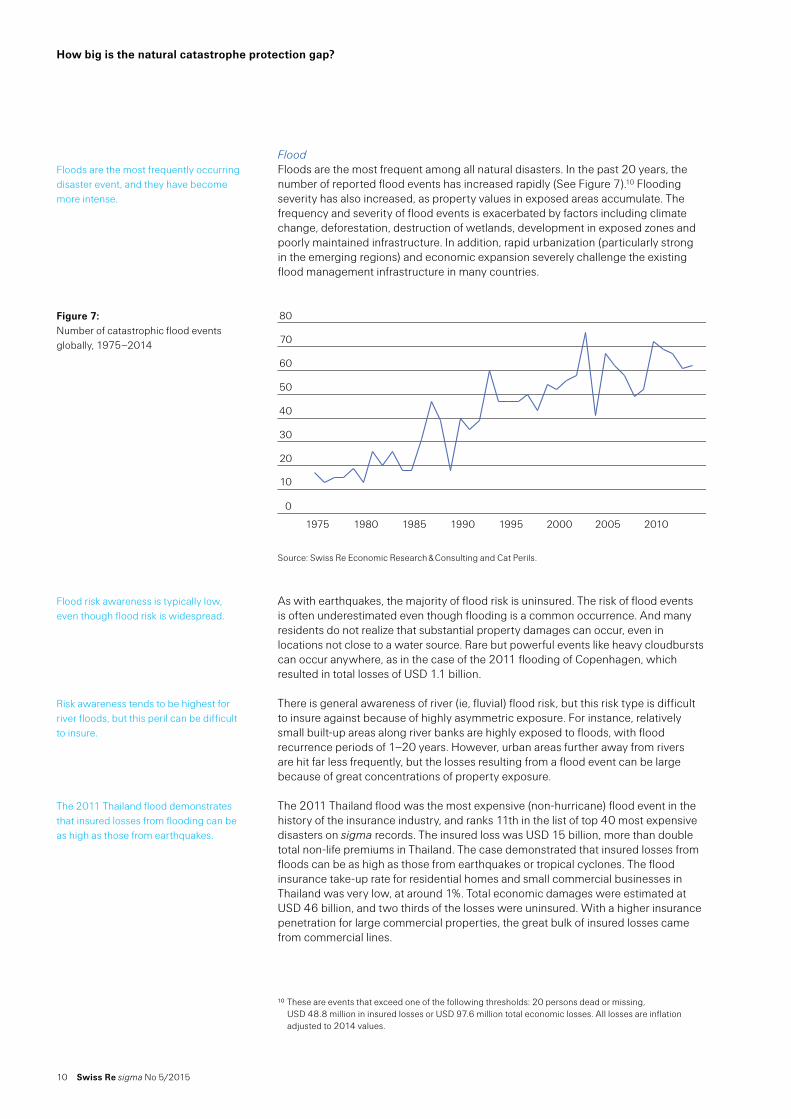
FloodFloods are the most frequent among all natural disasters. In the past 20 years, the number of reported flood events has increased rapidly (See Figure 7).10 Flooding severity has also increased, as property values in exposed areas accumulate. The frequency and severity of flood events is exacerbated by factors including climate change, deforestation, destruction of wetlands, development in exposed zones and poorly maintained infrastructure. In addition, rapid urbanization (particularly strong in the emerging regions) and economic expansion severely challenge the existing flood management infrastructure in many countries.
Source: Swiss Re Economic Research & Consulting and Cat Perils.
As with earthquakes, the majority of flood risk is uninsured. The risk of flood events is often underestimated even though flooding is a common occurrence. And many residents do not realize that substantial property damages can occur, even in locations not close to a water source. Rare but powerful events like heavy cloudbursts can occur anywhere, as in the case of the 2011 flooding of Copenhagen, which resulted in total losses of USD 1.1 billion.
There is general awareness of river (ie, fluvial) flood risk, but this risk type is difficult to insure against because of highly asymmetric exposure. For instance, relatively small built-up areas along river banks are highly exposed to floods, with flood recurrence periods of 1–20 years. However, urban areas further away from rivers are hit far less frequently, but the losses resulting from a flood event can be large because of great concentrations of property exposure.
The 2011 Thailand flood was the most expensive (non-hurricane) flood event in the history of the insurance industry, and ranks 11th in the list of top 40 most expensive disasters on sigma records. The insured loss was USD 15 billion, more than double total non-life premiums in Thailand. The case demonstrated that insured losses from floods can be as high as those from earthquakes or tropical cyclones. The flood insurance take-up rate for residential homes and small commercial businesses in Thailand was very low, at around 1%. Total economic damages were estimated at USD 46 billion, and two thirds of the losses were uninsured. With a higher insurance penetration for large commercial properties, the great bulk of insured losses came from commercial lines.
10 These are events that exceed one of the following thresholds: 20 persons dead or missing, USD 48.8 million in insured losses or USD 97.6 million total economic losses. All losses are inflation adjusted to 2014 values.
Floods are the most frequently occurring disaster event, and they have become more intense.
Figure 7: Number of catastrophic flood events globally, 1975–2014
0
10
20
30
40
50
60
70
80
20102005200019951990198519801975
Flood risk awareness is typically low, even though flood risk is widespread.
Risk awareness tends to be highest for river floods, but this peril can be difficult to insure.
The 2011 Thailand flood demonstrates that insured losses from flooding can be as high as those from earthquakes.
Swiss Re sigma No 5/2015 11
Mandatory government insurance schemes against flood risk have been introduced in some countries to boost insurance take-up. In Western Europe, those countries include France, Belgium, Denmark, Iceland, Norway, Spain and Switzerland. In the US, the National Flood Insurance Program (NFIP) has offered voluntary flood insurance through a federally-backed program since 1968, which has enhanced affordability but has recently become financially unsustainable due to major hurricane storm surge losses. The pros and cons of mandatory programs are discussed further below.
Flood risk: a multi-faceted hazardGlobally, river floods wreak most damage to property, and can leave thousands of square kilometres of river plain land under water for many weeks. Even superficially unscathed neighbouring areas can be affected by the rise in groundwater levels given seepage into basements, which can destabilize and sometimes destroy entire buildings.
The common cause for most flood events is heavy rainfall. Short but violent precipitation (torrential rainfall) over a small area can cause local accumulation of water, leading to flooding. In mountain areas, the largest risks are flash floods, when small watercourses swell very rapidly to create sudden floods, often combined with erosion and rubble deposits. Also, loose soil can become saturated with water, leading to destructive mudflows. Furthermore, dams, embankments and sewer systems, which are meant to protect exposed property, can themselves be a flood risk if they fail due to extreme weather or construction defects.
Significant flood risks are also prominent in coastal areas triggered by diverse causes such as spring tides, storm surges or — rarely, but more devastating – tsunamis. Other causes for floods include ice jams and lahars (volcanic mudflows). The causes for flood differ by region. In the US, one of the highest-risk areas for hurricanes, approximately 90% of insured flood losses are due to storm surges, while a minority is due to river flooding.
WindstormsWindstorm risk is more often insured than earthquake and flood, because it is typically covered within standard fire policies which have high participation rates in most mature markets. In emerging markets, on the other hand, 80% to 90% of wind losses are still uninsured because fire coverage is low. There are also significant deductibles in hazard prone areas. For example like in the US, where deductibles in hurricane prone areas typically range from 1% to 5% of the insured value, and can be as high as 15% in areas that are very highly exposed to wind or hurricane risk.
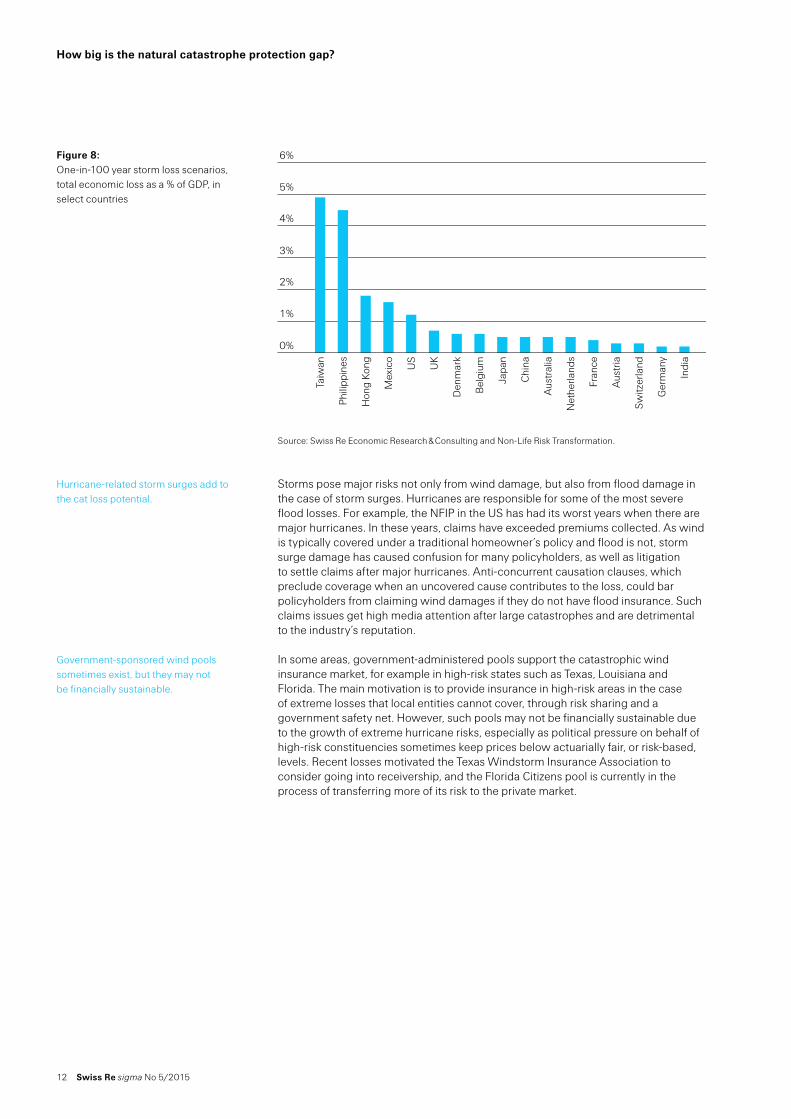
Many countries have high expected windstorm loss exposures. The US, China, Japan, Taiwan, Mexico, the UK and the Philippines have 1-in-100 year storm loss scenarios exceeding USD 10 billion. Most exposed, compared to the size of their economies, are Taiwan, the Philippines and Hong Kong, followed by Mexico. In all these highly exposed markets, property insurance penetration is below 0.2%.
Some countries have introduced mandatory flood risk insurance programmes.
River floods cause the most damage of any type of flood event.
Torrential rainfall can cause destructive flooding, even in areas far from rivers.
Coastal areas are also exposed, especially in regions where there are major storms or tsunamis.
Windstorm risk is better insured than other perils in mature markets because it is included in standard fire policies.
Some countries with high exposure have low property insurance penetration.
12 Swiss Re sigma No 5/2015
How big is the natural catastrophe protection gap?
Source: Swiss Re Economic Research & Consulting and Non-Life Risk Transformation.
Storms pose major risks not only from wind damage, but also from flood damage in the case of storm surges. Hurricanes are responsible for some of the most severe flood losses. For example, the NFIP in the US has had its worst years when there are major hurricanes. In these years, claims have exceeded premiums collected. As wind is typically covered under a traditional homeowner’s policy and flood is not, storm surge damage has caused confusion for many policyholders, as well as litigation to settle claims after major hurricanes. Anti-concurrent causation clauses, which preclude coverage when an uncovered cause contributes to the loss, could bar policyholders from claiming wind damages if they do not have flood insurance. Such claims issues get high media attention after large catastrophes and are detrimental to the industry’s reputation.
In some areas, government-administered pools support the catastrophic wind insurance market, for example in high-risk states such as Texas, Louisiana and Florida. The main motivation is to provide insurance in high-risk areas in the case of extreme losses that local entities cannot cover, through risk sharing and a government safety net. However, such pools may not be financially sustainable due to the growth of extreme hurricane risks, especially as political pressure on behalf of high-risk constituencies sometimes keep prices below actuarially fair, or risk-based, levels. Recent losses motivated the Texas Windstorm Insurance Association to consider going into receivership, and the Florida Citizens pool is currently in the process of transferring more of its risk to the private market.
Figure 8: One-in-100 year storm loss scenarios, total economic loss as a % of GDP, in select countries
0%
1%
2%
3%
4%
5%
6%
Indi
a
Ger
man
y
Switz
erla
nd
Aus
tria
Fran
ce
Net
herla
nds
Aus
tral
ia
Chi
na
Japa
n
Bel
gium
Den
mar
k
UK
US
Mex
ico
Hon
g Ko
ng
Phili
ppin
es
Taiw
an
Hurricane-related storm surges add to the cat loss potential.
Government-sponsored wind pools sometimes exist, but they may not be financially sustainable.
Swiss Re sigma No 5/2015 13
The global shortfall in property insurance
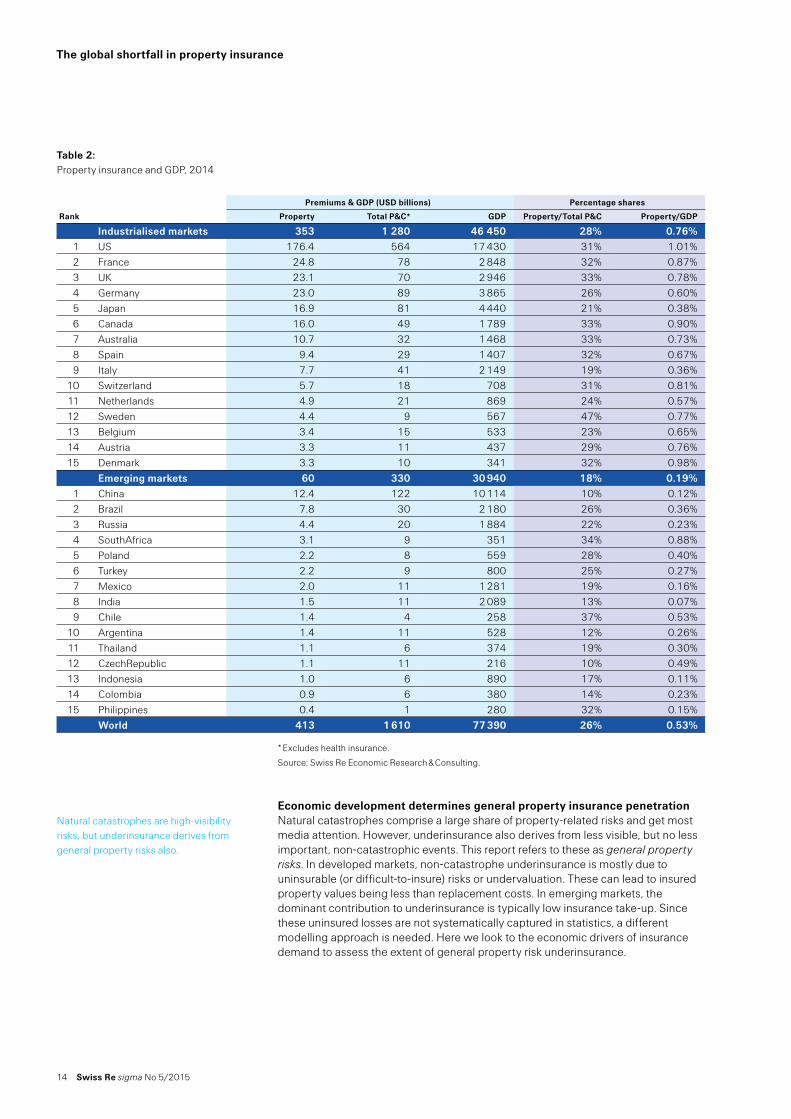
How big is the market?Global property insurance premium income was about USD 413 billion in 2014, which is 25% of total premiums in the Property & Casualty sector. The industrialised markets accounted for USD 353 billion, or 86% of global property premiums.
The US is by far the largest market with property premiums of USD 176 billion in 2014, or 43% of the global total. Of those, USD 82 billion came from residential, and USD 94 billion from commercial (including agriculture) property. The US also has the highest property insurance penetration (premiums 1.0% of GDP), driven by its high exposure to natural catastrophes and the propensity of US citizens and corporations to buy property insurance. In Canada, property premiums were USD 16 billion in 2014, the 6th largest market globally. Penetration was also high at 0.90%.
The largest property insurance markets in Western Europe are France, the UK and Germany, followed by Spain, Italy and Switzerland. There is considerable variation in penetration, spanning from 0.36% in Italy to 0.81% in Switzerland. The variation can in large part be explained by the extent of mandatory insurance. For example, in Switzerland, building insurance is mandatory in almost all cantons while in France and Spain, natural catastrophe insurance is covered by mandatory insurance schemes,11 and in the UK comprehensive property cover is required for mortgage-financed property. In Italy, however, a high number of residential and small commercial buildings, particularly in the south, are uninsured.
Japan is the 5th largest property market in the world with premium income of USD 16.9 billion in 2014. In addition to the commercial insurance industry, a significant part of the property protection is provided by mutual insurance corporations like Zenkyoren and Zenrosai. Even so, considering its high exposure to earthquake and windstorm risk, the combined commercial and residential insurance penetration in Japan is relatively low, at just 0.38% of GDP.
The largest emerging market is China, with property premiums of USD 12 billion in 2014. Brazil and Russia follow. Average property insurance penetration in the emerging markets is 0.21%, significantly lower than 0.77% in the advanced markets. However, the span of penetration is wide, from 0.07% in India to 0.53% in Chile (due to earthquake insurance being required as part of taking out a mortgage) and 0.88% in South Africa. In high-population countries such as China, Indonesia and India, penetration remains low. In India and Indonesia, many people live in rural areas and have limited access to insurance. But in China, where more than 50% of the population live in urban areas, demand is also low, with insurance penetration standing at just 0.12%.
11 Property insurance (ie, fire insurance) itself is not compulsory, but must be written with a corresponding natural perils cover.
Global property insurance premiums were USD 413 billion in 2014.
The US is the largest market …
…. while penetration rates in property insurance in Western Europe vary.
Japan has low insurance penetration, despite its high exposure to natural disaster risk.
The emerging markets comprise a small share of global property insurance premiums. China is the largest emerging market.
14 Swiss Re sigma No 5/2015
The global shortfall in property insurance
* Excludes health insurance.
Source: Swiss Re Economic Research & Consulting.
Economic development determines general property insurance penetration Natural catastrophes comprise a large share of property-related risks and get most media attention. However, underinsurance also derives from less visible, but no less important, non-catastrophic events. This report refers to these as general property risks. In developed markets, non-catastrophe underinsurance is mostly due to uninsurable (or difficult-to-insure) risks or undervaluation. These can lead to insured property values being less than replacement costs. In emerging markets, the dominant contribution to underinsurance is typically low insurance take-up. Since these uninsured losses are not systematically captured in statistics, a different modelling approach is needed. Here we look to the economic drivers of insurance demand to assess the extent of general property risk underinsurance.
Premiums & GDP (USD billions) Percentage shares
Rank Property Total P&C* GDP Property/Total P&C Property/GDP
Industrialised markets 353 1 280 46 450 28% 0.76%1 US 176.4 564 17 430 31% 1.01%2 France 24.8 78 2 848 32% 0.87%3 UK 23.1 70 2 946 33% 0.78%4 Germany 23.0 89 3 865 26% 0.60%5 Japan 16.9 81 4 440 21% 0.38%6 Canada 16.0 49 1 789 33% 0.90%7 Australia 10.7 32 1 468 33% 0.73%8 Spain 9.4 29 1 407 32% 0.67%9 Italy 7.7 41 2 149 19% 0.36%
10 Switzerland 5.7 18 708 31% 0.81%11 Netherlands 4.9 21 869 24% 0.57%12 Sweden 4.4 9 567 47% 0.77%13 Belgium 3.4 15 533 23% 0.65%14 Austria 3.3 11 437 29% 0.76%15 Denmark 3.3 10 341 32% 0.98%
Emerging markets 60 330 30 940 18% 0.19%1 China 12.4 122 10 114 10% 0.12%2 Brazil 7.8 30 2 180 26% 0.36%3 Russia 4.4 20 1 884 22% 0.23%4 SouthAfrica 3.1 9 351 34% 0.88%5 Poland 2.2 8 559 28% 0.40%6 Turkey 2.2 9 800 25% 0.27%7 Mexico 2.0 11 1 281 19% 0.16%8 India 1.5 11 2 089 13% 0.07%9 Chile 1.4 4 258 37% 0.53%
10 Argentina 1.4 11 528 12% 0.26%11 Thailand 1.1 6 374 19% 0.30%12 CzechRepublic 1.1 11 216 10% 0.49%13 Indonesia 1.0 6 890 17% 0.11%14 Colombia 0.9 6 380 14% 0.23%15 Philippines 0.4 1 280 32% 0.15%
World 413 1 610 77 390 26% 0.53%
Table 2: Property insurance and GDP, 2014
Natural catastrophes are high-visibility risks, but underinsurance derives from general property risks also.
Swiss Re sigma No 5/2015 15
Insurance penetration is a commonly used indicator of insurance demand, expressed as gross premiums written as a percentage of GDP. Empirical analysis of the drivers of property insurance penetration shows that differences in the relative demand for property insurance can be attributed to economic development. The developing world is more severely underinsured. For example, less than 1% of the estimated damage from the 2015 earthquake in Nepal was covered by insurance, compared with 73% in the 2010/2011 series of earthquakes in New Zealand.
On average, those with higher incomes are more able to afford insurance and have accumulated more assets that they want to protect. Conditional on other factors, insurance penetration rises with GDP per capita. However, different levels of GDP are accompanied by different growth rates of penetration. This is the classic “S-curve” that has been observed in previous insurance data.
In high-income countries, the rise in insurance penetration tends to slow as GDP per capita rises. The rise in penetration in emerging economies with medium per capita GDP is much faster. In these markets, penetration accelerates most rapidly as income and wealth grow, after the lowest middle-income level is reached. Considering the rapid emergence of the middle class in emerging economies – with people accumulating more wealth and assets – the S-curve suggests that the opportunity to increase penetration is greatest in the middle-income countries.
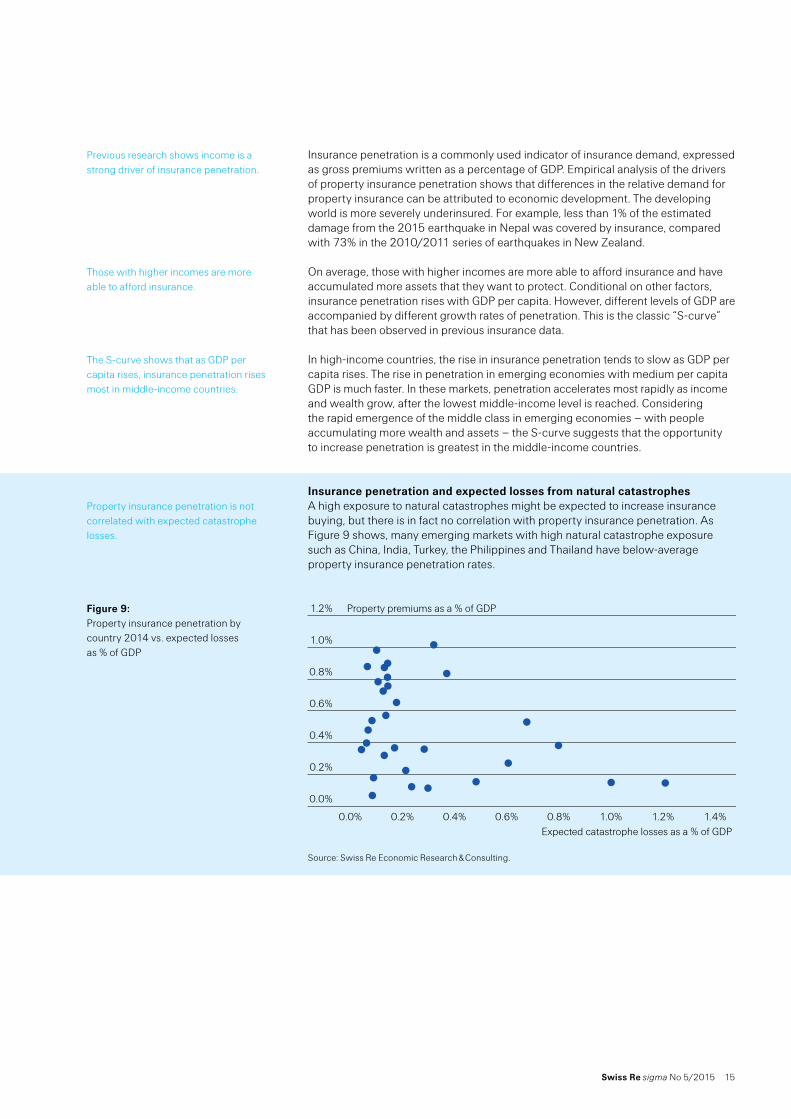
Insurance penetration and expected losses from natural catastrophesA high exposure to natural catastrophes might be expected to increase insurance buying, but there is in fact no correlation with property insurance penetration. As Figure 9 shows, many emerging markets with high natural catastrophe exposure such as China, India, Turkey, the Philippines and Thailand have below-average property insurance penetration rates.
Source: Swiss Re Economic Research & Consulting.
Previous research shows income is a strong driver of insurance penetration.
Those with higher incomes are more able to afford insurance.
The S-curve shows that as GDP per capita rises, insurance penetration rises most in middle-income countries.
Property insurance penetration is not correlated with expected catastrophe losses.
Figure 9: Property insurance penetration by country 2014 vs. expected losses as % of GDP
0.0% 0.2% 0.4% 0.6% 0.8% 1.0% 1.2% 1.4%
0.0%
0.2%
0.4%
0.6%
0.8%
1.0%
1.2%
Expected catastrophe losses as a % of GDP
Property premiums as a % of GDP

16 Swiss Re sigma No 5/2015
The global shortfall in property insurance
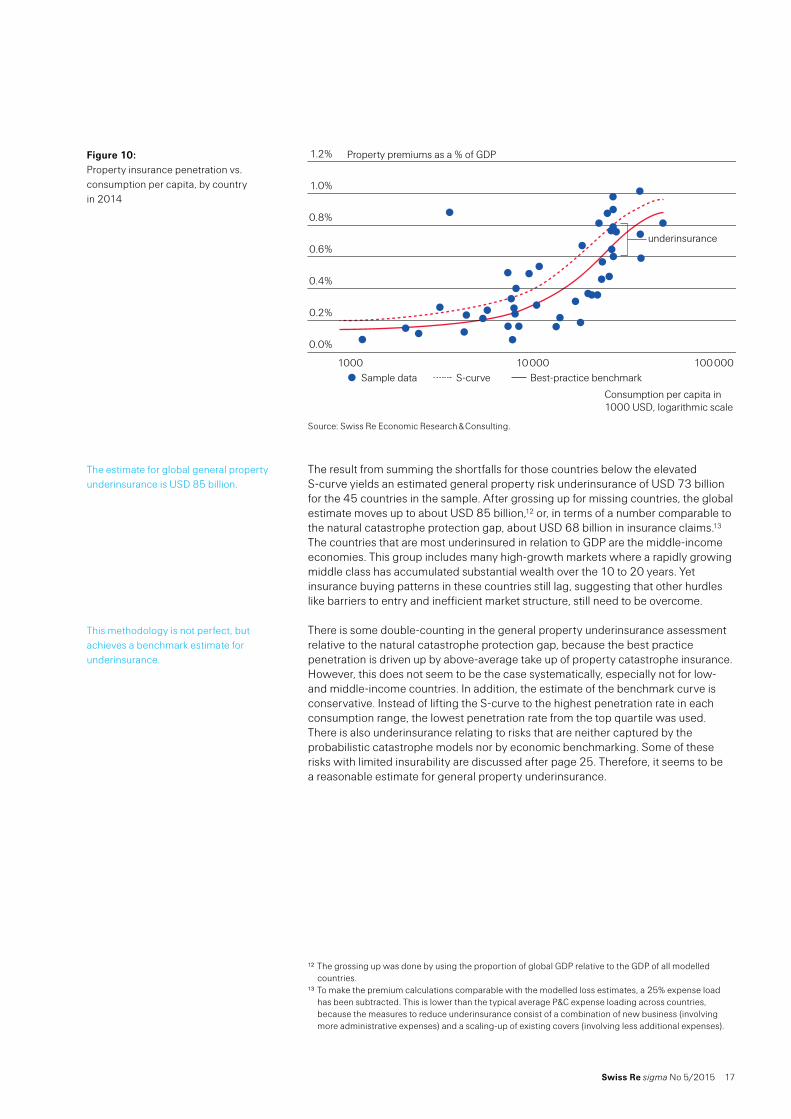
Quantifying general property underinsurance Using the S-curve model, a “best-practice benchmark” for insurance penetration has been estimated for a sample of 45 countries. The model is based on private consumption per capita, the economic variable most strongly correlated to insurance penetration in the sample countries. The modelled curve represents the average relationship between economic development and penetration, but the better-insured countries set the benchmark. As a crude proxy but conservative estimate, for the best-practice benchmark the difference of the top quartile to the median within each of the three consumption ranges was used to lift the S-curve to a higher level. This approach is complementary to the probabilistic natural catastrophe models discussed previously. Underinsurance of natural catastrophe perils lowers the benchmark calculations and therefore needs to be considered in addition to these results.
There is a wider range of insurance penetration for emerging economies. Therefore the spread between top quartile and median was calculated separately for low, medium and high-income countries. The add-on for the higher consumption countries is 0.08%, for middle 0.14% and for low 0.06%. The modelled benchmark curve was lifted by an add-on factor derived from smoothing between the spreads calculated for the three income groups. See the dotted curve in Figure 10. The data behind the calculations is shown in Table 6 in the Appendix.
Current penetration (property premiums as % of GDP)
Modeled benchmark penetration
Consumption per capita, USD median top quartile spreadMedian;
% of GDPgap in
USD billion
High (> 25K) 0.76% 0.84% 0.08% 0.80% 18.1
Middle (10K – 25K) 0.36% 0.50% 0.14% 0.60% 29.4 Low (< 10K) 0.22% 0.28% 0.06% 0.28% 25.8 Total of 45 countries 73.5
Source: Swiss Re Economic Research & Consulting.
All countries below the elevated S-curve are considered to be underinsured equal to the value of lifting their penetration, given their consumption level, to the new curve (see Figure 10). For example in the case of the Netherlands, the S-curve model suggests a penetration rate of 0.60%. With an add-on factor of 0.13, the modelled benchmark penetration is 0.73%. Compared to an actual property penetration of 0.57%, there is underinsurance of 0.17% of GDP, or USD 1.45 billion.
An S-curve model was used to define a best-practice benchmark for general property insurance penetration.
The best-practice S-curve has higher penetration rates than the estimated S-curve.
Table 3: Property insurance penetration 2014 vs. consumption per capita
Countries below the elevated S-curve are considered to be underinsured.
Swiss Re sigma No 5/2015 17
Source: Swiss Re Economic Research & Consulting.
The result from summing the shortfalls for those countries below the elevated S-curve yields an estimated general property risk underinsurance of USD 73 billion for the 45 countries in the sample. After grossing up for missing countries, the global estimate moves up to about USD 85 billion,12 or, in terms of a number comparable to the natural catastrophe protection gap, about USD 68 billion in insurance claims.13 The countries that are most underinsured in relation to GDP are the middle-income economies. This group includes many high-growth markets where a rapidly growing middle class has accumulated substantial wealth over the 10 to 20 years. Yet insurance buying patterns in these countries still lag, suggesting that other hurdles like barriers to entry and inefficient market structure, still need to be overcome.
There is some double-counting in the general property underinsurance assessment relative to the natural catastrophe protection gap, because the best practice penetration is driven up by above-average take up of property catastrophe insurance. However, this does not seem to be the case systematically, especially not for low- and middle-income countries. In addition, the estimate of the benchmark curve is conservative. Instead of lifting the S-curve to the highest penetration rate in each consumption range, the lowest penetration rate from the top quartile was used. There is also underinsurance relating to risks that are neither captured by the probabilistic catastrophe models nor by economic benchmarking. Some of these risks with limited insurability are discussed after page 25. Therefore, it seems to be a reasonable estimate for general property underinsurance.
12 The grossing up was done by using the proportion of global GDP relative to the GDP of all modelled countries.
13 To make the premium calculations comparable with the modelled loss estimates, a 25% expense load has been subtracted. This is lower than the typical average P&C expense loading across countries, because the measures to reduce underinsurance consist of a combination of new business (involving more administrative expenses) and a scaling-up of existing covers (involving less additional expenses).
Figure 10: Property insurance penetration vs. consumption per capita, by country in 2014
1000 10 000 100 000
0.0%
0.2%
0.4%
0.6%
0.8%
1.0%
1.2%
Consumption per capita in1000 USD, logarithmic scale
Sample data S-curve Best-practice benchmark
Property premiums as a % of GDP
underinsurance
The estimate for global general property underinsurance is USD 85 billion.
This methodology is not perfect, but achieves a benchmark estimate for underinsurance.
18 Swiss Re sigma No 5/2015
The global shortfall in property insurance
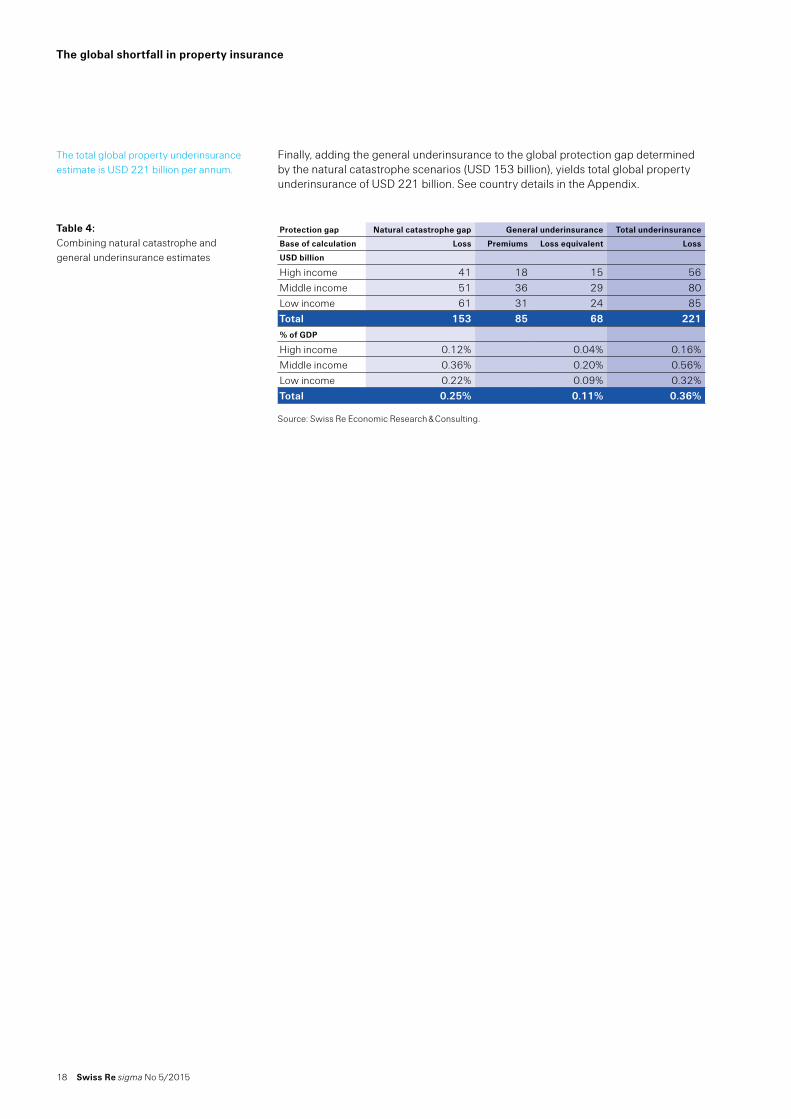
Finally, adding the general underinsurance to the global protection gap determined by the natural catastrophe scenarios (USD 153 billion), yields total global property underinsurance of USD 221 billion. See country details in the Appendix.
Protection gap Natural catastrophe gap General underinsurance Total underinsurance
Base of calculation Loss Premiums Loss equivalent Loss
USD billion
High income 41 18 15 56Middle income 51 36 29 80Low income 61 31 24 85Total 153 85 68 221% of GDP High income 0.12% 0.04% 0.16%Middle income 0.36% 0.20% 0.56%Low income 0.22% 0.09% 0.32%Total 0.25% 0.11% 0.36%
Source: Swiss Re Economic Research & Consulting.
The total global property underinsurance estimate is USD 221 billion per annum.
Table 4: Combining natural catastrophe and general underinsurance estimates
Swiss Re sigma No 5/2015 19
Underinsurance explained
Deconstructing the causes of underinsuranceThere are four types of underinsurance, each requiring different solutions to narrow or close the gap: entirely uninsured, insured but with certain perils not covered, insured but with restrictions, and insured but at too low a valuation.
Entirely uninsuredPotential clients in this group buy no property insurance at all, either because they do not know about it or believe that the cost of insurance outweighs the benefit. The majority of uninsured risk is held by this group in many emerging markets, most prominently China, one of the three countries with the largest measured property protection gap.
Potential clients in this group require tailored concepts to be convinced to purchase property insurance. Natural catastrophe cover – in particular on a standalone basis – may not be the most effective in promoting the concept of insurance, because disaster events may be very remote in customers’ minds. Rather, the approach should be to focus on risks that rank highest with these consumers, for instance agriculture, motor or health insurance, before talking about protection for residential property.
Mandatory motor liability cover has been the gateway to developing a broad-based personal lines insurance sector in many emerging countries. Insurance companies have benefitted from the development of retail distribution networks and their experience with retail underwriting and policy administration in motor. These can be leveraged to create cross-selling opportunities into other risk segments like property.
Insured, but certain perils are not coveredIn this group insured clients typically have a fire policy, but their coverage excludes certain natural world perils such as floods and earthquakes. This pool is fundamentally different from the previous in that the general concept of insurance is understood. However, clients may be unaware that certain perils are not covered, they may not see sufficient benefit in natural catastrophe coverage, or coverage may simply not be available. The world’s top two uninsured perils, Japan and California earthquakes, fall into this category. Other prominent examples include floods in the Netherlands and Canada, and earthquakes and floods in Italy.
Insured, but policy terms are restrictiveIn this case, the insured holds a policy which covers natural catastrophe perils, but the cover is restrictive, perhaps due to limits on insurability. Examples are secondary effects of a natural disaster event, such as business interruption, contingent business interruption or loss of income. The contribution of this type of underinsurance to the overall gap is significant.
Normally, more comprehensive coverage is either unavailable or is deemed to be unaffordable for many. Two top protection gaps provide prominent examples: California Earthquake Authority (CEA) policies available to Californians have a deductible of 10% or 15% of the insured value. According to Swiss Re modelling, almost 50% of expected quake losses would be borne by the policyholders’ retentions. And in Japan, the homeowners’ policies of the Japanese Earthquake Response programme cover only half of the insured value.
Insured, but undervaluedIn this case, the perils are covered and the policy terms are in line with a desired level of coverage, but the valuation parameters are too low. There are a variety of reasons for undervaluation in both commercial and residential property.
As far as it relates to a lack of information or awareness, this can be addressed by specific communication from insurers and/or their distribution channels. Inertia and the unwillingness to deal with negative events suggest an important role of product design with index features. This is especially relevant in high-inflation environments.
There are four types of underinsurance.
A large portion of households, particularly in the emerging markets, are entirely uninsured.
The entirely uninsured may purchase motor or fire insurance before considering natural catastrophe cover.
Mandatory motor liability is a gateway to insurance for many first-time buyers.
A second category of underinsurance encompasses the insured who are not covered for certain perils.
A third group is insured but with restrictive policy terms, for example high deductibles that leave large uninsured losses in the event of a disaster.
For this group, more comprehensive coverage is either unavailable or unaffordable.
Underinsurance also results from undervaluation of property assets …
… due to lack of information, awareness, or willingness to confront unpleasant issues.
20 Swiss Re sigma No 5/2015
Underinsurance explained
What factors influence the decision to buy property insurance?Risk awarenessA Gallup poll in 2013 on risk perceptions found that in most countries, the majority of survey respondents think there will be more frequent natural catastrophes events 20 years from now.14 Nevertheless, there is little correlation between risk perception and objective measures of natural disaster. For example, few respondents in Hong Kong said their neighborhood was a high-disaster risk area, but many respondents in Italy did. The paradox is that Hong Kong has a higher disaster risk profile than Italy.
A strong perception of risk does not necessarily lead to insurance purchases. A high incidence (68%) of Italian respondents in the Gallup poll, for example, reported their neighbourhood as having been hit by a major natural catastrophe in the past, and a high proportion (59%) said there is a big chance it could be hit again. Yet only 44% of private buildings in Italy are insured.15
A lack of awareness or salience of low-probability events can contribute to underinsurance and under-preparation. For example, research on individual behaviour during Hurricane Sandy in New York in 2012 showed that only 37% of homeowners who already owned removable storm shutters put them up, and only 54% of residents whose homes were less than a block away from a body of water indicated that they had flood insurance.16 In Vancouver, about 60% of residential homes have earthquake coverage and in Montreal only 4% do, even though both cities are exposed to earthquake risk.
There is evidence that insurance demand responds to natural disaster events but that the effect diminishes over time, perhaps as the memory of the loss event lapses or as new residents who do not have prior disaster awareness move into disaster-exposed areas. In the US, research shows that flood insurance take-up rates significantly increase in flood-affected counties in the year after a flood, but steadily decline over the next decade to return to pre-disaster take-up rates.17
Knowledge about insurance products and their availability Consumer knowledge about insurance is a critical foundation for building a culture of protection. Even well-educated people are not necessarily financially literate, as a survey of eight countries in 2012 showed.18 Insurance literacy requires an understanding of specific policy components such as how much is covered, premium levels, and how to make a claim. Yet surveys show that consumers often do not fully understand their coverage, even in developed countries. This lack of knowledge can become particularly problematic in complex loss events such as a major storm surge event, when a policy may cover wind but not flood damage.
In a survey of Australian homeowners in 2013, many were uncertain about specific exclusions. For example 45% did not know whether their policy covered earthquake risk and 37% were unsure if it covered floods. This uncertainty extended even to high risk areas, with 23% of homeowners in known flood risk zones unsure about their coverage. Underinsurance appeared to be more prominent among young people: of 18 to 29 year olds, 21% deemed building insurance unnecessary outside high disaster risk areas, and 28% thought contents insurance unnecessary in low-crime neighbourhoods.19
14 150 Years Swiss Re - Risk Perception Survey, The Gallup Organization Europe, 2013.15 The natural catastrophe protection gap in Italy: time for action, Swiss Re, June 2015.16 Meyer, E., Baker, J., Broad, K., Czajkowski, J., and Orlove, B. “The Dynamics of Hurricane Risk Perception:
Real-Time Evidence from the 2012 Atlantic Hurricane Season”, Bulletin of the American Meteorological Society, September 2014, pp 1389–1404.
17 Gallagher, J. “Learning about an Infrequent Event: Evidence from Flood Insurance Take-Up in the United States.” American Economic Journal: Applied Economics, July 2014, pp 206–33.
18 Dr. Olivia Mitchell on global financial literacy, State Street Corporation, 2013. 19 The Understand Insurance Research Report, Insurance Council of Australia, October 2013.
Risk perceptions are often not objective measures of disaster risk …
… and need not translate into insurance buying behavior.
Low risk awareness leads to underinsurance and low investment in prevention or mitigation.
There is evidence that insurance demand increases after catastrophes, but that over time, it diminishes again.
Consumer knowledge about insurance is critical to sustaining take-up rates.
Even well-educated consumers often don’t know what cover they have.
Swiss Re sigma No 5/2015 21
AffordabilityAffordability of property insurance is a critical factor in buying decisions. Global consumer surveys reveal that half of insurance buyers make final policy decisions based on price.20 Respondents consistently select their policies based on cost rather than adequacy of coverage, meaning that high premium payments may be an important factor in the underinsurance of especially costly risks.
The importance of affordability is even more acute in emerging markets, where many consumers do not have a habit of insurance buying. It is critical also for low-income households in either developed or emerging markets where budget constraints may require reducing consumption in other areas in order to be able to pay insurance premiums.
Trust in insurers Intangible factors relating to the consumer experience play another important role. Trust in insurance providers has been shown to be a critical driver of consumer buying behavior. People want to know not only that they are paying a fair price, but also that insurers will be reliable in paying out claims. Global survey evidence shows that the level of consumer trust in insurers is lower than that of banks and retailers.21 High-profile incidents of claims disputes, such as those after Hurricane Sandy in the US, pose challenges for insurers’ reputations.
Reliance on government aid as a substitute for insurance Governments have historically played an important role in post-event disaster relief. For example, most losses arising from natural disasters in Italy have traditionally been covered by the state on a post-event basis.22 Similarly, the Japanese government bore most of the 2011 Tohoku earthquake losses, as did the Chinese government with the 2008 Sichuan quake, and the Turkish government with the 1999 Izmit earthquake. In Japan and Canada, explicit government compensation commitments for private property are in place. If there is widespread expectation of post disaster relief, there is less incentive to buy insurance, leading to a crowding out of private sector solutions.
Using data from the NFIP, Kousky et al (2013) found that an increase in average aid grants reduces average insurance coverage by more than the amount of aid, although there was no impact on take-up rates. On the other hand, they found that government loans have no effect on insurance demand and could therefore be a more effective policy tool.23
Using data on natural disasters, government spending and election returns, Healy and Malhotra (2009) show that voters reward the incumbent presidential party for delivering disaster relief spending, but not for investing in disaster preparedness. These inconsistencies distort the incentives of public officials, leading the state to underinvest in disaster preparedness and so generating potentially substantial public welfare losses. They estimate that spending on preparedness is worth multiples of the future damage it mitigates.24 The inference is that it is more efficient for the government to focus its resources on effective mitigation and to encourage private insurance solutions for post-disaster funding, than to provide relief funding after an actual catastrophe event.
20 Global Insurance Survey, Ernst & Young, 2014.21 Global Consumer Insurance Survey, Ernst & Young, 2014.22 See, The natural catastrophe protection gap in Italy: time for action, Swiss Re, June 2015.23 Kousky, C., E. Michel-Kerjan and P. Rachky, “Does federal disaster assistance crowd out private demand
for insurance?” Risk Management and Decision Processes Center, The Wharton School, University of Pennsylvania, Working Paper #2013–10.
24 Healy, A. and N. Malhotra, “Myopic Voters and Natural Disaster Policy,” American Political Science Review, August 2009, pp 398–406.
Many insurance buyers select policies based on cost rather than scope of cover.
Affordability is critical especially for low-income households and in emerging markets.
Consumer trust of insurance providers is also a key factor in the buying decision.
Many countries have established patterns of government disaster relief …
… which can crowd out demand for private sector insurance.
Political action is typically easier for post-disaster relief than for pre-disaster mitigation, but waiting until after a disaster can result in higher overall costs.
22 Swiss Re sigma No 5/2015
Underinsurance explained
Ease of buying insurance productsSurvey evidence indicates that ease of purchase may also be an important factor in insurance buying behaviour. In a recent global survey, while 50% of consumers reported buying insurance policies based on cost, nearly 30% reported that frequency of communication with their insurer was an important factor, while 30% highly valued the level of service received.25 It is often said that insurance is “sold not bought,” except in cases of government or bank-mandated coverage. As an abstract and intangible concept, insurance often requires customized explanation.
Undervaluation of insured assetsUndervaluation also contributes to underinsurance. Valuing properties at less than replacement value means that insurance policies will not cover full damages. Undervaluation may occur in both commercial and personal insurance for a variety of reasons, including lack of valuation capacity, lack of awareness of the insurance coverage, or deliberate undervaluation to reduce premium costs. Generally, the definition of “insurable value” for buildings, plants and equipment is the replacement cost. In many cases, risk managers report accounting-driven market values or book values rather than current appraisals for replacement costs. Insurers use databases and models from appraisal services to mitigate the potential for under-reporting.
A sample of nearly 630 000 property units in the US and Canada in 2014 shows that a considerable portion of properties were valued lower than their estimated replacement value, according to proprietary analysis obtained by Swiss Re from property and financial analytics firm CoreLogic. The data show that smaller properties in particular had a larger valuation gap in terms of insured limits. Properties with limits below USD 20 million (representing 95% of the sample) were under-valued by an average 26%. And properties under USD 5 million by 38% (81% of the sample). A main reason for the more severe under-valuation of smaller properties is the use of depreciated values from accounting records rather than assessing replacement values. By type of occupancy, rental apartment buildings were on average under-valued by 14% and wholesale and retail trade properties by an average 25%.
There can also be substantial undervaluation of residential property. Personal property undervaluation can be driven by homeowner lack of awareness or policy choice based on affordability rather than adequate coverage. A survey of Australian homeowners in 2013 found that more than 80% were underinsured for their home and contents.26 In most cases, buildings and contents were insured according to the homeowner’s own evaluations, but one-third had not updated their contents to cover new possessions. Up to 25% of respondents were knowingly unsure about what their policies covered, with almost half admitting that they had not read the policy document thoroughly and 10% admitting to deliberately underestimating their building value in order to lower their premiums.
Depending on the policy wording, the burden of undervaluation may fall on either the insured or the insurer. For example, in the US many contracts used to contain an average clause, which stated that if the insurance value of a property at the time of loss or damage was less than its real value, claims payments would be reduced proportionally according to the difference. With an average clause, undervaluation results in a lower claim payment and as a result, there is a higher incentive for the insured to obtain a correct valuation. Although average clauses still exist in many policies in other countries, or in smaller commercial properties in the US, many large corporations in the US no longer have them. That means insurers may incur unexpected claims costs in cases of large commercial undervaluation.
25 Global Consumer Insurance Survey, Ernst & Young, 2014.26 The Understand Insurance Research Report, Insurance Council of Australia, October 2013.
Ease of purchase and insurer interaction are also important factors in consumers’ buying decisions.
Valuing properties at less than replacement value results in underinsurance.
More than 80% of residential properties were undervalued in an Australian survey, often because of omissions by homeowners.
Policy wording can shift the burden of commercial undervaluation to either the insured or the insurer.
Swiss Re sigma No 5/2015 23
Risks that challenge the bounds of insurabilityInsurable risks are measurable subject to accidental damage and have manageable maximum losses, premium rates that are acceptable to both insurer and insured, and adequate industry capacity. It is challenging for re/insurers to provide sufficient and affordable covers to households and corporations for risks with a high potential of serial losses, and where probabilities are difficult to assess. Among these risks are natural catastrophes like fluvial floods (high probability of serial losses in risk prone areas) and earthquakes (very rare events, and also high probability of serial losses when earthquakes do happen). But there are also man-made risks which challenge the boundaries of insurability.
Terrorism risks: difficult to assess and insureTerrorism is a prominent example of a risk that fails to meet the criteria for insurability. There is a lack of both historical and simulation data for terrorism. Existing data is mostly classified by intelligence agencies. Further, any attempt to de-classify and model such data in private markets could invite terrorists’ deliberate attempts to evade prediction.
Although terrorism coverage is available for most insureds much of the time, it is not universally available under free market conditions. It is generally provided by the private sector and is backed up by the government. Because terrorism risk has many qualities that make it difficult to insure, insurers limit their exposure. The resulting limited supply of coverage means that for some insureds, it will be either entirely unavailable or available at prices that are prohibitive.
Take-up rates for commercial terrorism risk insurance differ widely by sector, size of business and geographic location. For example, businesses in cities perceived to be more at risk of terrorist attacks are more likely to demand terrorism insurance, creating a potential accumulation risk for private insurers. In the US, terrorism insurance take-up rates in 2012 ranged from 42% in the chemicals sector to 81% in the media sector, and from 57% in the West to 74% in the Northeast.27 Average take-up rates increased steadily from 27% in 2003 (the first year the Terrorism Risk Insurance Act was in effect) to a stable rate between 60–64% by 2009.28
Limited insurability of supply chain risk and contingent business interruptionAon’s 2015 Global Risk Management Survey ranks business interruption as the seventh highest concern among managers. Executives in the chemical and utility industries, which are susceptible to accidents and interruptions because of the inherently volatile nature of their businesses, rank business interruption as their second highest risk. In the Middle East and Africa, regions with the highest political risks, respondents rate business interruption as the number four top risk.29
Some supply-chain risks are at least party insured by Contingent Business Interruption (CBI) and related coverages such as Contingent Extra Expense (CEE), Service Interruption, Off-Premises Power Interruption (OPP) and Denial of Access. In most parts of the world, coverage is provided on a limited basis within a typical property insurance policy. CBI covers the potential business interruption and extra expenses to an insured from physical loss or damage at locations of key suppliers of products and services, or at receivers (ie, key customers) of supplies and services. The Japanese Tohoku earthquake and Thailand floods of 2011 resulted in large business interruption claims from major corporations due to damage at key suppliers. The complexity of these claims emphasize the necessity to better understand and control the accumulation potential of CBI risks, particularly as a consequence of natural catastrophes.
27 Terrorism Risk Insurance, Marsh & McLennan Companies, 18 September 2013.28 2014 Terrorism Risk Insurance Report, Marsh Risk Management Research, April 2014. 29 Global Risk Management Report, Aon, 2005,
Not all risks are fully insurable, because not all are measurable.
Terrorism risk lacks many characteristics that would make it insurable.
Terrorism coverage is not widely available under free market conditions.
Commercial terrorism insurance take-up rates differ widely by location and type of company.
Business interruption is a key risk management concern.
Contingent Business Interruption and related coverages can provide some protection against supply-related losses.
24 Swiss Re sigma No 5/2015
Underinsurance explained
CBI insurance is a first-party risk from a third-party exposure and is usually beyond the control of the insured. CBI as a consequence of a natural catastrophe, as demonstrated in Japan and Thailand, typically affects a higher number of suppliers and customers, triggering losses all over the world. In the past, the insurance industry’s view was that man-made CBI losses typically affect a small number of suppliers or customers. But the 2012 fire and explosion at a plant belonging to Evonik Industries, the chemical manufacturer in Germany, caused massive disruptions for the auto industry around the world, making it evident that an isolated man-made event can cause covered losses worldwide, impacting many industries.
Some important supply chain risks are not covered by CBI insurance, such as intangible or indirect losses (eg, loss of reputation, loss of customers, IT failures between key suppliers and customers nor financial failure at one or the other). There are discussions about insurers providing a broader form of CBI insurance to also include non-damage losses. However, insureds have so far been reluctant to provide more transparency into supply chains in order to facilitate greater insurer understanding of the complex exposures. Also, willingness to pay for the broader coverage is limited. Finally, given a lack of exposure data and transparency, and therefore limited insurability, CBI/CEE limits are typically a fraction of the business interruption limits offered for other losses to insured properties, and may not be large enough to cover the largest loss potential.
Cyber risks are complex and spread rapidlyIn recent times, there has been a surge in cyber-attacks and growing public awareness thereof. Aon’s 2015 Global Risk Management Survey ranks cyber as the 9th highest concern for businesses worldwide. The global annual cost of cybercrime is estimated to be in the range of USD 375 billion to USD 575 billion. The average time to resolve a cyber-attack is also getting longer, climbing to 45 days last year from 32 in 2013.30
There are considerable regional differences in cyber risk coverage. In the US, the class action litigation system drives third-party liability demand. European and Asian firms, meanwhile, are more concerned about the first-party risks of data breaches, including reputational damage, remediation of data and business interruption costs.
A current challenge for specialist commercial insurers is to develop products for operational risk from cyber-attacks that cover both non-damage and physical damage business interruption. So far cyber insurance has been focused on third-party data security and privacy risks, with very limited first-party coverage. Policies are limited to covering non-damage business interruption such as network outages. The broader operational risks resulting from cyber-attacks and the supply chain vulnerabilities discussed above influence product development efforts.
What is insurable in the market can change over time. Swiss Re’s SONAR report, for example, lists a range of emerging risks that have a reasonable probability to become relevant and may not yet be sufficiently insurable.31 The application of advanced data analytics may help overcome some of these underwriting restrictions by closing the information gap. On the other hand, if the frequency and severity of an insured risk increases sharply in a way not envisioned, the additional losses may be substantial and even threaten the financial stability of an insurer. In such cases, a risk once deemed insurable can become challenging to insure or uninsurable, as has happened with terrorism.
30 Net Losses: Estimating the Global Cost of Cybercrime, McAfee, June 2014. 31 SONAR: New emerging risk insights, Swiss Re, May 2015
CBI risk is usually beyond the control of the insured, and either natural or man-made events can cause global losses.
Global cyber-crime costs are currently estimated to be in the range of USD 375–575 billion annually.
European and Asian firms are more concerned about business interruption risks from cyber events, while US firms focus more on cyber liability.
One challenge is to develop insurance that covers physical damage caused by cyber-attacks.
The bounds of insurability can change over time. Improvements in modelling may increase insurability, while changes in risks may reduce insurability.
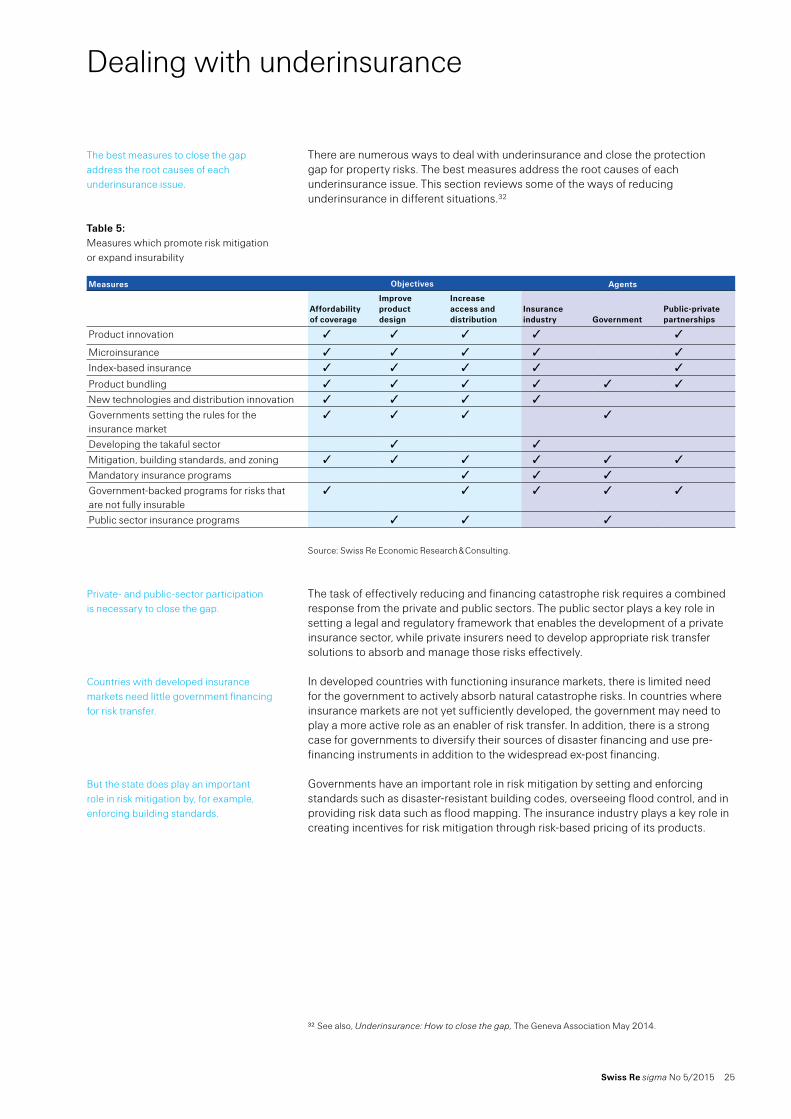
Swiss Re sigma No 5/2015 25
Dealing with underinsurance
There are numerous ways to deal with underinsurance and close the protection gap for property risks. The best measures address the root causes of each underinsurance issue. This section reviews some of the ways of reducing underinsurance in different situations.32
Source: Swiss Re Economic Research & Consulting.
The task of effectively reducing and financing catastrophe risk requires a combined response from the private and public sectors. The public sector plays a key role in setting a legal and regulatory framework that enables the development of a private insurance sector, while private insurers need to develop appropriate risk transfer solutions to absorb and manage those risks effectively.
In developed countries with functioning insurance markets, there is limited need for the government to actively absorb natural catastrophe risks. In countries where insurance markets are not yet sufficiently developed, the government may need to play a more active role as an enabler of risk transfer. In addition, there is a strong case for governments to diversify their sources of disaster financing and use pre-financing instruments in addition to the widespread ex-post financing.
Governments have an important role in risk mitigation by setting and enforcing standards such as disaster-resistant building codes, overseeing flood control, and in providing risk data such as flood mapping. The insurance industry plays a key role in creating incentives for risk mitigation through risk-based pricing of its products.
32 See also, Underinsurance: How to close the gap, The Geneva Association May 2014.
The best measures to close the gap address the root causes of each underinsurance issue.
Table 5: Measures which promote risk mitigation or expand insurability
Measures Objectives Agents
Affordability of coverage
Improve product design
Increaseaccess and distribution
Insurance industry Government
Public-private partnerships
Product innovation ✓ ✓ ✓ ✓ ✓
Microinsurance ✓ ✓ ✓ ✓ ✓
Index-based insurance ✓ ✓ ✓ ✓ ✓
Product bundling ✓ ✓ ✓ ✓ ✓ ✓
New technologies and distribution innovation ✓ ✓ ✓ ✓
Governments setting the rules for the insurance market
✓ ✓ ✓ ✓
Developing the takaful sector ✓ ✓
Mitigation, building standards, and zoning ✓ ✓ ✓ ✓ ✓ ✓
Mandatory insurance programs ✓ ✓ ✓
Government-backed programs for risks that are not fully insurable
✓ ✓ ✓ ✓ ✓
Public sector insurance programs ✓ ✓ ✓
Private- and public-sector participation is necessary to close the gap.
Countries with developed insurance markets need little government financing for risk transfer.
But the state does play an important role in risk mitigation by, for example, enforcing building standards.

26 Swiss Re sigma No 5/2015
Dealing with underinsurance
Product innovationProduct innovation carves out new areas of insurability. In the US, gaps in state-supported flood coverage have created product innovation opportunities. For instance in June 2015, National Flood Services, a division of private insurer Affinity Insurance Services, introduced a line of private flood insurance products that provide alternatives to the NFIP, including excess coverage and reduced underwriting requirements, as well as products designed to complement NFIP coverage.33 Such new products could make a considerable difference in satisfying areas of demand not covered by existing programs.
Another example of product innovation is in earthquake risk. There have been many innovations around the world to better address the burden of catastrophe risk in mortgage portfolios. Yet most residential property is uninsured against earthquake risk. In case of a large loss event, many homeowners would not be able to bear the resulting loss and default on their mortgages. Consequently, much of the world’s residential earthquake risk exposure is effectively borne by mortgage providers such as banks, which are usually also uninsured against this risk. Providing mortgage lenders with earthquake coverage is an opportunity for insurers to generate additional business and to narrow the natural catastrophe insurance gap.
Insurers are starting to offer broader cyber insurance coverage including for property and CBI damages. They are also expanding the availability of loss-control services such as risk assessment tools, breach counseling, and event response assistance.34
Innovation is necessary not only in products but also in policy wordings. Simplification, while maintaining product integrity and policy wording accuracy, is an important way for insurers to reach and communicate with customers.
MicroinsuranceMicroinsurance can provide low-income, vulnerable households with affordable and efficient insurance products, by using product design, distribution and claims management processes that are significantly different from traditional insurance. By providing small amounts of coverage and premiums per person, and using innovative product designs, microinsurance can be both affordable for low-income populations and financially sustainable for providers. Distribution is often done through existing networks, sometimes bundling the insurance cover with other financial or non-financial products.35 To keep costs affordable, microinsurance products also require an efficient claims handling system, and in many microinsurance business models, there is some form of community involvement in the claims process to reduce risk-taking, improve verification, and build consumer trust.36
For property risks, many microinsurance programs have used weather index-based insurance products to cover crop damages. By paying claims according to local weather parametres rather than individual damages, index products reduce the costs of underwriting and claims processing. With innovations in product design and distribution, there is scope to expand microinsurance to other property types.
33 “National Flood Services Launches Private Flood Product Suite”, www.mynewmarkets.com, 4 June 2015.34 Benchmarking Trends: As Cyber Concerns Broaden, Insurance Purchases Rise, Marsh, March 201535 sigma 6/2013, Microinsurance – risk protection for 4 billion people”, Swiss Re. 36 The moment of truth: Claims Management in Microinsurance; International Labour Office, 2014.
Product innovation may carve out new areas of insurability, for example for flood ...
… and earthquake risks.
Cyber covers now may include protection against property and CBI damages.
Innovation is also necessary in policy wording; keeping things simple to better communicate with consumers.
Microinsurance uses simplified product design, distribution and claims management to make insurance more affordable.
Microinsurance targets populations traditionally excluded from accessing insurance protection.
Swiss Re sigma No 5/2015 27
In addition, further innovation is underway to tie microinsurance to natural catastrophe protection for households and small businesses. An innovative example is the Microinsurance Catastrophe Risk Organisation (MiCRO), a social business registered as a Barbados-domiciled reinsurer and focused on providing microinsurance products that help protect against natural disasters. In Central America, MiCRO is launching innovative index insurance products channeled through existing microfinance institutions with a focus on the poorest and most vulnerable segments of the population.
Index-based insuranceThere is a growing interest in using index-based insurance products for agro risks in emerging markets. Many countries in Asia, Latin America, the Caribbean and Africa have piloted some sort of index-based insurance in agriculture, which has advantages in terms of transparency, low transaction costs, fast pay-outs and objectivity. Because index-based insurance relies on modelled data, it can be developed in markets where insurers do not have an existing claims portfolio providing data for underwriting or a claims handling infrastructure. Drawbacks include the basis risk – the risk that claims are not triggered by the parametre index even if an individual loss occurs, or vice versa. Ongoing innovation in both index development and in satellite technology is needed to successfully extend coverage.
Product bundling Like in life insurance, it could also be possible to combine property insurance protection with household savings. This option is not very appealing in the current low interest rate environment, but it could become more so once rates move up again. Property insurance policies bundled with savings already exist in Japan (called maturity refund policies, which include a savings component to refund the nominal premium payments at maturity) and Korea (called long-term insurance). They have helped popularise buildings and contents insurance in these markets.
To reach farmers in rural or remote regions in the emerging markets, insurers are exploring bundling agricultural insurance products, either as a tie-up with existing products and services or through already-existing distribution networks. Agricultural insurance can be bundled with, for example, credit products (through banks or microfinance institutions) or input suppliers (via fertiliser stores or seed distributors). Reduced distribution and transaction costs are the biggest advantages.
New technologies and distribution innovationSmart technology devices can improve insurability by reducing risks and enabling response in real-time to threatening situations. Connected fire alarms can reduce the severity of fires by alerting the owner and authorities as soon as burning starts. In similar vein, connected intruder alarms can discourage theft, and water leak detectors can reduce the damage that a burst pipe can do to a home by cutting off the water supply. State Farm, for example, has formed a partnership with security and alarm company ADT with the aim of offering connected-home and insurance solutions. Installing and servicing dedicated smart home devices for a connected-home insurance offering would be prohibitively expensive. Partnering with a home security provider gives access to an existing infrastructure.
Smart devices are already more prevalent in commercial property, partly because the value at stake is higher but also because they dovetail with other business needs such as business continuity risk management. The use of drones for property surveillance is growing and could enhance the tracking of valuation changes and speed claims assessment after disasters.
Microinsurance innovations are underway to extend protection for natural catastrophe risks.
Index-based insurance simplifies underwriting and claims to reduce costs.
Bundling insurance with savings can sometimes increase the appeal of the product in developed markets.
Bundling insurance products together can reduce distribution and underwriting costs.
Technological improvements could reduce expected losses for homeowners’ risks.
Drones or other smart devices are being used to regularly update valuation and improve claims estimates.
28 Swiss Re sigma No 5/2015
Dealing with underinsurance
To protect rural farmers from climate uncertainties such as drought, weather index insurance programs combine satellite technology with mobile communications. For example, the crop insurance pilot program Kilimo Salama has partnered with the largest agricultural companies in Ethiopia and Kenya to insert an insurance card into each bag of seed. By texting the number of the card, farmers receive an insurance policy number by return text. Through just the two data points of GPS location and date of planting, the insurer can match the farmer to the local weather station. In the event of a certain number of days without rain, a payment directly back to the farmers’ phone is triggered, thereby eliminating any underwriting or claims verification and vastly reducing the costs of insurance provision.
Remote tracking and identification technologies have lowered the cost of claims verification and reduced theft in claims payment. For livestock insurance in India, IFFCO-Tokio has pioneered the use of radio frequency identification (RFID) tags to reduce the number of fraudulent claims that were previously made when livestock were identified only by tags.37
Governments setting the rules for the insurance marketThe public sector has the political and legal power to set rules and regulations that enable the insurance market to develop and absorb large losses. These include setting capital and licensing requirements for insurers, providing access to international markets, defining the terms of liability and supporting preventive measures. In some situations, governments can help expand the availability of risk transfer solutions to individuals and corporations by introducing compulsory insurance schemes to create a sufficiently large “risk community”.
In addition, governments can address the issue of affordability by subsidising insurance premiums for low-income households. Similarly, policies which reduce premium taxes and remove regulation on rates are important in supporting demand for property insurance. For instance, the wave of deregulation in the EU insurance market during the 1990s increased competition and reduced premium rates.
Developing the takaful sectorIn Muslim-majority countries, underinsurance can be reduced by improving access to sharia-compliant insurance solutions (takaful). The availability of takaful products can help to overcome objections against insurance which are rooted in sharia, or Islamic, law.
A thriving takaful industry requires some key factors. First, a comprehensive and consistent regulatory framework can help form a level playing field, without an overburden of corporate governance and compliance costs. Second, prescribing one standard model for takaful can help. Also, strict monitoring and enforcement of rules is vital to ensure policyholder protection and trust in the takaful industry. The latter has been an issue in some markets in the Middle East.
Finally, takaful is dependent on the availability of sharia-compliant assets. While equity and real estate investments are generally available, the market for sukuks (sharia-compliant bonds) must be developed so that takaful companies can match liabilities with assets. Malaysia, with its well-developed regulatory framework, proactive regulator and deep Islamic financial market, is one of the most advanced takaful markets.
37 Annual Report 2013, International Labour Organization, 2014
Satellite and mobile technology enable index insurance programs.
Remote tracking and identification can help deliver post-disaster payments.
Governments set the regulatory framework for insurance markets.
Deregulation and premium subsidies can address the issue of affordability.
Developing products compliant with Islamic law can reduce underinsurance in Muslim-majority countries.
A supportive regulatory environment is essential for offering takaful.
The development of a takaful insurance industry also requires a broader financial base of sharia-compliant assets.
Swiss Re sigma No 5/2015 29
Mitigation, building standards and zoningGovernments play an important role in establishing and enforcing risk reduction standards. For example in mature markets such as the US, Japan, Canada and Australia, building codes have reduced risks and improved insurability. Deryugina (2013) found that stricter building codes in Florida reduce the amount of money spent by the federal government following a hurricane.38 Other highly effective building codes relate to the elevation of buildings in flood risk zones. Governments can also discourage development of high-risk areas through zoning, or provide incentives to relocate from high-risk areas after a disaster.
Insurers can play an important role in encouraging investment in mitigation. Premium rates can provide ex ante incentives for better risk management and prevention investments in physical structures. Actuarial and underwriting expertise can help measure the relative costs and benefits of mitigation decisions.
In many cases, the public sector and the insurance industry are implicit partners. Insurers will only insure against floods if the government implements flood prevention measures, or against fire if fire brigades exist. For example, in high flood risk areas of Northern Queensland in Australia, insurer Suncorp has encouraged municipal governments to build levees which significantly reduce collective risk and the costs of natural disasters. In the town of Roma, extreme weather and flood damages generated total repair costs of AUD 500 million between 2005 and 2013. After the levee was completed at a cost of approximately AUD 20 million, average insurance premiums dropped by 30%, with some homeowners experiencing decreases of up to 80%.39
Mandatory insurance programsGovernments can help further expand the availability of risk transfer solutions to individuals and corporations by introducing compulsory insurance schemes to create a sufficiently large risk community. Compulsory insurance is used in virtually all countries, albeit mostly as part of social security schemes related to health, old age and unemployment, or as compulsory liability insurance (eg, motor liability insurance). In property, however, such schemes are mostly semi-mandatory.
Though the mandatory schemes differ in terms of coverage and institutional set-up, almost all are attached to standard fire policies for buildings. For a sample of mandatory natural catastrophe schemes see Table 7 in the Appendix. With the exception of Switzerland40 and Iceland, fire policies are not mandatory, but they are usually very widespread with take-up rates of 90% or more in most European countries. Hence, mandatory schemes can easily piggyback on existing insurance contract relationships. The premium collection and claims handling can be done by the insurance companies, allowing cost efficient solutions.
38 Deryugina, Tatyana, Reducing the Cost of Ex Post Bailouts with Ex Ante Regulation: Evidence from Building Codes, Working paper, University of Illinois, 2013.
39 What a levee in Roma means for home insurance premiums, Suncorp Group infographic, July 2014.40 In most Swiss cantons, fire insurance policies are mandatory for buildings. In 19 cantons, mandatory
coverage is provided by state-owned monopoly insurers, in three cantons by the private insurance industry. Only in four cantons are fire policies optional.
Governments play an important role in establishing and enforcing risk reduction standards.
Insurers can also promote mitigation by helping measure cost-effectiveness.
Insurers and governments have mutual interests in mitigation and risk transfer.
Mandatory covers are prevalent for the risks of old age, health, unemployment, and motor liability.
Fire policies are usually not mandated but are very widespread.
30 Swiss Re sigma No 5/2015
Dealing with underinsurance
Mandatory schemes that are not linked to fire polices sometimes do not achieve broad coverage. For example in Turkey, residential buildings within municipal boundaries must have earthquake coverage through a private insurance company on behalf of the state-owned Turkish Catastrophe Insurance Pool (TCIP). Initial take-up rates were low as compliance was not strongly enforced. With a new catastrophe law enacted in 2012, however, take-up improved considerably as homeowners now need earthquake coverage to sign up for electricity or water services, obtain a mortgage, or receive rebuilding aid from the government if their homes are damaged in an earthquake.41
In markets such as India and the Philippines, crop insurance is compulsory for farmers seeking credit from banks or financial institutions. The same applies in Brazil for loans from state-owned banks. Compulsory agricultural insurance such as loan-linked agricultural insurance has multiple benefits. It can be used as collateral by farmers seeking farm credit while helping increase risk awareness and penetration of agricultural insurance and mitigating adverse selection through wider participation. It can also reduce distribution and transaction costs.
The main advantage of mandatory schemes is that they form the widest possible risk community and eliminate adverse selection. Premiums are often made affordable for most policyholders by way of a limited differentiation of premium rates. The vast majority of low-risk policies then cross-subsidize the high-risk ones. Risk bundling of various types of natural perils can help to improve societal acceptance of such schemes by pooling risks more broadly, though combining risks may be more difficult when there is a high risk disparity among regions.
The flipside is the potential for “systemic” moral hazard. Since potential losses are compensated by the insurance mechanism, there is less incentive for governments and property owners to invest in loss mitigation. Subsidized premiums, less stringent building codes and land use zoning facilitate property development in flood plains and other highly-exposed areas and thereby increase losses.
On the other hand, voluntary market solutions are not doomed to low penetration rates. The example of the German insurance industry has shown that it is possible to improve take-up rates for flood insurance in high- and low-exposure areas. German insurers have been successful in raising awareness among policyholders even in areas that are not exposed to fluvial floods. By 2002, less than 20% of residential building had covers against natural hazards, and today about 38% of buildings are covered.42
The German case has two important features: the availability of underwriting and risk-adjusted pricing, even in high-risk areas, and the increase in consumer risk awareness, even in areas away from rivers. Standard policy wording for comprehensive building insurance has mostly changed from offering natural hazard cover as an option to including it by default with an option to unselect.
41 The latest TCIP statistics show that 39% of all insurable buildings are covered against earthquakes as opposed to 23% in 2011.
42 Deutschlandkarte: Wer ist wo elementar versichert?, Gesamtverband der deutschen Versicherungswirtschaft (GDV), 5 July 2015
Earthquake insurance is legally required, but not always enforced, for homeowners in Turkey.
Compulsory insurance increases penetration and reduces anti-selection.
The main advantage of mandatory schemes is the broad distribution of risk, which makes policies more affordable even in high-risk areas.
The main drawback of mandatory schemes is the lower incentive to reduce risks in cross-subsidized high-risk areas.
Germany is an example of a voluntary solution that has increased penetration.
Building risk awareness and participation among policyholders is key for sustaining voluntary programs.
Swiss Re sigma No 5/2015 31
Flood Re in the UK: innovation to maintain insurability in high-risk areasThe Flood Re scheme in the UK is an insurance program for residential property that was introduced in the summer of 2015. It substitutes former voluntary agreements between the insurance industry, represented by the Association of British Insurers (ABI) and the government. The purpose of Flood Re is to provide affordable flood cover for properties in the UK at highest risk of flooding.43 It has been estimated that around 1–2% of domestic households, ie, between 300 000 and 500 000 homes, might benefit from the premium caps offered.
Flood Re is a not-for-profit flood reinsurance fund, owned and managed by the insurance industry. It accepts the transfer of insurance companies’ risk above a specified flood-related risk. This risk is very likely to be transferred if the calculated premium is above the Flood Re level. In case of a flood event, insurers will be reimbursed from Flood Re for the claims of the reinsured homeowners.
In addition to premiums ceded by the insurers, Flood Re is funded by a levy raised from insurers based on their residential property market shares which is a formalized cross-subsidizing system put in place prior to Flood Re’s inception. According to the ABI, on average it will cost individual policyholders GBP 10.5 per year, or 2.2% of a policy. The level of funding should be sufficient to cover a 1-in-200 year flood event. Additionally, the funds will buy retro cover from the reinsurance market.
Flood Re is financially independent from the government. Only in the case of an extraordinary loss burden in the set-up phase of the fund may Flood Re be granted a repayable loan from the UK government. For its part, the UK government has agreed to increase spending on flood defences by GBP 370 million for 2015–16, and increase the budget by the level of inflation for the subsequent five years.
Government backstops for risks that are not fully insurableIn many countries, governments also act as insurers or reinsurers for certain risks in order to supplement private schemes. Government backstop programmes can complement private-sector insurance solutions, which can be limited in cases where risk assessment is particularly challenging, and where the magnitude of a potential loss exceeds private sector capacity, such as in terrorism and extreme natural catastrophe events. For most weather-related and other natural catastrophe risks, the private sector does have the capacity and expertise to provide coverage. Here public sector involvement should focus on expanding the availability of insurance schemes – with the ultimate aim of establishing an efficient private-sector market.
Most countries facing terror risk have backstop programmes, including the US, European countries (Austria, Belgium, Denmark, France, Germany, the Netherlands, Spain, the UK), and countries in other regions (Australia, India, Israel, Russia, Sri Lanka, South Africa). Four countries (Israel, South Africa, Spain, and the UK) had programmes in place before 11 September 2001. Some developing countries face substantial terrorism risk but do not have governance systems in place.
Each country has developed a terrorism insurance arrangement unique to its own political structure and perceived level of risk, usually established after a major terror attack. A variety of approaches have been taken by different countries to terrorism risk sharing between the government and the private insurance industry.
43 The future of flood insurance: what happens next, Association of British Insurers, 30 July 2015,
Flood Re provides reinsurance for high flood risk homes in the UK, and the premium rates are capped.
Flood Re accepts the flood-related risks transferred to it by insurance companies.
Additional funds from a levy ensure that Flood Re remains solvent.
If those additional levy funds are exhausted, the UK government provides assistance.
Governments can act as reinsurers for risks that are not fully insurable by private markets.
Most countries facing terrorism risk have government programmes.
Such programme usually develop after a large terrorist event ...
32 Swiss Re sigma No 5/2015
Dealing with underinsurance
On one end of the spectrum, Israel has faced high costs of terrorism historically, using complete government coverage and no private involvement. At the other end, Germany has established Extremus, a private insurance company jointly owned by leading German re/insurers. Extremus insures terror risks above EUR 25 million and is endowed with a government backstop to cover aggregate losses in excess of EUR 2 billion. Other countries such as Spain, France, the UK and the US have developed different structures for public-private risk sharing.
Public-sector insurance programsThe costs of natural disasters, extreme weather events, climate change and other risks present a growing burden on government budgets in emerging economies. A study by the Bank of International Settlements on the macroeconomic impact of natural catastrophe events concluded that countries with higher insurance penetration had lower indirect costs and a faster economic recovery than less-insured countries.44 Many government and public sector entities are increasingly utilizing new forms of risk transfer.
Mexico issued a sovereign catastrophe bond with the assistance of the World Bank in 2009. By taking some of the likely costs of earthquake and hurricane damage off the government’s balance-sheet and into the capital markets, Mexico has reduced its fiscal vulnerability to future disasters.
The Caribbean Catastrophe Risk Insurance Facility (CCRIF) was set up as a multi-country disaster-relief fund in 2007. It is a donor-backed scheme to which participating governments also pay premiums. The CCRIF covers a range of countries, which diversifies risk and therefore reduces premiums. Similarly, the Pacific Catastrophe Risk Insurance Pilot is a natural catastrophe program for several Pacific Island countries. The World Bank acted as an intermediary and placed the country-specific catastrophe risk policies on the international reinsurance market as a single block of business. Parametric triggers help to provide faster payouts after a disaster hits a particular region. In Africa, the African Risk Capacity (ARC) agency is a donor-backed insurance pool that insures the participating nations against drought risk, using a modelled loss index based on satellite rainfall data.
44 Goetz, von Dahlen, Saxena, “Unmitigated disasters? New evidence on the macroeconomic cost of natural catastrophes”, BIS Working Papers, December 2012.
… and reflect each country’s unique political and historical situation.
Public-sector entities are exploring new forms of risk transfer.
Securitization can be a complement to traditional reinsurance to provide additional capital for disaster recovery.
The most notable of such schemes have been developed through public-private partnerships.
Swiss Re sigma No 5/2015 33
Conclusions
Underinsurance in property presents challenges, but also opportunities, for insurers to expand into new and more deeply penetrate existing markets. Government support in risk mitigation and insurance market governance is key for success.
This report provides an estimate of global property underinsurance, not only in terms of historical natural catastrophe events, but also in terms of forward-looking probabilistic models of natural catastrophe exposures and a general benchmarking of the wider demand for all property covers in relation to well-insured countries. This analysis identifies the gaps by country and by peril, and disentangles the root causes for the gap in each segment.
The challenge for the insurance industry is to focus on the needs of those who are totally uninsured or insufficiently insured. Closing the underinsurance gap will require that the industry continues to develop risk models to track the evolving landscape of new risks and exposures, not only of natural catastrophes, but also of perils that are difficult to quantify such as terrorism, cyber, and supply chain risks. In addition, the industry must develop the necessary data and analytical tools for risk measurement and modeling to advance these efforts. Further innovation in products, processes, and distribution are needed to reach previously uninsured consumers and risks.
Insurers cannot act alone. They require supportive regulatory environments, risk information and, in specific cases such as terrorism or high-risk flood zones, government involvement to extend coverage capacity. Successfully addressing property underinsurance requires a coordinated effort and innovative thinking by both the public and private sectors.
Underinsurance presents the opportunity to expand into new markets and more deeply penetrate existing markets.
The report provides various estimates of underinsurance, using diverse methods.
The insurance industry needs to develop the tools and models necessary to close the underinsurance gap.
Supportive government policies and actions will play an essential role in closing the underinsurance gap.
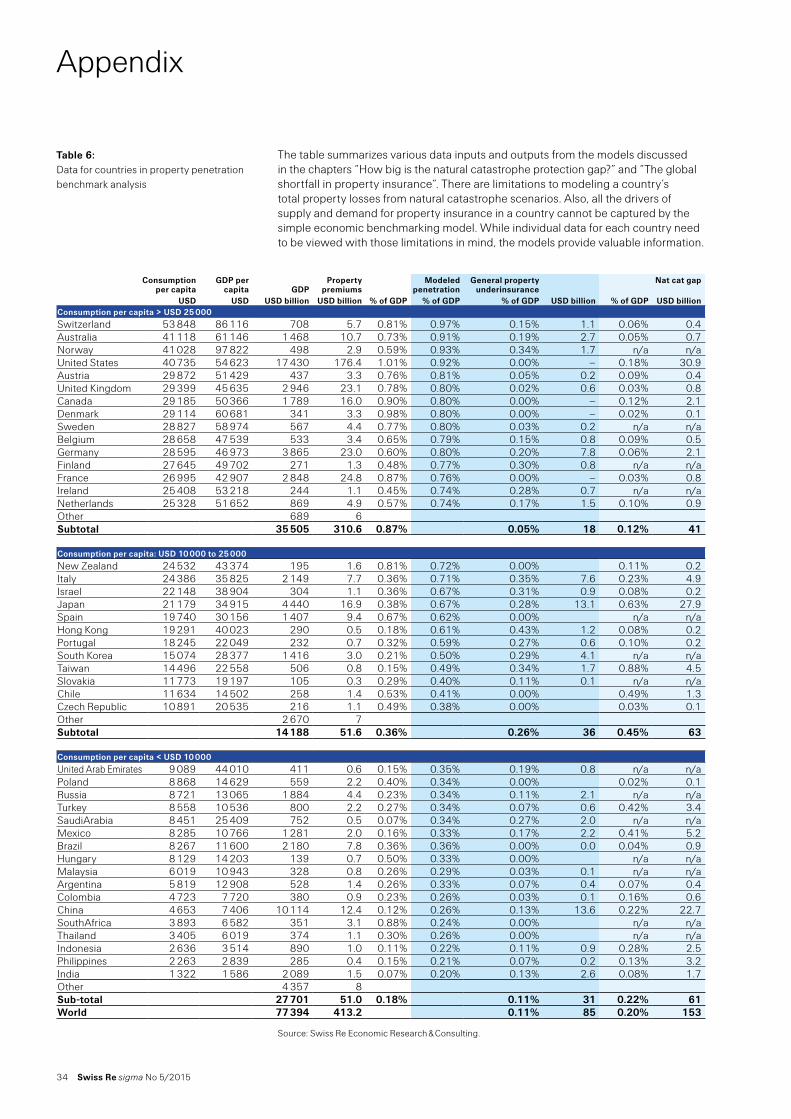
34 Swiss Re sigma No 5/2015
Appendix
The table summarizes various data inputs and outputs from the models discussed in the chapters “How big is the natural catastrophe protection gap?” and “The global shortfall in property insurance“. There are limitations to modeling a country’s total property losses from natural catastrophe scenarios. Also, all the drivers of supply and demand for property insurance in a country cannot be captured by the simple economic benchmarking model. While individual data for each country need to be viewed with those limitations in mind, the models provide valuable information.
Source: Swiss Re Economic Research & Consulting.
Table 6: Data for countries in property penetration benchmark analysis
Consumption per capita
GDP per capita
GDP
Property premiums
Modeled penetration
General property underinsurance
Nat cat gap
USD USD USD billion USD billion % of GDP % of GDP % of GDP USD billion % of GDP USD billionConsumption per capita > USD 25 000Switzerland 53 848 86 116 708 5.7 0.81% 0.97% 0.15% 1.1 0.06% 0.4Australia 41 118 61 146 1 468 10.7 0.73% 0.91% 0.19% 2.7 0.05% 0.7Norway 41 028 97 822 498 2.9 0.59% 0.93% 0.34% 1.7 n/a n/aUnited States 40 735 54 623 17 430 176.4 1.01% 0.92% 0.00% – 0.18% 30.9Austria 29 872 51 429 437 3.3 0.76% 0.81% 0.05% 0.2 0.09% 0.4United Kingdom 29 399 45 635 2 946 23.1 0.78% 0.80% 0.02% 0.6 0.03% 0.8Canada 29 185 50 366 1 789 16.0 0.90% 0.80% 0.00% – 0.12% 2.1Denmark 29 114 60 681 341 3.3 0.98% 0.80% 0.00% – 0.02% 0.1Sweden 28 827 58 974 567 4.4 0.77% 0.80% 0.03% 0.2 n/a n/aBelgium 28 658 47 539 533 3.4 0.65% 0.79% 0.15% 0.8 0.09% 0.5Germany 28 595 46 973 3 865 23.0 0.60% 0.80% 0.20% 7.8 0.06% 2.1Finland 27 645 49 702 271 1.3 0.48% 0.77% 0.30% 0.8 n/a n/aFrance 26 995 42 907 2 848 24.8 0.87% 0.76% 0.00% – 0.03% 0.8Ireland 25 408 53 218 244 1.1 0.45% 0.74% 0.28% 0.7 n/a n/aNetherlands 25 328 51 652 869 4.9 0.57% 0.74% 0.17% 1.5 0.10% 0.9Other 689 6Subtotal 35 505 310.6 0.87% 0.05% 18 0.12% 41
Consumption per capita: USD 10 000 to 25 000New Zealand 24 532 43 374 195 1.6 0.81% 0.72% 0.00% 0.11% 0.2Italy 24 386 35 825 2 149 7.7 0.36% 0.71% 0.35% 7.6 0.23% 4.9Israel 22 148 38 904 304 1.1 0.36% 0.67% 0.31% 0.9 0.08% 0.2Japan 21 179 34 915 4 440 16.9 0.38% 0.67% 0.28% 13.1 0.63% 27.9Spain 19 740 30 156 1 407 9.4 0.67% 0.62% 0.00% n/a n/aHong Kong 19 291 40 023 290 0.5 0.18% 0.61% 0.43% 1.2 0.08% 0.2Portugal 18 245 22 049 232 0.7 0.32% 0.59% 0.27% 0.6 0.10% 0.2South Korea 15 074 28 377 1 416 3.0 0.21% 0.50% 0.29% 4.1 n/a n/aTaiwan 14 496 22 558 506 0.8 0.15% 0.49% 0.34% 1.7 0.88% 4.5Slovakia 11 773 19 197 105 0.3 0.29% 0.40% 0.11% 0.1 n/a n/aChile 11 634 14 502 258 1.4 0.53% 0.41% 0.00% 0.49% 1.3Czech Republic 10 891 20 535 216 1.1 0.49% 0.38% 0.00% 0.03% 0.1Other 2 670 7Subtotal 14 188 51.6 0.36% 0.26% 36 0.45% 63
Consumption per capita < USD 10 000United Arab Emirates 9 089 44 010 411 0.6 0.15% 0.35% 0.19% 0.8 n/a n/a Poland 8 868 14 629 559 2.2 0.40% 0.34% 0.00% 0.02% 0.1Russia 8 721 13 065 1 884 4.4 0.23% 0.34% 0.11% 2.1 n/a n/aTurkey 8 558 10 536 800 2.2 0.27% 0.34% 0.07% 0.6 0.42% 3.4SaudiArabia 8 451 25 409 752 0.5 0.07% 0.34% 0.27% 2.0 n/a n/aMexico 8 285 10 766 1 281 2.0 0.16% 0.33% 0.17% 2.2 0.41% 5.2Brazil 8 267 11 600 2 180 7.8 0.36% 0.36% 0.00% 0.0 0.04% 0.9Hungary 8 129 14 203 139 0.7 0.50% 0.33% 0.00% n/a n/aMalaysia 6 019 10 943 328 0.8 0.26% 0.29% 0.03% 0.1 n/a n/aArgentina 5 819 12 908 528 1.4 0.26% 0.33% 0.07% 0.4 0.07% 0.4Colombia 4 723 7 720 380 0.9 0.23% 0.26% 0.03% 0.1 0.16% 0.6China 4 653 7 406 10 114 12.4 0.12% 0.26% 0.13% 13.6 0.22% 22.7SouthAfrica 3 893 6 582 351 3.1 0.88% 0.24% 0.00% n/a n/aThailand 3 405 6 019 374 1.1 0.30% 0.26% 0.00% n/a n/aIndonesia 2 636 3 514 890 1.0 0.11% 0.22% 0.11% 0.9 0.28% 2.5Philippines 2 263 2 839 285 0.4 0.15% 0.21% 0.07% 0.2 0.13% 3.2India 1 322 1 586 2 089 1.5 0.07% 0.20% 0.13% 2.6 0.08% 1.7Other 4 357 8Sub-total 27 701 51.0 0.18% 0.11% 31 0.22% 61World 77 394 413.2 0.11% 85 0.20% 153
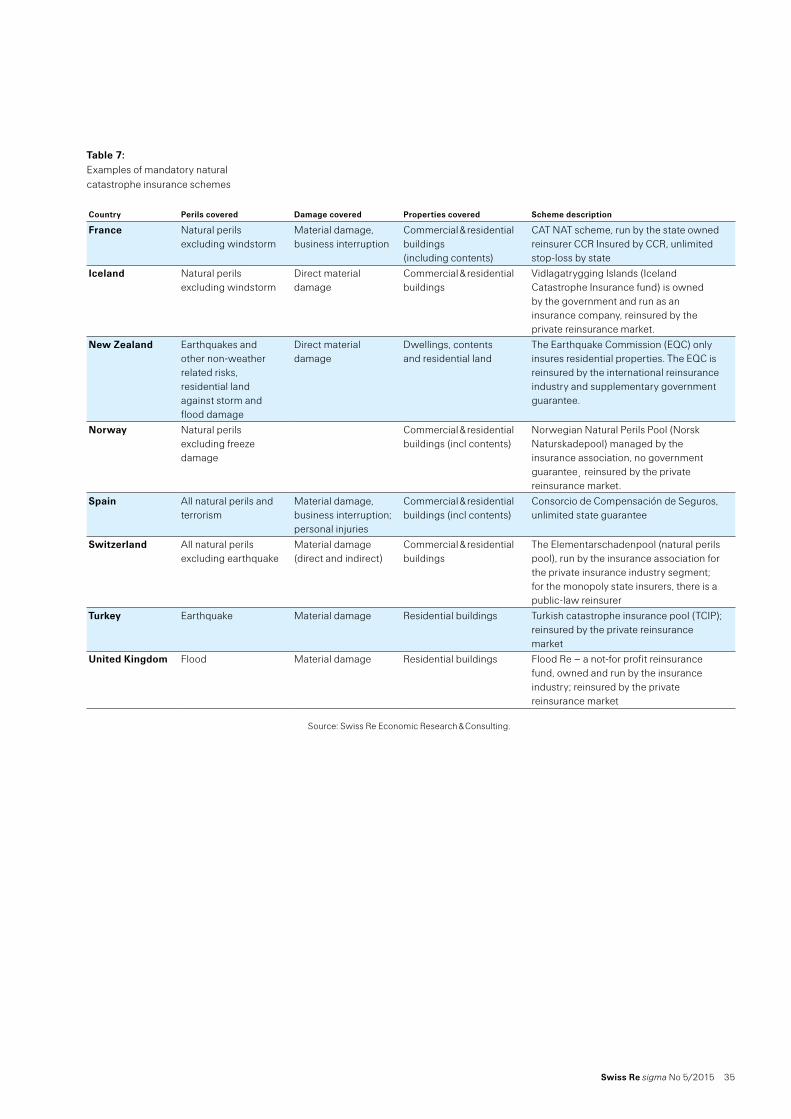
Swiss Re sigma No 5/2015 35
Source: Swiss Re Economic Research & Consulting.
Table 7: Examples of mandatory natural catastrophe insurance schemes
Country Perils covered Damage covered Properties covered Scheme description
France Natural perils excluding windstorm
Material damage, business interruption
Commercial & residential buildings (including contents)
CAT NAT scheme, run by the state owned reinsurer CCR Insured by CCR, unlimited stop-loss by state
Iceland Natural perils excluding windstorm
Direct material damage
Commercial & residential buildings
Vidlagatrygging Islands (Iceland Catastrophe Insurance fund) is owned by the government and run as an insurance company, reinsured by the private reinsurance market.
New Zealand Earthquakes and other non-weather related risks, residential land against storm and flood damage
Direct material damage
Dwellings, contents and residential land
The Earthquake Commission (EQC) only insures residential properties. The EQC is reinsured by the international reinsurance industry and supplementary government guarantee.
Norway Natural perils excluding freeze damage
Commercial & residential buildings (incl contents)
Norwegian Natural Perils Pool (Norsk Naturskadepool) managed by the insurance association, no government guarantee reinsured by the private reinsurance market.
Spain All natural perils and terrorism
Material damage, business interruption; personal injuries
Commercial & residential buildings (incl contents)
Consorcio de Compensación de Seguros, unlimited state guarantee
Switzerland All natural perils excluding earthquake
Material damage (direct and indirect)
Commercial & residential buildings
The Elementarschadenpool (natural perils pool), run by the insurance association for the private insurance industry segment; for the monopoly state insurers, there is a public-law reinsurer
Turkey Earthquake Material damage Residential buildings Turkish catastrophe insurance pool (TCIP); reinsured by the private reinsurance market
United Kingdom Flood Material damage Residential buildings Flood Re – a not-for profit reinsurance fund, owned and run by the insurance industry; reinsured by the private reinsurance market
36 Swiss Re sigma No 5/2015
Recent sigma publications
2015 No 1 Keeping healthy in emerging markets: insurance can help No 2 Natural catastrophes and man-made disasters in 2014: convective and winter storms generate most losses No 3 M & A in insurance: start of a new wave? No 4 World insurance in 2014: back to life No 5 Underinsurance of property risks: closing the gap
2014 No 1 Natural catastrophes and man-made disasters in 2013: large losses from floods and hail; Haiyan hits the Philippines
No 2 Digital distribution in insurance: a quiet revolution No 3 World insurance in 2013: steering towards recovery No 4 Liability claims trends: emerging risks and rebounding economic drivers No 5 How will we care? Finding sustainable long-term care solutions for an ageing world
2013 No 1 Partnering for food security in emerging markets No 2 Natural catastrophes and man-made disasters in 2012: A year of extreme weather events in the US No 3 World insurance 2012: Progressing on the long and winding road to recovery No 4 Navigating recent developments in marine and airline insurance No 5 Urbanisation in emerging markets: boon and bane for insurers No 6 Life insurance: focusing on the consumer
2012 No 1 Understanding profitability in life insurance No 2 Natural catastrophes and man-made disasters in 2011: historic losses surface from record earthquakes and floods No 3 World insurance in 2011: non-life ready for take-off No 4 Facing the interest rate challenge No 5 Insuring ever-evolving commercial risks No 6 Insurance accounting reform: a glass half empty or half full?
2011 No 1 Natural catastrophes and man-made disasters in 2010: a year of devastating and costly events No 2 World insurance in 2010 No 3 State involvement in insurance markets No 4 Product innovation in non-life insurance markets: where little “i” meets big “I” No 5 Insurance in emerging markets: growth drivers and profitability
2010 No 1 Natural catastrophes and man-made disasters in 2009: catastrophes claim fewer victims, insured losses fall
No 2 World insurance in 2009: premiums dipped, but industry capital improved No 3 Regulatory issues in insurance No 4 The impact of inflation on insurers No 5 Insurance investment in a challenging global environment No 6 Microinsurance – risk protection for 4 billion people
2009 No 1 Scenario analysis in insurance No 2 Natural catastrophes and man-made disasters in 2008:
North America and Asia suffer heavy losses No 3 World insurance in 2008: life premiums fall in the industrialised countries – strong
growth in the emerging economies No 4 The role of indices in transferring insurance risks to the capital markets No 5 Commercial liability: a challenge for businesses and their insurers
2008 No 1 Natural catastrophes and man-made disasters in 2007: high losses in Europe No 2 Non-life claims reserving: improving on a strategic challenge No 3 World insurance in 2007: emerging markets leading the way No 4 Innovative ways of financing retirement No 5 Insurance in the emerging markets: overview and prospects for Islamic insurance
Published by:
Swiss Reinsurance Company LtdEconomic Research & ConsultingP.O. Box 8022 ZurichSwitzerland
Telephone +41 43 285 2551Fax +41 43 282 [email protected]
Armonk Office:175 King StreetArmonk, NY 10504
Telephone +1 914 828 8000
Hong Kong Office:18 Harbour Road, WanchaiCentral Plaza, 61st FloorHong Kong, SAR
Telephone + 852 25 82 5703
Authors:Thomas HolzheuTelephone +1 914 828 6502
Roman LechnerTelephone +41 43 285 2344
Ginger Turner Telephone +1 914 828 8064
sigma editor:Paul RonkeTelephone +41 43 285 2660
Editor in chiefKurt Karl,Head of Economic Research & Consulting, is responsible for the sigma series.
Explore and visualize sigma data on natural catastrophes and the world insurance markets at www.sigma-explorer.com
© 2015 Swiss Re. All rights reserved.
The editorial deadline for this study was 5 August 2015.
sigma is available in English (original language), German, French, Spanish, Chinese and Japanese.
sigma is available on Swiss Re’s website: www.swissre.com/sigma
The internet version may contain slightly updated information.
Translations:German: Diction AGFrench: ithaxa Communications SARLSpanish: Traductores Asociados Valencia S.L.
Graphic design and production:Corporate Real Estate & Logistics / Media Production, Zurich
Printing: Multicolor Print AG, Baar
This report is printed on sustainably produced paper. The wood used comes from forest certified to 100% by the Forest Stewardship Council (FSC).
© 2015Swiss ReAll rights reserved.
The entire content of this sigma edition is subject to copyright with all rights reserved. The information may be used for private or internal purposes, provided that any copyright or other proprietary notices are not removed. Electronic reuse of the data published in sigma is prohibited.
Reproduction in whole or in part or use for any public purpose is permitted only with the prior written approval of Swiss Re Economic Research & Consulting and if the source reference “Swiss Re, sigma No 05/2015” is indicated. Courtesy copies are appreciated.
Although all the information used in this study was taken from reliable sources, Swiss Re does not accept any responsibility for the accuracy or comprehensiveness of the information given or forward looking statements made. The information provided and forward-looking statements made are for informational purposes only and in no way constitute or should be taken to reflect Swiss Re’s position, in particular in relation to any ongoing or future dispute. The information does not constitute any recommendation, advice, solicitation, offer or commitment to effect any transaction or to conclude any legal act of any kind whatsoever. In no event shall Swiss Re be liable for any loss or damage arising in connection with the use of this information and readers are cautioned not to place undue reliance on forward-looking statements. Swiss Re undertakes no obligation to publicly revise or update any forward-looking statements, whether as a result of new information, future events or otherwise.
Order no: 270_0515_en

Swiss Re LtdEconomic Research & ConsultingMythenquai 50 /60 P.O. Box 8022 Zurich Switzerland
Telephone + 41 43 285 2551 Fax +41 43 282 0075 [email protected]