Under Pressure: P/C Insurance in 2003 An Overview & Outlook for the US & New Mexico New Mexico...
84
P/C Insurance in 2003 An Overview & Outlook for the US & New Mexico New Mexico Insurance Issues Legislative Luncheon Independent Insurance Agents of New Mexico Santa Fe, NM February 7, 2003 Robert P. Hartwig, Ph.D., CPCU, Senior Vice President & Chief Economist Insurance Information Institute 110 William Street New York, NY 10038 Tel: (212) 346-5520 Fax: (212) 732-1916 [email protected] www.iii.org
-
Upload
anthony-hill -
Category
Documents
-
view
215 -
download
1
Transcript of Under Pressure: P/C Insurance in 2003 An Overview & Outlook for the US & New Mexico New Mexico...

Under Pressure: P/C Insurance in 2003
An Overview & Outlook forthe US & New Mexico
New Mexico Insurance Issues Legislative LuncheonIndependent Insurance Agents of New Mexico
Santa Fe, NM
February 7, 2003
Robert P. Hartwig, Ph.D., CPCU, Senior Vice President & Chief EconomistInsurance Information Institute 110 William Street New York, NY 10038
Tel: (212) 346-5520 Fax: (212) 732-1916 [email protected] www.iii.org

Presentation Outline
• Pressure to Improve Performance: ProfitabilityUnderwritingPricing
• Capacity Crunch• Investment Overview• The Challenge of Terrorism• Credit in Personal Lines Underwriting• Q & A

PRESSURE TO IMPROVE
PROFITABILITY

Highlights: Property/Casualty First 9 Months 2002 ($ Millions)
2002 2001 Change
Net Written Prem. 279,797 246,353 +13.6%
Loss & LAE 205,376 204,415 +0.5%
Net UW Gain (Loss) (18,028) (37,103) -51.4%
Net Inv. Income 26,434 27,955 -5.4%
Net Income (a.t.) 8,303 (9,194) NA
Surplus* 273,287 289,606 -5.6%
Combined Ratio 104.9 114.4 -9.5 pts.
*Comparison with year-end 2001;
P/C Net Income After Taxes1991-2002E ($ Millions)
$14,178
$5,840
$19,316
$10,870
$20,598
$24,404
$36,819
$30,773
$21,865$20,559
-$6,970
$12,419
-$10,000
-$5,000
$0
$5,000
$10,000
$15,000
$20,000
$25,000
$30,000
$35,000
$40,000
91 92 93 94 95 96 97 98 99 00 01 02*
*I.I.I. estimate based on first 9 months of 2002 data.Sources: A.M. Best, ISO, Insurance Information Institute.
2001 was the first year ever with a full year net loss
2002 9-Month ROE = 4.4%

-5%
0%
5%
10%
15%
20%
87 88 89 90 91 92 93 94 95 96 97 98 99 00 01 02E 03F
US P/C Insurers All US Industries
ROE: P/C vs. All Industries 1987–2003F*
Source: Insurance Information Institute; Fortune

0%
2%
4%
6%
8%
10%
12%
14%
16%
18%
91 92 93 94 95 96 97 98 99 00
US P/C Insurers All US Industries New Mexico P/C
ROE: U.S. P/C vs. New Mexico P/C & All Industries
Source: NAIC, Insurance Information Institute; Fortune
Profits in NM were
reasonable during the mid-1990s but have since fallen off

ROE for Major Commercial Lines in NM, 1991 - 2000
16.3
%
11.5
%
10.5
%
7.8%
7.6%
1.0%
12.0
%
8.3%
2.2%
0.2%
0%
2%
4%
6%
8%
10%
12%
14%
16%
18%
1991 1992 1993 1994 1995 1996 1997 1998 1999 2000
Com m ercial Auto
Com m ercial Multi-Peril
Source: NAIC

ROE for Personal Lines in NM1991 - 2000
6.5%
3.4%
9.0%
15.6
%
12.9
%
14.2
%
8.0%
-2.3
%
19.6
%
18.8
%
-12.
0%
10.1
% 14.2
%
13.8
%
15.0
%
10.1
%
1.8%4.
7%
-19.
1%
0.4%
-25%
-20%
-15%
-10%
-5%
0%
5%
10%
15%
20%
25%
1991 1992 1993 1994 1995 1996 1997 1998 1999 2000
Personal Auto
Hom eowners
Source: NAIC
10-Year Average:
Auto: 10.8%
Home: 3.7%

2000 Return on Equity:NM & Nearby States PP Auto
-3.1%
2.2%
2.9%
3.8%
3.8%
8.0%
-5% 0% 5% 10%
New Mexico
Arizona
Colorado
Utah
US
Texas
Source: NAIC, Insurance Information Institute
2000

2000 Return on Equity:NM & Nearby States HO
-12.0%
-10.9%
3.8%
3.8%
20.4%
22.7%
-20% -10% 0% 10% 20% 30%
Colorado*
Utah
Arizona
US
Texas
New Mexico
Source: NAIC, Insurance Information Institute
2000

PRESSURE TO IMPROVE
UNDERWRITING
($60)
($50)
($40)
($30)
($20)
($10)
$0
$101
97
51
97
61
97
71
97
81
97
91
98
01
98
11
98
21
98
31
98
41
98
51
98
61
98
71
98
81
98
91
99
01
99
11
99
21
99
31
99
41
99
51
99
61
99
71
99
81
99
92
00
02
00
12
00
2
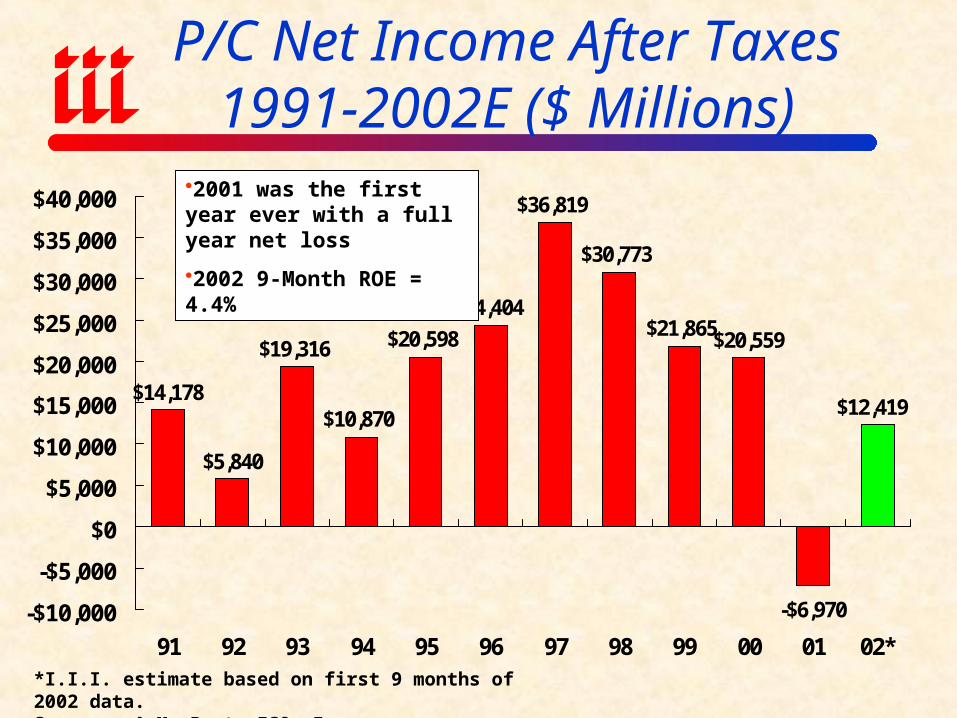
Underwriting Gain (Loss)1975-2002*
*Annualized estimate based on first 9 months of 2002 data.Source: A.M. Best, Insurance Information Institute
$ B
illi
ons
P-C insurers paid $22 billion more in claims & expenses than they collected in premiums
in 2002

95
100
105
110
115
120
70 72 74 76 78 80 82 84 86 88 90 92 94 96 98 00 02*
P/C Industry Combined Ratio
2001 = 115.7
2002E = 106.1*
2003F = 102.9*
Combined Ratios
1970s: 100.3
1980s: 109.2
1990s: 107.7
2000s: 110.4
*Based on January 2003 III survey of industry analysts.
Sources: A.M. Best; III

110.
5
105.
0 113.
6
119.
2
104.
8
100.
8
100.
5
114.
3
106.
5 114.
4
108.
8 115.
8
106.
9
108.
5
106.
5
105.
8
101.
6
105.
6
107.
7
110.
0
115.
7
105.
0
126.
5
162.
5
90
100
110
120
130
140
150
160
170
1991 1992 1993 1994 1995 1996 1997 1998 1999 2000 2001 2002*
Reinsurance All Lines Combined Ratio
Combined Ratio: Reinsurance vs. P/C Industry
*Figure for first 9 months of 2002.
Source: A.M. Best, ISO, Reinsurance Association of America, Insurance Information Institute
2001’s combined ratio was the worst-ever for reinsurers

U.S. InsuredCatastrophe Losses
$7.5
$2.7$4.7
$22.9
$5.5
$16.9
$8.3 $7.3
$2.6
$10.1$8.3
$4.3
$28.1
$5.0
$0
$5
$10
$15
$20
$25
$30
89 90 91 92 93 94 95 96 97 98 99 00 01 02*
*Estimate.Note: 2001 figure includes $20.3B for 9/11 losses reported through 12/31/01. Includes only business and personal property claims, business interruption and auto claims.Source: Property Claims Service, Insurance Information Institute
$ BillionsCAT losses continue to be a problem,
though 2002 was much better than 2001

Cost of U.S. Tort System($ Billions)
Source: Tillinghast-Towers Perrin; Insurance Information Institute estimates for 2001/2002 assume tort costs equal to 2% of GDP. 2005 forecasts from Tillinghast.
$129 $130$141 $144 $148
$159 $156 $156$167 $169 $179
$198 $204
$298
$0
$50
$100
$150
$200
$250
$300
$350
90 91 92 93 94 95 96 97 98 99 00 01* 02E* 05F
Tort costs consumed 2.0% of GDP annually on average since 1990, expected to rise to 2.4% of GDP by 2005!
Tort costs equaled $636 per person in 2000!
Expected to rise to $1,000 by 2005

Reserve Deficiency, by Line(AY 1992-2001, as of 12/01)
-$0.8-$1.8
-$4.1
-$6.2
-$9.1
-$3.8
-$0.8
-$17.8 -$18.0
-$1.9
-$20
-$18
-$16
-$14
-$12
-$10
-$8
-$6
-$4
-$2
$0HO PPA Liab CA Liab WC CMP Med Mal*
SpecialLiab
OtherLiab*
XS LiabReins
ProdLiab*
*Occurrence and claims madeSource: Morgan Stanley
Estimated Deficiency
Total Excluding A&E: $64 Billion
A&E Deficiency: $55 Billion
Total Including A&E: $120 Billion

Outlook for Personal Lines:2002-2004
99.5101.0101.1
109.4
103.5
109.5111.4
107.9
121.7
105.5
114.2
104.9
102.2
108.2
103.7103.9
90
95
100
105
110
115
120
125
Source: A.M. Best, Conning & Co.
97 98 99 00 01 02E 03F 04F
PERSONAL AUTO HOMEOWNERS
97 98 99 00 01 02E 03F 04F

Outlook for Commercial Lines:2002 - 2004
121.
7 130.
2
115.
8
118.
5
153.
3
100.
3
116.
6 125.
3
111.
9
103.
6
155.
3
98.8
113.
2 120.
2
108.
3
99.1
158.
1
95.2
113.
0
113.
6
106.
7
99.5
165.
0
92.8
90
100
110
120
130
140
150
160
170
WorkersComp
GL & Prod.Liab
CommercialAuto
CommercialPackage
Med Mal InlandMarine
2001 2002E 2003F 2004F
Sources: A.M. Best, Conning & Co.

12% After Tax ROE Requires Underwriting Profit
Source: Dowling & Partners
Accident Year Combined Ratio
P : S 90.0% 92.5 % 95.0 % 97.5 % 100.0 % 102.5 % 105.0 % 107.5 % 110.0 % 112.5 %
100 % 13.0 % 11.5 % 10.1 % 8.6 % 7.1 % 5.6 % 4.1 % 2.6 % 1.1 % -0.4 %
110 % 14.0 % 12.4 % 10.7 % 9.1 % 7.5 % 5.8 % 4.2 % 2..5 % 0.9 % -0.7 %
120 % 15.0 % 13.2 % 11.4 % 9.6 % 7.8 % 6.1 % 4.3 % 2.5 % 0.7 % -1.1 %
130 % 16.0% 14.0 % 12.1 % 10.2 % 8.2 % 6.3 % 4.4 % 2..4 % 0.5 % -1.5 %
140 % 16.9 % 14.9 % 12.8 % 10.7 % 8.6 % 6.5 % 4.4 % 2.4 % 0.3 % -1.8 %
150 % 17.9 % 15.7 % 13.5 % 11.2 % 9.0 % 6.8 % 4.5 % 2.3 % 0.1 % -2.2 %
160 % 18.9 % 16.5 % 14.1 % 11.8 % 9.4 % 7.0 % 4.6 % 2.2 % -0.2 % -2.5 %
170 % 19.9 % 17.3 % 14.8 % 12.3 % 9.8 % 7.2 % 4.7 % 2.2 % -0.4 % -2.9 %
180 % 20.9 % 18.2 % 15.5 % 12.8 % 10.1 % 7.5 % 4.8 % 2.1 % -0.6 % -3.3 %
190 % 21.8 % 19.0 % 16.2 % 13.3 % 10.5 % 7.7 % 4.9 % 2.0 % -0.8 % -3.6 %
200 % 22.8 % 19.8 % 16.9 % 13.9 % 10.9 % 7.9 % 4.9 % 2.0 % -1.0 % -4.0 %
225 % 25.3 % 21.9 % 18.6 % 15.2 % 11.9 % 8.5 % 5.2 % 1.8 % -1.5 % -4.9 %
250 % 27.7 % 24.0 % 20.3 % 16.5 % 12.8 % 9.1 % 5.4 % 1.7 % -2.1 % -5.8 %

HOW DOES THIS HARD MARKET STACK UP TO
PREVIOUS HARD MARKETS?

0%
5%
10%
15%
20%
25%
19
70
19
71
19
72
19
73
19
74
19
75
19
76
19
77
19
78
19
79
19
80
19
81
19
82
19
83
19
84
19
85
19
86
19
87
19
88
19
89
19
90
19
91
19
92
19
93
19
94
19
95
19
96
19
97
19
98
19
99
20
00
20
01
20
02
20
03
Source: A.M. Best, Insurance Information Institute
Hard Markets Since 1970
There have been 3 hard markets since 1970:
1975-1978
1985-1987
2001-200?
1975-78 1985-87 2001-03

100
125
150
175
200
225
250
19
87
19
88
19
89
19
90
19
91
19
92
19
93
19
94
19
95
19
96
19
97
19
98
19
99
20
00
20
01
20
02
E
20
03
F
Cumulative GDP GrowthCumulative NWP Growth
Note: Shaded area denotes hard market.Source: Insurance Information Institute
GDP Growth vs. Net Written Premium Growth (1987=100)
The gap between cumulative GDP and Net Written Premium growth
hit a maximum of 52.5 pts or 33.7% in 2000. In 2003, the
estimated gap is 29.0 pts or 15.2%.
Hard Market
52.5
pts
29.0 pts
THE U.S. LEGAL SYSTEMIS OUT OF CONTROL:
U.S. CIVIL JUSTICE SYSTEM RULED BY THEORY OF “JACKPOT JUSTICE”

TORT-ure
• Asbestos• “Toxic” Mold• Medical Malpractice• Construction Defects• Lead• Fast Food• Arsenic Treated Lumber • Guns• Genetically Modified Foods (Corn)• Pharmaceuticals & Medical Devices• Security exposures (workplace violence, post-9/11 issues)• What’s Next?• Slavery• Sept. 11??

Average Jury Awards1994 vs. 2000
419759
187 333
1,140 1,185
1,744
1,168
1,727
269698
3,482 3,566
6,817
$0
$1,000
$2,000
$3,000
$4,000
$5,000
$6,000
$7,000
Overall BusinessNegligence
VehicularLiability*
PremisesLiability
MedicalMalpractice
WrongfulDeath
ProductsLiability
($00
0)
1994 2000
Source: Jury Verdict Research; Insurance Information Institute.

Cost of U.S. Tort System($ Billions)
Source: Tillinghast-Towers Perrin; Insurance Information Institute estimates for 2001/2002 assume tort costs equal to 2% of GDP. 2005 forecasts from Tillinghast.
$129 $130$141 $144 $148
$159 $156 $156$167 $169 $179
$198 $204
$298
$0
$50
$100
$150
$200
$250
$300
$350
90 91 92 93 94 95 96 97 98 99 00 01* 02E* 05F
Tort costs consumed 2.0% of GDP annually on average since 1990, expected to rise to 2.4% of GDP by 2005!
Tort costs equaled $636 per person in 2000!
Expected to rise to $1,000 by 2005

Trends in Million Dollar Verdicts*
4%
8% 8%
19% 24
%
34% 40
%
4%
9%
12%
25%
24%
39%
50%
6%
13%
11%
37%
38%
52%
63%
0%
10%
20%
30%
40%
50%
60%
70%
80%
90%
100%
VehicularLiability
PremisesLiability
PersonalNegligence
BusinessNegligence
GovernmentNegligence
MedicalMalpractice
ProductsLiability
94-96 97-98 99-00
*Verdicts of $1 million or more.Source: Jury Verdict Research; Insurance Information Institute.
Very sharp jumps in multi-million dollar awards in recent years across virtually all types of defendants

Where the Tort Dollar Goes(2000)
Source: Tillinghast-Towers Perrin
Awards for Non-Economic
Loss22%
Claimants' Attorney Fees
17%Awards for
Economic Loss20%
Defense Costs16%
Administration
25%
Tort System is extremely inefficient:
Only 20% of the tort dollar compensates victims for economic losses
At least 58% of every tort dollar never reaches the victim

PRESSURE TO IMPROVE PRICING

0%
5%
10%
15%
20%
25%
19
70
19
71
19
72
19
73
19
74
19
75
19
76
19
77
19
78
19
79
19
80
19
81
19
82
19
83
19
84
19
85
19
86
19
87
19
88
19
89
19
90
19
91
19
92
19
93
19
94
19
95
19
96
19
97
19
98
19
99
20
00
20
01
20
02
20
03
*Estimate/forecast based on January 2003 III survey of industry analysts.Source: A.M. Best, Insurance Information Institute
Growth in Net Premiums Written (All P/C Lines)
2001: 8.1%
2002: 14.2% (est.)*
2003: 12.7% (forecast)*
The underwriting cycle went AWOL in the 1990s.
It’s Back!

Council of Insurance Agents & Brokers Rate Survey
Fourth Quarter 2002Rate Increases By Line of BusinessRate Increases By Line of Business
No Change Up 1-10% 10-20% 20-30% 30-50% 50%-100% >100%Change Up 1-10% 10-20% 20-30% 30-50% 50%-100% >100%
Comm. Auto 6% 14% 42% 25% 8% 1% 0%
Workers Comp 8% 17% 25% 24% 10% 2% 2%
General Liability 7% 13% 29% 37% 11% 0% 0%
Comm. Umbrella 8% 3% 21% 21% 26% 10% 5%
D&O 6% 4% 22% 23% 18% 9% 3%
Comm. Property 8% 16% 25% 25% 18% 3% 0%
Construction Risk 4% 8% 17% 18% 23% 9% 4%
Terrorism 12% 5% 8% 12% 5% 0% 6%
Business Interr. 13% 19% 36% 14% 4% 0% 0%
Surety Bonds 8% 16% 16% 15% 6% 1% 1%
Med Mal 1% 5% 6% 6% 12% 12% 16%

Cost of Risk per $1,000 of Revenues: 1990-2002E
$6.10
$6.40
$8.30$7.70
$7.30
$6.49
$5.70$5.25
$5.71
$5.20$4.83
$5.55
$6.94
$4
$5
$6
$7
$8
$9
$10
90 91 92 93 94 95 96 97 98 99 00 01E 02E
Source: 2001 RIMS Benchmark Survey; Insurance Information Institute estimates.
•Cost of risk to corporations fell 42% between 1992 and 2000
•Estimated 15% increase in 2001, 25% in 2002
• About half of 2002 increase due to 9/11

Average Price Change of Personal Lines Renewals
9%
9%
7%
9%
6%
6%3%
4%
1%
5%
4%
1%-1%
2%
0%
2%
-2% -1% 0% 1% 2% 3% 4% 5% 6% 7% 8% 9%
Homeowners
Personal Auto
2003* 2002* 2001* Fall 2000 Spring 2000 Fall 99 Spring 99 Fall 98*III estimatesSource: Conning, III

Average Price Change of Personal Lines Renewals
9%
9%
7%
9%
6%
6%3%
4%
1%
5%
4%
1%-1%
2%
0%
2%
-2% -1% 0% 1% 2% 3% 4% 5% 6% 7% 8% 9%
Homeowners
Personal Auto
2003* 2002* 2001* Fall 2000 Spring 2000 Fall 99 Spring 99 Fall 98*III estimatesSource: Conning, III

Average Expenditures on Auto Insurance: US vs. NM
691706 704
683 687
723
784
855
674664676
690
660
$600
$650
$700
$750
$800
$850
$900
*Insurance Information Institute Estimates/ForecastsSource: NAIC, Insurance Information Institute
Countrywide auto insurance are expected to rise 8-10% in 2003

Average Expenditures on Homeowners Ins.: US
418440
455
481 488500
512
553
603
451
$400
$450
$500
$550
$600
$650
*III EstimatesSource: NAIC, Insurance Information Institute
Average HO expenditures are expected to rise by 8-10% in 2003

Auto & Homeowners Insurance Expenditures as a% of Median Household Income
1.3%
2.0%
1.2%
1.9%
1.2%
1.9%
1.2%
1.8%
1.2%
1.7%
1.2%
1.6%
1.2%
1.8%
1.2%
0.0%
0.5%
1.0%
1.5%
2.0%
1994 1995 1996 1997 1998 1999 2000 2001
Auto Homeowners
The cost of auto and homeowners insurance relative to the typical
household’s income has remained stable over the years

Homeowners Insurance Expenditure as a % of Median Home Price*
$1
07
,20
0
$1
15
,80
0
$1
21
,80
0
$1
28
,40
0
$1
33
,30
0
$1
39
,00
0
$1
47
,80
0 $1
63
,60
0
$1
10
,50
0
0.39%
0.38% 0.38%
0.37% 0.37% 0.37%
0.36%
0.35%
0.34%
$100,000
$125,000
$150,000
$175,000
$200,000
94 95 96 97 98 99 00 01 02
0.3%
0.3%
0.4%
0.4%
0.4%Median Sales Price of Existing HomesHO Insurance Expenditure as a % of Sales Price
Source: Insurance Information Institute calculations based on data from National Association of Realtors, NAIC.
HO
Exp
end
iture as %
of Sales P
riceMed
ian
Hom
e S
ales
Pri
ce
The cost of homeowners
insurance relative to the
price of a typical home is falling!

Change in Cost of Homes vs. Change in Cost of Homeowners Insurance
$3,300
-$2
$5,300
$22
$6,000
$15
$6,600
$26
$4,900
$7
$5,700
$12
$8,800
$12
$15,800
$41
-$2,000$0
$2,000$4,000$6,000$8,000
$10,000$12,000$14,000$16,000
1995 1996 1997 1998 1999 2000 2001 2002*
Change in Cost of Median Existing HomeChange in Average Homeowners Insurance Expenditure
Recent increases in the cost of homeowners insurance are
miniscule in comparison to the soaring cost of homes
*August 2002Source: Insurance Info. Inst. calculations based on data from Natl. Association of Realtors, NAIC.

Property Taxes12%
Principal & Interest
84%
Homeowners Insurance
4%
Composition of Monthly Homeowners Payments
Sources: Mortgage interest rates: Freddie Mac; Median Home Price (existing homes): National Associationof Home Builders; Property Taxes: US Census Bureau; Homeowners Insurance: III and NAIC.
Property Taxes13%
Principal & Interest
83%
Homeowners Insurance
4%
2002 Total Monthly Payment: $1,0951997 Total Monthly Payment: $945
$791
$116
$38
$46
$144
$905
2002
Median Home Price
$157,000
Mortgage Rate (30-yr)
6.63%
Principal & Interest*,1
$10,863
Property Taxes*
$1,726
Homeowners Insurance*
$553 (est.)
1997 $121,800 7.83% $7,495 $1,390 $455
*Annual basis. 1Assues 90% of purchase price is financed (i.e., 10% down payment).

Homeownership Rates,1985 to 2002
* Third QuarterSource: U.S. Census Bureau
63.9% 64.1%64.5%
64.0%
64.7%
65.4%65.7%
66.3%66.8%
67.2%67.8% 68.0%
1990 1992 1993 1994 1995 1996 1997 1998 1999 2000 2001 2002*
Homeownership is at a record high. Because you can’t buy a
home without insurance, insurance is clearly available and affordable, including to millions of Americans of modest means
and all ethnic groups.

CAPACITY CRUNCH

$0
$50
$100
$150
$200
$250
$300
$350
75 76 77 78 79 80 81 82 83 84 85 86 87 88 89 90 91 92 93 94 95 96 97 98 99 00 01 02
Policyholder Surplus: 1975-2002*
*As of September 30, 2002Source: A.M. Best, Insurance Information Institute
Bil
lion
s
(US
$)
Surplus (capacity) peaked at $336.3 Billion in mid-1999 and has fallen by 18.7% ($63 billion) to $273.3 billion since then.
•Surplus fell 5.6% during first 9 months of 2002
•Surplus is now lower than at year-end 1997.
“Surplus” is a measure of underwriting capacity. It is analogous to “Owners Equity” or “Net Worth” in non-insurance organizations

Global P/C Insurance Capacity is Falling Dramatically
$920
$690
$0
$100
$200
$300
$400
$500
$600
$700
$800
$900
$1,000
2000:I 2002:IV (est.)
$ B
illi
ons
Sources: Insurance Information Institute, Swiss Re
Global non-life capacity is down
25% over the past 2 years

Capital Raising by P/C Insurers Since September 11, 2001*
$20,492
$11,442
$16,437
$4,872
$0
$5,000
$10,000
$15,000
$20,000
$25,000
$30,000
2001 2002*
($ M
illi
on
s)
Completed Pending
$25.4 Billion$27.9 Billion
*As of September 13, 2002.
Source: Morgan Stanley, Insurance Information Institute.
14 Pending 38 Pending
40 Completed 33 Completed
Capital Raising by P/C Insurers Since 9/11 Totals $53.2B

Capital Myth: US P/C Insurers Have $300 Billion to Pay Terrorism Claims
"Target" Commercial*$100 billion
33%
Other Commercial$50 billion
17%
Personal$150 billion
50%
Total PHS = $298.2 B as of 6/30/01
= $282.9 B as of 6/30/02
*”Target” Commercial includes: Comm property, liability and workers comp; Surplus must also back-up on non-terrorist related property/liability and WC claimsSource: Insurance Information Institute
Only 33% of industry surplus backs up “target” lines

INVESTMENT OVERVIEW

$0
$9
$18
$27
$36
$45
75 76 77 78 79 80 81 82 83 84 85 86 87 88 89 90 91 92 93 94 95 96 97 98 99 00 01 02
Net Investment Income
Facts
1997 Peak = $41.5B
2000= $40.7B
2001 = $37.7B
2002E* = $35.2B
Bil
lion
s
(US
$)
Investment income in 2002 is expected to fall 5 to 6% due primarily to historically low interest rates
*Annualized estimate based on first 9 months of 2002 data.Source: A.M. Best, Insurance Information Institute

0%
2%
4%
6%
8%
10%
12%
14%
16%
3-Month T-Bill 1-Yr. T-Bill 10-Year T-Note
Interest Rates: Lower Than They’ve Been in Decades
*Average for week ending December 27, 2002.Source: Board of Governors, Federal Reserve System; Insurance Information Institute
1. Historically low interest rates are the primary driver behind lower investment yields. Nevertheless, overall insurer investment performance outpaces all major market indices and almost every major category of mutual fund.
2. 66% of the industry’s invested assets are in bonds

-30%
-20%
-10%
0%
10%
20%
30%
40%
19
70
19
72
19
74
19
76
19
78
19
80
19
82
19
84
19
86
19
88
19
90
19
92
19
94
19
96
19
98
20
00
20
02
Large Company Stocks*As of February 5, 2003.Source: Ibbotson Associates, Insurance Information Institute
Total Returns for Large Company Stocks: 1970-2003*
2002 was 3rd consecutive year of decline for stocks
Will 2003 be the 4th?

P/C Industry Investments,by Type (as of Dec. 31, 2001)
Other5%
Bonds66%
Real Est. & Mortgages
1%
Common Stock21%
Cash & ST Secs.6%
Preferred Stock1%
Bond Holdings, by Type
Industrial & Misc. 32.5%
Special Revenue 30.5%
Governments 18.0%
States/Terr/Other 15.4%
Public Utilities 3.1%
Parents/Subs/Affiliates 0.5%
Source: A.M. Best, Insurance Information Institute
Common stock accounts for about 1/5 of invested
assets

Property/Casualty Insurance Industry Investment Gain*
$ Billions
$35.4
$42.8$47.2
$52.3
$44.4$39.5
$57.9
$51.9
$56.9
$0
$10
$20
$30
$40
$50
$60
94 95 96 97 98 99 00 01 2002E
*Investment gains consists primarily of interest, stock dividends and realized capital gains and losses.Source: Insurance Services Office; Insurance Information Institute estimate annualized as of 9/30/02.
Investment gains are simply returning to “pre-bubble” levels

Geopolitical Instability Increased in 2002, Boiling Over in 2003
War on Terrorism
Terrorists & Terrorism
North Korea: Nukes & KooksIraq: War
Jitters

THE CHALLENGE OF TERRORISM

Sept. 11 Industry Loss Estimates($ Billions)
Life$2.7 (7%)
Aviation Liability$3.5 (9%)
Other Liability
$10.0 (25%)
Biz Interruption$11.0 (27%)
Property -WTC 1 & 2$3.5 (9%)
Property - Other
$6.0 (15%)
Aviation Hull$0.5 (1%)
Event Cancellation
$1.0 (2%)
Workers Comp
$2.0 (5%)
Consensus Insured Losses Estimate: $40.2BSource: Insurance Information Institute

Structure of Proposed Federal Backstop
$0
$25
$50
$75
$100
Year 1 Year 2 Year 3
($ B
illio
ns)
* Company retention based on direct premiums written.
Source: U.S. Congress, Insurance Information Institute.
10%
In
du
stry
Co-
Rei
nsu
ran
ce
abov
e 7%
Ret
enti
on
Max Loss
$15 billion$12.5 billion
$10 billion
10%
In
du
stry
Co-
Rei
nsu
ran
ce
abov
e 10
% R
eten
tion
10%
In
du
stry
Co-
Rei
nsu
ran
ce
abov
e 15
% R
eten
tion
Fed
eral
Gov
ern
men
t co
vers
90
% a
bov
e 7%
ret
enti
on t
o $1
00B
max
Fed
eral
Gov
ern
men
t co
vers
90%
ab
ove
10%
ret
enti
on t
o $1
00B
m
ax
Fed
eral
Gov
ern
men
t co
vers
90%
ab
ove
15%
ret
enti
on t
o $1
00B
m
ax
7% Retention*10% Retention* 15% Retention*
Government recoups payouts below $10B in Year 1, $12.5 Year 2, $15B Year 3 with 3% max surcharge on policy premium.

Industry Losses Under Proposed Federal Backstop Using 9/11 Scenario
(as interpreted on date of enactment, Nov. 26, 2002)
$8.75$12.50
$18.75$1.125
$10.
575
$15.
75
$18.
00
$0
$5
$10
$15
$20
$25
$30
Year 1 Year 2 Year 3
($ B
illi
ons)
Industry Retention Surcharge Layer Co-Reinsurance Layer
Source: Insurance Information Institute.
$1.75B Industry Co-Share
Assumes $30B Commercial Prop & WC Loss, $125B “At Risk” Commercial DPE
$2.0B Industry Co-Share
$0.925B Industry Co-Share
$0.125B Industry Co-Share
Total Ind. Loss: $10.875B $14.25B $19.675B

Terrorism Act Summary• Terrorism Risk Insurance Act signed into law Nov. 26, 2002• Capping of risk allows insurers to estimate PMLs
Enhances ability to price
• Industry maintains significant retentions & FF exposure Company: 7%, 10%, 15% Comm. DPE in Years 1, 2, 3
• Aggregate industry cap of $10B, $12.5, 15B in those years• 10% co-reinsurance above industry aggregate• Government liability capped at $100B• Legislation requires mandatory offer of terror coverage• Reinsurers/Life insurers NOT eligible under the program• UPSHOT:
Bill will help a bit (expectation may be too high) Laws of insurance economics are not suspended Price/availability still a function of risk and capital available

Terrorism Act Summary• Mechanics of the Bill:
Bill immediately creates/reinstates coverage for all commercial policyholders (even those that declined or purchased sub-limited coverage)
Mandatory offer of coverage within 90 days (Feb. 24, 2003)Policyholder has 30 days to accept/reject (can negotiate after
rejection)Charge for terrorism must now appear as a line itemClaims must be processed in accordance with “appropriate
business practices”• Law Sunsets in 3 years (12/31/05)• State authority to disapprove rates if excessive,
inadequate or unfairly discriminatory retained• Civil liability can exist as federal cause of action• Federal definition of terrorism applies

CREDIT IN PERSONAL LINES UNDERWRITING

Why Do Insurers Use Credit Information?

Why Insurers Use Credit Information in Insurance Underwriting
1. There is a strong correlation between credit standing and loss ratios in both auto and homeowners insurance.
2. There is a distinct and consistent decline in relative loss ratios (which are a function of both claim frequency and cost) as credit standing improves.
3. Produces a more accurate and fair pricing system4. The relationship between credit standing and relative
loss ratios is statistically irrefutable.5. The odds that such a relationship does not exist in a
given random sample of policyholders are usually between 500, 1,000 or even 10,000 to one.
Source: Insurance Information Institute.

What You Might Not Know About Insurance Scoring
1. Insurers have been using credit since early 1990s Credit has been used in commercial insurance for decades
2. Insurance scores do not use the following information: Ethnicity Nationality Religion Age Gender Marital Status Familial Status Income Address Handicap
3. Insurance scoring is revenue neutral4. Increased use of credit information is a fact of life in the 21st
century (Why?: Works for trust-based relationships) Loans Leases Rentals Insurance Utilities Background Checks Empl. Screening NEXT: Preferred airport screening for frequent fliers
Source: Insurance Information Institute

Intuition Behind Insurance Scoring*
1. Personal Responsibility Responsibility is a personality trait that carries over into many
aspects of a person’s life It is intuitive and reasonable to believe that the responsibility
required to prudently manage one’s finances is associated with other types of responsible and prudent behaviors, for example: Proper maintenance of homes and automobiles Safe operation of cars
2. Stability It is intuitive and reasonable to believe that financially stable
individuals are like to exhibit stability in many other aspects of their lives.
3. Stress/Distraction Financial stress could lead to stress, distractions or other
behaviors that produce more losses (e.g., deferral of car/home maintenance).
*This list is neither exhaustive nor is it intended to characterize the behavior of any specific individual.
Source: Insurance Information Institute

Risk & Loss
Accounting for Differences in Losses by Risk Characteristics Makes
Insurance Pricing More Equitable

Age of Drivers Involved in Auto Accidents, 2000
61.88
45.96
31.6526.19
22.59 20.81 18.3
29.95
0
10
20
30
40
50
60
70
16-20 21-24 25-34 35-44 45-54 55-64 65-69 Overall
Invo
lvem
ent
Rat
e pe
r 10
0,00
0 Li
cens
ed D
river
s
Source: National Highway Traffic Safety Administration, Traffic Safety Facts 2000.
Interpretation:
Drivers age 16-20 are 2 to 3 times more likely to be involved in auto accidents. Should this
be ignored with better, more experienced drivers subsidizing teenagers?
OF COURSE NOT!

Gender of Drivers Involved in Fatal Auto Accidents, 2000
27
16
0
10
20
30
Male FemaleNo
. Dri
vers
in F
ata
l Acc
ide
nts
/bill
ion
mile
s d
rive
n
Source: National Safety Council
Interpretation:
Males are 69% more likely to be driving in fatal auto accidents. Should this be ignored and females be forced to subsidize males?
OF COURSE NOT!

1.324
1.107 1.0700.978 0.922 0.969
0.8590.798 0.767
1.122
0.0
0.5
1.0
1.5
2.0
Score Range
Rel
ativ
e P
erfo
rman
ceCredit Quality & Auto Insurance*
Interpretation
Individuals with the lowest scores have losses that are 32.4% above average; those with the best scores have losses that are 33.3% below average.
Should those who impose less cost on the system be forced to subsidize those who impose more?
Source: Tillinghast Towers-Perrin *Actual data from sampled company. More examples are given later in this presentation.

1.593
0.9110.795
0.656
1.066
0.0
0.5
1.0
1.5
2.0
Score Range
Rel
ativ
e P
erfo
rman
ceCredit Quality & Homeowners
Insurance (Sample Company)
Probability that Correlation Exists: 99.32%
Source: Tillinghast Towers-Perrin

Actual Example:
How Insurer Use of Credit Benefits Consumers &
What Consumers Stand to Lose

Example: Insurance Savings from Use of Credit Information
• Insured lives in Westchester County, NY (NYC suburb)• 2 fully insured vehicles ($250K/$500K liability, $1000 deductible)
2000 Nissan Xterra & 1994 Honda Civic • Insured’s biannual premium was $862 (Sept. 2002 renewal)
No accidents or moving violations on record• Insured’s credit-related discount for the 6-month period was
$148 out of $410 in total discounts.Credit-related discount saves consumer nearly $300/yearEffectively lowers premium by 14.7%Should this (and millions of other) consumers be denied this discount?
Some regulators and consumer groups want you to pay more unnecessarily and subsidize bad drivers.
• August 2002 FICO Score = 777 (out of 850) (= 72nd percentile) i.e., 28% have better (higher) scores, 72% have lower (worse) scores

Example (cont’d): Credit Discount Can Save $100s per Year*
Good Driver Discount
24%
Credit-Related
Discount36%
Safety/Anti-Theft Discount
19%
Multipolicy Discount
21%
$296
$174
$196
$154
*Annualized savings based on semi-annual data from example
Source: Insurance Information Institute
•Credit discount lowered annual premium by 14.7%
•Policyholder saved nearly $300
•Credit was single largest discount
•Opponents of credit will force people to pay more for coverage
Total Annual Savings from Discounts: $820

Some Groups Want to Ban C.L.U.E. Too!
Ad run by realtors in AZ in January 2003: But how would homeowners be
helped if CLUE is banned?
CLUE helps protect homebuyers by letting them see what problems a house has had before they buy it
A house without problems or that has been properly repaired will command a
premium, benefiting sellers
A house can be made safer and less expensive to insure if repairs have
been made properly
Don’t YOU want to know what you’re buying before you make the biggest investment of your life???

Insurers Support Good Public Policy in the Use of Credit Information in Insurance

Insurers Support Good Public Policy on Credit Issue
Major insurers endorse these principles in Texas (and elsewhere):
1. Require insurers to notify costumers that credit used to help assess risk.
2. Require insurers to: Provide applicants an explanation of why coverage not offered if due
to credit; and Provide existing customers a written statement of reason, upon
request, why they received a premium increase or cancellation notice if due to credit
3. Prohibit insurers form using credit as the sole factor in denying, canceling or not renewing a home or auto insurance policy.
Source: Texas Coalition for Affordable Insurance Solutions (TCAIS), www.tcais.org.

Insurers Support Good Public Policy on Credit Issue
Major insurers endorse these principles (cont’d.):4. Protect those that have little or no credit history by limiting
how insurers use a lack of credit history as a determining factor in denying coverage.
5. Prohibit insurers from using certain credit information—such as medical collection and disputed information under investigation by a credit bureau—to assess risk.
6. Require insurers to reevaluate policyholders, at their request, if they discover errors on their credit report.
7. Require insurers that use credit on renewal to reassess consumers’ credit information periodically and, when necessary, adjust their premiums accordingly.

Consequences of Banning Use of Credit in Insurance Underwriting
Banning the use of credit information will:• Force good drivers and responsible homeowners to subsidize
those with poor loss histories by hundreds of millions of dollars each year.
• Decrease incentives to drive safely• Decrease incentives to properly maintain cars and homes• Force insurers to rely on less accurate types of information,
such as DMV records.• Make non-standard risks more difficult to place• Increase size of residual market pools/plans• Create disparate impacts on groups such as older drivers,
people who file few claims, and millions of minorities and low income people who benefit
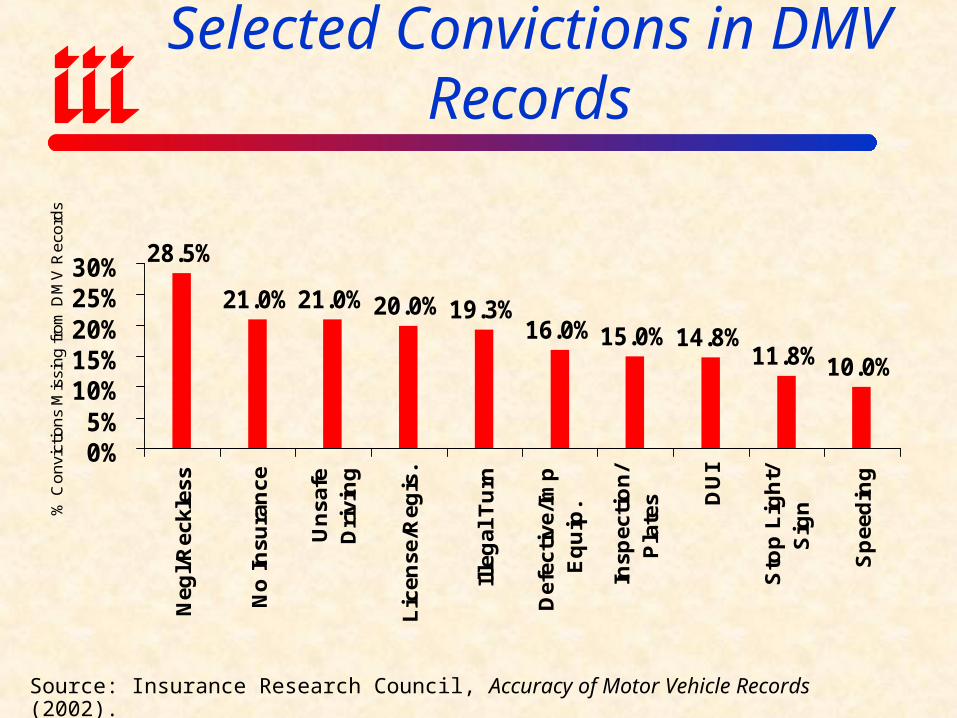
Average Omission Rate for Selected Convictions in DMV Records
28.5%
21.0% 21.0% 20.0% 19.3%16.0% 15.0% 14.8%
11.8% 10.0%
0%5%
10%15%20%25%30%
Neg
l/R
eckl
ess
No
In
sura
nce
Un
safe
Dri
vin
g
Lic
ense
/Reg
is.
Ille
gal
Tu
rn
Def
ecti
ve/I
mp
Eq
uip
.
Insp
ecti
on
/P
late
s DU
I
Sto
p L
igh
t/S
ign
Sp
eed
ing
% C
onvi
ctio
ns
Mis
sing
from
DM
V R
eco
rds
Source: Insurance Research Council, Accuracy of Motor Vehicle Records (2002).

Washington State Study on Credit Scoring in Auto UW & Pricing
STUDY DESIGN• WA State study released in January 2003 required under
ESHB 2544, which also restricted the use of scoring• Conducted by Washington State University (WSU)• Objective was to determine who benefits/is “harmed” by
scoring, impact of scoring on rates, disparate impacts on “the poor” or “people of color”
• Sampled about 1,000 auto policyholders from each of 3 insurers: age, gender, zip, inception date, score/rate class.
• Study’s models typically explain only 5% - 15% of variation• WSU contacted policyholders asked: ethnicity, marital
status, income, details of experience if cancelled

Washington State Study on Credit Scoring in Auto UW & Pricing
SUMMARY OF FINDINGS• Statistically the findings are extremely weak, leading even the
study’s author to conclude: “The …models only explain a fraction of the variance in score or discount found in the sample population” and that “…while there are statistically detectable patterns in the demographics of credit scoring, most of the variation among individual scores is to due to random chance or other facts not in this data.”
• Study’s models typically explain only 5% - 15% of variation. • Strongest and most consistent finding is that credit score is
positively associated with age Implication: banning on scoring creates disparate impact on older,
more experienced drivers

Problems With Such Studies• Already statistically irrefutable evidence that scoring works. This
fact is ignored in WA study.• Ignores fact that scoring is 100% blind to ethnicity, color, gender,
marital status, income, location, etc.• Introduces the divisive issue of race into an issue where it does not
belong (and doesn’t exist today)• Perpetuates false stereotype that minorities and the poor are
incapable of managing their finances responsibly• Puts regulators in awkward position of determining who is a
minority, who is poor• Lead to disparate impacts on groups such as older drivers, people
who file few claims, and millions of minorities and low income people who benefit today
• Lead to poor public policy decisions that produce perverse economic incentives (e.g., subsidies to drivers who have higher relative losses)

Insurance Information Institute On-Line
If you would like a copy of this presentation, please give me your business card with e-mail address